STATE OF NEW MEXICO HUMAN SERVICES ... November 14...STATE OF NEW MEXICO HUMAN SERVICES DEPARTMENT...
9
STATE OF NEW MEXICO HUMAN SERVICES DEPARTMENT Medical Assistance Division All Medicaid & SCHIP Reported 1,2 Estimated 3 Change from Jun. 2016 Projection Month Over Month Change Family Planning Estimated 3 QMBs Estimated 3 SLIMBs &QI1s Estimated 4 A B C D E F G H I J K L M N O P Q R S Jul-14 492,338 492,594 (81) - 41,669 21,202 8,938 564,403 162,379 162,379 251 - 726,782 388,387 45,489 144,272 578,148 Aug-14 495,461 495,620 (67) 3,026 43,302 21,358 8,972 569,252 168,338 168,338 (286) 5,959 737,590 388,607 45,502 152,668 586,777 Sep-14 497,372 497,526 5 1,906 44,846 21,559 8,971 572,902 174,592 174,592 (318) 6,254 747,494 388,962 45,777 157,999 592,738 Oct-14 498,380 498,546 10 1,020 46,495 21,765 9,057 575,863 180,478 180,478 (297) 5,886 756,341 389,357 45,955 163,173 598,485 Nov-14 499,544 499,672 8 1,126 47,711 22,002 9,101 578,486 186,075 186,075 (156) 5,597 764,561 389,974 46,144 168,109 604,227 Dec-14 501,955 501,987 (25) 2,315 49,782 22,087 9,225 583,081 193,134 193,134 (131) 7,059 776,215 391,647 46,413 174,503 612,563 Jan-15 502,226 502,156 (86) 169 51,635 22,238 9,426 585,455 200,299 200,299 (119) 7,165 785,754 391,396 46,288 180,918 618,602 Feb-15 503,317 503,182 (70) 1,026 53,501 22,919 9,503 589,105 207,270 207,270 (54) 6,971 796,375 392,222 46,071 187,477 625,770 Mar-15 504,073 503,889 (41) 707 55,442 23,310 9,508 592,149 210,820 210,820 (38) 3,550 802,969 392,127 46,262 190,759 629,148 Apr-15 499,316 499,093 (51) (4,796) 56,732 23,451 9,770 589,046 218,020 218,020 (702) 7,200 807,066 386,671 46,456 198,552 631,679 May-15 501,778 501,516 (13) 2,423 57,729 23,569 9,858 592,672 220,700 220,700 (110) 2,680 813,372 388,563 46,664 200,743 635,970 Jun-15 504,317 504,009 (12) 2,493 58,627 23,536 10,026 596,198 222,974 222,974 3 2,274 819,172 388,961 47,000 203,324 639,285 Jul-15 507,129 506,781 (2) 2,772 59,119 23,640 10,188 599,728 225,491 225,491 39 2,517 825,219 392,942 47,316 205,728 645,986 Aug-15 509,996 509,604 25 2,823 60,138 23,804 10,336 603,882 228,091 228,091 131 2,600 831,973 395,549 47,392 208,015 650,956 Sep-15 511,213 510,780 3 1,176 61,404 23,785 10,484 606,453 230,309 230,309 51 2,218 836,762 396,667 47,216 210,403 654,286 Oct-15 511,667 511,188 35 408 62,483 23,852 10,658 608,181 231,650 231,650 128 1,341 839,831 396,822 47,717 211,869 656,408 Nov-15 512,510 511,993 (35) 805 64,086 23,924 10,783 610,786 234,496 234,496 407 2,846 845,282 397,409 47,931 214,492 659,832 Dec-15 514,368 514,160 39 2,167 66,066 23,914 10,962 615,102 238,762 238,762 631 4,266 853,864 394,954 47,907 217,125 659,986 Jan-16 513,014 513,337 (90) (823) 66,585 23,912 11,103 614,937 241,801 241,801 183 3,039 856,738 397,898 48,114 221,549 667,561 Feb-16 515,005 515,881 (300) 2,544 67,573 23,995 11,202 618,651 244,599 244,599 - 2,798 863,250 400,067 48,285 224,080 672,432 Mar-16 515,874 517,390 (454) 1,509 68,616 24,006 11,296 621,308 246,338 246,338 884 1,739 867,646 402,070 48,281 224,355 674,706 Apr-16 514,674 516,919 (801) (471) 69,749 24,194 11,162 622,024 246,122 246,135 1,718 (203) 868,159 402,347 48,618 222,705 673,670 May-16 514,863 517,955 (1,206) 1,036 70,777 24,271 11,216 624,219 248,427 248,487 1,887 2,352 872,706 403,511 48,932 224,756 677,199 Jun-16 515,053 518,952 (1,769) 997 72,246 24,337 11,373 626,908 250,571 250,721 1,603 2,234 877,629 404,317 49,244 226,855 680,416 Jul-16 516,019 521,279 (1,020) 2,327 73,109 24,296 11,326 630,010 252,222 252,712 2,417 1,991 882,722 406,410 49,452 227,722 683,584 Aug-16 516,798 523,836 3 2,557 74,465 24,340 11,431 634,072 254,298 255,337 3,860 2,625 889,409 410,406 49,662 229,242 689,310 Sep-16 513,654 523,666 (2,089) (170) 75,606 24,420 11,458 635,150 255,011 257,237 4,572 1,900 892,387 409,922 49,872 231,337 691,131 Oct-16 525,191 (2,282) 1,525 76,565 24,483 11,532 637,771 258,266 4,406 1,029 896,037 411,380 50,083 232,824 694,287 Nov-16 526,853 (2,374) 1,662 77,528 24,588 11,608 640,577 259,170 4,109 904 899,747 409,944 50,296 233,406 693,646 Dec-16 528,116 (2,495) 1,263 78,481 24,724 11,656 642,977 260,077 3,810 907 903,054 410,836 50,509 233,990 695,335 Jan-17 529,947 (2,616) 1,831 79,613 24,830 11,716 646,106 260,988 3,509 911 907,094 412,168 50,723 234,575 697,466 Feb-17 531,326 (2,783) 1,379 80,575 24,944 11,851 648,696 261,770 3,073 782 910,466 413,180 50,938 235,161 699,279 Mar-17 533,199 (2,904) 1,873 81,730 24,974 11,928 651,831 262,556 2,636 786 914,387 414,538 51,155 235,749 701,442 Apr-17 534,956 (3,030) 1,757 82,752 25,040 12,011 654,759 263,343 2,193 787 918,102 415,800 51,372 236,338 703,510 May-17 536,438 (3,117) 1,482 83,850 25,157 12,160 657,605 264,133 1,749 790 921,738 416,864 51,591 236,929 705,384 Jun-17 537,818 (3,284) 1,380 84,797 25,221 12,251 660,087 264,926 1,300 793 925,013 417,826 51,810 237,521 707,157 Jul-17 539,153 (3,262) 1,335 85,161 25,257 12,262 661,833 265,721 1,141 795 927,554 418,786 52,030 238,353 709,169 Aug-17 540,144 (3,099) 991 85,782 25,304 12,285 663,515 266,518 981 797 930,033 419,393 52,252 239,187 710,832 Sep-17 541,356 (2,910) 1,212 86,878 25,319 12,322 665,875 267,317 820 799 933,192 420,257 52,474 240,024 712,755 Oct-17 542,532 (2,750) 1,176 87,593 25,351 12,348 667,824 268,119 658 802 935,943 421,070 52,698 240,864 714,632 Nov-17 543,757 (2,576) 1,225 88,724 25,366 12,382 670,229 268,924 495 805 939,153 421,915 52,923 241,707 716,545 Dec-17 544,949 (2,356) 1,192 89,228 25,412 12,414 672,003 269,730 331 806 941,733 422,711 53,148 242,553 718,412 Jan-18 546,226 (2,178) 1,277 89,950 25,434 12,454 674,064 270,540 366 810 944,604 423,612 53,375 243,402 720,389 Feb-18 547,386 (2,045) 1,160 90,314 25,484 12,485 675,669 271,351 402 811 947,020 424,379 53,603 244,254 722,236 Mar-18 548,414 (1,865) 1,028 90,856 25,514 12,520 677,304 272,165 436 814 949,469 425,071 53,832 245,109 724,012 Apr-18 549,102 (1,671) 688 91,908 25,530 12,571 679,111 272,982 473 817 952,093 425,461 54,062 245,967 725,490 May-18 549,749 (1,533) 647 92,645 25,580 12,617 680,591 273,801 509 819 954,392 425,801 54,293 246,828 726,922 Jun-18 550,848 (1,317) 1,099 93,373 25,595 12,635 682,451 274,622 547 821 957,073 426,551 54,526 247,692 728,769 Month-Year Total Base Population (D+G+H+I) Partial Benefit SFY 2018 SFY 2017 SFY 2016 SFY 2015 11/2/2016 Medicaid Enrollment Projection for SFY 2015-2018 Estimated MM in Managed Care Organization Physical Health Long Term Services and Supports Medicaid Expansion Medicaid Base Population & SCHIP Reported 1,2 Estimated 3 Estimated (J+L) Total MCO Change from Jun. 2016 Projection Full Benefit Month Over Month Change Medicaid Expansion
Transcript of STATE OF NEW MEXICO HUMAN SERVICES ... November 14...STATE OF NEW MEXICO HUMAN SERVICES DEPARTMENT...

STATE OF NEW MEXICO
HUMAN SERVICES DEPARTMENT
Medical Assistance Division
All Medicaid & SCHIP
Reported 1,2
Estimated3
Change from
Jun. 2016
Projection
Month
Over
Month
Change
Family
Planning
Estimated 3
QMBs
Estimated 3
SLIMBs &QI1s
Estimated 4
A B C D E F G H I J K L M N O P Q R S
Jul-14 492,338 492,594 (81) - 41,669 21,202 8,938 564,403 162,379 162,379 251 - 726,782 388,387 45,489 144,272 578,148
Aug-14 495,461 495,620 (67) 3,026 43,302 21,358 8,972 569,252 168,338 168,338 (286) 5,959 737,590 388,607 45,502 152,668 586,777
Sep-14 497,372 497,526 5 1,906 44,846 21,559 8,971 572,902 174,592 174,592 (318) 6,254 747,494 388,962 45,777 157,999 592,738
Oct-14 498,380 498,546 10 1,020 46,495 21,765 9,057 575,863 180,478 180,478 (297) 5,886 756,341 389,357 45,955 163,173 598,485
Nov-14 499,544 499,672 8 1,126 47,711 22,002 9,101 578,486 186,075 186,075 (156) 5,597 764,561 389,974 46,144 168,109 604,227
Dec-14 501,955 501,987 (25) 2,315 49,782 22,087 9,225 583,081 193,134 193,134 (131) 7,059 776,215 391,647 46,413 174,503 612,563
Jan-15 502,226 502,156 (86) 169 51,635 22,238 9,426 585,455 200,299 200,299 (119) 7,165 785,754 391,396 46,288 180,918 618,602
Feb-15 503,317 503,182 (70) 1,026 53,501 22,919 9,503 589,105 207,270 207,270 (54) 6,971 796,375 392,222 46,071 187,477 625,770
Mar-15 504,073 503,889 (41) 707 55,442 23,310 9,508 592,149 210,820 210,820 (38) 3,550 802,969 392,127 46,262 190,759 629,148
Apr-15 499,316 499,093 (51) (4,796) 56,732 23,451 9,770 589,046 218,020 218,020 (702) 7,200 807,066 386,671 46,456 198,552 631,679
May-15 501,778 501,516 (13) 2,423 57,729 23,569 9,858 592,672 220,700 220,700 (110) 2,680 813,372 388,563 46,664 200,743 635,970
Jun-15 504,317 504,009 (12) 2,493 58,627 23,536 10,026 596,198 222,974 222,974 3 2,274 819,172 388,961 47,000 203,324 639,285
Jul-15 507,129 506,781 (2) 2,772 59,119 23,640 10,188 599,728 225,491 225,491 39 2,517 825,219 392,942 47,316 205,728 645,986
Aug-15 509,996 509,604 25 2,823 60,138 23,804 10,336 603,882 228,091 228,091 131 2,600 831,973 395,549 47,392 208,015 650,956
Sep-15 511,213 510,780 3 1,176 61,404 23,785 10,484 606,453 230,309 230,309 51 2,218 836,762 396,667 47,216 210,403 654,286
Oct-15 511,667 511,188 35 408 62,483 23,852 10,658 608,181 231,650 231,650 128 1,341 839,831 396,822 47,717 211,869 656,408
Nov-15 512,510 511,993 (35) 805 64,086 23,924 10,783 610,786 234,496 234,496 407 2,846 845,282 397,409 47,931 214,492 659,832
Dec-15 514,368 514,160 39 2,167 66,066 23,914 10,962 615,102 238,762 238,762 631 4,266 853,864 394,954 47,907 217,125 659,986
Jan-16 513,014 513,337 (90) (823) 66,585 23,912 11,103 614,937 241,801 241,801 183 3,039 856,738 397,898 48,114 221,549 667,561
Feb-16 515,005 515,881 (300) 2,544 67,573 23,995 11,202 618,651 244,599 244,599 - 2,798 863,250 400,067 48,285 224,080 672,432
Mar-16 515,874 517,390 (454) 1,509 68,616 24,006 11,296 621,308 246,338 246,338 884 1,739 867,646 402,070 48,281 224,355 674,706
Apr-16 514,674 516,919 (801) (471) 69,749 24,194 11,162 622,024 246,122 246,135 1,718 (203) 868,159 402,347 48,618 222,705 673,670
May-16 514,863 517,955 (1,206) 1,036 70,777 24,271 11,216 624,219 248,427 248,487 1,887 2,352 872,706 403,511 48,932 224,756 677,199
Jun-16 515,053 518,952 (1,769) 997 72,246 24,337 11,373 626,908 250,571 250,721 1,603 2,234 877,629 404,317 49,244 226,855 680,416
Jul-16 516,019 521,279 (1,020) 2,327 73,109 24,296 11,326 630,010 252,222 252,712 2,417 1,991 882,722 406,410 49,452 227,722 683,584
Aug-16 516,798 523,836 3 2,557 74,465 24,340 11,431 634,072 254,298 255,337 3,860 2,625 889,409 410,406 49,662 229,242 689,310
Sep-16 513,654 523,666 (2,089) (170) 75,606 24,420 11,458 635,150 255,011 257,237 4,572 1,900 892,387 409,922 49,872 231,337 691,131
Oct-16 525,191 (2,282) 1,525 76,565 24,483 11,532 637,771 258,266 4,406 1,029 896,037 411,380 50,083 232,824 694,287
Nov-16 526,853 (2,374) 1,662 77,528 24,588 11,608 640,577 259,170 4,109 904 899,747 409,944 50,296 233,406 693,646
Dec-16 528,116 (2,495) 1,263 78,481 24,724 11,656 642,977 260,077 3,810 907 903,054 410,836 50,509 233,990 695,335
Jan-17 529,947 (2,616) 1,831 79,613 24,830 11,716 646,106 260,988 3,509 911 907,094 412,168 50,723 234,575 697,466
Feb-17 531,326 (2,783) 1,379 80,575 24,944 11,851 648,696 261,770 3,073 782 910,466 413,180 50,938 235,161 699,279
Mar-17 533,199 (2,904) 1,873 81,730 24,974 11,928 651,831 262,556 2,636 786 914,387 414,538 51,155 235,749 701,442
Apr-17 534,956 (3,030) 1,757 82,752 25,040 12,011 654,759 263,343 2,193 787 918,102 415,800 51,372 236,338 703,510
May-17 536,438 (3,117) 1,482 83,850 25,157 12,160 657,605 264,133 1,749 790 921,738 416,864 51,591 236,929 705,384
Jun-17 537,818 (3,284) 1,380 84,797 25,221 12,251 660,087 264,926 1,300 793 925,013 417,826 51,810 237,521 707,157
Jul-17 539,153 (3,262) 1,335 85,161 25,257 12,262 661,833 265,721 1,141 795 927,554 418,786 52,030 238,353 709,169
Aug-17 540,144 (3,099) 991 85,782 25,304 12,285 663,515 266,518 981 797 930,033 419,393 52,252 239,187 710,832
Sep-17 541,356 (2,910) 1,212 86,878 25,319 12,322 665,875 267,317 820 799 933,192 420,257 52,474 240,024 712,755
Oct-17 542,532 (2,750) 1,176 87,593 25,351 12,348 667,824 268,119 658 802 935,943 421,070 52,698 240,864 714,632
Nov-17 543,757 (2,576) 1,225 88,724 25,366 12,382 670,229 268,924 495 805 939,153 421,915 52,923 241,707 716,545
Dec-17 544,949 (2,356) 1,192 89,228 25,412 12,414 672,003 269,730 331 806 941,733 422,711 53,148 242,553 718,412
Jan-18 546,226 (2,178) 1,277 89,950 25,434 12,454 674,064 270,540 366 810 944,604 423,612 53,375 243,402 720,389
Feb-18 547,386 (2,045) 1,160 90,314 25,484 12,485 675,669 271,351 402 811 947,020 424,379 53,603 244,254 722,236
Mar-18 548,414 (1,865) 1,028 90,856 25,514 12,520 677,304 272,165 436 814 949,469 425,071 53,832 245,109 724,012
Apr-18 549,102 (1,671) 688 91,908 25,530 12,571 679,111 272,982 473 817 952,093 425,461 54,062 245,967 725,490
May-18 549,749 (1,533) 647 92,645 25,580 12,617 680,591 273,801 509 819 954,392 425,801 54,293 246,828 726,922
Jun-18 550,848 (1,317) 1,099 93,373 25,595 12,635 682,451 274,622 547 821 957,073 426,551 54,526 247,692 728,769
Month-Year
Total Base
Population
(D+G+H+I)
Partial Benefit
SF
Y 2
01
8S
FY
20
17
SF
Y 2
01
6S
FY
20
15
11/2/2016
Medicaid Enrollment Projection for SFY 2015-2018
Estimated MM in Managed Care Organization
Physical
Health
Long Term
Services and
Supports
Medicaid
Expansion
Medicaid Base Population & SCHIP
Reported 1,2
Estimated 3
Estimated (J+L) Total MCO
Change from
Jun. 2016
Projection
Full Benefit
Month Over
Month
Change
Medicaid Expansion

3. The estimated enrollments for the months from Jul-14 to Sep-16 were based on Monthly Eligibility Report released in Sep 2016 and adjusted for expected retroactive enrollments.
4. For Specified Low-Income Medicare Beneficiaries (SLIMBs) and Qualified Individuals (QI1s) population, the estimated enrollments for the months from Jul-14 to Sep-16 were based on the reports created from the data warehouse of Medical Assistance
Notes:
2. The reported enrollments for the full benefit base population and Medicaid expansion population for the month Sep-16 were based on the Medicaid Eligibility Report released in September 2016.
1. The reported enrollments for the full benefit base population and Medicaid expansion population for the months from Jul-14 to Aug-16 were based on the Monthly Eligibility Report released in Sep 2016.
For Medicaid Expansion, the reported enrollments from the Monthly Eligibility Report for the months from Jul-14 to Aug-16 were adjusted based on the estimated number of clients with duplicate COEs (COE 100 and other COEs).
Division in October 2016 and adjusted for expected retroactive enrollments. For the months from Oct-16 to Jun-18, the estimated enrollments were based on regressive analysis of the recent enrollment pattern.
Monthly Eligibility Report (MER) is posted on the internal MAD website on a monthly basis. The MER includes all clients eligible for Medical Assistance, including retroactive and late reported eligibility.
Medicaid Eligibility Report is published on the HSD website on monthly basis to show the actual enrollment for the recent month, and it is available to the public. http://www.hsd.state.nm.us/LookingForInformation/medicaid-eligibility.aspx
Data Sources:
The estimated enrollments for the months Oct-16 to Jun-18 were based on the regressive analysis of recent enrollment pattern, with consideration of impacts of new policies, court orders and the take-up from the eligible uninsured populations in New Mexico.

STATE OF NEW MEXICO
HUMAN SERVICES DEPARTMENT
Medical Assistance Division
Reported Projected Change from Jun. 2016 Projection Month Over Month ChangeA B C D E F
Jul-14 353,063 353,282 (17) -
Aug-14 356,380 356,568 (52) 3,286
Sep-14 359,097 359,279 (23) 2,711
Oct-14 360,824 360,958 (21) 1,679
Nov-14 362,336 362,439 (14) 1,481
Dec-14 364,776 364,807 (39) 2,368
Jan-15 366,535 366,528 (32) 1,721
Feb-15 368,599 368,539 (45) 2,011
Mar-15 370,341 370,251 (22) 1,712
Apr-15 371,321 371,135 (80) 884
May-15 373,018 372,806 (11) 1,671
Jun-15 374,775 374,521 5 1,715
Jul-15 376,560 376,266 88 1,745
Aug-15 378,937 378,597 103 2,331
Sep-15 380,301 380,064 50 1,467
Oct-15 380,774 380,553 15 489
Nov-15 381,733 381,579 (27) 1,026
Dec-15 383,452 383,410 5 1,831
Jan-16 382,842 382,919 12 (491)
Feb-16 384,306 384,500 (57) 1,581
Mar-16 385,054 385,329 2 829
Apr-16 384,963 385,198 (43) (131)
May-16 385,722 386,289 (172) 1,091
Jun-16 386,718 387,614 (535) 1,325
Jul-16 387,782 389,317 23 1,703
Aug-16 388,917 391,371 1,139 2,054
Sep-16 386,362 391,991 707 620
Oct-16 392,979 692 988
Nov-16 394,164 674 1,185
Dec-16 395,081 651 917
Jan-17 396,123 628 1,042
Feb-17 397,025 591 902
Mar-17 398,053 556 1,028
Apr-17 399,045 520 992
May-17 399,958 490 913
Jun-17 400,764 451 806
Jul-17 401,527 440 763
Aug-17 401,964 430 437
Sep-17 402,869 423 905
Oct-17 403,695 413 826
Nov-17 404,509 404 814
Dec-17 405,141 394 632
Jan-18 406,073 399 932
Feb-18 406,731 402 658
Mar-18 407,471 407 740
Apr-18 407,852 413 381
May-18 408,197 417 345
Jun-18 408,981 423 784
Notes:1. Medicaid Children are defined as any client less than age 21, regardless of category of eligibility. 2. The reported enrollments for the months from Jul-14 to Aug-16 were based on the Monthly Eligibility Report released in Sep 2016.
The reported enrollments for the month Sep-16 were based on the Medicaid Eligibility Report released in Sep 2016.
3. The estimated enrollments for the months from Jul-14 to Sep-16 were based on Monthly Eligibility Report released in September 2016 and adjusted
for expected retroactive enrollments. The estimated enrollments for the months Oct-16 to Jun-18 were based on the regressive analysis of
recent enrollment pattern, with consideration of impacts of new policies, court orders and the take-up from the eligible uninsured populations
in New Mexico.
11/2/2016
Medicaid Children Enrollment Projection for SFY 2015-2018
SF
Y 2
01
5S
FY
20
16
SF
Y 2
01
7S
FY
20
18
Month-Year

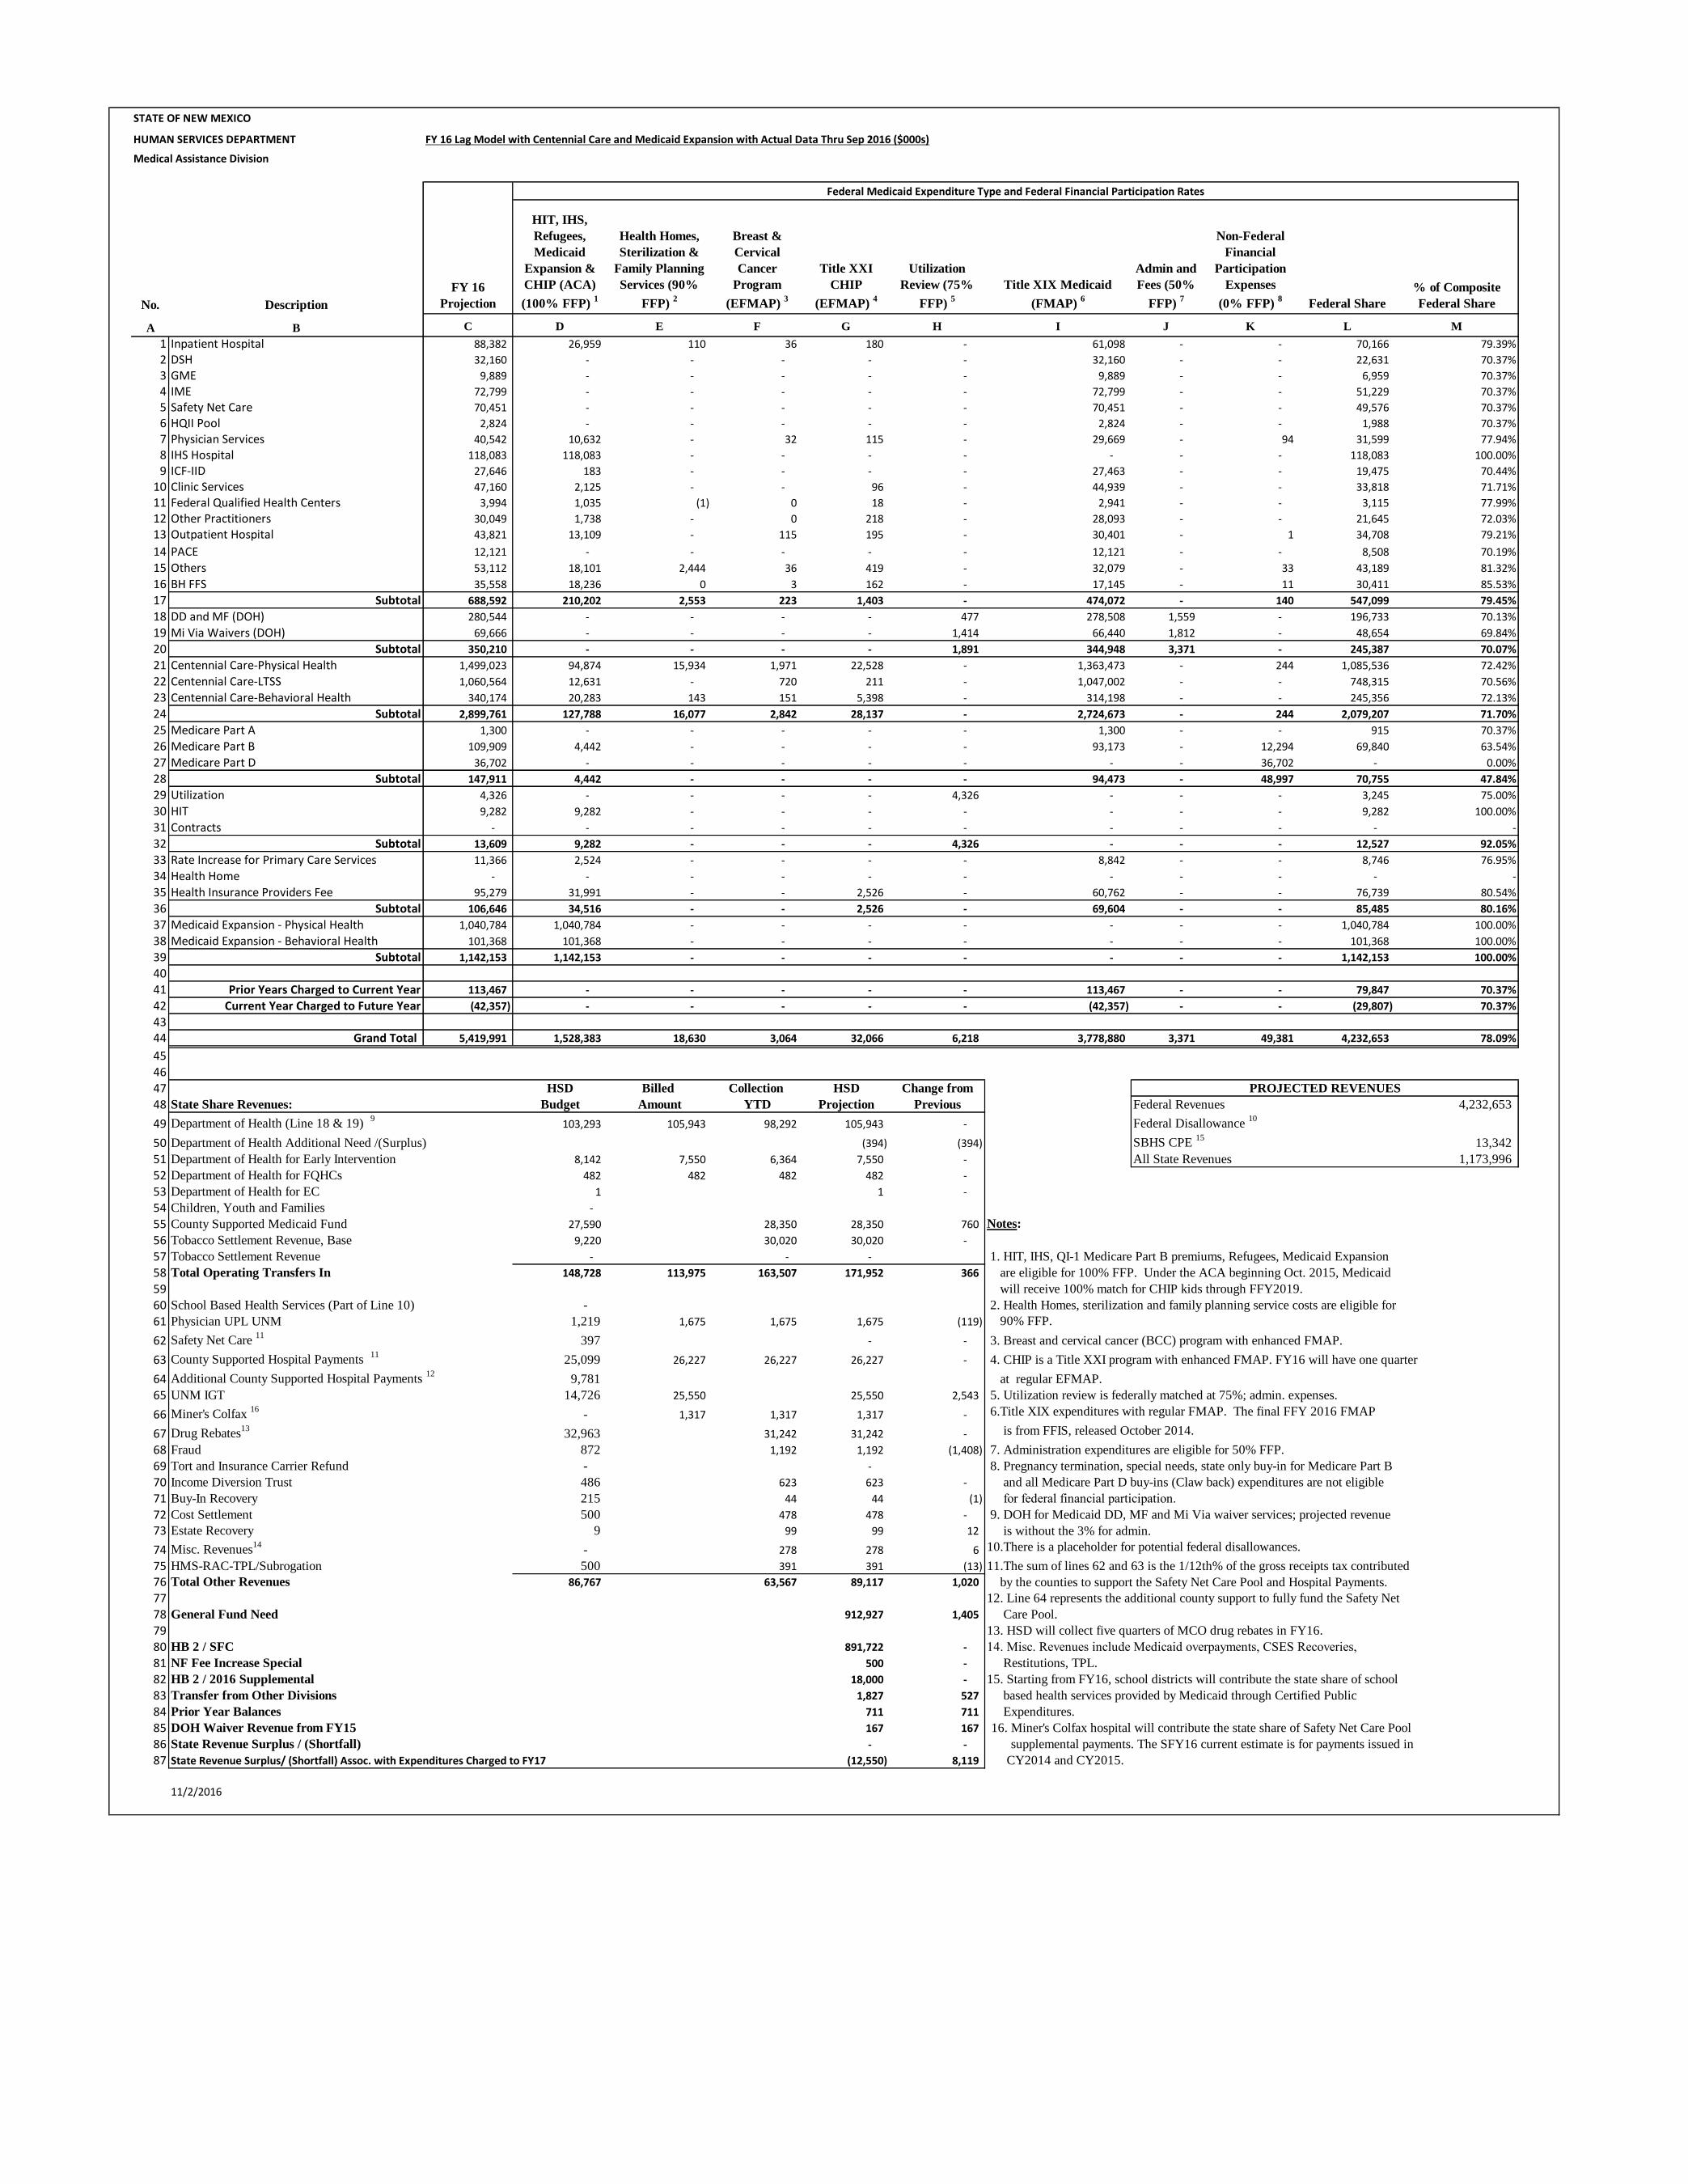
STATE OF NEW MEXICOHUMAN SERVICES DEPARTMENTMedical Assistance Division FY 16 Lag Model with Centennial Care and Medicaid Expansion with Actual Data Thru Sep 2016 ($000s)
No. Description
FY 15 Title XIX
Projection
FY 16 %
Completion Title XIX Actual YTD
Actual Paid Lump Sum/
Others YTD
Projected
Lump Sum Others
FY 16 Title XIX
Projection
% Change from
FY 15
CHIP Actual Paid
YTD
CHIP
Projection
FY 16 TOTAL
Medicaid
Projection
Jun 2016 Data
Projection
Change from
Previous No.
A B C D E F G H I J K L M N O P
1 Inpatient Hospital 86,890 96.70% 83,933 - - - 86,797 -0.11% 1,533 1,585 88,382 87,778 605 1
2 DSH 32,991 12.07% 3,883 3,883 32,160 - 32,160 -2.52% - - 32,160 32,160 - 2
3 GME 7,187 56.46% 5,584 5,584 9,889 - 9,889 37.60% - - 9,889 7,287 2,602 3
4 IME 61,565 100.00% 72,799 72,799 72,799 - 72,799 18.25% - - 72,799 60,928 11,871 4
5 Safety Net Care 34,445 100.00% 70,451 70,451 70,451 - 70,451 104.53% - - 70,451 68,889 1,561 5
6 HQII Pool - 100.00% 2,824 2,824 2,824 - 2,824 -- - - 2,824 2,824 - 6
7 Physician Services 39,201 96.47% 38,461 5,613 5,613 - 39,864 1.69% 650 677 40,542 40,919 (377) 7
8 IHS Hospital 110,356 96.31% 113,721 - - - 118,083 7.00% - - 118,083 119,945 (1,861) 8
9 ICF-IID 26,585 96.75% 26,748 - - - 27,646 3.99% - - 27,646 27,873 (227) 9
10 Clinic Services 15,462 44.58% 19,110 - - - 45,116 191.78% 1,912 2,045 47,160 47,160 - 10
11 Federal Qualified Health Centers 3,804 99.17% 3,872 - - - 3,905 2.65% 88 89 3,994 4,102 (109) 11
12 Other Practitioners 27,521 99.49% 28,715 - - - 28,862 4.87% 1,181 1,187 30,049 30,012 37 12
13 Outpatient Hospital 38,576 96.44% 41,439 - - - 42,971 11.39% 820 850 43,821 44,177 (356) 13
14 PACE 11,843 99.96% 12,116 - - - 12,121 2.34% - - 12,121 12,129 (8) 14
15 Others 44,052 97.33% 49,844 - - 100 51,235 16.31% 1,849 1,877 53,112 53,724 (612) 15
16 BH FFS 32,397 97.51% 33,832 - - - 34,704 7.12% 840 854 35,558 36,506 (948) 16
17 Subtotal 572,876 89.49% 607,331 161,154 193,736 100 679,427 18.60% 8,873 9,165 688,592 676,415 12,177 17
18 DD and MF (DOH) 279,305 99.38% 278,793 624 147 477 280,544 0.44% - - 280,544 283,242 (2,699) 18
19 Mi Via Waivers (DOH) 45,616 99.39% 69,239 3,185 69 3,115 69,666 52.72% - - 69,666 68,268 1,398 19
20 Subtotal 324,921 99.38% 348,032 3,809 216 3,593 350,210 7.78% - - 350,210 351,511 (1,301) 20
21 Centennial Care-Physical Health 1,467,068 101.73% 1,431,845 (2,500) 25,307 (42,523) 1,406,684 -4.12% 93,096 92,339 1,499,023 1,536,712 (37,688) 21
22 Centennial Care-LTSS 1,000,665 100.59% 1,065,551 - 11,552 - 1,059,274 5.86% 1,290 1,290 1,060,564 1,055,443 5,121 22
23 Centennial Care-Behavioral Health 304,492 99.58% 316,093 - 3,157 - 317,649 4.32% 22,660 22,524 340,174 345,664 (5,490) 23
24 Subtotal 2,772,225 101.06% 2,813,489 (2,500) 40,016 (42,523) 2,783,608 0.41% 117,046 116,153 2,899,761 2,937,819 (38,058) 24
25 Medicare Part A 1,483 100.00% 1,300 - - - 1,300 -12.35% - - 1,300 1,300 - 25
26 Medicare Part B 102,528 100.00% 109,909 - - - 109,909 7.20% - - 109,909 109,909 - 26
27 Medicare Part D 30,689 100.00% 36,702 - - - 36,702 19.60% - - 36,702 36,702 - 27
28 Subtotal 134,700 100.00% 147,911 - - - 147,911 14.45% - - 147,911 147,911 - 28
29 Utilization 2,588 100.00% 4,326 4,326 - 4,326 4,326 67.15% - - 4,326 4,326 - 29
30 HIT 6,305 100.00% 9,282 9,282 9,282 - 9,282 47.23% - - 9,282 9,240 43 30
31 Contracts 822 -- - - - - - -100.00% - - - - - 31
32 Subtotal 9,715 100.00% 13,609 13,609 9,282 4,326 13,609 40.08% - - 13,609 13,566 43 32
33 Rate Increase for Primary Care Services 24,205 80.09% 9,104 9,104 11,366 - 11,366 -53.04% - - 11,366 11,252 114 33
34 Health Home - -- - - - - - -- - - - - - 34
35 Health Insurance Providers Fee 84,298 0.00% - - - 95,279 95,279 13.03% - - 95,279 95,281 (1) 35
36 Subtotal 108,503 8.54% 9,104 9,104 11,366 95,279 106,646 -1.71% - - 106,646 106,533 113 36
37 Medicaid Expansion - Physical Health 1,153,070 133.39% 1,388,275 - 18,231 (368,021) 1,040,784 -9.74% - - 1,040,784 1,280,077 (239,293) 37
38 Medicaid Expansion - Behavioral Health 86,148 98.26% 99,606 - 1,586 - 101,368 17.67% - - 101,368 98,413 2,956 38
39 Subtotal 1,239,218 130.27% 1,487,881 - 19,817 (368,021) 1,142,153 -7.83% - - 1,142,153 1,378,489 (236,337) 39
40 40
41 Prior Years Charged to Current Year 7,274 na - - - 113,467 113,467 1459.83% - - 113,467 113,467 - 41
42 Current Year Charged to Future Year (113,467) na - - - (42,357) (42,357) -62.67% - - (42,357) (69,756) 27,399 42
43 43
44 Grand Total 5,055,965 102.46% 5,427,358 185,175 274,433 (236,135) 5,294,673 4.72% 125,919 125,318 5,419,991 5,655,956 (235,964) 44
Notes:
1. (Line 10)Clinic Services consists primarily of school based health services with small amounts also going to clinics providing a variety of services.
2. (Line 15) Others contains: Transportation, Lab/X-Ray, Prosthetics, RHC, Hospice, Home Health, Medical Supplies, Prescribed Drugs, Dental Services, EPSDT, Nursing Facility, Maintenance, Family Planning.
3. (Lines 21-23, 37-38, Columns E and K) Actual YTD payments are from the MCO database, instead of Share Accounting Detailed File (SADF), because SADF doesn't show payments by programs.
4. (Lines 21, 37, Column H) Others under the managed care projection lines reflect retroactive eligibility reconciliation for CY14 and CY15, Risk Corridor recoupment for CY14 and CY15, Hepatitis-C reconciliation, MCO sanctions.
5. (Line 34) Health Home budget has been built into the MCO rates starting from April 2016 for Behavior Health program for both Medicaid Base population and Expansion population, so the expenditures on Health Home is not shown in this line.
11/2/2016
STATE OF NEW MEXICO
HUMAN SERVICES DEPARTMENT FY 16 Lag Model with Centennial Care and Medicaid Expansion with Actual Data Thru Sep 2016 ($000s)
Medical Assistance Division
No. Description
FY 16
Projection
HIT, IHS,
Refugees,
Medicaid
Expansion &
CHIP (ACA)
(100% FFP) 1
Health Homes,
Sterilization &
Family Planning
Services (90%
FFP) 2
Breast &
Cervical
Cancer
Program
(EFMAP) 3
Title XXI
CHIP
(EFMAP) 4
Utilization
Review (75%
FFP) 5
Title XIX Medicaid
(FMAP) 6
Admin and
Fees (50%
FFP) 7
Non-Federal
Financial
Participation
Expenses
(0% FFP) 8
Federal Share
% of Composite
Federal Share
A B C D E F G H I J K L M
1 Inpatient Hospital 88,382 26,959 110 36 180 - 61,098 - - 70,166 79.39%
2 DSH 32,160 - - - - - 32,160 - - 22,631 70.37%
3 GME 9,889 - - - - - 9,889 - - 6,959 70.37%
4 IME 72,799 - - - - - 72,799 - - 51,229 70.37%
5 Safety Net Care 70,451 - - - - - 70,451 - - 49,576 70.37%
6 HQII Pool 2,824 - - - - - 2,824 - - 1,988 70.37%
7 Physician Services 40,542 10,632 - 32 115 - 29,669 - 94 31,599 77.94%
8 IHS Hospital 118,083 118,083 - - - - - - - 118,083 100.00%
9 ICF-IID 27,646 183 - - - - 27,463 - - 19,475 70.44%
10 Clinic Services 47,160 2,125 - - 96 - 44,939 - - 33,818 71.71%
11 Federal Qualified Health Centers 3,994 1,035 (1) 0 18 - 2,941 - - 3,115 77.99%
12 Other Practitioners 30,049 1,738 - 0 218 - 28,093 - - 21,645 72.03%
13 Outpatient Hospital 43,821 13,109 - 115 195 - 30,401 - 1 34,708 79.21%
14 PACE 12,121 - - - - - 12,121 - - 8,508 70.19%
15 Others 53,112 18,101 2,444 36 419 - 32,079 - 33 43,189 81.32%
16 BH FFS 35,558 18,236 0 3 162 - 17,145 - 11 30,411 85.53%
17 Subtotal 688,592 210,202 2,553 223 1,403 - 474,072 - 140 547,099 79.45%
18 DD and MF (DOH) 280,544 - - - - 477 278,508 1,559 - 196,733 70.13%
19 Mi Via Waivers (DOH) 69,666 - - - - 1,414 66,440 1,812 - 48,654 69.84%
20 Subtotal 350,210 - - - - 1,891 344,948 3,371 - 245,387 70.07%
21 Centennial Care-Physical Health 1,499,023 94,874 15,934 1,971 22,528 - 1,363,473 - 244 1,085,536 72.42%
22 Centennial Care-LTSS 1,060,564 12,631 - 720 211 - 1,047,002 - - 748,315 70.56%
23 Centennial Care-Behavioral Health 340,174 20,283 143 151 5,398 - 314,198 - - 245,356 72.13%
24 Subtotal 2,899,761 127,788 16,077 2,842 28,137 - 2,724,673 - 244 2,079,207 71.70%
25 Medicare Part A 1,300 - - - - - 1,300 - - 915 70.37%
26 Medicare Part B 109,909 4,442 - - - - 93,173 - 12,294 69,840 63.54%
27 Medicare Part D 36,702 - - - - - - - 36,702 - 0.00%
28 Subtotal 147,911 4,442 - - - - 94,473 - 48,997 70,755 47.84%
29 Utilization 4,326 - - - - 4,326 - - - 3,245 75.00%
30 HIT 9,282 9,282 - - - - - - - 9,282 100.00%
31 Contracts - - - - - - - - - - -
32 Subtotal 13,609 9,282 - - - 4,326 - - - 12,527 92.05%
33 Rate Increase for Primary Care Services 11,366 2,524 - - - - 8,842 - - 8,746 76.95%
34 Health Home - - - - - - - - - - -
35 Health Insurance Providers Fee 95,279 31,991 - - 2,526 - 60,762 - - 76,739 80.54%
36 Subtotal 106,646 34,516 - - 2,526 - 69,604 - - 85,485 80.16%
37 Medicaid Expansion - Physical Health 1,040,784 1,040,784 - - - - - - - 1,040,784 100.00%
38 Medicaid Expansion - Behavioral Health 101,368 101,368 - - - - - - - 101,368 100.00%
39 Subtotal 1,142,153 1,142,153 - - - - - - - 1,142,153 100.00%
40
41 Prior Years Charged to Current Year 113,467 - - - - - 113,467 - - 79,847 70.37%
42 Current Year Charged to Future Year (42,357) - - - - - (42,357) - - (29,807) 70.37%
4344 Grand Total 5,419,991 1,528,383 18,630 3,064 32,066 6,218 3,778,880 3,371 49,381 4,232,653 78.09%
45
46
47 HSD Billed Collection HSD Change from
48 State Share Revenues: Budget Amount YTD Projection Previous Federal Revenues 4,232,653
49 Department of Health (Line 18 & 19) 9
103,293 105,943 98,292 105,943 - Federal Disallowance 10
50 Department of Health Additional Need /(Surplus) (394) (394) SBHS CPE 15
13,342
51 Department of Health for Early Intervention 8,142 7,550 6,364 7,550 - All State Revenues 1,173,996
52 Department of Health for FQHCs 482 482 482 482 -
53 Department of Health for EC 1 1 -
54 Children, Youth and Families -
55 County Supported Medicaid Fund 27,590 28,350 28,350 760 Notes:
56 Tobacco Settlement Revenue, Base 9,220 30,020 30,020 -
57 Tobacco Settlement Revenue - - - 1. HIT, IHS, QI-1 Medicare Part B premiums, Refugees, Medicaid Expansion
58 Total Operating Transfers In 148,728 113,975 163,507 171,952 366 are eligible for 100% FFP. Under the ACA beginning Oct. 2015, Medicaid
59 will receive 100% match for CHIP kids through FFY2019.
60 School Based Health Services (Part of Line 10) - 2. Health Homes, sterilization and family planning service costs are eligible for
61 Physician UPL UNM 1,219 1,675 1,675 1,675 (119) 90% FFP.
62 Safety Net Care 11
397 - - 3. Breast and cervical cancer (BCC) program with enhanced FMAP.
63 County Supported Hospital Payments 11
25,099 26,227 26,227 26,227 - 4. CHIP is a Title XXI program with enhanced FMAP. FY16 will have one quarter
64 Additional County Supported Hospital Payments 12
9,781 at regular EFMAP.
65 UNM IGT 14,726 25,550 25,550 2,543 5. Utilization review is federally matched at 75%; admin. expenses.
66 Miner's Colfax 16
- 1,317 1,317 1,317 - 6.Title XIX expenditures with regular FMAP. The final FFY 2016 FMAP
67 Drug Rebates13
32,963 31,242 31,242 - is from FFIS, released October 2014.
68 Fraud 872 1,192 1,192 (1,408) 7. Administration expenditures are eligible for 50% FFP.
69 Tort and Insurance Carrier Refund - - 8. Pregnancy termination, special needs, state only buy-in for Medicare Part B
70 Income Diversion Trust 486 623 623 - and all Medicare Part D buy-ins (Claw back) expenditures are not eligible
71 Buy-In Recovery 215 44 44 (1) for federal financial participation.
72 Cost Settlement 500 478 478 - 9. DOH for Medicaid DD, MF and Mi Via waiver services; projected revenue
73 Estate Recovery 9 99 99 12 is without the 3% for admin.
74 Misc. Revenues14
- 278 278 6 10.There is a placeholder for potential federal disallowances.
75 HMS-RAC-TPL/Subrogation 500 391 391 (13) 11.The sum of lines 62 and 63 is the 1/12th% of the gross receipts tax contributed
76 Total Other Revenues 86,767 63,567 89,117 1,020 by the counties to support the Safety Net Care Pool and Hospital Payments.
77 12. Line 64 represents the additional county support to fully fund the Safety Net
78 General Fund Need 912,927 1,405 Care Pool.
79 13. HSD will collect five quarters of MCO drug rebates in FY16.
80 HB 2 / SFC 891,722 - 14. Misc. Revenues include Medicaid overpayments, CSES Recoveries,
81 NF Fee Increase Special 500 - Restitutions, TPL.
82 HB 2 / 2016 Supplemental 18,000 - 15. Starting from FY16, school districts will contribute the state share of school
83 Transfer from Other Divisions 1,827 527 based health services provided by Medicaid through Certified Public
84 Prior Year Balances 711 711 Expenditures.
85 DOH Waiver Revenue from FY15 167 167 16. Miner's Colfax hospital will contribute the state share of Safety Net Care Pool
86 State Revenue Surplus / (Shortfall) - - supplemental payments. The SFY16 current estimate is for payments issued in
87 State Revenue Surplus/ (Shortfall) Assoc. with Expenditures Charged to FY17 (12,550) 8,119 CY2014 and CY2015.
11/2/2016
Federal Medicaid Expenditure Type and Federal Financial Participation Rates
PROJECTED REVENUES

STATE OF NEW MEXICO
HUMAN SERVICES DEPARTMENT
Medical Assistance Division FY 17 Lag Model with Centennial Care and Medicaid Expansion with Actual Data Thru Sep 2016 ($000s)
No. Description
FY 16 Title XIX
Projection
FY 17 %
Completion
Title XIX
Actual YTD
Actual Paid Lump
Sum/ Others YTD
Projected
Lump Sum Others
FY 17 Title XIX
Projection
% Change
from FY 16
CHIP Actual
Paid YTD
CHIP
Projection
FY 17 TOTAL
Medicaid
Projection
Jun 2016 Data
Projection
Change from
Previous No.
A B C D E F G H I J K L M N O P
1 Inpatient Hospital 86,797 11.94% 10,139 - - - 84,918 -2.17% 306 2,566 87,484 87,068 416 1
2 DSH 32,160 0.00% - - 32,774 - 32,774 1.91% - - 32,774 32,774 - 2
3 GME 9,889 0.00% - - 18,500 - 18,500 87.07% - - 18,500 16,847 1,653 3
4 IME 72,799 0.00% - - 90,787 - 90,787 24.71% - - 90,787 83,667 7,120 4
5 Safety Net Care 70,451 0.00% - - 68,889 - 68,889 -2.22% - - 68,889 68,889 - 5
6 HQII Pool 2,824 0.00% - - 5,765 - 5,765 104.10% - - 5,765 5,765 - 6
7 Physician Services 39,864 14.17% 5,935 - 5,785 - 41,996 5.35% 104 637 42,633 42,199 434 7
8 IHS Hospital 118,083 18.01% 22,877 - - - 127,025 7.57% - - 127,025 125,396 1,629 8
9 ICF-IID 27,646 20.46% 5,631 - - - 27,524 -0.44% - - 27,524 27,937 (413) 9
10 Clinic Services 45,116 3.29% 1,545 - - - 50,117 11.09% 137 1,053 51,170 51,170 - 10
11 Federal Qualified Health Centers 3,905 15.82% 740 - - - 4,678 19.81% 18 113 4,791 4,908 (117) 11
12 Other Practitioners 28,862 16.98% 5,032 - - - 29,634 2.68% 192 1,128 30,762 30,640 122 12
13 Outpatient Hospital 42,971 16.18% 7,095 - - - 43,849 2.04% 124 767 44,616 44,947 (331) 13
14 PACE 12,121 25.68% 3,112 - - - 12,119 -0.01% - - 12,119 12,129 (10) 14
15 Others 51,235 19.77% 10,972 - - 2,219 55,560 8.44% 367 1,782 57,342 55,794 1,548 15
16 BH FFS 34,704 17.15% 6,368 - - - 37,090 6.88% 141 869 37,959 37,562 397 16
17 Subtotal 679,427 10.92% 79,447 - 222,501 2,219 731,226 7.62% 1,389 8,916 740,141 727,693 12,448 17
18 DD and MF (DOH) 280,544 7.69% 21,405 131 149 526 278,525 -0.72% - - 278,525 281,796 (3,271) 18
19 Mi Via Waivers (DOH) 69,666 19.43% 16,081 625 71 3,644 82,749 18.78% - - 82,749 78,761 3,988 19
20 Subtotal 350,210 10.38% 37,486 757 220 4,170 361,274 3.16% - - 361,274 360,557 717 20
21 Centennial Care-Physical Health 1,406,684 23.69% 338,648 - 25,063 (9,397) 1,431,819 1.79% 19,987 82,105 1,513,924 1,565,435 (51,511) 21
22 Centennial Care-LTSS 1,059,274 23.94% 263,435 - 11,552 2,640 1,101,288 3.97% 314 314 1,101,602 1,110,522 (8,920) 22
23 Centennial Care-Behavioral Health 317,649 23.92% 83,472 - 3,157 4,172 349,408 10.00% 5,115 20,867 370,275 378,810 (8,535) 23
24 Subtotal 2,783,608 23.81% 685,555 - 39,772 (2,586) 2,882,514 3.55% 25,416 103,286 2,985,800 3,054,767 (68,967) 24
25 Medicare Part A 1,300 36.59% 508 - - - 1,387 6.74% - - 1,387 1,295 92 25
26 Medicare Part B 109,909 29.89% 40,753 - - - 136,344 24.05% - - 136,344 136,190 154 26
27 Medicare Part D 36,702 16.28% 7,001 - - - 43,005 17.17% - - 43,005 42,567 438 27
28 Subtotal 147,911 26.70% 48,262 - - - 180,737 47.97% - - 180,737 180,051 686 28
29 Utilization 4,326 13.28% 664 664 - 5,000 5,000 15.57% - - 5,000 5,000 - 29
30 HIT 9,282 53.83% 6,459 6,459 12,000 - 12,000 29.28% - - 12,000 8,000 4,000 30
31 Contracts - 0.00% - - 1,345 - 1,345 -- - - 1,345 - 1,345 31
32 Subtotal 13,609 38.83% 7,123 7,123 13,345 5,000 18,345 34.80% - - 18,345 13,000 5,345 32
33 Rate Increase for Primary Care Services 11,366 100.00% 153 153 153 - 153 -98.65% - - 153 153 33
34 Health Home - -- - - - - - -- - - - - 34
35 Health Insurance Providers Fee 95,279 -- - - - - - -100.00% - - - - 35
36 Subtotal 106,646 100.00% 153 153 153 - 153 -99.86% - - 153 153 36
37 Medicaid Expansion - Physical Health 1,040,784 23.55% 326,619 - 18,231 (4,449) 1,386,883 33.25% - - 1,386,883 1,372,609 14,274 37
38 Medicaid Expansion - Behavioral Health 101,368 22.99% 25,422 - 1,586 1,650 110,566 9.07% - - 110,566 109,140 1,426 38
39 Subtotal 1,142,153 23.51% 352,041 - 19,817 (2,799) 1,497,450 31.11% - - 1,497,450 1,481,750 15,700 39
40 40
41 Prior Years Charged to Current Year 113,467 na - - - 42,357 42,357 -62.67% - - 42,357 69,756 (27,399) 41
42 Current Year Charged to Future Year (42,357) na - - - - -100.00% - - - - 42
43 43
44 Grand Total 5,294,673 21.23% 1,210,067 8,032 295,808 48,360 5,714,055 7.92% 26,805 112,201 5,826,256 5,887,573 (61,317) 44
Notes:
1. (Line 10)Clinic Services consists primarily of Medicaid School-Based Services (MSBS) with small amounts also going to clinics providing a variety of services.
2. (Line 15) Others contains: Transportation, Lab/X-Ray, Prosthetics, RHC, Hospice, Home Health, Medical Supplies, Prescribed Drugs, Dental Services, EPSDT, Nursing Facility, Maintenance, Family Planning.
3. (Lines 21-23, 37-38, Columns E and K) Actual YTD payments are from the MCO database, instead of Share Accounting Detailed File (SADF), because SADF doesn't show payments by programs.
4. (Lines 21, 37, Column H) Others under the managed care projection lines reflect retroactive eligibility reconciliation for CY14 and CY15, Hepatitis-C reconciliation, NMMIP for second half of SFY17.
5. (Line 34) Health Home budget has been built into the MCO rates starting from April 2016 for Behavior Health program for both Medicaid Base population and Expansion population, so the expenditures on Health Home is not shown in this line.
6. (Line 34) Health Insurance Providers Fee is suspended for the 2016 data year, but will be resumed for data year 2017 and forward.
11/2/2016

STATE OF NEW MEXICO
HUMAN SERVICES DEPARTMENT FY 17 Lag Model with Centennial Care and Medicaid Expansion with Actual Data Thru Sep 2016 ($000s)
Medical Assistance Division
No. Description
FY 17
Projection
HIT, IHS,
Refugees,
Medicaid
Expansion
(100% FFP) 1
Medicaid
Expansion
(95% FFP)1
Health Homes,
Sterilization &
Family
Planning
Services (90%
FFP) 2
Breast &
Cervical
Cancer
(EFMAP) 3
Title XXI CHIP
(EFMAP) 4
Utilization
Review (75%
FFP) 5
Title XIX
Medicaid
(FMAP) 6
Admin and Fees
(50% FFP) 7
Non-Federal
Financial
Participation
Expenses
(0% FFP) 8
Federal Share
% of
Composite
Federal
Share
A B C D E F G H I J K L M N
1 Inpatient Hospital 87,484 17,411 19,446 286 - 2,566 - 47,774 - - 72,647 83.04%
2 DSH 32,774 - - - - - - 32,774 - - 23,312 71.13%
3 GME 18,500 - - - - - - 18,500 - - 13,159 71.13%
4 IME 90,787 - - - - - - 90,787 - - 64,577 71.13%
5 Safety Net Care 68,889 - - - - - - 68,889 - - 49,001 71.13%
6 HQII Pool 5,765 - - - - - - 5,765 - - 4,100 71.13%
7 Physician Services 42,633 5,421 6,335 - 24 637 - 30,160 - 56 33,518 78.62%
8 IHS Hospital 127,025 127,025 - - - - - - - - 127,025 100.00%
9 ICF-IID 27,524 - 171 - - - - 27,352 - - 19,576 71.12%
10 Clinic Services 51,170 139 214 - - 1,053 - 49,734 - 30 36,760 71.84%
11 Federal Qualified Health Centers 4,791 629 601 3 1 113 - 3,444 - - 3,762 78.53%
12 Other Practitioners 30,762 463 514 - - 1,128 - 28,657 - - 22,426 72.90%
13 Outpatient Hospital 44,616 6,612 7,623 - 52 767 - 29,561 - - 35,653 79.91%
14 PACE 12,119 - - - - - - 12,119 - - 8,597 70.93%
15 Others 57,342 7,811 8,558 2,137 112 1,848 - 36,864 - 11 45,971 80.17%
16 BH FFS 37,959 3,223 4,081 1 4 869 - 29,769 - 13 29,124 76.73%
17 Subtotal 740,141 168,735 47,543 2,427 193 8,982 - 512,152 - 110 589,210 79.61%
18 DD and MF (DOH) 278,525 - - - - - 526 277,251 748 - 197,561 70.93%
19 Mi Via Waivers (DOH) 82,749 - - - - - 1,728 78,993 2,028 - 58,411 70.59%
20 Subtotal 361,274 - - - - - 2,254 356,244 2,776 - 255,972 70.85%
21 Centennial Care-Physical Health 1,513,924 25,063 - 15,934 1,498 82,105 - 1,389,324 - - 1,108,357 73.21%
22 Centennial Care-LTSS 1,101,602 11,552 - - 720 314 - 1,089,016 - - 785,056 71.26%
23 Centennial Care-Behavioral Health 370,275 3,157 - 143 127 20,867 - 345,980 - - 269,716 72.84%
24 Subtotal 2,985,800 39,772 - 16,077 2,345 103,286 - 2,824,320 - - 2,163,128 72.45%
25 Medicare Part A 1,387 - - - - - - 1,387 - - 987 71.13%
26 Medicare Part B 136,344 5,507 - - - - - 116,056 - 14,781 87,796 64.39%
27 Medicare Part D 43,005 - - - - - - - - 43,005 - 0.00%
28 Subtotal 180,737 5,507 - - - - - 117,444 - 57,787 88,783 49.12%
29 Utilization 5,000 - - - - - 5,000 - - - 3,750 75.00%
30 HIT 12,000 12,000 - - - - - - - - 12,000 100.00%
31 Contracts 1,345 - - - - - - 1,345 - - 957 71.13%
32 Subtotal 18,345 12,000 - - - - 5,000 1,345 - - 16,707 91.07%
33 Rate Increase for Primary Care Services 153 17 - - - - - 136 - - 113 73.66%
34 Health Home - - - - - - - - - - - -
35 Health Insurance Providers Fee - - - - - - - - - - - -
36 Subtotal 153 17 - - - - 136 - - 113 73.66%
37 Medicaid Expansion - Physical Health 1,386,883 633,902 752,981 - - - - - - - 1,349,234 97.29%
38 Medicaid Expansion - Behavioral Health 110,566 50,710 59,857 - - - - - - - 107,574 97.29%
39 Subtotal 1,497,450 684,612 812,838 - - - - - - - 1,456,808 97.29%
40
41 Prior Years Charged to Current Year 42,357 - - - - - - 42,357 - - 29,806 70.00%
42 Current Year Charged to Future Year
4344 Grand Total 5,826,256 910,643 860,381 18,504 2,538 112,268 7,254 3,853,997 2,776 57,896 4,600,527 78.96%
45
46
47 FY 17 Billed Collection HSD Change from
48 State Share Revenues: Op. Budget Amount YTD Projection Previous Federal Revenues 4,600,527
49 Department of Health (Line 18 & 19) 9,16
103,360 20,773 10,921 104,655 394 Federal Disallowance 10
50 Department of Health Additional Need /(Surplus) - (108) MSBS CPE 13
14,410
51 Department of Health for Early Intervention 8,062 2,016 626 8,292 - All State Revenues 1,211,319
52 Department of Health for FQHCs 462 462 560 -
53 Department of Health for EC 1 1 -
54 Children, Youth and Families - -
55 County Supported Medicaid Fund 33,533 9,959 1,847 30,200 (1,635) Notes:
56 Tobacco Settlement Revenue, Base 27,319 6,830 27,319 -
57 Tobacco Settlement Revenue - - 1. HIT, IHS, QI-1 Medicare Part B premiums, Refugees, Medicaid Expansion are eligible
58 UNM IGT 43,007 44,915 (6,758) for 100% FFP. Under ACA, the Medicaid Expansion population
59 Total Operating Transfers In 215,744 33,211 20,223 215,942 (8,107) will be federally funded 100% in CY2016 and 95% in CY2017.
60 2. Health Homes, sterilization and family planning service costs are eligible for 90% FFP.
61 Physician UPL UNM 1,993 1,681 (312) 3. Breast and cervical cancer (BCC) program with enhanced FMAP.
62 Safety Net Care 11
- - - 4. CHIP is a Title XXI program with enhanced FMAP. FY17 will have 100% FFP. Under the ACA
63 County Supported Hospital Payments 11
26,618 23,259 2,835 23,259 (2,978) beginning Oct. 2015, Medicaid will receive 100% match for CHIP kids through FFY2019.
64 Additional County Supported Hospital Payments 12
- - - 5. Utilization review is federally matched at 75%; admin. expenses.
65 Miner's Colfax14
771 1,036 - 6. Title XIX expenditures with regular FMAP. The FFY 2017 FMAP is from FFIS, released
66 County Contribution for Incarcerated Population15
- - September 2015, based on revised income data.
67 Drug Rebates 20,434 5,755 28,167 3,146 7. Administration expenditures are eligible for 50% FFP.
68 Fraud 872 6 872 -
69 Income Diversion Trust 486 275 486 -
70 Buy-In Recovery 215 11 215 -
71 Cost Settlement 500 64 500 - 9. DOH for Medicaid DD traditional and Mi Via waiver services; projected revenue is
72 Estate Recovery 9 1 9 - without the 3% for admin. MF GF appropriation is under HSD.
73 Misc. Revenue 32 32 32
74 HMS-RAC-TPL/Subrogation 500 500 - 11.The sum of lines 62 and 63 is the 1/12th% of the gross receipts tax contributed
75 Total Other Revenues 52,398 8,978 56,757 (111) by the counties to support the Safety Net Care Pool and Hospital Payments.
76
77 General Fund Need 938,619 (9,308) 13. Starting from FY16, school districts will contribute the state share of Medicaid
78 School Based Services through Certified Public Expenditures.
79 HB 2 / SFC 913,637 - 14. Miner's Colfax hospital will contribute the state share of Safety Net Care Pool supplemental
80 payments. The current estimate is for payments issued in CY2016.
81 15. Senate Bill 42 stated that counties will contribute the state share of payments for fee-
82 for-service inpatient services for their respective incarcerated populations.
83 16. DOH Budget request is for Developmental Disabled waiver only, budget request for
84 State Revenue Surplus / (Shortfall) (24,982) 9,308 Medically Fragile waiver is through HSD.
85
11/2/2016
Federal Medicaid Expenditure Type and Federal Financial Participation Rates
PROJECTED REVENUES
10.There is a placeholder for potential federal disallowances.
8. Pregnancy termination, special needs, state only buy-in for Medicare Part B and all
12. Line 64 represents the additional county support to fully fund the Safety Net Care Pool.
Medicare Part D buy-ins (Claw back) expenditures are not eligible for federal financial
participation.

STATE OF NEW MEXICO DRAFT
HUMAN SERVICES DEPARTMENT
Medical Assistance Division FY 18 Trend Model with Centennial Care and Medicaid Expansion ($000s)
No. Description
FY 17 Title XIX
Projection
FY 17 Title XIX
Projected Claims Δ Price $ Impact Δ Recipient $ Impact Δ Utilization $ Impact
Projected
Lump Sum Others
FY 18 Title
XIX
Projection
% Change
from FY 17
FY 17 Title
XXI
Projection
FY 18 Title
XXI
Projection
FY 18 Total
Medicaid
Projection
FY 18 Budget
Request
Change from
Budget
Request No.
A B C D E F G H I J K L M N O P Q R S T
1 Inpatient Hospital 84,918 84,918 0.00% - 1.67% 1,418 0.00% - - - 86,336 1.67% 2,566 2,612 88,948 88,622 327 1
2 DSH 32,774 - -- - -- - -- - 32,774 - 32,774 0.00% - - 32,774 32,774 - 2
3 GME 18,500 - -- - -- - -- - 18,500 - 18,500 0.00% - - 18,500 16,847 1,653 3
4 IME 90,787 - -- - -- - -- - 90,787 - 90,787 0.00% - - 90,787 85,244 5,543 4
5 Safety Net Care 68,889 - -- - -- - -- - 68,889 - 68,889 0.00% - - 68,889 68,889 - 5
6 HQII Pool 5,765 - -- - -- - -- - 8,826 - 8,826 53.10% - - 8,826 8,826 - 6
7 Physician Services 41,996 36,211 0.00% - 1.70% 617 0.00% - 5,785 - 42,613 1.47% 637 649 43,261 42,822 439 7
8 IHS Hospital 127,025 127,025 2.30% 2,922 -0.61% (794) 0.00% - - - 129,153 1.67% - - 129,153 127,504 1,649 8
9 ICF-IID 27,524 27,524 0.00% - 0.30% 82 0.00% - - - 27,605 0.30% - - 27,605 30,084 (2,479) 9
10 Clinic Services 50,117 50,117 0.00% - 1.73% 865 0.00% - - - 50,982 1.73% 1,053 1,072 52,054 52,054 - 10
11 Federal Qualified Health Centers 4,678 4,678 2.69% 126 -0.94% (45) 0.00% - - 678 5,437 16.21% 113 115 5,552 4,982 570 11
12 Other Practitioners 29,634 29,634 0.00% - 1.79% 530 0.00% - - - 30,165 1.79% 1,128 1,149 31,313 31,187 126 12
13 Outpatient Hospital 43,849 43,849 0.00% - 1.70% 747 0.00% - - - 44,595 1.70% 767 781 45,376 45,731 (355) 13
14 PACE 12,119 12,119 0.00% - 0.00% - 0.00% - - - 12,119 0.00% - - 12,119 12,129 (10) 14
15 Others 55,560 53,340 0.00% - 1.73% 924 0.00% - 0 100 54,364 -2.15% 1,782 1,814 56,179 56,791 (612) 15
16 BH FFS 37,090 37,090 0.04% 16 1.31% 485 0.00% - - - 37,591 1.35% 869 885 38,476 38,220 255 16
17 Subtotal 731,226 506,505 0.60% 3,063 0.95% 4,828 0.00% - 225,562 778 740,736 1.30% 8,916 9,076 749,812 742,707 7,106 17
18 Traditional DD and MF Waiver (DOH) 278,525 277,850 0.00% - 1.18% 3,280 0.00% 3 152 486 281,770 1.17% - - 281,770 278,368 3,403 18
19 Mi Via DD and MF Waiver (DOH) 82,749 79,035 0.00% - 4.73% 3,737 0.90% 746 72 3,704 87,294 5.49% - - 87,294 79,639 7,655 19
20 Subtotal 361,274 356,884 0.00% - 1.97% 7,018 0.21% 748 224 4,190 369,064 2.16% - - 369,064 358,006 11,058 20
21 Centennial Care-Physical Health 1,431,819 1,416,154 0.00% - 2.54% 35,976 1.17% 16,955 25,307 (1,598) 1,492,794 4.26% 82,105 85,173 1,577,967 1,631,836 (53,868) 21
22 Centennial Care-LTSS 1,101,288 1,087,096 0.00% - 5.23% 56,828 1.77% 20,249 11,552 5,279 1,181,004 7.24% 314 257 1,181,261 1,200,951 (19,691) 22
23 Centennial Care-Behavioral Health 349,408 342,079 0.00% - 2.83% 9,695 1.37% 4,809 3,157 5,993 365,733 4.67% 20,867 21,657 387,390 394,395 (7,005) 23
24 Subtotal 2,882,514 2,845,329 0.00% - 3.60% 102,499 1.43% 42,013 40,016 9,674 3,039,531 5.45% 103,286 107,087 3,146,618 3,227,182 (80,564) 24
25 Medicare Part A 1,387 1,387 2.35% 33 -1.73% (25) 0.00% (0) - - 1,395 0.58% - - 1,395 1,299 96 25
26 Medicare Part B 136,344 136,344 0.86% 1,178 2.77% 3,804 0.00% (1) - - 141,325 3.65% - - 141,325 141,548 (223) 26
27 Medicare Part D 43,005 43,005 7.71% 3,318 6.66% 3,087 0.00% (0) - - 49,410 14.89% - - 49,410 49,204 206 27
28 Subtotal 180,737 180,737 2.51% 4,528 3.71% 6,866 0.00% (1) - - 192,130 6.30% - - 192,130 192,051 80 28
29 Utilization 5,000 - -- - -- - -- - - 5,000 5,000 0.00% - - 5,000 5,000 - 2930 HIT 12,000 - -- - -- - -- - 6,000 - 6,000 -50.00% - - 6,000 6,000 - 30
31 Contracts 1,345 - -- - -- - -- - 1,345 - 1,345 0.00% - - 1,345 - 1,345 31
32 Subtotal 18,345 - - - - - - - 7,345 5,000 12,345 -32.71% - - 12,345 11,000 1,345 32
33 Rate Increase for Primary Care Services 153 - -- - -- - -- - - - - -100.00% - - - - - 33
34 Health Home - - -- - -- - -- - - - - -- - - - - - 34
35 Health Insurance Providers Fee - - -- - -- - -- - - 100,067 100,067 -- - - 100,067 101,483 (1,417) 35
36 Subtotal 153 - -- - -- - -- - - 100,067 100,067 65290.83% - - 100,067 101,483 (1,417) 36
37 Medicaid Expansion - Physical Health 1,386,883 1,373,101 0.00% - 3.96% 54,413 1.21% 17,214 18,231 (984) 1,461,975 5.41% - - 1,461,975 1,450,800 11,175 3738 Medicaid Expansion - Behavioral Health 110,566 107,330 0.00% - 3.96% 4,254 1.50% 1,674 1,586 1,650 116,494 5.36% - - 116,494 115,414 1,080 38
39 Subtotal 1,497,450 1,480,432 - - 3.96% 58,666 1.23% 18,888 19,817 666 1,578,469 5.41% - - 1,578,469 1,566,213 12,255 3940 40
41 Prior Years Charged to Current Year 42,357 - na - na - na - - - -100.00% - - - - - 41
42 Additional Cost Containment (55,325) (55,325) -- (55,325) (55,325) - 42
43 4344 Grand Total 5,714,055 5,369,887 0.14% 7,591 3.35% 179,877 1.11% 61,649 292,963 65,050 5,977,017 4.60% 112,201 116,163 6,093,180 6,143,317 (50,137) 44
Notes:1. (Line 10) Clinic Services consists primarily of Medicaid School-Based Services (MSBS) with small amounts also going to clinics providing a variety of services.
2. (Line 15) Others contains: Transportation, Lab/X-Ray, Prosthetics, RHC, Hospice, Home Health, Medical Supplies, Prescribed Drugs, Dental Services, EPSDT, Nursing Facility, Maintenance, Family Planning, PCO .3. (Lines 21-23, 36-37, Column L) Others under the managed care projection lines reflect the cost of NMMIP fo FY18, retroactive eligibility reconciliation, cost containment on Physician rate reduction effective 1/1/2017.
11/2/2016

STATE OF NEW MEXICO DRAFT
HUMAN SERVICES DEPARTMENT
Medical Assistance Division FY 18 Trend Model with Centennial Care and Medicaid Expansion ($000s)
Federal Medicaid Expenditure Type and Federal Financial Participation Rates
No. Description
FY 18
Projection
HIT, IHS,
Refugees (100%
FFP) 1
Medicaid
Expansion (95%
FFP)2
Medicaid
Expansion (94%
FFP)2
Health Homes,
Sterilization &
Family Planning
Services (90%
FFP) 3
Breast &
Cervical
Cancer,
CCBHC
Program
(EFMAP) 4
Title XXI
CHIP
(EFMAP) 5
Utilization Review
(75% FFP) 6
Title XIX
Medicaid
(FMAP) 7
Admin and
Fees (50%
FFP) 8
Non-Federal
Financial
Participation
Expenses
(0% FFP) 9
Federal Share
% of
Composite
Federal Share
A B C D E F G H I J K L M N O
1 Inpatient Hospital 88,948 524 17,957 19,453 40 36 2,612 - 48,325 - - 73,341 82.45%
2 DSH 32,774 - - - - - - - 32,774 - - 23,650 72.16%
3 GME 18,500 - - - - - - - 18,500 - - 13,350 72.16%
4 IME 90,787 - - - - - - - 90,787 - - 65,512 72.16%
5 Safety Net Care 68,889 - - - - - - - 68,889 - - 49,711 72.16%
6 HQII Pool 8,826 - - - - - - - 8,826 - - 6,369 72.16%
7 Physician Services 43,261 40 5,728 6,205 - 67 649 - 30,438 - 136 33,928 78.43%
8 IHS Hospital 129,153 129,153 - - - - - - 0 - - 129,153 100.00%
9 ICF-IID 27,605 - 91 99 - - - - 27,415 - - 19,905 72.11%
10 Clinic Services 52,054 - 172 186 - - 1,072 - 50,590 - 34 37,896 72.80%
11 Federal Qualified Health Centers 5,552 1 600 650 - 3 115 - 4,183 - - 4,310 77.64%
12 Other Practitioners 31,313 0 476 516 - 1 1,149 - 29,172 - - 23,084 73.72%
13 Outpatient Hospital 45,376 14 6,936 7,514 - 241 781 - 29,891 - - 36,159 79.69%
14 PACE 12,119 - - 3,497 - - - - 8,623 - - 9,488 78.28%
15 Others 56,179 2,552 7,454 8,075 2,265 41 1,814 - 33,946 - 32 45,528 81.04%
16 BH FFS 38,476 12,803 3,510 3,802 0 2 885 - 17,466 - 8 33,177 86.23%
17 Subtotal 749,812 145,087 42,922 49,995 2,305 390 9,076 - 499,827 - 210 604,560 80.63%
18 Traditional DD and MF Waiver (DOH) 281,770 - - - - - - 486 280,531 753 - 202,639 71.92%
19 Mi Via DD and MF Waiver (DOH) 87,294 - - - - - - 1,757 83,476 2,062 - 62,476 71.57%
20 Subtotal 369,064 - - - - - - 2,242 364,007 2,815 - 265,115 71.83%
21 Centennial Care-Physical Health 1,577,967 25,063 - - 15,934 1,554 85,173 - 1,449,999 - 244 1,168,520 74.05%22 Centennial Care-LTSS 1,181,261 11,552 - - - - 257 - 1,169,452 - - 852,762 72.19%23 Centennial Care-Behavioral Health 387,390 3,157 - - 1,842 101 21,755 - 360,535 - - 285,912 73.80%24 Subtotal 3,146,618 39,772 - - 17,776 1,655 107,186 - 2,979,986 - 244 2,307,193 73.32%25 Medicare Part A 1,395 - - - - - - - 1,395 - - 1,003 71.90%26 Medicare Part B 141,325 5,623 - - - - - - 121,162 - 14,540 92,751 65.63%27 Medicare Part D 49,410 - - - - - - - - - 49,410 - 0.00%28 Subtotal 192,130 5,623 - - - - - - 122,557 - 63,950 93,754 48.80%29 Utilization 5,000 - - - - - - 5,000 - - - 3,750 75.00%30 HIT 6,000 6,000 - - - - - - - - - 6,000 100.00%31 Contracts 1,345 - - - - - - - 1,345 - - 970 72.16%32 Subtotal 12,345 6,000 - - - - - 5,000 1,345 - - 10,720 86.84%33 Rate Increase for Primary Care Services - - - - - - - - - - - - -34 Health Home - - - - - - - - - - - - -35 Health Insurance Providers Fee 100,067 - 16,722 16,722 - - 2,330 - 64,294 - - 80,328 80.27%36 Subtotal 100,067 - 16,722 16,722 - - 2,330 - 64,294 - - 80,328 80.27%37 Medicaid Expansion - Physical Health 1,461,975 18,231 649,636 793,865 - - - - 0 - 244 1,381,617 94.50%38 Medicaid Expansion - Behavioral Health 116,494 1,586 51,791 63,117 - - - - - - - 110,117 94.53%39 Subtotal 1,578,469 19,817 701,427 856,981 - - - - 0 - 244 1,491,735 94.51%4041 Prior Years Charged to Current Year - - - - - - - - - - -42 Additional Cost Containment (55,325) (55,325) (39,325) 71.08%4344 Grand Total 6,093,180 216,299 761,070 923,698 20,081 2,046 118,591 7,242 3,976,691 2,815 64,647 4,814,080 79.01%
4546
47 FY 18 HSD Change from
48 State Share Revenues: Budget Request Projection Previous Federal Revenues 4,814,080
49 Department of Health (Line 18 & 19) 10,17
103,360 103,360 - Federal Disallowance 11
-
50 Department of Health for Early Intervention 8,292 8,292 -
51 Department of Health for FQHCs 560 560 - MSBS CPE14
14,158
52 Department of Health for EC 1 1 - All State Revenues 1,264,942
53 Children, Youth and Families - - -
54 County Supported Medicaid Fund 28,085 27,983 (102) Notes:
55 Tobacco Settlement Revenue, Base 27,819 27,819 - 1. HIT, IHS, QI-1 Medicare Part B premiums, Refugees are eligible for 100% FFP.
56 Tobacco Settlement Revenue - - - 2. Under ACA, the Medicaid Expansion population will be federally funded 95% in CY2017 and 94% in CY2018.
57 UNM IGT 52,088 43,814 (8,274) 3. Health Homes, sterilization and family planning service costs are eligible for 90% FFP.
58 Total Operating Transfers In 220,205 211,829 (8,376) 4. Breast and cervical cancer (BCC) program with enhanced FMAP.
59 Certified Community Behavioral Health Clinics program with enhanced FMAP.
60 Physician UPL UNM 1,993 1,681 (312) 5. CHIP is a Title XXI program with enhanced FMAP. FY18 will have 100% FFP. Under the ACA
61 Safety Net Care 12
- - - beginning Oct. 2015, Medicaid will receive 100% match for CHIP kids through FFY2019.
62 County Supported Hospital Payments 12
27,081 23,104 (3,977) 6. Utilization review is federally matched at 75%; admin. expenses.
63 Additional County Supported Hospital Payments 13
- - - 7. Title XIX expenditures with regular FMAP. The FFY 2018 final FMAP is from FFIS, released
64 Miner's Colfax15
1,036 1,036 - September 2016, based on revised income data.
65 County Contribution for Incarcerated Population16
8. Administration expenditures are eligible for 50% FFP.
66 Drug Rebates 27,024 28,867 1,843 9. Pregnancy termination, special needs and state only buy-in for Medicare Part B and all Medicare Part D
67 Fraud 872 872 - buy-ins (Claw back) expenditures are not eligible for federal financial participation.
68 Income Diversion Trust 486 486 - 10. DOH for Medicaid DD, MF and Mi Via waiver services; projected revenue is without the 3% for admin.
69 Buy-In Recovery 215 215 - 11.There is a placeholder for potential federal disallowances.
70 Cost Settlement 500 500 - 12.The sum of lines 61 and 62 is the 1/12th% of the gross receipts tax contributed by the counties to support the71 Estate Recovery 9 9 - Safety Net Care Pool and Hospital Payments.
72 HMS-RAC-TPL/Subrogation 500 500 - 13. Line 63 represents the additional county support to fully fund the Safety Net Care Pool.
73 Total Other Revenues 59,716 57,270 (2,446) 14. Starting from FY16, school districts will contribute the state share of Medicaid School-Based Services
74 - through Certified Public Expenditures.75 General Fund Need 1,033,653 995,843 (37,810) 15. Miner's Colfax hospital will contribute the state share of Safety Net Care Pool supplemental
76 payments. The current estimate is for services provided in CY2017.
77 FY 2017 Appropriation 913,637 913,637 - 16. Senate Bill 42 stated that counties will contribute the state share of payments for fee-for-service inpatient services
78 for their respective incarcerated populations.
79 State Revenue Surplus/(Shortfall) (120,016) (82,206) 37,810 17. DOH Budget request is for Developmental Disabled waiver only, budget request ($1.4 million) for Medically
Fragile waiver is through HSD.
11/2/2016
PROJECTED REVENUES