STATE OF NEW JERSEY Board of Public Utilities 44 South ...
270
STATE OF NEW JERSEY Board of Public Utilities 44 South Clinton Avenue, 9th Floor Post Office Box 350 Trenton, New Jersey 08625-0350 www.nj.gov/bpu/ ENERGY AND CLEAN ENERGY IN THE MATTER OF THE PETITION OF PUBLIC SERVICE ELECTRIC AND GAS COMPANY FOR APPROVAL OF ITS CLEAN ENERGY FUTURE- ENERGY EFFICIENCY (“CEF-EE”) PROGRAM ON A REGULATED BASIS ) ) ) ) ) ORDER ADOPTING STIPULATION DOCKET NOS. GO18101112 AND EO18101113 Parties of Record: Stefanie A. Brand, Esq., Director, New Jersey Division of Rate Counsel Matthew M. Weissman, Esq., General State Regulatory Counsel, Public Service Electric and Gas Company Daniel Greenhouse, Esq. and William D. Bittinger Esq., Eastern Environmental Law Center Erin Cosgrove, Esq., Energy Efficiency Alliance of New Jersey Steven S. Goldenberg, Esq., Giordano, Halleran and Ciesla, P.C. for New Jersey Large Energy Users Coalition Christopher E. Torkelson, Esq., Eckert Seamans Cherin and Mellott, LLC for Market Participants BY THE BOARD: On October 11, 2018, Public Service Electric and Gas Company (“PSE&G” or “Company”) filed a petition with the New Jersey Board of Public Utilities (“Board” or “BPU”) requesting approval of its Clean Energy Future – Energy Efficiency (“CEF-EE”) Program (“CEF EE Petition”). By this Order, the Board adopts a stipulation of settlement (“Stipulation”) executed by PSE&G, Board Staff ("Staff ”), the New Jersey Division of Rate Counsel ("Rate Counsel"), the Eastern Environmental Law Center (“EELC”); the Energy Efficiency Alliance of New Jersey (“EEA-NJ”); and the New Jersey Large Energy Users Coalition ("NJLEUC") (collectively, "Signatory Parties") that addresses several issues in this matter. Direct Energy Business LLC, Direct Energy Business Marketing LLC, Direct Energy Services LLC, Gateway Energy Services Corporation, NJR Retail Services Company, NRG Energy Inc. (“NRG”), Just Energy Group Inc. (“Just Energy”), and Centrica Business Solutions ("Market Participants") filed a letter of non-opposition. BACKGROUND On January 13, 2008, L. 2007, c. 340 (the “RGGI Act”) was signed into law based on the New Jersey Legislature’s findings that energy efficiency (“EE”) and conservation measures must be essential elements of the state’s energy future and that greater reliance on EE and conservation Agenda Date: 9/23/20 Agenda Item: 8B
Transcript of STATE OF NEW JERSEY Board of Public Utilities 44 South ...

STATE OF NEW JERSEY Board of Public Utilities
44 South Clinton Avenue, 9th Floor Post Office Box 350
Trenton, New Jersey 08625-0350 www.nj.gov/bpu/
ENERGY AND CLEAN ENERGY IN THE MATTER OF THE PETITION OF PUBLIC SERVICE ELECTRIC AND GAS COMPANY FOR APPROVAL OF ITS CLEAN ENERGY FUTURE-ENERGY EFFICIENCY (“CEF-EE”) PROGRAM ON A REGULATED BASIS
) ) ) ) )
ORDER ADOPTING STIPULATION DOCKET NOS. GO18101112 AND EO18101113
Parties of Record: Stefanie A. Brand, Esq., Director, New Jersey Division of Rate Counsel Matthew M. Weissman, Esq., General State Regulatory Counsel, Public Service Electric and
Gas Company Daniel Greenhouse, Esq. and William D. Bittinger Esq., Eastern Environmental Law Center Erin Cosgrove, Esq., Energy Efficiency Alliance of New Jersey Steven S. Goldenberg, Esq., Giordano, Halleran and Ciesla, P.C. for New Jersey Large Energy Users Coalition Christopher E. Torkelson, Esq., Eckert Seamans Cherin and Mellott, LLC for Market
Participants BY THE BOARD: On October 11, 2018, Public Service Electric and Gas Company (“PSE&G” or “Company”) filed a petition with the New Jersey Board of Public Utilities (“Board” or “BPU”) requesting approval of its Clean Energy Future – Energy Efficiency (“CEF-EE”) Program (“CEF EE Petition”). By this Order, the Board adopts a stipulation of settlement (“Stipulation”) executed by PSE&G, Board Staff ("Staff”), the New Jersey Division of Rate Counsel ("Rate Counsel"), the Eastern Environmental Law Center (“EELC”); the Energy Efficiency Alliance of New Jersey (“EEA-NJ”); and the New Jersey Large Energy Users Coalition ("NJLEUC") (collectively, "Signatory Parties") that addresses several issues in this matter. Direct Energy Business LLC, Direct Energy Business Marketing LLC, Direct Energy Services LLC, Gateway Energy Services Corporation, NJR Retail Services Company, NRG Energy Inc. (“NRG”), Just Energy Group Inc. (“Just Energy”), and Centrica Business Solutions ("Market Participants") filed a letter of non-opposition. BACKGROUND
On January 13, 2008, L. 2007, c. 340 (the “RGGI Act”) was signed into law based on the New Jersey Legislature’s findings that energy efficiency (“EE”) and conservation measures must be essential elements of the state’s energy future and that greater reliance on EE and conservation
Agenda Date: 9/23/20 Agenda Item: 8B

Agenda Date: 9/23/20 Agenda Item: 8B
2 BPU DOCKET NOS. GO18101112 and EO18101113
will provide significant benefits to the citizens of New Jersey. The Legislature also found that public utility involvement and competition in the conservation and EE industries are essential to maximize efficiencies.1 Pursuant to Section 13 of the RGGI Act, codified as N.J.S.A. 48:3-98.1(a)(1), an electric or gas public utility may provide and invest in EE and conservation programs in its service territory on a regulated basis. Such investment in EE and conservation programs may be eligible for rate treatment approved by the Board, including a return on equity, or other incentives or rate mechanisms that decouple utility revenue from sales of electricity and gas.2 Ratemaking treatment may include placing appropriate technology and program costs investments in the utility’s rate base, or recovering the utility’s technology and program costs through another ratemaking methodology approved by the Board.3 An electric or gas utility seeking cost recovery for any EE and conservation programs pursuant to N.J.S.A. 48:3-98.1 must file a petition with the Board.4 On May 23, 2018, Governor Murphy signed into law the Clean Energy Act of 2018 (“CEA” or the “Act”).5 The CEA plays a key role in achieving the State’s goal of 100% clean energy by 2050 by establishing aggressive energy reduction requirements, among other clean energy strategies. The CEA emphasizes the importance of EE and peak demand reduction (“PDR”) and requires the Board to adopt an efficiency program “to ensure investment in cost-effective energy efficiency measures, ensure universal access to energy efficiency measures, and serve the needs of low-income communities”6 The CEA also calls upon New Jersey’s electric and gas public utilities7 to play an increased role in delivering EE and PDR programs to customers by requiring the utilities to reduce the use of electricity and natural gas in their service territories.8 On the same day that Governor Murphy signed the CEA into law, he also issued Executive Order 28 (“EO 28”), directing the creation of a new Energy Master Plan (“EMP”) for the state which “shall provide a comprehensive blueprint for the total conversion of the state’s energy production profile to 100% clean energy sources on or before January 1, 2050, and shall further provide specific proposals to be implemented over the next 10 years in order to achieve the January 1, 2050 goal.”9 EE is one of the seven key strategies identified in New Jersey’s 2019 EMP10 and will play an essential role in meeting the State’s long-term clean energy goals. From February 2019 through May 2020, the Board solicited stakeholder feedback through numerous public meetings and technical working group meetings; and invited comments on three topic-specific proposals (program administration, cost recovery mechanisms, and application of
1 N.J.S.A. 48:3-98.1(b). 2 Id. 3 Id. 4 Id. 5 P.L. 2018, c. 17 (N.J.S.A. 48:3-87.8 et al.). 6 N.J.S.A. 48:3-87(g). 7 New Jersey’s electric and gas public utilities include Atlantic City Electric Company (“ACE”), Butler Power and Light Company (“Butler”), Elizabethtown Gas Company (“Elizabethtown”), Jersey Central Power & Light Company (“JCP&L”), New Jersey Natural Gas Company (“NJNG”), Public Service Electric and Gas Company (“PSE&G”), Rockland Electric Company (“RECO”), and South Jersey Gas Company (“SJG”) (collectively, “utilities”). 8 N.J.S.A. 48:3-87.9(a). 9 Exec. Order No. 28 (May 23, 2018), 50 N.J.R. 1394(b) (June 18, 2018), ¶ 3. 10 2019 New Jersey Energy Master Plan: Pathway to 2050 (January 28, 2020), available at https://www.nj.gov/emp/docs/pdf/2020_NJBPU_EMP.pdf.

Agenda Date: 9/23/20 Agenda Item: 8B
3 BPU DOCKET NOS. GO18101112 and EO18101113
utility targets), as well as on a full Energy Efficiency Transition Straw Proposal released on April 1, 2020. Also during the EE transition process, on May 28, 2019, the Board completed a study pursuant to the CEA regarding the potential for reduction in energy usage and peak demand in the state and adopted preliminary quantitative performance indicators to establish utility targets for these reductions. On May 1, 2020, the utilities submitted to the Board and Rate Counsel the results of the demographic analysis required by the CEA, the purpose of which was to determine if all utility customers are able to participate fully in implementing EE measures, identify market barriers that prevent such participation, and make recommendations for measures to overcome such barriers. On May 4, 2020, Staff hosted a public meeting on equity in EE consisting of two panel sessions and a presentation on the results of the demographic analysis, accepting written comments through May 15, 2020. On June 10, 2020, the Board approved an EE transition framework for EE and PDR programs implemented pursuant to the CEA, including requirements for the utilities to establish programs that reduce the use of electricity and natural gas within their territories.11 In addition, on July 13, 2020, the utilities solicited stakeholder input through a public stakeholder meeting on EE core program design, structure, and delivery. A question and answer session facilitated discussion on topics related to challenges and barriers for programs, enhancements to existing core programs, equity, and workforce development. Staff and the utilities accepted written comments through July 27, 2020. PSE&G CEF-EE Program In the CEF EE Petition, the Company sought approval to implement 22 sub-programs, including seven residential sub-programs, seven commercial and industrial (“C&I”) sub-programs, and eight pilot sub-programs (collectively, “2018 EE Programs”). The CEF-EE residential sub-programs would, among other initiatives, promote the purchase and installation of high-efficiency appliances through rebates and on-bill incentives; provide customers with energy audits and installation of EE measures; educate residential builders and developers on energy efficient home design and construction; and educate kindergarten through 12 th grade students on EE. The CEF-EE C&I sub-programs would, among other activities, promote the installation of energy efficient equipment; advance efficient design and equipment installation for new buildings; optimize energy consumption in existing buildings; and upgrade all of PSE&G’s existing high-pressure sodium cobra head streetlights to more efficient light emitting diode (“LED”) streetlights. Lastly, the CEF-EE pilot sub-programs would consist of PSE&G implementing and managing select, highly advanced approaches to EE that, after the conclusion of the pilot phase, might support future EE programs in New Jersey. The total proposed investment for the 2018 EE Programs was approximately $2.8 billion, including $2.5 billion for investment and approximately $283 million in administrative costs over the proposed six-year term of the program, with a proposed 15-year amortization period for residential and C&I program investments. The proposed 2018 EE Programs would include $86.2 million for information technology (“IT”) build investments and $28.9 million for IT run costs. PSE&G
11 In re the Implementation of P.L. 2018, c. 17 Regarding the Establishment of Energy Efficiency and Peak Demand Reduction Programs, BPU Docket No. QO19010040, Order dated June 10, 2020 (“June 10, 2020 Order”).

Agenda Date: 9/23/20 Agenda Item: 8B
4 BPU DOCKET NOS. GO18101112 and EO18101113
proposes to recover costs associated with the 2018 EE Programs via a new CEF-EE Program component (“CEF-EEC”) of the Company’s electric and gas Green Programs Recovery Charge (“GPRC”), which would be filed annually after the proposed initial period, which the Company proposes to begin upon Board approval of the CEF-EE Program. PSE&G proposed to earn a return on its net investment based on its most recent weighted average cost of capital (“WACC”). In addition, the Company requested Board approval of a decoupling mechanism for recovering lost revenues, the Green Enabling Mechanism (“GEM”). The GEM would provide for the recovery or refund of the difference between actual revenue and the level of “allowed” revenue per customer established in the most recently completed base rate case. Under the CEF-EE Program proposal, following a one-year transition period, PSE&G would become the exclusive provider of Board-regulated EE programs in its service territory, with the New Jersey Division of Clean Energy providing oversight, standard setting, and policymaking after the transition. Procedural History On December 16, 2008, the Board issued an Order authorizing PSE&G to implement its Carbon Abatement Program, which included five sub-programs: 1) Residential Whole House Efficiency; 2) Residential Programmable Thermostat Installation; 3) Small Business Direct Install; 4) Large Business Best Practices and Technology Demonstration Pilot; and 5) Hospital Efficiency.12 On July 16, 2009, the Board issued an Order authorizing PSE&G to implement eight EE sub-programs as part of its Energy Efficiency Economic Stimulus Program (“EEE Program”): 1) Residential Whole House Efficiency Sub-Program; 2) Residential Multi-Family Housing Sub-Program; 3) Small Business Direct Install Sub-Program; 4) Municipal/Local/State Government Direct Install Sub-Program; 5) Hospital Efficiency Sub-Program; 6) Data Center Efficiency Sub-Program; 7) Building Commissioning/O&M Sub-Program; and 8) Technology Demonstration Sub-Program.13 By Order dated July 14, 2011, the Board authorized PSE&G to extend three of its eight sub-programs: 1) Residential Multi-Family Housing; 2) Municipal/Local/State Government Direct Install; and 3) Hospital Efficiency (“EEE Extension Sub-Programs”).14 On April 16, 2015, the Board authorized PSE&G to further extend the three sub-programs approved in the July 2011 Order (“EEE Extension II”).15
12 In re the Petition of Public Service Electric and Gas Company Offering a Carbon Abatement Program in Its Service Territory on a Regulated Basis and Associated Cost Recovery Mechanism Pursuant to N.J.S.A. 48:3-98.1, BPU Docket No. EO08060426, Order dated December 16, 2008 (“December 2008 Order”). 13 In re the Petition of Public Service Electric and Gas Company Offering an Energy Efficiency Economic Stimulus Program in Its Service Territory on a Regulated Basis and Associated Cost Recovery Mechanism Pursuant to N.J.S.A. 48:3-98.1, BPU Docket No. EO09010058, Order dated July 16, 2009 (“July 2009 Order”). 14 In re the Petition of Public Service Electric and Gas Company for an Extension of Three Sub-Components of Its Energy Efficiency Economic Stimulus Program in Its Service Territory on a Regulated Basis and Associated Cost Recovery and for Changes in the Tariff for Electric Service, B.P.U.N.J. No. 15 Electric and the Tariff for Gas Service, B.P.U.N.J. No. 15 Gas, Pursuant to N.J.S.A. 48:2-21, 48:2-21.1, and N.J.S.A. 48:3-98.1, BPU Docket No. EO11010030, Order dated July 14, 2011 (“July 2011 Order”). 15 In re the Petition of Public Service Electric and Gas Company to Continue Its Energy Efficiency Economic Extension Program on a Regulated Basis (“EEE Extension II”), BPU Docket No. EO14080897, Order dated April 16, 2015 (“April 2015 Order”).

Agenda Date: 9/23/20 Agenda Item: 8B
5 BPU DOCKET NOS. GO18101112 and EO18101113
By Order dated August 23, 2017, in its approval of the Company’s Energy Efficiency 2017 Program (“EE 2017 Program”), the Board authorized PSE&G to extend the EEE Extension Sub-Programs for two years.16 The Board further authorized the Company to implement a Smart Thermostat Sub-Program and a Residential Data Analytics Smart Pilot Sub-Program. CEF EE Petition On May 3, 2018, PSE&G met with Staff and Rate Counsel for a pre-filing meeting, as required by the May 2008 Order, to discuss the Company’s potential filings. On October 11, 2018, PSE&G filed the CEF EE Petition with the Board. By letter dated November 14, 2018, Staff notified the Company that the CEF EE Petition was administratively deficient with respect to the minimum filing requirements (“MFRs”) set forth in the Board’s May 12, 2008 Order and amended through an Order issued on October 20, 2017 (“Deficiency Letter”).17 In response to the Deficiency Letter, PSE&G filed supplemental information on January 7, 2019. On January 9, 2019, Staff advised PSE&G that the CEF EE Petition was administratively complete as of January 7, 2019. Accordingly, the 180-day period for the Board to review the CEF EE Petition began on January 7, 2019 and was set to expire on July 6, 2019. By Order dated October 29, 2018, the Board designated Commissioner Dianne Solomon as Presiding Commissioner, authorized to rule on all motions that arise during the pendency of the CEF-EE proceeding and modify any schedules that may be set as necessary to secure a just and expeditious determination of the issues.18 The Board directed that any entities seeking to intervene or participate in this matter file the appropriate application with the Board by November 16, 2018 and authorized Commissioner Solomon to render decisions on stipulations, pursuant to N.J.S.A. 48:2-21.3, extending the 180 review period, if submitted, provided that the stipulation extending the time period is executed by all the parties to the proceeding. The authority was limited to extensions that did not collectively exceed 180 days, with any further request for extensions to be directed to the Board. By the November 16, 2018 deadline, nine entities filed to intervene, and six entities filed to participate. Specifically, NJNG; NJLEUC; Tendril Networks, Inc. (“Tendril”) n/k/a Uplight; Market Participants19; EELC, on behalf of Environment New Jersey, Sierra Club, the Environmental
16 In re the Petition of Public Service Electric and Gas Company for Approval of its Energy Efficiency 2017 Program and Recovery of Associated Costs, BPU Docket No. EO17030196, Order dated August 23, 2017 (“August 2017Order”). 17 In re Electric Public Utilities and Gas Public Utilities Offering Energy Efficiency and Conservation Programs, Investing in Class I Renewable Energy Resources, and Offering Class I Renewable Energy Programs in their Respective Service Territories on a Regulated Basis Pursuant to N.J.S.A. 48:3-98.1 – Minimum Filing Requirements, BPU Docket No. QO17091004, Order Dated October 20, 2017. 18 In re the Petition of Public Service Electric and Gas Company for Approval of Its Clean Energy Future – Energy Efficiency (“CEF-EE”) Program on a Regulated Basis, BPU Docket Nos. GO18101112 and EO18101113, Order dated October 29, 2018. 19 On November 16, 2018, Direct Energy (representing five affiliated third party energy supplier companies, including Direct Energy Business, LLC, Direct Energy Business Marketing, LLC, Direct Energy Services, LLC, Gateway Energy Services Corporation, and NJR Retail Services Company) and Centrica Business Solutions filed a motion to intervene. On December 6, 2018, Direct Energy filed a supplemental motion that joined NRG and Just Energy in the original request to intervene on the same grounds as the original moving parties.

Agenda Date: 9/23/20 Agenda Item: 8B
6 BPU DOCKET NOS. GO18101112 and EO18101113
Defense Fund, New Jersey League of Conservation Voters, and Natural Resources Defense Council; Enel X North America, Inc. (“Enel X”); the Keystone Energy Efficiency Alliance (“KEEA”) n/k/a EEANJ; MaGrann Associates; and Sunrun, Inc. (“Sunrun”) moved to intervene. ACE; JCP&L; RECO; Google, LLC (“Google”); Lime Energy Co. (“Lime Energy”); and Philips Lighting North America Corporation n/k/a Signify moved to participate. Commissioner Solomon issued a Prehearing Order on January 22, 2019 that established the issues to be determined by the Board, set forth a procedural schedule, granted intervener status to the NJLEUC and EELC, and granted participant status to the remaining movants, with the exception of KEEA (“Prehearing Order”).20 The Prehearing Order also granted admission pro hac vice to Paul F. Forshay, Esq. for NJLEUC and Kristine E. Marsilio, Esq. for Market Participants. On January 29, 2019, Sunrun moved for reconsideration of the Prehearing Order insofar as it denied Sunrun intervener status. On the same date, the Market Participants moved for interlocutory review of the Prehearing Order insofar as it denied Direct Energy intervener status. Both entities argued that their interests as competitors in the EE field could only be adequately represented by themselves. On February 1 and February 8, 2019, PSE&G filed responses in opposition to the Market Participants’ and Sunrun’s motions, respectively. On February 5, 2019, Sunrun requested that the Board consider its motion for reconsideration as a motion for interlocutory review. On February 8, 2019, KEEA advised Staff that, as of that date, it was represented by an attorney licensed to practice in New Jersey. On February 27, 2019, the Board issued an Order granting KEEA’s motion to intervene and denying the motions of the Market Participants and Sunrun.21 On March 8, 2019, the Market Participants filed for reconsideration of the Board’s February 27, 2019 Order insofar as it denied the Market Participants’ motion for interlocutory review and affirmed the Prehearing Order, which denied the Market Participants’ motion to intervene and instead granted the Market Participants participant status. The Market Participants set forth several additional reasons and arguments for the Board to consider in support of their intervention. On March 18, 2019, PSE&G filed its opposition to the motion. On April 18, 2019, the Board authorized a Secretary’s Letter advising the parties that, pursuant to N.J.A.C. 14:1-8.7, the Board would take additional time to consider the motion. Following appropriate notice, six public hearings were held on the following dates in PSE&G’s service territory: two hearings on March 13, 2019 in New Brunswick, two hearings on March 18, 2019 in Mount Holly, and two hearings on March 21, 2019 in Hackensack. Numerous members of the public made statements at the aforementioned hearings. The majority expressed support for the filed CEF-EE Program, and two members of the public expressed concerns regarding the impact of the filing on the competitive energy efficiency market.
20 In re the Petition of Public Service Electric and Gas Company for Approval of its Clean Energy Future – Energy Efficiency (“CEF-EE”) Program on a Regulated Basis, BPU Docket Nos. GO18101112 and EO18101113, Order Dated January 22, 2019. 21 In re the Petition of Public Service Electric and Gas Company for Approval of its Clean Energy Future – Energy Efficiency (“CEF-EE”) Program on a Regulated Basis, BPU Docket Nos. GO18101112 and EO18101113, Order Dated February 27, 2019.

Agenda Date: 9/23/20 Agenda Item: 8B
7 BPU DOCKET NOS. GO18101112 and EO18101113
Rate Counsel, Staff, and the EELC served discovery questions, to which the Company responded. Discovery conferences were held on March 6 and March 14, 2019. With the CEF EE Petition, PSE&G filed the direct testimonies of Ms. Karen Reif, PSE&G Vice President, Renewables and Energy Solutions; Mr. Steven Swetz, PSE&G Senior Director, Corporate Rates and Revenue Requirements; and Daniel Hansen, PhD, Vice President, Christensen Associates Energy Consulting, LLC. PSE&G's Supplemental Filing on January 4, 2019 included the supplemental direct testimony of Ms. Reif. On March 22, 2019, pursuant to the schedule set forth in the Prehearing Order, Rate Counsel filed the direct testimonies of Mr. Dante Mugrace, Senior Consultant, PCMG and Associates; David E. Dismukes, PhD, Consulting Economist, Acadian Consulting Group, LLC; and Ezra Hausman, PhD, President, Ezra Hausman Consulting. The EELC filed the direct testimony of Ms. Amanda Levin. The parties participated in settlement conferences on March 25 and April 9, 2019. On April 15, 2019, PSE&G filed the rebuttal testimony of Ms. Reif, Mr. Swetz, and Dr. Hansen, as well as the rebuttal testimony of a new witness, Mr. Isaac Gabel-Frank. Rate Counsel filed the rebuttal testimony of Dr. Dismukes, and EELC filed the rebuttal testimony of Ms. Levin. Evidentiary hearings were held on May 1 and 2, 2019 at the Office of Administrative Law in Mercerville (Hamilton), New Jersey, before Commissioner Solomon. The parties introduced their respective pre-filed testimonies and exhibits, all discovery responses were moved into evidence, and, in accordance with the Prehearing Order, Rate Counsel witnesses Hausman, Mugrace, and Dismukes and EELC witness Levin presented oral sur-rebuttal testimony, and witnesses were cross-examined. The following parties and participants submitted initial briefs: PSE&G, Rate Counsel, NJLEUC, EELC, Enel X, ACE, the Market Participants, Google, Lime Energy, Signify, Sunrun, Tendril n/k/a Uplight, and Staff. The following parties and participants submitted reply briefs: PSE&G, Rate Counsel, EELC, Google, and Sunrun. The parties participated in additional settlement discussions on June 18 and July 15, 2019. On June 19, 2019, the parties entered into a stipulation to extend the review period to August 19, 2019 to allow more time for review of the proposed CEF-EE Program by the Board. On June 27, 2019, Commissioner Solomon issued an Order adopting the stipulation and extending the review period to August 19, 2019.22 On August 6, 2019, the parties entered into a stipulation to further extend the review period to allow more time for settlement discussions. On August 12, 2019, Commissioner Solomon issued an Order adopting the stipulation and extending the review period from August 19, 2019 to September 18, 2019.23
22 In re the Petition of Public Service Electric and Gas Company for Approval of its Clean Energy Future – Energy Efficiency (“CEF-EE”) Program on a Regulated Basis, BPU Docket Nos. GO18101112 and EO18101113, Order Dated June 27, 2019. 23 In re the Petition of Public Service Electric and Gas Company for Approval of its Clean Energy Future – Energy Efficiency (“CEF-EE”) Program on a Regulated Basis, BPU Docket Nos. GO18101112 and

Agenda Date: 9/23/20 Agenda Item: 8B
8 BPU DOCKET NOS. GO18101112 and EO18101113
By Order dated September 11, 2019, the Board approved a stipulation that authorized the extension of the 180-day period for Board action on the Company’s CEF-EE Program from September 18, 2019 until no later than March 16, 2020; approved the extension of the Company’s Multifamily Housing Sub-Program, Hospital Efficiency Sub-Program, Smart Thermostat Sub Program, and Residential Data Analytics Sub-Program through September 21, 2020; and reaffirmed the termination of the Company’s Direct Install Sub-Program by October 31, 2019.24 On September 13, 2019, Sunrun submitted a letter to the Board noting the multiple extensions of the 180-day timeline and asking the Board to relax or disregard the procedural rules and allow Sunrun to participate in any future settlement discussions, potential final resolutions, and additional interim agreements. By Order dated November 13, 2019, the Board found that the nature and extent of the Market Participants’ interest warranted intervener status and that their inclusion would add measurably and constructively to the record in this proceeding. The Board granted the Market Participants’ motion for reconsideration and reversed its previous ruling. Additionally, the Board reaffirmed its ruling in the February 27, 2019 Order as it related to Sunrun and denied Sunrun’s request dated September 13, 2019.25 By Order dated February 19, 2020, the Board approved a stipulation that authorized the extension of an additional 180-day period for Board action on the Company’s CEF-EE Program, until no later than September 30, 2020. The parties also agreed that PSE&G would further extend its EE 2017 Program through September 30, 2020.26 Following Board adoption of the EE transition framework on June 10, 2020, the parties participated in additional settlement conferences on June 25, July 14, July 16, July 28, July 31, August 14, August 19, August 25, August 28, and September 1, 2020. STIPULATION
On September 22, 2020, the Signatory Parties executed the Stipulation, the relevant terms of which are provided below:27 I. General Terms
1. The Signatory Parties (“Parties”) agree that, subject to Board approval of the Stipulation,
PSE&G may implement a modified CEF-EE Program (“Program”) under the terms and conditions described in the Stipulation. The Program will include implementation,
EO18101113, Order Dated August 12, 2019. 24 In re the Petition of Public Service Electric and Gas Company for Approval of its Clean Energy Future – Energy Efficiency (“CEF-EE”) Program on a Regulated Basis, BPU Docket Nos. GO18101112 and EO18101113, Order Dated September 11, 2019. 25 In re the Petition of Public Service Electric and Gas Company for Approval of its Clean Energy Future – Energy Efficiency (“CEF-EE”) Program on a Regulated Basis, BPU Docket Nos. GO18101112 and EO18101113, Order Dated November 13, 2019. 26 In re the Petition of Public Service Electric and Gas Company for Approval of its Clean Energy Future – Energy Efficiency (“CEF-EE”) Program on a Regulated Basis, BPU Docket Nos. GO18101112 and EO18101113, Order Dated February 19, 2020. 27 Although summarized in this Order, the detailed terms of the Stipulation are controlling, subject to the findings and conclusions of this Order. Paragraphs are numbered to coincide with the Stipulation.

Agenda Date: 9/23/20 Agenda Item: 8B
9 BPU DOCKET NOS. GO18101112 and EO18101113
administration and investment in 10 sub-programs, including four residential sub-programs, five commercial and industrial (“C&I”) sub-programs, and one multifamily sub-program.
2. The Parties agree that PSE&G should be permitted to implement the 10 sub-programs identified in Attachment 1, attached to the Stipulation, subject to the final consensus of the Joint Utility Working Group, as outlined in paragraph 50 of the Stipulation.
3. PSE&G will launch sub-programs in accordance with Attachment 1 of the Stipulation, and adjustments will be made in the implementation of these sub-programs to coordinate delivery and assure consistency of core sub-programs with other utility core sub-programs, as necessary. To coordinate sub-program offerings across the state, the utilities are engaged in a joint effort to contract with a single third-party entity to serve as a dual-fuel statewide coordinator.
4. Customers in PSE&G’s electric and/or gas service territory who meet the criteria for the respective CEF-EE sub-program offerings will be eligible to participate.
5. The CEF-EE Program budget is as follows:
Program
Component Description
Component
Budget
($M)
Implementation
Date
Res Efficient
Products
Rebates and on-bill repayment for HVAC, smart
thermostats, appliances, lighting, and other
equipment
140
Marketplace: 10/1/20
All other: 1/1/21
Res Existing
Homes
Rebates and on-bill repayment for energy audit,
direct install of efficient equipment, and broader
weatherization / appliance replacement services
55
1/1/21
Res Behavior Data analytics, home energy reports, and online
energy audits 25
1/1/2128
Res Multifamily Energy audit and direct install of efficient
equipment at no charge to tenants 9
1/1/21
Income Eligible
Energy audit, direct install of efficient
equipment, and broader weatherization /
appliance replacement services at no charge for
income-eligible customers and for properties
located within low and moderate-income census
tracts
55
1/1/21
28 Additional customers will be added to the Behavior Subprogram on January 1, 2021. EE 2017 will continue to serve existing customers through December 2020.

Agenda Date: 9/23/20 Agenda Item: 8B
10 BPU DOCKET NOS. GO18101112 and EO18101113
Program
Component Description
Component
Budget
($M)
Implementation
Date
C&I Prescriptive
Rebates and on-bill repayment for HVAC,
lighting, motors and drives, refrigeration, water
heaters, air compressors, and food service
equipment
210
1/1/21
C&I Custom Custom incentives for large energy efficiency
projects, including on-bill repayment 100
1/1/21
C&I Small Non-
Residential
Efficiency (a/k/a
Direct Install)
Rebates and on-bill repayment for direct-
installed EE measures to small non-residential
customers of lighting, controls, refrigeration,
heating and air conditioning updates, etc.
165
10/1/2029
C&I Energy
Management
Retro-commissioning and strategic energy
management: optimizing existing systems with
little to no equipment upgrades
6
1/1/21
C&I Engineered
Solutions
Whole-building engineered energy saving
solutions to hospitals, school districts,
universities, municipalities, apartment buildings,
other non-profit /public entities
205
10/1/2030
IT
Technology systems and services to ensure
PSE&G customers have easy access to energy
efficient products, incentives, and repayments
3331
N/A
Admin
Program administration; program management;
education and outreach; program design and
development; and IT run costs
Cap at 10%
of
investment
N/A
Investment Total 1,003
6. Based on market response, the Company may shift the timing of investment spending between Program Years (October 1 – September 30) in any sub-program as necessary to provide flexibility in responding to market conditions and customer demand and to ensure the achievement of Program targets during the term of the Program, in accordance with the procedure outlined in the Board’s June 10, 2020 Order (“Framework Order”).
29 The EE 2017 Direct Install Subprogram will continue for Urban Enterprise Zones, Government, and Nonprofits. Expansion of the program beyond that will begin no earlier than January 1, 2021. 30 The C&I Engineered Solutions Sub-program will continue for Hospitals and Multifamily. Expansion of the program beyond that will begin no earlier than January 1, 2021. 31 An expected breakdown of these IT costs is provided at Attachment 2.

Agenda Date: 9/23/20 Agenda Item: 8B
11 BPU DOCKET NOS. GO18101112 and EO18101113
7. During implementation, certain sub-programs may be more successful in the near term
and require additional budget in order to respond to the market need and to continue operations. Accordingly, the Parties agree that a process enabling the Company to make adjustments to sub-program budgets in response to real market conditions experienced is justified. The process, in accordance with the Framework Order, shall be as follows:
PSE&G can shift its sub-program budgets out of an individual sub-program within the Residential sector or within the C&I sector, up to 25% of the individual sub-program’s total budget with Staff notification (which should be provided within 30 days following the change), 25–50% with Staff approval, and over 50% with Board approval.
PSE&G can shift budgets out of the residential sector or the C&I sector up to 5% of individual utility sector budgets with Staff notification (which should be provided within 30 days following the change), 5–10% with Staff approval, and over 10% with Board approval. Such budgets may be added to any sub-program(s) within the sector to which it is being transferred without limitation when the budget shift does not exceed 5%.
All requests for budget adjustments shall be submitted to Staff and Rate Counsel. Staff retains the right to reject shifts requiring Staff notification. Requests for budget adjustments within the three-year Program filing necessitating Staff approval shall be submitted to Staff and Rate Counsel with a written description of and rationale for the proposed transfers, and shall be responded to within 30 days. Rate Counsel may object within 30 days, which will trigger Staff review within 30 days of Rate Counsel’s objection. If there is no response from Rate Counsel or Staff within 30 days of PSE&G’s request, those requests will be automatically granted.
8. Customer information shall be used by the Company to deliver an effective customer experience in compliance with any applicable BPU regulations and statutory obligations. The Company shall adopt privacy and data handling policies and procedures for CEF-EE that are consistent with PSE&G's customer data security protections, the Framework Order, and any applicable BPU regulations and statutory obligations. In the event of any breach of the above confidentiality by an affiliate, PSE&G shall remediate this breach to the full extent required by law. In the event of any breach of the above confidentiality by a vendor hired to deliver the CEF-EE or to evaluate the sub-programs, the Company commits to enforcing the contractual confidentiality requirement to the extent allowed by the law. Any “breach of security” with respect to customers’ “personal information,” as those terms are defined in N.J.S.A. 56:8-161, shall be treated in accordance with the New Jersey Identity Theft Prevention Act, N.J.S.A. 56:8-161 et seq., and Section 3b of the BPU’s Cybersecurity Order of March 18, 2016 in Docket No. AO16030196.
9. PSE&G agrees customer-specific data belongs to the customer, who may request or authorize PSE&G to share it with suppliers, and data gathered during the operation of these sub-programs not specific to any particular customer belongs to the Company and will be used solely to support current or future regulated utility programs. Such data may not be used for other purposes without Board approval. Any financial benefits derived from the data will be offset against the costs of the program. The Company will also submit non-customer-specific data to the Board in compliance with reporting requirements, as established by the Board.

Agenda Date: 9/23/20 Agenda Item: 8B
12 BPU DOCKET NOS. GO18101112 and EO18101113
10. PSE&G has used a competitive selection process to select current EE implementation
vendors under existing EE Programs described in the Stipulation. The Company commits to conducting a competitive solicitation process to select vendors for the second and third program years that meet currently applicable requirements in a manner that permits the Company to prudently implement the sub-programs. Alternatively, to the extent that contracts with existing vendors can be extended to increase speed to market or reduce costs for customers, the Company will pursue these options and make reasonable efforts to integrate all currently applicable competitive selection procurement protocols into those contracts, while continuing to follow all competitive selection procurement protocols for other services required.
11. Within 30 days of May 31, 2021, PSE&G will convene at least one non-confidential stakeholder collaborative meeting to discuss potential partnerships with market participants and other stakeholders, and to obtain input regarding the design and implementation of “non-core” programs, including but not limited to demand response and PDR programs, non-pipe and non-wire alternative programs, and building electrification/decarbonization programs. PSE&G agrees to consider in good faith the issues and suggestions raised in the meeting and to develop recommendations regarding a future filing on additional programs identified in the meeting.
12. Within 120 days of Board approval of the Stipulation, PSE&G will convene at least one stakeholder collaborative meeting to discuss competitive issues in the provision of EE, including but not limited to the implementation of supplier consolidated billing.
13. Incentive structures are described in Attachment 1 of the Stipulation, and measure level details are included in Appendix A of Attachment 1 of the Stipulation, subject to modification consistent with the Framework Order and in cooperation with the BPU’s Utility Working Group and the Utilities’ Program Working Groups. The Company commits to complying with all Board Orders regarding the programs and program details it is required to offer.
II. Program Term
14. Implementation of the CEF-EE Program will commence on October 1, 2020 and will continue over the course of the next three years until September 30, 2023.
15. CEF-EE core programs that are continuations of the EE 2017 sub-programs PSE&G currently operates (Efficient Products Marketplace component32 and Direct Install33) shall commence on October 1, 2020. CEF-EE core programs that PSE&G does not currently operate shall commence no earlier than January 1, 2021. Non-core sub-programs, including those sub-programs that are continuations of existing EE 2017 sub-programs, will commence on October 1, 2020. The EE 2017 Hospital and Multi-Family sub-programs will continue as components of the Engineered Solutions sub-program, with new elements of the Engineered Solutions sub-program commencing no earlier than January 1, 2021. The EE 2017 Data Analytics sub-program will continue as the Behavioral sub-program.
32 Efficient Products – Marketplace will be expanded to offer several on-line products on October 1, 2020. 33 See footnote 8.

Agenda Date: 9/23/20 Agenda Item: 8B
13 BPU DOCKET NOS. GO18101112 and EO18101113
PSE&G will continue to coordinate regarding transition of programs (including program delivery, program data, and marketing) with the current New Jersey Clean Energy Program administrator and other utilities with whom the Company has overlapping service territories. To the extent that the utilities jointly decide to implement programs differently than currently envisioned, the Company commits to implement, as permissible under law, consistent elements of the core programs concurrently with all electric and gas utilities in the state. This consistency will include the following elements:
Common forms for use by customers and contractors;
Contractor requirements, open and competitive procurement protocols where feasible, and training; procurement protocols should include policies and practices (e.g., scoring systems) developed in collaboration with the Equity Working Group and Workforce Development Working Group that encourage supplier diversity (including contractors and subcontractors) and contractor coaching/mentoring of diverse business enterprises;
Customer and property eligibility requirements and processes, including alternative/automatic eligibility methods for low- to moderate-income customers (e.g., based on census tracts, environmental justice communities, Urban Enterprise Zones, etc.);
Eligible measures;
Incentive ranges;
Incentive payment processes and timeframes;
Customer and contractor engagement platforms;
Data platforms and database sharing among program administrators, where appropriate; and
Quality control standards and remediation policies.
16. The Company will file a subsequent multiyear program extension for Board approval by September 30, 2022 with a commencement date of October 1, 2023 to allow for efficient continuation of the CEF-EE Program and align the program term with the subsequent State-wide July-June program cycle.
III. CEF-EE Program Expenditures
17. The Parties agree that the total investment for the CEF-EE Program is $1.003 billion, which includes all capital expenditures (including IT), rebates and incentives, including financing costs and audit/installation labor, and outside services for third party sub-program implementation and EM&V. The budget for investment includes amounts that are spent during the three-year program cycle (October 1, 2020 – September 30, 2023) as well as amounts reserved to fund projects/incentives for customers who have enrolled in sub-programs during that three-year period, as defined in Appendix B of Attachment 1 of the Stipulation.
18. The agreed upon $1.003 billion investment amount does not include Company administrative costs, which will be capped at $100.3 million. Company administrative costs include PSE&G administrative, labor, IT run costs, and portfolio-level costs, such as program development and jobs initiatives for the three-year program cycle. The Company will recover its actual reasonable and prudently incurred administrative costs up to the $100.3 million cap through annual GPRC cost recovery filings. Staff and Rate Counsel

Agenda Date: 9/23/20 Agenda Item: 8B
14 BPU DOCKET NOS. GO18101112 and EO18101113
reserve their rights to challenge the prudency of all costs, including administrative costs, in future GPRC filings.
19. The Joint Utility Program Working Group is developing requirements for coordination of services to customers, including the sharing of costs and the allocation of savings. The investments and administrative costs do not include expenditures required for coordination with other utilities, including the Statewide Program Coordinator System. The Parties agree that any additional costs for such coordination efforts that go beyond the scope of the Program, and that are deemed prudently incurred after appropriate review, will be recoverable.
20. All Program expenditures will be filed with the Board and submitted for prudency review in annual cost recovery filings over the term of the Program by way of PSE&G’s annual GPRC proceedings.
IV. Cost Benefit Analysis / Reporting
21. The Company submitted calculations as to the cost-effectiveness of each of the proposed sub-programs under five (5) different cost-benefit tests: the Participant Cost Test (“PCT”), the Program Administrator Cost (“PAC”) Test, the Ratepayer Impact Measure (“RIM”) Test, the Total Resource Cost (“TRC”) Test, and the Societal Cost Test (“SCT”). Included in Attachment 3 to the Stipulation are summaries of the results of (1) the Company’s Benefit Cost Analysis, including the New Jersey Cost Test (“NJCT”), (2) its Costs-to-Achieve Savings Analyses, and (3) its analysis of electric and gas QPI values in Program Years 1-3. On or before September 25, 2020, the Company will provide detailed supporting calculations and workpapers that are fully compliant with the MFRs established in the Framework Order. With regard to the QPIs, the Company will provide a description of how the proposed portfolio achieves the targets established for the Company, as required by MFR Section VII.
22. QPI performance periods will be those set forth in the Framework Order. In addition to
CEF-EE projects and measures completed after July 1, 2021, EE 2017 projects and measures completed after July 1, 2021 shall be included in QPI measurement. Quarterly, annual, and triennial reports will be consistent with the requirements of the Framework Order, the details of which will be developed by the BPU’s Utility Working Group.
23. The Company will perform EM&V for the CEF-EE Program in accordance with the Framework Order. All EE 2017 projects and measures completed after July 1, 2021 shall also be included in the CEF-EE EM&V plan.
V. Capital Structure/Return on Equity
24. PSE&G will earn a return on its net investment based upon the authorized return on equity (“ROE”) and capital structure approved by the Board in its last base rate proceeding.
25. PSE&G’s weighted average cost of capital (“WACC”) for its CEF-EE Program investments will be set based on the WACC established in the Company’s 2018 base rate case, which is 6.99%, or 9.02% on a pre-tax basis based on a common equity percentage of 54%, an ROE of 9.60%, and current tax rates. Attachment 4, Schedule SS-CEF-EE-1 of the Stipulation shows the calculation of the WACC for the CEF-EE Program.

Agenda Date: 9/23/20 Agenda Item: 8B
15 BPU DOCKET NOS. GO18101112 and EO18101113
26. The Parties agree that any change in the WACC authorized by the Board in a subsequent base rate case will be reflected in the appropriate corresponding subsequent monthly revenue requirement calculations. The Signatory Parties further agree that any change in the revenue requirement resulting from the change in the WACC will not be included in the monthly interest calculation for over and under recoveries until the date of the next scheduled annual true-up but, in any event, no later than January 1 of the subsequent year. Any changes to current tax rates would be reflected in an adjustment to the pre-tax WACC and in any corresponding revenue requirement calculations.
VI. Cost Recovery
27. Cost recovery for the Program will be made and tracked via a new CEF-EEC component of the Company’s electric and gas GPRC, which will be filed annually after the proposed initial period. PSE&G has submitted proposed tariff sheets (both red-lined and clean) as Attachment 5 of the Stipulation to reflect the updated GPRC tariff.
28. The Parties agree that, in light of the impacts of the current COVID-19 pandemic, the initial electric and gas CEF-EECs will be set at zero as of the date of the BPU Order in this proceeding. The Parties further agree that the CEF-EECs will be included in an update to the Company’s pending 2020 GPRC Cost Recovery filing in Docket Nos. ER20060467 & GR20060468, and an initial rate can be set for each component in the settlement of that proceeding. In any event, the initial CEF-EECs will not be increased before January 1, 2021.
29. The electric and gas CEF-EECs will be subject to adjustment and true-up through the deferral process, and any required adjustment will be included in the over/under recovered balance to be recovered from or returned to customers over the following year. Any Board ordered cost recovery adjustments resulting from the review of the actual costs will be made to the over/under deferred balance and reflected in the charges established for the following year pursuant to a final Board Order.
30. The calculation methodology of revenue requirements and the over/under deferred balance is detailed in Attachment 4 of the Stipulation. The Parties agree the Company will modify the revenue requirement calculation if needed to coordinate sharing of investment with partner utilities in shared service territories as a result of the Board’s review and approval of the other utilities cost recovery methodology.
31. Revenues received under the CEF-EE Program, such as PJM Capacity Revenues, marketplace revenues negotiated with vendors, or any other source of revenues as a result of the implementation of the CEF-EE Program, as well as financial benefits from the usage of data as provided in paragraph 9 of the Stipulation, will be utilized to offset revenue requirements to customers.
32. The Company shall offer eligible EE into the PJM capacity market, consistent with the approach agreed upon by the BPU’s Joint Utility Working Group, subject to the requirements of PJM. The Company will credit CEF-EE revenue requirements with any PJM capacity market revenues.
33. The Parties agree to amortize the CEF-EE investments, excluding IT, over a 10-year period. Investment other than financing costs will be expensed when incurred for tax purposes and flowed back to customers as shown in Attachment 4 of the Stipulation. IT

Agenda Date: 9/23/20 Agenda Item: 8B
16 BPU DOCKET NOS. GO18101112 and EO18101113
investments will be amortized in accordance with PSE&G’s accounting policy and generally accepted accounting principles, which is forecasted to be a five-year book amortization period and three-year straight-line period for tax purposes. IT tax deductions will also be flowed back to customers, as shown in Attachment 4 of the Stipulation.
34. The Parties stipulate that the Company will file to adjust its electric and gas CEF-EECs, as part of the true-up petition (“True-Up Filing”) for the GPRC, with copies provided to the Parties no later than July 1, 2021 and annually thereafter for the implementation of the proposed revised CEF-EECs on October 1 of each year. The True-Up Filing will provide information as required by the MFRs. Each True-Up Filing will contain a reconciliation of its projected CEF-EECs costs and recoveries and actual revenue requirements for the prior period, and a forecast of revenue requirements for the estimated time period before Board approval (October 1) and the 12-month period thereafter, which shall be based upon the Company’s most current authorized ROE and capital structure as defined in the Stipulation. The True-Up Filing also will present actual costs incurred since the previous annual review, and those costs will then be reviewed for reasonableness and prudency.
35. The Parties agree that any over/under recovery of the actual revenue requirements compared to revenues will be deferred. In calculating the monthly interest on net over and under recoveries, the interest rate shall be based upon the Company’s interest rate obtained on its commercial paper and/or bank credit lines utilized in the preceding month. If both commercial paper and bank credit lines have been utilized, the weighted average of both sources of capital shall be used. In the event that neither commercial paper nor bank credit lines were utilized in the preceding month, the prior months interest rate calculation will be used. The interest rate shall not exceed PSE&G’s overall rate of return, as authorized by the Board, in calculating revenue requirements for the corresponding period. The interest amount charged to the CEF-EE Program electric and gas deferred balances will be computed using the methodology set forth in Attachment 4, Schedule SS-CEF-EE-6E and SS-CEF-EE-6G, respectively of the Stipulation. The calculation of monthly interest shall be net of tax based on the average monthly balance, consistent with the methodology set forth in Attachment 4, Schedules SS-CEF-EE-6E and SS-CEF-EE-6G of the Stipulation for the CEF-EE Program. Simple interest shall accrue on any over and under recovered balances and shall be included in the deferred balances at the end of each reconciliation period. Near the end of the initial and each subsequent recovery period, the corresponding electric and gas deferred balances will be included with forecasted revenue requirements for the succeeding period for the purpose of setting the revised electric and gas CEF-EECs.
36. The True-Up Filing will be subject to review by the Parties with opportunity for discovery
and evidentiary hearings (if necessary) prior to the issuance of a Board Order establishing the Company’s revised CEF-EECs. The issuance of a written Board Order will be preceded by adequate public notice and public hearings including evidentiary hearings, if necessary.
VII. Conservation Incentive Program (“CIP”)
37. Given the volumetric rate structure to recover fixed costs and the potential for decline in revenue associated with the implementation of energy efficiency, the Parties agree—as consistent with the CEA—to account for lost sales revenue resulting from the decrease in customer energy usage.

Agenda Date: 9/23/20 Agenda Item: 8B
17 BPU DOCKET NOS. GO18101112 and EO18101113
Shareholder Contribution
38. The recovery of lost revenues due to programs like the CEF-EE will be made via a CIP based on the methodology outlined below and detailed in the schedules for gas and electric, as noted in Attachments 6G and 6E of the Stipulation, respectively. In addition, PSE&G agrees to implement initiatives to further customer conservation efforts, providing a funding amount (“shareholder contribution”) of $3.3 million per year as long as the CIP remains in place, commencing with the start of the CIP deferrals, as defined below. All shareholder contribution expenditures will be allocated 55% to electric distribution (or approximately $1.8 million) and 45% to gas distribution (or approximately $1.5 million). Any under- spend in a year will be factored into the following year’s spending amount. The shareholder contribution will not be included in customer rates. The shareholder contribution will support initiatives designed to aid customers in reducing their costs of natural gas and electricity and to reduce each utility’s peak demand. The initiatives may include efforts such as education and outreach, as well as enhancements to standard incentives to further encourage customer engagement in the CEF-EE Program (e.g., the distribution of free EE kits within low- and moderate-income census tracts), grants to schools and community organizations, and a business EE portal.
Community Education and Outreach: This category covers community outreach activities, such as presentations, lunch and learns, outreach tables, trade shows, business conferences, and green fairs. It may also include grants or initiatives with community organizations. Particular emphasis will be placed on low- and moderate-income communities.
Municipal and NGO (non-governmental organization) Outreach: This category includes activities to work with municipalities and other organizations and may include funding for special studies or projects and partnerships to promote EE.
Customer Engagement: This category includes activities to increase customer awareness and engagement in programs, including enhanced incentives for promotional purposes, such as the offering of a flash sale. Particular emphasis will be placed on low- and moderate-income customers. A business engagement portal may be explored to evaluate the potential to provide customized information to this diverse customer segment.
Energy Efficient Economy: This category supports efforts to engage and develop a diverse supplier and workforce base to support the delivery of EE services.
Filing/Tariff Details
39. The Parties agree that, in light of the COVID-19 pandemic, the Company will submit its first electric CIP cost recovery filing by February 1, 2022, for new rates effective June 1, 2022, based on an initial deferral period of June 1, 2021 through May 31, 2022. The Parties further agree that the Company will submit its first gas CIP cost recovery filing by June 1, 2022, for new rates effective October 1, 2022, based on an initial deferral period of October 1, 2021 through September 30, 2022. The electric and gas CIPs will be adjusted annually thereafter. The Company will not book any CIP deferral prior to June 1, 2021 for electric and October 1, 2021 for gas. The filings will document actual results,

Agenda Date: 9/23/20 Agenda Item: 8B
18 BPU DOCKET NOS. GO18101112 and EO18101113
perform the required CIP collection tests described in more detail below, and propose the new CIP rate. Any variances from the annual filings will be trued-up in the subsequent year.
40. Attachment 5 to the Stipulation contains the electric and gas CIP tariffs. The CIP tariffs will reflect an initial rate of $0.00000 for both electric and gas.
41. The terms of the existing Weather Normalization Charge (“WNC”) will be suspended as of October 1, 2021 at the time that the Gas CIP deferral begins. The 2021 Gas WNC cost recovery filing for the 2020-2021 Winter period can be implemented for new rates effective October 1, 2021, with any remaining over or under-collection included in the Company’s first gas CIP tariff to be submitted by June 1, 2022. CIP Methodology
42. The monthly CIP deferrals will be calculated as reflected in Attachments 5 and 6E/G to
the Stipulation. For the gas CIP, the baseline usage per customer by applicable rate schedule is shown in Attachments 5 and 6G of the Stipulation and is based on the billing determinants approved in the Company’s 2018 base rate case. The baseline usage per customer will be adjusted with each subsequent base rate case. The margin rate utilized in the calculation of the gas deferral is based on the current variable margin rate for each rate schedule and will be updated for any Infrastructure Investment Program (“IIP”) rate adjustments or future base rate changes. For the electric CIP, the baseline revenue per customer by applicable rate schedule is shown in Attachments 5 and 6E of the Stipulation and is based on the billing determinants from the 2018 base rate case and the latest variable margin rates per rate schedule, including any IIP rate adjustments. The baseline usage and margin rates will be updated with each subsequent base rate case or IIP rate adjustment.
43. For purposes of determining recovery eligibility for CIP accruals, the margin impact of changes in customer usage will be segregated into weather-related and non-weather-related components. The non-weather-related components will be limited by eligibility tests described in more detail below. The weather-related component will not be subject to those limitations.
44. The non-weather component will be calculated by first deducting the weather component. For gas, the weather impact will be calculated in the same manner as calculated for the Company’s existing WNC. For electric, the weather impact will be calculated in a manner consistent with the methodology used for gas. PSE&G will establish sales coefficients based on 20 years of weather history of sales for residential customers only. The weather will be measured by the impacts on sales and associated distribution revenue of heating degree days (“HDD”) for winter weather and the temperature humidity index (“THI”) for summer weather. The average of the 20 years of data for HDD and THI will be considered normal. The difference in actual and normal HDD and THI will be multiplied by the sales coefficients to establish sales impacts. The sales impacts will be multiplied by the current tariff rates to derive the revenue impact. The weather normalization methodology is detailed in Schedule 4 of Attachments 6E and 6G of the Stipulation for electric and gas, respectively.

Agenda Date: 9/23/20 Agenda Item: 8B
19 BPU DOCKET NOS. GO18101112 and EO18101113
45. The Parties agree that recovery of non-weather related gas CIP impacts shall be subject
to the application of two eligibility tests: a Modified BGSS Savings Test and a Variable Margin Test. The Parties further agree that recovery of non-weather related electric CIP impacts shall be subject to the application of two eligibility tests: a BGS Savings Test and a Variable Margin Test. In order to be eligible for recovery, non-weather related CIP impacts must pass both cost recovery tests. A description of the eligibility tests is provided below.
a. Modified BGSS Savings Test (Gas only) – The Parties agree that reductions in
customer usage provide opportunities to reduce peak demand and lower commodity costs. As a result, recovery through the gas CIP Tariff will be limited to BGSS Savings calculated under the following methodology. Consistent with the existing Modified BGSS Savings Test utilized by New Jersey Natural Gas Company and South Jersey Gas Company, the margin impact shall be multiplied by a factor of 75% prior to application of the BGSS Savings test. Further, the Parties agree to recognize three categories of savings when calculating the total savings used in the Modified BGSS Savings Test.
i. Category One includes the Company's permanent savings realized from its permanent capacity releases or contract terminations on an ongoing basis. The permanent capacity releases and contract terminations are $45.395 million, as detailed by contract in Schedule 5 of Attachment 6G of the Stipulation. These amounts will remain constant after the re-setting of the CIP benchmarks in future base rate cases.
ii. Category Two includes BGSS gas cost savings from reductions of capacity on a long-term basis, i.e., for periods of at least one year. This category of savings will include, but not be limited to: 1) additional contract terminations not included in Attachment 6G, Schedule 5 of the Stipulation; 2) release of capacity to an affiliate or non-affiliate; 3) contract restructuring; and 4) reductions in the commodity cost of gas supply effectuated through purchasing strategies.
iii. Category Three is the Company's savings associated with avoided capacity costs to meet residential customer growth on a prospective basis, beginning with the first annual CIP filing following implementation of these terms. Avoided capacity costs shall be calculated on a monthly basis and are equal to the net change in residential customers for CIP multiplied by the corresponding Benchmark Use per Customer and by the average fixed capacity cost reflected in the Company’s concurrent BGSS filing. Schedule 5 of Attachment 6G to the Stipulation illustrates the savings calculation.
iv. Additional BGSS savings pursuant to subparagraphs 44(a)(ii) and (iii) above will only be counted within the Modified BGSS Savings Test after agreement is reached with Rate Counsel and Board Staff about BGSS savings transactions.
b. BGS Savings Test (Electric only) – The Parties agree that reductions in customer usage provide opportunities to reduce peak demand and lower commodity costs. As a result, recovery through the electric CIP Tariff will be limited to BGS Savings calculated under the following methodology. Consistent with the Modified BGSS Savings Test described above for gas, the margin impact shall be multiplied by a factor of 75% prior to application of the BGS Savings test. Further,
Agenda Date: 9/23/20 Agenda Item: 8B
20 BPU DOCKET NOS. GO18101112 and EO18101113
the Parties agree to recognize three categories of savings when calculating the total savings used in the BGS Savings Test.
i. Category One includes the Company's permanent savings realized from the reduction in PJM Final Zonal Unforced Capacity (“UCAP”) Obligation from the 2011/2012 energy year compared to the 2020/2021 energy year multiplied by the 2020/2021 PS Zonal Net Load Price. The permanent BGS savings are $64.506 million, as shown in Schedule 5 of Attachment 6E of the Stipulation. These amounts will remain after the re-setting of the CIP benchmarks in future base rate cases.
ii. Category Two includes BGS cost savings from ongoing reductions of the Company’s PJM Final Zonal UCAP Obligation. This category of savings will be calculated as any annual incremental UCAP Obligation savings after the 2020/2021 energy year. Any annual incremental UCAP Obligation savings will be multiplied by the most recent PS Zonal Net Load Price. Due to the potential for Peak increases due to electric vehicles and electrification, savings are set as a minimum of the incremental obligation savings or zero.
iii. Category Three is the Company's savings associated with avoided capacity costs to meet customer growth on a prospective basis beginning with the first annual CIP filing following implementation of these terms. Avoided capacity costs shall be calculated on a monthly basis and are equal to the net change in customers for CIP multiplied by the corresponding obligation per customer and the current PS Zonal Net Load Price per month. Schedule 5 of Attachment 6E to the Stipulation illustrates the savings calculation.
iv. Additional savings pursuant to subparagraphs 44(b)(ii) and (iii) of the Stipulation will only be counted within the BGS Savings Test after agreement is reached with Rate Counsel and Board Staff.
c. Variable Margin Test (Electric and Gas) – The Parties further agree to adopt an
additional recovery limitation to non-weather-related CIP margins equal to 6.5% of variable margins for the CIP accrual year. However, for the first annual deferral period only (June 1, 2021 through May 31, 2022 for Electric and October 1, 2021 through September 30, 2022 for Gas), the Parties agree to a recovery and refund limitation to non-weather-related CIP margins equal to 4.0 percent of variable margins. Specifically, variable margins for the gas CIP will be calculated based upon: (i) the number of customers, (ii) the applicable baseline use per customer ("BUC"), and (iii) the associated margin per therm. The margin revenues for each month for each gas CIP Group shall equal the actual number of customers multiplied by the BUC and multiplied by the margin revenue factor. For the electric CIP, variable margins will be calculated based on: (i) the number of customers and (ii) the baseline revenue per customer. The margin revenues for each month for each electric CIP Group shall equal the actual number of customers multiplied by the baseline revenue per customer. The resulting monthly values for both electric and gas shall be summed for all 12 months for all CIP Groups in order to yield the total Variable Margins for the year. Recoverable non-weather CIP amounts shall not exceed 6.5% (or 4.0% in the first year as defined above for electric and gas) of the aggregate variable margin revenues under this test.

Agenda Date: 9/23/20 Agenda Item: 8B
21 BPU DOCKET NOS. GO18101112 and EO18101113
46. The dual cost recovery tests set forth in the Stipulation shall operate in conjunction with
each other in such a manner so that the total non-weather recoverable amount is limited to the smaller of the two (2) recoverable amounts allowed under the separate Modified BGSS Savings Test and the Variable Margin Revenue Test for Gas and BGS Savings Test and Variable Margin Revenue Test for Electric. The Parties agree that any amounts that exceed the Modified BGSS Savings Test/BGS Savings Test and/or Variable Margin Revenue recovery limitations may be deferred for future recovery subject to the earnings test described below. The Company agrees to not seek recovery of interest on any deferred carry-forward amount.
47. Earnings Test – The Parties agree to include an earnings test, through which actual ROE shall be determined based on the actual net income of the utility for the most recent 12-month period divided by the average of the beginning and ending common equity balances for the corresponding period. The timing of the earnings test and definitions of Net Income and Common Equity are specified in the Electric and Gas CIP Tariffs provided in Attachment 5 of the Stipulation. The earnings test will be applicable to the total CIP deferral, including both weather and non-weather components. If the calculated ROE exceeds the allowed ROE from the utility's last base rate case by 50 basis points or more, recovery of lost revenues through the CIP shall not be allowed for the applicable filing period and shall not be carried over to subsequent filing periods.
VIII. Rate and Bill Impacts
48. Electric and gas customers will see no change in their current bill as a result of the Stipulation. Attachment 4, Schedules SS-CEF-EE-4E and SS-CEF-EE-4G of the Stipulation, provides the bill impacts to a typical residential electric and gas customer, respectively, over the life of the CEF-EE Program.
49. The Stipulation represents a mutual balancing of interests, contains interdependent
provisions, and, therefore, is intended to be accepted and approved in its entirety. In the event that any particular aspect of the Stipulation is not accepted and approved in its entirety by the Board, any Party aggrieved thereby shall not be bound to proceed with the Stipulation and shall have the right to litigate all issues addressed herein to a conclusion. More particularly, in the event that the Stipulation is not adopted in its entirety by the Board, in any applicable Order, then any Party hereto is free to pursue its then available legal remedies with respect to all issues addressed in the Stipulation as though the Stipulation had not been signed.
50. To the extent that any particular aspect of the Stipulation concerning establishment of core
sub-programs and coordinated elements (such as incentives, marketplace, marketing, workforce development, and contractor procurement), or sub-program structure in overlapping territories are not consistent with the final consensus reached by the Joint Utility Working Group, the Parties agree that the conflicting aspects of the Stipulation shall be revised accordingly.

Agenda Date: 9/23/20 Agenda Item: 8B
22 BPU DOCKET NOS. GO18101112 and EO18101113
DISCUSSION AND FINDINGS
As noted in previous orders, in the months leading up to the date of this filing in October 2018, two significant policy shifts occurred. In May 2018, Governor Murphy ordered the Board and several executive branch agencies to work on an EMP that would chart a path for New Jersey to convert its energy production profile to 100% clean energy sources by January 1, 2050. The draft EMP was released in June 2019, and the final EMP was released in January 2020. Also in May 2018, Governor Murphy signed into law the CEA, which set forth ambitious goals to advance energy efficiency in the state. In the two years following passage of the CEA, the Board, Staff, Rate Counsel, utilities, and a broad range of stakeholders worked diligently and collaboratively to review and consider options and best practices on a myriad of topics related to EE. The subject matter included details of program design and administration; application of utility targets; filing requirements; cost recovery mechanisms; performance incentives and penalties; evaluation, measurement, and verification; tracking and reporting requirements; a triennial review process; and ongoing stakeholder working groups. This work culminated in the adoption on June 10, 2020 of a comprehensive framework for the next generation of EE and PDR programs to be developed and implemented in New Jersey by electric and gas public utilities and the State pursuant to the CEA.
Having carefully reviewed the record in this matter, including the petition, testimony, and Stipulation, the Board HEREBY FINDS the Stipulation to be reasonable, in the public interest, and in accordance with the law. The Board FINDS that the Stipulation will benefit New Jersey’s
residents, energy users, and ratepayers and is consistent with the goals of the CEA and the EMP, as well as the requirements of the Board’s June 10, 2020 Order. The Board FURTHER FINDS
that the Stipulation will bolster New Jersey’s clean energy workforce and will greatly improve the ability of low- and moderate-income customers to take advantage of EE programs, initiatives, and opportunities. Accordingly, the Board HEREBY APPROVES the attached Stipulation in its entirety and HEREBY INCORPORATES its terms and conditions as though fully stated herein.
Accordingly, the Board HEREBY AUTHORIZES PSE&G to implement a new component of its
electric and gas GPRC to recover the costs associated with the CEF EE Programs (“CEF-EEC”). The initial CEF-EEC rates will be set to zero. The CEF-EECs will be included in an update to the Company’s pending 2020 GRPC Cost Recovery filing in Docket Nos. ER20060467 and GR20060468, through which the initial rate will be established. As a result of the Stipulation, PSE&G’s typical residential electric and gas customers will not experience any immediate changes to their current monthly bills. The Board also HEREBY AUTHORIZES PSE&G to implement its electric and gas CIPs, as forth in the Stipulation and related attachments, to account for lost revenue resulting from the potential decrease in customer energy usage. The Board HEREBY ORDERS the Company to file the appropriate revised tariff sheets
conforming to the terms of this Order by October 1, 2020. The Company’s costs will remain subject to audit by the Board. This Decision and Order shall not preclude nor prohibit the Board from taking any actions determined to be appropriate as a result of any such audit.

Agenda Date: 9/23/20 Agenda Item: 8B
23 BPU DOCKET NOS. GO18101112 and EO18101113
The effective date of this Order is September 30, 2020. DATED: September 23, 2020 BOARD OF PUBLIC UTILITIES
BY:
_________________________ JOSEPH L. FIORDALISO PRESIDENT
________________________ _________________________ MARY-ANNA HOLDEN DIANNE SOLOMON COMMISSIONER COMMISSIONER _________________________ _________________________ UPENDRA J. CHIVUKULA ROBERT M. GORDON COMMISSIONER COMMISSIONER ATTEST: ___________________________
AIDA CAMACHO-WELCH SECRETARY

Agenda Date: 9/23/20 Agenda Item: 8B
24 BPU DOCKET NOS. GO18101112 and EO18101113
In the Matter of the Petition of Public Service Electric and Gas Company for Approval of its Clean Energy Future – Energy Efficiency (“CEF-EE”) Program on a Regulated Basis
BPU Docket Nos. GO18101112 and EO18101113
SERVICE LIST
Public Service Electric and Gas Company
PSEG Services Corporation 80 Park Plaza, T5 P.O. Box 570 Newark, NJ 07102 Matthew M. Weissman, Esq. General State Regulatory Counsel [email protected] Joseph F. Accardo, Jr., Esq. Vice President – Regulatory and Deputy General Counsel [email protected] Danielle Lopez, Esq. [email protected] Karen Reif [email protected] Tim Fagan [email protected] Todd Van Aken [email protected] Michele Falcao Regulatory Filings Supervisor [email protected] Caitlyn White Regulatory Case Coordinator [email protected] James C. Meyer Riker Danzig Scherer Hyland and Perretti LLP Headquarters Plaza One Speedwell Avenue Morristown, NJ 07962-1981 [email protected]
New Jersey Board of Public Utilities
Board of Public Utilities 44 South Clinton Avenue, 9th Floor Post Office Box 350 Trenton, NJ 08625-0350 Aida Camacho-Welch Secretary of the Board [email protected] Paul Flanagan, Esq. Executive Director [email protected] Bob Brabston, Esq. Deputy Executive Director [email protected] Ben Witherell, Chief Economist [email protected] Division of Clean Energy Kelly Mooij, Director [email protected] Stacy Ho Richardson, Deputy Director [email protected] Sherri Jones, Assistant Director [email protected] Mahogany A. Hall, Program Specialist 2 [email protected] Benjamin Goldstein, Program Specialist [email protected] Chris Colacello, Analyst I [email protected]

Agenda Date: 9/23/20 Agenda Item: 8B
25 BPU DOCKET NOS. GO18101112 and EO18101113
Eastern Environmental Law Center
Daniel Greenhouse, Esq. William Bittinger, Esq. Eastern Environmental Law Center 50 Park Place, Suite 1025 Newark, NJ 07102 [email protected] [email protected] New Jersey Division of Rate Counsel
Post Office Box 003 Trenton, NJ 08625-0003
Stefanie A. Brand, Esq., Director [email protected] Brian O. Lipman, Esq., Litigation Manager [email protected] Felicia Thomas-Friel, Esq. Managing Attorney – Gas [email protected] Kurt Lewandowski, Esq. Assistant Deputy Rate Counsel [email protected] Sarah H. Steindel, Esq. Assistant Deputy Rate Counsel [email protected] Maura Caroselli, Esq. Assistant Deputy Rate Counsel [email protected] Shelly Massey [email protected] New Jersey Natural Gas Company Andrew K. Dembia, Esq. Regulatory Affairs Counsel 1415 Wyckoff Road P.O. Box 1464 Wall, NJ 07719 [email protected]
Division of Energy
Stacy Peterson, Director [email protected] Paul Lupo, Bureau Chief [email protected] Bart Kilar [email protected] Counsel’s Office Carol Artale, Esq. Deputy Chief Counsel [email protected] Rachel Boylan, Esq. [email protected] Lanhi Saldana, Esq. [email protected] Charles Gurkas, Paralegal [email protected] New Jersey Division of Law Department of Law and Public Safety Division of Law R.J. Hughes Justice Complex, 7th Fl. West 25 Market Street P.O. Box 112 Trenton, NJ 08625-0112 David Apy, Assistant Attorney General [email protected] Daren Eppley, Section Chief, DAG [email protected] Pamela Owen, Assistant Section Chief, DAG [email protected] Michael Beck, DAG [email protected] Matko Ilic, DAG [email protected]

Agenda Date: 9/23/20 Agenda Item: 8B
26 BPU DOCKET NOS. GO18101112 and EO18101113
Rockland Electric Company
4 Irving Place, Suite 1815-S New York, NY 10003 Margaret Comes, Esq. Associate Counsel [email protected] Jack Carley, Esq. Assistant General Counsel Consolidated Edison Company of New York, Inc. [email protected] James C. Meyer Riker Danzig Scherer Hyland and Perretti LLP Headquarters Plaza One Speedwell Avenue Morristown, NJ 07962-1981 [email protected] Lime Energy Company Lloyd Kass Senior Vice President, Utility Strategy 4 Gateway Center, 4th Floor 100 Mulberry Street Newark, NJ 07102 [email protected] Nathan Howe, Esq. McCarter and English, LLP 100 Mulberry Street Four Gateway Center Newark, NJ 07102 [email protected] MaGrann Associates
Ben Adams 701 East Gate Drive, Suite 100 Mount Laurel, NJ 08054 [email protected]
Terel Klein, DAG [email protected] Rate Counsel Consultants
David E. Dismukes, Ph.D. Consulting Economist Acadian Consulting Group 5800 One Perkins Place Drive, Suite 5-F Baton Rouge, LA 70808 [email protected] Dante Mugrace, Senior Consultant c/o Karl Richard Pavlovic PCMG and Associates, LLC 22 Brookes Avenue Gaithersburg, MD 20877 [email protected] Ezra Hausman, Ph.D., President Ezra Hausman Consulting 77 Kaposia St. Auburndale, MA 02466 [email protected] Atlantic City Electric Company
Philip J. Passanante, Esq. Assistant General Counsel Mailstop 92DC42 500 N. Wakefield Drive Newark, DE19702 [email protected] Jersey Central Power and Light Company
Joshua R. Eckert, Esq., Counsel 300 Madison Avenue Morristown, NJ 07962-1911 [email protected] Lauren M. Lepkoski, Esq. FirstEnergy Service Company Legal Department 2800 Pottsville Pike Reading, PA 19712-6001 [email protected]

Agenda Date: 9/23/20 Agenda Item: 8B
27 BPU DOCKET NOS. GO18101112 and EO18101113
Market Participants
Christopher Torkelson, Esq. Eckert Seamans Cherin and Mellott, LLC P.O. Box 5404 Princeton, NJ 08543 [email protected] Karen O. Moury, Esq. Kristine Marsilio, Esq. Eckert Seamans Cherin and Mellott, LLC 213 Market Street, 8th Floor Harrisburg, PA 17101 [email protected] [email protected] Uplight Kerry Cahill, Esq. Florio Perrucci Steinhardt and Cappelli, LLC 235 Broubalow Way Phillipsburg, NJ 08865 [email protected] Tanuj Deora Vice President, Market Development and Regulatory Affairs [email protected] New Jersey Large Energy Users Coalition
Steven S. Goldenberg, Esq. Giordano, Halleran and Ciesla, P.C. 125 Half Mile Road, Suite 300 Red Bank, NJ 07701-6777 [email protected] Paul F. Forshay, Esq. Eversheds Sutherland (US) LLP 700 Sixth Street, N.W., Suite 700 Washington, D.C. 20001-3980 [email protected]
Enel X North America, Inc.
Katie Guerry, Vice President Brian Kauffman, Manager Regulatory Affairs – North America One Marina Park Drive Boston, MA 02210 [email protected] [email protected] William Harla, Esq. Alice M. Bergen, Esq. Ryan J. Scerbo, Esq. Decotiis, Fitzpatrick, Cole and Giblin, LLP Glenpointe Centre West 500 Frank W. Burr Boulevard Teaneck, NJ 07666 [email protected] [email protected] [email protected] Energy Efficiency Alliance of New Jersey
Erin Cosgrove, Esq., Policy Counsel 14 S. 3rd Street, Second Floor Philadelphia, PA 19106 [email protected] Google, LLC
Murray E. Bevan, Esq. William K. Mosca, Jr., Esq. Jennifer McCave, Esq. Bevan, Mosca and Giuditta P.C. 222 Mount Airy Road, Suite 200 Basking Ridge, NJ 07920 [email protected] [email protected] [email protected]

Agenda Date: 9/23/20 Agenda Item: 8B
28 BPU DOCKET NOS. GO18101112 and EO18101113
Signify
Ben Brinkert, Esq. 3 Burlington Woods Drive Burlington, MA 01803 [email protected] Barbara Koonz, Esq. Wilentz, Goldman and Spitzer, P.A. 90 Woodbridge Center Drive, Suite 900 Woodbridge, NJ 07095 [email protected] Sunrun Inc. Lauri A. Mazzuchetti, Esq. Glenn T. Graham, Esq. Kelley Drye and Warren LLP One Jefferson Road, 2nd Floor Parsippany, NJ 07054 [email protected] [email protected] Beren Argetsinger, Esq. Keyes and Fox LLP P.O. Box 166 Burdett, NY 14818 [email protected]

Matthew M. Weissman Law Department Managing Counsel - State Regulatory PSEG Services Corporation 80 Park Plaza – T5, Newark, New Jersey 07102-4194 tel : 973-430-7052 fax: 973-430-5983 email: [email protected]
September 22, 2020
IN THE MATTER OF THE PETITION OF
PUBLIC SERVICE ELECTRIC AND GAS COMPANY FOR APPROVAL OF ITS CLEAN ENERGY FUTURE-ENERGY
EFFICIENCY (“CEF-EE”) PROGRAM ON A REGULATED BASIS
BPU Docket No. GO18101112 and EO18101113
VIA ELECTRONIC MAIL Aida Camacho-Welch, Secretary of the Board Board of Public Utilities 44 South Clinton Avenue, 9th Floor Trenton, New Jersey 08625 Dear Secretary Camacho-Welch:
Attached please find the fully executed Stipulation in the above-referenced case resolving all aspects of this matter. The following parties have signed the Stipulation: Public Service Electric and Gas Company; the Staff of the New Jersey Board of Public Utilities; the New Jersey Division of Rate Counsel; the Eastern Environmental Law Center, for Environment New Jersey, Environmental Defense Fund, New Jersey League of Conservation Voters and Natural Resources Defense Council; Keystone Energy Efficiency Alliance, n/k/a Energy Efficiency Alliance of New Jersey; and New Jersey Large Energy Users Coalition. While intervenor Direct Energy Business, LLC; Direct Energy Business Marketing, LLC; Direct Energy Services, LLC; Gateway Energy Services Corporation; Centrica Business Solutions; Just Energy Group, Inc.; and NRG, Inc. (the “Market Participants”) are not signatories to the Stipulation, we have been advised that they have no opposition to the stipulation and will be submitting a letter to that effect. In accordance with the Order issued by the Board in connection with I/M/O the New Jersey Board of Public Utilities’ Response to the COVID-19 Pandemic for a Temporary Waiver of Requirements for Certain Non-Essential Obligations, BPU Docket No. EO20030254, Order dated March 19, 2020, this document is being electronically filed. No paper copies will follow. If you have any questions, please do not hesitate to contact me.
0 PSEG Services Corporation

Aida Camacho-Welch, Secretary - 2 - September 22, 2020
Thank you for your consideration in this matter. Very truly yours,
Matthew M. Weissman Attach. C Attached Service List (E-Mail)

STATE OF NEW JERSEY BOARD OF PUBLIC UTILITIES
IN THE MATTER OF THE PETITION OF ) STIPULATION OF PUBLIC SERVICE ELECTRIC AND GAS ) SETTLEMENT COMPANY FOR APPROVAL OF ITS ) CLEAN ENERGY FUTURE-ENERGY EFFICIENCY ) BPU Docket Nos. GO18101112 and PROGRAM ON A REGULATED BASIS ) EO18101113
APPEARANCES:
Joseph F. Accardo Jr., Esq., Vice President - Regulatory and Deputy General Counsel, Matthew M. Weissman, Esq., Managing Counsel - State Regulatory, and Danielle Lopez, Esq., Associate Counsel - Regulatory for the Petitioner, Public Service Electric and Gas Company
Stefanie A. Brand, Esq., Director, Felicia Thomas-Friel, Esq., Deputy Rate Counsel, Kurt Lewandowski, Esq., Assistant Deputy Rate Counsel, Sarah Steindel, Esq., Assistant Deputy Rate Counsel, and Maura Caroselli, Esq., Assistant Deputy Rate Counsel for the New Jersey Division of Rate Counsel
Matko Illic, Esq., Deputy Attorney General, for the Staff of the New Jersey Board of Public Utilities (Gurbir S. Grewal, Attorney General of New Jersey)
Daniel Greenhouse, Esq., William D. Bittinger, Esq., Eastern Environmental Law Center, for Environment New Jersey, Environmental Defense Fund, New Jersey League of Conservation Voters and Natural Resources Defense Council (collectively, “Environmental Advocates”)
Erin Cosgrove, Esq., for the Keystone Energy Efficiency Alliance n/k/a Energy Efficiency Alliance of New Jersey.
Steven Goldenberg. Esq., Giordano Halleran & Ciesla, P.A. for the New Jersey Large Energy Users Coalition
Christopher E. Torkelson, Esq., Karen O. Moury, Esq., and Kristine Marsilio, Esq., Eckert Seamans Cherin & Mellott, LLC for Direct Energy Business, LLC; Direct Energy Business Marketing, LLC; Direct Energy Services, LLC; Gateway Energy Services Corporation; Centrica Business Solutions; Just Energy Group, Inc.; and NRG, Inc. (“Market Participants”)
TO THE HONORABLE BOARD OF PUBLIC UTILITIES:
It is hereby AGREED, by and between Public Service Electric and Gas Company (“PSE&G”
or “Company”), the Staff of the New Jersey Board of Public Utilities (“Board Staff” or “Staff”), the
New Jersey Division of Rate Counsel (“Rate Counsel”), the Keystone Energy Efficiency Alliance
- 2 -
(“KEEA”) n/k/a Energy Efficiency Alliance of New Jersey (“EEANJ”), the Environmental Advocates,
the New Jersey Large Energy Users Coalition (“NJLEUC”), and the Market Participants (collectively
referred to herein as the “Parties”) to execute this Stipulation of Settlement and Agreement resolving
PSE&G’s petition in this docket and to join in recommending that the New Jersey Board of Public
Utilities (“Board” or “BPU”) issue a Final Decision and Order approving this Stipulation of Settlement
and Agreement (“Stipulation”).
BACKGROUND
On January 13, 2008, L. 2007, c. 340 (“RGGI Law”) was signed into law and pronounced that
energy efficiency (“EE”) and conservation measures must be essential elements of the State’s energy
future. The Legislature also found that public utility involvement and competition in the conservation
and EE industries are essential to maximize efficiencies. N.J.S.A. 26:2C-45. Pursuant to Section 13 of
the RGGI Law, codified in part as N.J.S.A. 48:3-98.1(a)(1), an electric or gas public utility may, among
other things, provide and invest in EE and conservation programs in its service territory on a regulated
basis. An electric or gas public utility’s investment in EE and conservation programs is eligible for
rate treatment approved by the Board, including a return on equity, or other incentives or rate
mechanisms. N.J.S.A. 48:3-98.1(b).
PSE&G has made several EE filings pursuant to Section 13 of the RGGI Law, including:
i. On June 23, 2008, PSE&G filed a petition with the Board seeking approval of its Carbon Abatement Program, which included five (5) sub-programs: 1) Residential Whole House Efficiency; 2) Residential Programmable Thermostat Installation; 3) Small Business Direct Install; 4) Large Business Best Practices and Technology Demonstration Pilot; and 5) Hospital Efficiency, which the Board approved on December 16, 2008;1
1 In the Matter of the Petition of Public Service Electric and Gas Company Offering a Carbon Abatement Program in its Service
Territory on a Regulated Basis and Associated Cost Recovery Mechanism Pursuant to N.J.S.A. 48:3-98.1, BPU Docket No. EO08060426, Order (Dec. 16, 2008).

- 3 -
ii. On January 21, 2009, PSE&G filed a petition with the Board seeking approval of its Energy Efficiency Economic Stimulus Program (“EEE Program”), to implement eight (8) EE sub-programs: 1) Residential Whole House Efficiency; 2) Residential Multi-Family Housing; 3) Small Business Direct Install; 4) Municipal/Local/State Government Direct Install; 5) Hospital Efficiency; 6) Data Center Efficiency; 7) Building Commissioning/O&M; and 8) Technology Demonstration, which the Board approved on July 16, 2009;2
iii. On January 24, 2011, PSE&G filed a petition with the Board seeking approval to extend three (3) of the EEE sub-programs: Multi-Family Housing, Government/Municipal/Non-Profit Direct Install, and Hospital Efficiency, which the BPU approved on July 14, 2011;3
iv. On August 8, 2014, PSE&G filed a petition with the Board seeking a further extension of the three (3) EEE sub-programs with certain modifications, which the BPU approved on April 15, 2015;4 and
v. On March 3, 2017, PSE&G filed a petition with the Board seeking a further extension of the three EEE sub-programs for two (2) years (subject to the agreement that the Company would terminate the Direct Install Sub-Program at the conclusion of the two (2) year term), along with a request for two (2) new sub-programs: 1) smart thermostats; and 2) data analytics, all of which the Board approved on August 23, 2017.5
On May 23, 2018, Governor Murphy signed the Clean Energy Act (“CEA”) into law. The CEA
builds upon the RGGI Law by employing clean energy strategies and establishing aggressive energy
2 In the Matter of the Petition of Public Service Electric and Gas Company Offering an Energy Efficiency Economic Stimulus Program
in its Service Territory on a Regulated Basis and Associated Cost Recovery Mechanism Pursuant to N.J.S.A. 48:3-98.1, BPU Docket No. EO09010058, Decision (July 16, 2009).
3 In the Matter of the Petition of Public Service Electric and Gas Company for an Extension of Three Sub-Components of its Energy
Efficiency Economic Stimulus Program in its Service Territory on a Regulated Basis and Associated Cost Recovery and for Changes in the Tariff for Electric Service, B.P.U.N.J. No. 15 Electric and the Tariff for Gas Service, B.P.U.N.J. No. 15 Gas, Pursuant to N.J.S.A. 48:2-21, 48:2-21.1, and 48:3-98.1, BPU Docket No. EO11010030, Decision and Order (July 14, 2011).
4 In the Matter of the Petition of Public Service Electric and Gas Company to Continue its Energy Efficiency Economic Extension
Program on a Regulated Basis (“EEE Extension II”), BPU Docket No. EO14080897, Order Adopting Stipulation (Apr. 15, 2015).
5 In the Matter of the Petition of Public Service Gas and Electric Company for Approval of its Energy Efficiency 2017 Program and
Recovery of Associated Costs (“17 EE Program”), BPU Docket No. EO17030196, Order Adopting Stipulation (Aug. 23, 2017).

- 4 -
reduction requirements with the goal of improving public health by ensuring a cleaner environment for
current and future New Jersey residents. Specifically, the CEA requires that each utility implement EE
measures that “achieve annual reductions in the use of electricity of two percent of the average annual
usage in the prior three years within five years of implementation of its electric energy efficiency
program" and “annual reductions in the use of natural gas of 0.75 percent of the average annual usage
in the prior three years within five years of implementation of its gas energy efficiency program.”6 The
CEA emphasizes the importance of EE and peak demand reduction (“PDR”) and calls upon New
Jersey’s electric and gas public utilities to play an increased role in delivering EE and PDR programs
to customers, with the aim to achieve the State’s goal of 100% clean energy by 2050.
The CEA required the Board to complete a study to determine energy savings targets for each
utility to achieve the full economic, cost effective potential for energy usage reductions and the
timeframe to achieve those reductions. It also required the Board to adopt quantitative performance
indicators (“QPIs”) to establish utility targets for energy usage reduction and PDR, and to establish a
stakeholder process to evaluate the economically achievable EE and PDR requirements, rate
adjustments, QPIs, and the process for evaluating, measuring, and verifying energy usage reductions
and peak demand reductions by the public utilities.
CEF-EE FILING
As with the Company’s Carbon Abatement Program, and the EEE Program filing and its three
(3) extensions, PSE&G filed for approval of its Clean Energy Future- Energy Efficiency (“CEF-EE”)
Program pursuant to Section 13 of the RGGI Law on October 11, 2018 (“CEF-EE Petition” or
“Petition”). In accordance with the RGGI Law, the Company met with Board Staff and Rate Counsel
on May 3, 2018 for a pre-filing meeting to discuss: (a) the nature of the EE program; (b) the program
6 P.L. 2018, c. 17, § 3(a) and (e)(1).

- 5 -
cost recovery mechanism to be proposed in the Petition; and (c) the minimum filing requirements
(“MFRs”) to be submitted along with the Petition.
On November 14, 2018, Staff informed the Company that it found the CEF-EE Petition to be
administratively deficient with respect to the MFRs for EE, renewable energy, and conservation
programs ("Deficiency Letter''). In response to Staff's Deficiency Letter, the Company filed
supplemental information on January 4, 2019 (“Supplemental Filing”). On January 9, 2019, Board
Staff notified the Company that it reviewed the Petition for completeness and determined the Petition
administratively complete, thereby establishing the Board’s 180-day review period. Accordingly, the
Board’s 180-day review period under N.J.S.A. 48:3-98.1 commenced on January 7, 2019, with an
expiration date of July 6, 2019.
Accompanying its Petition, PSE&G filed the direct testimonies of Karen Reif, PSE&G Vice
President, Renewables and Energy Solutions; Steven Swetz, PSE&G Senior Director, Corporate Rates
and Revenue Requirements; and Daniel Hansen, PhD, Vice President, Christensen Associates Energy
Consulting, LLC. PSE&G's Supplemental Filing on January 4, 2019 included the supplemental direct
testimony of Ms. Reif.
The CEF-EE Program filing consisted of 22 sub-programs, including seven (7) residential sub-
programs, seven (7) commercial and industrial (“C&I”) sub-programs, and eight (8) pilot sub-
programs. The CEF-EE residential sub-programs were proposed to, among other initiatives, promote
the purchase and installation of high-efficiency appliances through rebates and on-bill incentives;
provide customers with energy audits and installation of EE measures; educate residential builders and
developers on energy efficient home design and construction; and educate kindergarten through 12th
grade students on EE. These residential sub-programs were proposed to work together to upgrade
efficiency in homes throughout PSE&G’s service territory. The CEF-EE C&I sub-programs were
proposed to, among other things, promote the installation of energy efficient equipment; advance

- 6 -
efficient design and equipment installation for new buildings; optimize energy consumption in existing
buildings; and upgrade all of PSE&G's existing high-pressure sodium cobra head streetlights to more
efficient light emitting diode ("LED") streetlights. Lastly, the CEF-EE pilot sub-programs were
proposed to implement and manage select, advanced approaches to EE that, after the conclusion of the
pilot phase, may support future EE programs in New Jersey.
The total proposed investment for the CEF-EE Program was approximately $2.8 billion,
including $2.5 billion for investment—including $86.2 million for information technology (“IT”)
investments—and approximately $283 million in administrative costs, including $28.9 million for IT
run costs, over the proposed six (6) year term of the Program, with a proposed 15-year amortization
period for residential and C&I program investments. PSE&G proposed that the costs be recovered via
a new CEF-EE Program component (“CEF-EEC”) of the Company’s electric and gas Green Programs
Recovery Charge (“GPRC”) that would be filed annually.
PSE&G proposed to earn a return on its net investment based on its most recent weighted
average cost of capital (“WACC”). Additionally, the Company requested Board approval of a
decoupling mechanism for recovering lost revenues, the Green Enabling Mechanism (“GEM”), which
would provide for the recovery or refund of the difference between actual revenue and the level of
“allowed” revenue per customer established in the most recently completed base rate case.
By Order dated October 29, 2018, the Board designated Commissioner Dianne Solomon as
Presiding Commissioner, authorized to rule on all motions that arise during the pendency of the CEF-EE
Petition and modify any schedules that may be set as necessary to secure a just and expeditious
determination of the issues. The Board directed that any entities seeking to intervene or participate in this
matter file the appropriate application with the Board by November 16, 2018. Moreover, to enable the
Board to effectively and efficiently carry out its mandate under N.J.S.A. 48:3-98.1 and to allow for
development of a complete record, the Board authorized Commissioner Solomon to render decisions on

- 7 -
stipulations, pursuant to N.J.S.A. 48:2-21.3, extending the 180-day review period, if submitted, provided
that the stipulation extending the time period is executed by all parties to the proceeding. The authority so
delegated was limited to extensions that do not collectively exceed 180 days, with any further request for
extensions to be directed to the Board.
By Order dated January 22, 2019, Commissioner Solomon issued a Prehearing Order that
established the issues to be determined by the Board and set forth a procedural schedule (“Prehearing
Order”). The Prehearing Order also granted the Motions for the Intervention of NJLEUC and the
Environmental Advocates. The Motions for Intervention of EEANJ and the Market Participants (on
Motion for Reconsideration) were granted by orders dated February 27, 2019 and November 13, 2019.
Public notice was provided, and six (6) public hearings were held on the CEF-EE Program on
the following dates at three (3) locations in PSE&G’s service territory: two (2) hearings on March 13,
2019 in New Brunswick, New Jersey; two (2) hearings on March 18, 2019 in Mt. Holly, New Jersey;
and two (2) hearings on March 21, 2019 in Hackensack, New Jersey. A total of 62 members of the
public made statements at the public hearings, the majority of whom commented in support of the CEF-
EE Program. Two (2) members of the public expressed concerns regarding the CEF-EE Program’s
impact on the competitive EE market.
The Company, Rate Counsel, and the Environmental Advocates pre-filed direct and rebuttal
testimony of their witnesses. Discovery questions were propounded by Board Staff, Rate Counsel, the
Environmental Advocates, and the Company; PSE&G, Rate Counsel, and the Environmental
Advocates responded thereto. Evidentiary hearings were conducted on May 1 and 2, 2019 before
Commissioner Solomon. During the evidentiary hearings, PSE&G, Rate Counsel, and the
Environmental Advocates introduced their respective pre-filed testimonies and exhibits, all discovery
responses were moved into evidence, Rate Counsel witnesses presented sur-rebuttal testimony, and

- 8 -
witnesses were cross-examined. Initial post-hearing briefs were submitted on May 17, 2019 and reply
briefs on May 29, 2019.
Several stipulations were approved by Commissioner Solomon to extend the 180-day period
for decision pursuant to N.J.S.A. 48:3-98.1: (a) by Order dated June 27, 2019—extending the period
from July 6, 2019 until August 19, 2019; (b) by Order dated August 12, 2019—extending the period
from August 19, 2019 until September 18, 2019; (c) by Order dated September 11, 2019—extending
the 180-day period for Board action on the Company’s CEF-EE Program from September 18, 2019
until March 16, 2020 and authorizing PSE&G to extend four (4) of the five (5) then-current EE 2017
sub-programs for one (1) year, with an additional $32.995 million of expenditures to be added to the
existing EE 2017 component of the GPRC (“EE 2017 Extension I”).
The Parties held settlement meetings on January 14, 29, February 5, 7, and 11, 2020, which
culminated in an interim settlement and further extension. A fully executed stipulation was submitted to
the BPU: 1) providing an extension of time for BPU action on the CEF-EE Petition until September 30,
2020; and 2) allowing the Company to continue all five (5) existing EE sub-programs through September
30, 2020, with an additional $111 million of program investment and an additional $19 million for the
Fixed Administrative Allowance and evaluation by outside contractors, to be recovered through the EE
2017 component of the Company’s annual GPRC filing (“EE 2017 Extension II”). The Board approved
that stipulation by Order dated February 19, 2020.
BPU ENERGY EFFICIENCY TRANSITION
Pursuant to the requirements of the CEA, the Board undertook a process to develop a framework
for establishing EE and PDR programs to reduce the use of electricity and natural gas in New Jersey.
At the outset of the proceeding, the Board contracted with Optimal Energy, Inc. (“Optimal”) to perform
a study to determine the potential for EE and PDR for each utility in the state and to develop preliminary
energy savings targets and QPIs for electricity and natural gas usage reduction (“EE Potential Study”).

- 9 -
As part of the Board’s separate EE transition process applicable to all utility- and State-
administered EE programs implemented pursuant to the CEA, the Board also established a stakeholder
process to evaluate the economically achievable EE and PDR requirements, rate adjustments, QPIs,
and the process for evaluating, measuring, and verifying energy usage reductions and peak demand
reductions by the public utilities. Following several stakeholder meetings regarding the EE Potential
Study, the Board adopted the energy savings targets and QPIs as preliminary and approved
establishment of an Energy Efficiency Advisory Group (“EEAG”) to participate in the ongoing EE
transition stakeholder process related to the development of EE and PDR programs in New Jersey.
Board Staff, Rate Counsel, and the utilities have also been working together through a Joint Utility
Working Group to review progress on efforts to coordinate programs. The utilities have been working
together to develop program details through the Utility Program Working Groups, which are comprised
of multiple teams working on topics including Residential sub-programs, Commercial and Industrial
sub-programs, Cross-Cutting issues (common issues between residential and C&I sub-programs),
evaluation, rates, and a statewide coordinator system.
Board Staff worked to consider and incorporate public comments and technical data received
throughout the EE transition process in the refinement of the framework for EE and PDR programs.
Staff also released proposals for comment on program administration and cost recovery and, ultimately,
following the submission of comments, on March 20, 2020 issued the full “Energy Efficiency
Transition Straw Proposal.” Public comments were again considered prior to submission to the Board
for approval. On June 10, 2020, the Board accepted Staff’s proposed framework (“Framework Order”)
for the performance targets, program administration, cost recovery, evaluation, measurement,
verification (“EM&V”), and filing and reporting standards for implementation of New Jersey’s EE and
PDR programs.

- 10 -
POST EE FRAMEWORK ORDER
Following the Board’s issuance of the Framework Order, the Parties recommenced settlement
discussions concerning PSE&G’s CEF-EE proposal. The Company has also continued its participation
in the Joint Utility Working Groups as per the Framework Order. Settlement discussions were held on
June 25, July 14, 16, 28, 31, August 14, 19, 25, 27, and September 1, and 2 with the goal of reaching a
settlement for BPU approval in advance of the September 30, 2020 deadline for Board action.
The Company, Board Staff, Rate Counsel, and the intervening parties (collectively
“Signatories”) have reached an agreement resolving all issues in this proceeding as guided by the
principles set forth in the Framework Order and by the Joint Utility Working Group and the Utility
Program Working Groups. In light of the foregoing, the Signatories have executed this Stipulation of
Settlement and Agreement, the terms of which are set forth below. Specifically, the Signatories hereby
STIPULATE AND AGREE to the following:
STIPULATED MATTERS
I. General Terms
1. The Parties agree that, subject to Board approval of this Stipulation of Settlement and
Agreement, PSE&G may implement a modified CEF-EE Program under the terms and conditions
described herein. The Program will include implementation, administration and investment in 10 sub-
programs, including four (4) residential sub-programs, five (5) Commercial and Industrial (C&I) sub-
programs, and one (1) multifamily sub-program.
2. The Parties agree that PSE&G should be permitted to implement the 10 sub-programs
identified in Attachment 1, attached hereto and incorporated herein by reference, subject to the final
consensus of the Joint Utility Working Group, as outlined in paragraph 50

- 11 -
3. PSE&G will launch sub-programs in accordance with Attachment 1, and adjustments
will be made in the implementation of these sub-programs to coordinate delivery and assure consistency
of core sub-programs with other utility core sub-programs, as necessary. To coordinate sub-program
offerings across the state, the utilities are engaged in a joint effort to contract with a single third-party
entity to serve as a dual-fuel statewide coordinator.
4. Customers in PSE&G’s electric and/or gas service territory who meet the criteria for the
respective CEF-EE sub-program offerings will be eligible to participate.
5. The CEF-EE Program budget is as follows:
Program Component Description
Component Budget ($M)
Implementation Date
Res Efficient Products
Rebates and on-bill repayment for HVAC, smart thermostats, appliances, lighting, and other equipment
140 Marketplace: 10/1/20
All other: 1/1/21
Res Existing Homes
Rebates and on-bill repayment for energy audit, direct install of efficient equipment, and broader weatherization / appliance replacement services
55 1/1/21
Res Behavior Data analytics, home energy reports, and online energy audits 25 1/1/217
Res Multifamily Energy audit and direct install of efficient equipment at no charge to tenants 9 1/1/21
Income Eligible
Energy audit, direct install of efficient equipment, and broader weatherization / appliance replacement services at no charge for income-eligible customers and for properties located within low and moderate-income census tracts
55
1/1/21
C&I Prescriptive Rebates and on-bill repayment for HVAC, lighting, motors and drives, refrigeration, water heaters, air compressors, and food service equipment
210 1/1/21
7 Additional customers will be added to the Behavior Subprogram on January 1, 2021. EE 2017 will continue to serve existing customers through December 2020.

- 12 -
Program Component Description
Component Budget ($M)
Implementation Date
C&I Custom Custom incentives for large energy efficiency projects, including on-bill repayment 100 1/1/21
C&I Small Non-
Residential Efficiency (a/k/a Direct Install)
Rebates and on-bill repayment for direct-installed EE measures to small non-residential customers of lighting, controls, refrigeration, heating and air conditioning updates, etc.
165
10/1/208
C&I Energy Management
Retro-commissioning and strategic energy management: optimizing existing systems with little to no equipment upgrades
6 1/1/21
C&I Engineered Solutions
Whole-building engineered energy saving solutions to hospitals, school districts, universities, municipalities, apartment buildings, other non-profit /public entities
205 10/1/209
IT Technology systems and services to ensure PSE&G customers have easy access to energy efficient products, incentives, and repayments
3310 N/A
Admin Program administration; program management; education and outreach; program design and development; and IT run costs
Cap at 10% of
investment
N/A
Investment Total 1,003
6. Based on market response, the Company may shift the timing of investment spending
between Program Years (October 1 – September 30) in any sub-program as necessary to provide
flexibility in responding to market conditions and customer demand and to ensure the achievement of
Program targets during the term of the Program, in accordance with the procedure outlined in the
8 The EE 2017 Direct Install Subprogram will continue for Urban Enterprise Zones, Government, and Nonprofits. Expansion of the program beyond that will begin no earlier than January 1, 2021. 9 The C&I Engineered Solutions Sub-program will continue for Hospitals and Multifamily. Expansion of the program beyond that will begin no earlier than January 1, 2021. 10 An expected breakdown of these IT costs is provided at Attachment 2.

- 13 -
Framework Order.
7. During implementation, certain sub-programs may be more successful in the near term
and require additional budget in order to respond to the market need and to continue operations.
Accordingly, the Parties agree that a process enabling the Company to make adjustments to sub-
program budgets in response to real market conditions experienced is justified. The process, in
accordance with the Framework Order, shall be as follows:
• PSE&G can shift its sub-program budgets out of an individual sub-program within the Residential sector or within the C&I sector, up to 25% of the individual sub-program’s total budget with Staff notification (which should be provided within 30 days following the change), 25–50% with Staff approval, and over 50% with Board approval.
• PSE&G can shift budgets out of the Residential sector or the C&I sector up to 5% of individual utility sector budgets with Staff notification (which should be provided within 30 days following the change), 5–10% with Staff approval, and over 10% with Board approval. Such budgets may be added to any sub-program(s) within the sector to which it is being transferred without limitation when the budget shift does not exceed 5%.
• All requests for budget adjustments shall be submitted to Staff and Rate Counsel. Staff retains the right to reject shifts requiring Staff notification. Requests for budget adjustments within the three-year Program filing necessitating Staff approval shall be submitted to Staff and Rate Counsel with a written description of and rationale for the proposed transfers, and shall be responded to within 30 days. Rate Counsel may object within 30 days, which will trigger Staff review within 30 days of Rate Counsel’s objection. If there is no response from Rate Counsel or Staff within 30 days of PSE&G’s request, those requests will be automatically granted.
8. Customer information shall be used by the Company to deliver an effective customer
experience in compliance with any applicable BPU regulations and statutory obligations. The
Company shall adopt privacy and data handling policies and procedures for CEF-EE that are consistent
with PSE&G's customer data security protections, the Framework Order, and any applicable BPU
regulations and statutory obligations. In the event of any breach of the above confidentiality by an
affiliate, PSE&G shall remediate this breach to the full extent required by law. In the event of any
breach of the above confidentiality by a vendor hired to deliver the CEF-EE or to evaluate the sub-

- 14 -
programs, the Company commits to enforcing the contractual confidentiality requirement to the extent
allowed by the law. Any “breach of security” with respect to customers’ “personal information,” as
those terms are defined in N.J.S.A. 56:8-161, shall be treated in accordance with the New Jersey
Identity Theft Prevention Act, N.J.S.A. 56:8-161 et seq., and Section 3b of the BPU’s Cybersecurity
Order of March 18, 2016 in Docket No. AO16030196.
9. PSE&G agrees customer-specific data belongs to the customer, who may request or
authorize PSE&G to share it with suppliers, and data gathered during the operation of these sub-
programs not specific to any particular customer belongs to the Company and will be used solely to
support current or future regulated utility programs. Such data may not be used for other purposes
without Board approval. Any financial benefits derived from the data will be offset against the costs
of the program. The Company will also submit non-customer-specific data to the Board in compliance
with reporting requirements, as established by the Board.
10. PSE&G has used a competitive selection process to select current EE implementation
vendors under existing EE Programs described above. The Company commits to conducting a
competitive solicitation process to select vendors for the second and third program years that meet
currently applicable requirements in a manner that permits the Company to prudently implement the
sub-programs. Alternatively, to the extent that contracts with existing vendors can be extended to
increase speed to market or reduce costs for customers, the Company will pursue these options and
make reasonable efforts to integrate all currently applicable competitive selection procurement
protocols into those contracts, while continuing to follow all competitive selection procurement
protocols for other services required.
11. Within 30 days of May 31, 2021, PSE&G will convene at least one (1) non-confidential
stakeholder collaborative meeting to discuss potential partnerships with market participants and other
stakeholders, and to obtain input regarding the design and implementation of “non-core” programs,

- 15 -
including but not limited to demand response and PDR programs, non-pipe and non-wire alternative
programs, and building electrification/decarbonization programs. PSE&G agrees to consider in good
faith the issues and suggestions raised in the meeting and to develop recommendations regarding a
future filing on additional programs identified in the meeting.
12. Within 120 days of Board approval of this Stipulation, PSE&G will convene at least one
stakeholder collaborative meeting to discuss competitive issues in the provision of EE, including but
not limited to the implementation of supplier consolidated billing.
13. Incentive structures are described in Attachment 1 of this Stipulation, and measure level
details are included in Appendix A of Attachment 1, subject to modification consistent with the
Framework Order and in cooperation with the BPU’s Utility Working Group and the Utilities’ Program
Working Groups. The Company commits to complying with all Board Orders regarding the programs
and program details it is required to offer.
II. Program Term
14. Implementation of the CEF-EE Program will commence on October 1, 2020 and will
continue over the course of the next three years until September 30, 2023.
15. CEF-EE core programs that are continuations of the EE 2017 sub-programs PSE&G
currently operates (Efficient Products Marketplace component11 and Direct Install12) shall commence
on October 1, 2020. CEF-EE core programs that PSE&G does not currently operate shall commence
no earlier than January 1, 2021. Non-core sub-programs, including those sub-programs that are
continuations of existing EE 2017 sub-programs, will commence on October 1, 2020. The EE 2017
Hospital and Multi-Family sub-programs will continue as components of the Engineered Solutions sub-
11 Efficient Products – Marketplace will be expanded to offer several on-line products on October 1, 2020. 12 See footnote 8.

- 16 -
program, with new elements of the Engineered Solutions sub-program commencing no earlier than
January 1, 2021. The EE 2017 Data Analytics sub-program will continue as the Behavioral sub-
program.
PSE&G will continue to coordinate regarding transition of programs (including program
delivery, program data, and marketing) with the current NJCEP program administrator and other
utilities with whom the Company has overlapping service territories. To the extent that the utilities
jointly decide to implement programs differently than currently envisioned, the Company commits to
implement, as permissible under law, consistent elements of the core programs concurrently with all
electric and gas utilities in the state. This consistency will include the following elements:
• Common forms for use by customers and contractors; • Contractor requirements, open and competitive procurement protocols where feasible, and
training; procurement protocols should include policies and practices (e.g., scoring systems) developed in collaboration with the Equity Working Group and Workforce Development Working Group that encourage supplier diversity (including contractors and subcontractors) and contractor coaching/mentoring of diverse business enterprises;
• Customer and property eligibility requirements and processes, including alternative/automatic eligibility methods for low- to moderate-income customers (e.g., based on census tracts, environmental justice communities, Urban Enterprise Zones, etc.);
• Eligible measures; • Incentive ranges; • Incentive payment processes and timeframes; • Customer and contractor engagement platforms; • Data platforms and database sharing among program administrators, where appropriate; and • Quality control standards and remediation policies.
16. The Company will file a subsequent multiyear Program extension for Board approval
by September 30, 2022 with a commencement date of October 1, 2023 to allow for efficient
continuation of the CEF-EE Program and align the program term with the subsequent State-wide July-
June program cycle.

- 17 -
III. CEF-EE Program Expenditures 17. The Parties agree that the total investment for the CEF-EE Program is $1.003 billion,
which includes all capital expenditures (including IT), rebates and incentives, including financing costs
and audit/installation labor, and outside services for third party sub-program implementation and
EM&V. The budget for investment includes amounts that are spent during the three-year program
cycle (October 1, 2020 – September 30, 2023) as well as amounts reserved to fund projects/incentives
for customers who have enrolled in sub-programs during that three (3) year period, as defined in
Appendix B of Attachment 1.
18. The agreed upon $1.003 billion investment amount does not include Company
administrative costs, which will be capped at $100.3 million. Company administrative costs include
PSE&G administrative, labor, IT run costs, and portfolio-level costs, such as program development and
jobs initiatives for the three year program cycle. The Company will recover its actual reasonable and
prudently incurred administrative costs up to the $100.3 million cap through annual GPRC cost
recovery filings. Staff and Rate Counsel reserve their rights to challenge the prudency of all costs,
including administrative costs, in future GPRC filings.
19. The Joint Utility Program Working Group is developing requirements for coordination
of services to customers, including the sharing of costs and the allocation of savings. The investments
and administrative costs do not include expenditures required for coordination with other utilities,
including the Statewide Program Coordinator System. The Parties agree that any additional costs for
such coordination efforts that go beyond the scope of the Program, and that are deemed prudently
incurred after appropriate review, will be recoverable.
20. All Program expenditures will be filed with the Board and submitted for prudency
review in annual cost recovery filings over the term of the Program by way of PSE&G’s annual GPRC
proceedings.

- 18 -
IV. Cost Benefit Analysis / Reporting
21. The Company submitted calculations as to the cost-effectiveness of each of the proposed
sub-programs under five (5) different cost-benefit tests: the Participant Cost Test (“PCT”), the Program
Administrator Cost (“PAC”) Test, the Ratepayer Impact Measure (“RIM”) Test, the Total Resource
Cost (“TRC”) Test, and the Societal Cost Test (“SCT”). Attached hereto as Attachment 3 are
summaries of the results of (1) the Company’s Benefit Cost Analysis including the New Jersey Cost
Test (NJCT), (2) its Costs-to-Achieve Savings Analyses, and (3) its analysis of Electric and Gas QPI
values in Program Years 1-3. On or before September 25, 2020 the Company will provide detailed
supporting calculations and workpapers that are fully compliant with the MFRs established in the
Framework Order. With regard to the QPIs, the Company will provide a description of how the
proposed portfolio achieves the targets established for the Company as required by MFR VII.
22. QPI performance periods will be those set forth in the Framework Order. In addition to
CEF-EE projects and measures completed after July 1, 2021, EE 2017 projects and measures completed
after July 1, 2021 shall be included in QPI measurement. Quarterly, annual and triennial reports will
be consistent with the requirements of the Framework Order, the details of which will be developed by
the BPU’s Utility Working Group.
23. The Company will perform EM&V for the CEF-EE Program in accordance with the
Framework Order. All EE 2017 projects and measures completed after July 1, 2021 shall also be
included in the CEF-EE EM&V plan.
V. Capital Structure/Return on Equity
24. PSE&G will earn a return on its net investment based upon the authorized return on
equity (“ROE”) and capital structure approved by the Board in its last base rate proceeding.
25. PSE&G’s weighted average cost of capital (“WACC”) for its CEF-EE Program
investments will be set based on the WACC established in the Company’s 2018 base rate case, which

- 19 -
is 6.99%, or 9.02% on a pre-tax basis based on a common equity percentage of 54%, an ROE of 9.60%,
and current tax rates. Attachment 4, Schedule SS-CEF-EE-1 of this Stipulation shows the calculation
of the WACC for the CEF-EE Program.
26. The Parties agree that any change in the WACC authorized by the Board in a subsequent
base rate case will be reflected in the appropriate corresponding subsequent monthly revenue
requirement calculations. The Signatory Parties further agree that any change in the revenue
requirement resulting from the change in the WACC will not be included in the monthly interest
calculation for over and under recoveries until the date of the next scheduled annual true-up but, in any
event, no later than January 1 of the subsequent year. Any changes to current tax rates would be
reflected in an adjustment to the Pre-Tax WACC and in any corresponding revenue requirement
calculations.
VI. Cost Recovery
27. Cost recovery for the Program will be made and tracked via a new CEF-EE Program
component (“CEF-EEC”) of the Company’s electric and gas GPRC, which will be filed annually after
the proposed initial period. PSE&G has submitted proposed tariff sheets (both red-lined and clean) as
Attachment 5 of this Stipulation to reflect the updated GPRC tariff.
28. The Parties agree that, in light of the impacts of the current COVID-19 pandemic,
the initial electric and gas CEF-EECs will be set at zero as of the date of the BPU Order in this
proceeding. The Parties further agree that the CEF-EECs will be included in an update to the
Company’s pending 2020 GPRC Cost Recovery filing in Docket Nos. ER20060467 &
GR20060468, and an initial rate can be set for each component in the settlement of that proceeding.
In any event, the initial CEF-EECs will not be increased before January 1, 2021.
29. The electric and gas CEF-EECs will be subject to adjustment and true-up through
the deferral process, and any required adjustment will be included in the over/under recovered

- 20 -
balance to be recovered from or returned to customers over the following year. Any Board ordered
cost recovery adjustments resulting from the review of the actual costs will be made to the
over/under deferred balance and reflected in the charges established for the following year
pursuant to a final Board Order.
30. The calculation methodology of revenue requirements and the over/under deferred
balance is detailed in Attachment 4. The Parties agree the Company will modify the revenue
requirement calculation if needed to coordinate sharing of investment with partner utilities in
shared service territories as a result of the Board’s review and approval of the other utilities cost
recovery methodology.
31. Revenues received under the CEF-EE Program, such as PJM Capacity Revenues,
marketplace revenues negotiated with vendors, or any other source of revenues as a result of the
implementation of the CEF-EE Program, as well as financial benefits from the usage of data as provided
in paragraph 9 herein, will be utilized to offset revenue requirements to customers.
32. The Company shall offer eligible EE into the PJM capacity market, consistent with the
approach agreed upon by the BPU’s Joint Utility Working Group, subject to the requirements of PJM.
The Company will credit CEF-EE revenue requirements with any PJM capacity market revenues.
33. The Parties agree to amortize the CEF-EE investments, excluding IT, over a 10-year
period. Investment other than financing costs will be expensed when incurred for tax purposes and
flowed back to customers as shown in Attachment 4. IT investments will be amortized in accordance
with PSE&G’s accounting policy and generally accepted accounting principles, which is forecasted to
be a five (5)-year book amortization period and three (3)-year straight-line period for tax purposes. IT
tax deductions will also be flowed back to customers, as shown in Attachment 4.
34. The Parties stipulate that the Company will file to adjust its electric and gas CEF-EECs,
as part of the true-up petition (“True-Up Filing”) for the GPRC, with copies provided to the Parties no

- 21 -
later than July 1, 2021 and annually thereafter for the implementation of the proposed revised CEF-
EECs on October 1 of each year. The True-Up Filing will provide information as required by the
MFRs. Each True-Up Filing will contain a reconciliation of its projected CEF-EECs costs and
recoveries and actual revenue requirements for the prior period, and a forecast of revenue requirements
for the estimated time period before Board approval (October 1) and the 12-month period thereafter,
which shall be based upon the Company’s most current authorized ROE and capital structure as defined
above. The True-Up Filing also will present actual costs incurred since the previous annual review,
and those costs will then be reviewed for reasonableness and prudency.
35. The Parties agree that any over/under recovery of the actual revenue requirements
compared to revenues will be deferred. In calculating the monthly interest on net over and under
recoveries, the interest rate shall be based upon the Company’s interest rate obtained on its commercial
paper and/or bank credit lines utilized in the preceding month. If both commercial paper and bank
credit lines have been utilized, the weighted average of both sources of capital shall be used. In the
event that neither commercial paper nor bank credit lines were utilized in the preceding month, the
prior months interest rate calculation will be used. The interest rate shall not exceed PSE&G’s overall
rate of return, as authorized by the Board, in calculating revenue requirements for the corresponding
period. The interest amount charged to the CEF-EE Program electric and gas deferred balances will be
computed using the methodology set forth in Attachment 4, Schedule SS-CEF-EE-6E and SS-CEF-
EE-6G, respectively of this Stipulation. The calculation of monthly interest shall be net of tax based
on the average monthly balance, consistent with the methodology set forth in Attachment 4, Schedules
SS-CEF-EE-6E and SS-CEF-EE-6G of this Stipulation for the CEF-EE Program. Simple interest shall
accrue on any over and under recovered balances and shall be included in the deferred balances at the
end of each reconciliation period. Near the end of the initial and each subsequent recovery period, the

- 22 -
corresponding electric and gas deferred balances will be included with forecasted revenue requirements
for the succeeding period for the purpose of setting the revised electric and gas CEF-EECs.
36. The True-Up Filing will be subject to review by the Parties with opportunity for
discovery and evidentiary hearings (if necessary) prior to the issuance of a Board Order establishing
the Company’s revised CEF-EECs. The issuance of a written Board Order will be preceded by
adequate public notice and public hearings including evidentiary hearings, if necessary.
VII. Conservation Incentive Program (“CIP”)
37. Given the volumetric rate structure to recover fixed costs and the potential for decline
in revenue associated with the implementation of energy efficiency, the Parties agree—as consistent
with the CEA—to account for lost sales revenue resulting from the decrease in customer energy usage.
Shareholder Contribution
38. The recovery of lost revenues due to programs like the CEF-EE will be made via a CIP
based on the methodology outlined below and detailed in the schedules for gas and electric, as noted in
Attachments 6G and 6E, respectively. In addition, PSE&G agrees to implement initiatives to further
customer conservation efforts, providing a funding amount (“shareholder contribution”) of $3.3 million
per year as long as the CIP remains in place, commencing with the start of the CIP deferrals, as defined
below. All shareholder contribution expenditures will be allocated 55% to electric distribution (or
approximately $1.8 million) and 45% to gas distribution (or approximately $1.5 million). Any under-
spend in a year will be factored into the following year’s spending amount. The shareholder
contribution will not be included in customer rates. The shareholder contribution will support
initiatives designed to aid customers in reducing their costs of natural gas and electricity and to reduce
each utility’s peak demand. The initiatives may include efforts such as education and outreach, as well
as enhancements to standard incentives to further encourage customer engagement in the CEF-EE
Program (e.g., the distribution of free EE kits within low- and moderate-income census tracts), grants

- 23 -
to schools and community organizations, and a business EE portal.
• Community Education and Outreach: This category covers community outreach activities, such as presentations, lunch and learns, outreach tables, trade shows, business conferences, and green fairs. It may also include grants or initiatives with community organizations. Particular emphasis will be placed on low- and moderate-income communities.
• Municipal and NGO (non-governmental organization) Outreach: This category includes activities to work with municipalities and other organizations and may include funding for special studies or projects and partnerships to promote EE.
• Customer Engagement: This category includes activities to increase customer awareness and engagement in programs, including enhanced incentives for promotional purposes, such as the offering of a flash sale. Particular emphasis will be placed on low- and moderate-income customers. A business engagement portal may be explored to evaluate the potential to provide customized information to this diverse customer segment.
• Energy Efficient Economy: This category supports efforts to engage and develop a diverse supplier and workforce base to support the delivery of EE services.
Filing/Tariff Details
39. The Parties agree that, in light of the COVID-19 pandemic, the Company will submit
its first electric CIP cost recovery filing by February 1, 2022, for new rates effective June 1, 2022,
based on an initial deferral period of June 1, 2021 through May 31, 2022. The Parties further agree
that the Company will submit its first gas CIP cost recovery filing by June 1, 2022, for new rates
effective October 1, 2022, based on an initial deferral period of October 1, 2021 through September 30,
2022. The electric and gas CIPs will be adjusted annually thereafter. The Company will not book any
CIP deferral prior to June 1, 2021 for electric and October 1, 2021 for gas. The filings will document
actual results, perform the required CIP collection tests described in more detail below, and propose
the new CIP rate. Any variances from the annual filings will be trued-up in the subsequent year.
40. Attachment 5 to this Stipulation contains the electric and gas CIP tariffs. The CIP tariffs
will reflect an initial rate of $0.00000 for both electric and gas.
41. The terms of the existing Weather Normalization Charge (“WNC”) will be suspended
as of October 1, 2021 at the time that the Gas CIP deferral begins. The 2021 Gas WNC cost recovery
filing for the 2020-2021 Winter period can be implemented for new rates effective October 1, 2021,

- 24 -
with any remaining over or under-collection included in the Company’s first gas CIP tariff to be
submitted by June 1, 2022.
CIP Methodology
42. The monthly CIP deferrals will be calculated as reflected in Attachments 5 and 6E/G to
this Stipulation. For the gas CIP, the baseline usage per customer by applicable rate schedule is shown
in Attachments 5 and 6G and is based on the billing determinants approved in the Company’s 2018
base rate case. The baseline usage per customer will be adjusted with each subsequent base rate case.
The margin rate utilized in the calculation of the gas deferral is based on the current variable margin
rate for each rate schedule and will be updated for any Infrastructure Investment Program (“IIP”) rate
adjustments or future base rate changes. For the electric CIP, the baseline revenue per customer by
applicable rate schedule is shown in Attachments 5 and 6E and is based on the billing determinants
from the 2018 base rate case and the latest variable margin rates per rate schedule, including any IIP
rate adjustments. The baseline usage and margin rates will be updated with each subsequent base rate
case or IIP rate adjustment.
43. For purposes of determining recovery eligibility for CIP accruals, the margin impact of
changes in customer usage will be segregated into weather-related and non-weather-related
components. The non-weather-related components will be limited by eligibility tests described in more
detail below. The weather-related component will not be subject to those limitations.
44. The non-weather component will be calculated by first deducting the weather
component. For gas, the weather impact will be calculated in the same manner as calculated for the
Company’s existing WNC. For electric, the weather impact will be calculated in a manner consistent
with the methodology used for gas. PSE&G will establish sales coefficients based on 20 years of
weather history of sales for residential customers only. The weather will be measured by the impacts
on sales and associated distribution revenue of heating degree days (“HDD”) for winter weather and

- 25 -
the temperature humidity index (“THI”) for summer weather. The average of the 20 years of data for
HDD and THI will be considered normal. The difference in actual and normal HDD and THI will be
multiplied by the sales coefficients to establish sales impacts. The sales impacts will be multiplied by
the current tariff rates to derive the revenue impact. The weather normalization methodology is detailed
in Schedule 4 of Attachments 6E and 6G for electric and gas, respectively.
45. The Parties agree that recovery of non-weather related gas CIP impacts shall be subject
to the application of two eligibility tests: a Modified BGSS Savings Test and a Variable Margin Test.
The Parties further agree that recovery of non-weather related electric CIP impacts shall be subject to
the application of two eligibility tests: a BGS Savings Test and a Variable Margin Test. In order to be
eligible for recovery, non-weather related CIP impacts must pass both cost recovery tests. A description
of the eligibility tests is provided below.
• a. Modified BGSS Savings Test (Gas only) – The Parties agree that reductions in
customer usage provide opportunities to reduce peak demand and lower commodity
costs. As a result, recovery through the gas CIP Tariff will be limited to BGSS Savings
calculated under the following methodology. Consistent with the existing Modified
BGSS Savings Test utilized by New Jersey Natural Gas Company and South Jersey Gas
Company, the margin impact shall be multiplied by a factor of 75% prior to application
of the BGSS Savings test. Further, the Parties agree to recognize three (3) categories of
savings when calculating the total savings used in the Modified BGSS Savings Test.
i. Category One includes the Company's permanent savings realized from its
permanent capacity releases or contract terminations on an ongoing basis. The
permanent capacity releases and contract terminations are $45.395 million, as
detailed by contract in Schedule 5 of Attachment 6G. These amounts will remain
constant after the re-setting of the CIP benchmarks in future base rate cases.

- 26 -
ii. Category Two includes BGSS gas cost savings from reductions of capacity on a
long-term basis, i.e., for periods of at least one (1) year. This category of savings
will include, but not be limited to: 1) additional contract terminations not
included in Attachment 6G, Schedule 5; 2) release of capacity to an affiliate or
non-affiliate; 3) contract restructuring; and 4) reductions in the commodity cost
of gas supply effectuated through purchasing strategies.
iii. Category Three is the Company's savings associated with avoided capacity costs
to meet residential customer growth on a prospective basis, beginning with the
first annual CIP filing following implementation of these terms. Avoided
capacity costs shall be calculated on a monthly basis and are equal to the net
change in residential customers for CIP multiplied by the corresponding
Benchmark Use per Customer and by the average fixed capacity cost reflected
in the Company’s concurrent BGSS filing. Schedule 5 of Attachment 6G to this
Stipulation illustrates the savings calculation.
iv. Additional BGSS savings pursuant to subparagraphs 44(a)(ii) and (iii) above
will only be counted within the Modified BGSS Savings Test after agreement is
reached with Rate Counsel and Board Staff about BGSS savings transactions.
• b. BGS Savings Test (Electric only) – The Parties agree that reductions in customer
usage provide opportunities to reduce peak demand and lower commodity costs. As a
result, recovery through the electric CIP Tariff will be limited to BGS Savings calculated
under the following methodology. Consistent with the Modified BGSS Savings Test
described above for gas, the margin impact shall be multiplied by a factor of 75% prior
to application of the BGS Savings test. Further, the Parties agree to recognize three (3)
categories of savings when calculating the total savings used in the BGS Savings Test.

- 27 -
i. Category One includes the Company's permanent savings realized from the
reduction in PJM Final Zonal Unforced Capacity (“UCAP”) Obligation from the
2011/2012 energy year compared to the 2020/2021 energy year multiplied by
the 2020/2021 PS Zonal Net Load Price. The permanent BGS savings are
$64.506 million, as shown in Schedule 5 of Attachment 6E. These amounts will
remain after the re-setting of the CIP benchmarks in future base rate cases.
ii. Category Two includes BGS cost savings from ongoing reductions of the
Company’s PJM Final Zonal UCAP Obligation. This category of savings will
be calculated as any annual incremental UCAP Obligation savings after the
2020/2021 energy year. Any annual incremental UCAP Obligation savings will
be multiplied by the most recent PS Zonal Net Load Price. Due to the potential
for Peak increases due to electric vehicles and electrification, savings are set as
a minimum of the incremental obligation savings or zero.
iii. Category Three is the Company's savings associated with avoided capacity costs
to meet customer growth on a prospective basis beginning with the first annual
CIP filing following implementation of these terms. Avoided capacity costs
shall be calculated on a monthly basis and are equal to the net change in
customers for CIP multiplied by the corresponding obligation per customer and
the current PS Zonal Net Load Price per month. Schedule 5 of Attachment 6E
to this Stipulation illustrates the savings calculation.
iv. Additional savings pursuant to subparagraphs 44(b)(ii) and (iii) above will only
be counted within the BGS Savings Test after agreement is reached with Rate
Counsel and Board Staff.
• Variable Margin Test (Electric and Gas) – The Parties further agree to adopt an

- 28 -
additional recovery limitation to non-weather-related CIP margins equal to 6.5% of
variable margins for the CIP accrual year. However, for the first annual deferral period
only (June 1, 2021 through May 31, 2022 for Electric and October 1, 2021 through
September 30, 2022 for Gas), the Parties agree to a recovery and refund limitation to
non-weather-related CIP margins equal to 4.0 percent of variable margins. Specifically,
variable margins for the gas CIP will be calculated based upon: (i) the number of
customers, (ii) the applicable baseline use per customer ("BUC"), and (iii) the associated
margin per therm. The margin revenues for each month for each gas CIP Group shall
equal the actual number of customers multiplied by the BUC and multiplied by the
margin revenue factor. For the electric CIP, variable margins will be calculated based
on: (i) the number of customers and (ii) the baseline revenue per customer. The margin
revenues for each month for each electric CIP Group shall equal the actual number of
customers multiplied by the baseline revenue per customer. The resulting monthly
values for both electric and gas shall be summed for all 12 months for all CIP Groups
in order to yield the total Variable Margins for the year. Recoverable non-weather CIP
amounts shall not exceed 6.5% (or 4.0% in the first year as defined above for electric
and gas) of the aggregate variable margin revenues under this test.
46. The dual cost recovery tests set forth in this paragraph shall operate in conjunction with
each other in such a manner so that the total non-weather recoverable amount is limited to the smaller
of the two (2) recoverable amounts allowed under the separate Modified BGSS Savings Test and the
Variable Margin Revenue Test for Gas and BGS Savings Test and Variable Margin Revenue Test for
Electric. The Parties agree that any amounts that exceed the Modified BGSS Savings Test/BGS
Savings Test and/or Variable Margin Revenue recovery limitations may be deferred for future recovery
subject to the earnings test described below. The Company agrees to not seek recovery of interest on

- 29 -
any deferred carry-forward amount.
47. Earnings Test – The Parties agree to include an earnings test, through which actual ROE
shall be determined based on the actual net income of the utility for the most recent 12-month period
divided by the average of the beginning and ending common equity balances for the corresponding
period. The timing of the earnings test and definitions of Net Income and Common Equity are
specified in the Electric and Gas CIP Tariffs provided in Attachment 5. The earnings test will be
applicable to the total CIP deferral, including both weather and non-weather components. If the
calculated ROE exceeds the allowed ROE from the utility's last base rate case by 50 basis points or
more, recovery of lost revenues through the CIP shall not be allowed for the applicable filing period
and shall not be carried over to subsequent filing periods.
VIII. Rate and Bill Impacts
48. Electric and gas customers will see no change in their current bill as a result of this
Stipulation. Attachment 4, Schedules SS-CEF-EE-4E and SS-CEF-EE-4G, provides the bill impacts
to a typical residential electric and gas customer, respectively, over the life of the CEF-EE Program.
49. This Stipulation represents a mutual balancing of interests, contains interdependent
provisions, and, therefore, is intended to be accepted and approved in its entirety. In the event that any
particular aspect of this Stipulation is not accepted and approved in its entirety by the Board, any Party
aggrieved thereby shall not be bound to proceed with this Stipulation and shall have the right to litigate
all issues addressed herein to a conclusion. More particularly, in the event that this Stipulation is not
adopted in its entirety by the Board, in any applicable Order, then any Party hereto is free to pursue its
then available legal remedies with respect to all issues addressed in this Stipulation as though this
Stipulation had not been signed.
50. To the extent that any particular aspect of this Stipulation concerning establishment of

- 30 -
core sub-programs and coordinated elements (such as incentives, marketplace, marketing, workforce
development, and contractor procurement), or sub-program structure in overlapping territories are not
consistent with the final consensus reached by the Joint Utility Working Group, the Parties agree that
the conflicting aspects of this Stipulation shall be revised accordingly.
51. It is the intent of the Parties that the provisions hereof be approved by the Board as being
in the public interest. The Parties further agree that they consider the Stipulation to be binding on them
for all purposes herein.
52. It is specifically understood and agreed that this Stipulation represents a negotiated
agreement and has been made exclusively for the purpose of these proceedings. Except as expressly
provided herein, the Parties shall not be deemed to have approved, agreed to, or consented to any
principle or methodology underlying or supposed to underlie any agreement provided herein, in total or
by specific item. The Parties further agree that this Stipulation is in no way binding upon them in any
other proceeding, except to enforce the terms of this Stipulation.
GURBIR S. GREWAL ATTORNEY GENERAL OF NEW JERSEY Attorney for the Staff of the New Jersey Board of Public Utilities
By:~& Matko Ilic, Esq. Deputy Attorney General
Dated: September 22, 2020
PUBLIC SERVICE ELECTRIC AND GAS COMPANY
/~~ By: -------------
Matthew M. Weissman, Esq. Managing Counsel - State Regulatory
Dated: September 21, 2020

- 31 -
STEFANIE A BRAND, DIRECTOR NEW JERSEY DIVISION OF RA TE COUNSEL
By: J-J0/~ Sarah H Steindel, Esq. Assistant Deputy Rate Counsel
Dated: September 22, 2020
EASTERN ENVIRONMENTAL LAW CENTER
By: __________ _ Daniel Greenhouse, Esq. William Bittinger, Esq. Eastern Environmental Law Center
Dated: September 21, 2020
MARKETPARTICPANTS
By: ------- ---Christopher E. Torkelson, Esq. Karen 0 . Moury, Esq. Eckert Seamans Cherin & Mellott, LLC
Dated: September 21 , 2020
NEW JERSEY LARGE ENERGY USERS
By: ___________ _ Steven Goldenberg, Esq. Giordano Halleran & Ciesla, P.A.
Dated: September 21, 2020
KEYSTONE ENERGY EFFICIENCY ALLIANCE, n/k/a ENERGY EFFICIENCY ALLIANCE OF NEW JERSEY
By: _______ ____ _
Erin Cosgrove, Esq. Keystone Energy Efficiency Alliance n/k/a Energy Efliciency Alliance of New Jersey
Dated: September 21, 2020

DIVISION OF RATE COUNSEL
By: ------------Stefanie A. Brand, Esq. Director
Dated: September 21, 2020
EASTERN ENVIRONMENTAL LAW CENTER
By: ___________ _ Daniel Greenhouse, Esq. William Bittinger, Esq. Eastern Environmental Law Center
Dated: September 21, 2020
MARKET PARTICP ANTS
By: ------------Christopher E. Torkelson, Esq. Karen 0. Moury, Esq. Eckert Seamans Cherin & Mellott, LLC
Dated: September 21, 2020
- 31 -
NEW JERSEY LARGE ENERGY USERS
Steven Goldenberg, Esq. Giordano Halleran & Ciesla, P.A.
Dated: September 21, 2020
KEYSTONE ENERGY EFFICIENCY ALLIANCE, n/k/a ENERGY EFFICIENCY ALLIANCE OF NEW JERSEY
By:------------Erin Cosgrove, Esq. Keystone Energy Efficiency Alliance n/k/a Energy Efficiency Alliance of New Jersey
Dated: September 21, 2020

- 31 -
By: ____________________________ By: ________________________________ Stefanie A. Brand, Esq. Steven Goldenberg, Esq. Director Giordano Halleran & Ciesla, P.A. Dated: September 21, 2020 Dated: September 21, 2020
EASTERN ENVIRONMENTAL LAW CENTER KEYSTONE ENERGY EFFICIENCY ALLIANCE, n/k/a ENERGY EFFICIENCY
ALLIANCE OF NEW JERSEY By: By:____________________________ By: _______________________________
Daniel Greenhouse, Esq. Erin Cosgrove, Esq. William Bittinger, Esq. Keystone Energy Efficiency Alliance
Eastern Environmental Law Center n/k/a Energy Efficiency Alliance of New Jersey
Dated: September 21, 2020 Dated: September 21, 2020 MARKET PARTICPANTS
mmmmm MARKET PARTICIPANTS
By: ____________________________ Christopher E. Torkelson, Esq. Karen O. Moury, Esq. Eckert Seamans Cherin & Mellott, LLC Dated: September 21, 2020
J

By:------------Stefanie A. Brand, Esq. Director
Dated: September 21, 2020
EASTERN ENVIRONMENTAL LAW CENTER
~r tN~ £ Pf, /11:rllV, '- NP-.bL
By: 114/J.§ William D. Bittinger,sq. Daniel Greenhouse, Esq. Eastern Environmental Law Center
Dated: September 22, 2020
MARKET PAR TICP ANTS
By:-----------Christopher E. Torkelson, Esq. Karen 0. Moury, Esq. Eckert Seamans Cherin & Mellott, LLC
Dated: September 21, 2020
- 31 -
By: ____________ _ Steven Goldenberg, Esq. Giordano Halleran & Ciesla, P.A.
Dated: September 21, 2020
KEYSTONE ENERGY EFFICIENCY ALLIANCE, n/k/a ENERGY EFFICIENCY ALLIANCE OF NEW JERSEY
By:------------Erin Cosgrove, Esq.
Keystone Energy Efficiency Alliance n/k/a Energy Efficiency Alliance of New Jersey
Dated: September 21, 2020

ATTACHMENT 1
1
Contents 1.1. Residential Sector Subprograms 2
1.1.1. Residential Efficient Products 2 1.1.2. Residential Existing Homes 6 1.1.3. Residential Behavioral 8 1.1.4. Residential Income Eligible 10
1.2. Multifamily Sector Subprogram 11 1.2.1. Residential Multi-Family 11
1.3. Commercial & Industrial Sector Subprograms 13 1.3.1. C&I Prescriptive 14 1.3.2. C&I Custom 16 1.3.3. C&I Small Non-Residential Efficiency 18 1.3.4. C&I Energy Management 20 1.3.5. C&I Engineered Solutions 24
APPENDIX A – MEASURE-LEVEL DETAILS 27
APPENDIX B: ENROLLMENT 39
Note: Note that subprogram and incentive designs may be adjusted as required to coordinate with other
NJ utilities.

ATTACHMENT 1
2
1.1. Residential Sector Subprograms The proposed residential subprograms will work together to significantly upgrade efficiency in homes
throughout PSE&G’s service territory. All sub-segments are addressed, from new construction and
refurbishments, to existing homes, to an online marketplace for installation service, with additional
dedicated support for multi-family and lower income customers. Where needed, additional customer
support is provided through on-bill repayments and other incentives. To further improve the culture of
energy efficiency use in its territory, PSE&G will sponsor subprograms through education and behavioral
subprograms.
1.1.1. Residential Efficient Products The Residential Efficient Products Subprogram will promote the installation of ENERGY STAR and other
high-efficiency electric and natural gas equipment by residential customers by offering a broad range of
energy efficient equipment and appliances through a variety of channels, including an online marketplace,
in-store rebates, reduced point of sale costs, and a network of trade allies. The subprogram will provide
incentives for energy efficient lighting, appliances, smart thermostats, electronics, and heating and cooling
equipment. Installation services may also be offered for some equipment. Measures range in type and price,
but include both electric and natural gas technologies that improve energy efficiency in the home. Up-front
rebates will be offered on all technologies to reduce initial costs, and some purchases will qualify for on-
bill repayments to further reduce first cost barriers. The subprogram is designed to provide easy and cost-
effective access to energy efficient measures through customers' preferred channels.
The subprogram is designed to:
Provide incentives to customers for the installation of products to reduce energy use in the home
and information about other subprograms that encourage the installation of high efficiency
equipment, such as lighting, room air conditioners, HVAC units, electronics and appliances.
Provide midstream incentives to retailers to increase sales of ENERGY STAR products.
Provide a marketing mechanism for retailer and high efficiency product suppliers to promote
energy efficient equipment and products to end users.
Ensure the participation process is clear, easy to understand and simple for the customer and
contractor.
Provide online and other channels for customers to acquire select ENERGY STAR and other
qualified products.
Utilize energy efficiency kits to introduce and promote energy efficiency technologies that can be
easily installed in the home. The kits will serve as a gateway to other programs by including
energy efficiency and conservation educational materials and promotional materials for other
program opportunities, including the utility, Comfort Partners and NJCEP programs.
Provide energy efficiency kits to local foodbank and non-profit organizations and at energy
assistance outreach events to reach low- to moderate-income customers, with schools to promote
energy efficiency education in classrooms, to new movers, customers upon request, and within
utility marketplaces to support customer engagement.
This subprogram will significantly increase adoption of energy efficient equipment by harnessing PSE&G’s
unique customer relationship to positively impact the entire sales process surrounding efficient equipment,
from education and awareness of customers, engagement with trade ally contractors and equipment
distributors, to on-bill repayments and final installation and commissioning of the high efficiency
equipment.
Market Segment/Efficiency Targeted

ATTACHMENT 1
3
The Residential Efficient Products Subprogram will be available to all residential electric and/or natural
gas customers in the PSE&G service territory. The subprogram is focused on promoting the sale and
installation of efficient electric and natural gas equipment across all major residential end-use categories,
and can be easily promoted to trade allies and customers via straightforward prescriptive rebates.
Technologies incentivized through this subprogram include lighting, HVAC, other heating/cooling
equipment, smart thermostats, and other efficient products. The subprogram will also promote the
retirement, recycling, and replacement of old refrigerators, freezers, and other inefficient appliances.
PSE&G will offer enhanced incentives for Low-to-Moderate income (LMI) customers (up to 400% of
federal poverty level) for certain products to enable the program to reach all customer types. Eligibility
for these enhanced incentives can be determined based on screening an individual customer however
PSE&G will also implement automatic eligibility for enhanced incentives based upon a physical location
(e.g. properties located in low and moderate census tracts, environmental justice community, Urban
Enterprise Zone) to increase PSE&G’s presence in LMI communities. Customer eligibility based on the
property location in a low-income and moderate-income U.S. census tract can be determined by inputting
individual addresses and accessing U.S. census tract maps available at the Federal Financial Institutions
Examination Council website at https://geomap.ffiec.gov/FFIECGeocMap/GeocodeMap1.aspx.
Delivery Method PSE&G will use its brand, its customer outreach infrastructure, and its marketplace relationships to increase
the availability, awareness, and customer uptake of energy efficient products. On-bill repayments will be
available to customers to cover the remaining cost (after applying the rebate discount) for the balance of
the efficient product cost for select products and services.
A third-party implementation contractor(s) will be selected to assist with the administration, oversight, and
delivery of the subprogram. This contractor will assist in the expansion of the PSE&G branded online
marketplace, will work to promote the subprogram through word-of-mouth, advertising, and awareness,
and will work with PSE&G to review and adjust the product and service list. These activities will occur
prior to commercial operation and during the delivery of the subprogram. The third-party implementation
contractor will also assist in securing partnerships with retailers, wholesalers, and trade allies to assure all
PSE&G customers are able to easily purchase energy efficient products and equipment through the
subprogram. Customer engagement and sales channels may include:
Point of Sale Rebates: Prescriptive rebate applications will be made available at the point of sale.
PSE&G will explore the viability of using a digital, smartphone-based application platform, to
enable customers to purchase efficient equipment at traditional consumer retail outlets and instantly
redeem rebates at point-of-sale in both physical stores and online. Allowing easy access to rebates
encourages customers to purchase qualifying efficient products. Appliance recycling will also be
available to customers whereby they may schedule a pick-up to have eligible inefficient appliances
(e.g. old refrigerators) removed and a rebate issued.
Post Purchase Rebates: Rebates will also be made available to customers after they have made
their purchase. Applications will be available online to submit either electronically or in hard copy
with proof-of-purchase.
Online Marketplace: PSE&G will expand the self-branded online marketplace currently being
deployed for the EE2017 Smart Thermostat Program to incorporate other products and services in
this direct-to-customer platform. This online marketplace is a branded, easy to use source for the
online purchase of efficient products and services. Participants will be able to browse energy
efficient equipment and appliances and purchase through the marketplace which will offer instant

ATTACHMENT 1
4
rebates and the option for on-bill repayments on purchases above a certain threshold. PSE&G will
validate customer eligibility prior to applying rebates.
Midstream Rebates: PSE&G will promote a midstream rebate component to encourage purchase
of efficient equipment via directly marking down the price of the efficient equipment at the point
of sale. PSE&G will work with retail partners (such as Home Depot, Lowes, etc.) to assure that
marked down measures are available throughout the PSE&G service territory. Midstream rebates
encourage market transformation and wider availability of efficient equipment. Efficient products
that are rebated via a midstream approach will not be eligible for retail channel rebates.
Trade Allies: PSE&G will establish a network of trade allies to promote and deliver the
subprogram with a consistent experience to the customer. The trade ally network will consist of
qualified installation contractors, plumbers, electricians, and other trade service professionals.
Trade allies will be able to leverage the subprogram and offer customers rebates through their
normal course of business. In addition, PSE&G will refer customers to a list of qualified trade
allies. By allowing participants to select a trade ally they are comfortable with (either through an
existing relationship or by reference from PSE&G), the subprogram reduces barriers to entry
related to knowledge of energy efficiency, confidence in assessments, and measure installation.
PSE&G will qualify entities to participate in the trade ally network and oversee trade ally
performance to verify quality standards are met.
By developing relationships with trade allies, the subprogram will develop a broad reach across the
marketplace, and also solicit feedback from the marketplace to ensure incentives and measures are
impacting the market as designed. Targeted trade ally firms may include:
HVAC & appliance distributors, contractors, and retail providers
General contractors, plumbers, electricians, and other trade service professionals
Regardless of the delivery mechanism, PSE&G will take steps to ensure customers are made aware of
PSE&G's engagement in helping to off-set up-front costs of the efficient products.
Proposed Incentives PSE&G proposes to provide a range of incentives depending on the measure type, subject to changes based
upon customer response and marketplace changes over the plan period. Incentives will vary depending on
the specific product, the incremental cost of the high-efficiency technology, and the product maturity in the
marketplace. Incentive levels will be reviewed periodically with the input of subprogram staff and broader
feedback from the marketplace to ensure incentive design is optimally driving energy savings across offered
measures, while minimizing any potential free ridership.
Incentives will be available in several ways and are adapted to the retail partner needs and market response.
The strategies that might be used include:
Mail-in applications available from the retailer/contractor and the subprogram website
Online rebate forms
In-store “Instant Reward” coupons that are redeemed in-store at the time of purchase.
Special sale events in retail stores
Manufacturer buy down to Retailer
Midstream incentives to retailers to encourage them to carry and stock efficient products
Incentives may change based on market prices, as well as manufacturer and distributor co-funding. Other
incentive alternatives may be used as the market evolves and new and innovative customer and trade ally
engagement opportunities become apparent.

ATTACHMENT 1
5
Marketing Approach PSE&G will implement a multi-pronged direct and indirect marketing campaign to promote this
subprogram. Customers will be exposed to broad-based energy efficiency awareness campaigns, web-based
engagement and information, digital advertising, and hard-copy materials to promote awareness, as well as
tie-ins with other PSE&G subprograms. Retailers, wholesalers, and trade allies will be contacted directly
and through trade associations to develop networks and promote involvement in the subprogram. PSE&G
will also look to leverage the behavior subprogram for ‘warm leads’ into the subprogram through both the
home energy reports and online audit tool. Finally, appliance recycling will provide customers with rebates
that can be redeemed in the online marketplace, further driving customer incentive and participation in the
subprogram.
Targeting and promotion within the subprogram will be enabled through intelligence gained through other
residential subprograms, primarily Behavioral, Existing Homes, and other activity in the Efficient Products
Subprogram. Integrated IT solutions will enable PSE&G to provide customized information to customers
with prioritized action items, to maximize availability and uptake.
A combination of strategies will be used to train and support retailers, including media advertising, outreach
community forums, events, and direct outreach to customers and retailers. Marketing activities include:
Point of purchase displays and materials, joint advertising with retailers, coupons, and special
“instant sales events”
Public relations materials
Brochures that describe the benefits and features of the subprogram including application forms
and processes. The brochures will be available for various public awareness events (presentations,
seminars etc.)
Bill inserts, bill messages, email messages, Facebook and Twitter, pop-up stores.
Company website content providing subprogram information resources, contact information,
online application forms, online retail store and links to other relevant service and information
resources
Customer representatives trained to promote the subprogram to their customers
Presence at conferences and public events used to increase general awareness of the subprogram
and distribute subprogram promotional materials
Contractor Role PSE&G will oversee the build-out of the online marketplace as well as the retail and Trade Ally network,
which will be administered by third-party implementation contractors. A third-party implementation
contractor will be responsible for identifying and engaging retail and wholesale entities dealing in energy
efficient equipment to on-board them with the PSE&G subprogram vision, eligible efficient products,
rebates, and ways to participate. Additionally, the third-party implementation contractor will engage trade
allies, including local construction, electrical, plumbing, and other contractors to educate them on
subprogram benefits and build an approved trade ally network which will reliably install energy efficient
equipment for participating customers. The third-party implementation contractor will also monitor
participation to assess the effectiveness of outreach efforts, incentive levels, delivery methods, and trade
ally availability to provide suggestions to assure that the subprogram is continually providing PSE&G
customers with their needs. A third-party implementation contractor will be responsible for the management
of the online marketplace. This third-party implementation contractor will also process the online instant
rebates, verify eligibility of customers and manage the delivery of items purchased on the website.

ATTACHMENT 1
6
To select qualified third-party implementation contractors, PSE&G will prioritize criteria including but not
limited to:
Experience delivering similar subprograms or initiatives
Resources and marketing strength
Cost effectiveness
1.1.2. Residential Existing Homes The Residential Existing Homes Subprogram provides a holistic approach for customers to explore and
invest in the efficiency and comfort of their homes. Under the Residential Existing Homes Subprogram,
participants undergo an energy audit and receive free installation of low-cost direct install energy efficiency
measures, as well as an energy efficiency action-plan that includes recommendations for potential upgrades
and available incentives. The audit will be incentivized, while the work to complete recommended energy
efficiency measures will receive rebates with the ability for customers to use on-bill repayments for the
balance of the costs. Home energy audits will be conducted by PSE&G and/or local trade allies (including,
e.g. home improvement contractors) that are qualified to perform comprehensive home assessments, and a
follow-up audit may be conducted after completing home energy improvements to verify proper installation
and function of home efficiency improvements.
This subprogram is designed to review the entire status of a home, including equipment and envelope to
achieve deeper energy savings than the Residential Efficient Products Subprogram. The subprogram will
follow guidelines and qualifying criteria associated with the U.S. Environmental Protection Agency Home
Performance with ENERGY STAR (HPwES) program subject to as-needed enhancements to maximize
participation and cost-effective energy savings opportunities.
Market Segment/Efficiency Targeted The Residential Existing Homes Subprogram will be available to all single-family and single-family
attached electric and/or natural gas customers in the PSE&G service territory. Potential measures
incentivized through this subprogram include but are not limited to insulation, air sealing, lighting, smart
thermostats, low-flow devices, smart strips, and HVAC. This subprogram will drive deeper levels of
activity and investment in homes than the Residential Efficient Products Subprogram by including a suite
of home performance measures and the advice of PSE&G and/or qualified trade ally professionals that can
identify efficiency opportunities in residential homes.
In addition to the comprehensive approach described above, a Quick Home Energy Check-Up (QHEC)
option may be offered, to help customers understand their best opportunities to save energy through an in-
home consultation and also secure energy savings during that visit through the direct installation of energy
saving measures. It will be designed to help renters as well as homeowners and promotes additional energy
savings opportunities and upgrades available to the customer.
Delivery Method The subprogram will be managed by a third-party implementation contractor as outlined in detail in the
Contractor Role:
In-Home Energy Audit: In-home energy audits are conducted by PSE&G and/or local trade allies.
During the audit, customers will receive free installation of low-cost measures, such as LED
lighting, low-flow devices, and smart strips at no additional cost, in addition to behavioral
suggestions to improve efficiency of the home and a review of thermostat set points. Smart

ATTACHMENT 1
7
thermostats may be made available while the auditors are on premises through the Residential
Efficient Products Subprogram. Following the in-home audit, the participant will be provided an
energy efficiency action-plan that summarizes the findings of the audit and recommends
technology and building performance improvements that will maximize the efficiency of the home.
This report will also include detail regarding estimated cost, available rebates, and availability of
on-bill repayment.
In-Home Efficiency Improvements: If the customer chooses to pursue some or all of the
recommended home efficiency measures, a second appointment will be scheduled to implement
the measures. At the completion of the work, PSE&G and/or the trade ally will test the home to
validate the energy savings and to ensure that all mechanical equipment is operating safely.
Subprogram management staff, including the third-party implementation contractor, may spot
check installations as needed.
Local Trade Ally Network: The local trade ally network will be qualified, trained, and managed
by the third-party implementation contractor, and may deliver audits and/or energy efficiency
services.
Measures from the Residential Efficient Products Subprogram, such as home appliances (e.g. clothes
washers) may be installed by PSE&G and/or the trade ally if requested by the participant and if within the
scope of services. These measures are not typically addressed in a home performance subprogram because
they are generally only replaced at end-of-life.
Proposed Incentives PSE&G will provide a subsidized in-home audit, as well as a suite of low-cost direct-install measures.
Home performance measures recommended by PSE&G and/or the trade ally carry incentives that will be
available individually but may also be offered as part of bundled performance incentives depending on
customer interest and budget. If utilized, home performance incentives will be structured on the basis of
estimated total energy reduction in the home and the total cost of installed measures, such that customers
can receive an overall, packaged incentive that is subject to a maximum of either a specific cap, to be
evaluated and modified periodically, or a percentage of total installation cost. On-bill repayment will also
be available to qualified customers to reduce upfront cost barriers. In order to use on-bill repayments,
participants will be evaluated to determine their risk and ability to repay. In coordination with the Joint
Utilities, PSE&G will establish qualification minimums for on-bill repayments, which may include bill
payment history.
Marketing Approach
PSE&G will utilize many marketing avenues to assure subprogram awareness and participation is
maximized. These include traditional marketing avenues, such as web-based engagement and information,
digital advertising, media advertising, and hard-copy materials to promote awareness among trade allies
and customers. An additional marketing pathway PSE&G plans to utilize is through the network of other
subprograms being offered in the CEF-EE Program. The integration of all subprograms will allow for direct
marketing to customers through the Residential Behavioral and Residential Efficient Products
Subprograms. The connections with these subprograms also provides two-way marketing potential, in that
customers engaged in the Residential Behavioral and Residential Efficient Products Subprograms will be
provided with information and literature about the opportunity to participate in the Residential Existing
Homes Subprogram. Information garnered from subprograms, such as the Residential Behavioral and
Residential Efficient Products could be used to identify prime candidates for participation in the Residential
Existing Homes Subprogram. For example, a review of usage data contained in HERs from the Residential
Behavioral Subprogram could allow PSE&G to identify customers who are particularly susceptible to
changes in weather, and would be ideal candidates for an audit. Likewise, the Residential Efficient Products
Subprogram could provide leads to customers interested in energy efficiency.

ATTACHMENT 1
8
Contractor Role PSE&G will supervise the subprogram, as well as select a third-party implementation contractor to manage
the subprogram.
The third-party implementation contractor will oversee all aspects of the subprogram, including training
and engagement, QA/QC, and rebate processing (including measures installed during audits). A large part
of the third-party implementation contractor will focus on developing, training, and growing a qualified
trade ally network. This will include trade ally training sessions, workshops, and market development
events to grow and develop the trade ally network, with a priority placed on encouraging them to integrate
home efficiency performance into their business and become Building Performance Institute (BPI) and
ENERGY STAR certified contractors. The third-party implementation contractor will maintain a close
relationship with entities delivering the audits and efficiency measures to ensure consistent subprogram
delivery experience and high customer satisfaction. The third-party implementation contractor will also
take on the responsibility of providing an additional layer of customer support as needed and conducting
selective verification of trade ally installation work.
The trade ally marketplace may consist of companies in the fields of residential HVAC, home improvement,
weatherization and insulation, and other relevant areas. In order to facilitate trade ally access to participants,
PSE&G or the third-party implementation contractor will administer a web portal where customers can find
local trade allies based on geography and other criteria.
To select a qualified third-party implementation contractor PSE&G will prioritize criteria including but not
limited to:
Experience delivering similar subprograms or initiatives, especially ENERGY STAR certified
programs
Knowledge of the current marketplace
Ability to educate and train contractors
Local presence
Cost
1.1.3. Residential Behavioral The Residential Behavior Subprogram will provide customers with granular and easy-to-understand
information about their energy use, a comparison of their usage against other similar customers, and
suggested action steps to generate awareness and motivate customers to produce energy savings through
behavioral changes and engagement with other efficiency subprograms.
Direct mailed and/or electronic home energy reports (HERs) will be the cornerstone of the subprogram and
will provide participants with customized, easy-to-implement action steps and recommendations to reduce
energy consumption and support behavior modification for improved energy efficiency. The HERs will
present participants with a view of their historical energy consumption compared to peer group customers.
High usage alerts will also be issued by email to customers when weather patterns and other data indicate
their next bill is trending higher, and provide the customer with tips to manage their usage.
The subprogram will also offer an internet-based home energy self-audit to all residential customers. This
audit will allow customers to better understand their energy usage and their opportunities for energy
savings.

ATTACHMENT 1
9
An online portal will be used to provide customers with usage information, recommendations, tips, and
links to energy efficiency subprograms provided by PSE&G, including the online marketplace with access
to the Residential Efficient Products Subprogram and the Residential Existing Homes Subprogram. The
online customer portal will integrate the information from the HERs and online audit to further assist
customers as they look to realize deeper equipment and appliance-based savings. PSE&G will utilize the
information gathered from the HERs and online audits to not only better understand the residential customer
base, but also assist in making smart decisions moving forward with the energy efficiency subprograms.
Information on customers participating in other subprograms such as the Residential Efficient Products and
Residential Existing Homes Programs will be linked into the HERs as to provide up-to-date information
and recommendations to participants.
Market Segment/Efficiency Targeted The subprogram will provide HERs to a minimum of 650,000 residential customers. This quantity of
customers represents the number of unique customers in the program. These customers will receive multiple
home energy reports per year, in accordance with best practices in the industry This quantity of customers
will be reviewed periodically and modified as needed to maximize cost-effective energy savings. The online
energy audit will be available to all PSE&G electric and/or natural gas residential customers. The HERs
and online audit will offer tailored recommendations to reduce electric and/or natural gas consumption.
The subprogram may also provide HERs to participants of other residential subprograms, such as
Residential Efficient Products and Residential Existing Homes. The subprogram will primarily target single
family homes; however, PSE&G may also evaluate potential in the multi-family and income eligible
markets.
Delivery Method PSE&G will extend its current Data Analytics Subprogram to additional customers using a selected HER
vendor.
PSE&G's HER vendor will identify and distribute HERs to residential customers at no charge to the
participant. The online audit will be available for all PSE&G residential customers free of charge. High
usage alerts will be provided to customers receiving HERs via email to customers for whom PSE&G has a
valid email address.
Proposed Incentives All services under this subprogram will be provided at no cost to the customer.
Marketing Approach The recipients of the HERs will be selected by PSE&G, its selected HER vendor, and its evaluation
contractor. The online audit will be marketed through bill-insert mailers, digital advertising, and other
means to assure that all customers are aware of the availability of these resources. Participants in other
PSE&G energy efficiency subprograms will be referred to the online audit tool and online portal as
appropriate.
Contractor Role PSE&G will utilize a third-party implementation contractor to provide the services under this subprogram
including HERs, the portal, the online audit, and high usage alerts.

ATTACHMENT 1
10
1.1.4. Residential Income Eligible The Residential Income Eligible Subprogram is targeted at customers whose household income is less than
or equal to 400 percent of the Federal Poverty Level (FPL). Properties located within low and moderate
income census tracts will also be eligible for this program. The subprogram will complement, and not
duplicate or compete with, the Co-Managed Comfort Partners Program. The Residential Income Eligible
Subprogram provides free direct installation of energy efficient technologies and weatherization services
to qualifying PSE&G customers with limited income. The subprogram generates energy savings for
residential lower-income customers through an in-home energy audit and the direct installation of a wide
range of energy efficiency measures such as efficient lighting, efficient refrigerators, HVAC, as well as
weatherization upgrades for air-sealing and attic and wall insulation. The subprogram also provides for the
installation of health and safety measures as appropriate, and may also include actions to address building
shell issues that prevent the installation of energy efficiency measures, such as moisture/mold remediation,
roof repairs, electrical repairs, and asbestos remediation, consistent with the approach under the New Jersey
Comfort Partners Procedure Manual.
In addition to the core subprogram attributes described above, the subprogram will also provide for the
distribution of free LED light bulbs via food banks/pantries or other distribution venues that serve income
eligible customers, along with educational information on energy efficiency. The subprogram will
coordinate low-income services with local, state and federal agencies to provide comprehensive assistance.
The subprogram may also seek to work with workforce development organizations, in order to provide a
sufficient pool of qualified workforce that will be required to support a significant growth in energy
efficiency services.
Market Segment/Efficiency Targeted The Residential Income Eligible Subprogram targets residential customers in PSE&G’s electric and/or gas
service territory whose household income is less than or equal to 400 percent of the Federal Poverty Level
(FPL) and those properties located within low and moderate income U.S. census tracts. Customers who
receive Federal Supplemental Security Income (“SSI”), Home Energy Assistance (“HEAP”), Universal
Service Fund (“USF”), Lifeline, Pharmaceutical Assistance to the Aged and Disabled (“PAAD”),
Temporary Assistance to Needy Families (“TANF”), or Section 8 Housing will also be eligible.
Delivery Method This subprogram will be managed by PSE&G with the support of a qualified third-party implementation
contractor with experience delivering services in similar subprograms. It is envisioned that PSE&G’s third-
party implementation contractor will facilitate subprogram delivery across the multiple subprogram
vendors as well as PSE&G’s workforce. Eligible customers will receive an in-home energy assessment
from PSE&G. The applicable measures and services will be installed either by subprogram vendors, or by
PSE&G’s workforce. PSE&G, with its third-party implementation contractor will be responsible for
activities including, but not limited to, the following:
Ensuring customers meet eligibility requirements
Marketing collateral development and deployment
Reviewing, approving, and tracking of documentation for completed projects
Payment processing, fund management, and reporting
Quality assurance of technical and procedural subprogram guidelines
Budgeting, goal tracking, and reporting
Call center services
Customer satisfaction and problem resolution
Provide technical training to workforce

ATTACHMENT 1
11
Proposed Incentives Equipment and installation costs for all eligible measures will be provided free to eligible customers, subject
to subprogram terms and conditions.
Among the measures to be considered for each home are efficient lighting products; hot water conservation
measures (water heater replacement and tank temperature turn-down); replacement of inefficient
refrigerators and freezers; installation of programmable and smart thermostats; insulation upgrades (attic,
wall, basement, etc.); blower-door guided air sealing; duct sealing and repair; heating/cooling equipment
maintenance, repair and/or replacement; and other measures as may be needed to enable the installation of
energy efficiency measures (e.g. repair or replacement of a broken window, repair of a hole in the wall
and/or roof, mold remediation, or the installation of rain gutters).
Failed or failing heating or cooling systems can be replaced for efficiency and/or health and safety reasons,
on a case-by-case basis, as subprogram funds permit. For customer homes that require treatment beyond
the scope of the subprogram, such services may be coordinated with other agencies.
Marketing Approach Marketing efforts will be focused toward property owners, non-profit organizations, churches, and
community organizations to bring awareness to the subprogram and initiate effective participation. Key
elements of the marketing strategy include:
Targeted outreach through local agencies
Websites and newsletters
Press releases
Posters in municipal buildings
Neighborhood canvassing
Contractor Role PSE&G will administer and manage the overall subprogram with the support of a third-party
implementation contractor(s). The third-party implementation contractor will have responsibility for
delivery tasks and customer outreach on behalf of PSE&G. To select a qualified third-party implementation
contractor, PSE&G will prioritize criteria including, but not limited to:
Experience delivering similar subprograms or initiatives
Third-party staff qualification for delivering low-income energy efficiency subprograms
Cost
1.2. Multifamily Sector Subprogram
1.2.1. Residential Multi-Family The Residential Multi-Family Subprogram provides a turnkey service for multi-family property owners,
managers, and the residents of multi-family facilities to help improve the energy efficiency of their facilities
and reduce their operating costs. This service provides direct installation of energy-efficient measures in
individual living units. The primary measures to be installed include LED lighting, low-flow showerheads
and faucet aerators, and smart power strips. The subprogram will also provide literature on energy saving
tips achieved through other behavioral actions (e.g. thermostat settings, maximizing dishwasher and clothes
washer loads, etc.).

ATTACHMENT 1
12
Market Segment/Efficiency Targeted The subprogram targets multi-family property owners, property managers, and residents. All multi-family
buildings with three or more units in PSE&G’s electric or natural gas service territory are eligible to
participate, although it is anticipated that the majority of participating units will be from low income or
moderate income multi-family units, and will have 12 or more units.
The subprogram will look to achieve direct, easy to install, energy savings through the provision of
measures such as LED lighting, low-flow showerheads and faucet aerators, and smart power strips.
Delivery Method The Multi-Family Subprogram will be delivered by PSE&G and/or a qualified third-party implementation
contractor with experience delivering similar subprograms. The subprogram manager will recruit multi-
family property owners and oversee the direct installation of free low-cost measures (e.g. lighting,
showerheads) in individual units. The service is provided at no cost to property owners or occupants. This
subprogram design (including the provision of no cost services) is intended to overcome market barriers
and assure that benefits are provided to tenants.
PSE&G and/or the implementation contractor will be responsible for activities including, but not limited
to, the following:
Developing relationships with property management companies, owners, associations, and their
members to recruit participants
Training, education, and coordination with direct-install staff and/or contractors
Marketing collateral development and deployment
Procuring energy efficiency equipment and materials
Reviewing, approving, and tracking of documentation for completed projects
Quality assurance of technical and procedural subprogram guidelines
Budgeting, goal tracking, and reporting
Customer satisfaction and problem resolution
Provide notice to tenants and property owners prior to conducting work
Proposed Incentives Equipment and installation costs for all measures directly installed in tenant units will be provided free to
eligible properties.
Marketing Approach The marketing strategy will focus on informing property owners, managers, associations, tenant groups,
municipalities, and community organizations about the availability and benefits of the subprogram and how
to participate. Marketing activities will be focused on serving the lower income multi-family sector. Key
elements of the marketing strategy include:
Targeted outreach through direct mailings and presentations to inform property owners, managers,
apartment associations, tenant groups, municipalities and community organizations about the
benefits of the subprogram and participation processes
Brochures highlighting the benefits and features of the subprogram as well as the participation
processes
Website content providing subprogram information resources and contact information
In-person visits by subprogram representatives to properties with three or more units

ATTACHMENT 1
13
Walk-through energy assessments of properties to encourage the building owners or facility
managers to allow participation in the direct installation component of the subprogram as well as
encourage participation in the other PSE&G efficiency subprograms
Contractor Role PSE&G will administer and manage the overall subprogram. Depending on the final design of the delivery
process, PSE&G may utilize the support of a third-party implementation contractor(s). In this event, the
third-party implementation contractor will have responsibility for delivery tasks and customer outreach on
behalf of PSE&G.
Key elements of the implementation strategy and core responsibilities of the implementation contractor
may include:
Targeted Outreach to Property Owners: Subprogram representatives will build relationships
with property management companies, owners, associations and their members to recruit
participation in the subprogram. The subprogram team will assist customers as necessary to
coordinate direct installations and complete rebate application requirements. In addition, property
owners will be reached through direct mail, participation in association events, one-on-one
meetings with subprogram staff, and other channels. Special emphasis will be placed on properties
with as little as three units and greater. This has been traditionally an over-looked segment in other
utility-run subprograms around the country.
In-Unit Direct Installs: Subprogram representatives will identify interested property owners and
schedule appointments for the free installation of energy saving devices in the individual living
units and common areas. In-unit HVAC tune-ups will be offered at no cost to the property owner
or tenant. The installation crews are trained on the technical and educational aspects of the energy
saving devices installed and leave educational materials in each unit describing the work performed
and explaining the energy-saving benefits.
Subprogram Operations: The third-party implementation contractor handles implementation
related administrative requirements, including the following:
o Marketing and educational materials
o Field services
o Product ordering and inventory
o Data tracking and reporting
o Investment tracking and reporting
o Prescriptive, custom and comprehensive application processing
o Trade ally and customer outreach/training
o Customer satisfaction/problem resolution
To select a qualified third-party contractor, PSE&G will prioritize criteria including but not limited to:
Experience delivering similar subprograms or initiatives
Third-party staff qualifications
Cost
In the event PSE&G delivers the program with its own workforce, contractor role would be minimal, limited
to customer acquisition and alignment with other subprograms.
1.3. Commercial & Industrial Sector Subprograms

ATTACHMENT 1
14
PSE&G’s commercial and industrial customers are very diverse. These subprograms address each segment,
including those with limited time and resources to make efficiency improvements. The subprogram designs
are intended to enable PSE&G to address the unique needs of each sub-sector. For example, if a large
customer has ready access to financing and more advanced approaches to energy management, PSE&G
will offer customized financial support to reduce paybacks on investments and bring about increased
installation of measures. For small businesses or municipal customers, PSE&G will provide more
substantial management, financial support, and on-bill repayment.
1.3.1. C&I Prescriptive The C&I Prescriptive Subprogram will promote the installation of high-efficiency electric and natural gas
equipment by C&I customers. The subprogram is designed to:
Provide incentives to facility owners and operators for the installation of high efficiency equipment
and controls
Provide the knowledge necessary and market demand to justify the marketing of high efficiency
measures by participating trade allies such as electrical contractors, mechanical contractors, and
their distributors
Ensure the participation process is clear and simple
The subprogram will offer a broad range of energy efficient equipment and appliances through a variety of
channels, including reduced point of sale costs, and a network of trade allies. The subprogram will incent
energy efficient lighting, appliances, heating and cooling equipment, and food service equipment, among
other efficiency measures. These measures will range in type and price but include both electric and natural
gas technologies that improve energy efficiency. Up-front rebates will be offered on all technologies to
reduce initial costs and some purchases will qualify for on-bill repayments to further reduce first cost
barriers. The subprogram is designed to provide easy and cost-effective access to energy efficient measures
through customers' preferred channels.
This subprogram will significantly increase adoption of energy efficient equipment by harnessing PSE&G’s
unique customer relationships to positively impact the entire sales process surrounding efficient equipment,
from education and awareness with customers, engagement with trade ally contractors and equipment
distributors, to on-bill repayments and final installation and commissioning of the high efficiency
equipment.
Market Segment/Efficiency Targeted The C&I Prescriptive Subprogram will be available to all commercial, industrial, and other non-residential
electric and natural gas customers located within PSE&G’s service territory. The subprogram is focused on
promoting the sale and installation of efficient electric and natural gas equipment across all major end-use
categories and can be easily promoted to trade allies and customers via straightforward prescriptive rebates.
Potential technologies incentivized through this subprogram include energy efficient lighting, appliances,
heating and cooling equipment, and food service equipment, among other efficiency measures.
Delivery Method To maximize customer participation and streamline the customer experience, PSE&G will use its strong
customer and marketplace relationships to support multiple implementation strategies to achieve
subprogram goals.
Trade Allies: PSE&G will establish a network of trade allies (e.g. electricians, HVAC contractors,
lighting retailers and distributors, building energy managers, etc.) to promote the efficiency
opportunities and incentives to their clients, and deliver the subprogram with a consistent

ATTACHMENT 1
15
experience to the customer. Trade allies will be able to leverage the subprogram and offer customers
rebates through their normal course of business. In addition, PSE&G or the third-party
implementation contractor can refer customers to a list of qualified trade allies to perform more
intricate work. By allowing participants to select a partner they are comfortable with (either through
an existing relationship or by reference from PSE&G or the third-party implementation contractor),
the subprogram reduces barriers to entry related to knowledge of energy efficiency, confidence in
assessments, and measure installation. PSE&G will oversee trade ally performance to verify quality
standards are met and qualify contractors to participate in the Trade Ally network. By developing
relationships with trade allies, the subprogram will develop a broad reach across the marketplace,
and also solicit feedback from the marketplace to ensure incentives and measures are impacting the
market as designed. Examples of targeted trade ally firms include:
o Design, engineering, and controls firms
o HVAC distributors, contractors, and retail providers
o Food service retailers and service providers
o Commercial lighting distributors and wholesalers
Retail: PSE&G subprogram staff, third-party implementation contractors, and field representatives
will work with retailers and distributors that directly target C&I customers so they are aware of the
participation process and available equipment incentives. This will include training and instruction
to participating retailers and distributors about the PSE&G prescriptive rebate forms as well as
enrollment of distributors to participate in midstream subprogram offerings.
Midstream: PSE&G will aggressively promote a midstream component for specific equipment
types to encourage purchase of efficient equipment via directly marking down the cost of the
efficient equipment at the point of sale. Midstream rebates encourage market transformation and
wider availability of efficient equipment. PSE&G anticipates offering midstream point of sale
discounts across numerous equipment types, including, but not limited to: LED lighting, HVAC,
and food service equipment. Efficient products that are rebated via a midstream subprogram
approach will not be eligible for rebates in any other PSE&G rebate subprogram.
Digital: The subprogram will be marketed directly to C&I customers on the PSE&G website, where
customers will have easy access to information regarding eligible equipment and savings
opportunities, how to participate, and incentives across all efficient equipment types and end-uses.
In addition, the website will offer information on qualified local trade allies to enable easy access
to equipment retailers for customers.
Rebate-as-a-Service: PSE&G will evaluate the viability of using a digital, smartphone based
application platform, where business customers purchasing efficient equipment for commercial use
at traditional consumer retail outlets can instantly redeem rebates at point-of-sale in both physical
stores and online. This channel will help PSE&G offer rebates to very small commercial customers
and local businesses outside of the C&I Small Non-Residential Efficiency Subprogram.
Targeted Customer Outreach: In select cases, PSE&G staff and its third-party implementation
contractor may choose to reach out directly to large business and commercial customers to develop
relationships with energy and facilities managers, operations staff, and procurement personnel.
Subprogram staff can help facilitate completion of rebate applications and serve as a direct resource
to these customers.
Proposed Incentives Incentive levels and the list of eligible equipment will be reviewed periodically with the input of
subprogram staff and broader feedback from the marketplace to ensure incentive design is optimally driving
energy savings across offered measures. Incentive levels will vary depending on the efficient measure, and
the unit level being rebated (e.g. incentives for equipment, and/or incentive based on the system size or
square footage where the system is being applied).

ATTACHMENT 1
16
Marketing Approach The C&I Prescriptive Subprogram will engage with customers and trade allies at multiple levels, including
broad-based energy efficiency awareness campaigns, direct outreach by subprogram staff and
representatives, web-based engagement and information, digital advertising, and hard-copy materials to
promote awareness among trade allies and customers. In some cases, subprogram staff and representatives
will reach out directly to large commercial customers. Use of appropriate types of media are anticipated to
be included in the marketing plan, such as direct mail, email, print, and digital media. Engagement with
trade associations (e.g. builders, architects, equipment distributors, professional contractor associations,
etc.) will all be important venues for PSE&G to present information about the subprogram, raise awareness
and encourage participation.
Contractor Role PSE&G will administer and manage the overall subprogram, including implementation of an on-bill
repayment offering, with the support of third-party implementation contractor(s). The third-party
implementation contractor will have responsibility for the majority of delivery tasks and customer outreach
on behalf of PSE&G. It is anticipated that this third-party implementation contractor will assist with
optimizing the subprogram’s strategic direction, including but not limited to:
Customer outreach/subprogram delivery strategy
Offered efficiency measures and efficiency levels
Promotion of emerging technologies
Incentive levels and strategies
Customer/trade ally/retailer engagement and enrollment in the subprogram
Marketing
Customer satisfaction
Equipment installation and subprogram data tracking
Rebate processing
1.3.2. C&I Custom The Commercial and Industrial (C&I) Custom Subprogram will offer incentives for electric and natural gas
efficiency opportunities for commercial, industrial, and other non-residential customers that are non-
standard and not captured by the C&I Prescriptive Subprogram, or any other proposed custom subprogram
offering including the C&I Engineered Solutions Subprogram. Typical measures incentivized by the C&I
Custom Subprogram are either less common measures or efficiency opportunities in specialized
applications that may include specialized manufacturing processes or non-traditional use cases. In many
cases, custom efficiency projects are more complex than prescriptive equipment replacement.
Large customers with facilities and engineering teams will develop and submit custom efficiency project
rebate applications for review. A third-party implementation contractor will also play an active role in
supporting project identification, developing energy savings calculations, and assessing project economics
as required. Potential participants are required to submit an application for pre-approval to reserve funding,
and if accepted by PSE&G, a timeline is established for project completion to qualify for a rebate. The
typical lead time for completing a custom project is 90 to 120 days. Large projects, or subsets of projects,
may be required to undergo pre-and post-inspection to validate project energy savings. Approved projects
will also be eligible for on-bill repayment support to further reduce first-cost barriers.
Market Segment/Efficiency Targeted The C&I Custom Subprogram targets all C&I customers in PSE&G’s electric and/or natural gas service
territory with cost effective savings opportunities that are not covered by the C&I Prescriptive or Small
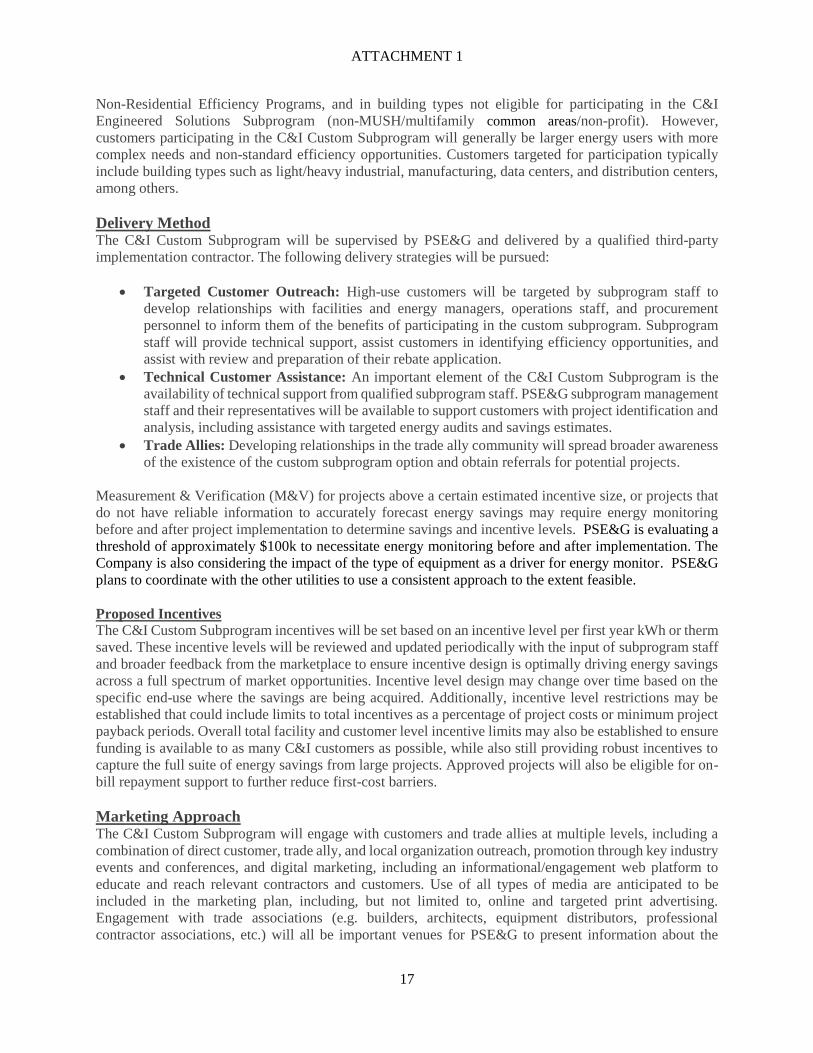
ATTACHMENT 1
17
Non-Residential Efficiency Programs, and in building types not eligible for participating in the C&I
Engineered Solutions Subprogram (non-MUSH/multifamily common areas/non-profit). However,
customers participating in the C&I Custom Subprogram will generally be larger energy users with more
complex needs and non-standard efficiency opportunities. Customers targeted for participation typically
include building types such as light/heavy industrial, manufacturing, data centers, and distribution centers,
among others.
Delivery Method The C&I Custom Subprogram will be supervised by PSE&G and delivered by a qualified third-party
implementation contractor. The following delivery strategies will be pursued:
Targeted Customer Outreach: High-use customers will be targeted by subprogram staff to
develop relationships with facilities and energy managers, operations staff, and procurement
personnel to inform them of the benefits of participating in the custom subprogram. Subprogram
staff will provide technical support, assist customers in identifying efficiency opportunities, and
assist with review and preparation of their rebate application.
Technical Customer Assistance: An important element of the C&I Custom Subprogram is the
availability of technical support from qualified subprogram staff. PSE&G subprogram management
staff and their representatives will be available to support customers with project identification and
analysis, including assistance with targeted energy audits and savings estimates.
Trade Allies: Developing relationships in the trade ally community will spread broader awareness
of the existence of the custom subprogram option and obtain referrals for potential projects.
Measurement & Verification (M&V) for projects above a certain estimated incentive size, or projects that
do not have reliable information to accurately forecast energy savings may require energy monitoring
before and after project implementation to determine savings and incentive levels. PSE&G is evaluating a
threshold of approximately $100k to necessitate energy monitoring before and after implementation. The
Company is also considering the impact of the type of equipment as a driver for energy monitor. PSE&G
plans to coordinate with the other utilities to use a consistent approach to the extent feasible.
Proposed Incentives The C&I Custom Subprogram incentives will be set based on an incentive level per first year kWh or therm
saved. These incentive levels will be reviewed and updated periodically with the input of subprogram staff
and broader feedback from the marketplace to ensure incentive design is optimally driving energy savings
across a full spectrum of market opportunities. Incentive level design may change over time based on the
specific end-use where the savings are being acquired. Additionally, incentive level restrictions may be
established that could include limits to total incentives as a percentage of project costs or minimum project
payback periods. Overall total facility and customer level incentive limits may also be established to ensure
funding is available to as many C&I customers as possible, while also still providing robust incentives to
capture the full suite of energy savings from large projects. Approved projects will also be eligible for on-
bill repayment support to further reduce first-cost barriers.
Marketing Approach The C&I Custom Subprogram will engage with customers and trade allies at multiple levels, including a
combination of direct customer, trade ally, and local organization outreach, promotion through key industry
events and conferences, and digital marketing, including an informational/engagement web platform to
educate and reach relevant contractors and customers. Use of all types of media are anticipated to be
included in the marketing plan, including, but not limited to, online and targeted print advertising.
Engagement with trade associations (e.g. builders, architects, equipment distributors, professional
contractor associations, etc.) will all be important venues for PSE&G to present information about the

ATTACHMENT 1
18
subprogram and raise awareness and encourage participation. The subprogram will leverage PSE&G’s
existing relationships and communication channels with customers through subprogram staff and account
management team.
Contractor Role PSE&G will administer and manage the overall subprogram, including implementation of an on-bill
repayment offering, with the support of third-party implementation contractor(s). The third-party
implementation contractor will have responsibility for the majority of delivery tasks and customer outreach
on behalf of PSE&G. It is anticipated that this third-party implementation contractor will work closely with
PSE&G to optimize the subprogram’s strategic direction, including, but not limited to, the following
activities:
Offered incentive levels and strategies
Customer satisfaction
Measurement and verification during on-site visits
Subprogram data tracking
Rebate payments
PSE&G will select a qualified third-party implementation contractor (or contractors) based on, but not
limited to, the following factors:
Technical Approach
Organizational and Management Capability
Experience
Cost
1.3.3. C&I Small Non-Residential Efficiency The C&I Small Non-Residential Efficiency Subprogram is focused on installation of efficiency measures
in small non-residential customers that typically lack the time, knowledge, or financial resources necessary
to pursue energy efficiency. The subprogram is designed to provide non-residential owners with easy
investment decisions for the direct installation of energy efficiency projects. The subprogram will pay the
up-front cost to install the recommended energy efficiency measures with the participating customer
repaying a portion of the cost either in a lump sum or interest-free on their PSE&G bill. The reduced overall
costs and on-bill repayments mitigate up-front cost barriers and assist participants in making decisions,
which otherwise would be time-consuming and difficult to justify. The C&I Small Non-Residential
Efficiency Subprogram plays an important role in the marketplace because private providers of energy
efficiency services typically do not target small non-residential customers due to the lower overall profit
for their services when compared with larger non-residential customers. For these reasons, small non-
residential customers are often hard to reach, and the subprogram fills an important gap by delivering
efficiency services to these customers directly.
The audit will be provided to customers free of charge and will offer recommendations on energy efficiency
projects to reduce energy usage and costs. The aggregation of this data will allow PSE&G to better
understand its customers and can be used to inform other subprograms and future subprogram designs, such
as the C&I Prescriptive Subprogram, the C&I New Construction Subprogram, and the Business Energy
Reports Pilot Subprogram.

ATTACHMENT 1
19
The subprogram will also focus on the smallest customers within the small business segment. PSE&G
anticipates portions of the subprogram to be directed at restaurants, small offices, and other small businesses
that often are left behind in less-comprehensive energy efficiency subprograms. Through a number of
delivery mechanisms, PSE&G will assure that all business types are able to participate in this subprogram.
Market Segment/Efficiency Targeted
PSE&G expects small non-residential customers with an average 12-month individual facility annual
electricity peak demand usage of less than 200 kW to be the eligibility threshold; however, this figure may
be adjusted by PSE&G up to 500 kW subject to Staff approval and alignment with the threshold established
by the Joint Utilities, to ensure the subprogram is properly addressing the market in PSE&G’s service
territory. The subprogram will also be structured to focus on and secure participants especially in the lower-
usage tiers.
The subprogram seeks to address high-return, relatively low-cost measures (e.g. LED lighting retrofits), but
customers may choose to pursue further retrofits that are eligible for additional incentives. Example end-
use categories covered by the subprogram include lighting, HVAC, controls, refrigeration, motors, low-
flow devices, pipe wrap and domestic hot water equipment.
Delivery Method The C&I Small Non-Residential Efficiency Subprogram interfaces with customers via either direct
solicitation or upon customer request. All participants receive a site visit, including a free on-site audit to
identify energy efficiency retrofit opportunities. Following the audit, participants are provided with a report
assessing the site and recommending investments that could further improve the energy efficiency of the
facility.
Based on the results of the audit report, the subprogram will offer to initially pay 100% of the project cost
to install the recommended energy efficiency measures with the participating customer (or landlord)
repaying a portion of the cost either in a lump sum or interest free on their PSE&G bill. PSE&G may adjust
the incentive structure to encourage deeper retrofits, as well as to encourage participation by micro-
customers. PSE&G will provide for the installation of all work and assure it is completed on time and to
specifications. This approach frees up the participant, which, as a small non-residential customer, may not
have the time or resources to focus on implementation issues.
The subprogram budget will be split into tranches based upon customer consumption size, or other
designated factors, to focus contractors to complete work on specific tranches. This will assure that non-
residential customers, even those that are the smallest and often overlooked, receive ample focus.
Contractors will be limited to specific tranches to assure minimum volumes and scale can be reached while
also providing for adequate cost effectiveness. PSE&G may also elect to provide additional contractor-
focused bonus incentives to further encourage contractor emphasis on specific sectors. The tranche
divisions will be implemented to combat contractors’ inherent focus on larger customer facilities. The
subprogram may also be marketed and structured into customer types. For example, one element of the
subprogram structure may focus on restaurants, while another is focused on convenience stores and
bodegas.
Proposed Incentives One of the key benefits of the subprogram is that it is a simple, turnkey solution for small non-residential
customers that requires no up-front customer investment. The initial site visit, energy audit, and installation
of recommended efficiency measures are provided at no initial cost to participants. This up-front incentive
value will be evaluated periodically to assure that the subprogram incentive is adequate and provides the
correct signal to the marketplace regarding energy efficiency. Participants will reimburse PSE&G a portion

ATTACHMENT 1
20
of total project cost interest-free through on-bill repayments, thereby eliminating the up-front cost burden
of installing energy efficiency measures. The incentive portion of the total project cost is up to 70%, with
the option to provide up to 80% incentive for underserved markets such as small businesses up to 100kW,
or customers in Urban Enterprise Zones, etc. PSE&G may adjust the incentive structure to encourage
deeper retrofits, as well as to encourage participation by micro-customers.
Marketing Approach The C&I Small Non-Residential Efficiency Subprogram will be marketed to customers through a
combination of direct outreach by subprogram staff and a third-party implementation contractor, web-based
engagement and customer information analytics, digital advertising, and hard-copy materials to promote
awareness among trade allies and customers. Direct outreach from a third-party implementation contractor
may include unsolicited visits to customer premises to distribute hard-copy subprogram materials, inform
customers about the subprogram directly, and solicit participation. This strategy is useful for enrolling small
non-residential customers that may be interested in participating, but have not heard of the subprogram and
do not have resources to prioritize reaching out to PSE&G.
PSE&G will evaluate the potential to utilize Business Energy Reports or customer information analytics to
identify and target customers best suited for participation in the subprogram.
Contractor Role PSE&G will administer and manage the subprogram with the support of third-party implementation
contractor(s). The third-party implementation contractor will have responsibility for the majority of delivery
tasks and customer outreach on behalf of PSE&G. It is anticipated that this third-party implementation
contractor will work closely with PSE&G to optimize the subprogram’s management and strategic
direction, including, but not limited to:
Initial participant recruitment, audit, and equipment installation
Subprogram data tracking
Direct customer outreach/subprogram delivery strategy
Development of measure mix
Marketing
Promotion of emerging technology
Customer satisfaction
The third-party implementation contractor will take on the responsibility of managing the subprogram,
directing the qualification of contractors, and will work to assure that ample contractors are available to
complete all work derived from the subprogram.
A group of selected vendors will perform the audits and installations, working with PSE&G and the third-
party implementation contractor’s oversight to undertake all construction and installation work identified
in the audit process.
1.3.4. C&I Energy Management The C&I Energy Management Subprogram includes two major subprogram initiatives: Retro-
commissioning and Strategic Energy Management. Both subprograms are designed to optimize energy
consumption in existing C&I buildings through management of major energy using systems, user behavior,
and low-cost, easy-to-install efficiency measures at the time of an initial site visit or a follow-up. In many
cases, revised building management processes can produce meaningful energy savings without capital

ATTACHMENT 1
21
investment in new equipment or controls; however, recommended investment areas may also be identified
through this subprogram. Details of the subprogram initiatives are as follows:
Retro-commissioning (RCx): Also known as ‘existing building commissioning’, retro-
commissioning focuses on identifying operations and maintenance improvements in existing
commercial buildings to ensure optimal performance of building systems and system interactions.
Retro-commissioning applies the same systematic process to buildings as is applied during initial
building commissioning, and may be performed every three to five years to ensure optimal building
performance. Retro-commissioning is typically among the most cost-effective energy savings
strategies applied in commercial buildings and may produce other non-energy benefits, including
extending the life of existing equipment and improving thermal comfort and indoor air quality.
Strategic Energy Management (SEM): This subprogram is primarily geared toward industrial
and manufacturing buildings and is a holistic approach to managing energy usage focused on
management of existing systems and processes (including behavior), as well as tracking and
benchmarking performance to identify and evaluate energy optimization efforts. SEM is a long-
term effort typically led by an external instructor focused on developing and executing an energy
management strategy via workshops, webinars, and group/individual training sessions with cohorts
of facility managers. SEM applies continuous improvement principles to energy management to
encourage and enable a culture of energy efficiency within an organization to develop measurable
long-term savings.
Market Segment/Efficiency Targeted All commercial, industrial, and other non-residential customers located within PSE&G’s electric and/or
natural gas territory are eligible to participate in this subprogram.
RCx targets the existing commercial building stock, and is particularly relevant for medium to large non-
industrial building types including office, lodging, education, healthcare, laboratory, warehouse/storage,
supermarkets, and more. The primary target market for the RCx subprogram will be C&I customers
utilizing a building management system.
SEM targets existing large and very large commercial and industrial customers and building types, and is
particularly relevant to large energy users engaged in manufacturing processes. For SEM to be successful,
the subprogram will invest significant resources upfront to focus on recruiting and pre-qualifying customers
to participate in the subprogram. SEM's objective is to change a company’s focus and engagement with
energy management over the long-term, in a continuous manner. A core goal is to recruit customers who
demonstrate genuine and committed interest in working with PSE&G over a long period of time. These
“energy champions” will ideally include multiple staff at each company, placed in different departments
and various levels of seniority and decision making in the company.
Eligible measures will vary depending on the business segment served, but are likely to include at least the
following:
Optimizing chiller and boiler operations to better match building load conditions
Reducing ventilation in over-ventilated areas
Fixing ventilation dampers that are open when they should be closed, or vice versa
System rebalancing and decreasing supply air pressure set-point
Reducing supply air temperature and fan speed in air handling units
Aligning zone temperature set-points to match the building’s occupancy patterns
Operating equipment only when building is occupied or when equipment is needed
Lighting controls including occupancy/vacancy controls, photo-sensors, and timer controls

ATTACHMENT 1
22
Delivery Method The RCx and SEM Programs will be delivered by a third-party implementation contractor(s). Both
subprograms require customer and trade ally involvement in the form of on-site access to existing
equipment, management protocols, and energy management/facilities staff.
To support the marketplace and develop a project pipeline, the following delivery strategies, among others,
will be pursued:
Targeted Customer Outreach: Subprogram staff and their representatives will make outreach
efforts directly to PSE&G customers that own or operate facilities identified by internal screening
activity as potential participants. Factors considered in initial screening may include building
age/size/type and historical energy use patterns.
Technical Customer Assistance: An important element of the C&I Energy Management
Subprogram is the availability of technical support, guidance, training and orientation from
PSE&G’s third-party implementation contractor(s). Subprogram staff will be available to support
customers and determine if they may qualify for participation for either RCx or SEM. Depending
on the customer’s goals and likely energy savings potential, significant customer engagement may
be undertaken for the SEM subprogram.
On-Site Implementation: Both the RCx and SEM subprograms require subprogram staff to visit
customer premises to identify energy savings opportunities (including through the logging and
analysis of energy consumption data) and develop strategies and solutions for acquiring these
savings.
The RCx subprogram will be delivered through a network of approved retro-commissioning service
providers (RSPs) operating in PSE&G’s service territory that have been trained in subprogram protocols
and participation processes. Once an application has been accepted, one of the expert engineering RSPs
conducts a detailed energy assessment to investigate and identify low-cost energy-saving operational
improvements through a systematic evaluation of energy using systems. RCx involves a series of steps to
qualify appropriate customers for participation and to ensure the subprogram will produce meaningful
energy savings. These steps may include:
Initial Customer Screening: Customer-submitted applications are reviewed to assess the
likelihood of energy savings. Customers may also be identified through a data analytics engine
using PSE&G data and through data acquired via the Business Energy Reports Pilot or other
methods.
Project Scoping: The building owner or primary representative will be contacted by PSE&G
subprogram staff or their representatives to schedule a time for an on-site visit. This visit will entail
inspecting the building and major energy using equipment, reviewing past energy consumption,
and identifying preliminary opportunities for energy-use reduction.
Agreement and Implementation: A rigorous evaluation of building systems is conducted and an
incentive agreement is finalized with the customer regarding project measures, implementation
strategy, and incentives.
Follow-up: Additional training may be provided to building owners/operators after completion of
an RCx project to ensure savings persistence.
Example SEM implementation efforts also include the following:
Onsite Energy Management Assessment: Identify current strengths and weaknesses in existing
energy management practices.

ATTACHMENT 1
23
Metering Training: Instruction on the use of metering equipment to identify energy saving
opportunities and an introduction to energy modelling.
Coach-led Training Sessions: Targeted at any combination of building operations/facilities staff,
management personnel, and other company staff, training sessions are used to build awareness and
detect inefficient operating practices.
Benchmarking: Energy consumption benchmarking is a key aspect of SEM, and both baseline and
ongoing energy use monitoring strategies are employed to encourage data-driven energy
management and short-term feedback.
Proposed Incentives Incentives will be reviewed periodically with the input of subprogram staff and broader feedback from the
marketplace to ensure the incentive design is optimally driving energy savings and participation. The
incentive design structure and payment per first year kWh and therm saved may be different between the
RCx and SEM subprogram participants. Additionally, incentive levels may vary depending on the end-use
where the savings are achieved, and the overall comprehensiveness and estimated longevity of the energy
savings. These incentives are subject to change based on final subprogram design and the go-to-market
implementation plan.
Marketing Approach The C&I Energy Management Subprogram will engage with customers at multiple levels, including
through a combination of direct outreach by subprogram staff and representatives, web-based engagement
and information, digital advertising, and hard-copy materials to promote awareness among trade allies and
customers. Engagement with building and facilities managers for large commercial and industrial customers
will all be an important pathway for PSE&G to present information about the subprogram, raise awareness,
and encourage participation. PSE&G’s brand and its relationships with these customer types will drive
participation. The subprogram will leverage PSE&G’s existing relationships with customers through
subprogram staff and account management team.
Education and promotional materials will be developed for building owners and operators to reinforce the
benefits of energy efficiency improvements and improved systems performance, including educational
brochures, customer and market provider seminars, subprogram promotional material, and website content.
The marketing strategy will identify key customer segments and vertical markets for targeting, and will
prepare specific outreach activities for these customers. The strategy will be designed to inform customers
of the availability and benefits of the subprogram and how they can participate in the RCx or SEM
subprograms.
The marketing and communications plan will include:
Creating and updating Subprogram Fact Sheets, Case Studies
Hosting an annual Subprogram product knowledge workshop
Participating in local conferences and industry events to promote the RCx and SEM programs
Contractor Role PSE&G will administer and manage the overall subprogram with the support of third-party implementation
contractor(s). The third-party implementation contractor will have responsibility for the majority of delivery
tasks and customer outreach on behalf of PSE&G. It is anticipated that this third-party implementation
contractor will work closely with PSE&G to optimize the subprogram’s strategic direction including, but
not limited to, conducting the following tasks:

ATTACHMENT 1
24
Customer outreach/subprogram delivery strategy
Select, train and manage network of RCx trade ally contractors
Energy modeling and equipment metering
Leading SEM coaching and engagement sessions
Incentive levels and strategies
Marketing
Customer satisfaction
Subprogram data tracking
Rebate processing
PSE&G will select a qualified third-party implementation contractor (or contractors) based on, but not
limited to, the following factors:
Technical Approach
Organizational and Management Capability
Experience
Cost
1.3.5. C&I Engineered Solutions The C&I Engineered Solutions Subprogram will provide tailored energy efficiency assistance to public
service entities, such as municipalities, universities, schools, hospitals (MUSH), non-profit entities and
multi-family facilities. The subprogram will provide expert-guided service throughout delivery to assist
customers in identifying and undertaking large energy efficiency projects on-site, while requiring no up-
front funding from the customer.
Through this subprogram, customers will be provided with an in-depth audit of their facilities, as well as a
detailed assessment and recommendation of energy efficiency measures that could be economically
installed. Customer incentives are determined on a project-by-project basis, and participants may select
their preferred installation providers. In addition to the calculated project-by-project incentive, participants
will have the option to pay back the non-incentive portion of the project costs through interest free on-bill
repayments over a period of five years (and ten years for HMFA qualified multi-family facilities). Through
this subprogram design, participants in market segments that have typically been underserved are able to
achieve greater energy savings.
Market Segment/Efficiency Targeted C&I public service (MUSH), non-profit, and multi-family entities located within PSE&G’s electric and/or
natural gas service territory are eligible to participate in this subprogram. The subprogram will provide
energy audits and incentives to entities that directly serve the public, but often have difficultly investing in
energy efficiency. The measures included in this subprogram may include HVAC, building envelope,
motors, lighting, controls, energy storage, and other energy consuming equipment.
Delivery Method PSE&G will retain qualified vendors to undertake the audit and engineering services required to deliver
this subprogram. Participants will contract with their preferred installation providers to install the measures
included in projects.
The subprogram delivery will typically occur in four steps:

ATTACHMENT 1
25
Audit: PSE&G shall assess the required level of American Society of Heating, Refrigerating, and
Air Conditioning Engineers (ASHRAE) audit to perform, based on the complexity of the facility
and the potential energy efficiency measures; an investment grade audit may not be required for all
facilities. The selected PSE&G vendor will then perform the appropriate level energy audit and
prepare a customized audit report that includes a list of recommended energy efficiency upgrades.
PSE&G and its representatives will then review the recommended energy efficiency upgrades with
the customer to determine whether to proceed with a project.
Engineering Analysis of Project: Based on the audit results, an engineering analysis may be
required. PSE&G will conduct a screening of the payback and project cost effectiveness and select
a set of approved energy efficiency measures for the project. The subprogram engineering vendor
will prepare bid-ready documents and work with the participant to prepare a project scope of work,
which will be used by the customer to obtain installation cost estimates for the project.
Scope of Work/Contractor Bids: The participant will issue a scope of work to obtain bids to
complete the identified project. PSE&G, the subprogram engineering vendor and the participant
will review and evaluate the bids/costs received, with the participant making the final decision on
bid selection. Following bid selection, the proposed project is again screened for cost effectiveness
and the participant is presented the funding commitment proposal from PSE&G. Once (i) the
participant and PSE&G have executed the funding commitment and (ii) the installation provider
and the participant have executed applicable agreements and contracts, the first progress payment
equal to approximately 30% of the installation cost can be issued to the customer to initiate the
project (Stage 1 Progress Payment).
Measures Installation and Inspections: PSE&G and the energy engineering vendor, acting as
construction administration agent, will monitor project progress. Upon verification of satisfactory
project progress, a series of Stage 2 progress payments up to 50% of total project commitment can
be issued. When the project is 100% complete, a final project true-up, and final inspection are
undertaken. The final payment based on the results of project true-up is determined and issued only
if the final inspection is successfully completed and approved. If the final costs are less than the
estimated project commitment, the final payment will be adjusted down to reflect the actual costs.
If the final costs are greater than the estimated project commitment, the final payment will not be
adjusted and will be paid according to the executed agreements and contracts specifying original
costs.
The progress payment schedule described above is designed to ensure that building owners can pay their
contractors on a timely basis. Project progress and the project cash flow will be monitored and verified by
PSE&G or a designated third-party implementation contractor.
Proposed Incentives The subprogram will provide a 100% incentive for an up-front ASHRAE Level I, II, or III audit. The
specific audit level will be determined based upon the type, size, and age of the facility. In addition, PSE&G
will buy-down the simple payback of the recommended energy efficiency project cost for approved
measures by up to six years, with the resulting payback not less than three years. After the project incentive
buy-down, the remaining project costs may be funded by the subprogram with participants repaying the
balance of the project costs on-bill.
PSE&G will retain the option and flexibility to adjust the incentive offered to participants to enable a whole-
building approach that will include additional ECMs in the project.
The full cost of the energy efficiency projects (including engineering, transaction costs and cost of
construction) will be covered through a combination of subprogram incentive and customer repayments.

ATTACHMENT 1
26
Marketing Approach PSE&G will leverage existing relationships with municipalities, universities, schools, and other public
agencies to promote the subprogram and will conduct further outreach through school, university, and
municipal associations. In addition, PSE&G will generate a marketing campaign to hospitals, healthcare
facilities, non-profits, and multi-family agencies to increase awareness of the subprogram. The subprogram
will leverage PSE&G’s existing relationships and communication channels with customers through
subprogram staff and account management team.
Contractor Role PSE&G will select qualified subprogram participating vendors to undertake all auditing and engineering
work associated with the subprogram. Participants are permitted to select their preferred installation
providers to complete work on-site. PSE&G may also utilize a third-party implementation contractor to
assist in the outreach, marketing, and trade ally coordination, to support the large number of municipalities
and schools within the PSE&G service territory. The installation provider will adhere to the project
specifications set forth by PSE&G and the engineering vendor and approved by the participant. The third-
party implementation contractor will also monitor participation to assess the effectiveness of outreach
efforts, incentive levels, delivery methods, and vendor availability and provide suggestions for
improvement.
To select a qualified third-party implementation contractor, PSE&G will prioritize criteria such as:
Experience delivering similar subprograms or initiatives
Resources and marketing strength
Cost effectiveness

ATTACHMENT 1
27
APPENDIX A – MEASURE-LEVEL DETAILS The chart below contains preliminary measure-by-measure details used to develop the subprograms. It is anticipated that incentive levels may
change prior to and during the implementation of each Subprogram.
Table 1. Measure Level Details
Subprogram Name Measure Primary
Fuel Type Unit Basis Modeled
AVG
Incentive
Res Eff Products Storage WH, EF=0.82 GAS per water heater $125.00
Res Eff Products Instant WH, EF>=0.82 GAS per water heater $150.00
Res Eff Products Heat Pump WH ELEC per water heater $400.00
Res Eff Products Circulator with demand control GAS per water heater $40.00
Res Eff Products Indirect water heater with Energy Star hot water boiler GAS per water heater $400.00
Res Eff Products Condensing Boiler 90-95% GAS Per Boiler $400.00
Res Eff Products ENERGY STAR RAC ELEC Per Room AC $50.00
Res Eff Products ENERGY STAR CAC (16 SEER 13 EER) ELEC Per Air Conditioner $400.00
Res Eff Products ENERGY STAR Fan ELEC Per Fan $15.00
Res Eff Products ENERGY STAR Mini Split HP ELEC Per Heat Pump $400.00
Res Eff Products SEER 18 HSPF 8.5, installed according to specifications ELEC Per Heat Pump $450.00
Res Eff Products ENERGY STAR heat pump ELEC Per System $450.00
Res Eff Products WiFi thermostat ELEC Per Thermostat $100.00
Res Eff Products WiFi thermostat GAS Per Thermostat $75.00
Res Eff Products Condensing Furnace 95-97% GAS Per Furnace $400.00
Res Eff Products VRF Heat Pump ELEC Per VRF System $400.00
Res Eff Products Most efficient Direct Unit Heater available GAS Per Direct Heater $400.00
Res Eff Products ECM circulator pump ELEC Per pump $75.00
Res Eff Products ECM Motor ELEC Per HVAC system $100.00
Res Eff Products Condensing boiler combo GAS Per Water Heating System $350.00
Res Eff Products Properly maintained CAC, 2.6 ton ELEC Per AC System $25.00
Res Eff Products ENERGY STAR Freezer ELEC per Freezer $75.00
Res Eff Products ENERGY STAR Most Efficient Refrigerator ELEC per Refrigerator $75.00

ATTACHMENT 1
28
Subprogram Name Measure Primary
Fuel Type Unit Basis Modeled
AVG
Incentive
Res Eff Products Heat Pump Clothes Dryer ELEC per dryer $75.00
Res Eff Products EnergyStar Side-Loading Clothes Washer GAS Per Clothes Washer $75.00
Res Eff Products EnergyStar Side-Loading Clothes Washer ELEC Per Clothes Washer $75.00
Res Eff Products EnergyStar Ceiling Fan, no light ELEC per Ceiling Fan $15.00
Res Eff Products EnergyStar Portable Dehumidifier ELEC per Dehumidifier $35.00
Res Eff Products Energy Star Dryer ELEC per Dryer $50.00
Res Eff Products Energy Star Dryer GAS PER DRYER $50.00
Res Eff Products Energy Star Air Cleaner ELEC per Air Cleaner $50.00
Res Eff Products Energy Star Television ELEC per Television $10.00
Res Eff Products Energy Star 5.0 TV Set Top Box ELEC per TV Set Top Box $1.50
Res Eff Products Energy Star 7.0 LCD Monitor ELEC Per Monitor $2.50
Res Eff Products ECM Whole Home Fan ELEC per Fan $15.00
Res Eff Products Induction Cooktop Stove ELEC per stove $25.00
Res Eff Products Variable Speed Pool Pump ELEC per in-ground pool $250.00
Res Eff Products Above ground pool with pump timer ELEC per above-ground pool $10.00
Res Eff Products LED Screw-in General Service Lamp ELEC Per Bulb $3.00
Res Eff Products Networked/ Connected - Indoor LED Lamp ELEC Per Bulb $5.00
Res Eff Products LED Replacement Lamp (Tube) ELEC Per Bulb $3.00
Res Eff Products LED ENERGY STAR Fixture ELEC Per Fixture $10.00
Res Eff Products Networked/ Connected - Indoor LED Luminaire ELEC Per Fixture $10.00
Res Eff Products LED Outdoor Flood Light Fixture ELEC Per Fixture $5.00
Res Eff Products LED Nightlight ELEC Per Bulb $1.59
Res Eff Products Manual Dimming Control All Types ELEC Per Bulb $2.21
Res Eff Products Occupancy Sensor ELEC Per Bulb $5.33
Res Eff Products Daylighting Control ELEC Per Bulb $5.00
Res Eff Products Low flow aerator ELEC per faucet $6.00
Res Eff Products Low flow aerator GAS per faucet $7.00
Res Eff Products Low flow showerhead GAS per shower $8.00

ATTACHMENT 1
29
Subprogram Name Measure Primary
Fuel Type Unit Basis Modeled
AVG
Incentive
Res Eff Products Low flow showerhead ELEC per shower $9.00
Res Eff Products Pipe wrap (hot water) GAS per house $10.00
Res Eff Products Pipe wrap (hot water) ELEC per house $10.00
Res Eff Products Secondary Freezer Not Replaced ELEC per Freezer $75.00
Res Eff Products Secondary Refrigerator Not Replaced ELEC per Refrigerator $75.00
Res Eff Products Smart (Tier 1) Power Strip ELEC per smart power strip $15.00
Res Eff Products Advanced Smart (Tier 2) Power Strip ELEC per advanced power strip $25.00
Res Existing Homes Sealed duct in unconditioned spaces ELEC Per Household $150.00
Res Existing Homes Ground Source Heat Pump ELEC Per GSHP $450.00
Res Existing Homes ENERGY STAR RAC ELEC Per Room AC $35.00
Res Existing Homes ENERGY STAR CAC (16 SEER 13 EER) ELEC Per Air Conditioner $450.00
Res Existing Homes ENERGY STAR heat pump ELEC Per System $350.00
Res Existing Homes VRF Heat Pump ELEC Per VRF System $350.00
Res Existing Homes Fan system with heat recovery GAS Per Fan System $300.00
Res Existing Homes Properly installed CAC ELEC Per Air Conditioner $50.00
Res Existing Homes Added Desuperheater ELEC per GSHP $250.00
Res Existing Homes Drainwater Heat Exchanger ELEC per house $300.00
Res Existing Homes LED Screw-in General Service Lamp ELEC Per Bulb $10.00
Res Existing Homes Networked/ Connected - Indoor LED Lamp ELEC Per Bulb $10.00
Res Existing Homes LED Replacement Lamp (Tube) ELEC Per Bulb $5.00
Res Existing Homes LED ENERGY STAR Fixture ELEC Per Fixture $8.00
Res Existing Homes Networked/ Connected - Indoor LED Luminaire ELEC Per Fixture $10.00
Res Existing Homes LED Outdoor Flood Light Fixture ELEC Per Fixture $5.00
Res Existing Homes LED Nightlight ELEC Per Bulb $2.00
Res Existing Homes Manual Dimming Control All Types ELEC Per Bulb $2.00
Res Existing Homes Occupancy Sensor ELEC Per Bulb $5.00
Res Existing Homes Daylighting Control ELEC Per Bulb $5.00
Res Existing Homes Condensing Boiler 90-95% GAS Per Boiler $400.00

ATTACHMENT 1
30
Subprogram Name Measure Primary
Fuel Type Unit Basis Modeled
AVG
Incentive
Res Existing Homes Condensing Furnace 95-97% GAS Per Furnace $400.00
Res Existing Homes Low flow aerator ELEC per faucet $4.00
Res Existing Homes Low flow aerator GAS per faucet $4.00
Res Existing Homes Low flow showerhead ELEC per shower $11.00
Res Existing Homes Low flow showerhead GAS per shower $11.00
Res Existing Homes Pipe wrap (hot water) GAS per house $22.00
Res Existing Homes Pipe wrap (hot water) ELEC per house $22.48
Res Existing Homes Standard flow showerhead with TSV ELEC per shower $34.00
Res Existing Homes Water Heater set to 120F ELEC per water heater $5.00
Res Existing Homes Instant WH, EF>=0.82 GAS per water heater $300.00
Res Existing Homes WH timer ELEC per water heater $5.00
Res Existing Homes Single-Pane window with low-E film ELEC per living unit $138.60
Res Existing Homes Home that has air sealing performed ELEC per house $350.00
Res Existing Homes Home that has air sealing performed GAS per house $350.00
Res Existing Homes Insulated ductwork GAS per living unit $300.00
Res Existing Homes Home with insulated basement GAS per house $500.00
Res Existing Homes Home with insulated ceiling roof GAS per house $500.00
Res Existing Homes Home with insulated knee walls GAS per house $400.00
Res Existing Homes Home with insulated rim joists GAS per house $350.00
Res Existing Homes Home with insulated walls GAS per house $350.00
Res Existing Homes Insulated ductwork ELEC per living unit $500.00
Res Existing Homes Home with insulated basement ELEC per house $500.00
Res Existing Homes Home with insulated ceiling roof ELEC per house $500.00
Res Existing Homes Home with insulated knee walls ELEC per house $350.00
Res Existing Homes Home with insulated rim joists ELEC per house $350.00
Res Existing Homes Home with insulated walls ELEC per house $500.00
Res Existing Homes Boiler with reset controls GAS Per Boiler $200.00
Res Existing Homes Insulated piping GAS Per Household $11.00

ATTACHMENT 1
31
Subprogram Name Measure Primary
Fuel Type Unit Basis Modeled
AVG
Incentive
Res Existing Homes HVAC system sized according to Manual J ELEC Per System $125.00
Res Existing Homes Heat Pump operating according to specifications ELEC Per Heat Pump $75.00
Res Existing Homes Properly maintained furnace GAS Per Furnace $25.00
Res Existing Homes Steam heating system with properly adjusted vents GAS Per household $40.00
Res Existing Homes Secondary Freezer Not Replaced ELEC per Freezer $50.00
Res Existing Homes Secondary Refrigerator Not Replaced ELEC per Refrigerator $50.00
Res Existing Homes Smart (Tier 1) Power Strip ELEC per smart power strip $20.00
Res Existing Homes Advanced Smart (Tier 2) Power Strip ELEC per advanced power strip $30.00
Res Behavior Home Energy Reports ELEC per report $11.00
Res K-12 Education K-12 Education Behavior (HER) GAS per report $0.00
Res K-12 Education K-12 Education Behavior (HER) ELEC per report $0.00
Res K-12 Education Low flow aerator ELEC per faucet $4.00
Res K-12 Education Low flow aerator GAS per faucet $4.00
Res K-12 Education Low flow showerhead GAS per shower $11.00
Res K-12 Education Low flow showerhead ELEC per shower $11.00
Res K-12 Education LED Screw-in General Service Lamp ELEC Per Bulb $9.00
Res K-12 Education Networked/ Connected - Indoor LED Lamp ELEC Per Bulb $41.00
Res K-12 Education LED Nightlight ELEC Per Bulb $9.00
Res New Construction Res New Construction - Per Home Gas Component GAS per living unit $1,250.00
Res New Construction Res New Construction - Per Home Elec Component ELEC per living unit $1,250.00
Res MF Home Energy Reports ELEC per report $6.00
Res MF Home Energy Reports GAS per report $6.00
Res MF Low flow aerator ELEC per faucet $4.00
Res MF Low flow aerator GAS per faucet $4.00
Res MF Low flow showerhead GAS per shower $11.00
Res MF Low flow showerhead ELEC per shower $11.00
Res MF Standard flow showerhead with TSV ELEC per shower $34.00
Res MF Smart (Tier 1) Power Strip ELEC per smart power strip $33.00
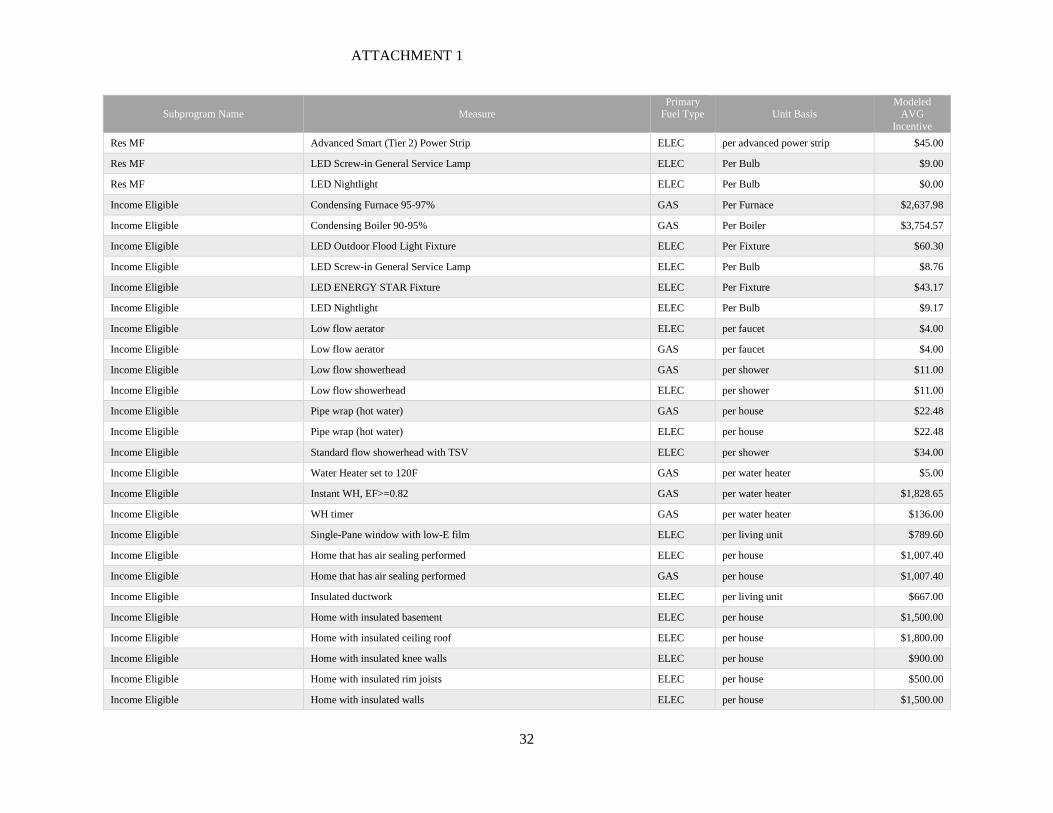
ATTACHMENT 1
32
Subprogram Name Measure Primary
Fuel Type Unit Basis Modeled
AVG
Incentive
Res MF Advanced Smart (Tier 2) Power Strip ELEC per advanced power strip $45.00
Res MF LED Screw-in General Service Lamp ELEC Per Bulb $9.00
Res MF LED Nightlight ELEC Per Bulb $0.00
Income Eligible Condensing Furnace 95-97% GAS Per Furnace $2,637.98
Income Eligible Condensing Boiler 90-95% GAS Per Boiler $3,754.57
Income Eligible LED Outdoor Flood Light Fixture ELEC Per Fixture $60.30
Income Eligible LED Screw-in General Service Lamp ELEC Per Bulb $8.76
Income Eligible LED ENERGY STAR Fixture ELEC Per Fixture $43.17
Income Eligible LED Nightlight ELEC Per Bulb $9.17
Income Eligible Low flow aerator ELEC per faucet $4.00
Income Eligible Low flow aerator GAS per faucet $4.00
Income Eligible Low flow showerhead GAS per shower $11.00
Income Eligible Low flow showerhead ELEC per shower $11.00
Income Eligible Pipe wrap (hot water) GAS per house $22.48
Income Eligible Pipe wrap (hot water) ELEC per house $22.48
Income Eligible Standard flow showerhead with TSV ELEC per shower $34.00
Income Eligible Water Heater set to 120F GAS per water heater $5.00
Income Eligible Instant WH, EF>=0.82 GAS per water heater $1,828.65
Income Eligible WH timer GAS per water heater $136.00
Income Eligible Single-Pane window with low-E film ELEC per living unit $789.60
Income Eligible Home that has air sealing performed ELEC per house $1,007.40
Income Eligible Home that has air sealing performed GAS per house $1,007.40
Income Eligible Insulated ductwork ELEC per living unit $667.00
Income Eligible Home with insulated basement ELEC per house $1,500.00
Income Eligible Home with insulated ceiling roof ELEC per house $1,800.00
Income Eligible Home with insulated knee walls ELEC per house $900.00
Income Eligible Home with insulated rim joists ELEC per house $500.00
Income Eligible Home with insulated walls ELEC per house $1,500.00
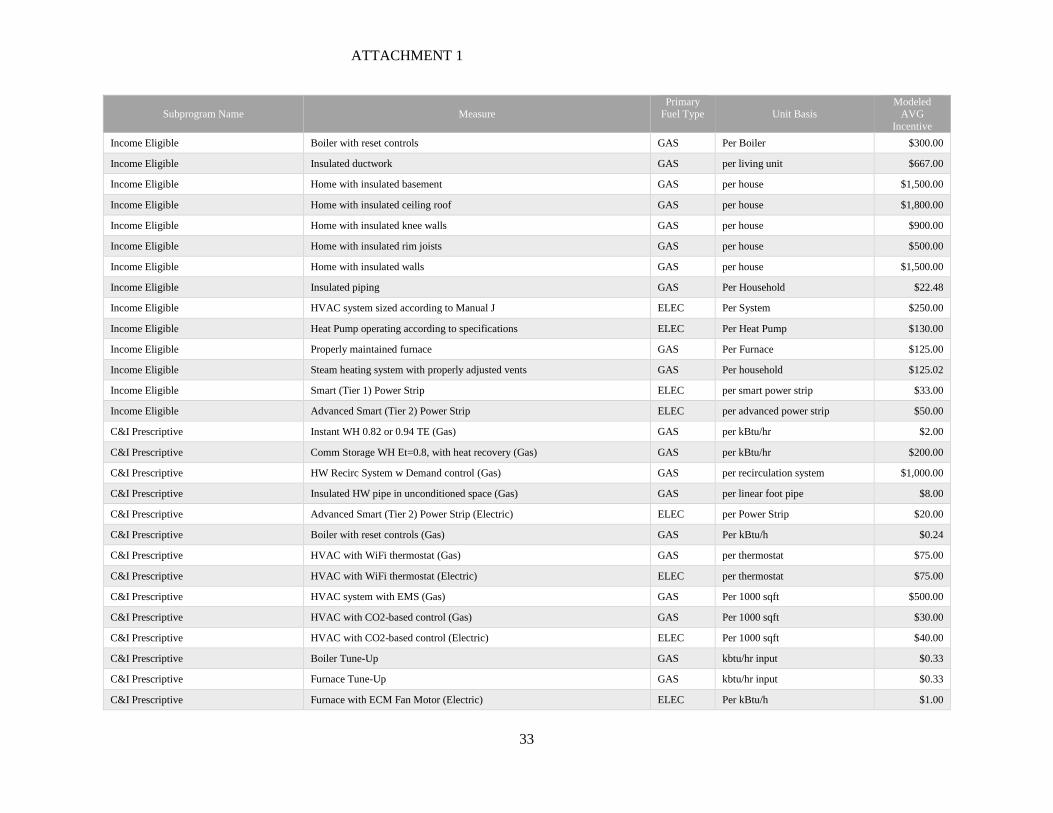
ATTACHMENT 1
33
Subprogram Name Measure Primary
Fuel Type Unit Basis Modeled
AVG
Incentive
Income Eligible Boiler with reset controls GAS Per Boiler $300.00
Income Eligible Insulated ductwork GAS per living unit $667.00
Income Eligible Home with insulated basement GAS per house $1,500.00
Income Eligible Home with insulated ceiling roof GAS per house $1,800.00
Income Eligible Home with insulated knee walls GAS per house $900.00
Income Eligible Home with insulated rim joists GAS per house $500.00
Income Eligible Home with insulated walls GAS per house $1,500.00
Income Eligible Insulated piping GAS Per Household $22.48
Income Eligible HVAC system sized according to Manual J ELEC Per System $250.00
Income Eligible Heat Pump operating according to specifications ELEC Per Heat Pump $130.00
Income Eligible Properly maintained furnace GAS Per Furnace $125.00
Income Eligible Steam heating system with properly adjusted vents GAS Per household $125.02
Income Eligible Smart (Tier 1) Power Strip ELEC per smart power strip $33.00
Income Eligible Advanced Smart (Tier 2) Power Strip ELEC per advanced power strip $50.00
C&I Prescriptive Instant WH 0.82 or 0.94 TE (Gas) GAS per kBtu/hr $2.00
C&I Prescriptive Comm Storage WH Et=0.8, with heat recovery (Gas) GAS per kBtu/hr $200.00
C&I Prescriptive HW Recirc System w Demand control (Gas) GAS per recirculation system $1,000.00
C&I Prescriptive Insulated HW pipe in unconditioned space (Gas) GAS per linear foot pipe $8.00
C&I Prescriptive Advanced Smart (Tier 2) Power Strip (Electric) ELEC per Power Strip $20.00
C&I Prescriptive Boiler with reset controls (Gas) GAS Per kBtu/h $0.24
C&I Prescriptive HVAC with WiFi thermostat (Gas) GAS per thermostat $75.00
C&I Prescriptive HVAC with WiFi thermostat (Electric) ELEC per thermostat $75.00
C&I Prescriptive HVAC system with EMS (Gas) GAS Per 1000 sqft $500.00
C&I Prescriptive HVAC with CO2-based control (Gas) GAS Per 1000 sqft $30.00
C&I Prescriptive HVAC with CO2-based control (Electric) ELEC Per 1000 sqft $40.00
C&I Prescriptive Boiler Tune-Up GAS kbtu/hr input $0.33
C&I Prescriptive Furnace Tune-Up GAS kbtu/hr input $0.33
C&I Prescriptive Furnace with ECM Fan Motor (Electric) ELEC Per kBtu/h $1.00

ATTACHMENT 1
34
Subprogram Name Measure Primary
Fuel Type Unit Basis Modeled
AVG
Incentive
C&I Prescriptive VFD-Controlled Motor (Electric) ELEC per HP $100.00
C&I Prescriptive ECM Circulator Pump (Electric) ELEC Per HP $635.00
C&I Prescriptive Insulated pipe (Gas) GAS per linear foot pipe $8.00
C&I Prescriptive Chilled Water Pump with VFD (Electric) ELEC per HP $150.00
C&I Prescriptive Variable Air Volume HVAC (Electric) ELEC Per ton $200.00
C&I Prescriptive Cooling Tower Fan with VFD (Electric) ELEC per HP $100.00
C&I Prescriptive PTAC/PTHP with occupancy sensor (Electric) ELEC Per ton $100.00
C&I Prescriptive Air Handler with DOAS (Gas) GAS Per ton $275.00
C&I Prescriptive Ventilation with heat recovery (Gas) GAS Per ventilator $375.00
C&I Prescriptive Hotel Guest Room Occupancy Sensor (Electric) ELEC per 1000 sq ft $150.00
C&I Prescriptive Interior Occupancy Sensor (Electric) ELEC per 1000 sq ft $100.00
C&I Prescriptive LED Outdoor Building Exterior (Electric) ELEC per 1000 sq ft $25.00
C&I Prescriptive Exterior Occupancy Sensor (Electric) ELEC per 1000 sq ft $10.00
C&I Prescriptive LED Track Lighting (Electric) ELEC per 1000 sq ft $7.50
C&I Prescriptive Solid State (LED) Recessed Downlight (Electric) ELEC per 1000 sq ft $30.00
C&I Prescriptive LED Refrigerator/Freezer Case (Electric) ELEC per 1000 sq ft $0.10
C&I Prescriptive Refrigerator Case Light Sensor (Electric) ELEC per 1000 sq ft $1.50
C&I Prescriptive Freezer Case Light Sensor (Electric) ELEC per 1000 sq ft $0.50
C&I Prescriptive LED Exit Sign (Electric) ELEC per 1000 sq ft $25.00
C&I Prescriptive Bi-Level Stairway Lighting (Electric) ELEC per 1000 sq ft $15.00
C&I Prescriptive LED Bollard (Electric) ELEC per 1000 sq ft $0.50
C&I Prescriptive Daylight Dimming Control (Electric) ELEC per 1000 sq ft $200.00
C&I Prescriptive LED Troffer/Surface/Suspended (Electric) ELEC per 1000 sq ft $300.00
C&I Prescriptive LED Display Case Lighting (Electric) ELEC per 1000 sq ft $1.50
C&I Prescriptive LED Replacement Lamp (Tube) (Electric) ELEC per 1000 sq ft $50.00
C&I Prescriptive LED Other Linear Fixture (Electric) ELEC per 1000 sq ft $50.00
C&I Prescriptive LED Low/High Bay (Electric) ELEC per 1000 sq ft $250.00
C&I Prescriptive LED Pole/Arm Mounted (Electric) ELEC per 1000 sq ft $50.00

ATTACHMENT 1
35
Subprogram Name Measure Primary
Fuel Type Unit Basis Modeled
AVG
Incentive
C&I Prescriptive LLLC - Low Impact Application (Electric) ELEC per 1000 sq ft $400.00
C&I Prescriptive LED Channel Signage (Electric) ELEC per 1000 sq ft $3.00
C&I Prescriptive LED Parking Garage and Canopy (Electric) ELEC per 1000 sq ft $50.00
C&I Prescriptive Market Avg Eff Spray Valve (1.16 GPM) (Gas) GAS per Spray Valve $25.00
C&I Prescriptive ENERGY STAR Commercial Refrigerator (Electric) ELEC per Refrigerator $300.00
C&I Prescriptive ENERGY STAR Commercial Freezer (Electric) ELEC per Freezer $300.00
C&I Prescriptive Pool with Cover (Gas) GAS per sqft of pool surface $1.00
C&I Prescriptive Demand Controlled Ventilation (DCV) Exhaust Hood (Electric) ELEC per HP $800.00
C&I Prescriptive Refrigerated Vending Machine with control system (Electric) ELEC Vending Machine $100.00
C&I Prescriptive Non-Refrigerated Vending Machine with control system (Electric) ELEC Vending Machine $100.00
C&I Prescriptive Refrigeration – Cooler Night Covers LT (Electric) ELEC Per foot $6.00
C&I Prescriptive Refrigeration – Cooler Night Covers MT (Electric) ELEC Per foot $6.00
C&I Prescriptive Refrigeration – Cooler Night Covers HT (Electric) ELEC Per foot $6.00
C&I Prescriptive Evaporator Fan Control (Electric) ELEC Per Compressor HP $30.00
C&I Prescriptive Add Door to Open Display Case (Electric) ELEC Per foot $200.00
C&I Prescriptive electronically commutated motors Motor (Electric) ELEC Motor $75.00
C&I Prescriptive Automatic door Closer (Electric) ELEC autocloser $75.00
C&I Prescriptive Freezer and Cooler Door Strip Curtians (Electric) ELEC Per square foot $2.00
C&I Prescriptive Insulated Lines (Electric) ELEC Per foot $1.00
C&I Prescriptive Anti sweat heat control (Electric) ELEC Per foot $20.00
C&I Prescriptive Defrost Controls (Electric) ELEC Per evap Fan $125.00
C&I Prescriptive Floating Head- Air Cooled (Electric) ELEC Per Ton $100.00
C&I Prescriptive Floating Head- Evap Cooled (Electric) ELEC Per Ton $40.00
C&I Prescriptive Freezer and Cooler Door Gaskets (Electric) ELEC Per foot $20.00
C&I Prescriptive Condensing Storage WH 90% TE (Gas) GAS per kBtu/hr $5.00
C&I Prescriptive Indirect WH 85% CAE (Gas) GAS per kBtu/hr $4.00
C&I Prescriptive Elec Storage WH 2.30 Et (Electric) ELEC per kBtu/hr $2.00
C&I Prescriptive Volume Water Heater 92% TE (Gas) GAS per kBtu/hr $5.00

ATTACHMENT 1
36
Subprogram Name Measure Primary
Fuel Type Unit Basis Modeled
AVG
Incentive
C&I Prescriptive High performance hood (Gas) GAS Hood $500.00
C&I Prescriptive hood controls (Gas) GAS Hood $1,000.00
C&I Prescriptive High Pressure Steam Trap, Greater than 75 PSIG, Tested GAS PER UNIT $300.00
C&I Prescriptive Medium Pressure Steam Trap, 15 PSIG to 75 PSIG, Tested GAS PER UNIT $200.00
C&I Prescriptive 95% or 97% AFUE and ECM motor (Gas) GAS Per kBtu/h $2.76
C&I Prescriptive ENERGY STAR RAC (Electric) ELEC per kBtu/hr $1.47
C&I Prescriptive 90% Et Condensing Boiler (Gas) GAS Per kBtu/h $7.92
C&I Prescriptive CEE-compliant heat pump (Electric) ELEC per ton cooling $100.00
C&I Prescriptive ENERGY STAR Minisplit (Electric) ELEC per ton cooling $100.00
C&I Prescriptive VRF HP (Electric) ELEC per ton cooling $1,250.00
C&I Prescriptive 15.0 EER Ground-Source HP (Electric) ELEC Per Ton $80.00
C&I Prescriptive ROB DX Packaged System, EER=10.8, 30 tons (Electric) ELEC Per Ton $24.93
C&I Prescriptive ROB DX Packaged System, EER=10.8, 30 tons, AFUE 95% (Gas) GAS Per Ton $90.00
C&I Prescriptive Condensing integrated boiler and water heater (Gas) GAS Per kbtuhr $1.36
C&I Prescriptive Variable Speed Centrifugal Chiller (Electric) ELEC Per ton $100.00
C&I Prescriptive 95 AFUE make-up air unit (Gas) GAS Per kBtu/h $2.61
C&I Prescriptive HVLS fan (Electric) ELEC Per 1000 sqft $100.00
C&I Prescriptive High-efficiency PTHP (Electric) ELEC Per ton $40.00
C&I Prescriptive High-efficiency PTAC (Electric) ELEC Per ton $40.00
C&I Prescriptive Condensing unit heater, 90% AFUE (Gas) GAS per kBtu/h $5.32
C&I Prescriptive Gas-fired low-intensity infrared heating unit (Gas) GAS per kBtu/h $1.10
C&I Prescriptive HVAC system with high-efficiency air-cooled chiller (Electric) ELEC Per ton cooling $100.00
C&I Prescriptive HVAC system with high-efficiency water-cooled chiller (Electric) ELEC Per ton cooling $100.00
C&I Prescriptive HVAC system with dual enthalpy sensor outside air economizer (Electric) ELEC Per tons cooling $80.00
C&I Prescriptive Heat Pump Multi-Family Laundromat Dryer (Electric) ELEC per Dryer $300.00
C&I Prescriptive Variable Speed Pool Pump (Electric) ELEC per in-ground pool $300.00
C&I Prescriptive ENERGY STAR Refrigerator-Freezer (Electric) ELEC per Refrigerator $61.00
C&I Prescriptive ES 3.0 Beverage Vending Machine (Electric) ELEC per Beverage Vending Machine $100.00

ATTACHMENT 1
37
Subprogram Name Measure Primary
Fuel Type Unit Basis Modeled
AVG
Incentive
C&I Prescriptive Electric Clothes Dryer - High Efficiency- Electric (Electric) ELEC per Dryer $100.00
C&I Prescriptive Electric Clothes Dryer - High Efficiency- Gas (Gas) GAS per Dryer $200.00
C&I Prescriptive HE Commercial Cloths Washer (Gas) GAS Per Washer $100.00
C&I Prescriptive Ozone Laundry Washing Machine (Gas) GAS Per Washer $2,500.00
C&I Prescriptive ENERGY STAR Electric Convection Oven (Electric) ELEC per oven $750.00
C&I Prescriptive ENERGY STAR Electric Combination Oven (Electric) ELEC per oven $750.00
C&I Prescriptive ENERGY STAR Gas Convection Oven (Gas) GAS per oven $600.00
C&I Prescriptive ENERGY STAR Gas Combination Oven (Gas) GAS per oven $1,250.00
C&I Prescriptive ENERGY STAR Hot Food Holding Cabinet (Electric) ELEC per hot food holding cabinet $750.00
C&I Prescriptive ENERGY STAR Ice Machine or CEE Tier 2 (Electric) ELEC per ice machine $100.00
C&I Prescriptive ENERGY STAR High Temperature Commercial Dishwasher, Conveyor - Electric (Electric)
ELEC per dishwasher $300.00
C&I Prescriptive ENERGY STAR High Temperature Commercial Dishwasher, Conveyor -
Gas (Gas) GAS per dishwasher $300.00
C&I Prescriptive ENERGY STAR High Temperature Commercial Dishwasher, Non-conveyor - electric (Electric)
ELEC per dishwasher $300.00
C&I Prescriptive ENERGY STAR High Temperature Commercial Dishwasher, Non-conveyor
- gas (Gas) GAS per dishwasher $300.00
C&I Prescriptive ENERGY STAR Low Temperature Commercial Dishwasher - Electric (Electric)
ELEC per dishwasher $300.00
C&I Prescriptive ENERGY STAR Low Temperature Commercial Dishwasher - Gas (Gas) GAS per dishwasher $300.00
C&I Prescriptive Existing Compressor (Electric) ELEC Per compressor $275.00
C&I Prescriptive High Efficiency Compressor (Electric) ELEC Per compressor $125.00
C&I Prescriptive Oversized Condenser- Air Cooled (Electric) ELEC Per Ton $125.00
C&I Prescriptive Oversized Condenser- Evap Cooled (Electric) ELEC Per Ton $125.00
C&I Prescriptive Refrigeration/Freezer Door Heater Controls ELEC per door $20.00
C&I Prescriptive ENERGY STAR Commercial Fryers ELEC per fryer $300.00
C&I Custom C&I Custom - Elec ELEC per kWh $0.20
C&I Custom C&I Custom - Gas GAS per therm $1.64
C&I Small Non-Residential Efficiency C&I Small Non-Residential Efficiency Electric ELEC per kWh $0.20
C&I Small Non-Residential Efficiency C&I Small Non-Residential Efficiency Gas GAS per therm $1.50
C&I New Construction C&I NC Electric ELEC per kWh $0.16

ATTACHMENT 1
38
Subprogram Name Measure Primary
Fuel Type Unit Basis Modeled
AVG
Incentive
C&I New Construction C&I NC Gas GAS per therm $2.00
C&I Energy Management RCX Electric ELEC per kWh $0.05
C&I Energy Management RCX Gas GAS per therm $0.96
C&I Energy Management Strategic Energy Mgmt Electric ELEC per kWh $0.05
C&I Energy Management Strategic Energy Mgmt Gas GAS per therm $0.96
C&I Engineered Solutions MUSH Engineered Solution - Audit ELEC PROGRAM $21,223.14
C&I Engineered Solutions MUSH Engineered Solution - Audit GAS PROGRAM $9,987.36
C&I Engineered Solutions MUSH Engineered Solution - Engineering ELEC PROGRAM $43,889.46
C&I Engineered Solutions MUSH Engineered Solution - Engineering GAS PROGRAM $20,653.86
C&I Engineered Solutions MUSH Engineered Solution - Construction Begins (1st Pay) ELEC PROGRAM $129,696.98
C&I Engineered Solutions MUSH Engineered Solution - Construction Begins (1st Pay) GAS PROGRAM $61,033.87
C&I Engineered Solutions MUSH Engineered Solution - 50% Complete (2nd Pay) ELEC PROGRAM $129,696.98
C&I Engineered Solutions MUSH Engineered Solution - 50% Complete (2nd Pay) GAS PROGRAM $61,033.87
C&I Engineered Solutions MUSH Engineered Solution - Construction Finished (3rd Pay) ELEC PROGRAM $129,696.98
C&I Engineered Solutions MUSH Engineered Solution - Construction Finished (3rd Pay) GAS PROGRAM $61,033.87
C&I Streetlight STREETLIGHTING - HPS 58 TO LED 36 ELEC PER FIXTURE $305.83
C&I Streetlight STREETLIGHTING - HPS 117 TO LED 56 ELEC PER FIXTURE $309.23
C&I Streetlight STREETLIGHTING - HPS 171 TO LED 73 ELEC PER FIXTURE $353.44
C&I Streetlight STREETLIGHTING - HPS 300 TO LED 107 ELEC PER FIXTURE $353.41
C&I Streetlight STREETLIGHTING - HPS 450 TO LED 180 ELEC PER FIXTURE $473.49
C&I Streetlight LED CONTROLLER ELEC PER FIXTURE $124.74
C&I Streetlight LED CONTROLLER INSTALL ELEC PER FIXTURE $0.00
C&I Streetlight INDUCTION CONTROLLER ELEC PER FIXTURE $124.74
C&I Streetlight INDUCTION CONTROLLER INSTALL ELEC PER FIXTURE $61.43
C&I Streetlight Smart City Pilot ELEC Per Controller $90.33

ATTACHMENT 1
39
APPENDIX B: Enrollment
Subprogram Enrollment
Residential Efficient Products Customer application received
Residential Existing Homes Customer application received
Residential Behavioral Customer included in treatment group
Residential Multi-Family Customer application received
Residential Income Eligible Customer application received
C&I Prescriptive Customer application received
C&I Custom Customer application received
C&I Small Non-Residential
Efficiency
Customer application received (Audit Access
Agreement)
C&I Energy Management Customer application received
C&I Engineered Solutions Customer application received (Customer Access
Consent Agreement )

1
ATTACHMENT 2 – IT COST BREAKDOWN
Platform Description Investment
($M)
SAP ERP/Billing platform 8.9
Salesforce Customer relationship management platform 5.5
Mulesoft Integration system using Application Programming Interfaces (APIs)
2.9
Online Integration
Web based customer self-service portal, Mobile App, Digital Assistant, IVR integration, and e-signature enablement
6.1
Energy Efficiency Tracking System
Platform for tracking EE program investments, energy savings, enrollments and customer participation, and tracking BPU reporting requirements
2.8
Program-specific support
Support for Behavioral and Marketplace platforms 1.0
Analytics Platform to provide insights into program participation, energy savings and overall program effectiveness, leveraging data lakes and advanced algorithms
5.8
Total 33.0
Note: values rounded to the nearest $0.1M
Note: The cost breakdown above is based on program scope as documented in this Stipulation. PSE&G will
have flexibility to move the dollars among the platforms within the approved budget of $33M.

ATTACHMENT 3
Benefit Cost Analysis Results
Subprograms NJCT* SCT TRC PCT PAC RIM
Res Eff Products 1.7 2.3 0.7 7.7 0.9 0.6
Res Existing Homes 1.6 2.4 0.8 4.9 1.2 0.7
Res Behavior 2.2 2.6 1.2 n/a** 1.2 0.6
Res MF 1.3 2.4 0.7 n/a** 0.7 0.5
Income Eligible 1.2 1.8 0.5 n/a** 0.5 0.4
C&I Prescriptive 2.7 3.5 1.3 6.6 2.0 1.2
C&I Custom 3.0 4.7 1.5 6.9 2.1 1.3
C&I Small Non-Residential Efficiency 2.7 4.3 1.3 5.4 1.9 1.1
C&I Energy Management 1.8 4.0 1.3 8.7 1.4 1.0
C&I Engineered Solutions 1.8 3.0 0.9 5.3 1.1 0.9
Residential Programs 1.7 2.4 0.8 8.7 1.0 0.6
Commercial & Industrial Programs 2.5 3.7 1.2 6.1 1.8 1.1
Low Income Programs 1.2 1.8 0.5 n/a* 0.5 0.4
Total Portfolio 2.2 3.2 1.0 7.0 1.4 0.9
*- NJCT assumptions and calculations are consistent with the August 24th, 2020 order and subsequent guidance
**- PCT results for Res Behavior, Res MF, & Income Eligible are n/a as these subprograms are provided at no cost

ATTACHMENT 3
Cost-to-Achieve Savings Analysis
CEF-EE CTA
Electric ($/annualized kWh) Gas ($/annualized therm)
Guidance +/- 10%*
CEF-EE CTA Guidance +/-
10%* CEF-EE CTA
Residential Sector 0.29 - 0.35 0.19 7.82 - 9.56 2.06
Eff Products 0.32 3.42
Existing Homes 0.59 12.50
Behavior 0.05 0.68
C&I Sector 0.33 - 0.41 0.46 3.72 - 4.54 2.36
Prescriptive 0.45 0.16
Custom 0.31 2.46
Direct Install 0.27 1.94
Energy Management 0.17 3.16
Engineered Solutions 1.91 9.03
Multifamily Sector 1.09 - 1.33 0.35 16.82 - 20.56 2.54
Multifamily 0.35 2.54
Low Income Sector**
1.89 - 2.31 0.88 25.53 - 31.21 20.98
Income Eligible 0.88 20.98 * Guidance is based on Core Program Cost Guidelines established in the June 10th Board Order.
** Co-managed low income sector targets used for income eligible subprogram

ATTACHMENT 3
Values for the QPIs in years 1-3
Electric Results* PY1 (Jul21-Jun22)
PY2 (Jul22-Jun23)
PY3 (Jul23-Jun24)
Annual Energy Savings (kWh) 439,366,569 487,189,790 368,845,495
Annual Peak Demand Savings (MW) 38,277 50,580 41,190
Lifetime Energy Savings (kWh) 2,985,212,297 4,705,957,570 4,110,966,390
Lifetime Persistent Peak Demand Savings (MW) 376,882 634,685 525,044
Utility Cost Test (NPV of Benefits)** 1.43 1.43 1.43
Low-Income Lifetime Savings (kWh) 137,524,557 33,327,854 20,891,897
Small Business Lifetime Savings (kWh) 547,176,929 615,127,006 920,902,348
Gas Results* PY1 (Jul21-Jun22)
PY2 (Jul22-Jun23)
PY3 (Jul23-Jun24)
Annual Energy Savings (Therms) 12,425,905 19,736,673 11,701,416
Annual Peak Demand Savings*** - - -
Lifetime Energy Savings (Therms) 94,604,425 151,631,297 108,635,745
Lifetime Persistent Peak Demand Savings*** - - -
Utility Cost Test (NPV of Benefits)** 1.43 1.43 1.43
Low-Income Lifetime Savings (Therms) 13,104,732 18,229,550 11,427,375
Small Business Lifetime Savings (Therms) 2,162,032 2,430,520 3,638,714
* QPIs are based on July 2021 to June 2024 program years as established in the June 10th Board Order. Should PSE&G's program
year be changed to align with the schedule of its program, these values will be adjusted accordingly. Currently PY3 represents a
partial year of programs that would be supplemented with PSE&G’s second triennial program approval.
** The Utility Cost Test, also known as the Program Administrator Cost Test (PAC) result represents the result across the entire
program cycle.
*** The approach to calculating the Gas Peak Demand Savings has not yet been finalized. Collaboration with other utilities to
establish the appropriate methodology is ongoing.

Attachment 4
PSE&G Clean Energy Future Energy Efficiency Program Schedule SS-CEF-EE-1Weighted Average Cost of Capital (WACC)
Revenue Pre-TaxWeighted Conversion Weighted Discount
Percent Cost Cost Factor Cost RateLong Term Debt 45.53% 3.9567% 1.8017% 1.0000 1.8017%Custumer Deposits 0.47% 0.8700% 0.0041% 1.0000 0.0041%
Sub-total 46.00% 1.8058% 1.8058% 1.2982%
Common Equity 54.00% 9.60% 5.1836% 1.3910 7.2105% 5.1836%Total 100.00% 6.99% 9.02% 6.4818%
Monthly WACC 0.5825% 0.7514%
Reflects a tax rate of 28.11%

Attachment 4
PSE&G Clean Energy Future Energy Efficiency Program Schedule SS-CEF-EE-2EElectric Revenue Requirements Calculation Page 1 of 2
Monthly WACC effective 11/1/2018 0.75136%Inc. tax rate effective 11/1/2018 28.11%
(1) (2) (3) (4) (5) (6) (7) (8) (9) (10) (11) (12)
PSE&G Program Investment
Program Investment
from/to Partner utility
Capitalized IT Costs Gross Plant
PSE&G + Partner Utility
Program Investment
AmortizationIT Cost
Amortization Accumulated Amortization Net Plant Tax Depreciation
Book Depreciation
Tax BasisDeferred Income
Tax
Beginning Acumulated
Deferred Income Tax
Monthly Calculation
Jan-20 - - - - - - - - - - - - Feb-20 - - - - - - - - - - - - Mar-20 - - - - - - - - - - - - Apr-20 - - - - - - - - - - - -
May-20 - - - - - - - - - - - - Jun-20 - - - - - - - - - - - - Jul-20 - - - - - - - - - - - -
Aug-20 - - - - - - - - - - - - Sep-20 - - - - - - - - - - - - Oct-20 1,176,140 - - 1,176,140 4,901 - 4,901 1,171,239 1,127,626 4,895 79,826 - Nov-20 1,130,607 - - 2,306,746 14,512 - 19,413 2,287,334 1,082,291 14,298 75,934 79,826 Dec-20 1,148,983 - - 3,455,729 24,010 - 43,423 3,412,306 1,100,865 23,588 76,594 155,760 Jan-21 1,594,628 - - 5,050,357 35,442 - 78,865 4,971,492 1,570,964 34,815 109,220 232,355 Feb-21 1,631,273 - - 6,681,630 48,883 - 127,748 6,553,882 1,607,708 48,152 110,884 341,575 Mar-21 1,669,128 - 1,079,699 9,430,457 62,635 8,997 199,381 9,231,076 1,675,654 70,797 114,105 452,459 Apr-21 5,557,437 - - 14,987,893 92,746 17,995 310,121 14,677,772 2,736,810 111,421 186,665 566,565
May-21 5,557,437 - - 20,545,330 139,058 17,995 467,174 20,078,156 2,750,365 147,412 185,070 753,230 Jun-21 5,575,813 - 538,053 26,659,196 185,446 22,479 675,099 25,984,097 2,797,243 187,964 185,520 938,300 Jul-21 5,558,892 - - 32,218,088 231,841 26,963 933,902 31,284,186 4,025,683 227,541 270,048 1,123,820
Aug-21 14,067,634 - - 46,285,723 313,618 17,965 1,265,485 45,020,238 9,797,815 294,631 675,676 1,393,868 Sep-21 15,544,425 - 4,619,024 66,449,172 437,002 65,454 1,767,941 64,681,231 11,422,265 448,332 780,247 2,069,544
Program Assumption
Investment in Shared Service Territory shared
with Partner Utility
See WP-SS-CEF-EE-1.xlsx'ITCap-E' wksht
Prior Month + (Col 1 + Col 1a + Col 2)
See WP-SS-CEF-EE-1.xlsx
'BkTaxSum' wksht
See WP-SS-CEF-EE-1.xlsx
'BkTaxSum' wksht
Prior Month + (Col 4 + Col 5) Col 3 - Col 6
See WP-SS-CEF-EE-1.xlsx
'BkTaxSum' wksht
See WP-SS-CEF-EE-1.xlsx
'BkTaxSum' wksht
See WP-SS-CEF-EE-1.xlsx
'BkTaxSum' wksht
See WP-SS-CEF-EE-1.xlsx
'BkTaxSum' wksht
Annual Summary
2019 - - - - - - - - - - - - 2020 3,455,729 - - 3,455,729 43,423 - 43,423 3,412,306 3,310,782 42,782 232,355 155,760 2021 99,654,053 - 10,863,771 113,973,553 3,588,398 523,761 4,155,583 109,817,970 69,063,488 3,692,730 4,647,861 4,211,396 2022 239,530,305 - 12,478,752 365,982,611 20,957,581 3,360,096 28,473,260 337,509,350 162,949,482 21,538,237 10,054,340 13,986,581 2023 279,773,822 - 3,218,796 648,975,229 46,558,204 5,043,982 80,075,446 568,899,782 189,887,627 44,811,604 10,314,905 24,164,264 2024 125,289,009 - - 774,264,237 70,371,913 5,312,264 155,759,623 618,504,614 71,713,143 68,084,403 258,003 25,591,912 2025 32,434,923 - - 806,699,160 76,457,933 5,312,264 237,529,820 569,169,340 48,486,675 83,158,064 (2,465,136) 23,291,523 2026 7,938,174 - - 814,637,334 78,456,999 4,865,553 320,852,372 493,784,962 46,648,952 93,434,179 (3,326,430) 20,008,840 2027 - - - 814,637,334 78,807,601 1,901,990 401,561,963 413,075,371 - 47,278,621 (3,361,510) 16,628,966 2028 - - - 814,637,334 78,807,601 241,410 480,610,974 334,026,360 - 45,618,041 (3,243,443) 13,379,802 2029 - - - 814,637,334 78,807,601 - 559,418,576 255,218,758 - 45,376,631 (3,226,278) 10,153,524 2030 - - - 814,637,334 78,764,179 - 638,182,754 176,454,580 - 45,335,035 (3,223,321) 6,928,568 2031 - - - 814,637,334 75,219,203 - 713,401,957 101,235,377 - 42,878,837 (3,048,685) 3,842,556 2032 - - - 814,637,334 57,850,020 - 771,251,977 43,385,356 - 31,337,150 (2,228,071) 1,525,463 2033 - - - 814,637,334 32,249,397 - 803,501,375 11,135,959 - 15,296,581 (1,087,587) 337,153 2034 - - - 814,637,334 8,435,688 - 811,937,063 2,700,271 - 3,153,014 (224,179) 82,627 2035 - - - 814,637,334 2,349,668 - 814,286,731 350,603 - 891,253 (63,368) 11,418 2036 - - - 814,637,334 350,603 - 814,637,334 - - 132,987 (9,455) - 2037 - - - 814,637,334 - - 814,637,334 - - - - - 2038 - - - 814,637,334 - - 814,637,334 - - - - - 2039 - - - 814,637,334 - - 814,637,334 - - - - - 2040 - - - 814,637,334 - - 814,637,334 - - - - - 2041 - - - 814,637,334 - - 814,637,334 - - - - - 2042 - - - 814,637,334 - - 814,637,334 - - - - - 2043 - - - 814,637,334 - - 814,637,334 - - - - - 2044 - - - 814,637,334 - - 814,637,334 - - - - - Total 788,076,014 - 26,561,319 788,076,014 26,561,319 592,060,149 592,060,149 (0)
Oct 20 - Sep 21 60,212,396 - 1,590,093 177,848 41,695,290 1,613,847 2,849,791

Attachment 4
Monthly Calculation
Jan-20Feb-20Mar-20Apr-20
May-20Jun-20Jul-20
Aug-20Sep-20Oct-20Nov-20Dec-20Jan-21Feb-21Mar-21Apr-21
May-21Jun-21Jul-21
Aug-21Sep-21
Annual Summary
20192020202120222023202420252026202720282029203020312032203320342035203620372038203920402041204220432044Total
Oct 20 - Sep 21
PSE&G Clean Energy Future Energy Efficiency Program Schedule SS-CEF-EE-2EElectric Revenue Requirements Calculation Page 2 of 2
Monthly WACC effective 11/1/2018 0.75136%Inc. tax rate effective 11/1/2018 28.11%
(13) (14) (15) (16) (17) (18) (19) (20) (21) (22)
Ending Acumulated
Deferred Income Tax
Average Net Investment Return Requirement
Program Investment Repayments Expenses Revenue Offsets Tax Flow-through
Tax Flow-Through Gross-up
Tax Adjustment on Loan
Revenue Requirements
- - - - - - - - - - - - - - - - - - - - - - - - - - - - - - - - - - - - - - - - - - - - - - - - - - - - - - - - - - - - - - - - - - - - - - - - - - - - - - - - - - - - - - - - - -
79,826 545,706 4,100 (1,002) 1,544,650 - (235,774) (92,191) (313) 1,224,371 155,760 1,611,493 12,108 (2,005) 1,544,650 - (224,278) (87,696) (546) 1,256,745 232,355 2,655,762 19,954 (3,007) 1,544,650 - (226,228) (88,458) (779) 1,270,142 341,575 3,904,934 29,340 (3,508) 1,544,650 - (322,591) (126,138) (856) 1,156,338 452,459 5,365,669 40,315 (4,010) 1,544,650 - (327,507) (128,060) (973) 1,173,299 566,565 7,382,967 55,473 (4,511) 1,544,650 - (337,020) (131,780) (1,089) 1,197,355 753,230 11,294,527 84,862 (65,398) 1,544,650 - (551,332) (215,578) (20,190) 887,755 938,300 16,532,199 124,216 (126,286) 1,544,650 - (546,620) (213,736) (34,662) 904,615
1,123,820 22,000,067 165,299 (187,173) 1,544,650 - (547,948) (214,256) (49,134) 919,363 1,393,868 27,375,298 205,687 (221,470) 1,693,621 - (797,610) (311,877) (55,226) 771,929 2,069,544 36,420,506 273,649 (313,233) 1,693,621 - (1,995,669) (780,334) (81,315) (871,699) 2,849,791 52,391,067 393,645 (404,997) 1,693,621 - (2,304,526) (901,102) (102,913) (1,123,818)
See WP-SS-CEF-EE-1.xlsx
'BkTaxSum' wksht
(Prev Col 7 - Col 11 + Col 7 - Col 12) / 2
Col 15* Monthly Pre Tax
WACC Program Assumption Program
Assumption Program
Assumption
See WP-SS-CEF-EE-1.xlsx
'BkTaxSum' wksht
See WP-SS-CEF-EE-1.xlsx
'BkTaxSum' wksht
See WP-SS-CEF-EE-1.xlsx
'BkTaxSum' wksht
Col 4 + Col 5 + Col 14 + Col 15 + Col 68 + Col 17 + Col 18 + Col 19 +
Col 20
- - - - - - - - - - 232,355 2,655,762 36,163 (6,014) 4,633,949 - (686,280) (268,345) (1,637) 3,751,257
4,880,216 96,342,826 3,219,489 (3,099,098) 19,429,621 - (13,727,859) (5,367,786) (785,349) 3,781,178 14,934,555 311,294,740 18,353,621 (18,386,694) 21,092,020 - (29,696,361) (11,611,695) (4,484,382) (415,814) 25,249,460 530,542,055 37,834,675 (41,320,776) 16,667,803 - (30,465,965) (11,912,620) (9,713,815) 12,691,488 25,507,464 593,032,269 52,976,305 (72,606,000) 7,731,777 - (762,035) (297,967) (17,383,587) 45,342,670 23,042,328 548,677,208 51,433,652 (93,135,722) 2,880,357 - 7,280,992 2,846,970 (23,915,657) 29,160,789 19,715,898 477,375,614 46,027,738 (105,755,396) 1,040,221 - 9,824,898 3,841,673 (28,364,957) 9,936,727 16,354,388 399,907,578 39,237,031 - 516,795 - 9,928,510 3,882,187 13,071,979 147,346,094 13,110,946 324,064,636 32,346,228 - 422,115 - 9,579,789 3,745,832 13,071,979 138,214,954 9,884,667 248,483,313 25,527,377 - 249,541 - 9,529,093 3,726,009 13,071,979 130,911,600 6,661,346 172,931,267 18,713,060 - 94,352 - 9,520,357 3,722,593 13,071,265 123,885,806 3,612,661 100,391,324 11,984,336 - 97,182 - 9,004,556 3,520,908 12,645,538 112,471,722 1,384,590 43,838,449 6,121,047 - 100,098 - 6,580,801 2,573,186 10,366,905 83,592,057
297,003 11,577,462 2,179,155 - 103,101 - 3,212,282 1,256,047 6,628,789 45,628,772 72,824 2,804,292 518,269 - 52,312 - 662,133 258,903 2,065,600 11,992,905 9,455 376,549 109,011 - - - 187,163 73,183 570,261 3,289,286
- - 9,503 - - - 27,927 10,920 85,091 484,044 - - 0 - - - - - - 0 - - 0 - - - - - - 0 - - 0 - - - - - - 0 - - 0 - - - - - - 0 - - 0 - - - - - - 0 - - 0 - - - - - - 0 - - 0 - - - - - - 0 - - - - - - - - - -
346,626,660 (334,309,700) 75,111,241 - (0) 0 (0) 902,065,534
1,408,648 (1,336,600) 18,982,707 - (8,417,103) (3,291,206) (347,994) 8,766,394
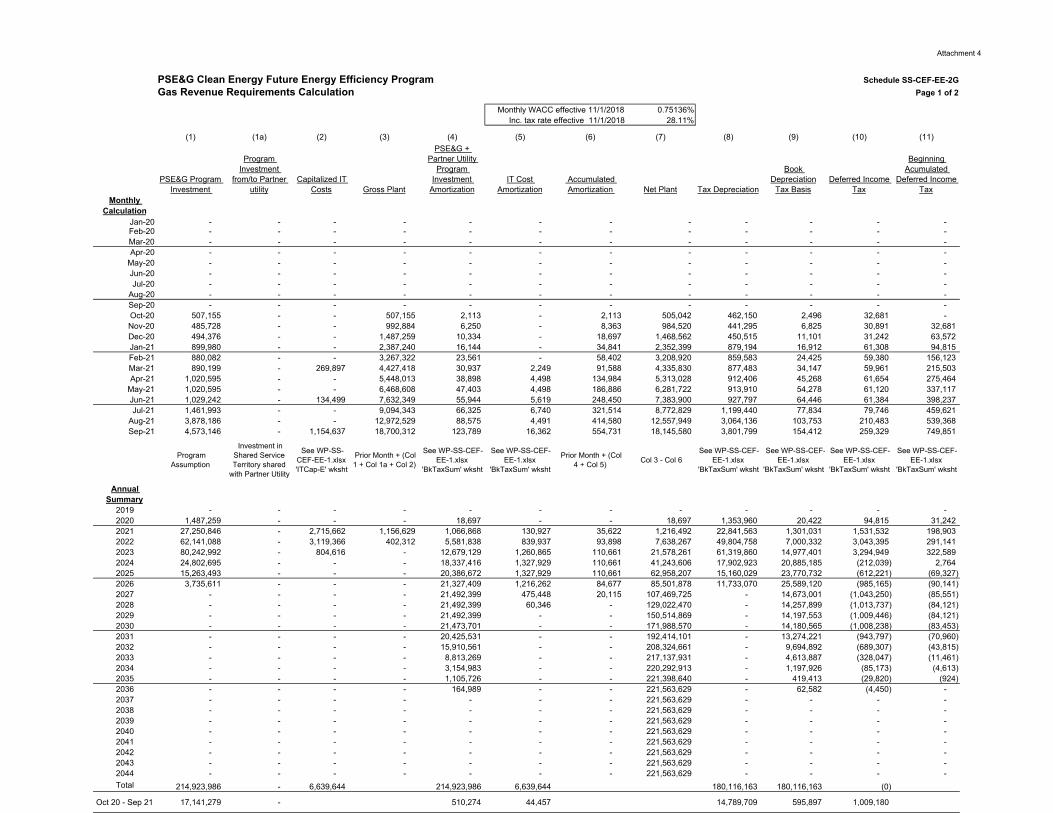
Attachment 4
PSE&G Clean Energy Future Energy Efficiency Program Schedule SS-CEF-EE-2GGas Revenue Requirements Calculation Page 1 of 2
Monthly WACC effective 11/1/2018 0.75136%Inc. tax rate effective 11/1/2018 28.11%
(1) (1a) (2) (3) (4) (5) (6) (7) (8) (9) (10) (11)
PSE&G Program Investment
Program Investment
from/to Partner utility
Capitalized IT Costs Gross Plant
PSE&G + Partner Utility
Program Investment
AmortizationIT Cost
Amortization Accumulated Amortization Net Plant Tax Depreciation
Book Depreciation
Tax BasisDeferred Income
Tax
Beginning Acumulated
Deferred Income Tax
Monthly Calculation
Jan-20 - - - - - - - - - - - - Feb-20 - - - - - - - - - - - - Mar-20 - - - - - - - - - - - - Apr-20 - - - - - - - - - - - -
May-20 - - - - - - - - - - - - Jun-20 - - - - - - - - - - - - Jul-20 - - - - - - - - - - - -
Aug-20 - - - - - - - - - - - - Sep-20 - - - - - - - - - - - - Oct-20 507,155 - - 507,155 2,113 - 2,113 505,042 462,150 2,496 32,681 - Nov-20 485,728 - - 992,884 6,250 - 8,363 984,520 441,295 6,825 30,891 32,681 Dec-20 494,376 - - 1,487,259 10,334 - 18,697 1,468,562 450,515 11,101 31,242 63,572 Jan-21 899,980 - - 2,387,240 16,144 - 34,841 2,352,399 879,194 16,912 61,308 94,815 Feb-21 880,082 - - 3,267,322 23,561 - 58,402 3,208,920 859,583 24,425 59,380 156,123 Mar-21 890,199 - 269,897 4,427,418 30,937 2,249 91,588 4,335,830 877,483 34,147 59,961 215,503 Apr-21 1,020,595 - - 5,448,013 38,898 4,498 134,984 5,313,028 912,406 45,268 61,654 275,464
May-21 1,020,595 - - 6,468,608 47,403 4,498 186,886 6,281,722 913,910 54,278 61,120 337,117 Jun-21 1,029,242 - 134,499 7,632,349 55,944 5,619 248,450 7,383,900 927,797 64,446 61,384 398,237 Jul-21 1,461,993 - - 9,094,343 66,325 6,740 321,514 8,772,829 1,199,440 77,834 79,746 459,621
Aug-21 3,878,186 - - 12,972,529 88,575 4,491 414,580 12,557,949 3,064,136 103,753 210,483 539,368 Sep-21 4,573,146 - 1,154,637 18,700,312 123,789 16,362 554,731 18,145,580 3,801,799 154,412 259,329 749,851
Program Assumption
Investment in Shared Service Territory shared
with Partner Utility
See WP-SS-CEF-EE-1.xlsx'ITCap-E' wksht
Prior Month + (Col 1 + Col 1a + Col 2)
See WP-SS-CEF-EE-1.xlsx
'BkTaxSum' wksht
See WP-SS-CEF-EE-1.xlsx
'BkTaxSum' wksht
Prior Month + (Col 4 + Col 5) Col 3 - Col 6
See WP-SS-CEF-EE-1.xlsx
'BkTaxSum' wksht
See WP-SS-CEF-EE-1.xlsx
'BkTaxSum' wksht
See WP-SS-CEF-EE-1.xlsx
'BkTaxSum' wksht
See WP-SS-CEF-EE-1.xlsx
'BkTaxSum' wksht
Annual Summary
2019 - - - - - - - - - - - - 2020 1,487,259 - - - 18,697 - - 18,697 1,353,960 20,422 94,815 31,242 2021 27,250,846 - 2,715,662 1,156,629 1,066,868 130,927 35,622 1,216,492 22,841,563 1,301,031 1,531,532 198,903 2022 62,141,088 - 3,119,366 402,312 5,581,838 839,937 93,898 7,638,267 49,804,758 7,000,332 3,043,395 291,141 2023 80,242,992 - 804,616 - 12,679,129 1,260,865 110,661 21,578,261 61,319,860 14,977,401 3,294,949 322,589 2024 24,802,695 - - - 18,337,416 1,327,929 110,661 41,243,606 17,902,923 20,885,185 (212,039) 2,764 2025 15,263,493 - - - 20,386,672 1,327,929 110,661 62,958,207 15,160,029 23,770,732 (612,221) (69,327) 2026 3,735,611 - - - 21,327,409 1,216,262 84,677 85,501,878 11,733,070 25,589,120 (985,165) (90,141) 2027 - - - - 21,492,399 475,448 20,115 107,469,725 - 14,673,001 (1,043,250) (85,551) 2028 - - - - 21,492,399 60,346 - 129,022,470 - 14,257,899 (1,013,737) (84,121) 2029 - - - - 21,492,399 - - 150,514,869 - 14,197,553 (1,009,446) (84,121) 2030 - - - - 21,473,701 - - 171,988,570 - 14,180,565 (1,008,238) (83,453) 2031 - - - - 20,425,531 - - 192,414,101 - 13,274,221 (943,797) (70,960) 2032 - - - - 15,910,561 - - 208,324,661 - 9,694,892 (689,307) (43,815) 2033 - - - - 8,813,269 - - 217,137,931 - 4,613,887 (328,047) (11,461) 2034 - - - - 3,154,983 - - 220,292,913 - 1,197,926 (85,173) (4,613) 2035 - - - - 1,105,726 - - 221,398,640 - 419,413 (29,820) (924) 2036 - - - - 164,989 - - 221,563,629 - 62,582 (4,450) - 2037 - - - - - - - 221,563,629 - - - - 2038 - - - - - - - 221,563,629 - - - - 2039 - - - - - - - 221,563,629 - - - - 2040 - - - - - - - 221,563,629 - - - - 2041 - - - - - - - 221,563,629 - - - - 2042 - - - - - - - 221,563,629 - - - - 2043 - - - - - - - 221,563,629 - - - - 2044 - - - - - - - 221,563,629 - - - - Total 214,923,986 - 6,639,644 214,923,986 6,639,644 180,116,163 180,116,163 (0)
Oct 20 - Sep 21 17,141,279 - 510,274 44,457 14,789,709 595,897 1,009,180

Attachment 4
Monthly Calculation
Jan-20Feb-20Mar-20Apr-20
May-20Jun-20Jul-20
Aug-20Sep-20Oct-20Nov-20Dec-20Jan-21Feb-21Mar-21Apr-21
May-21Jun-21Jul-21
Aug-21Sep-21
Annual Summary
20192020202120222023202420252026202720282029203020312032203320342035203620372038203920402041204220432044Total
Oct 20 - Sep 21
PSE&G Clean Energy Future Energy Efficiency Program Schedule SS-CEF-EE-2GGas Revenue Requirements Calculation Page 2 of 2
Monthly WACC effective 11/1/2018 0.75136%Inc. tax rate effective 11/1/2018 28.11%
(12) (13) (14) (15) (16) (17) (18) (19) (20) (21)
Ending Acumulated
Deferred Income Tax
Average Net Investment Return Requirement
Program Investment Repayments Expenses Revenue Offsets Tax Flow-through
Tax Flow-Through Gross-up
Tax Adjustment on Loan
Revenue Requirements
- - - - - - - - - - - - - - - - - - - - - - - - - - - - - - - - - - - - - - - - - - - - - - - - - - - - - - - - - - - - - - - - - - - - - - - - - - - - - - - - -
32,681 236,180 1,775 (1,325) 524,340 (96,527) (37,744) (444) 392,188 63,572 696,654 5,234 (2,650) 524,340 (91,239) (35,676) (814) 405,446 94,815 1,147,348 8,621 (3,976) 524,340 (92,277) (36,082) (1,183) 409,777
156,123 1,785,012 13,412 (4,638) 524,340 (181,079) (70,805) (1,331) 296,043 215,503 2,594,847 19,497 (5,301) 524,340 (175,383) (68,577) (1,516) 316,620 275,464 3,526,892 26,500 (5,964) 524,340 (177,101) (69,249) (1,701) 330,012 337,117 4,518,139 33,947 (9,446) 524,340 (182,099) (71,203) (2,830) 336,106 398,237 5,429,698 40,796 (12,928) 524,340 (180,523) (70,587) (3,801) 349,199 459,621 6,403,881 48,116 (16,411) 524,340 (181,304) (70,892) (4,773) 360,640 539,368 7,578,870 56,944 (24,681) 572,406 (235,537) (92,098) (7,348) 342,750 749,851 10,020,779 75,292 (49,296) 572,406 (621,681) (243,086) (15,130) (188,429)
1,009,180 14,472,249 108,738 (73,912) 572,406 (765,951) (299,498) (21,997) (340,062)
See WP-SS-CEF-EE-1.xlsx
'BkTaxSum' wksht
(Prev Col 7 - Col 11 + Col 7 - Col 12) / 2
Col 15* Monthly Pre Tax
WACC Program Assumption Program
Assumption Program
Assumption
See WP-SS-CEF-EE-1.xlsx
'BkTaxSum' wksht
See WP-SS-CEF-EE-1.xlsx
'BkTaxSum' wksht
See WP-SS-CEF-EE-1.xlsx
'BkTaxSum' wksht
Col 4 + Col 5 + Col 14 + Col 15 + Col 68 + Col 17 + Col 18 + Col 19 +
Col 20
- - - - - - - - - - 63,572 94,815 15,630 (7,951) 1,573,020 - (280,043) (109,501) (2,441) 1,207,411
1,427,443 1,626,346 932,227 (571,464) 6,580,479 - (4,523,512) (1,768,757) (167,326) 1,679,442 4,378,600 4,669,741 4,807,551 (3,838,899) 7,087,828 - (8,988,929) (3,514,798) (1,079,090) 895,437 7,642,101 7,964,690 10,192,106 (9,570,699) 5,806,282 - (9,731,917) (3,805,316) (2,531,908) 4,298,543 7,749,887 7,752,651 13,610,437 (15,185,839) 2,687,298 - 626,275 244,882 (3,850,726) 17,797,672 7,209,757 7,140,430 13,621,233 (20,065,205) 784,992 - 1,808,248 707,050 (5,261,748) 13,309,172 6,245,406 6,155,265 12,535,441 (23,708,399) 260,028 - 2,909,771 1,137,761 (6,457,973) 9,220,301 5,197,565 5,112,015 10,764,574 - 129,185 - 3,081,330 1,204,843 2,852,387 40,000,167 4,182,398 4,098,278 8,898,731 - 105,518 - 2,994,159 1,170,758 2,852,387 37,574,297 3,172,952 3,088,832 7,050,873 - 62,379 - 2,981,486 1,165,803 2,852,387 35,605,327 2,164,047 2,080,594 5,204,208 - 23,585 - 2,977,919 1,164,408 2,851,719 33,695,540 1,207,756 1,136,797 3,385,371 - 24,293 - 2,787,586 1,089,985 2,796,263 30,509,029
491,305 447,490 1,795,788 - 25,022 - 2,035,927 796,076 2,430,414 22,993,788 130,903 119,442 712,780 - 25,773 - 968,916 378,860 1,642,017 12,541,616 38,883 34,270 231,028 - 13,077 - 251,564 98,365 765,237 4,514,254 5,373 4,450 51,299 - - - 88,077 34,439 268,358 1,547,899
- - 4,472 - - - 13,142 5,139 40,043 227,785 - - (0) - - - - - - (0) - - (0) - - - - - - (0) - - (0) - - - - - - (0) - - (0) - - - - - - (0) - - (0) - - - - - - (0) - - (0) - - - - - - (0) - - (0) - - - - - - (0) - - - - - - - - - -
93,813,750 (72,948,457) 25,188,759 - 0 0 (0) 267,617,681
438,873 (210,528) 6,436,280 - (2,980,701) (1,165,496) (62,868) 3,010,291

Attachment 4
PSE&G Clean Energy Future Energy Efficiency Program Schedule SS-CEF-EE-3Proposed Rate Calculations($'s Unless Specified)
Current SUT Rate 6.625%
Line Date(s) Electric Gas Source/Description
1 Oct 20 - Sep 21
Revenue Requirements 8,766,394 3,010,291 SS-2E/G, Col 23
2 Oct 20 - Sep 21 Forecasted ($/kWh or $/Therm) 40,681,934 2,852,756
3 Proposed Rate w/o SUT ($/kWh or $/Therm) 0.000215 0.001055 Line 1 / Line 2 [Rnd 6)
4 Public Notice Rate w/o SUT ($/kWh) 0.000215 0.001055 Line 3
5 Proposed Rate w/ SUT ($/kWh or $/Therm) 0.000229 0.001125 (Line 3 * (1 + SUT Rate)) [Rnd 6]
6 Existing Rate w/o SUT ($/kWh or $/Therm) 0.000000 0.000000
7 Difference in Proposed and Existing Rate 0.000215 0.001055 (Line 3 - Line 6)
8 Resultant CEF-EE Program Revenue Increase / (Decrease) 8,746,616 3,009,657 (Line 2 * Line 7 * 1,000)

Attachment 4
PSE&G Clean Energy Future Energy Efficiency Program Schedule SS-CEF-EE-4E
Electric GPRC Recovery Charge (GPRC) - Rate Impact Analysis6,920 Avg RS kWh / yr.
740 Avg RS kWh / Summer Month6.625% SUT Rate effective 1/1/2018 495 Avg RS kWh / Winter Month
40,681,934 kWh Sales (000) - Oct 20 - Sep 2140,681,934 kWh Sales (000) - Oct 20 - thereafter 0.001901 Current electric GPRC ($/kWh)
(1) (2) (3) (4) (5) (6) (7) (8) (9) (10) (11) (12) (13) (14) (15) (16)Typical RS GPRC ($)
Electric CEF-EE Revenue
Requirements 2
ElectricCEF-EEC w/o SUT ($/kWh)
Electric CEF-EEC
w/ SUT ($/kWh)3 RS RHS RLM GLP LPL-S LPL-P HTS-S
SummerMonthly
Bill
WinterMonthly
Bill Annual Bill
Change in RS Typical Annual Bill
($'s)
RS Typical Annual Bill
($'s) 3
% Change in RS Typical Annual Bill
Current 0.189699 0.143870 0.188949 0.168403 0.130598 0.105895 0.090674 1.41 0.94 13.16 1,312.72 Oct 20 - Sep 21 8,766,394 0.000215 0.000229 0.189928 0.144099 0.189178 0.168632 0.130827 0.106124 0.090903 1.58 1.05 14.72 $1.56 1,314.28 0.12%Oct 21 - Sep 22 (2,310,773) (0.000057) (0.000061) 0.189638 0.143809 0.188888 0.168342 0.130537 0.105834 0.090613 1.36 0.91 12.72 -$0.44 1,312.28 -0.03%Oct 22 - Sep 23 11,493,290 0.000283 0.000302 0.190001 0.144172 0.189251 0.168705 0.130900 0.106197 0.090976 1.63 1.09 15.24 $2.08 1,314.80 0.16%Oct 23 - Sep 24 35,878,508 0.000882 0.000940 0.190639 0.144810 0.189889 0.169343 0.131538 0.106835 0.091614 2.10 1.41 19.68 $6.52 1,319.24 0.50%Oct 24 - Sep 25 36,083,142 0.000887 0.000946 0.190645 0.144816 0.189895 0.169349 0.131544 0.106841 0.091620 2.11 1.41 19.72 $6.56 1,319.28 0.50%Oct 25 - Sep 26 12,344,026 0.000303 0.000323 0.190022 0.144193 0.189272 0.168726 0.130921 0.106218 0.090997 1.65 1.10 15.40 $2.24 1,314.96 0.17%Oct 26 - Sep 27 113,476,801 0.002789 0.002974 0.192673 0.146844 0.191923 0.171377 0.133572 0.108869 0.093648 3.61 2.41 33.72 $20.56 1,333.28 1.57%Oct 27 - Sep 28 140,246,121 0.003447 0.003675 0.193374 0.147545 0.192624 0.172078 0.134273 0.109570 0.094349 4.13 2.76 38.60 $25.44 1,338.16 1.94%Oct 28 - Sep 29 132,693,551 0.003262 0.003478 0.193177 0.147348 0.192427 0.171881 0.134076 0.109373 0.094152 3.98 2.66 37.20 $24.04 1,336.76 1.83%Oct 29 - Sep 30 125,644,735 0.003088 0.003293 0.192992 0.147163 0.192242 0.171696 0.133891 0.109188 0.093967 3.84 2.57 35.92 $22.76 1,335.48 1.73%Oct 30 - Sep 31 116,766,520 0.002870 0.003060 0.192759 0.146930 0.192009 0.171463 0.133658 0.108955 0.093734 3.67 2.46 34.36 $21.20 1,333.92 1.61%Oct 31 - Sep 32 92,363,341 0.002270 0.002420 0.192119 0.146290 0.191369 0.170823 0.133018 0.108315 0.093094 3.20 2.14 29.92 $16.76 1,329.48 1.28%Oct 32 - Sep 33 55,444,874 0.001363 0.001453 0.191152 0.145323 0.190402 0.169856 0.132051 0.107348 0.092127 2.48 1.66 23.20 $10.04 1,322.76 0.76%Oct 33 - Sep 34 17,734,940 0.000436 0.000465 0.190164 0.144335 0.189414 0.168868 0.131063 0.106360 0.091139 1.75 1.17 16.36 $3.20 1,315.92 0.24%Oct 34 - Sep 35 4,558,249 0.000112 0.000119 0.189818 0.143989 0.189068 0.168522 0.130717 0.106014 0.090793 1.49 1.00 13.96 $0.80 1,313.52 0.06%Oct 35 - Sep 36 854,834 0.000021 0.000022 0.189721 0.143892 0.188971 0.168425 0.130620 0.105917 0.090696 1.42 0.95 13.28 $0.12 1,312.84 0.01%Oct 36 - Sep 37 26,982 0.000001 0.000001 0.189700 0.143871 0.188950 0.168404 0.130599 0.105896 0.090675 1.41 0.94 13.16 $0.00 1,312.72 0.00%Oct 37 - Sep 38 0 - - 0.189699 0.143870 0.188949 0.168403 0.130598 0.105895 0.090674 1.41 0.94 13.16 $0.00 1,312.72 0.00%Oct 38 - Sep 39 0 - - 0.189699 0.143870 0.188949 0.168403 0.130598 0.105895 0.090674 1.41 0.94 13.16 $0.00 1,312.72 0.00%Oct 39 - Sep 40 0 - - 0.189699 0.143870 0.188949 0.168403 0.130598 0.105895 0.090674 1.41 0.94 13.16 $0.00 1,312.72 0.00%Oct 40 - Sep 41 0 - - 0.189699 0.143870 0.188949 0.168403 0.130598 0.105895 0.090674 1.41 0.94 13.16 $0.00 1,312.72 0.00%Oct 41 - Sep 42 0 - - 0.189699 0.143870 0.188949 0.168403 0.130598 0.105895 0.090674 1.41 0.94 13.16 $0.00 1,312.72 0.00%Oct 42 - Sep 43 0 - - 0.189699 0.143870 0.188949 0.168403 0.130598 0.105895 0.090674 1.41 0.94 13.16 $0.00 1,312.72 0.00%Oct 43 - Sep 44 0 - - 0.189699 0.143870 0.188949 0.168403 0.130598 0.105895 0.090674 1.41 0.94 13.16 $0.00 1,312.72 0.00%
From Schedule SS-CEF-EE-2E
Col 23
Col 1 / [kWh Sales] (Rnd
to 6 dec.)
Col 2 * (1 + SUT Rate) Rnd 6
(Cur. eGPRC +
Col 3) * Avg RS kWh Sum Mo Rnd 2
(Cur. eGPRC +
Col 3) * Avg RS kWh Win MoRnd 2
(4 * Col 11) +
(8 * Col 12)
Col 13 - CurrentCol 13
CurrentCol 15 +Col 14
Col 14 /Current Col
15Rnd 4
RS RHS RLM GLP LPL-S LPL-P HTS-SApr 19 - Sep 20 0.00% 0.00% 0.00% 0.00% 0.00% 0.00% 0.00%Oct 20 - Sep 21 0.12% 0.16% 0.12% 0.14% 0.18% 0.22% 0.25%Oct 21 - Sep 22 -0.03% -0.04% -0.03% -0.04% -0.05% -0.06% -0.07%Oct 22 - Sep 23 0.16% 0.21% 0.16% 0.18% 0.23% 0.29% 0.33%Oct 23 - Sep 24 0.50% 0.65% 0.50% 0.56% 0.72% 0.89% 1.04%Oct 24 - Sep 25 0.50% 0.66% 0.50% 0.56% 0.72% 0.89% 1.04%Oct 25 - Sep 26 0.17% 0.22% 0.17% 0.19% 0.25% 0.31% 0.36%Oct 26 - Sep 27 1.57% 2.07% 1.57% 1.77% 2.28% 2.81% 3.28%Oct 27 - Sep 28 1.94% 2.55% 1.94% 2.18% 2.81% 3.47% 4.05%Oct 28 - Sep 29 1.83% 2.42% 1.84% 2.07% 2.66% 3.28% 3.84%Oct 29 - Sep 30 1.74% 2.29% 1.74% 1.96% 2.52% 3.11% 3.63%Oct 30 - Sep 31 1.61% 2.13% 1.62% 1.82% 2.34% 2.89% 3.37%Oct 31 - Sep 32 1.28% 1.68% 1.28% 1.44% 1.85% 2.29% 2.67%Oct 32 - Sep 33 0.77% 1.01% 0.77% 0.86% 1.11% 1.37% 1.60%Oct 33 - Sep 34 0.25% 0.32% 0.25% 0.28% 0.36% 0.44% 0.51%Oct 34 - Sep 35 0.06% 0.08% 0.06% 0.07% 0.09% 0.11% 0.13%Oct 35 - Sep 36 0.01% 0.02% 0.01% 0.01% 0.02% 0.02% 0.02%Oct 36 - Sep 37 0.00% 0.00% 0.00% 0.00% 0.00% 0.00% 0.00%Oct 37 - Sep 38 0.00% 0.00% 0.00% 0.00% 0.00% 0.00% 0.00%Oct 38 - Sep 39 0.00% 0.00% 0.00% 0.00% 0.00% 0.00% 0.00%Oct 39 - Sep 40 0.00% 0.00% 0.00% 0.00% 0.00% 0.00% 0.00%Oct 40 - Sep 41 0.00% 0.00% 0.00% 0.00% 0.00% 0.00% 0.00%Oct 41 - Sep 42 0.00% 0.00% 0.00% 0.00% 0.00% 0.00% 0.00%Oct 42 - Sep 43 0.00% 0.00% 0.00% 0.00% 0.00% 0.00% 0.00%
1 All customers assumed to have BGS Supply2 Initial Rate period is October 2020 to September 2021 for the CEF-EE Program 3 SUT is assumed at the current SUT rate effective January 1, 2018 through the life of the Program4 The rates are based on a typical residential bill as of September 1, 2020
Class Average Rate w/SUT - $/kWh 1
Current Class Avg Rate + Col 3 for Each Rate Class (Col 4 thru Col 11)
% Change from Current Class Average Rate w/SUT

Attachment 4
PSE&G Clean Energy Future Energy Efficiency Program Schedule SS-CEF-EE-4G
Gas GPRC Recovery Charge (GPRC) - Rate Impact Analysis
1,040 Typical RSG Therms / yr.6.625% SUT Rate effective 1/1/2018 0.004361 Current gas GPRC ($/therm)
2,852,756 Therm Sales (000) 172 89 29 Monthly Therms2,852,756 Therm Sales (000) 4 2 6 # of Months/year
(1) (2) (3) (4) (5) (6) (7) (8) (9) (10) (11) (12) (13) (14) (15) (16)Typical RSG GPRC ($)
Gas CEF-EE Revenue
Requirements 2
GasCEF-EEC w/o SUT ($/therm)
GasCEF-EEC
w/ SUT ($/therm) 3 RSG GSG LVG TSG-F TSG-NF CIGDec-Mar
Monthly BillNov & Apr
Monthly BillMay-Oct
Monthly Bill Annual Bill
Change in RSG Typcial Annual Bill
($'s)
RSG Typical Annual Bill
($'s)4
% Change in RSG Typical Annual Bill
Current 0.839154 0.905645 0.728062 0.614771 0.570814 0.413154 0.75 0.39 0.13 4.56 872.72Oct 20 - Sep 21 3,010,291 0.001055 0.001125 0.840279 0.906770 0.729187 0.615896 0.571939 0.414209 0.94 0.49 0.16 5.70 $1.14 873.86 0.13%Oct 21 - Sep 22 339,194 0.000119 0.000127 0.839281 0.905772 0.728189 0.614898 0.570941 0.413273 0.77 0.40 0.13 4.66 $0.10 872.82 0.01%Oct 22 - Sep 23 3,657,933 0.001282 0.001367 0.840521 0.907012 0.729429 0.616138 0.572181 0.414436 0.99 0.51 0.17 6.00 $1.44 874.16 0.17%Oct 23 - Sep 24 14,760,013 0.005174 0.005517 0.844671 0.911162 0.733579 0.620288 0.576331 0.418328 1.70 0.88 0.29 10.30 $5.74 878.46 0.66%Oct 24 - Sep 25 14,685,113 0.005148 0.005489 0.844643 0.911134 0.733551 0.620260 0.576303 0.418302 1.69 0.88 0.29 10.26 $5.70 878.42 0.65%Oct 25 - Sep 26 9,791,235 0.003432 0.003659 0.842813 0.909304 0.731721 0.618430 0.574473 0.416586 1.38 0.71 0.23 8.32 $3.76 876.48 0.43%Oct 26 - Sep 27 32,421,115 0.011365 0.012118 0.851272 0.917763 0.740180 0.626889 0.582932 0.424519 2.83 1.47 0.48 17.14 $12.58 885.30 1.44%Oct 27 - Sep 28 38,117,867 0.013362 0.014247 0.853401 0.919892 0.742309 0.629018 0.585061 0.426516 3.20 1.66 0.54 19.36 $14.80 887.52 1.70%Oct 28 - Sep 29 36,086,599 0.012650 0.013488 0.852642 0.919133 0.741550 0.628259 0.584302 0.425804 3.07 1.59 0.52 18.58 $14.02 886.74 1.61%Oct 29 - Sep 30 34,181,256 0.011982 0.012776 0.851930 0.918421 0.740838 0.627547 0.583590 0.425136 2.95 1.53 0.50 17.86 $13.30 886.02 1.52%Oct 30 - Sep 31 31,682,744 0.011106 0.011842 0.850996 0.917487 0.739904 0.626613 0.582656 0.424260 2.79 1.44 0.47 16.86 $12.30 885.02 1.41%Oct 31 - Sep 32 25,257,132 0.008854 0.009441 0.848595 0.915086 0.737503 0.624212 0.580255 0.422008 2.37 1.23 0.40 14.34 $9.78 882.50 1.12%Oct 32 - Sep 33 15,335,201 0.005376 0.005732 0.844886 0.911377 0.733794 0.620503 0.576546 0.418530 1.74 0.90 0.29 10.50 $5.94 878.66 0.68%Oct 33 - Sep 34 5,731,956 0.002009 0.002142 0.841296 0.907787 0.730204 0.616913 0.572956 0.415163 1.12 0.58 0.19 6.78 $2.22 874.94 0.25%Oct 34 - Sep 35 2,145,058 0.000752 0.000802 0.839956 0.906447 0.728864 0.615573 0.571616 0.413906 0.89 0.46 0.15 5.38 $0.82 873.54 0.09%Oct 35 - Sep 36 402,275 0.000141 0.000150 0.839304 0.905795 0.728212 0.614921 0.570964 0.413295 0.78 0.40 0.13 4.70 $0.14 872.86 0.02%Oct 36 - Sep 37 12,697 0.000004 0.000004 0.839158 0.905649 0.728066 0.614775 0.570818 0.413158 0.75 0.39 0.13 4.56 $0.00 872.72 0.00%Oct 37 - Sep 38 (0) - - 0.839154 0.905645 0.728062 0.614771 0.570814 0.413154 0.75 0.39 0.13 4.56 $0.00 872.72 0.00%Oct 38 - Sep 39 (0) - - 0.839154 0.905645 0.728062 0.614771 0.570814 0.413154 0.75 0.39 0.13 4.56 $0.00 872.72 0.00%Oct 39 - Sep 40 (0) - - 0.839154 0.905645 0.728062 0.614771 0.570814 0.413154 0.75 0.39 0.13 4.56 $0.00 872.72 0.00%Oct 40 - Sep 41 (0) - - 0.839154 0.905645 0.728062 0.614771 0.570814 0.413154 0.75 0.39 0.13 4.56 $0.00 872.72 0.00%Oct 41 - Sep 42 (0) - - 0.839154 0.905645 0.728062 0.614771 0.570814 0.413154 0.75 0.39 0.13 4.56 $0.00 872.72 0.00%Oct 42 - Sep 43 (0) - - 0.839154 0.905645 0.728062 0.614771 0.570814 0.413154 0.75 0.39 0.13 4.56 $0.00 872.72 0.00%Oct 43 - Sep 44 (0) - - 0.839154 0.905645 0.728062 0.614771 0.570814 0.413154 0.75 0.39 0.13 4.56 $0.00 872.72 0.00%
From Schedule SS-CEF-EE-2G
Col 23
Col 1 / Therm Sales
Col 2 * (1 + SUT Rate) Rnd 6
(Cur. GPRC + Col 3) * Dec-Mar Monthly ThermsRnd 2
(Cur. GPRC + Col 3) * Nov & Apr Monthly ThermsRnd 2
(Cur. GPRC + Col 3) * May-Oct Monthly ThermsRnd 2
(4 * Col 10) +
( 2 * Col 11) +
(6 * Col 12)
Col 13 - CurrentCol 13
CurrentCol 15 +Col 14
Col 14 /Current Col
15Rnd 4
RSG GSG LVG TSG-F TSG-NF CIGApr 19 - Sep 20 0.00% 0.00% 0.00% 0.00% 0.00% 0.00%Oct 20 - Sep 21 0.13% 0.12% 0.15% 0.18% 0.20% 0.27%Oct 21 - Sep 22 0.02% 0.01% 0.02% 0.02% 0.02% 0.03%Oct 22 - Sep 23 0.16% 0.15% 0.19% 0.22% 0.24% 0.33%Oct 23 - Sep 24 0.66% 0.61% 0.76% 0.90% 0.97% 1.34%Oct 24 - Sep 25 0.65% 0.61% 0.75% 0.89% 0.96% 1.33%Oct 25 - Sep 26 0.44% 0.40% 0.50% 0.60% 0.64% 0.89%Oct 26 - Sep 27 1.44% 1.34% 1.66% 1.97% 2.12% 2.93%Oct 27 - Sep 28 1.70% 1.57% 1.96% 2.32% 2.50% 3.45%Oct 28 - Sep 29 1.61% 1.49% 1.85% 2.19% 2.36% 3.26%Oct 29 - Sep 30 1.52% 1.41% 1.75% 2.08% 2.24% 3.09%Oct 30 - Sep 31 1.41% 1.31% 1.63% 1.93% 2.07% 2.87%Oct 31 - Sep 32 1.13% 1.04% 1.30% 1.54% 1.65% 2.29%Oct 32 - Sep 33 0.68% 0.63% 0.79% 0.93% 1.00% 1.39%Oct 33 - Sep 34 0.26% 0.24% 0.29% 0.35% 0.38% 0.52%Oct 34 - Sep 35 0.10% 0.09% 0.11% 0.13% 0.14% 0.19%Oct 35 - Sep 36 0.02% 0.02% 0.02% 0.02% 0.03% 0.04%Oct 36 - Sep 37 0.00% 0.00% 0.00% 0.00% 0.00% 0.00%Oct 37 - Sep 38 0.00% 0.00% 0.00% 0.00% 0.00% 0.00%Oct 38 - Sep 39 0.00% 0.00% 0.00% 0.00% 0.00% 0.00%Oct 39 - Sep 40 0.00% 0.00% 0.00% 0.00% 0.00% 0.00%Oct 40 - Sep 41 0.00% 0.00% 0.00% 0.00% 0.00% 0.00%Oct 41 - Sep 42 0.00% 0.00% 0.00% 0.00% 0.00% 0.00%Oct 42 - Sep 43 0.00% 0.00% 0.00% 0.00% 0.00% 0.00%
1 All customers assumed to have BGSS Supply2 Initial Rate period is October 2020 to September 2021 for the CEF-EE Program 3 SUT is assumed at the current SUT rate effective January 1, 2018 through the life of the Program4 The rates are based on a typical residential bill as of September 1, 2020
Oct 20 - Sep 21Oct 20 - thereafter
Class Average Rate w/SUT - $/therm1
Current Class Avg Rate + Col 3 for Each Rate Class (Col 4 thru Col 10)
% Change from Current Class Average Rate w/SUT

Attachment 4
PSE&G Clean Energy Future Energy Efficiency Program Schedule SS-CEF-EE-6EElectric Over/(Under) Calculation
Reflects a tax rate of 28.11%Existing Rate / kWh (w/o SUT) 0.000000Proposed Rate / kWh (w/o SUT) 0.000215
(1) (2) (3) (4) (5) (6) (7) (8) (9) (10)
Over / (Under) Recovery Beginning
BalanceElectric
RevenuesRevenue
RequirementOver / (Under)
Recovery
Over / (Under) Recovery Ending
Balance
Over / (Under) Average Monthly
BalanceInterest Rate (Annualized)
Interest On Over / (Under) Average Monthly Balance Interest Roll-In
Cumulative Interest
Monthly Calculation
Jan-20 - - - - - - 2.14% - - - Feb-20 - - - - - - 2.14% - - - Mar-20 - - - - - - 2.14% - - - Apr-20 - - - - - - 2.14% - - -
May-20 - - - - - - 2.14% - - - Jun-20 - - - - - - 2.14% - - - Jul-20 - - - - - - 2.14% - - -
Aug-20 - - - - - - 2.14% - - - Sep-20 - - - - - - 2.14% - - - Oct-20 - 666,051 1,224,371 (558,320) (558,320) (279,160) 2.14% (358) - (358) Nov-20 (558,320) 629,938 1,256,745 (626,807) (1,185,127) (871,724) 2.14% (1,118) - (1,475) Dec-20 (1,185,127) 718,729 1,270,142 (551,413) (1,736,540) (1,460,833) 2.14% (1,873) - (3,348) Jan-21 (1,736,540) 758,469 1,156,338 (397,869) (2,134,409) (1,935,474) 2.14% (2,481) - (5,830) Feb-21 (2,134,409) 688,465 1,173,299 (484,834) (2,619,243) (2,376,826) 2.14% (3,047) - (8,877) Mar-21 (2,619,243) 692,767 1,197,355 (504,587) (3,123,830) (2,871,537) 2.14% (3,681) - (12,558) Apr-21 (3,123,830) 599,517 887,755 (288,237) (3,412,068) (3,267,949) 2.14% (4,190) - (16,748)
May-21 (3,412,068) 671,801 904,615 (232,814) (3,644,881) (3,528,475) 2.14% (4,524) - (21,272) Jun-21 (3,644,881) 781,108 919,363 (138,255) (3,783,137) (3,714,009) 2.14% (4,762) - (26,033) Jul-21 (3,783,137) 911,272 771,929 139,343 (3,643,794) (3,713,465) 2.14% (4,761) - (30,794)
Aug-21 (3,643,794) 908,713 (871,699) 1,780,412 (1,863,382) (2,753,588) 2.14% (3,530) - (34,324) Sep-21 (1,863,382) 719,786 (1,123,818) 1,843,604 (19,778) (941,580) 2.14% (1,207) - (35,531)
(Prior Col 5) + (Col 9)
Forecasted kWh * Proposed Rate
See Revenue Requirements Schedule for
Details
Col 2 - Col 3 Col 1 + Col 4 (Col 1 + Col 5) / 2 (Col 6 * (Col 7) / 12)*net of tax rate
Prior Month + Col 8 - Col 9

Attachment 4
PSE&G Clean Energy Future Energy Efficiency Program Schedule SS-CEF-EE-6GGas Over/(Under) Calculation
Reflects a tax rate of 28.11%Existing Rate / Therms (w/o SUT) 0.000000Proposed Rate /Therms (w/o SUT) 0.001055
(1) (2) (3) (4) (5) (6) (7) (8) (9) (10)
Over / (Under) Recovery Beginning
Balance Gas RevenuesRevenue
RequirementOver / (Under)
Recovery
Over / (Under) Recovery Ending
Balance
Over / (Under) Average Monthly
BalanceInterest Rate (Annualized)
Interest On Over / (Under) Average Monthly Balance Interest Roll-In
Cumulative Interest
Monthly Calculations
Jan-20 - - - - - - 2.14% - - - Feb-20 - - - - - - 2.14% - - - Mar-20 - - - - - - 2.14% - - - Apr-20 - - - - - - 2.14% - - -
May-20 - - - - - - 2.14% - - - Jun-20 - - - - - - 2.14% - - - Jul-20 - - - - - - 2.14% - - -
Aug-20 - - - - - - 2.14% - - - Sep-20 - - - - - - 2.14% - - - Oct-20 - 154,120 392,188 (238,067) (238,067) (119,034) 2.14% (153) - (153) Nov-20 (238,067) 293,829 405,446 (111,617) (349,684) (293,875) 2.14% (377) - (529) Dec-20 (349,684) 441,840 409,777 32,063 (317,621) (333,652) 2.14% (428) - (957) Jan-21 (317,621) 537,726 296,043 241,683 (75,938) (196,779) 2.14% (252) - (1,209) Feb-21 (75,938) 479,764 316,620 163,144 87,206 5,634 2.14% 7 - (1,202) Mar-21 87,206 388,702 330,012 58,690 145,896 116,551 2.14% 149 - (1,053) Apr-21 145,896 241,498 336,106 (94,608) 51,288 98,592 2.14% 126 - (926)
May-21 51,288 122,145 349,199 (227,054) (175,766) (62,239) 2.14% (80) - (1,006) Jun-21 (175,766) 101,527 360,640 (259,113) (434,880) (305,323) 2.14% (391) - (1,398) Jul-21 (434,880) 80,892 342,750 (261,858) (696,737) (565,809) 2.14% (725) - (2,123)
Aug-21 (696,737) 84,379 (188,429) 272,808 (423,929) (560,333) 2.14% (718) - (2,841) Sep-21 (423,929) 83,234 (340,062) 423,296 (634) (212,281) 2.14% (272) - (3,113)
(Prior Col 5) + (Col 9)
See Revenue Requirements Schedule for
Details
Col 2 - Col 3 Col 1 + Col 4 (Col 1 + Col 5) / 2
PSE&G CP/STD Wght Avg Rate from Previous
Month
(Col 6 * (Col 7) / 12)*net of tax rate
Prior Month + Col 8 - Col 9

PUBLIC SERVICE ELECTRIC AND GAS COMPANY XXX Revised Sheet No. 65
Superseding B.P.U.N.J. No. 16 ELECTRIC XXX Revised Sheet No. 65
GREEN PROGRAMS RECOVERY CHARGE
Charge (per kilowatt-hour)
Component:
Carbon Abatement Program ................................................................................................ $0.000022 Energy Efficiency Economic Stimulus Program ................................................................... ($0.000060) Demand Response Program ............................................................................................... $0.000000 Solar Generation Investment Program ................................................................................ $0.000767 Solar Loan II Program .......................................................................................................... $0.000282 Energy Efficiency Economic Extension Program ................................................................. ($0.000079) Solar Generation Investment Extension Program ............................................................... ($0.000035) Solar Loan III Program ......................................................................................................... ($0.000060) Energy Efficiency Economic Extension Program II .............................................................. $0.000274 Solar Generation Investment Extension II Program ............................................................ ($0.000035) Energy Efficiency 2017 Program ......................................................................................... $0.000175 Transition Renewable Energy Certificate Program ............................................................... $0.000532 Clean Energy Future - Energy Efficiency Program ............................................................... $0.000000 Sub-total per kilowatt-hour .................................................................................................... $0.001783
Charge including New Jersey Sales and Use Tax (SUT) ........................................................ $0.001901
GREEN PROGRAMS RECOVERY CHARGE
This charge is designed to recover the revenue requirements associated with the PSE&G Green Programs and other Board of Public Utilities (BPU) Programs approved for collection via this charge. The charge will be reset nominally on an annual basis. Interest at the weighted average of the interest rates on PSE&G’s commercial paper and bank credit lines utilized in the prior month will be accrued monthly on any under- or over- recovered balances. The interest rates shall be reset each month.
Date of Issue: Effective: Issued by SCOTT S. JENNINGS, SVP - Corporate Planning, Strategy and Utility Finance – PSE&G
80 Park Plaza, Newark, New Jersey 07102 Filed pursuant to Order of Board of Public Utilities dated
in Docket No.
Attachment 5 Page 1 of 13

PUBLIC SERVICE ELECTRIC AND GAS COMPANY XXX Revised Sheet No. 65
Superseding B.P.U.N.J. No. 16 ELECTRIC XXX Revised Sheet No. 65
GREEN PROGRAMS RECOVERY CHARGE
Charge (per kilowatt-hour) Component:
Carbon Abatement Program ................................................................................................ $0.000022 Energy Efficiency Economic Stimulus Program ................................................................... ($0.000060) Demand Response Program ............................................................................................... $0.000000 Solar Generation Investment Program ................................................................................ $0.000767 Solar Loan II Program .......................................................................................................... $0.000282 Energy Efficiency Economic Extension Program ................................................................. ($0.000079) Solar Generation Investment Extension Program ............................................................... ($0.000035) Solar Loan III Program ......................................................................................................... ($0.000060) Energy Efficiency Economic Extension Program II .............................................................. $0.000274 Solar Generation Investment Extension II Program ............................................................ ($0.000035) Energy Efficiency 2017 Program ......................................................................................... $0.000175 Transition Renewable Energy Certificate Program ............................................................... $0.000532 Clean Energy Future - Energy Efficiency Program ............................................................... $0.000000 Sub-total per kilowatt-hour .................................................................................................... $0.001783 Charge including New Jersey Sales and Use Tax (SUT) ........................................................ $0.001901
GREEN PROGRAMS RECOVERY CHARGE
This charge is designed to recover the revenue requirements associated with the PSE&G Green Programs and other Board of Public Utilities (BPU) Programs approved for collection via this charge. The charge will be reset nominally on an annual basis. Interest at the weighted average of the interest rates on PSE&G’s commercial paper and bank credit lines utilized in the prior month will be accrued monthly on any under- or over- recovered balances. The interest rates shall be reset each month.
Date of Issue: Effective:
Issued by SCOTT S. JENNINGS, SVP - Corporate Planning, Strategy and Utility Finance – PSE&G 80 Park Plaza, Newark, New Jersey 07102
Filed pursuant to Order of Board of Public Utilities dated in Docket No.
Attachment 5 Page 2 of 13

PUBLIC SERVICE ELECTRIC AND GAS COMPANY XXX Revised Sheet No. 44
Superseding
B.P.U.N.J. No. 16 GAS XXX Revised Sheet No. 44
GREEN PROGRAMS RECOVERY CHARGE
CHARGE APPLICABLE TO
RATE SCHEDULES RSG, GSG, LVG, SLG,
TSG-F, TSG-NF, CIG, CSG
(Per Therm)
Component:
Carbon Abatement Program ................................................................................................ $ 0.000834 Energy Efficiency Economic Stimulus Program ................................................................... (0.000555) Energy Efficiency Economic Extension Program ................................................................. (0.000369) Energy Efficiency Economic Extension Program II .............................................................. 0.002340 Energy Efficiency 2017 Program ......................................................................................... 0.001840 Clean Energy Future - Energy Efficiency Program .............................................................. 0.000000 Green Programs Recovery Charge ..................................................................................... $ 0.004090 Green Programs Recovery Charge including New Jersey Sales and Use Tax (SUT)…… . $ 0.004361
Green Programs Recovery Charge
This charge is designed to recover the revenue requirements associated with the PSE&G Green Programs. The charge will be reset nominally on an annual basis. Interest at the weighted average of the interest rates on PSE&G’s commercial paper and bank credit lines utilized in the prior month will be accrued monthly on any under- or over- recovered balances. The interest rate shall be reset each month. See Section 16 of the Standard Terms and Conditions for exemptions from this charge. Date of Issue: Effective:
Issued by SCOTT S. JENNINGS, SVP - Corporate Planning, Strategy and Utility Finance – PSE&G 80 Park Plaza, Newark, New Jersey 07102
Filed pursuant to Order of Board of Public Utilities dated in Docket No.
Attachment 5 Page 3 of 13

PUBLIC SERVICE ELECTRIC AND GAS COMPANY XXX Revised Sheet No. 44
Superseding
B.P.U.N.J. No. 16 GAS XXX Revised Sheet No. 44
GREEN PROGRAMS RECOVERY CHARGE
CHARGE APPLICABLE TO
RATE SCHEDULES RSG, GSG, LVG, SLG,
TSG-F, TSG-NF, CIG, CSG
(Per Therm)
Component:
Carbon Abatement Program ................................................................................................ $ 0.000834 Energy Efficiency Economic Stimulus Program ................................................................... (0.000555) Energy Efficiency Economic Extension Program ................................................................. (0.000369) Energy Efficiency Economic Extension Program II .............................................................. 0.002340 Energy Efficiency 2017 Program ......................................................................................... 0.001840 Clean Energy Future - Energy Efficiency Program .............................................................. 0.000000 Green Programs Recovery Charge ..................................................................................... $ 0.004090 Green Programs Recovery Charge including New Jersey Sales and Use Tax (SUT)…… . $ 0.004361
Green Programs Recovery Charge
This charge is designed to recover the revenue requirements associated with the PSE&G Green Programs. The charge will be reset nominally on an annual basis. Interest at the weighted average of the interest rates on PSE&G’s commercial paper and bank credit lines utilized in the prior month will be accrued monthly on any under- or over- recovered balances. The interest rate shall be reset each month. See Section 16 of the Standard Terms and Conditions for exemptions from this charge. Date of Issue: Effective:
Issued by SCOTT S. JENNINGS, SVP - Corporate Planning, Strategy and Utility Finance – PSE&G 80 Park Plaza, Newark, New Jersey 07102
Filed pursuant to Order of Board of Public Utilities dated in Docket No.
Attachment 5 Page 4 of 13

PUBLIC SERVICE ELECTRIC AND GAS COMPANY
B.P.U.N.J. No. 16 ELECTRIC Original Sheet No. XX
CONSERVATION INCENTIVE PROGRAM
CHARGE APPLICABLE TO RATE SCHEDULES RS, RHS, RLM, GLP, LPL-S
Conservation
Incentive Program
Conservation Incentive Program
including SUT
RS & RHS $0.000000 $0.000000 Per kilowatt-hour RLM $0.000000 $0.000000 Per kilowatt-hour GLP $0.0000 $0.0000 Per kilowatt of monthly peak demand LPL-S $0.0000 $0.0000 Per kilowatt of monthly peak demand
Conservation Incentive Program This charge shall be applicable to the rate schedules listed above. The Conservation Incentive Program shall be based on the differences between actual and allowed revenue per customer during the preceding annual period. The Conservation Incentive Program mechanism shall be determined as follows: I. DEFINITION OF TERMS AS USED HEREIN 1. Actual Number of Customers - the Actual Number of Customers (“ANC”) shall be determined on a monthly basis for each of the Customer Class Groups to which the Conservation Incentive Program (“CIP”) Clause applies. The ANC shall equal the aggregate actual monthly Service Charge revenue for each class of customers subject to the CIP as recorded on the Company’s books, divided by the service charge rate applicable to such class of customers in each Customer Class Group. 2. Actual Revenue Per Customer – the Actual Revenue per Customer (“ARC”) shall be determined in dollars per customer on a monthly basis for each of the Customer Class Groups to which the CIP applies. The ARC shall equal the aggregate actual booked variable margin revenue per applicable rate schedule for the month as recorded on the Company’s books divided by the Actual Number of Customers for the corresponding month. Actual revenues shall include Distribution Kilowatt-hour and Distribution Kilowatt charges as well as any Infrastructure Investment Program revenues, and shall not include the Service Charge and any non-base rate charges such as the Societal Benefits, Non-Utility Generation Charge, Securitization Transition Charges, Solar Pilot Recovery Charges, Green Programs Recovery Charges, or the Technology Innovation Charge. 3. Adjustment Period – shall be the year beginning immediately following the conclusion of the Annual Period. 4. Annual Period – shall be the twelve consecutive months from June 1 of one calendar year through May 31 of the following calendar year. 5. Average 13 Month Common Equity Balance – shall be the average of the beginning and ending common equity balances based on the latest publically available financials available before the end of the Annual Period. The Company shall provide the most recently available actual months plus forecasted data at the time of each Initial Filing. The forecasted data will be updated with actuals once the financial statements for the months have been disclosed. Date of Issue: Effective:
Issued by SCOTT S. JENNINGS, SVP - Corporate Planning, Strategy and Utility Finance – PSE&G 80 Park Plaza, Newark, New Jersey 07102
Filed pursuant to Order of Board of Public Utilities dated in Docket No.
Attachment 5 Page 5 of 13

PUBLIC SERVICE ELECTRIC AND GAS COMPANY
B.P.U.N.J. No. 16 ELECTRIC Original Sheet No. XX
CONSERVATION INCENTIVE PROGRAM (Continued)
6. Baseline Revenue per Customer – the Baseline Revenue per Customer (“BRC”) shall be stated in dollars per customer on a monthly basis for each of the Customer Class Groups to which the CIP applies. The BRC shall be calculated as the current variable margin revenue per rate schedule, including any revenue from Infrastructure Investment Program rate adjustments, divided by the number of customers from the most recent approve base rate case for the rate schedule. Baseline revenues shall include Distribution Kilowatt-hour and Distribution Kilowatt charges, and shall not include the Service Charge and any non-base rate charges such as the Societal Benefits, Non-Utility Generation Charge, Securitization Transition Charges, Solar Pilot Recovery Charges, Green Programs Recovery Charges, or the Technology Innovation Charge. 7. Customer Class Group – For purposes of determining and applying the CIP, customers shall be aggregated into four separate recovery class groups. The Customer Class Groups shall be as follows: Group I: RS & RHS Group IA: RLM Group II: GLP Group III: LPL-S 8. Forecast Annual Usage – the Forecast Annual Usage (“FAU”) shall be the projected total annual throughput for all customers within the applicable Customer Class Group. The FAU shall be estimated based on normal weather. 9. Degree Days (DD) - the difference between 65oF and the mean daily temperature. The mean daily temperature is the simple average of the 24 hourly temperature observations for a day. Heating Degree Days (HDD) are used to measure winter weather. 10. Temperature Humidity Index (THI) - a measure of the degree of discomfort experienced by an individual in warm weather that includes temperature and humidity which is included by incorporating the dew point in the measure. The daily THI is the sum of the 24 hourly THI observations for a day. THI is used to measure summer weather. 11. Actual Calendar Month HDD and THI - the accumulation of the actual HDD and THI for each day of a calendar month. Date of Issue: Effective:
Issued by SCOTT S. JENNINGS, SVP - Corporate Planning, Strategy and Utility Finance – PSE&G 80 Park Plaza, Newark, New Jersey 07102
Filed pursuant to Order of Board of Public Utilities dated
in Docket No.
Attachment 5 Page 6 of 13
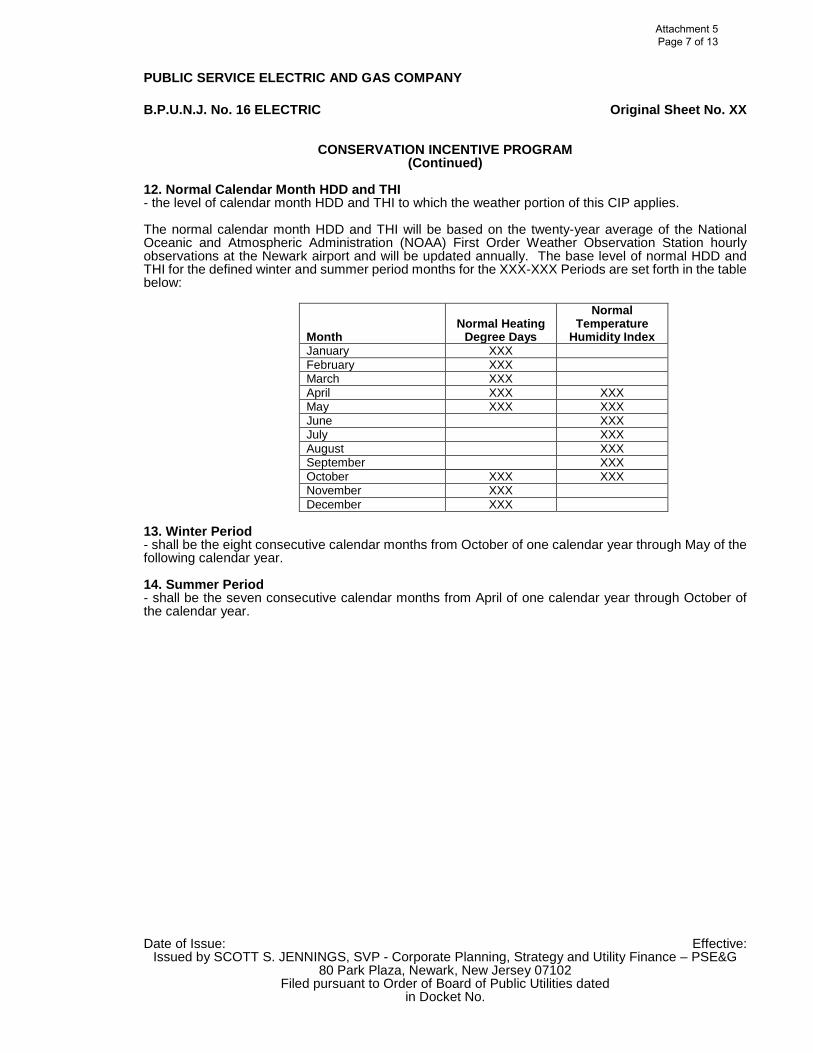
PUBLIC SERVICE ELECTRIC AND GAS COMPANY
B.P.U.N.J. No. 16 ELECTRIC Original Sheet No. XX
CONSERVATION INCENTIVE PROGRAM (Continued)
12. Normal Calendar Month HDD and THI - the level of calendar month HDD and THI to which the weather portion of this CIP applies. The normal calendar month HDD and THI will be based on the twenty-year average of the National Oceanic and Atmospheric Administration (NOAA) First Order Weather Observation Station hourly observations at the Newark airport and will be updated annually. The base level of normal HDD and THI for the defined winter and summer period months for the XXX-XXX Periods are set forth in the table below:
Month Normal Heating
Degree Days
Normal Temperature
Humidity Index January XXX
February XXX March XXX
April XXX XXX May XXX XXX
June XXX July XXX
August XXX September XXX
October XXX XXX November XXX
December XXX 13. Winter Period - shall be the eight consecutive calendar months from October of one calendar year through May of the following calendar year. 14. Summer Period - shall be the seven consecutive calendar months from April of one calendar year through October of the calendar year. Date of Issue: Effective:
Issued by SCOTT S. JENNINGS, SVP - Corporate Planning, Strategy and Utility Finance – PSE&G 80 Park Plaza, Newark, New Jersey 07102
Filed pursuant to Order of Board of Public Utilities dated in Docket No.
Attachment 5 Page 7 of 13

PUBLIC SERVICE ELECTRIC AND GAS COMPANY
B.P.U.N.J. No. 16 ELECTRIC Original Sheet No. XX
CONSERVATION INCENTIVE PROGRAM (Continued)
15. Consumption Factors - the use per HDD and THI component by month used in forecasting sales for the applicable rate schedules. These factors will be updated annually. Consumption Factors for the XXX-XXX Winter Period for HDD and XXX Summer Period for THI are set forth below and presented as kWh per degree day: Consumption Factors
(kWh per HDD and THI)
RS RHS RLM
Month HDD THI HDD THI HDD THI
January XXX XXX XXX XXX XXX XXX
February XXX XXX XXX XXX XXX XXX
March XXX XXX XXX XXX XXX XXX
April XXX XXX XXX XXX XXX XXX
May XXX XXX XXX XXX XXX XXX
June XXX XXX XXX XXX XXX XXX
July XXX XXX XXX XXX XXX XXX
August XXX XXX XXX XXX XXX XXX
September XXX XXX XXX XXX XXX XXX
October XXX XXX XXX XXX XXX XXX
November XXX XXX XXX XXX XXX XXX
December XXX XXX XXX XXX XXX XXX
II. BASELINE REVENUE PER CUSTOMER – The BRC for each Customer Class Group by month are as follows:
Month RS & RHS RLM GLP LPL-S Jun XXX XXX XXX XXX Jul XXX XXX XXX XXX Aug XXX XXX XXX XXX Sep XXX XXX XXX XXX Oct XXX XXX XXX XXX Nov XXX XXX XXX XXX Dec XXX XXX XXX XXX Jan XXX XXX XXX XXX Feb XXX XXX XXX XXX Mar XXX XXX XXX XXX Apr XXX XXX XXX XXX May XXX XXX XXX XXX Total Annual 249.7 458.5 947.6 21,429
Date of Issue: Effective: Issued by SCOTT S. JENNINGS, SVP - Corporate Planning, Strategy and Utility Finance – PSE&G
80 Park Plaza, Newark, New Jersey 07102 Filed pursuant to Order of Board of Public Utilities dated
in Docket No.
Attachment 5 Page 8 of 13

PUBLIC SERVICE ELECTRIC AND GAS COMPANY
B.P.U.N.J. No. 16 ELECTRIC Original Sheet No. XX
CONSERVATION INCENTIVE PROGRAM (Continued)
III. DETERMINATION OF THE CONSERVATION INCENTIVE PROGRAM 1. At the end of the Annual Period, a calculation shall be made that determines for each Customer Class Group the deficiency or excess to be surcharged or credited to customers pursuant to the CIP mechanism. The deficiency or excess shall be calculated each month by multiplying the result obtained from subtracting the Baseline Revenue per Customer from the Actual Revenue per Customer by the Actual Number of Customers. 2. The weather related change in customer usage shall be calculated as the difference between actual HDD and THI and the above HDD and THI multiplied by the consumption factors, and multiplying the result by the margin revenue factors as defined in Section I.10. of this rate schedule to determine the weather-related deficiency or excess. The weather-related amount will be subtracted from the total deficiency or excess to determine the non-weather related deficiency or excess. 3. Recovery of margin deficiency associated with non-weather related changes in customer usage will be subject to a BGS savings test and a Variable Margin Revenue recovery limitation (“recovery tests”). Recovery of non-weather related margin deficiency will be limited to the smaller of (1) the level of BGS savings achieved when such savings are less than 75 percent of the non-weather related margin deficiency, i.e. BGS savings test, and (2) 6.5 percent of variable margins for the CIP Annual Period, i.e., Variable Margin Revenue recovery limitation. Any amount that exceeds the above limitations may be deferred for future recovery and is subject to either or both of the recovery tests in a future year consistent with the amount by which either or both of the non-weather related margin deficiency exceeded the recovery tests. For the purposes of this calculation, the value of the weather related portion shall be calculated as set forth in Section III.2. of this rate schedule. 4. In addition, if the calculated ROE exceeds the allowed ROE from the utility's last base rate case by 50 basis points or more, recovery of lost revenues through the CIP shall not be allowed for the applicable filing period. For purposes of this section, the Company's rate of return on common equity shall be calculated by dividing the Company's net income for the applicable period as defined in the Average 13 Month Common Equity Balance by the Company's average common equity balance for the same period, all as reflected in the Company's monthly reports to the Board of Public Utilities. The Company's net income shall be calculated by subtracting from total operating income, any clause related Net Income, such as the Green Program’s Recovery Charge, the Technology Innovation Charge and interest expenses. The Company's Average 13 Month Common Equity Balance shall be the ratio of Electric Distribution Net Plant (including the Electric Distribution allocation of Common Plant) to total PSE&G Net Plant for the Average 13 Month Common Equity Balance period multiplied by the Company's total common equity for the same period. 5. The amount to be surcharged or credited shall equal the eligible aggregate deficiency or excess for all months during the Annual Period determined in accordance with the provisions herein, divided by the Forecast Annual Usage for the Customer Class Group. IV. TRACKING THE OPERATION OF THE CONSERVATION INCENTIVE PROGRAM The revenues billed, or credits applied, net of taxes and assessments, through the application of the Conservation Incentive Program Rate shall be accumulated for each month of the Adjustment Period and applied against the CIP excess or deficiency from the Annual Period and any cumulative balances remaining from prior periods.
Date of Issue: Effective: Issued by SCOTT S. JENNINGS, SVP - Corporate Planning, Strategy and Utility Finance – PSE&G
80 Park Plaza, Newark, New Jersey 07102 Filed pursuant to Order of Board of Public Utilities dated
in Docket No.
Attachment 5 Page 9 of 13

PUBLIC SERVICE ELECTRIC AND GAS COMPANY
B.P.U.N.J. No. 16 GAS Original Sheet No. XX
CONSERVATION INCENTIVE PROGRAM
CHARGE APPLICABLE TO
RATE SCHEDULES RSG, GSG, LVG (Per Therm)
Conservation
Incentive Program Conservation Incentive Program
including SUT RSG $0.000000 $0.000000 GSG $0.000000 $0.000000 LVG $0.000000 $0.000000
Conservation Incentive Program This charge shall be applicable to the rate schedules listed above. The Conservation Incentive Program shall be based on the differences between actual and allowed revenue per customer during the preceding annual period. The Conservation Incentive Mechanism shall be determined as follows: I. DEFINITION OF TERMS AS USED HEREIN 1. Actual Number of Customers – the Actual Number of Customers (“ANC”) shall be determined on a monthly basis for each of the Customer Class Groups to which the Conservation Incentive Program (“CIP”) Clause applies. The ANC shall equal the aggregate actual monthly Service Charge revenue for each class of customers subject to the CIP as recorded on the Company’s books, divided by the service charge rate applicable to such class of customers in each Customer Class Group. 2. Actual Usage Per Customer – the Actual Usage per Customer (“AUC”) shall be determined in therms on a monthly basis for each of the Customer Class Groups to which the CIP applies. The AUC shall equal the aggregate actual booked sales for the month as recorded on the Company’s books divided by the ANC for the corresponding month. 3. Adjustment Period – shall be the year beginning immediately following the conclusion of the Annual Period. 4. Annual Period – shall be the twelve consecutive months from October 1 of one calendar year through September 30 of the following calendar year. 5. Average 13 Month Common Equity Balance – shall be the average of the beginning and ending common equity balances based on the latest publically available financials available before the end of the Annual Period. The Company shall provide the most recently available actual months plus forecasted data at the time of each Initial Filing. The forecasted data will be updated with actuals once the financial statements for the months have been disclosed. 6. Baseline Usage per Customer – the Baseline Usage per Customer (“BUC”) shall be stated in therms on a monthly basis for each of the Customer Class Groups to which the CIP applies. The BUC shall be rounded to the nearest one tenth of one therm. The BUC shall be reset each time new base rates are placed into effect through a base rate case. Date of Issue: Effective:
Issued by SCOTT S. JENNINGS, SVP - Corporate Planning, Strategy and Utility Finance – PSE&G 80 Park Plaza, Newark, New Jersey 07102
Filed pursuant to Order of Board of Public Utilities dated in Docket No.
Attachment 5 Page 10 of 13

PUBLIC SERVICE ELECTRIC AND GAS COMPANY
B.P.U.N.J. No. 16 GAS Original Sheet No. XX
CONSERVATION INCENTIVE PROGRAM (Continued)
7. Customer Class Group – For purposes of determining and applying the CIP, customers shall be aggregated into three separate recovery class groups. The Customer Class Groups shall be as follows: Group I: RSG Group II: GSG Group III: LVG 8. Forecast Annual Usage – the Forecast Annual Usage (“FAU”) shall be the projected total annual throughput for all customers within the applicable Customer Class Group. The FAU shall be estimated based on normal weather. 9. Margin Revenue Factor – the Margin Revenue Factor (“MRF”) shall be the weighted-average margin rate as quoted in the individual service classes to which the CIP applies. The MRFs by Customer Class Group are as follows: Group I (RSG): $XXX Group II (GSG): $XXX Group III (LVG): $XXX The MRF shall be reset each time new base rates are placed into effect, including through a base rate case or any Infrastructure Investment Program rate adjustment. 10. Degree Days (DD) - the difference between 65oF and the mean daily temperature for the day. The mean daily temperature is the simple average of the 24 hourly temperature observations for a day. 11. Actual Calendar Month Degree Days - the accumulation of the actual Degree Days for each day of a calendar month. 12. Normal Calendar Month Degree Days - the level of calendar month degree days to which the weather portion of the CIP applies. The normal calendar month Degree Days will be the twenty-year average of the National Oceanic and Atmospheric Administration (NOAA) First Order Weather Observation Station at the Newark airport and will be updated annually. The base level of normal HDD for the defined winter period months for the XXX-XXX Winter Period are set forth in the table below:
Month Normal Heating
Degree Days October XXX
November XXX December XXX
January XXX February XXX
March XXX April XXX
May XXX 13. Winter Period - shall be the eight consecutive calendar months from October of one calendar year through May of the following calendar year. Date of Issue: Effective:
Issued by SCOTT S. JENNINGS, SVP - Corporate Planning, Strategy and Utility Finance – PSE&G 80 Park Plaza, Newark, New Jersey 07102
Filed pursuant to Order of Board of Public Utilities dated
in Docket No.
Attachment 5 Page 11 of 13

PUBLIC SERVICE ELECTRIC AND GAS COMPANY
B.P.U.N.J. No. 16 GAS Original Sheet No. XX
CONSERVATION INCENTIVE PROGRAM (Continued)
14. Degree Day Consumption Factors - the use per degree day component of the gas sales equations by month used in forecasting firm gas sales for the applicable rate schedules. These factors will be updated annually in the WNC proceeding. Degree day Consumption Factors for the XXX-XXX Winter Period are set forth below and presented as therms per degree day: Consumption Factors
(therms per degree day)
RSG GSG LVG
Month Heating Non-Heating Heating Non-Heating
October XXX XXX XXX XXX XXX
November XXX XXX XXX XXX XXX
December XXX XXX XXX XXX XXX
January XXX XXX XXX XXX XXX
February XXX XXX XXX XXX XXX
March XXX XXX XXX XXX XXX
April XXX XXX XXX XXX XXX
May XXX XXX XXX XXX XXX
II. BASELINE USE PER CUSTOMER – The BUC for each Customer Class Group by month are as follows:
Month RSG GSG LVG Oct. XXX XXX XXX Nov. XXX XXX XXX Dec. XXX XXX XXX Jan. XXX XXX XXX Feb. XXX XXX XXX Mar. XXX XXX XXX Apr. XXX XXX XXX May XXX XXX XXX Jun. XXX XXX XXX Jul. XXX XXX XXX Aug. XXX XXX XXX Sep. XXX XXX XXX Total Annual 909.7 2,132.3 40,143.9
Date of Issue: Effective:
Issued by SCOTT S. JENNINGS, SVP - Corporate Planning, Strategy and Utility Finance – PSE&G 80 Park Plaza, Newark, New Jersey 07102
Filed pursuant to Order of Board of Public Utilities dated
in Docket No.
Attachment 5 Page 12 of 13

PUBLIC SERVICE ELECTRIC AND GAS COMPANY
B.P.U.N.J. No. 16 GAS Original Sheet No. XX
CONSERVATION INCENTIVE PROGRAM (Continued)
III. DETERMINATION OF THE CONSERVATION INCENTIVE PROGRAM 1. At the end of the Annual Period, a calculation shall be made that determines for each Customer Class Group the deficiency or excess to be surcharged or credited to customers pursuant to the CIP mechanism. The deficiency or excess shall be calculated each month by multiplying the result obtained from subtracting the Baseline Usage per Customer from the Actual Usage per Customer by the Actual Number of Customers and then multiplying the resulting therms by the Margin Revenue Factor. 2. The weather related change in customer usage shall be calculated as the difference between actual degree days and the above normal degree days multiplied by the consumption factors, and multiplying the result by the margin revenue factors as defined in Section I.10. of this rate schedule to determine the weather-related deficiency or excess. The weather-related amount will be subtracted from the total deficiency or excess to determine the non-weather related deficiency or excess. 3. Recovery of margin deficiency associated with non-weather related deficiency in customer usage will be subject to a BGSS savings test and a Variable Margin Revenue recovery limitation (“recovery tests”). Recovery of non-weather related margin deficiency will be limited to the smaller of (1) the level of BGSS savings achieved when such savings are less than 75 percent of the non-weather related margin deficiency, i.e. BGSS savings test, and (2) 6.5 percent of variable margins for the CIP Annual Period, i.e., Margin Revenue recovery limitation. Any amount that exceeds the above limitations may be deferred for future recovery and is subject to either or both of the recovery tests in a future year consistent with the amount by which either or both of the non-weather related margin deficiency exceeded the recovery tests. For the purposes of this calculation, the value of the weather related portion shall be calculated as set forth in Section III.2. of this rate schedule. 4. In addition, if the calculated ROE exceeds the allowed ROE from the utility's last base rate case by 50 basis points or more, recovery of lost revenues through the CIP shall not be allowed for the applicable filing period. For purposes of this section, the Company's rate of return on common equity shall be calculated by dividing the Company's net income for the applicable period as defined in the Average 13 Month Common Equity Balance by the Company's average common equity balance for the same period, all as reflected in the Company's monthly reports to the Board of Public Utilities. The Company's net income shall be calculated by subtracting from total operating income, any clause related Net Income, such as the Green Program’s Recovery Charge, the Technology Innovation Charge and interest expenses. The Company's Average 13 Month Common Equity Balance shall be the ratio of Gas Net Plant (including the Gas allocation of Common Plant) to total PSE&G Net Plant for the Average 13 Month Common Equity Balance period multiplied by the Company's total common equity for the same period. 5. The amount to be surcharged or credited shall equal the eligible aggregate deficiency or excess for all months during the Annual Period determined in accordance with the provisions herein, divided by the Forecast Annual Usage for the Customer Class Group. IV. TRACKING THE OPERATION OF THE CONSERVATION INCENTIVE PROGRAM The revenues billed, or credits applied, net of taxes and assessments, through the application of the Conservation Incentive Program Rate shall be accumulated for each month of the Adjustment Period and applied against the CIP excess or deficiency from the Annual Period and any cumulative balances remaining from prior periods.
Date of Issue: Effective: Issued by SCOTT S. JENNINGS, SVP - Corporate Planning, Strategy and Utility Finance – PSE&G
80 Park Plaza, Newark, New Jersey 07102 Filed pursuant to Order of Board of Public Utilities dated
in Docket No.
Attachment 5 Page 13 of 13

ILLUSTRATIVE PURPOSES ONLY
Attachment 6E
Schedule 1
Page 1 of 3
Conservation Incentive Program
Group I: Residential Service RS and RHS
June 2021 - May 2022
Actual per Books1
Actual/ Total Class Number of Actual Avg. Baseline Margin
Customer Class Estimate Revenues Customers Revenue / Cust. Revenue / Cust.2
Difference Variance
(a) (b) (c) (d) = (b) / (c) (e) (f) = (d) - (e)
Residential
June e 49,371,972 1,921,455 25.7 33.2 (7.5) ($14,451,083)
July e 66,562,969 1,923,694 34.6 42.4 (7.8) ($15,061,780)
August e 62,183,411 1,916,474 32.5 42.5 (10.0) ($19,204,604)
September e 39,442,052 1,916,615 20.6 20.4 0.2 $419,197
October e 27,262,574 1,914,216 14.2 12.2 2.1 $3,958,738
November e 28,180,670 1,921,687 14.7 12.5 2.2 $4,160,448
December e 35,710,474 1,916,894 18.6 14.3 4.3 $8,271,811
January e 37,910,446 1,911,763 19.8 15.1 4.7 $8,997,068
February e 31,534,835 1,916,381 16.5 13.9 2.6 $4,936,039
March e 29,979,266 1,866,048 16.1 13.5 2.5 $4,706,744
April e 24,767,541 1,995,221 12.4 11.4 1.0 $1,954,531
May e 31,047,164 1,906,131 16.3 18.3 (2.0) ($3,824,224)
Total 463,953,374 241.9 249.7 (7.8) ($15,137,116)
Margin Deficiency/ (Credit) 15,137,116$
Prior Period (Over) / Under Recovery3
-$
Total Deficiency/(Credit) 15,137,116$
Projected Residential kWh Use 12,735,566,204
Pre-tax CIP Charge/(Credit) per kWh 0.0012$
BPU/RC Assessment Factor 1.002569
CIP Charge/(Credit) including assessments 0.0012$
6.625% Sales Tax 0.0001$
Proposed After-tax CIP Charge/(Credit) per kWh 0.0013$
Current After-tax CIP Charge/(Credit) per kWh -$
Increase/ (Decrease) in After-tax CIP Charge/(Credit) per kWh 0.0013$
1 Per Exhibit C, Schedule 1, Page 22 From latest base rate adjustment for Madison and Marshall divided by billing determinants approved in the 2018 Base Rate Case3 Per Exhibit C, Schedule 1, Page 3
Public Service Electric and Gas

ILLUSTRATIVE PURPOSES ONLY
Attachment 6E
Schedule 1
Page 2 of 3
Public Service Electric and Gas
Customers and Therms
Group I: Residential Service RS and RHS
Estimate Estimate Estimate Estimate Estimate Estimate Estimate Estimate Estimate Estimate Estimate Estimate
Jun-21 Jul-21 Aug-21 Sep-21 Oct-21 Nov-21 Dec-21 Jan-22 Feb-22 Mar-22 Apr-22 May-22
Customers
Service Charge Revenues 8,915,549 8,925,942 8,892,438 8,893,095 8,881,964 8,916,629 8,894,386 8,870,582 8,892,006 8,658,464 9,257,826 8,844,450
Service Charge Rate (pre-tax) 4.64 4.64 4.64 4.64 4.64 4.64 4.64 4.64 4.64 4.64 4.64 4.64
Total Customers 1,921,455 1,923,694 1,916,474 1,916,615 1,914,216 1,921,687 1,916,894 1,911,763 1,916,381 1,866,048 1,995,221 1,906,131 1,918,263
Volumes
RS kWh 1,249,731,621 1,660,904,132 1,555,566,043 1,067,201,231 812,603,869 839,597,043 1,063,517,481 1,127,566,843 937,651,870 892,211,731 737,944,250 869,949,572
RHS kWh 5,492,583 6,297,597 6,294,388 4,952,544 6,178,453 8,090,827 12,380,098 15,996,419 13,230,413 10,650,572 6,702,851 4,729,049
Total Volumes 1,255,224,204 1,667,201,729 1,561,860,431 1,072,153,774 818,782,322 847,687,870 1,075,897,579 1,143,563,262 950,882,282 902,862,303 744,647,102 874,678,621 7,043,583,705

ILLUSTRATIVE PURPOSES ONLY Attachment 6E
Schedule 1
Page 3 of 3
PUBLIC SERVICE ELECTRIC AND GAS
STATEMENT OF ESTIMATED UNDER/(OVER) RECOVERED CIP BALANCE
Group I: Residential Service RS and RHS
Estimate Estimate Estimate Estimate Estimate Estimate Estimate Estimate Estimate Estimate Estimate Estimate
Jun-21 Jul-21 Aug-21 Sep-21 Oct-21 Nov-21 Dec-21 Jan-22 Feb-22 Mar-22 Apr-22 May-22 TOTAL
Beginning Under/(Over) Recovery $ 0 0 0 0 0 0 0 0 0 0 0 0 0
kWh Sales 1,667,201,729 1,561,860,431 1,072,153,774 818,782,322 847,687,870 1,075,897,579 1,143,563,262 950,882,282 902,862,303 744,647,102 874,678,621 1,255,224,204 12,915,441,480
Pre-tax Recovery Rate per kWh1 0.0000 0.0000 0.0000 0.0000 0.0000 0.0000 0.0000 0.0000 0.0000 0.0000 0.0000 0.0000
Recovery $ 0 0 0 0 0 0 0 0 0 0 0 0 0
Ending Under/(Over) Recovery $ 0 0 0 0 0 0 0 0 0 0 0 0 0
June 2021 - May 2022
1 Pre-tax Recovery Rate per therm excluding BPU and RC assessments.

ILLUSTRATIVE PURPOSES ONLY
Attachment 6E
Schedule 1a
Page 1 of 3
Conservation Incentive Program
Group Ia: Residential Load Management (RLM)
June 2021 - May 2022
Actual per Books1
Actual/ Total Class Number of Actual Avg. Baseline Margin
Customer Class Estimate Revenues Customers
Revenue /
Cust.
Revenue /
Cust.2
Difference Variance
(a) (b) (c) (d) = (b) / (c) (e) (f) = (d) - (e)
Residential Load Management
June e 833,526 11,427 73.0 61.0 12.0 $136,744
July e 1,157,983 11,540 100.3 77.9 22.5 $259,110
August e 975,534 11,475 85.0 78.0 7.0 $80,869
September e 570,198 11,811 48.3 37.4 10.9 $128,776
October e 168,969 11,545 14.6 22.3 (7.7) ($88,939)
November e 160,451 11,511 13.9 22.9 (9.0) ($103,562)
December e 210,289 11,542 18.2 26.3 (8.1) ($92,998)
January e 218,345 11,559 18.9 27.8 (8.9) ($102,553)
February e 184,553 11,609 15.9 25.5 (9.6) ($111,296)
March e 182,328 11,233 16.2 24.9 (8.6) ($97,040)
April e 155,299 11,576 13.4 21.0 (7.6) ($87,543)
May e 342,186 11,781 29.1 33.6 (4.5) ($53,437)
Total 5,159,660 446.9 458.5 (11.6) ($131,868)
Margin Deficiency/ (Credit) 131,868$
Prior Period (Over) / Under Recovery3
-$
Total Deficiency/(Credit) 131,868$
Projected Residential kWh Use 186,694,277
Pre-tax CIP Charge/(Credit) per kWh 0.0007$
BPU/RC Assessment Factor 1.002569
CIP Charge/(Credit) including assessments 0.000708$
6.625% Sales Tax -$
Proposed After-tax CIP Charge/(Credit) per kWh 0.0007$
Current After-tax CIP Charge/(Credit) per kWh -$
Increase/ (Decrease) in After-tax CIP Charge/(Credit) per kWh 0.0007$
1 Per Exhibit C, Schedule 1a, Page 22 From latest base rate adjustment for Madison and Marshall divided by billing determinants approved in the 2018 Base Rate Case3 Per Exhibit C, Schedule 1, Page 3
Public Service Electric and Gas

ILLUSTRATIVE PURPOSES ONLY
Attachment 6E
Schedule 1a
Page 2 of 3
Public Service Electric and Gas
Customers and Therms
Group Ia: RLM
Estimate Estimate Estimate Estimate Estimate Estimate Estimate Estimate Estimate Estimate Estimate Estimate
Jun-21 Jul-21 Aug-21 Sep-21 Oct-21 Nov-21 Dec-21 Jan-22 Feb-22 Mar-22 Apr-22 May-22
Customers
Service Charge Revenues 149,346 150,829 149,980 154,366 150,892 150,449 150,854 151,070 151,729 146,810 151,298 153,973
Service Charge Rate (pre-tax) 13.07 13.07 13.07 13.07 13.07 13.07 13.07 13.07 13.07 13.07 13.07 13.07
Total Customers 11,427 11,540 11,475 11,811 11,545 11,511 11,542 11,559 11,609 11,233 11,576 11,781
Volumes
RLM kWh 20,896,208 27,849,888 25,509,789 17,611,308 11,449,339 10,873,364 14,251,120 14,837,393 12,531,596 12,380,556 10,545,170 14,082,828
Total Volumes 20,896,208 27,849,888 25,509,789 17,611,308 11,449,339 10,873,364 14,251,120 14,837,393 12,531,596 12,380,556 10,545,170 14,082,828 192,818,561

ILLUSTRATIVE PURPOSES ONLY Attachment 6E
Schedule 1a
Page 3 of 3
PUBLIC SERVICE ELECTRIC AND GAS
STATEMENT OF ESTIMATED UNDER/(OVER) RECOVERED CIP BALANCE
Group Ia: Residential Load Management (RLM)
Estimate Estimate Estimate Estimate Estimate Estimate Estimate Estimate Estimate Estimate Estimate Estimate
Jun-21 Jul-21 Aug-21 Sep-21 Oct-21 Nov-21 Dec-21 Jan-22 Feb-22 Mar-22 Apr-22 May-22 TOTAL
Beginning Under/(Over) Recovery $ 0 0 0 0 0 0 0 0 0 0 0 0 0
kWh Sales 27,849,888 25,509,789 17,611,308 11,449,339 10,873,364 14,251,120 14,837,393 12,531,596 12,380,556 10,545,170 14,082,828 20,896,208 192,818,561
Pre-tax Recovery Rate per kWh1 0.0000 0.0000 0.0000 0.0000 0.0000 0.0000 0.0000 0.0000 0.0000 0.0000 0.0000 0.0000
Recovery $ 0 0 0 0 0 0 0 0 0 0 0 0 0
Ending Under/(Over) Recovery $ 0 0 0 0 0 0 0 0 0 0 0 0 0
June 2021 - May 2022
1 Pre-tax Recovery Rate per therm excluding BPU and RC assessments.

ILLUSTRATIVE PURPOSES ONLY
Attachment 6E
Schedule 2
Page 1 of 3
Conservation Incentive Program
Group II: General Power & Light (GLP)
June 2021 - May 2022
Actual per Books1
Actual/ Total Class Number of Actual Avg. Baseline Margin
Customer Class Estimate Revenues Customers Revenue / Cust.
Revenue /
Cust.2
Difference Variance
(a) (b) (c) (d) = (b) / (c) (e) (f) = (d) - (e)
Residential Heating
June e 32,681,689 286,513 114.1 134.2 (20.1) ($5,759,173)
July e 36,480,013 283,243 128.8 148.9 (20.1) ($5,705,520)
August e 37,048,243 268,939 137.8 156.5 (18.7) ($5,042,047)
September e 24,295,879 295,678 82.2 101.7 (19.5) ($5,766,077)
October e 14,966,985 288,457 51.9 46.9 5.0 $1,435,801
November e 12,280,664 280,410 43.8 46.9 (3.1) ($855,537)
December e 12,319,359 284,876 43.2 45.2 (2.0) ($558,163)
January e 13,020,503 282,497 46.1 45.9 0.2 $60,502
February e 12,583,581 283,851 44.3 46.8 (2.4) ($689,008)
March e 13,114,961 272,327 48.2 46.2 1.9 $530,016
April e 12,148,504 292,470 41.5 46.0 (4.4) ($1,299,656)
May e 22,334,793 284,631 78.5 82.5 (4.0) ($1,145,607)
Total 243,275,174 860.3 947.6 (87.3) ($24,794,468)
Margin Deficiency/ (Credit) 24,794,468$
Prior Period (Over) / Under Recovery3
-$
Total Deficiency/(Credit) 24,794,468$
Projected GLP Annual kW Use 27,884,493
Pre-tax CIP Charge/(Credit) per kW 0.8892$
BPU/RC Assessment Factor 1.002569
CIP Charge/(Credit) including assessments 0.8915$
6.625% Sales Tax 0.0591$
Proposed After-tax CIP Charge/(Credit) per kW 0.9506$
Current After-tax CIP Charge/(Credit) per kW -$
Increase/ (Decrease) in After-tax CIP Charge/(Credit) per kW 0.9506$
1 Per Exhibit C, Schedule 2, Page 22 From latest base rate adjustment for Madison and Marshall divided by billing determinants approved in the 2018 Base Rate Case3 Per Exhibit C, Schedule 2, Page 3
Public Service Electric and Gas

ILLUSTRATIVE PURPOSES ONLY
Attachment 6E
Schedule 2
Page 2 of 3
Public Service Electric and Gas
Customers and Therms
Group II: General Power & Light (GLP)
Estimate Estimate Estimate Estimate Estimate Estimate Estimate Estimate Estimate Estimate Estimate Estimate
Jun-21 Jul-21 Aug-21 Sep-21 Oct-21 Nov-21 Dec-21 Jan-22 Feb-22 Mar-22 Apr-22 May-22
Customers
Service Charge Revenues 1,269,252 1,254,767 1,191,401 1,309,853 1,277,865 1,242,218 1,262,002 1,251,462 1,257,459 1,206,409 1,295,640 1,260,914
Service Charge Rate (pre-tax) 4.43 4.43 4.43 4.43 4.43 4.43 4.43 4.43 4.43 4.43 4.43 4.43
Total Customers 286,513 283,243 268,939 295,678 288,457 280,410 284,876 282,497 283,851 272,327 292,470 284,631
Demand
GLP kW 2,504,424 2,595,005 2,707,023 2,332,346 2,566,230 2,162,933 2,023,033 2,129,087 2,131,198 2,210,824 2,123,320 2,528,576
Total Demand 2,504,424 2,595,005 2,707,023 2,332,346 2,566,230 2,162,933 2,023,033 2,129,087 2,131,198 2,210,824 2,123,320 2,528,576 28,013,999

ILLUSTRATIVE PURPOSES ONLY Attachment 6E
Schedule 2
Page 3 of 3
PUBLIC SERVICE ELECTRIC AND GAS
STATEMENT OF ESTIMATED UNDER/(OVER) RECOVERED CIP BALANCE
Group II: General Power & Light (GLP)
Estimate Estimate Estimate Estimate Estimate Estimate Estimate Estimate Estimate Estimate Estimate Estimate
Jun-21 Jul-21 Aug-21 Sep-21 Oct-21 Nov-21 Dec-21 Jan-22 Feb-22 Mar-22 Apr-22 May-22 TOTAL
Beginning Under/(Over) Recovery $ 0 0 0 0 0 0 0 0 0 0 0 0 0
kW Demand 2,595,005 2,707,023 2,332,346 2,566,230 2,162,933 2,023,033 2,129,087 2,131,198 2,210,824 2,123,320 2,528,576 2,504,424 28,013,999
Pre-tax Recovery Rate per kW1 0.0000 0.0000 0.0000 0.0000 0.0000 0.0000 0.0000 0.0000 0.0000 0.0000 0.0000 0.0000
Recovery $ 0 0 0 0 0 0 0 0 0 0 0 0 0
Ending Under/(Over) Recovery $ 0 0 0 0 0 0 0 0 0 0 0 0 0
June 2021 - May 2022
1 Pre-tax Recovery Rate per therm excluding BPU and RC assessments.

ILLUSTRATIVE PURPOSES ONLY
Attachment 6E
Schedule 3
Page 1 of 3
Conservation Incentive Program
Group III: Large Power & Light - Seconday (LPLS)
June 2021 - May 2022
Actual per Books1
Actual/ Total Class Number of Actual Avg. Baseline Margin
Customer Class Estimate Therms Customers Use / Cust. Use / Cust.2
Difference Variance
(a) (b) (c) (d) = (b) / (c) (e) (f) = (d) - (e)
General Service Small
June e 8,638,705 9,018 958 2,464 (2,536) ($22,868,738)
July e 9,103,155 9,251 984 3,494 (2,622) ($24,254,873)
August e 9,431,600 9,153 1,030 3,606 (1,221) ($11,178,685)
September e 8,533,046 9,122 935 2,252 (681) ($6,213,948)
October e 8,789,688 8,912 986 1,617 (122) ($1,088,393)
November e 14,464,383 9,026 1,603 1,108 542 $4,891,640
December e 24,818,028 9,234 2,688 1,061 1,718 $15,861,232
January e 29,836,602 8,927 3,342 970 2,237 $19,971,315
February e 29,402,661 9,273 3,171 1,105 2,092 $19,401,571
March e 21,209,712 8,598 2,467 1,078 1,457 $12,525,184
April e 9,727,248 9,819 991 1,010 (674) ($6,615,493)
May e 9,030,553 8,978 1,006 1,664 (1,458) ($13,090,450)
Total 182,985,380 20,161 21,429 (1,269) ($12,659,637)
Margin Deficiency/ (Credit) 12,659,637$
Prior Period (Over) / Under Recovery3
-$
Total Deficiency/(Credit) 12,659,637$
Projected LPLS Annual kW Use 27,994,029
Pre-tax CIP Charge/(Credit) per kW 0.4522$
BPU/RC Assessment Factor 1.002569
CIP Charge/(Credit) including assessments 0.4534$
6.625% Sales Tax 0.0300$
Proposed After-tax CIP Charge/(Credit) per kW 0.4834$
Current After-tax CIP Charge/(Credit) per kW -$
Increase/ (Decrease) in After-tax CIP Charge/(Credit) per kW 0.4834$
1 Per Exhibit C, Schedule 3, Page 22 From latest base rate adjustment for Madison and Marshall divided by billing determinants approved in the 2018 Base Rate Case3 Per Exhibit C, Schedule 3, Page 3
Public Service Electric and Gas

ILLUSTRATIVE PURPOSES ONLY
Attachment 6E
Schedule 3
Page 2 of 3
Public Service Electric and Gas
Customers and Therms
Group III: LPLS
Estimate Estimate Estimate Estimate Estimate Estimate Estimate Estimate Estimate Estimate Estimate Estimate
Jun-21 Jul-21 Aug-21 Sep-21 Oct-21 Nov-21 Dec-21 Jan-22 Feb-22 Mar-22 Apr-22 May-22
Customers
Service Charge Revenues 3,136,159 3,217,067 3,182,982 3,172,309 3,099,319 3,138,913 3,211,214 3,104,484 3,224,986 2,990,179 3,414,691 3,122,387
Service Charge Rate (pre-tax) 348 348 348 348 348 348 348 348 348 348 348 348
Total Customers 9,018 9,251 9,153 9,122 8,912 9,026 9,234 8,927 9,273 8,598 9,819 8,978
Demand
LPLS kW 2,448,613 2,580,259 2,673,356 2,418,664 2,491,408 2,211,925 1,982,675 2,184,804 2,193,451 2,182,891 2,066,302 2,559,680
Total Demand 2,448,613 2,580,259 2,673,356 2,418,664 2,491,408 2,211,925 1,982,675 2,184,804 2,193,451 2,182,891 2,066,302 2,559,680 27,994,029

ILLUSTRATIVE PURPOSES ONLY Attachment 6E
Schedule 3
Page 3 of 3
PUBLIC SERVICE ELECTRIC AND GAS
STATEMENT OF ESTIMATED UNDER/(OVER) RECOVERED CIP BALANCE
Group III: Large Power & Light - Seconday (LPLS)
Estimate Estimate Estimate Estimate Estimate Estimate Estimate Estimate Estimate Estimate Estimate Estimate
Jun-21 Jul-21 Aug-21 Sep-21 Oct-21 Nov-21 Dec-21 Jan-22 Feb-22 Mar-22 Apr-22 May-22 TOTAL
Beginning Under/(Over) Recovery $ 0 0 0 0 0 0 0 0 0 0 0 0 0
kW Demand 2,580,259 2,673,356 2,418,664 2,491,408 2,211,925 1,982,675 2,184,804 2,193,451 2,182,891 2,066,302 2,559,680 2,448,613 27,994,029
Pre-tax Recovery Rate per kW1 0.0000 0.0000 0.0000 0.0000 0.0000 0.0000 0.0000 0.0000 0.0000 0.0000 0.0000 0.0000
Recovery $ 0 0 0 0 0 0 0 0 0 0 0 0 0
Ending Under/(Over) Recovery $ 0 0 0 0 0 0 0 0 0 0 0 0 0
June 2021 - May 2022
1 Pre-tax Recovery Rate per therm excluding BPU and RC assessments.

ILLUSTRATIVE PURPOSES ONLY Attachment 6E
Schedule 4
Group I
RS
DEGREE DEGREE DEGREE HDD DEGREE THI
DAYS DAYS DAYS CONSUMPTION DAYS THI THI THI CONSUMPTION THI TOTAL MARGIN MARGIN
NORMAL ACTUAL VARIANCE FACTOR kWh NORMAL ACTUAL VARIANCE FACTOR kWh kWh FACTOR2
IMPACT
Jun-21 e 989 1,010 21 383,845 8,089,540 1 0 -1 154,244 (137,662) 7,951,878 $0.0334 $265,911
Jul-21 e 836 814 (22) 382,431 (8,462,078) 0 0 0 153,675 (69,538) (8,531,616) $0.0334 ($285,297)
Aug-21 e 685 734 48 385,559 18,591,967 30 23 -7 154,932 (1,122,483) 17,469,484 $0.0334 $584,180
Sep-21 e 350 302 (48) 381,946 (18,330,399) 182 169 -13 153,480 (1,987,571) (20,317,970) $0.0334 ($679,433)
Oct-21 e 126 127 2 386,245 580,976 925 791 -134 155,208 (20,815,678) (20,234,702) $0.0334 ($676,648)
Nov-21 e 14 2 (12) 386,226 (4,519,654) 3,009 2,814 -195 155,200 (30,331,589) (34,851,243) $0.0380 ($1,324,347)
Dec-21 e 0 0 (0) 387,218 (9,680) 5,275 6,710 1,436 155,599 223,406,438 223,396,757 $0.0380 $8,489,077
Jan-22 e 1 0 (1) 386,022 (260,565) 4,673 4,522 -151 155,118 (23,394,951) (23,655,516) $0.0380 ($898,910)
Feb-22 e 24 8 (16) 388,852 (6,355,305) 2,116 2,216 100 156,256 15,583,759 9,228,454 $0.0380 $350,681
Mar-22 e 240 178 (62) 387,280 (23,975,359) 345 476 131 155,624 20,462,203 (3,513,155) $0.0334 ($117,480)
Apr-22 e 511 650 139 389,194 54,106,315 21 0 -21 156,393 (3,315,921) 50,790,394 $0.0334 $1,698,431
May-22 e 824 836 12 387,107 4,808,194 6 0 -6 155,554 (866,049) 3,942,145 $0.0334 $131,825
TOTAL 4,600 4,662 61 24,263,952 16,583 17,721 1,138 177,410,958 201,674,910 $7,537,989
Group I
RHS
DEGREE DEGREE DEGREE HDD DEGREE THI
DAYS DAYS DAYS CONSUMPTION DAYS THI THI THI CONSUMPTION THI TOTAL MARGIN MARGIN
NORMAL ACTUAL VARIANCE FACTOR kWh NORMAL ACTUAL VARIANCE FACTOR kWh kWh FACTOR2
IMPACT
Jun-21 e 989 1,010 21 14,674 309,255 1 0 -1 729 (651) 308,604 $0.0328 $10,117
Jul-21 e 836 814 (22) 14,576 (322,516) 0 0 0 724 (328) (322,844) $0.0328 ($10,584)
Aug-21 e 685 734 48 14,560 702,100 30 23 -7 724 (5,242) 696,858 $0.0328 $22,846
Sep-21 e 350 302 (48) 14,458 (693,883) 182 169 -13 719 (9,305) (703,188) $0.0328 ($23,053)
Oct-21 e 126 127 2 14,386 21,639 925 791 -134 715 (95,884) (74,245) $0.0328 ($2,434)
Nov-21 e 14 2 (12) 14,287 (167,192) 3,009 2,814 -195 710 (138,768) (305,960) $0.0486 ($14,874)
Dec-21 e 0 0 (0) 14,260 (356) 5,275 6,710 1,436 709 1,017,505 1,017,149 $0.0486 $49,447
Jan-22 e 1 0 (1) 14,136 (9,541) 4,673 4,522 -151 702 (105,951) (115,492) $0.0486 ($5,614)
Feb-22 e 24 8 (16) 14,018 (229,109) 2,116 2,216 100 697 69,480 (159,629) $0.0486 ($7,760)
Mar-22 e 240 178 (62) 13,949 (863,548) 345 476 131 693 91,150 (772,398) $0.0328 ($25,322)
Apr-22 e 511 650 139 13,906 1,933,227 21 0 -21 691 (14,653) 1,918,574 $0.0328 $62,899
May-22 e 824 836 12 13,802 171,437 6 0 -6 686 (3,819) 167,618 $0.0328 $5,495
TOTAL 4,600 4,662 61 851,511 16,583 17,721 1,138 803,535 1,655,046 $61,162
Group Ia
RLM
DEGREE DEGREE DEGREE HDD DEGREE THI
DAYS DAYS DAYS CONSUMPTION DAYS THI THI THI CONSUMPTION THI TOTAL MARGIN MARGIN
NORMAL ACTUAL VARIANCE FACTOR kWh NORMAL ACTUAL VARIANCE FACTOR kWh kWh FACTOR2
IMPACT
Jun-21 e 989 1,010 21 6,104 128,637 1 0 -1 2,440 (2,178) 126,459 $0.0147 $1,862
Jul-21 e 836 814 (22) 6,015 (133,099) 0 0 0 2,405 (1,088) (134,187) $0.0147 ($1,976)
Aug-21 e 685 734 48 6,104 294,329 30 23 -7 2,440 (17,681) 276,648 $0.0147 $4,074
Sep-21 e 350 302 (48) 6,077 (291,660) 182 169 -13 2,430 (31,466) (323,126) $0.0147 ($4,759)
Oct-21 e 126 127 2 6,040 9,085 925 791 -134 2,415 (323,864) (314,779) $0.0147 ($4,636)
Nov-21 e 14 2 (12) 6,019 (70,431) 3,009 2,814 -195 2,406 (470,298) (540,730) $0.0705 ($38,146)
Dec-21 e 0 0 (0) 6,047 (151) 5,275 6,710 1,436 2,418 3,471,476 3,471,324 $0.0705 $244,888
Jan-22 e 1 0 (1) 6,026 (4,068) 4,673 4,522 -151 2,409 (363,389) (367,456) $0.0705 ($25,923)
Feb-22 e 24 8 (16) 5,999 (98,041) 2,116 2,216 100 2,398 239,200 141,159 $0.0705 $9,958
Mar-22 e 240 178 (62) 6,089 (376,968) 345 476 131 2,435 320,118 (56,850) $0.0147 ($837)
Apr-22 e 511 650 139 6,095 847,372 21 0 -21 2,437 (51,671) 795,701 $0.0147 $11,718
May-22 e 824 836 12 5,990 74,397 6 0 -6 2,395 (13,333) 61,063 $0.0147 $899
TOTAL 4,600 4,662 61 379,402 16,583 17,721 1,138 2,755,824 3,135,227 $197,124
Total TOTAL MARGIN
All Groups kWh IMPACT
Jun-21 a 8,386,941 277,890
Jul-21 a (8,988,647) (297,858)
Aug-21 a 18,442,989 611,100
Sep-21 a (21,344,284) (707,245)
Oct-21 a (20,623,726) (683,718)
Nov-21 a (35,697,933) (1,377,367)
Dec-21 a 227,885,230 8,783,411
Jan-22 a (24,138,465) (930,447)
Feb-22 a 9,209,985 352,879
Mar-22 a (4,342,403) (143,639)
Apr-22 a 53,504,669 1,773,048
May-22 a 4,170,827 138,220
TOTAL 206,465,182 $7,796,274
Public Service Electric and Gas
Conservation Incentive Program
Weather Normalization Calculation

ILLUSTRATIVE PURPOSES ONLY Attachment 6E
Schedule 5
Page 1 of 5
Determine Weather and Non-Weather CIP Impacts
Weather Non-Weather Total
CIP Group I RS RHS 7,599,151$ 7,537,965$ 15,137,116$
CIP Group II RLM 197,124$ (65,255)$ 131,868$
CIP Group III GLP -$ 24,794,468$ 24,794,468$
CIP Group IV LPLS -$ 12,659,637$ 12,659,637$
Total Deficiency/(Credit) 7,796,274$ 44,926,815$ 52,723,089$
Step 2: Apply Modified BGSS Savings Test
A. Non-weather Impact Subject to Modified BGS Savings Test
Non-Weather Impact 44,926,815$
75% Factor 75%
Subtotal 33,695,111$
Prior Year Carry-Forward (Modified BGSS Savings Test) -$
Non-weather Impact Subject to Test 33,695,111$
B. BGS Savings
Permanent Capacity Savings (Exhibit C, Schedule 6, Page 3) 64,505,906$
Additional Capacity BGS Savings (Exhibit C, Schedule 6, Page 3) -$
Avoided Cost BGS Savings (Exhibit C, Schedule 6, Page 4) 26,508,428$
Total BGS Savings 91,014,334$
C. Results
Non-Weather Impacts Passing Test (current accrual) 44,926,815$
Non-Weather Impacts Passing Test (prior year carry-forward) -$
Non-Weather Impacts Exceeding Test -$
Public Service Electric and Gas
Conservation Incentive Program Filing
June 2021 - May 2022
CIP Recovery Tests
Summary

ILLUSTRATIVE PURPOSES ONLY
Attachment 6E
Schedule 5
Page 2 of 5
Step 3: Apply Variable Margin Revenue Test
A. Non-weather Impact Subject to Variable Margin Revenue Test
Non-Weather Impact 44,926,815$
Prior Year Carry-Forward (Variable Margin Revenue Test) -$
Non-weather Impact Subject to Test 44,926,815$
B. Variable Margin Revenues
Variable Margin Revenues (Exhibit C, Schedule 6, Page 5) 949,240,295$
6.5% Factor 6.5%
Total Fixed Recovery Cap 61,700,619$
C. Results
Non-Weather Impacts Passing Test (current accrual) 44,926,815$
Non-Weather Impacts Passing Test (prior year carry-forward) -$
Non-Weather Impacts Exceeding Test -$
Step 4: Determine Recoverable Non-Weather CIP Impacts
A. Current Year Accrual Recoverable Non-Weather Impacts
Amount Passing Modified BGSS Savings Test 44,926,815$
Amount Passing Variable Margin Revenue Test 44,926,815$
Recoverable Amount 44,926,815$
B. Previous Carry-Forward Recoverable Amounts
Amount Passing Modified BGSS Savings Test -$
Amount Passing Variable Margin Revenue Test -$
Deduction for any amount also included in above -$
-$
Total Non-Weather Recoverable CIP Amount 44,926,815$
Summary
CIP Recovery Tests
Public Service Electric and Gas
Conservation Incentive Program Filing
June 2021 - May 2022

Attachment 6E
Schedule 5
Page 3 of 5
CIP Recovery Tests
I. Permanent BGS Savings
Year WN Summer PeakFinal Zonal UCAP
Obligation
PS Zonal Net
Load Price
$/MW-Day
PS Zonal Net
Load Price
$/kW-yr
2011/2012 10,340 12,333 $116.15 $42.42
2012/2013 10,150 11,645 $157.73 $57.61
2013/2014 10,100 11,629 $248.30 $90.69
2014/2015 10,120 11,564 $170.95 $62.44
2015/2016 10,160 11,398 $166.29 $60.74
2016/2017 9,490 11,043 $224.70 $82.07
2017/2018 9,530 10,932 $208.59 $76.19
2018/2019 9,450 11,272 $218.96 $79.97
2019/2020 9,370 11,281 $115.83 $42.31
2020/2021 9,480 11,320 $174.32 $63.67
Permanent Capacity Savings 1,013
2021 PS Zonal Net Load Capacity Cost per kW-year $63.67
Total Permanent Reductions $64,505,906
II. Additional Capacity BGS Savings
CIP Recovery
Year WN Summer PeakFinal Zona lUCAP
Obligation
PS Zonal Net
Load Price
$/MW-Day
2019/2020 9,370 11,281 $42.31
2020/2021* 9,480 11,320 $63.67
Incremental Capacity Savings* 0
PS Zonal Net Load Capacity Cost per kW-year $63.67
Total Additional Capacity Reductions -$
III. Avoided Capacity
CIP Recovery
Year Annual $
2019/2020 26,508,428$
VI. Total of all Savings
CIP
Recovery
Year
Permanent
Capacity
Savings
Additional Capacity BGSS
Savings
Avoided Cost BGSS
Savings Annual $
2019/2020 64,505,906$ -$ 26,508,428$ 91,014,334$
Public Service Electric and Gas
CIP BGS Savings
* Due to the potential for Peak increases due to Electric Vehicles and Electrification, incremental savings
is set as a minimum of the incremental obligation savings or zero

ILLUSTRATIVE PURPOSES ONLY Attachment 6E
Schedule 5
Page 4 of 5
Base Year Current Year
Net Increase/
(Decrease) Base Year Current Year Avoided
Month Customer Count Customer Count Customer Count
Unforced
Capacity /
Customer
(kW)
Capacity Rate /
Cust.
($/kW) Capacity
(a) (b) (c) (d) = (b) / (c) (e) (f)
(g) = (d) * (e) * (f)
* 1,000
Group 1: RS
June 1,882,438 1,921,455 45,393 2.3 $5.31 559,726
July 1,876,061 1,923,694 58,192 2.3 $5.31 720,245
August 1,865,502 1,916,474 43,971 2.3 $5.31 544,190
September 1,872,503 1,916,615 43,447 2.3 $5.31 538,382
October 1,873,168 1,914,216 41,351 2.3 $5.31 510,417
November 1,872,865 1,921,687 35,139 2.3 $5.31 434,824
December 1,886,548 1,916,894 26,299 2.3 $5.31 326,307
January 1,890,595 1,911,763 31,675 2.3 $5.31 392,062
February 1,880,088 1,916,381 64,008 2.4 $5.31 813,641
March 1,852,372 1,866,048 (52,315) 2.2 $5.31 (621,957)
April 1,918,364 1,995,221 131,146 2.3 $5.31 1,632,007
May 1,864,076 1,906,131 28,250 2.3 $5.31 348,742
Subtotal 1,877,882 1,918,882 41,380 $6,198,587
Group 2: RLM
June 12,114 11,427 (971) 7.4 $5.31 (38,152)
July 12,213 11,540 (574) 7.4 $5.31 (22,690)
August 11,549 11,475 (738) 7.2 $5.31 (28,337)
September 12,247 11,811 262 7.4 $5.31 10,287
October 12,179 11,545 (702) 7.4 $5.31 (27,654)
November 12,329 11,511 (668) 7.4 $5.31 (26,261)
December 12,188 11,542 (787) 7.4 $5.31 (30,898)
January 12,017 11,559 (630) 7.4 $5.31 (24,612)
February 12,039 11,609 (408) 7.6 $5.31 (16,480)
March 12,316 11,233 (806) 7.4 $5.31 (31,589)
April 12,310 11,576 (740) 7.3 $5.31 (28,477)
May 12,397 11,781 (529) 7.5 $5.31 (21,014)
Subtotal 12,158 11,551 (608) ($285,878)
Group 3: GLP
June 269,005 286,513 21,754 8.9 $5.31 1,030,287
July 264,759 283,243 23,892 9.4 $5.31 1,191,750
August 259,351 268,939 4,401 8.6 $5.31 199,656
September 264,539 295,678 48,029 8.8 $5.31 2,233,630
October 247,648 288,457 29,778 9.0 $5.31 1,424,579
November 258,679 280,410 13,735 8.9 $5.31 646,784
December 266,675 284,876 23,772 8.9 $5.31 1,128,831
January 261,105 282,497 19,522 8.9 $5.31 922,614
February 262,975 283,851 27,296 9.3 $5.31 1,344,609
March 256,555 272,327 4,903 8.6 $5.31 224,882
April 267,424 292,470 27,829 8.9 $5.31 1,311,598
May 264,641 284,631 15,626 8.8 $5.31 731,611
Subtotal 261,946 283,658 21,711 $12,390,832
Group 4: LPLS
June 8,883 9,018 162 267.1 $5.31 229,325
July 8,727 9,251 368 270.0 $5.31 526,705
August 8,370 9,153 425 270.9 $5.31 611,195
September 8,140 9,122 752 277.3 $5.31 1,106,538
October 9,014 8,912 772 273.8 $5.31 1,120,956
November 7,780 9,026 11 267.6 $5.31 16,100
December 8,886 9,234 1,454 276.8 $5.31 2,135,451
January 8,481 8,927 41 266.5 $5.31 57,568
February 8,891 9,273 793 287.4 $5.31 1,208,750
March 8,867 8,598 (293) 251.7 $5.31 (391,031)
April 8,846 9,819 952 275.2 $5.31 1,390,334
May 8,856 8,978 133 274.0 $5.31 192,996
Subtotal 8,645 9,109 464 $8,204,886
Total Avoided Capacity Cost BGS Savings $26,508,428
Notes:
(1)Base Year Customer Count is equal to the test year customer count used to set base rates in a base rate case
(2)Current Year Customer Count is equal to the customer count in the CIP accrual year.
(3)Base Year Unforced capacity is equal to the 2017/2018 Unforced capacity from PJM by rate schedule divided by number of customers
(4)Current Year Capacity rate is the current year PS Zonal Net Load Price $/kW-yr divided by 12
Public Service Electric and Gas
CIP Recovery Tests
Avoided Capacity Cost BGS Savings

ILLUSTRATIVE PURPOSES ONLY Attachment 6E
Schedule 5
Page 5 of 5
Group I (RS) $479,659,857
Group II (RLM) $5,296,387
Group III (GLP) $268,638,974
Group IV $195,645,078
Total Variable Margin $949,240,295
Actual/ Number of Baseline Variable
Customer Class Estimate Customers Revenue / Cust. Revenue
Group I: Residential Service RS and RHS
June e 1,921,455 42.4 $81,526,572
July e 1,923,694 42.5 $81,700,841
August e 1,916,474 20.4 $39,021,862
September e 1,916,615 12.2 $23,328,902
October e 1,914,216 12.5 $23,918,140
November e 1,921,687 14.3 $27,508,538
December e 1,916,894 15.1 $28,990,789
January e 1,911,763 13.9 $26,543,477
February e 1,916,381 13.5 $25,962,537
March e 1,866,048 11.4 $21,329,665
April e 1,995,221 18.3 $36,505,114
May e 1,906,131 33.2 $63,323,418
Total 249.7 $479,659,857
Group Ia: Residential Load Management (RLM)
June e 11,427 77.9 $889,984
July e 11,540 78.0 $899,696
August e 11,475 37.4 $428,901
September e 11,811 22.3 $263,895
October e 11,545 22.9 $264,804
November e 11,511 26.3 $302,478
December e 11,542 27.8 $320,435
January e 11,559 25.5 $294,593
February e 11,609 24.9 $288,705
March e 11,233 21.0 $235,688
April e 11,576 33.6 $388,791
May e 11,781 61.0 $718,417
Total 458.5 $5,296,387
Group II: General Power & Light (GLP)
June e 286,513 148.9 $42,671,371
July e 283,243 156.5 $44,329,777
August e 268,939 101.7 $27,343,386
September e 295,678 46.9 $13,870,980
October e 288,457 46.9 $13,514,508
November e 280,410 45.2 $12,674,355
December e 284,876 45.9 $13,068,934
January e 282,497 46.8 $13,208,820
February e 283,851 46.2 $13,117,814
March e 272,327 46.0 $12,522,612
April e 292,470 82.5 $24,127,246
May e 284,631 134.2 $38,189,171
Total 947.6 $268,638,974
Group III: Large Power & Light - Seconday (LPLS)
June e 9,018 3,493.9 $31,507,445
July e 9,251 3,606.1 $33,358,072
August e 9,153 2,251.9 $20,610,296
September e 9,122 1,616.7 $14,746,992
October e 8,912 1,108.4 $9,878,101
November e 9,026 1,060.6 $9,572,704
December e 9,234 970.0 $8,956,818
January e 8,927 1,105.1 $9,865,275
February e 9,273 1,078.5 $10,001,098
March e 8,598 1,010.0 $8,684,560
April e 9,819 1,664.4 $16,342,703
May e 8,978 2,463.8 $22,121,014
Total 21,429.4 $195,645,078
Public Service Electric and Gas
CIP Recovery Tests
Allowed Margin

ILLUSTRATIVE PURPOSES ONLY
Attachment 6E
Schedule 6
CONSERVATION INCENTIVE PROGRAM
EARNINGS TEST
JANUARY 1, 2021 THROUGH DECEMBER 31, 2021
NINE MONTHS ACTUAL, THREE MONTHS ESTIMATE
in $000
1 Equity Base for Earnings Test 3,000,000
2 Allowed ROE 9.6% 2018 Base Rate Case
3 ROE Limit buffer 0.5% From IIP
4 Maximum ROE 10.1% = ln 2 + ln 3
5 Actual Net Income 250,000
6 ROE for Earnings Test 8.33% = ln 5 / ln 1
7 Earnings Test Pass / Fail Pass = IF ln 4 > 6, Pass else Fail
PUBLIC SERVICE ELECTRIC AND GAS
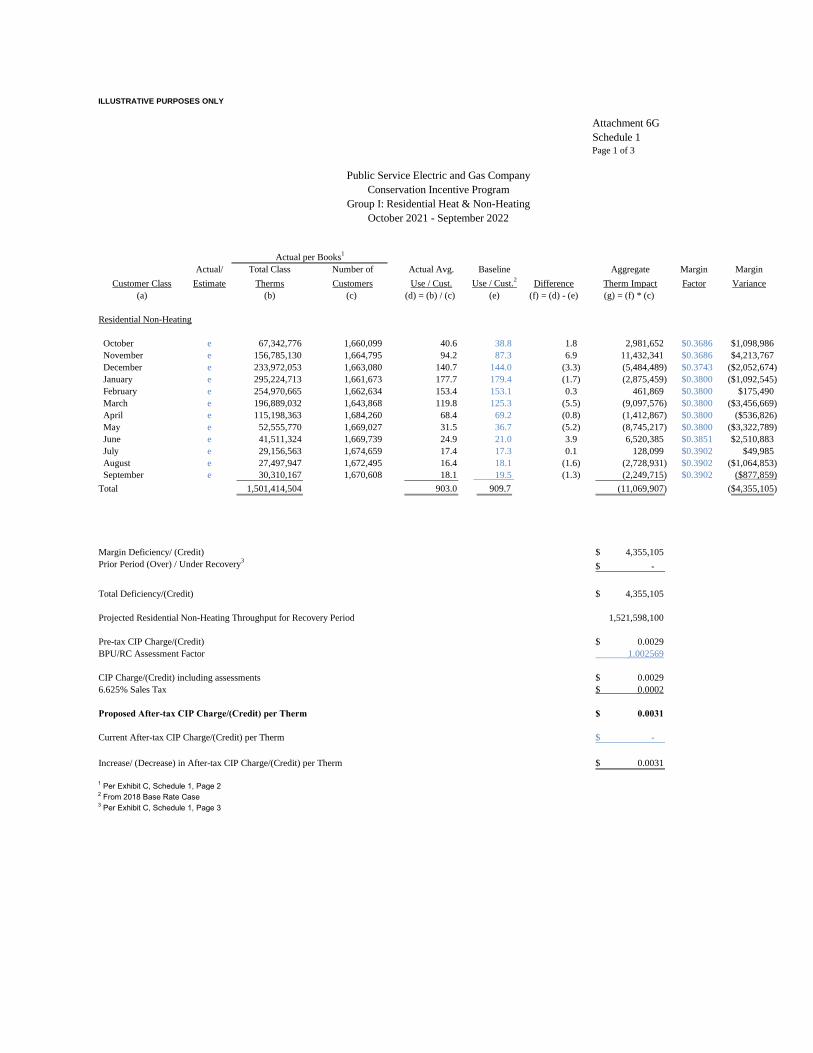
ILLUSTRATIVE PURPOSES ONLY
Attachment 6G
Schedule 1
Page 1 of 3
Conservation Incentive Program
Group I: Residential Heat & Non-Heating
October 2021 - September 2022
Actual per Books1
Actual/ Total Class Number of Actual Avg. Baseline Aggregate Margin Margin
Customer Class Estimate Therms Customers Use / Cust. Use / Cust.2
Difference Therm Impact Factor Variance
(a) (b) (c) (d) = (b) / (c) (e) (f) = (d) - (e) (g) = (f) * (c)
Residential Non-Heating
October e 67,342,776 1,660,099 40.6 38.8 1.8 2,981,652 $0.3686 $1,098,986
November e 156,785,130 1,664,795 94.2 87.3 6.9 11,432,341 $0.3686 $4,213,767
December e 233,972,053 1,663,080 140.7 144.0 (3.3) (5,484,489) $0.3743 ($2,052,674)
January e 295,224,713 1,661,673 177.7 179.4 (1.7) (2,875,459) $0.3800 ($1,092,545)
February e 254,970,665 1,662,634 153.4 153.1 0.3 461,869 $0.3800 $175,490
March e 196,889,032 1,643,868 119.8 125.3 (5.5) (9,097,576) $0.3800 ($3,456,669)
April e 115,198,363 1,684,260 68.4 69.2 (0.8) (1,412,867) $0.3800 ($536,826)
May e 52,555,770 1,669,027 31.5 36.7 (5.2) (8,745,217) $0.3800 ($3,322,789)
June e 41,511,324 1,669,739 24.9 21.0 3.9 6,520,385 $0.3851 $2,510,883
July e 29,156,563 1,674,659 17.4 17.3 0.1 128,099 $0.3902 $49,985
August e 27,497,947 1,672,495 16.4 18.1 (1.6) (2,728,931) $0.3902 ($1,064,853)
September e 30,310,167 1,670,608 18.1 19.5 (1.3) (2,249,715) $0.3902 ($877,859)
Total 1,501,414,504 903.0 909.7 (11,069,907) ($4,355,105)
Margin Deficiency/ (Credit) 4,355,105$
Prior Period (Over) / Under Recovery3
-$
Total Deficiency/(Credit) 4,355,105$
Projected Residential Non-Heating Throughput for Recovery Period 1,521,598,100
Pre-tax CIP Charge/(Credit) 0.0029$
BPU/RC Assessment Factor 1.002569
CIP Charge/(Credit) including assessments 0.0029$
6.625% Sales Tax 0.0002$
Proposed After-tax CIP Charge/(Credit) per Therm 0.0031$
Current After-tax CIP Charge/(Credit) per Therm -$
Increase/ (Decrease) in After-tax CIP Charge/(Credit) per Therm 0.0031$
1 Per Exhibit C, Schedule 1, Page 22 From 2018 Base Rate Case3 Per Exhibit C, Schedule 1, Page 3
Public Service Electric and Gas Company

ILLUSTRATIVE PURPOSES ONLY
Attachment 6G
Schedule 1
Page 2 of 3
Public Service Electric and Gas CompanyCustomers and Therms
Group I: Residential Heat & Non-Heating
Estimate Estimate Estimate Estimate Estimate Estimate Estimate Estimate Estimate Estimate Estimate Estimate
Oct-21 Nov-21 Dec-21 Jan-22 Feb-22 Mar-22 Apr-22 May-22 Jun-22 Jul-22 Aug-22 Sep-22
CustomersRSG heating 1,432,278 1,435,713 1,434,502 1,424,074 1,430,635 1,416,067 1,456,991 1,442,691 1,443,720 1,448,951 1,446,908 1,444,193
RSG non-heating 227,821 229,083 228,577 237,599 231,999 227,801 227,269 226,336 226,019 225,708 225,587 226,415
Total Customers 1,660,099 1,664,795 1,663,080 1,661,673 1,662,634 1,643,868 1,684,260 1,669,027 1,669,739 1,674,659 1,672,495 1,670,608
VolumesRSG heating 65,270,130 148,604,339 225,403,007 289,967,465 250,424,912 193,012,074 111,867,103 49,912,548 39,212,812 26,571,828 25,387,358 28,285,580 1,453,919,157
RSG non-heating 2,072,647 8,180,791 8,569,046 5,257,248 4,545,753 3,876,959 3,331,260 2,643,222 2,298,511 2,584,736 2,110,589 2,024,586 47,495,348
Total Volumes 67,342,776 156,785,130 233,972,053 295,224,713 254,970,665 196,889,032 115,198,363 52,555,770 41,511,324 29,156,563 27,497,947 30,310,167 1,501,414,504

ILLUSTRATIVE PURPOSES ONLY Attachment 6G
Schedule 1
Page 3 of 3
PUBLIC SERVICE ELECTRIC AND GAS COMPANYSTATEMENT OF ESTIMATED UNDER/(OVER) RECOVERED CIP BALANCE
Group I: Residential Heat & Non-Heating
Estimate Estimate Estimate Estimate Estimate Estimate Estimate Estimate Estimate Estimate Estimate Estimate
Oct-21 Nov-21 Dec-21 Jan-22 Feb-22 Mar-22 Apr-22 May-22 Jun-22 Jul-22 Aug-22 Sep-22 TOTAL
Beginning Under/(Over) Recovery $ 0 0 0 0 0 0 0 0 0 0 0 0 0
Therm Sales 67,342,776 156,785,130 233,972,053 295,224,713 254,970,665 196,889,032 115,198,363 52,555,770 41,511,324 29,156,563 27,497,947 30,310,167 1,501,414,504
Pre-tax Recovery Rate per Therm1 0.0000 0.0000 0.0000 0.0000 0.0000 0.0000 0.0000 0.0000 0.0000 0.0000 0.0000 0.0000
Recovery $ 0 0 0 0 0 0 0 0 0 0 0 0 0
Ending Under/(Over) Recovery $ 0 0 0 0 0 0 0 0 0 0 0 0 0
October 2021 - September 2022
1 Pre-tax Recovery Rate per therm excluding BPU and RC assessments.

ILLUSTRATIVE PURPOSES ONLY
Attachment 6G
Schedule 2
Page 1 of 3
Conservation Incentive Program
Group II: General Service Gas (GSG)
October 2021 - September 2022
Actual per Books1
Actual/ Total Class Number of Actual Avg. Baseline Aggregate Margin Margin
Customer Class Estimate Therms Customers Use / Cust. Use / Cust.2
Difference Therm Impact Factor Variance
(a) (b) (c) (d) = (b) / (c) (e) (f) = (d) - (e) (g) = (f) * (c)
General Service Small
October e 12,918,483 139,593 92.5 112.2 (19.7) (2,748,266) $0.2926 ($804,019)
November e 27,806,708 139,796 198.9 173.7 25.2 3,526,241 $0.2926 $1,031,619
December e 47,586,518 139,531 341.1 320.4 20.7 2,885,422 $0.2956 $853,016
January e 55,978,433 139,557 401.1 433.7 (32.6) (4,551,009) $0.2987 ($1,359,404)
February e 46,707,448 139,502 334.8 354.4 (19.6) (2,736,061) $0.2987 ($817,273)
March e 37,335,157 137,321 271.9 281.5 (9.6) (1,324,681) $0.2987 ($395,688)
April e 21,785,596 140,732 154.8 164.4 (9.6) (1,348,271) $0.2987 ($402,734)
May e 11,439,173 140,077 81.7 80.6 1.0 144,114 $0.2987 $43,047
June e 7,482,658 140,041 53.4 49.7 3.8 527,964 $0.3014 $159,105
July e 7,109,375 138,968 51.2 57.1 (6.0) (829,433) $0.3040 ($252,155)
August e 7,669,412 139,089 55.1 51.2 4.0 549,968 $0.3040 $167,195
September e 6,820,285 138,549 49.2 53.4 (4.2) (575,054) $0.3040 ($174,822)
Total 290,639,246 2,085.7 2,132.3 (6,479,067) ($1,952,111)
Margin Deficiency/ (Credit) 1,952,111$
Prior Period (Over) / Under Recovery3
-$
Total Deficiency/(Credit) 1,952,111$
Projected Commercial Throughput for Recovery Period 289,952,320
Pre-tax CIP Charge/(Credit) 0.0067$
BPU/RC Assessment Factor 1.002569
CIP Charge/(Credit) including assessments 0.0067$
6.625% Sales Tax 0.0004$
Proposed After-tax CIP Charge/(Credit) per Therm 0.0071$
Current After-tax CIP Charge/(Credit) per Therm -$
Increase/ (Decrease) in After-tax CIP Charge/(Credit) per Therm 0.0071$
1 Per Exhibit C, Schedule 3, Page 22 From 2018 Base Rate Case3 Per Exhibit C, Schedule 3, Page 3
Public Service Electric and Gas

ILLUSTRATIVE PURPOSES ONLY
Attachment 6G
Schedule 3
Page 2 of 3
Public Service Electric and GasCustomers and Therms
Group II: General Service Gas (GSG)
Estimate Estimate Estimate Estimate Estimate Estimate Estimate Estimate Estimate Estimate Estimate Estimate
Oct-21 Nov-21 Dec-21 Jan-22 Feb-22 Mar-22 Apr-22 May-22 Jun-22 Jul-22 Aug-22 Sep-22
CustomersGSG Heating 114,183 114,527 114,337 114,295 114,273 112,674 115,341 114,934 114,880 113,941 114,194 113,625
GSG Non-Heating 25,410 25,269 25,194 25,263 25,229 24,647 25,391 25,142 25,162 25,027 24,895 24,924
Total Customers 139,593 139,796 139,531 139,557 139,502 137,321 140,732 140,077 140,041 138,968 139,089 138,549
VolumesGSG Heating 10,454,149 24,089,750 41,550,122 50,222,054 40,967,187 32,276,661 18,277,654 8,821,668 5,244,883 5,013,542 5,501,554 5,136,675 247,555,900
GSG Non-Heating 2,464,334 3,716,958 6,036,396 5,756,379 5,740,261 5,058,496 3,507,942 2,617,505 2,237,775 2,095,833 2,167,858 1,683,610 43,083,346
Total Volumes 12,918,483 27,806,708 47,586,518 55,978,433 46,707,448 37,335,157 21,785,596 11,439,173 7,482,658 7,109,375 7,669,412 6,820,285 290,639,246

ILLUSTRATIVE PURPOSES ONLY Attachment 6G
Schedule 3
Page 3 of 3
PUBLIC SERVICE ELECTRIC AND GAS COMPANYSTATEMENT OF ESTIMATED UNDER/(OVER) RECOVERED CIP BALANCE
Group II: General Service Gas (GSG)
Estimate Estimate Estimate Estimate Estimate Estimate Estimate Estimate Estimate Estimate Estimate Estimate
Oct-21 Nov-21 Dec-21 Jan-22 Feb-22 Mar-22 Apr-22 May-22 Jun-22 Jul-22 Aug-22 Sep-22 TOTAL
Beginning Under/(Over) Recovery $ 0 0 0 0 0 0 0 0 0 0 0 0 0
Therm Sales 12,918,483 27,806,708 47,586,518 55,978,433 46,707,448 37,335,157 21,785,596 11,439,173 7,482,658 7,109,375 7,669,412 6,820,285 290,639,246
Pre-tax Recovery Rate per Therm1 0.0000 0.0000 0.0000 0.0000 0.0000 0.0000 0.0000 0.0000 0.0000 0.0000 0.0000 0.0000
Recovery $ 0 0 0 0 0 0 0 0 0 0 0 0 0
Ending Under/(Over) Recovery $ 0 0 0 0 0 0 0 0 0 0 0 0 0
October 2021 - September 2022
1 Pre-tax Recovery Rate per therm excluding BPU and RC assessments.

ILLUSTRATIVE PURPOSES ONLY
Attachment 6G
Schedule 3
Page 1 of 3
Conservation Incentive Program
Group III: Large Volume Gas (LVG)
October 2021 - September 2022
Actual per Books1
Large Adjusted
Actual/ Total Class Number of Customer Number of Actual Avg. Baseline Aggregate Margin Margin
Customer Class Estimate Therms Customers Adjustment Customers Use / Cust.2
Use / Cust. Difference Therm Impact Factor Variance
(a) (b) (c1) (c2) (c) = (c1) + (c2) (d) = (b) / (c) (e) (f) = (d) - (e) (g) = (f) * (c)
General Service Large
October e 42,763,409 19,081 - 19,081 2,241.1 2,391.9 (150.7) (2,876,010) $0.0440 ($126,455)
November e 70,622,456 19,101 - 19,101 3,697.4 3,570.6 126.7 2,420,323 $0.0440 $106,419
December e 106,773,356 19,008 - 19,008 5,617.3 5,232.3 385.0 7,318,162 $0.0451 $329,793
January e 121,930,621 18,668 - 18,668 6,531.4 6,507.3 24.1 450,365 $0.0462 $20,789
February e 109,927,597 19,016 - 19,016 5,780.9 5,836.7 (55.8) (1,061,727) $0.0462 ($49,010)
March e 103,382,969 18,579 - 18,579 5,564.5 5,497.3 67.2 1,248,064 $0.0462 $57,612
April e 66,170,486 19,692 - 19,692 3,360.3 3,498.7 (138.4) (2,725,064) $0.0462 ($125,792)
May e 36,430,854 19,054 - 19,054 1,911.9 2,012.5 (100.6) (1,916,701) $0.0462 ($88,477)
June e 27,748,463 19,080 - 19,080 1,454.3 1,457.5 (3.1) (59,566) $0.0451 ($2,685)
July e 23,818,293 19,086 - 19,086 1,248.0 1,366.7 (118.7) (2,265,279) $0.0440 ($99,661)
August e 25,317,371 18,926 - 18,926 1,337.7 1,404.2 (66.5) (1,258,509) $0.0440 ($55,368)
September e 25,679,844 18,851 - 18,851 1,362.3 1,368.3 (6.0) (113,418) $0.0440 ($4,990)
Total 760,565,719 40,107.1 40,143.9 (839,360) ($37,825)
Margin Deficiency/ (Credit) 37,825$
Prior Period (Over) / Under Recovery3
-$
Total Deficiency/(Credit) 37,825$
Projected Commercial Throughput for Recovery Period 760,577,559
Pre-tax CIP Charge/(Credit) -$
BPU/RC Assessment Factor 1.002569
CIP Charge/(Credit) including assessments -$
6.625% Sales Tax -$
Proposed After-tax CIP Charge/(Credit) per Therm -$
Current After-tax CIP Charge/(Credit) per Therm -$
Increase/ (Decrease) in After-tax CIP Charge/(Credit) per Therm -$
1 Per Exhibit C, Schedule 4, Page 22 From 2018 Base Rate Case3 Per Exhibit C, Schedule 4, Page 3
Public Service Electric and Gas Company

ILLUSTRATIVE PURPOSES ONLY
Attachment 6G
Schedule 3
Page 2 of 3
Public Service Electric and Gas CompanyCustomers and Therms
Group III: Large Volume Gas (LVG)
Estimate Estimate Estimate Estimate Estimate Estimate Estimate Estimate Estimate Estimate Estimate Estimate
Oct-21 Nov-21 Dec-21 Jan-22 Feb-22 Mar-22 Apr-22 May-22 Jun-22 Jul-22 Aug-22 Sep-22
CustomersLVG 19,081 19,101 19,008 18,668 19,016 18,579 19,692 19,054 19,080 19,086 18,926 18,851
Total Customers 19,081 19,101 19,008 18,668 19,016 18,579 19,692 19,054 19,080 19,086 18,926 18,851
VolumesLVG 42,763,409 70,622,456 106,773,356 121,930,621 109,927,597 103,382,969 66,170,486 36,430,854 27,748,463 23,818,293 25,317,371 25,679,844 760,565,719
Total Volumes 42,763,409 70,622,456 106,773,356 121,930,621 109,927,597 103,382,969 66,170,486 36,430,854 27,748,463 23,818,293 25,317,371 25,679,844 760,565,719

ILLUSTRATIVE PURPOSES ONLY Attachment 6G
Schedule 3
Page 3 of 3
PUBLIC SERVICE ELECTRIC AND GAS COMPANYSTATEMENT OF ESTIMATED UNDER/(OVER) RECOVERED CIP BALANCE
Group III: Large Volume Gas (LVG)
Estimate Estimate Estimate Estimate Estimate Estimate Estimate Estimate Estimate Estimate Estimate Estimate
Oct-21 Nov-21 Dec-21 Jan-22 Feb-22 Mar-22 Apr-22 May-22 Jun-22 Jul-22 Aug-22 Sep-22 TOTAL
Beginning Under/(Over) Recovery $ 0 0 0 0 0 0 0 0 0 0 0 0 0
Therm Sales 42,763,409 70,622,456 106,773,356 121,930,621 109,927,597 103,382,969 66,170,486 36,430,854 27,748,463 23,818,293 25,317,371 25,679,844 760,565,719
Pre-tax Recovery Rate per Therm1 0.0000 0.0000 0.0000 0.0000 0.0000 0.0000 0.0000 0.0000 0.0000 0.0000 0.0000 0.0000
Recovery $ 0 0 0 0 0 0 0 0 0 0 0 0 0
Ending Under/(Over) Recovery $ 0 0 0 0 0 0 0 0 0 0 0 0 0
October 2021 - September 2022
1 Pre-tax Recovery Rate per therm excluding BPU and RC assessments.

ILLUSTRATIVE PURPOSES ONLY Attachment 6GSchedule 4
Step 1: Determine the degree day variance from the dead band.0.50%
Normal Dead Actual Normalization
Degree Days Band Low End High End Degree Days Amount (1)
October 243 1 242 244 243 - November 516 3 514 519 516 - December 827 4 823 831 827 - January 1,003 5 998 1,008 1,003 - February 858 4 854 862 858 - March 692 3 688 695 692 - April 358 2 356 359 358 - May 124 1 123 124 124 -
Step 2: Determine the normalized volumes by rate class.
RSG GSG LVG RSG GSG LVG
October 155,872 17,368 88,550 - - - November 249,538 31,588 88,550 - - - December 246,824 54,161 88,550 - - - January 284,118 68,715 89,001 - - - February 291,909 59,983 89,001 - - - March 292,968 61,432 89,001 - - - April 270,873 61,014 89,001 - - - May 196,672 17,503 89,001 - - -
Step 3: Calculate the margin revenue to be deferred.
Margin Revenue Factor:
December 2020- May 2021 0.36071 0.28830 0.04198
October 2020 - November 2020 0.35139 0.28326 0.04181 Total
October -$ -$ -$ -$ November -$ -$ -$ -$ December -$ -$ -$ -$ January -$ -$ -$ -$ February -$ -$ -$ -$ March -$ -$ -$ -$ April -$ -$ -$ -$ May -$ -$ -$ -$ Winter Period Total -$ -$ -$ -$
(1) Amount above or below the Dead Band
(2) Consumption factors to be true-up at the end of the Winter Period for actual # of customers.
(3) Normalization degree days x Therms Per Degree Day
(4) Normalization Volumes x Margin Revenue Factor
Margin Revenue Deferral (4)
Public Service Electric and GasWeather Normalization
2021-2022 Winter Period
Dead Band
Therms Per Degree Day (2) Normalization Volumes (3)

ILLUSTRATIVE PURPOSES ONLY Attachment 6GSchedule 5Page 1 of 5
Determine Weather and Non-Weather CIP ImpactsWeather Non-Weather Total
CIP Group 1 (RSG) -$ 4,355,105$ 4,355,105$
CIP Group 2 (GSG) -$ 1,952,111$ 1,952,111$
CIP Group 3 (LVG) -$ 37,825$ 37,825$
Total Deficiency/(Credit) -$ 6,345,041$ 6,345,041$
Step 2: Apply Modified BGSS Savings Test
A. Non-weather Impact Subject to Modified BGSS Savings Test
Non-Weather Impact 6,345,041$
75% Factor 75%
Subtotal 4,758,781$
Prior Year Carry-Forward (Modified BGSS Savings Test) -$
Non-weather Impact Subject to Test 4,758,781$
B. BGSS Savings
Permanent Capacity Savings (Exhibit C, Schedule 6, Page 3) 45,394,957$
Additional Capacity BGSS Savings (Exhibit C, Schedule 6, Page 3) -$
Avoided Cost BGSS Savings (Exhibit C, Schedule 6, Page 4) 3,387,831$
Total BGSS Savings 48,782,788$
C. Results
Non-Weather Impacts Passing Test (current accrual) 6,345,041$ Non-Weather Impacts Passing Test (prior year carry-forward) -$ Non-Weather Impacts Exceeding Test -$
Public Service Electric and GasConservation Incentive Program Filing
October 2021 - September 2022CIP Recovery Tests
Summary

ILLUSTRATIVE PURPOSES ONLY
Attachment 6GSchedule 6Page 2 of 5
Step 3: Apply Variable Margin Revenue Test
A. Non-weather Impact Subject to Variable Margin Revenue Test
Non-Weather Impact 6,345,041$
Prior Year Carry-Forward (Variable Margin Revenue Test) -$
Non-weather Impact Subject to Test 6,345,041$
B. Variable Margin Revenues
Variable Margin Revenues (Exhibit C, Schedule 6, Page 5) 695,148,298$
6.5% Factor 6.5%
Total Fixed Recovery Cap 45,184,639$
C. Results
Non-Weather Impacts Passing Test (current accrual) 6,345,041$ Non-Weather Impacts Passing Test (prior year carry-forward) -$ Non-Weather Impacts Exceeding Test -$
Step 4: Determine Recoverable Non-Weather CIP Impacts
A. Current Year Accrual Recoverable Non-Weather Impacts
Amount Passing Modified BGSS Savings Test 6,345,041$
Amount Passing Variable Margin Revenue Test 6,345,041$
Recoverable Amount 6,345,041$
B. Previous Carry-Forward Recoverable Amounts
Amount Passing Modified BGSS Savings Test -$
Amount Passing Variable Margin Revenue Test -$
Deduction for any amount also included in above -$
-$
Total Non-Weather Recoverable CIP Amount 6,345,041$
Summary
Public Service Electric and GasConservation Incentive Program Filing
October 2021 - September 2022CIP Recovery Tests

Attachment 6GSchedule 5Page 3 of 5
I. Permanent BGSS SavingsPipeline Contract No. Type of Transaction Quantity Dth Annual $
Texas Eastern 870146 Contract Terminated 88,321 3,539,906$
Texas Eastern 870145 Contract Terminated 25,000 821,250
Texas Eastern 911678 Contract Reduced 33,376 1,400,000
Texas Eastern 911677 Contract Reduced 56,493 2,000,000
Texas Eastern 911679 Contract Reduced 59,817 2,200,000
Dominion 200318/200315 Contract Terminated 43,300 1,089,237
Dominion 525445 Contract Reduced 48,526 2,537,483
Dominion 200482 Contract Reduced 55,737 4,271,190
National Fuel F11135 Contract Terminated 48,400 3,545,087
National Fuel F10833 Contract Terminated 30,795 1,265,702
National Fuel F10845 Contract Terminated 20,000 822,018
Steuben 4 Contract Terminated 11,111 1,084,634
Steuben 3 Contract Terminated 30,955 3,333,011
Trunkline 21079 Contract Terminated 89,392 6,630,062
Trunkline 20912 Contract Terminated 25,242 998,725
Panhandle 22945 Contract Terminated 88,498 2,994,348
Panhandle 22652 Contract Terminated 25,000 718,138
Texas Gas T025024 Contract Terminated 85,417 6,144,167
Total Permanent Reductions 45,394,957$
II. Additional Capacity BGSS Savings
CIP Recovery
Year Annual $
2020-2021 -$
III. Avoided Capacity
CIP Recovery
Year Annual $
2020-2021 3,387,831$
VI. Total of all Savings
CIP Recovery Year
Permanent
Capacity Savings
Additional Capacity BGSS
Savings
Avoided Cost
BGSS Savings Annual $
2020-2021 45,394,957$ -$ 3,387,831$ 48,782,788$
Public Service Electric and Gas Company
CIP BGSS SavingsCIP Recovery Tests
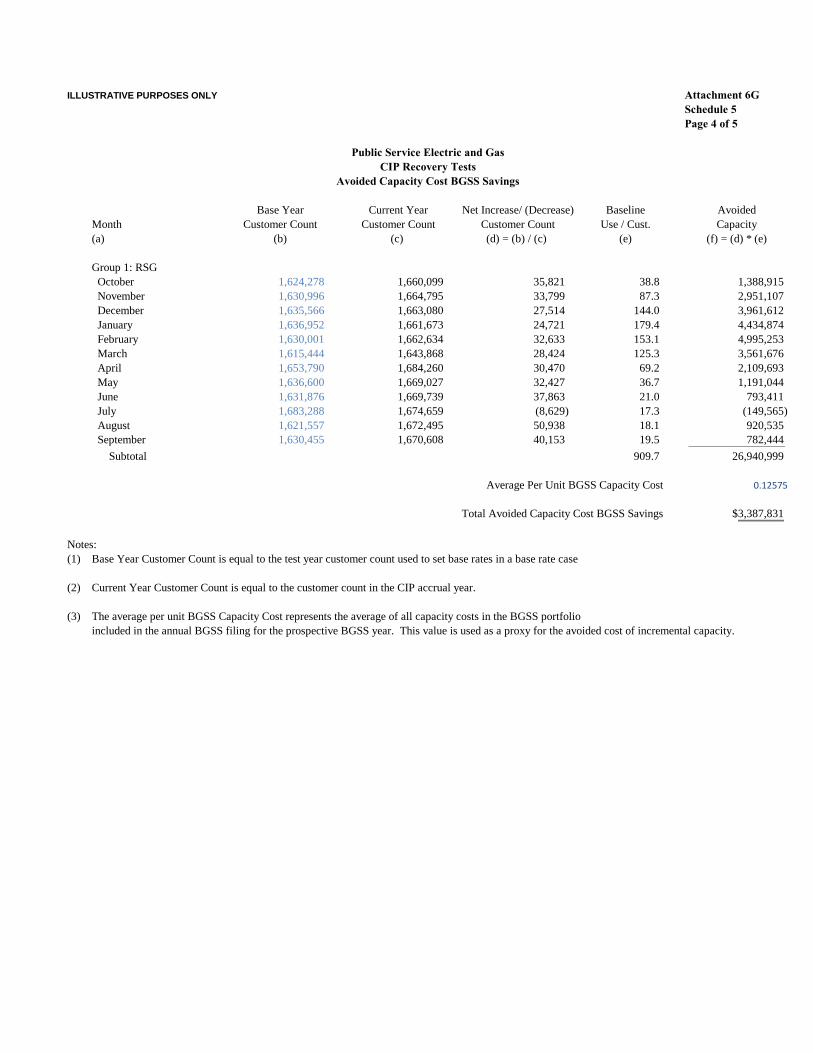
ILLUSTRATIVE PURPOSES ONLY Attachment 6GSchedule 5Page 4 of 5
Base Year Current Year Net Increase/ (Decrease) Baseline Avoided
Month Customer Count Customer Count Customer Count Use / Cust. Capacity
(a) (b) (c) (d) = (b) / (c) (e) (f) = (d) * (e)
Group 1: RSG
October 1,624,278 1,660,099 35,821 38.8 1,388,915
November 1,630,996 1,664,795 33,799 87.3 2,951,107
December 1,635,566 1,663,080 27,514 144.0 3,961,612
January 1,636,952 1,661,673 24,721 179.4 4,434,874
February 1,630,001 1,662,634 32,633 153.1 4,995,253
March 1,615,444 1,643,868 28,424 125.3 3,561,676
April 1,653,790 1,684,260 30,470 69.2 2,109,693
May 1,636,600 1,669,027 32,427 36.7 1,191,044
June 1,631,876 1,669,739 37,863 21.0 793,411
July 1,683,288 1,674,659 (8,629) 17.3 (149,565)
August 1,621,557 1,672,495 50,938 18.1 920,535
September 1,630,455 1,670,608 40,153 19.5 782,444
Subtotal 909.7 26,940,999
Average Per Unit BGSS Capacity Cost 0.12575
Total Avoided Capacity Cost BGSS Savings $3,387,831
Notes:
(1) Base Year Customer Count is equal to the test year customer count used to set base rates in a base rate case
(2) Current Year Customer Count is equal to the customer count in the CIP accrual year.
(3) The average per unit BGSS Capacity Cost represents the average of all capacity costs in the BGSS portfolio
included in the annual BGSS filing for the prospective BGSS year. This value is used as a proxy for the avoided cost of incremental capacity.
Avoided Capacity Cost BGSS Savings
Public Service Electric and GasCIP Recovery Tests

ILLUSTRATIVE PURPOSES ONLY Attachment 6GSchedule 5Page 5 of 5
Group I (RSG) $572,054,911
Group II (GSG) $88,504,755
Group III (LVG) $34,588,632
Total Variable Margin $695,148,298
Actual/ Number of Baseline Margin Variable
Customer Class Estimate Customers Use / Cust. Factor Revenue
RSG
October e 1,660,099 38.8 $0.3686 $23,725,156
November e 1,664,795 87.3 $0.3686 $53,576,514
December e 1,663,080 144.0 $0.3743 $89,623,633
January e 1,661,673 179.4 $0.3800 $113,266,416
February e 1,662,634 153.1 $0.3800 $96,699,726
March e 1,643,868 125.3 $0.3800 $78,264,526
April e 1,684,260 69.2 $0.3800 $44,308,922
May e 1,669,027 36.7 $0.3800 $23,292,338
June e 1,669,739 21.0 $0.3851 $13,473,757
July e 1,674,659 17.3 $0.3902 $11,326,878
August e 1,672,495 18.1 $0.3902 $11,793,969
September e 1,670,608 19.5 $0.3902 $12,703,075
Total 909.7 $572,054,911
GSG
October e 139,593 112.2 $0.2926 $4,583,213
November e 139,796 173.7 $0.2926 $7,103,377
December e 139,531 320.4 $0.2956 $13,215,149
January e 139,557 433.7 $0.2987 $18,080,212
February e 139,502 354.4 $0.2987 $14,769,162
March e 137,321 281.5 $0.2987 $11,547,748
April e 140,732 164.4 $0.2987 $6,910,111
May e 140,077 80.6 $0.2987 $3,373,728
June e 140,041 49.7 $0.3014 $2,095,763
July e 138,968 57.1 $0.3040 $2,413,539
August e 139,089 51.2 $0.3040 $2,164,358
September e 138,549 53.4 $0.3040 $2,248,396
Total 2,132.3 $88,504,755
LVG
October e 19,081 2,391.9 $0.0440 $2,006,715
November e 19,101 3,570.6 $0.0440 $2,998,783
December e 19,008 5,232.3 $0.0451 $4,481,945
January e 18,668 6,507.3 $0.0462 $5,607,648
February e 19,016 5,836.7 $0.0462 $5,123,380
March e 18,579 5,497.3 $0.0462 $4,714,650
April e 19,692 3,498.7 $0.0462 $3,180,291
May e 19,054 2,012.5 $0.0462 $1,770,159
June e 19,080 1,457.5 $0.0451 $1,253,530
July e 19,086 1,366.7 $0.0440 $1,147,551
August e 18,926 1,404.2 $0.0440 $1,169,202
September e 18,851 1,368.3 $0.0440 $1,134,777
Total 40,143.9 $34,588,632
Public Service Electric and GasCIP Recovery Tests
Variable Margin

ILLUSTRATIVE PURPOSES ONLY
Attachment 6GSchedule 6
PUBLIC SERVICE ELECTRIC AND GASCONSERVATION INCENTIVE PROGRAM
EARNINGS TESTAPRIL 1, 2021 THROUGH MARCH 31, 2022
NINE MONTHS ACTUAL, THREE MONTHS ESTIMATE
in $000
1 Equity Base for Earnings Test 3,000,000
2 Allowed ROE 9.6% 2018 Base Rate Case
3 ROE Limit buffer 0.5% From IIP
4 Maximum ROE 10.1% = ln 2 + ln 3
5 Actual Net Income 250,000
6 ROE for Earnings Test 8.33% = ln 5 / ln 1
7 Earnings Test Pass / Fail Pass = IF ln 4 > 6, Pass else Fail

13 DOCKET NOS. GO18101112 and EO18101113
IN THE MATTER OF THE PETITION OF PUBLIC SERVICE ELECTRIC AND GAS COMPANY FOR APPROVAL OF ITS CLEAN ENERGY FUTURE – ENERGY EFFICIENCY (“CEF-EE”) PROGRAM ON A
REGULATED BASIS
BPU DOCKET NOS. GO18101112 and EO18101113
SERVICE LIST
Public Service Electric and Gas Company New Jersey Board of Public Utilities
PSEG Services Corporation 80 Park Plaza, T5 P.O. Box 570 Newark, NJ 07102
Matthew M. Weissman, Esq. General State Regulatory Counsel [email protected]
Joseph F. Accardo, Jr., Esq. VP Regulatory & Deputy General Counsel [email protected]
Danielle Lopez, Esq. Associate General Regulatory Counsel [email protected]
Michele Falcao Regulatory Filings Supervisor [email protected]
Caitlyn White Regulatory Case Coordinator [email protected]
Kenneth Maloney, Esq. Cullen and Dykman LLP on behalf of Public Service Electric and Gas Company One Riverfront Plaza Newark, New Jersey 07102 [email protected]
Board of Public Utilities 44 South Clinton Avenue, 9th Floor Post Office Box 350 Trenton, NJ 08625-0350
Aida Camacho-Welch Secretary of the Board [email protected]
Paul Flanagan, Esq. Executive Director [email protected]
Bob Brabston, Esq. Deputy Executive Director [email protected]
Ben Witherell, Chief Economist [email protected]
Division of Clean Energy
Sara Bluhm Gibson, Director [email protected]
Kelly Mooij, Deputy Director [email protected]
Sherri Jones, Assistant Director [email protected]
Benjamin S. Hunter, Manager Bureau of Clean and Renewable Energy [email protected]
Mahogany A. Hall, Program Specialist 2 [email protected]
Benjamin Goldstein, Program Specialist [email protected]

14 DOCKET NOS. GO18101112 and EO18101113
New Jersey Board of Public Utilities, cont’d New Jersey Division of Rate Counsel
Division of Energy
Stacy Peterson, Director [email protected]
Paul Lupo, Bureau Chief, Rates & Tariffs [email protected]
Bart Kilar [email protected]
Counsel’s Office
Post Office Box 003 Trenton, NJ 08625-0003
Stefanie A. Brand, Esq., Director [email protected]
Brian O. Lipman, Esq., Litigation Manager [email protected]
Felicia Thomas-Friel, Esq. Managing Attorney – Gas [email protected]
Carol Artale, Esq. Deputy Chief Counsel [email protected]
Kurt Lewandowski, Esq. Assistant Deputy Rate Counsel [email protected]
Rachel Boylan, Esq. [email protected]
Stacy Ho Richardson, Esq. [email protected]
Charles Gurkas, Paralegal [email protected]
New Jersey Division of Law
Sarah H. Steindel, Esq. Assistant Deputy Rate Counsel [email protected]
Maura Caroselli, Esq. Assistant Deputy Rate Counsel [email protected]
Shelly Massey [email protected]
Department of Law and Public Safety Division of Law Post Office Box 45029 Newark, NJ 07101-45029
Darren Eppley, Section Chief, DAG [email protected]
Pamela Owen, ASC, DAG [email protected]
Michael Beck, DAG [email protected]
Matko Ilic, DAG [email protected]
Rate Counsel Consultants
David E. Dismukes, Ph.D. Consulting Economist Acadian Consulting Group 5800 One Perkins Place Drive, Suite 5-F Baton Rouge, LA 70808 [email protected]
Dante Mugrace, Senior Consultant c/o Karl Richard Pavlovic PCMG and Associates, LLC 22 Brookes Avenue Gaithersburg, MD 20877 [email protected]
Ezra Hausman, Ph.D., President Ezra Hausman Consulting 77 Kaposia St. Auburndale, MA 02466 [email protected]

15 DOCKET NOS. GO18101112 and EO18101113
Atlantic City Electric Company Eastern Environmental Law Center
Philip J. Passanante, Esq. Assistant General Counsel Mailstop 92DC42 500 N. Wakefield Drive Newark, DE19702 [email protected]
Jersey Central Power and Light Company
Lauren M. Lepkoski, Esq. FirstEnergy Service Company Legal Department 2800 Pottsville Pike Reading, PA 19712-6001 [email protected]
New Jersey Natural Gas Company
Daniel Greenhouse, Esq. William D. Bittinger, Esq. Eastern Environmental Law Center 50 Park Place, Suite 1025 Newark, NJ 07102 [email protected] [email protected]
Enel X North America, Inc.
Katie Guerry, Vice President Brian Kauffman, Manager Regulatory Affairs – North America One Marina Park Drive Boston, MA 02210 [email protected] [email protected]
Andrew K. Dembia, Esq. Regulatory Affairs Counsel 1415 Wyckoff Road P.O. Box 1464 Wall, NJ 07719 [email protected]
Rockland Electric Company
Margaret Comes, Esq. Associate Counsel 4 Irving Place, Suite 1815-S New York, NY 10003 [email protected]
Jack Carley, Esq. Assistant General Counsel Consolidated Edison Company of New York, Inc. [email protected]
James C. Meyer Riker Danzig Scherer Hyland and Perretti LLP Headquarters Plaza One Speedwell Avenue Morristown, NJ 07962-1981 [email protected]
William Harla, Esq. Alice M. Bergen, Esq. Ryan J. Scerbo, Esq. Decotiis, Fitzpatrick, Cole & Giblin, LLP Glenpointe Centre West 500 Frank W. Burr Boulevard Teaneck, NJ 07666 [email protected] [email protected] [email protected]
Google, LLC
Murray E. Bevan, Esq. William K. Mosca, Jr., Esq. Bevan, Mosca & Giuditta P.C. 222 Mount Airy Road, Suite 200 Basking Ridge, NJ 07920 [email protected] [email protected]
Keystone Energy Efficiency Alliance n/k/a Energy Efficiency Alliance of New Jersey
14 S. 3rd Street Philadelphia, PA 19106
Matt Elliott, Executive Director [email protected]
Erin Cosgrove, Esq. [email protected]

16 DOCKET NOS. GO18101112 and EO18101113
Lime Energy Company New Jersey Large Energy Users Coalition
Lloyd Kass Senior Vice President, Utility Strategy 4 Gateway Center, 4th Floor 100 Mulberry Street Newark, NJ 07102 [email protected]
Nathan Howe, Esq. McCarter and English, LLP 100 Mulberry Street Four Gateway Center Newark, NJ 07102 [email protected]
Steven S. Goldenberg, Esq. Giordano, Halleran & Ciesla, P.C. 125 Half Mile Road, Suite 300 Red Bank, NJ 07701-6777 [email protected]
Paul F. Forshay, Esq. Eversheds Sutherland (US) LLP 700 Sixth Street, N.W., Suite 700 Washington, D.C. 20001-3980 [email protected]
Sunrun Inc.
MaGrann Associates
Ben Adams 701 East Gate Drive, Suite 100 Mount Laurel, NJ 08054 [email protected]
Market Participants
Christopher Torkelson, Esq. Eckert Seamans Cherin and Mellott, LLC P.O. Box 5404 Princeton, NJ 08543 [email protected]
Karen O. Moury, Esq. Kristine Marsilio, Esq. Eckert Seamans Cherin and Mellott, LLC 213 Market Street, 8th Floor Harrisburg, PA 17101 [email protected] [email protected]
Lauri A. Mazzuchetti, Esq. Glenn T. Graham, Esq. Kelley Drye & Warren LLP One Jefferson Road, 2nd Floor Parsippany, NJ 07054 [email protected] [email protected]
Beren Argetsinger, Esq. Keyes and Fox LLP P.O. Box 166 Burdett, NY 14818 [email protected]
Uplight
Kerry Cahill, Esq. Florio Perrucci Steinhardt and Cappelli, LLC 235 Broubalow Way Phillipsburg, NJ 08865 [email protected]
Signify
Ben Brinkert, Esq. 3 Burlington Woods Drive Burlington, MA 01803 [email protected]
Barbara Koonz, Esq. Wilentz, Goldman and Spitzer, P.A. 90 Woodbridge Center Drive, Suite 900 Woodbridge, NJ 07095 [email protected]

ATTACHMENT 1
1
Contents 1.1. Residential Sector Subprograms 2
1.1.1. Residential Efficient Products 2 1.1.2. Residential Existing Homes 6 1.1.3. Residential Behavioral 8 1.1.4. Residential Income Eligible 10
1.2. Multifamily Sector Subprogram 11 1.2.1. Residential Multi-Family 11
1.3. Commercial & Industrial Sector Subprograms 13 1.3.1. C&I Prescriptive 14 1.3.2. C&I Custom 16 1.3.3. C&I Small Non-Residential Efficiency 18 1.3.4. C&I Energy Management 20 1.3.5. C&I Engineered Solutions 24
APPENDIX A – MEASURE-LEVEL DETAILS 27
APPENDIX B: ENROLLMENT 39
Note: Note that subprogram and incentive designs may be adjusted as required to coordinate with other
NJ utilities.

ATTACHMENT 1
2
1.1. Residential Sector Subprograms The proposed residential subprograms will work together to significantly upgrade efficiency in homes
throughout PSE&G’s service territory. All sub-segments are addressed, from new construction and
refurbishments, to existing homes, to an online marketplace for installation service, with additional
dedicated support for multi-family and lower income customers. Where needed, additional customer
support is provided through on-bill repayments and other incentives. To further improve the culture of
energy efficiency use in its territory, PSE&G will sponsor subprograms through education and behavioral
subprograms.
1.1.1. Residential Efficient Products The Residential Efficient Products Subprogram will promote the installation of ENERGY STAR and other
high-efficiency electric and natural gas equipment by residential customers by offering a broad range of
energy efficient equipment and appliances through a variety of channels, including an online marketplace,
in-store rebates, reduced point of sale costs, and a network of trade allies. The subprogram will provide
incentives for energy efficient lighting, appliances, smart thermostats, electronics, and heating and cooling
equipment. Installation services may also be offered for some equipment. Measures range in type and price,
but include both electric and natural gas technologies that improve energy efficiency in the home. Up-front
rebates will be offered on all technologies to reduce initial costs, and some purchases will qualify for on-
bill repayments to further reduce first cost barriers. The subprogram is designed to provide easy and cost-
effective access to energy efficient measures through customers' preferred channels.
The subprogram is designed to:
Provide incentives to customers for the installation of products to reduce energy use in the home
and information about other subprograms that encourage the installation of high efficiency
equipment, such as lighting, room air conditioners, HVAC units, electronics and appliances.
Provide midstream incentives to retailers to increase sales of ENERGY STAR products.
Provide a marketing mechanism for retailer and high efficiency product suppliers to promote
energy efficient equipment and products to end users.
Ensure the participation process is clear, easy to understand and simple for the customer and
contractor.
Provide online and other channels for customers to acquire select ENERGY STAR and other
qualified products.
Utilize energy efficiency kits to introduce and promote energy efficiency technologies that can be
easily installed in the home. The kits will serve as a gateway to other programs by including
energy efficiency and conservation educational materials and promotional materials for other
program opportunities, including the utility, Comfort Partners and NJCEP programs.
Provide energy efficiency kits to local foodbank and non-profit organizations and at energy
assistance outreach events to reach low- to moderate-income customers, with schools to promote
energy efficiency education in classrooms, to new movers, customers upon request, and within
utility marketplaces to support customer engagement.
This subprogram will significantly increase adoption of energy efficient equipment by harnessing PSE&G’s
unique customer relationship to positively impact the entire sales process surrounding efficient equipment,
from education and awareness of customers, engagement with trade ally contractors and equipment
distributors, to on-bill repayments and final installation and commissioning of the high efficiency
equipment.
Market Segment/Efficiency Targeted

ATTACHMENT 1
3
The Residential Efficient Products Subprogram will be available to all residential electric and/or natural
gas customers in the PSE&G service territory. The subprogram is focused on promoting the sale and
installation of efficient electric and natural gas equipment across all major residential end-use categories,
and can be easily promoted to trade allies and customers via straightforward prescriptive rebates.
Technologies incentivized through this subprogram include lighting, HVAC, other heating/cooling
equipment, smart thermostats, and other efficient products. The subprogram will also promote the
retirement, recycling, and replacement of old refrigerators, freezers, and other inefficient appliances.
PSE&G will offer enhanced incentives for Low-to-Moderate income (LMI) customers (up to 400% of
federal poverty level) for certain products to enable the program to reach all customer types. Eligibility
for these enhanced incentives can be determined based on screening an individual customer however
PSE&G will also implement automatic eligibility for enhanced incentives based upon a physical location
(e.g. properties located in low and moderate census tracts, environmental justice community, Urban
Enterprise Zone) to increase PSE&G’s presence in LMI communities. Customer eligibility based on the
property location in a low-income and moderate-income U.S. census tract can be determined by inputting
individual addresses and accessing U.S. census tract maps available at the Federal Financial Institutions
Examination Council website at https://geomap.ffiec.gov/FFIECGeocMap/GeocodeMap1.aspx.
Delivery Method PSE&G will use its brand, its customer outreach infrastructure, and its marketplace relationships to increase
the availability, awareness, and customer uptake of energy efficient products. On-bill repayments will be
available to customers to cover the remaining cost (after applying the rebate discount) for the balance of
the efficient product cost for select products and services.
A third-party implementation contractor(s) will be selected to assist with the administration, oversight, and
delivery of the subprogram. This contractor will assist in the expansion of the PSE&G branded online
marketplace, will work to promote the subprogram through word-of-mouth, advertising, and awareness,
and will work with PSE&G to review and adjust the product and service list. These activities will occur
prior to commercial operation and during the delivery of the subprogram. The third-party implementation
contractor will also assist in securing partnerships with retailers, wholesalers, and trade allies to assure all
PSE&G customers are able to easily purchase energy efficient products and equipment through the
subprogram. Customer engagement and sales channels may include:
Point of Sale Rebates: Prescriptive rebate applications will be made available at the point of sale.
PSE&G will explore the viability of using a digital, smartphone-based application platform, to
enable customers to purchase efficient equipment at traditional consumer retail outlets and instantly
redeem rebates at point-of-sale in both physical stores and online. Allowing easy access to rebates
encourages customers to purchase qualifying efficient products. Appliance recycling will also be
available to customers whereby they may schedule a pick-up to have eligible inefficient appliances
(e.g. old refrigerators) removed and a rebate issued.
Post Purchase Rebates: Rebates will also be made available to customers after they have made
their purchase. Applications will be available online to submit either electronically or in hard copy
with proof-of-purchase.
Online Marketplace: PSE&G will expand the self-branded online marketplace currently being
deployed for the EE2017 Smart Thermostat Program to incorporate other products and services in
this direct-to-customer platform. This online marketplace is a branded, easy to use source for the
online purchase of efficient products and services. Participants will be able to browse energy
efficient equipment and appliances and purchase through the marketplace which will offer instant

ATTACHMENT 1
4
rebates and the option for on-bill repayments on purchases above a certain threshold. PSE&G will
validate customer eligibility prior to applying rebates.
Midstream Rebates: PSE&G will promote a midstream rebate component to encourage purchase
of efficient equipment via directly marking down the price of the efficient equipment at the point
of sale. PSE&G will work with retail partners (such as Home Depot, Lowes, etc.) to assure that
marked down measures are available throughout the PSE&G service territory. Midstream rebates
encourage market transformation and wider availability of efficient equipment. Efficient products
that are rebated via a midstream approach will not be eligible for retail channel rebates.
Trade Allies: PSE&G will establish a network of trade allies to promote and deliver the
subprogram with a consistent experience to the customer. The trade ally network will consist of
qualified installation contractors, plumbers, electricians, and other trade service professionals.
Trade allies will be able to leverage the subprogram and offer customers rebates through their
normal course of business. In addition, PSE&G will refer customers to a list of qualified trade
allies. By allowing participants to select a trade ally they are comfortable with (either through an
existing relationship or by reference from PSE&G), the subprogram reduces barriers to entry
related to knowledge of energy efficiency, confidence in assessments, and measure installation.
PSE&G will qualify entities to participate in the trade ally network and oversee trade ally
performance to verify quality standards are met.
By developing relationships with trade allies, the subprogram will develop a broad reach across the
marketplace, and also solicit feedback from the marketplace to ensure incentives and measures are
impacting the market as designed. Targeted trade ally firms may include:
HVAC & appliance distributors, contractors, and retail providers
General contractors, plumbers, electricians, and other trade service professionals
Regardless of the delivery mechanism, PSE&G will take steps to ensure customers are made aware of
PSE&G's engagement in helping to off-set up-front costs of the efficient products.
Proposed Incentives PSE&G proposes to provide a range of incentives depending on the measure type, subject to changes based
upon customer response and marketplace changes over the plan period. Incentives will vary depending on
the specific product, the incremental cost of the high-efficiency technology, and the product maturity in the
marketplace. Incentive levels will be reviewed periodically with the input of subprogram staff and broader
feedback from the marketplace to ensure incentive design is optimally driving energy savings across offered
measures, while minimizing any potential free ridership.
Incentives will be available in several ways and are adapted to the retail partner needs and market response.
The strategies that might be used include:
Mail-in applications available from the retailer/contractor and the subprogram website
Online rebate forms
In-store “Instant Reward” coupons that are redeemed in-store at the time of purchase.
Special sale events in retail stores
Manufacturer buy down to Retailer
Midstream incentives to retailers to encourage them to carry and stock efficient products
Incentives may change based on market prices, as well as manufacturer and distributor co-funding. Other
incentive alternatives may be used as the market evolves and new and innovative customer and trade ally
engagement opportunities become apparent.

ATTACHMENT 1
5
Marketing Approach PSE&G will implement a multi-pronged direct and indirect marketing campaign to promote this
subprogram. Customers will be exposed to broad-based energy efficiency awareness campaigns, web-based
engagement and information, digital advertising, and hard-copy materials to promote awareness, as well as
tie-ins with other PSE&G subprograms. Retailers, wholesalers, and trade allies will be contacted directly
and through trade associations to develop networks and promote involvement in the subprogram. PSE&G
will also look to leverage the behavior subprogram for ‘warm leads’ into the subprogram through both the
home energy reports and online audit tool. Finally, appliance recycling will provide customers with rebates
that can be redeemed in the online marketplace, further driving customer incentive and participation in the
subprogram.
Targeting and promotion within the subprogram will be enabled through intelligence gained through other
residential subprograms, primarily Behavioral, Existing Homes, and other activity in the Efficient Products
Subprogram. Integrated IT solutions will enable PSE&G to provide customized information to customers
with prioritized action items, to maximize availability and uptake.
A combination of strategies will be used to train and support retailers, including media advertising, outreach
community forums, events, and direct outreach to customers and retailers. Marketing activities include:
Point of purchase displays and materials, joint advertising with retailers, coupons, and special
“instant sales events”
Public relations materials
Brochures that describe the benefits and features of the subprogram including application forms
and processes. The brochures will be available for various public awareness events (presentations,
seminars etc.)
Bill inserts, bill messages, email messages, Facebook and Twitter, pop-up stores.
Company website content providing subprogram information resources, contact information,
online application forms, online retail store and links to other relevant service and information
resources
Customer representatives trained to promote the subprogram to their customers
Presence at conferences and public events used to increase general awareness of the subprogram
and distribute subprogram promotional materials
Contractor Role PSE&G will oversee the build-out of the online marketplace as well as the retail and Trade Ally network,
which will be administered by third-party implementation contractors. A third-party implementation
contractor will be responsible for identifying and engaging retail and wholesale entities dealing in energy
efficient equipment to on-board them with the PSE&G subprogram vision, eligible efficient products,
rebates, and ways to participate. Additionally, the third-party implementation contractor will engage trade
allies, including local construction, electrical, plumbing, and other contractors to educate them on
subprogram benefits and build an approved trade ally network which will reliably install energy efficient
equipment for participating customers. The third-party implementation contractor will also monitor
participation to assess the effectiveness of outreach efforts, incentive levels, delivery methods, and trade
ally availability to provide suggestions to assure that the subprogram is continually providing PSE&G
customers with their needs. A third-party implementation contractor will be responsible for the management
of the online marketplace. This third-party implementation contractor will also process the online instant
rebates, verify eligibility of customers and manage the delivery of items purchased on the website.

ATTACHMENT 1
6
To select qualified third-party implementation contractors, PSE&G will prioritize criteria including but not
limited to:
Experience delivering similar subprograms or initiatives
Resources and marketing strength
Cost effectiveness
1.1.2. Residential Existing Homes The Residential Existing Homes Subprogram provides a holistic approach for customers to explore and
invest in the efficiency and comfort of their homes. Under the Residential Existing Homes Subprogram,
participants undergo an energy audit and receive free installation of low-cost direct install energy efficiency
measures, as well as an energy efficiency action-plan that includes recommendations for potential upgrades
and available incentives. The audit will be incentivized, while the work to complete recommended energy
efficiency measures will receive rebates with the ability for customers to use on-bill repayments for the
balance of the costs. Home energy audits will be conducted by PSE&G and/or local trade allies (including,
e.g. home improvement contractors) that are qualified to perform comprehensive home assessments, and a
follow-up audit may be conducted after completing home energy improvements to verify proper installation
and function of home efficiency improvements.
This subprogram is designed to review the entire status of a home, including equipment and envelope to
achieve deeper energy savings than the Residential Efficient Products Subprogram. The subprogram will
follow guidelines and qualifying criteria associated with the U.S. Environmental Protection Agency Home
Performance with ENERGY STAR (HPwES) program subject to as-needed enhancements to maximize
participation and cost-effective energy savings opportunities.
Market Segment/Efficiency Targeted The Residential Existing Homes Subprogram will be available to all single-family and single-family
attached electric and/or natural gas customers in the PSE&G service territory. Potential measures
incentivized through this subprogram include but are not limited to insulation, air sealing, lighting, smart
thermostats, low-flow devices, smart strips, and HVAC. This subprogram will drive deeper levels of
activity and investment in homes than the Residential Efficient Products Subprogram by including a suite
of home performance measures and the advice of PSE&G and/or qualified trade ally professionals that can
identify efficiency opportunities in residential homes.
In addition to the comprehensive approach described above, a Quick Home Energy Check-Up (QHEC)
option may be offered, to help customers understand their best opportunities to save energy through an in-
home consultation and also secure energy savings during that visit through the direct installation of energy
saving measures. It will be designed to help renters as well as homeowners and promotes additional energy
savings opportunities and upgrades available to the customer.
Delivery Method The subprogram will be managed by a third-party implementation contractor as outlined in detail in the
Contractor Role:
In-Home Energy Audit: In-home energy audits are conducted by PSE&G and/or local trade allies.
During the audit, customers will receive free installation of low-cost measures, such as LED
lighting, low-flow devices, and smart strips at no additional cost, in addition to behavioral
suggestions to improve efficiency of the home and a review of thermostat set points. Smart

ATTACHMENT 1
7
thermostats may be made available while the auditors are on premises through the Residential
Efficient Products Subprogram. Following the in-home audit, the participant will be provided an
energy efficiency action-plan that summarizes the findings of the audit and recommends
technology and building performance improvements that will maximize the efficiency of the home.
This report will also include detail regarding estimated cost, available rebates, and availability of
on-bill repayment.
In-Home Efficiency Improvements: If the customer chooses to pursue some or all of the
recommended home efficiency measures, a second appointment will be scheduled to implement
the measures. At the completion of the work, PSE&G and/or the trade ally will test the home to
validate the energy savings and to ensure that all mechanical equipment is operating safely.
Subprogram management staff, including the third-party implementation contractor, may spot
check installations as needed.
Local Trade Ally Network: The local trade ally network will be qualified, trained, and managed
by the third-party implementation contractor, and may deliver audits and/or energy efficiency
services.
Measures from the Residential Efficient Products Subprogram, such as home appliances (e.g. clothes
washers) may be installed by PSE&G and/or the trade ally if requested by the participant and if within the
scope of services. These measures are not typically addressed in a home performance subprogram because
they are generally only replaced at end-of-life.
Proposed Incentives PSE&G will provide a subsidized in-home audit, as well as a suite of low-cost direct-install measures.
Home performance measures recommended by PSE&G and/or the trade ally carry incentives that will be
available individually but may also be offered as part of bundled performance incentives depending on
customer interest and budget. If utilized, home performance incentives will be structured on the basis of
estimated total energy reduction in the home and the total cost of installed measures, such that customers
can receive an overall, packaged incentive that is subject to a maximum of either a specific cap, to be
evaluated and modified periodically, or a percentage of total installation cost. On-bill repayment will also
be available to qualified customers to reduce upfront cost barriers. In order to use on-bill repayments,
participants will be evaluated to determine their risk and ability to repay. In coordination with the Joint
Utilities, PSE&G will establish qualification minimums for on-bill repayments, which may include bill
payment history.
Marketing Approach
PSE&G will utilize many marketing avenues to assure subprogram awareness and participation is
maximized. These include traditional marketing avenues, such as web-based engagement and information,
digital advertising, media advertising, and hard-copy materials to promote awareness among trade allies
and customers. An additional marketing pathway PSE&G plans to utilize is through the network of other
subprograms being offered in the CEF-EE Program. The integration of all subprograms will allow for direct
marketing to customers through the Residential Behavioral and Residential Efficient Products
Subprograms. The connections with these subprograms also provides two-way marketing potential, in that
customers engaged in the Residential Behavioral and Residential Efficient Products Subprograms will be
provided with information and literature about the opportunity to participate in the Residential Existing
Homes Subprogram. Information garnered from subprograms, such as the Residential Behavioral and
Residential Efficient Products could be used to identify prime candidates for participation in the Residential
Existing Homes Subprogram. For example, a review of usage data contained in HERs from the Residential
Behavioral Subprogram could allow PSE&G to identify customers who are particularly susceptible to
changes in weather, and would be ideal candidates for an audit. Likewise, the Residential Efficient Products
Subprogram could provide leads to customers interested in energy efficiency.

ATTACHMENT 1
8
Contractor Role PSE&G will supervise the subprogram, as well as select a third-party implementation contractor to manage
the subprogram.
The third-party implementation contractor will oversee all aspects of the subprogram, including training
and engagement, QA/QC, and rebate processing (including measures installed during audits). A large part
of the third-party implementation contractor will focus on developing, training, and growing a qualified
trade ally network. This will include trade ally training sessions, workshops, and market development
events to grow and develop the trade ally network, with a priority placed on encouraging them to integrate
home efficiency performance into their business and become Building Performance Institute (BPI) and
ENERGY STAR certified contractors. The third-party implementation contractor will maintain a close
relationship with entities delivering the audits and efficiency measures to ensure consistent subprogram
delivery experience and high customer satisfaction. The third-party implementation contractor will also
take on the responsibility of providing an additional layer of customer support as needed and conducting
selective verification of trade ally installation work.
The trade ally marketplace may consist of companies in the fields of residential HVAC, home improvement,
weatherization and insulation, and other relevant areas. In order to facilitate trade ally access to participants,
PSE&G or the third-party implementation contractor will administer a web portal where customers can find
local trade allies based on geography and other criteria.
To select a qualified third-party implementation contractor PSE&G will prioritize criteria including but not
limited to:
Experience delivering similar subprograms or initiatives, especially ENERGY STAR certified
programs
Knowledge of the current marketplace
Ability to educate and train contractors
Local presence
Cost
1.1.3. Residential Behavioral The Residential Behavior Subprogram will provide customers with granular and easy-to-understand
information about their energy use, a comparison of their usage against other similar customers, and
suggested action steps to generate awareness and motivate customers to produce energy savings through
behavioral changes and engagement with other efficiency subprograms.
Direct mailed and/or electronic home energy reports (HERs) will be the cornerstone of the subprogram and
will provide participants with customized, easy-to-implement action steps and recommendations to reduce
energy consumption and support behavior modification for improved energy efficiency. The HERs will
present participants with a view of their historical energy consumption compared to peer group customers.
High usage alerts will also be issued by email to customers when weather patterns and other data indicate
their next bill is trending higher, and provide the customer with tips to manage their usage.
The subprogram will also offer an internet-based home energy self-audit to all residential customers. This
audit will allow customers to better understand their energy usage and their opportunities for energy
savings.

ATTACHMENT 1
9
An online portal will be used to provide customers with usage information, recommendations, tips, and
links to energy efficiency subprograms provided by PSE&G, including the online marketplace with access
to the Residential Efficient Products Subprogram and the Residential Existing Homes Subprogram. The
online customer portal will integrate the information from the HERs and online audit to further assist
customers as they look to realize deeper equipment and appliance-based savings. PSE&G will utilize the
information gathered from the HERs and online audits to not only better understand the residential customer
base, but also assist in making smart decisions moving forward with the energy efficiency subprograms.
Information on customers participating in other subprograms such as the Residential Efficient Products and
Residential Existing Homes Programs will be linked into the HERs as to provide up-to-date information
and recommendations to participants.
Market Segment/Efficiency Targeted The subprogram will provide HERs to a minimum of 650,000 residential customers. This quantity of
customers represents the number of unique customers in the program. These customers will receive multiple
home energy reports per year, in accordance with best practices in the industry This quantity of customers
will be reviewed periodically and modified as needed to maximize cost-effective energy savings. The online
energy audit will be available to all PSE&G electric and/or natural gas residential customers. The HERs
and online audit will offer tailored recommendations to reduce electric and/or natural gas consumption.
The subprogram may also provide HERs to participants of other residential subprograms, such as
Residential Efficient Products and Residential Existing Homes. The subprogram will primarily target single
family homes; however, PSE&G may also evaluate potential in the multi-family and income eligible
markets.
Delivery Method PSE&G will extend its current Data Analytics Subprogram to additional customers using a selected HER
vendor.
PSE&G's HER vendor will identify and distribute HERs to residential customers at no charge to the
participant. The online audit will be available for all PSE&G residential customers free of charge. High
usage alerts will be provided to customers receiving HERs via email to customers for whom PSE&G has a
valid email address.
Proposed Incentives All services under this subprogram will be provided at no cost to the customer.
Marketing Approach The recipients of the HERs will be selected by PSE&G, its selected HER vendor, and its evaluation
contractor. The online audit will be marketed through bill-insert mailers, digital advertising, and other
means to assure that all customers are aware of the availability of these resources. Participants in other
PSE&G energy efficiency subprograms will be referred to the online audit tool and online portal as
appropriate.
Contractor Role PSE&G will utilize a third-party implementation contractor to provide the services under this subprogram
including HERs, the portal, the online audit, and high usage alerts.

ATTACHMENT 1
10
1.1.4. Residential Income Eligible The Residential Income Eligible Subprogram is targeted at customers whose household income is less than
or equal to 400 percent of the Federal Poverty Level (FPL). Properties located within low and moderate
income census tracts will also be eligible for this program. The subprogram will complement, and not
duplicate or compete with, the Co-Managed Comfort Partners Program. The Residential Income Eligible
Subprogram provides free direct installation of energy efficient technologies and weatherization services
to qualifying PSE&G customers with limited income. The subprogram generates energy savings for
residential lower-income customers through an in-home energy audit and the direct installation of a wide
range of energy efficiency measures such as efficient lighting, efficient refrigerators, HVAC, as well as
weatherization upgrades for air-sealing and attic and wall insulation. The subprogram also provides for the
installation of health and safety measures as appropriate, and may also include actions to address building
shell issues that prevent the installation of energy efficiency measures, such as moisture/mold remediation,
roof repairs, electrical repairs, and asbestos remediation, consistent with the approach under the New Jersey
Comfort Partners Procedure Manual.
In addition to the core subprogram attributes described above, the subprogram will also provide for the
distribution of free LED light bulbs via food banks/pantries or other distribution venues that serve income
eligible customers, along with educational information on energy efficiency. The subprogram will
coordinate low-income services with local, state and federal agencies to provide comprehensive assistance.
The subprogram may also seek to work with workforce development organizations, in order to provide a
sufficient pool of qualified workforce that will be required to support a significant growth in energy
efficiency services.
Market Segment/Efficiency Targeted The Residential Income Eligible Subprogram targets residential customers in PSE&G’s electric and/or gas
service territory whose household income is less than or equal to 400 percent of the Federal Poverty Level
(FPL) and those properties located within low and moderate income U.S. census tracts. Customers who
receive Federal Supplemental Security Income (“SSI”), Home Energy Assistance (“HEAP”), Universal
Service Fund (“USF”), Lifeline, Pharmaceutical Assistance to the Aged and Disabled (“PAAD”),
Temporary Assistance to Needy Families (“TANF”), or Section 8 Housing will also be eligible.
Delivery Method This subprogram will be managed by PSE&G with the support of a qualified third-party implementation
contractor with experience delivering services in similar subprograms. It is envisioned that PSE&G’s third-
party implementation contractor will facilitate subprogram delivery across the multiple subprogram
vendors as well as PSE&G’s workforce. Eligible customers will receive an in-home energy assessment
from PSE&G. The applicable measures and services will be installed either by subprogram vendors, or by
PSE&G’s workforce. PSE&G, with its third-party implementation contractor will be responsible for
activities including, but not limited to, the following:
Ensuring customers meet eligibility requirements
Marketing collateral development and deployment
Reviewing, approving, and tracking of documentation for completed projects
Payment processing, fund management, and reporting
Quality assurance of technical and procedural subprogram guidelines
Budgeting, goal tracking, and reporting
Call center services
Customer satisfaction and problem resolution
Provide technical training to workforce

ATTACHMENT 1
11
Proposed Incentives Equipment and installation costs for all eligible measures will be provided free to eligible customers, subject
to subprogram terms and conditions.
Among the measures to be considered for each home are efficient lighting products; hot water conservation
measures (water heater replacement and tank temperature turn-down); replacement of inefficient
refrigerators and freezers; installation of programmable and smart thermostats; insulation upgrades (attic,
wall, basement, etc.); blower-door guided air sealing; duct sealing and repair; heating/cooling equipment
maintenance, repair and/or replacement; and other measures as may be needed to enable the installation of
energy efficiency measures (e.g. repair or replacement of a broken window, repair of a hole in the wall
and/or roof, mold remediation, or the installation of rain gutters).
Failed or failing heating or cooling systems can be replaced for efficiency and/or health and safety reasons,
on a case-by-case basis, as subprogram funds permit. For customer homes that require treatment beyond
the scope of the subprogram, such services may be coordinated with other agencies.
Marketing Approach Marketing efforts will be focused toward property owners, non-profit organizations, churches, and
community organizations to bring awareness to the subprogram and initiate effective participation. Key
elements of the marketing strategy include:
Targeted outreach through local agencies
Websites and newsletters
Press releases
Posters in municipal buildings
Neighborhood canvassing
Contractor Role PSE&G will administer and manage the overall subprogram with the support of a third-party
implementation contractor(s). The third-party implementation contractor will have responsibility for
delivery tasks and customer outreach on behalf of PSE&G. To select a qualified third-party implementation
contractor, PSE&G will prioritize criteria including, but not limited to:
Experience delivering similar subprograms or initiatives
Third-party staff qualification for delivering low-income energy efficiency subprograms
Cost
1.2. Multifamily Sector Subprogram
1.2.1. Residential Multi-Family The Residential Multi-Family Subprogram provides a turnkey service for multi-family property owners,
managers, and the residents of multi-family facilities to help improve the energy efficiency of their facilities
and reduce their operating costs. This service provides direct installation of energy-efficient measures in
individual living units. The primary measures to be installed include LED lighting, low-flow showerheads
and faucet aerators, and smart power strips. The subprogram will also provide literature on energy saving
tips achieved through other behavioral actions (e.g. thermostat settings, maximizing dishwasher and clothes
washer loads, etc.).

ATTACHMENT 1
12
Market Segment/Efficiency Targeted The subprogram targets multi-family property owners, property managers, and residents. All multi-family
buildings with three or more units in PSE&G’s electric or natural gas service territory are eligible to
participate, although it is anticipated that the majority of participating units will be from low income or
moderate income multi-family units, and will have 12 or more units.
The subprogram will look to achieve direct, easy to install, energy savings through the provision of
measures such as LED lighting, low-flow showerheads and faucet aerators, and smart power strips.
Delivery Method The Multi-Family Subprogram will be delivered by PSE&G and/or a qualified third-party implementation
contractor with experience delivering similar subprograms. The subprogram manager will recruit multi-
family property owners and oversee the direct installation of free low-cost measures (e.g. lighting,
showerheads) in individual units. The service is provided at no cost to property owners or occupants. This
subprogram design (including the provision of no cost services) is intended to overcome market barriers
and assure that benefits are provided to tenants.
PSE&G and/or the implementation contractor will be responsible for activities including, but not limited
to, the following:
Developing relationships with property management companies, owners, associations, and their
members to recruit participants
Training, education, and coordination with direct-install staff and/or contractors
Marketing collateral development and deployment
Procuring energy efficiency equipment and materials
Reviewing, approving, and tracking of documentation for completed projects
Quality assurance of technical and procedural subprogram guidelines
Budgeting, goal tracking, and reporting
Customer satisfaction and problem resolution
Provide notice to tenants and property owners prior to conducting work
Proposed Incentives Equipment and installation costs for all measures directly installed in tenant units will be provided free to
eligible properties.
Marketing Approach The marketing strategy will focus on informing property owners, managers, associations, tenant groups,
municipalities, and community organizations about the availability and benefits of the subprogram and how
to participate. Marketing activities will be focused on serving the lower income multi-family sector. Key
elements of the marketing strategy include:
Targeted outreach through direct mailings and presentations to inform property owners, managers,
apartment associations, tenant groups, municipalities and community organizations about the
benefits of the subprogram and participation processes
Brochures highlighting the benefits and features of the subprogram as well as the participation
processes
Website content providing subprogram information resources and contact information
In-person visits by subprogram representatives to properties with three or more units

ATTACHMENT 1
13
Walk-through energy assessments of properties to encourage the building owners or facility
managers to allow participation in the direct installation component of the subprogram as well as
encourage participation in the other PSE&G efficiency subprograms
Contractor Role PSE&G will administer and manage the overall subprogram. Depending on the final design of the delivery
process, PSE&G may utilize the support of a third-party implementation contractor(s). In this event, the
third-party implementation contractor will have responsibility for delivery tasks and customer outreach on
behalf of PSE&G.
Key elements of the implementation strategy and core responsibilities of the implementation contractor
may include:
Targeted Outreach to Property Owners: Subprogram representatives will build relationships
with property management companies, owners, associations and their members to recruit
participation in the subprogram. The subprogram team will assist customers as necessary to
coordinate direct installations and complete rebate application requirements. In addition, property
owners will be reached through direct mail, participation in association events, one-on-one
meetings with subprogram staff, and other channels. Special emphasis will be placed on properties
with as little as three units and greater. This has been traditionally an over-looked segment in other
utility-run subprograms around the country.
In-Unit Direct Installs: Subprogram representatives will identify interested property owners and
schedule appointments for the free installation of energy saving devices in the individual living
units and common areas. In-unit HVAC tune-ups will be offered at no cost to the property owner
or tenant. The installation crews are trained on the technical and educational aspects of the energy
saving devices installed and leave educational materials in each unit describing the work performed
and explaining the energy-saving benefits.
Subprogram Operations: The third-party implementation contractor handles implementation
related administrative requirements, including the following:
o Marketing and educational materials
o Field services
o Product ordering and inventory
o Data tracking and reporting
o Investment tracking and reporting
o Prescriptive, custom and comprehensive application processing
o Trade ally and customer outreach/training
o Customer satisfaction/problem resolution
To select a qualified third-party contractor, PSE&G will prioritize criteria including but not limited to:
Experience delivering similar subprograms or initiatives
Third-party staff qualifications
Cost
In the event PSE&G delivers the program with its own workforce, contractor role would be minimal, limited
to customer acquisition and alignment with other subprograms.
1.3. Commercial & Industrial Sector Subprograms

ATTACHMENT 1
14
PSE&G’s commercial and industrial customers are very diverse. These subprograms address each segment,
including those with limited time and resources to make efficiency improvements. The subprogram designs
are intended to enable PSE&G to address the unique needs of each sub-sector. For example, if a large
customer has ready access to financing and more advanced approaches to energy management, PSE&G
will offer customized financial support to reduce paybacks on investments and bring about increased
installation of measures. For small businesses or municipal customers, PSE&G will provide more
substantial management, financial support, and on-bill repayment.
1.3.1. C&I Prescriptive The C&I Prescriptive Subprogram will promote the installation of high-efficiency electric and natural gas
equipment by C&I customers. The subprogram is designed to:
Provide incentives to facility owners and operators for the installation of high efficiency equipment
and controls
Provide the knowledge necessary and market demand to justify the marketing of high efficiency
measures by participating trade allies such as electrical contractors, mechanical contractors, and
their distributors
Ensure the participation process is clear and simple
The subprogram will offer a broad range of energy efficient equipment and appliances through a variety of
channels, including reduced point of sale costs, and a network of trade allies. The subprogram will incent
energy efficient lighting, appliances, heating and cooling equipment, and food service equipment, among
other efficiency measures. These measures will range in type and price but include both electric and natural
gas technologies that improve energy efficiency. Up-front rebates will be offered on all technologies to
reduce initial costs and some purchases will qualify for on-bill repayments to further reduce first cost
barriers. The subprogram is designed to provide easy and cost-effective access to energy efficient measures
through customers' preferred channels.
This subprogram will significantly increase adoption of energy efficient equipment by harnessing PSE&G’s
unique customer relationships to positively impact the entire sales process surrounding efficient equipment,
from education and awareness with customers, engagement with trade ally contractors and equipment
distributors, to on-bill repayments and final installation and commissioning of the high efficiency
equipment.
Market Segment/Efficiency Targeted The C&I Prescriptive Subprogram will be available to all commercial, industrial, and other non-residential
electric and natural gas customers located within PSE&G’s service territory. The subprogram is focused on
promoting the sale and installation of efficient electric and natural gas equipment across all major end-use
categories and can be easily promoted to trade allies and customers via straightforward prescriptive rebates.
Potential technologies incentivized through this subprogram include energy efficient lighting, appliances,
heating and cooling equipment, and food service equipment, among other efficiency measures.
Delivery Method To maximize customer participation and streamline the customer experience, PSE&G will use its strong
customer and marketplace relationships to support multiple implementation strategies to achieve
subprogram goals.
Trade Allies: PSE&G will establish a network of trade allies (e.g. electricians, HVAC contractors,
lighting retailers and distributors, building energy managers, etc.) to promote the efficiency
opportunities and incentives to their clients, and deliver the subprogram with a consistent

ATTACHMENT 1
15
experience to the customer. Trade allies will be able to leverage the subprogram and offer customers
rebates through their normal course of business. In addition, PSE&G or the third-party
implementation contractor can refer customers to a list of qualified trade allies to perform more
intricate work. By allowing participants to select a partner they are comfortable with (either through
an existing relationship or by reference from PSE&G or the third-party implementation contractor),
the subprogram reduces barriers to entry related to knowledge of energy efficiency, confidence in
assessments, and measure installation. PSE&G will oversee trade ally performance to verify quality
standards are met and qualify contractors to participate in the Trade Ally network. By developing
relationships with trade allies, the subprogram will develop a broad reach across the marketplace,
and also solicit feedback from the marketplace to ensure incentives and measures are impacting the
market as designed. Examples of targeted trade ally firms include:
o Design, engineering, and controls firms
o HVAC distributors, contractors, and retail providers
o Food service retailers and service providers
o Commercial lighting distributors and wholesalers
Retail: PSE&G subprogram staff, third-party implementation contractors, and field representatives
will work with retailers and distributors that directly target C&I customers so they are aware of the
participation process and available equipment incentives. This will include training and instruction
to participating retailers and distributors about the PSE&G prescriptive rebate forms as well as
enrollment of distributors to participate in midstream subprogram offerings.
Midstream: PSE&G will aggressively promote a midstream component for specific equipment
types to encourage purchase of efficient equipment via directly marking down the cost of the
efficient equipment at the point of sale. Midstream rebates encourage market transformation and
wider availability of efficient equipment. PSE&G anticipates offering midstream point of sale
discounts across numerous equipment types, including, but not limited to: LED lighting, HVAC,
and food service equipment. Efficient products that are rebated via a midstream subprogram
approach will not be eligible for rebates in any other PSE&G rebate subprogram.
Digital: The subprogram will be marketed directly to C&I customers on the PSE&G website, where
customers will have easy access to information regarding eligible equipment and savings
opportunities, how to participate, and incentives across all efficient equipment types and end-uses.
In addition, the website will offer information on qualified local trade allies to enable easy access
to equipment retailers for customers.
Rebate-as-a-Service: PSE&G will evaluate the viability of using a digital, smartphone based
application platform, where business customers purchasing efficient equipment for commercial use
at traditional consumer retail outlets can instantly redeem rebates at point-of-sale in both physical
stores and online. This channel will help PSE&G offer rebates to very small commercial customers
and local businesses outside of the C&I Small Non-Residential Efficiency Subprogram.
Targeted Customer Outreach: In select cases, PSE&G staff and its third-party implementation
contractor may choose to reach out directly to large business and commercial customers to develop
relationships with energy and facilities managers, operations staff, and procurement personnel.
Subprogram staff can help facilitate completion of rebate applications and serve as a direct resource
to these customers.
Proposed Incentives Incentive levels and the list of eligible equipment will be reviewed periodically with the input of
subprogram staff and broader feedback from the marketplace to ensure incentive design is optimally driving
energy savings across offered measures. Incentive levels will vary depending on the efficient measure, and
the unit level being rebated (e.g. incentives for equipment, and/or incentive based on the system size or
square footage where the system is being applied).

ATTACHMENT 1
16
Marketing Approach The C&I Prescriptive Subprogram will engage with customers and trade allies at multiple levels, including
broad-based energy efficiency awareness campaigns, direct outreach by subprogram staff and
representatives, web-based engagement and information, digital advertising, and hard-copy materials to
promote awareness among trade allies and customers. In some cases, subprogram staff and representatives
will reach out directly to large commercial customers. Use of appropriate types of media are anticipated to
be included in the marketing plan, such as direct mail, email, print, and digital media. Engagement with
trade associations (e.g. builders, architects, equipment distributors, professional contractor associations,
etc.) will all be important venues for PSE&G to present information about the subprogram, raise awareness
and encourage participation.
Contractor Role PSE&G will administer and manage the overall subprogram, including implementation of an on-bill
repayment offering, with the support of third-party implementation contractor(s). The third-party
implementation contractor will have responsibility for the majority of delivery tasks and customer outreach
on behalf of PSE&G. It is anticipated that this third-party implementation contractor will assist with
optimizing the subprogram’s strategic direction, including but not limited to:
Customer outreach/subprogram delivery strategy
Offered efficiency measures and efficiency levels
Promotion of emerging technologies
Incentive levels and strategies
Customer/trade ally/retailer engagement and enrollment in the subprogram
Marketing
Customer satisfaction
Equipment installation and subprogram data tracking
Rebate processing
1.3.2. C&I Custom The Commercial and Industrial (C&I) Custom Subprogram will offer incentives for electric and natural gas
efficiency opportunities for commercial, industrial, and other non-residential customers that are non-
standard and not captured by the C&I Prescriptive Subprogram, or any other proposed custom subprogram
offering including the C&I Engineered Solutions Subprogram. Typical measures incentivized by the C&I
Custom Subprogram are either less common measures or efficiency opportunities in specialized
applications that may include specialized manufacturing processes or non-traditional use cases. In many
cases, custom efficiency projects are more complex than prescriptive equipment replacement.
Large customers with facilities and engineering teams will develop and submit custom efficiency project
rebate applications for review. A third-party implementation contractor will also play an active role in
supporting project identification, developing energy savings calculations, and assessing project economics
as required. Potential participants are required to submit an application for pre-approval to reserve funding,
and if accepted by PSE&G, a timeline is established for project completion to qualify for a rebate. The
typical lead time for completing a custom project is 90 to 120 days. Large projects, or subsets of projects,
may be required to undergo pre-and post-inspection to validate project energy savings. Approved projects
will also be eligible for on-bill repayment support to further reduce first-cost barriers.
Market Segment/Efficiency Targeted The C&I Custom Subprogram targets all C&I customers in PSE&G’s electric and/or natural gas service
territory with cost effective savings opportunities that are not covered by the C&I Prescriptive or Small

ATTACHMENT 1
17
Non-Residential Efficiency Programs, and in building types not eligible for participating in the C&I
Engineered Solutions Subprogram (non-MUSH/multifamily common areas/non-profit). However,
customers participating in the C&I Custom Subprogram will generally be larger energy users with more
complex needs and non-standard efficiency opportunities. Customers targeted for participation typically
include building types such as light/heavy industrial, manufacturing, data centers, and distribution centers,
among others.
Delivery Method The C&I Custom Subprogram will be supervised by PSE&G and delivered by a qualified third-party
implementation contractor. The following delivery strategies will be pursued:
Targeted Customer Outreach: High-use customers will be targeted by subprogram staff to
develop relationships with facilities and energy managers, operations staff, and procurement
personnel to inform them of the benefits of participating in the custom subprogram. Subprogram
staff will provide technical support, assist customers in identifying efficiency opportunities, and
assist with review and preparation of their rebate application.
Technical Customer Assistance: An important element of the C&I Custom Subprogram is the
availability of technical support from qualified subprogram staff. PSE&G subprogram management
staff and their representatives will be available to support customers with project identification and
analysis, including assistance with targeted energy audits and savings estimates.
Trade Allies: Developing relationships in the trade ally community will spread broader awareness
of the existence of the custom subprogram option and obtain referrals for potential projects.
Measurement & Verification (M&V) for projects above a certain estimated incentive size, or projects that
do not have reliable information to accurately forecast energy savings may require energy monitoring
before and after project implementation to determine savings and incentive levels. PSE&G is evaluating a
threshold of approximately $100k to necessitate energy monitoring before and after implementation. The
Company is also considering the impact of the type of equipment as a driver for energy monitor. PSE&G
plans to coordinate with the other utilities to use a consistent approach to the extent feasible.
Proposed Incentives The C&I Custom Subprogram incentives will be set based on an incentive level per first year kWh or therm
saved. These incentive levels will be reviewed and updated periodically with the input of subprogram staff
and broader feedback from the marketplace to ensure incentive design is optimally driving energy savings
across a full spectrum of market opportunities. Incentive level design may change over time based on the
specific end-use where the savings are being acquired. Additionally, incentive level restrictions may be
established that could include limits to total incentives as a percentage of project costs or minimum project
payback periods. Overall total facility and customer level incentive limits may also be established to ensure
funding is available to as many C&I customers as possible, while also still providing robust incentives to
capture the full suite of energy savings from large projects. Approved projects will also be eligible for on-
bill repayment support to further reduce first-cost barriers.
Marketing Approach The C&I Custom Subprogram will engage with customers and trade allies at multiple levels, including a
combination of direct customer, trade ally, and local organization outreach, promotion through key industry
events and conferences, and digital marketing, including an informational/engagement web platform to
educate and reach relevant contractors and customers. Use of all types of media are anticipated to be
included in the marketing plan, including, but not limited to, online and targeted print advertising.
Engagement with trade associations (e.g. builders, architects, equipment distributors, professional
contractor associations, etc.) will all be important venues for PSE&G to present information about the

ATTACHMENT 1
18
subprogram and raise awareness and encourage participation. The subprogram will leverage PSE&G’s
existing relationships and communication channels with customers through subprogram staff and account
management team.
Contractor Role PSE&G will administer and manage the overall subprogram, including implementation of an on-bill
repayment offering, with the support of third-party implementation contractor(s). The third-party
implementation contractor will have responsibility for the majority of delivery tasks and customer outreach
on behalf of PSE&G. It is anticipated that this third-party implementation contractor will work closely with
PSE&G to optimize the subprogram’s strategic direction, including, but not limited to, the following
activities:
Offered incentive levels and strategies
Customer satisfaction
Measurement and verification during on-site visits
Subprogram data tracking
Rebate payments
PSE&G will select a qualified third-party implementation contractor (or contractors) based on, but not
limited to, the following factors:
Technical Approach
Organizational and Management Capability
Experience
Cost
1.3.3. C&I Small Non-Residential Efficiency The C&I Small Non-Residential Efficiency Subprogram is focused on installation of efficiency measures
in small non-residential customers that typically lack the time, knowledge, or financial resources necessary
to pursue energy efficiency. The subprogram is designed to provide non-residential owners with easy
investment decisions for the direct installation of energy efficiency projects. The subprogram will pay the
up-front cost to install the recommended energy efficiency measures with the participating customer
repaying a portion of the cost either in a lump sum or interest-free on their PSE&G bill. The reduced overall
costs and on-bill repayments mitigate up-front cost barriers and assist participants in making decisions,
which otherwise would be time-consuming and difficult to justify. The C&I Small Non-Residential
Efficiency Subprogram plays an important role in the marketplace because private providers of energy
efficiency services typically do not target small non-residential customers due to the lower overall profit
for their services when compared with larger non-residential customers. For these reasons, small non-
residential customers are often hard to reach, and the subprogram fills an important gap by delivering
efficiency services to these customers directly.
The audit will be provided to customers free of charge and will offer recommendations on energy efficiency
projects to reduce energy usage and costs. The aggregation of this data will allow PSE&G to better
understand its customers and can be used to inform other subprograms and future subprogram designs, such
as the C&I Prescriptive Subprogram, the C&I New Construction Subprogram, and the Business Energy
Reports Pilot Subprogram.

ATTACHMENT 1
19
The subprogram will also focus on the smallest customers within the small business segment. PSE&G
anticipates portions of the subprogram to be directed at restaurants, small offices, and other small businesses
that often are left behind in less-comprehensive energy efficiency subprograms. Through a number of
delivery mechanisms, PSE&G will assure that all business types are able to participate in this subprogram.
Market Segment/Efficiency Targeted
PSE&G expects small non-residential customers with an average 12-month individual facility annual
electricity peak demand usage of less than 200 kW to be the eligibility threshold; however, this figure may
be adjusted by PSE&G up to 500 kW subject to Staff approval and alignment with the threshold established
by the Joint Utilities, to ensure the subprogram is properly addressing the market in PSE&G’s service
territory. The subprogram will also be structured to focus on and secure participants especially in the lower-
usage tiers.
The subprogram seeks to address high-return, relatively low-cost measures (e.g. LED lighting retrofits), but
customers may choose to pursue further retrofits that are eligible for additional incentives. Example end-
use categories covered by the subprogram include lighting, HVAC, controls, refrigeration, motors, low-
flow devices, pipe wrap and domestic hot water equipment.
Delivery Method The C&I Small Non-Residential Efficiency Subprogram interfaces with customers via either direct
solicitation or upon customer request. All participants receive a site visit, including a free on-site audit to
identify energy efficiency retrofit opportunities. Following the audit, participants are provided with a report
assessing the site and recommending investments that could further improve the energy efficiency of the
facility.
Based on the results of the audit report, the subprogram will offer to initially pay 100% of the project cost
to install the recommended energy efficiency measures with the participating customer (or landlord)
repaying a portion of the cost either in a lump sum or interest free on their PSE&G bill. PSE&G may adjust
the incentive structure to encourage deeper retrofits, as well as to encourage participation by micro-
customers. PSE&G will provide for the installation of all work and assure it is completed on time and to
specifications. This approach frees up the participant, which, as a small non-residential customer, may not
have the time or resources to focus on implementation issues.
The subprogram budget will be split into tranches based upon customer consumption size, or other
designated factors, to focus contractors to complete work on specific tranches. This will assure that non-
residential customers, even those that are the smallest and often overlooked, receive ample focus.
Contractors will be limited to specific tranches to assure minimum volumes and scale can be reached while
also providing for adequate cost effectiveness. PSE&G may also elect to provide additional contractor-
focused bonus incentives to further encourage contractor emphasis on specific sectors. The tranche
divisions will be implemented to combat contractors’ inherent focus on larger customer facilities. The
subprogram may also be marketed and structured into customer types. For example, one element of the
subprogram structure may focus on restaurants, while another is focused on convenience stores and
bodegas.
Proposed Incentives One of the key benefits of the subprogram is that it is a simple, turnkey solution for small non-residential
customers that requires no up-front customer investment. The initial site visit, energy audit, and installation
of recommended efficiency measures are provided at no initial cost to participants. This up-front incentive
value will be evaluated periodically to assure that the subprogram incentive is adequate and provides the
correct signal to the marketplace regarding energy efficiency. Participants will reimburse PSE&G a portion

ATTACHMENT 1
20
of total project cost interest-free through on-bill repayments, thereby eliminating the up-front cost burden
of installing energy efficiency measures. The incentive portion of the total project cost is up to 70%, with
the option to provide up to 80% incentive for underserved markets such as small businesses up to 100kW,
or customers in Urban Enterprise Zones, etc. PSE&G may adjust the incentive structure to encourage
deeper retrofits, as well as to encourage participation by micro-customers.
Marketing Approach The C&I Small Non-Residential Efficiency Subprogram will be marketed to customers through a
combination of direct outreach by subprogram staff and a third-party implementation contractor, web-based
engagement and customer information analytics, digital advertising, and hard-copy materials to promote
awareness among trade allies and customers. Direct outreach from a third-party implementation contractor
may include unsolicited visits to customer premises to distribute hard-copy subprogram materials, inform
customers about the subprogram directly, and solicit participation. This strategy is useful for enrolling small
non-residential customers that may be interested in participating, but have not heard of the subprogram and
do not have resources to prioritize reaching out to PSE&G.
PSE&G will evaluate the potential to utilize Business Energy Reports or customer information analytics to
identify and target customers best suited for participation in the subprogram.
Contractor Role PSE&G will administer and manage the subprogram with the support of third-party implementation
contractor(s). The third-party implementation contractor will have responsibility for the majority of delivery
tasks and customer outreach on behalf of PSE&G. It is anticipated that this third-party implementation
contractor will work closely with PSE&G to optimize the subprogram’s management and strategic
direction, including, but not limited to:
Initial participant recruitment, audit, and equipment installation
Subprogram data tracking
Direct customer outreach/subprogram delivery strategy
Development of measure mix
Marketing
Promotion of emerging technology
Customer satisfaction
The third-party implementation contractor will take on the responsibility of managing the subprogram,
directing the qualification of contractors, and will work to assure that ample contractors are available to
complete all work derived from the subprogram.
A group of selected vendors will perform the audits and installations, working with PSE&G and the third-
party implementation contractor’s oversight to undertake all construction and installation work identified
in the audit process.
1.3.4. C&I Energy Management The C&I Energy Management Subprogram includes two major subprogram initiatives: Retro-
commissioning and Strategic Energy Management. Both subprograms are designed to optimize energy
consumption in existing C&I buildings through management of major energy using systems, user behavior,
and low-cost, easy-to-install efficiency measures at the time of an initial site visit or a follow-up. In many
cases, revised building management processes can produce meaningful energy savings without capital

ATTACHMENT 1
21
investment in new equipment or controls; however, recommended investment areas may also be identified
through this subprogram. Details of the subprogram initiatives are as follows:
Retro-commissioning (RCx): Also known as ‘existing building commissioning’, retro-
commissioning focuses on identifying operations and maintenance improvements in existing
commercial buildings to ensure optimal performance of building systems and system interactions.
Retro-commissioning applies the same systematic process to buildings as is applied during initial
building commissioning, and may be performed every three to five years to ensure optimal building
performance. Retro-commissioning is typically among the most cost-effective energy savings
strategies applied in commercial buildings and may produce other non-energy benefits, including
extending the life of existing equipment and improving thermal comfort and indoor air quality.
Strategic Energy Management (SEM): This subprogram is primarily geared toward industrial
and manufacturing buildings and is a holistic approach to managing energy usage focused on
management of existing systems and processes (including behavior), as well as tracking and
benchmarking performance to identify and evaluate energy optimization efforts. SEM is a long-
term effort typically led by an external instructor focused on developing and executing an energy
management strategy via workshops, webinars, and group/individual training sessions with cohorts
of facility managers. SEM applies continuous improvement principles to energy management to
encourage and enable a culture of energy efficiency within an organization to develop measurable
long-term savings.
Market Segment/Efficiency Targeted All commercial, industrial, and other non-residential customers located within PSE&G’s electric and/or
natural gas territory are eligible to participate in this subprogram.
RCx targets the existing commercial building stock, and is particularly relevant for medium to large non-
industrial building types including office, lodging, education, healthcare, laboratory, warehouse/storage,
supermarkets, and more. The primary target market for the RCx subprogram will be C&I customers
utilizing a building management system.
SEM targets existing large and very large commercial and industrial customers and building types, and is
particularly relevant to large energy users engaged in manufacturing processes. For SEM to be successful,
the subprogram will invest significant resources upfront to focus on recruiting and pre-qualifying customers
to participate in the subprogram. SEM's objective is to change a company’s focus and engagement with
energy management over the long-term, in a continuous manner. A core goal is to recruit customers who
demonstrate genuine and committed interest in working with PSE&G over a long period of time. These
“energy champions” will ideally include multiple staff at each company, placed in different departments
and various levels of seniority and decision making in the company.
Eligible measures will vary depending on the business segment served, but are likely to include at least the
following:
Optimizing chiller and boiler operations to better match building load conditions
Reducing ventilation in over-ventilated areas
Fixing ventilation dampers that are open when they should be closed, or vice versa
System rebalancing and decreasing supply air pressure set-point
Reducing supply air temperature and fan speed in air handling units
Aligning zone temperature set-points to match the building’s occupancy patterns
Operating equipment only when building is occupied or when equipment is needed
Lighting controls including occupancy/vacancy controls, photo-sensors, and timer controls

ATTACHMENT 1
22
Delivery Method The RCx and SEM Programs will be delivered by a third-party implementation contractor(s). Both
subprograms require customer and trade ally involvement in the form of on-site access to existing
equipment, management protocols, and energy management/facilities staff.
To support the marketplace and develop a project pipeline, the following delivery strategies, among others,
will be pursued:
Targeted Customer Outreach: Subprogram staff and their representatives will make outreach
efforts directly to PSE&G customers that own or operate facilities identified by internal screening
activity as potential participants. Factors considered in initial screening may include building
age/size/type and historical energy use patterns.
Technical Customer Assistance: An important element of the C&I Energy Management
Subprogram is the availability of technical support, guidance, training and orientation from
PSE&G’s third-party implementation contractor(s). Subprogram staff will be available to support
customers and determine if they may qualify for participation for either RCx or SEM. Depending
on the customer’s goals and likely energy savings potential, significant customer engagement may
be undertaken for the SEM subprogram.
On-Site Implementation: Both the RCx and SEM subprograms require subprogram staff to visit
customer premises to identify energy savings opportunities (including through the logging and
analysis of energy consumption data) and develop strategies and solutions for acquiring these
savings.
The RCx subprogram will be delivered through a network of approved retro-commissioning service
providers (RSPs) operating in PSE&G’s service territory that have been trained in subprogram protocols
and participation processes. Once an application has been accepted, one of the expert engineering RSPs
conducts a detailed energy assessment to investigate and identify low-cost energy-saving operational
improvements through a systematic evaluation of energy using systems. RCx involves a series of steps to
qualify appropriate customers for participation and to ensure the subprogram will produce meaningful
energy savings. These steps may include:
Initial Customer Screening: Customer-submitted applications are reviewed to assess the
likelihood of energy savings. Customers may also be identified through a data analytics engine
using PSE&G data and through data acquired via the Business Energy Reports Pilot or other
methods.
Project Scoping: The building owner or primary representative will be contacted by PSE&G
subprogram staff or their representatives to schedule a time for an on-site visit. This visit will entail
inspecting the building and major energy using equipment, reviewing past energy consumption,
and identifying preliminary opportunities for energy-use reduction.
Agreement and Implementation: A rigorous evaluation of building systems is conducted and an
incentive agreement is finalized with the customer regarding project measures, implementation
strategy, and incentives.
Follow-up: Additional training may be provided to building owners/operators after completion of
an RCx project to ensure savings persistence.
Example SEM implementation efforts also include the following:
Onsite Energy Management Assessment: Identify current strengths and weaknesses in existing
energy management practices.

ATTACHMENT 1
23
Metering Training: Instruction on the use of metering equipment to identify energy saving
opportunities and an introduction to energy modelling.
Coach-led Training Sessions: Targeted at any combination of building operations/facilities staff,
management personnel, and other company staff, training sessions are used to build awareness and
detect inefficient operating practices.
Benchmarking: Energy consumption benchmarking is a key aspect of SEM, and both baseline and
ongoing energy use monitoring strategies are employed to encourage data-driven energy
management and short-term feedback.
Proposed Incentives Incentives will be reviewed periodically with the input of subprogram staff and broader feedback from the
marketplace to ensure the incentive design is optimally driving energy savings and participation. The
incentive design structure and payment per first year kWh and therm saved may be different between the
RCx and SEM subprogram participants. Additionally, incentive levels may vary depending on the end-use
where the savings are achieved, and the overall comprehensiveness and estimated longevity of the energy
savings. These incentives are subject to change based on final subprogram design and the go-to-market
implementation plan.
Marketing Approach The C&I Energy Management Subprogram will engage with customers at multiple levels, including
through a combination of direct outreach by subprogram staff and representatives, web-based engagement
and information, digital advertising, and hard-copy materials to promote awareness among trade allies and
customers. Engagement with building and facilities managers for large commercial and industrial customers
will all be an important pathway for PSE&G to present information about the subprogram, raise awareness,
and encourage participation. PSE&G’s brand and its relationships with these customer types will drive
participation. The subprogram will leverage PSE&G’s existing relationships with customers through
subprogram staff and account management team.
Education and promotional materials will be developed for building owners and operators to reinforce the
benefits of energy efficiency improvements and improved systems performance, including educational
brochures, customer and market provider seminars, subprogram promotional material, and website content.
The marketing strategy will identify key customer segments and vertical markets for targeting, and will
prepare specific outreach activities for these customers. The strategy will be designed to inform customers
of the availability and benefits of the subprogram and how they can participate in the RCx or SEM
subprograms.
The marketing and communications plan will include:
Creating and updating Subprogram Fact Sheets, Case Studies
Hosting an annual Subprogram product knowledge workshop
Participating in local conferences and industry events to promote the RCx and SEM programs
Contractor Role PSE&G will administer and manage the overall subprogram with the support of third-party implementation
contractor(s). The third-party implementation contractor will have responsibility for the majority of delivery
tasks and customer outreach on behalf of PSE&G. It is anticipated that this third-party implementation
contractor will work closely with PSE&G to optimize the subprogram’s strategic direction including, but
not limited to, conducting the following tasks:

ATTACHMENT 1
24
Customer outreach/subprogram delivery strategy
Select, train and manage network of RCx trade ally contractors
Energy modeling and equipment metering
Leading SEM coaching and engagement sessions
Incentive levels and strategies
Marketing
Customer satisfaction
Subprogram data tracking
Rebate processing
PSE&G will select a qualified third-party implementation contractor (or contractors) based on, but not
limited to, the following factors:
Technical Approach
Organizational and Management Capability
Experience
Cost
1.3.5. C&I Engineered Solutions The C&I Engineered Solutions Subprogram will provide tailored energy efficiency assistance to public
service entities, such as municipalities, universities, schools, hospitals (MUSH), non-profit entities and
multi-family facilities. The subprogram will provide expert-guided service throughout delivery to assist
customers in identifying and undertaking large energy efficiency projects on-site, while requiring no up-
front funding from the customer.
Through this subprogram, customers will be provided with an in-depth audit of their facilities, as well as a
detailed assessment and recommendation of energy efficiency measures that could be economically
installed. Customer incentives are determined on a project-by-project basis, and participants may select
their preferred installation providers. In addition to the calculated project-by-project incentive, participants
will have the option to pay back the non-incentive portion of the project costs through interest free on-bill
repayments over a period of five years (and ten years for HMFA qualified multi-family facilities). Through
this subprogram design, participants in market segments that have typically been underserved are able to
achieve greater energy savings.
Market Segment/Efficiency Targeted C&I public service (MUSH), non-profit, and multi-family entities located within PSE&G’s electric and/or
natural gas service territory are eligible to participate in this subprogram. The subprogram will provide
energy audits and incentives to entities that directly serve the public, but often have difficultly investing in
energy efficiency. The measures included in this subprogram may include HVAC, building envelope,
motors, lighting, controls, energy storage, and other energy consuming equipment.
Delivery Method PSE&G will retain qualified vendors to undertake the audit and engineering services required to deliver
this subprogram. Participants will contract with their preferred installation providers to install the measures
included in projects.
The subprogram delivery will typically occur in four steps:

ATTACHMENT 1
25
Audit: PSE&G shall assess the required level of American Society of Heating, Refrigerating, and
Air Conditioning Engineers (ASHRAE) audit to perform, based on the complexity of the facility
and the potential energy efficiency measures; an investment grade audit may not be required for all
facilities. The selected PSE&G vendor will then perform the appropriate level energy audit and
prepare a customized audit report that includes a list of recommended energy efficiency upgrades.
PSE&G and its representatives will then review the recommended energy efficiency upgrades with
the customer to determine whether to proceed with a project.
Engineering Analysis of Project: Based on the audit results, an engineering analysis may be
required. PSE&G will conduct a screening of the payback and project cost effectiveness and select
a set of approved energy efficiency measures for the project. The subprogram engineering vendor
will prepare bid-ready documents and work with the participant to prepare a project scope of work,
which will be used by the customer to obtain installation cost estimates for the project.
Scope of Work/Contractor Bids: The participant will issue a scope of work to obtain bids to
complete the identified project. PSE&G, the subprogram engineering vendor and the participant
will review and evaluate the bids/costs received, with the participant making the final decision on
bid selection. Following bid selection, the proposed project is again screened for cost effectiveness
and the participant is presented the funding commitment proposal from PSE&G. Once (i) the
participant and PSE&G have executed the funding commitment and (ii) the installation provider
and the participant have executed applicable agreements and contracts, the first progress payment
equal to approximately 30% of the installation cost can be issued to the customer to initiate the
project (Stage 1 Progress Payment).
Measures Installation and Inspections: PSE&G and the energy engineering vendor, acting as
construction administration agent, will monitor project progress. Upon verification of satisfactory
project progress, a series of Stage 2 progress payments up to 50% of total project commitment can
be issued. When the project is 100% complete, a final project true-up, and final inspection are
undertaken. The final payment based on the results of project true-up is determined and issued only
if the final inspection is successfully completed and approved. If the final costs are less than the
estimated project commitment, the final payment will be adjusted down to reflect the actual costs.
If the final costs are greater than the estimated project commitment, the final payment will not be
adjusted and will be paid according to the executed agreements and contracts specifying original
costs.
The progress payment schedule described above is designed to ensure that building owners can pay their
contractors on a timely basis. Project progress and the project cash flow will be monitored and verified by
PSE&G or a designated third-party implementation contractor.
Proposed Incentives The subprogram will provide a 100% incentive for an up-front ASHRAE Level I, II, or III audit. The
specific audit level will be determined based upon the type, size, and age of the facility. In addition, PSE&G
will buy-down the simple payback of the recommended energy efficiency project cost for approved
measures by up to six years, with the resulting payback not less than three years. After the project incentive
buy-down, the remaining project costs may be funded by the subprogram with participants repaying the
balance of the project costs on-bill.
PSE&G will retain the option and flexibility to adjust the incentive offered to participants to enable a whole-
building approach that will include additional ECMs in the project.
The full cost of the energy efficiency projects (including engineering, transaction costs and cost of
construction) will be covered through a combination of subprogram incentive and customer repayments.

ATTACHMENT 1
26
Marketing Approach PSE&G will leverage existing relationships with municipalities, universities, schools, and other public
agencies to promote the subprogram and will conduct further outreach through school, university, and
municipal associations. In addition, PSE&G will generate a marketing campaign to hospitals, healthcare
facilities, non-profits, and multi-family agencies to increase awareness of the subprogram. The subprogram
will leverage PSE&G’s existing relationships and communication channels with customers through
subprogram staff and account management team.
Contractor Role PSE&G will select qualified subprogram participating vendors to undertake all auditing and engineering
work associated with the subprogram. Participants are permitted to select their preferred installation
providers to complete work on-site. PSE&G may also utilize a third-party implementation contractor to
assist in the outreach, marketing, and trade ally coordination, to support the large number of municipalities
and schools within the PSE&G service territory. The installation provider will adhere to the project
specifications set forth by PSE&G and the engineering vendor and approved by the participant. The third-
party implementation contractor will also monitor participation to assess the effectiveness of outreach
efforts, incentive levels, delivery methods, and vendor availability and provide suggestions for
improvement.
To select a qualified third-party implementation contractor, PSE&G will prioritize criteria such as:
Experience delivering similar subprograms or initiatives
Resources and marketing strength
Cost effectiveness

ATTACHMENT 1
27
APPENDIX A – MEASURE-LEVEL DETAILS The chart below contains preliminary measure-by-measure details used to develop the subprograms. It is anticipated that incentive levels may
change prior to and during the implementation of each Subprogram.
Table 1. Measure Level Details
Subprogram Name Measure Primary
Fuel Type Unit Basis Modeled
AVG
Incentive
Res Eff Products Storage WH, EF=0.82 GAS per water heater $125.00
Res Eff Products Instant WH, EF>=0.82 GAS per water heater $150.00
Res Eff Products Heat Pump WH ELEC per water heater $400.00
Res Eff Products Circulator with demand control GAS per water heater $40.00
Res Eff Products Indirect water heater with Energy Star hot water boiler GAS per water heater $400.00
Res Eff Products Condensing Boiler 90-95% GAS Per Boiler $400.00
Res Eff Products ENERGY STAR RAC ELEC Per Room AC $50.00
Res Eff Products ENERGY STAR CAC (16 SEER 13 EER) ELEC Per Air Conditioner $400.00
Res Eff Products ENERGY STAR Fan ELEC Per Fan $15.00
Res Eff Products ENERGY STAR Mini Split HP ELEC Per Heat Pump $400.00
Res Eff Products SEER 18 HSPF 8.5, installed according to specifications ELEC Per Heat Pump $450.00
Res Eff Products ENERGY STAR heat pump ELEC Per System $450.00
Res Eff Products WiFi thermostat ELEC Per Thermostat $100.00
Res Eff Products WiFi thermostat GAS Per Thermostat $75.00
Res Eff Products Condensing Furnace 95-97% GAS Per Furnace $400.00
Res Eff Products VRF Heat Pump ELEC Per VRF System $400.00
Res Eff Products Most efficient Direct Unit Heater available GAS Per Direct Heater $400.00
Res Eff Products ECM circulator pump ELEC Per pump $75.00
Res Eff Products ECM Motor ELEC Per HVAC system $100.00
Res Eff Products Condensing boiler combo GAS Per Water Heating System $350.00
Res Eff Products Properly maintained CAC, 2.6 ton ELEC Per AC System $25.00
Res Eff Products ENERGY STAR Freezer ELEC per Freezer $75.00
Res Eff Products ENERGY STAR Most Efficient Refrigerator ELEC per Refrigerator $75.00

ATTACHMENT 1
28
Subprogram Name Measure Primary
Fuel Type Unit Basis Modeled
AVG
Incentive
Res Eff Products Heat Pump Clothes Dryer ELEC per dryer $75.00
Res Eff Products EnergyStar Side-Loading Clothes Washer GAS Per Clothes Washer $75.00
Res Eff Products EnergyStar Side-Loading Clothes Washer ELEC Per Clothes Washer $75.00
Res Eff Products EnergyStar Ceiling Fan, no light ELEC per Ceiling Fan $15.00
Res Eff Products EnergyStar Portable Dehumidifier ELEC per Dehumidifier $35.00
Res Eff Products Energy Star Dryer ELEC per Dryer $50.00
Res Eff Products Energy Star Dryer GAS PER DRYER $50.00
Res Eff Products Energy Star Air Cleaner ELEC per Air Cleaner $50.00
Res Eff Products Energy Star Television ELEC per Television $10.00
Res Eff Products Energy Star 5.0 TV Set Top Box ELEC per TV Set Top Box $1.50
Res Eff Products Energy Star 7.0 LCD Monitor ELEC Per Monitor $2.50
Res Eff Products ECM Whole Home Fan ELEC per Fan $15.00
Res Eff Products Induction Cooktop Stove ELEC per stove $25.00
Res Eff Products Variable Speed Pool Pump ELEC per in-ground pool $250.00
Res Eff Products Above ground pool with pump timer ELEC per above-ground pool $10.00
Res Eff Products LED Screw-in General Service Lamp ELEC Per Bulb $3.00
Res Eff Products Networked/ Connected - Indoor LED Lamp ELEC Per Bulb $5.00
Res Eff Products LED Replacement Lamp (Tube) ELEC Per Bulb $3.00
Res Eff Products LED ENERGY STAR Fixture ELEC Per Fixture $10.00
Res Eff Products Networked/ Connected - Indoor LED Luminaire ELEC Per Fixture $10.00
Res Eff Products LED Outdoor Flood Light Fixture ELEC Per Fixture $5.00
Res Eff Products LED Nightlight ELEC Per Bulb $1.59
Res Eff Products Manual Dimming Control All Types ELEC Per Bulb $2.21
Res Eff Products Occupancy Sensor ELEC Per Bulb $5.33
Res Eff Products Daylighting Control ELEC Per Bulb $5.00
Res Eff Products Low flow aerator ELEC per faucet $6.00
Res Eff Products Low flow aerator GAS per faucet $7.00
Res Eff Products Low flow showerhead GAS per shower $8.00

ATTACHMENT 1
29
Subprogram Name Measure Primary
Fuel Type Unit Basis Modeled
AVG
Incentive
Res Eff Products Low flow showerhead ELEC per shower $9.00
Res Eff Products Pipe wrap (hot water) GAS per house $10.00
Res Eff Products Pipe wrap (hot water) ELEC per house $10.00
Res Eff Products Secondary Freezer Not Replaced ELEC per Freezer $75.00
Res Eff Products Secondary Refrigerator Not Replaced ELEC per Refrigerator $75.00
Res Eff Products Smart (Tier 1) Power Strip ELEC per smart power strip $15.00
Res Eff Products Advanced Smart (Tier 2) Power Strip ELEC per advanced power strip $25.00
Res Existing Homes Sealed duct in unconditioned spaces ELEC Per Household $150.00
Res Existing Homes Ground Source Heat Pump ELEC Per GSHP $450.00
Res Existing Homes ENERGY STAR RAC ELEC Per Room AC $35.00
Res Existing Homes ENERGY STAR CAC (16 SEER 13 EER) ELEC Per Air Conditioner $450.00
Res Existing Homes ENERGY STAR heat pump ELEC Per System $350.00
Res Existing Homes VRF Heat Pump ELEC Per VRF System $350.00
Res Existing Homes Fan system with heat recovery GAS Per Fan System $300.00
Res Existing Homes Properly installed CAC ELEC Per Air Conditioner $50.00
Res Existing Homes Added Desuperheater ELEC per GSHP $250.00
Res Existing Homes Drainwater Heat Exchanger ELEC per house $300.00
Res Existing Homes LED Screw-in General Service Lamp ELEC Per Bulb $10.00
Res Existing Homes Networked/ Connected - Indoor LED Lamp ELEC Per Bulb $10.00
Res Existing Homes LED Replacement Lamp (Tube) ELEC Per Bulb $5.00
Res Existing Homes LED ENERGY STAR Fixture ELEC Per Fixture $8.00
Res Existing Homes Networked/ Connected - Indoor LED Luminaire ELEC Per Fixture $10.00
Res Existing Homes LED Outdoor Flood Light Fixture ELEC Per Fixture $5.00
Res Existing Homes LED Nightlight ELEC Per Bulb $2.00
Res Existing Homes Manual Dimming Control All Types ELEC Per Bulb $2.00
Res Existing Homes Occupancy Sensor ELEC Per Bulb $5.00
Res Existing Homes Daylighting Control ELEC Per Bulb $5.00
Res Existing Homes Condensing Boiler 90-95% GAS Per Boiler $400.00

ATTACHMENT 1
30
Subprogram Name Measure Primary
Fuel Type Unit Basis Modeled
AVG
Incentive
Res Existing Homes Condensing Furnace 95-97% GAS Per Furnace $400.00
Res Existing Homes Low flow aerator ELEC per faucet $4.00
Res Existing Homes Low flow aerator GAS per faucet $4.00
Res Existing Homes Low flow showerhead ELEC per shower $11.00
Res Existing Homes Low flow showerhead GAS per shower $11.00
Res Existing Homes Pipe wrap (hot water) GAS per house $22.00
Res Existing Homes Pipe wrap (hot water) ELEC per house $22.48
Res Existing Homes Standard flow showerhead with TSV ELEC per shower $34.00
Res Existing Homes Water Heater set to 120F ELEC per water heater $5.00
Res Existing Homes Instant WH, EF>=0.82 GAS per water heater $300.00
Res Existing Homes WH timer ELEC per water heater $5.00
Res Existing Homes Single-Pane window with low-E film ELEC per living unit $138.60
Res Existing Homes Home that has air sealing performed ELEC per house $350.00
Res Existing Homes Home that has air sealing performed GAS per house $350.00
Res Existing Homes Insulated ductwork GAS per living unit $300.00
Res Existing Homes Home with insulated basement GAS per house $500.00
Res Existing Homes Home with insulated ceiling roof GAS per house $500.00
Res Existing Homes Home with insulated knee walls GAS per house $400.00
Res Existing Homes Home with insulated rim joists GAS per house $350.00
Res Existing Homes Home with insulated walls GAS per house $350.00
Res Existing Homes Insulated ductwork ELEC per living unit $500.00
Res Existing Homes Home with insulated basement ELEC per house $500.00
Res Existing Homes Home with insulated ceiling roof ELEC per house $500.00
Res Existing Homes Home with insulated knee walls ELEC per house $350.00
Res Existing Homes Home with insulated rim joists ELEC per house $350.00
Res Existing Homes Home with insulated walls ELEC per house $500.00
Res Existing Homes Boiler with reset controls GAS Per Boiler $200.00
Res Existing Homes Insulated piping GAS Per Household $11.00

ATTACHMENT 1
31
Subprogram Name Measure Primary
Fuel Type Unit Basis Modeled
AVG
Incentive
Res Existing Homes HVAC system sized according to Manual J ELEC Per System $125.00
Res Existing Homes Heat Pump operating according to specifications ELEC Per Heat Pump $75.00
Res Existing Homes Properly maintained furnace GAS Per Furnace $25.00
Res Existing Homes Steam heating system with properly adjusted vents GAS Per household $40.00
Res Existing Homes Secondary Freezer Not Replaced ELEC per Freezer $50.00
Res Existing Homes Secondary Refrigerator Not Replaced ELEC per Refrigerator $50.00
Res Existing Homes Smart (Tier 1) Power Strip ELEC per smart power strip $20.00
Res Existing Homes Advanced Smart (Tier 2) Power Strip ELEC per advanced power strip $30.00
Res Behavior Home Energy Reports ELEC per report $11.00
Res K-12 Education K-12 Education Behavior (HER) GAS per report $0.00
Res K-12 Education K-12 Education Behavior (HER) ELEC per report $0.00
Res K-12 Education Low flow aerator ELEC per faucet $4.00
Res K-12 Education Low flow aerator GAS per faucet $4.00
Res K-12 Education Low flow showerhead GAS per shower $11.00
Res K-12 Education Low flow showerhead ELEC per shower $11.00
Res K-12 Education LED Screw-in General Service Lamp ELEC Per Bulb $9.00
Res K-12 Education Networked/ Connected - Indoor LED Lamp ELEC Per Bulb $41.00
Res K-12 Education LED Nightlight ELEC Per Bulb $9.00
Res New Construction Res New Construction - Per Home Gas Component GAS per living unit $1,250.00
Res New Construction Res New Construction - Per Home Elec Component ELEC per living unit $1,250.00
Res MF Home Energy Reports ELEC per report $6.00
Res MF Home Energy Reports GAS per report $6.00
Res MF Low flow aerator ELEC per faucet $4.00
Res MF Low flow aerator GAS per faucet $4.00
Res MF Low flow showerhead GAS per shower $11.00
Res MF Low flow showerhead ELEC per shower $11.00
Res MF Standard flow showerhead with TSV ELEC per shower $34.00
Res MF Smart (Tier 1) Power Strip ELEC per smart power strip $33.00

ATTACHMENT 1
32
Subprogram Name Measure Primary
Fuel Type Unit Basis Modeled
AVG
Incentive
Res MF Advanced Smart (Tier 2) Power Strip ELEC per advanced power strip $45.00
Res MF LED Screw-in General Service Lamp ELEC Per Bulb $9.00
Res MF LED Nightlight ELEC Per Bulb $0.00
Income Eligible Condensing Furnace 95-97% GAS Per Furnace $2,637.98
Income Eligible Condensing Boiler 90-95% GAS Per Boiler $3,754.57
Income Eligible LED Outdoor Flood Light Fixture ELEC Per Fixture $60.30
Income Eligible LED Screw-in General Service Lamp ELEC Per Bulb $8.76
Income Eligible LED ENERGY STAR Fixture ELEC Per Fixture $43.17
Income Eligible LED Nightlight ELEC Per Bulb $9.17
Income Eligible Low flow aerator ELEC per faucet $4.00
Income Eligible Low flow aerator GAS per faucet $4.00
Income Eligible Low flow showerhead GAS per shower $11.00
Income Eligible Low flow showerhead ELEC per shower $11.00
Income Eligible Pipe wrap (hot water) GAS per house $22.48
Income Eligible Pipe wrap (hot water) ELEC per house $22.48
Income Eligible Standard flow showerhead with TSV ELEC per shower $34.00
Income Eligible Water Heater set to 120F GAS per water heater $5.00
Income Eligible Instant WH, EF>=0.82 GAS per water heater $1,828.65
Income Eligible WH timer GAS per water heater $136.00
Income Eligible Single-Pane window with low-E film ELEC per living unit $789.60
Income Eligible Home that has air sealing performed ELEC per house $1,007.40
Income Eligible Home that has air sealing performed GAS per house $1,007.40
Income Eligible Insulated ductwork ELEC per living unit $667.00
Income Eligible Home with insulated basement ELEC per house $1,500.00
Income Eligible Home with insulated ceiling roof ELEC per house $1,800.00
Income Eligible Home with insulated knee walls ELEC per house $900.00
Income Eligible Home with insulated rim joists ELEC per house $500.00
Income Eligible Home with insulated walls ELEC per house $1,500.00

ATTACHMENT 1
33
Subprogram Name Measure Primary
Fuel Type Unit Basis Modeled
AVG
Incentive
Income Eligible Boiler with reset controls GAS Per Boiler $300.00
Income Eligible Insulated ductwork GAS per living unit $667.00
Income Eligible Home with insulated basement GAS per house $1,500.00
Income Eligible Home with insulated ceiling roof GAS per house $1,800.00
Income Eligible Home with insulated knee walls GAS per house $900.00
Income Eligible Home with insulated rim joists GAS per house $500.00
Income Eligible Home with insulated walls GAS per house $1,500.00
Income Eligible Insulated piping GAS Per Household $22.48
Income Eligible HVAC system sized according to Manual J ELEC Per System $250.00
Income Eligible Heat Pump operating according to specifications ELEC Per Heat Pump $130.00
Income Eligible Properly maintained furnace GAS Per Furnace $125.00
Income Eligible Steam heating system with properly adjusted vents GAS Per household $125.02
Income Eligible Smart (Tier 1) Power Strip ELEC per smart power strip $33.00
Income Eligible Advanced Smart (Tier 2) Power Strip ELEC per advanced power strip $50.00
C&I Prescriptive Instant WH 0.82 or 0.94 TE (Gas) GAS per kBtu/hr $2.00
C&I Prescriptive Comm Storage WH Et=0.8, with heat recovery (Gas) GAS per kBtu/hr $200.00
C&I Prescriptive HW Recirc System w Demand control (Gas) GAS per recirculation system $1,000.00
C&I Prescriptive Insulated HW pipe in unconditioned space (Gas) GAS per linear foot pipe $8.00
C&I Prescriptive Advanced Smart (Tier 2) Power Strip (Electric) ELEC per Power Strip $20.00
C&I Prescriptive Boiler with reset controls (Gas) GAS Per kBtu/h $0.24
C&I Prescriptive HVAC with WiFi thermostat (Gas) GAS per thermostat $75.00
C&I Prescriptive HVAC with WiFi thermostat (Electric) ELEC per thermostat $75.00
C&I Prescriptive HVAC system with EMS (Gas) GAS Per 1000 sqft $500.00
C&I Prescriptive HVAC with CO2-based control (Gas) GAS Per 1000 sqft $30.00
C&I Prescriptive HVAC with CO2-based control (Electric) ELEC Per 1000 sqft $40.00
C&I Prescriptive Boiler Tune-Up GAS kbtu/hr input $0.33
C&I Prescriptive Furnace Tune-Up GAS kbtu/hr input $0.33
C&I Prescriptive Furnace with ECM Fan Motor (Electric) ELEC Per kBtu/h $1.00

ATTACHMENT 1
34
Subprogram Name Measure Primary
Fuel Type Unit Basis Modeled
AVG
Incentive
C&I Prescriptive VFD-Controlled Motor (Electric) ELEC per HP $100.00
C&I Prescriptive ECM Circulator Pump (Electric) ELEC Per HP $635.00
C&I Prescriptive Insulated pipe (Gas) GAS per linear foot pipe $8.00
C&I Prescriptive Chilled Water Pump with VFD (Electric) ELEC per HP $150.00
C&I Prescriptive Variable Air Volume HVAC (Electric) ELEC Per ton $200.00
C&I Prescriptive Cooling Tower Fan with VFD (Electric) ELEC per HP $100.00
C&I Prescriptive PTAC/PTHP with occupancy sensor (Electric) ELEC Per ton $100.00
C&I Prescriptive Air Handler with DOAS (Gas) GAS Per ton $275.00
C&I Prescriptive Ventilation with heat recovery (Gas) GAS Per ventilator $375.00
C&I Prescriptive Hotel Guest Room Occupancy Sensor (Electric) ELEC per 1000 sq ft $150.00
C&I Prescriptive Interior Occupancy Sensor (Electric) ELEC per 1000 sq ft $100.00
C&I Prescriptive LED Outdoor Building Exterior (Electric) ELEC per 1000 sq ft $25.00
C&I Prescriptive Exterior Occupancy Sensor (Electric) ELEC per 1000 sq ft $10.00
C&I Prescriptive LED Track Lighting (Electric) ELEC per 1000 sq ft $7.50
C&I Prescriptive Solid State (LED) Recessed Downlight (Electric) ELEC per 1000 sq ft $30.00
C&I Prescriptive LED Refrigerator/Freezer Case (Electric) ELEC per 1000 sq ft $0.10
C&I Prescriptive Refrigerator Case Light Sensor (Electric) ELEC per 1000 sq ft $1.50
C&I Prescriptive Freezer Case Light Sensor (Electric) ELEC per 1000 sq ft $0.50
C&I Prescriptive LED Exit Sign (Electric) ELEC per 1000 sq ft $25.00
C&I Prescriptive Bi-Level Stairway Lighting (Electric) ELEC per 1000 sq ft $15.00
C&I Prescriptive LED Bollard (Electric) ELEC per 1000 sq ft $0.50
C&I Prescriptive Daylight Dimming Control (Electric) ELEC per 1000 sq ft $200.00
C&I Prescriptive LED Troffer/Surface/Suspended (Electric) ELEC per 1000 sq ft $300.00
C&I Prescriptive LED Display Case Lighting (Electric) ELEC per 1000 sq ft $1.50
C&I Prescriptive LED Replacement Lamp (Tube) (Electric) ELEC per 1000 sq ft $50.00
C&I Prescriptive LED Other Linear Fixture (Electric) ELEC per 1000 sq ft $50.00
C&I Prescriptive LED Low/High Bay (Electric) ELEC per 1000 sq ft $250.00
C&I Prescriptive LED Pole/Arm Mounted (Electric) ELEC per 1000 sq ft $50.00

ATTACHMENT 1
35
Subprogram Name Measure Primary
Fuel Type Unit Basis Modeled
AVG
Incentive
C&I Prescriptive LLLC - Low Impact Application (Electric) ELEC per 1000 sq ft $400.00
C&I Prescriptive LED Channel Signage (Electric) ELEC per 1000 sq ft $3.00
C&I Prescriptive LED Parking Garage and Canopy (Electric) ELEC per 1000 sq ft $50.00
C&I Prescriptive Market Avg Eff Spray Valve (1.16 GPM) (Gas) GAS per Spray Valve $25.00
C&I Prescriptive ENERGY STAR Commercial Refrigerator (Electric) ELEC per Refrigerator $300.00
C&I Prescriptive ENERGY STAR Commercial Freezer (Electric) ELEC per Freezer $300.00
C&I Prescriptive Pool with Cover (Gas) GAS per sqft of pool surface $1.00
C&I Prescriptive Demand Controlled Ventilation (DCV) Exhaust Hood (Electric) ELEC per HP $800.00
C&I Prescriptive Refrigerated Vending Machine with control system (Electric) ELEC Vending Machine $100.00
C&I Prescriptive Non-Refrigerated Vending Machine with control system (Electric) ELEC Vending Machine $100.00
C&I Prescriptive Refrigeration – Cooler Night Covers LT (Electric) ELEC Per foot $6.00
C&I Prescriptive Refrigeration – Cooler Night Covers MT (Electric) ELEC Per foot $6.00
C&I Prescriptive Refrigeration – Cooler Night Covers HT (Electric) ELEC Per foot $6.00
C&I Prescriptive Evaporator Fan Control (Electric) ELEC Per Compressor HP $30.00
C&I Prescriptive Add Door to Open Display Case (Electric) ELEC Per foot $200.00
C&I Prescriptive electronically commutated motors Motor (Electric) ELEC Motor $75.00
C&I Prescriptive Automatic door Closer (Electric) ELEC autocloser $75.00
C&I Prescriptive Freezer and Cooler Door Strip Curtians (Electric) ELEC Per square foot $2.00
C&I Prescriptive Insulated Lines (Electric) ELEC Per foot $1.00
C&I Prescriptive Anti sweat heat control (Electric) ELEC Per foot $20.00
C&I Prescriptive Defrost Controls (Electric) ELEC Per evap Fan $125.00
C&I Prescriptive Floating Head- Air Cooled (Electric) ELEC Per Ton $100.00
C&I Prescriptive Floating Head- Evap Cooled (Electric) ELEC Per Ton $40.00
C&I Prescriptive Freezer and Cooler Door Gaskets (Electric) ELEC Per foot $20.00
C&I Prescriptive Condensing Storage WH 90% TE (Gas) GAS per kBtu/hr $5.00
C&I Prescriptive Indirect WH 85% CAE (Gas) GAS per kBtu/hr $4.00
C&I Prescriptive Elec Storage WH 2.30 Et (Electric) ELEC per kBtu/hr $2.00
C&I Prescriptive Volume Water Heater 92% TE (Gas) GAS per kBtu/hr $5.00

ATTACHMENT 1
36
Subprogram Name Measure Primary
Fuel Type Unit Basis Modeled
AVG
Incentive
C&I Prescriptive High performance hood (Gas) GAS Hood $500.00
C&I Prescriptive hood controls (Gas) GAS Hood $1,000.00
C&I Prescriptive High Pressure Steam Trap, Greater than 75 PSIG, Tested GAS PER UNIT $300.00
C&I Prescriptive Medium Pressure Steam Trap, 15 PSIG to 75 PSIG, Tested GAS PER UNIT $200.00
C&I Prescriptive 95% or 97% AFUE and ECM motor (Gas) GAS Per kBtu/h $2.76
C&I Prescriptive ENERGY STAR RAC (Electric) ELEC per kBtu/hr $1.47
C&I Prescriptive 90% Et Condensing Boiler (Gas) GAS Per kBtu/h $7.92
C&I Prescriptive CEE-compliant heat pump (Electric) ELEC per ton cooling $100.00
C&I Prescriptive ENERGY STAR Minisplit (Electric) ELEC per ton cooling $100.00
C&I Prescriptive VRF HP (Electric) ELEC per ton cooling $1,250.00
C&I Prescriptive 15.0 EER Ground-Source HP (Electric) ELEC Per Ton $80.00
C&I Prescriptive ROB DX Packaged System, EER=10.8, 30 tons (Electric) ELEC Per Ton $24.93
C&I Prescriptive ROB DX Packaged System, EER=10.8, 30 tons, AFUE 95% (Gas) GAS Per Ton $90.00
C&I Prescriptive Condensing integrated boiler and water heater (Gas) GAS Per kbtuhr $1.36
C&I Prescriptive Variable Speed Centrifugal Chiller (Electric) ELEC Per ton $100.00
C&I Prescriptive 95 AFUE make-up air unit (Gas) GAS Per kBtu/h $2.61
C&I Prescriptive HVLS fan (Electric) ELEC Per 1000 sqft $100.00
C&I Prescriptive High-efficiency PTHP (Electric) ELEC Per ton $40.00
C&I Prescriptive High-efficiency PTAC (Electric) ELEC Per ton $40.00
C&I Prescriptive Condensing unit heater, 90% AFUE (Gas) GAS per kBtu/h $5.32
C&I Prescriptive Gas-fired low-intensity infrared heating unit (Gas) GAS per kBtu/h $1.10
C&I Prescriptive HVAC system with high-efficiency air-cooled chiller (Electric) ELEC Per ton cooling $100.00
C&I Prescriptive HVAC system with high-efficiency water-cooled chiller (Electric) ELEC Per ton cooling $100.00
C&I Prescriptive HVAC system with dual enthalpy sensor outside air economizer (Electric) ELEC Per tons cooling $80.00
C&I Prescriptive Heat Pump Multi-Family Laundromat Dryer (Electric) ELEC per Dryer $300.00
C&I Prescriptive Variable Speed Pool Pump (Electric) ELEC per in-ground pool $300.00
C&I Prescriptive ENERGY STAR Refrigerator-Freezer (Electric) ELEC per Refrigerator $61.00
C&I Prescriptive ES 3.0 Beverage Vending Machine (Electric) ELEC per Beverage Vending Machine $100.00

ATTACHMENT 1
37
Subprogram Name Measure Primary
Fuel Type Unit Basis Modeled
AVG
Incentive
C&I Prescriptive Electric Clothes Dryer - High Efficiency- Electric (Electric) ELEC per Dryer $100.00
C&I Prescriptive Electric Clothes Dryer - High Efficiency- Gas (Gas) GAS per Dryer $200.00
C&I Prescriptive HE Commercial Cloths Washer (Gas) GAS Per Washer $100.00
C&I Prescriptive Ozone Laundry Washing Machine (Gas) GAS Per Washer $2,500.00
C&I Prescriptive ENERGY STAR Electric Convection Oven (Electric) ELEC per oven $750.00
C&I Prescriptive ENERGY STAR Electric Combination Oven (Electric) ELEC per oven $750.00
C&I Prescriptive ENERGY STAR Gas Convection Oven (Gas) GAS per oven $600.00
C&I Prescriptive ENERGY STAR Gas Combination Oven (Gas) GAS per oven $1,250.00
C&I Prescriptive ENERGY STAR Hot Food Holding Cabinet (Electric) ELEC per hot food holding cabinet $750.00
C&I Prescriptive ENERGY STAR Ice Machine or CEE Tier 2 (Electric) ELEC per ice machine $100.00
C&I Prescriptive ENERGY STAR High Temperature Commercial Dishwasher, Conveyor - Electric (Electric)
ELEC per dishwasher $300.00
C&I Prescriptive ENERGY STAR High Temperature Commercial Dishwasher, Conveyor -
Gas (Gas) GAS per dishwasher $300.00
C&I Prescriptive ENERGY STAR High Temperature Commercial Dishwasher, Non-conveyor - electric (Electric)
ELEC per dishwasher $300.00
C&I Prescriptive ENERGY STAR High Temperature Commercial Dishwasher, Non-conveyor
- gas (Gas) GAS per dishwasher $300.00
C&I Prescriptive ENERGY STAR Low Temperature Commercial Dishwasher - Electric (Electric)
ELEC per dishwasher $300.00
C&I Prescriptive ENERGY STAR Low Temperature Commercial Dishwasher - Gas (Gas) GAS per dishwasher $300.00
C&I Prescriptive Existing Compressor (Electric) ELEC Per compressor $275.00
C&I Prescriptive High Efficiency Compressor (Electric) ELEC Per compressor $125.00
C&I Prescriptive Oversized Condenser- Air Cooled (Electric) ELEC Per Ton $125.00
C&I Prescriptive Oversized Condenser- Evap Cooled (Electric) ELEC Per Ton $125.00
C&I Prescriptive Refrigeration/Freezer Door Heater Controls ELEC per door $20.00
C&I Prescriptive ENERGY STAR Commercial Fryers ELEC per fryer $300.00
C&I Custom C&I Custom - Elec ELEC per kWh $0.20
C&I Custom C&I Custom - Gas GAS per therm $1.64
C&I Small Non-Residential Efficiency C&I Small Non-Residential Efficiency Electric ELEC per kWh $0.20
C&I Small Non-Residential Efficiency C&I Small Non-Residential Efficiency Gas GAS per therm $1.50
C&I New Construction C&I NC Electric ELEC per kWh $0.16

ATTACHMENT 1
38
Subprogram Name Measure Primary
Fuel Type Unit Basis Modeled
AVG
Incentive
C&I New Construction C&I NC Gas GAS per therm $2.00
C&I Energy Management RCX Electric ELEC per kWh $0.05
C&I Energy Management RCX Gas GAS per therm $0.96
C&I Energy Management Strategic Energy Mgmt Electric ELEC per kWh $0.05
C&I Energy Management Strategic Energy Mgmt Gas GAS per therm $0.96
C&I Engineered Solutions MUSH Engineered Solution - Audit ELEC PROGRAM $21,223.14
C&I Engineered Solutions MUSH Engineered Solution - Audit GAS PROGRAM $9,987.36
C&I Engineered Solutions MUSH Engineered Solution - Engineering ELEC PROGRAM $43,889.46
C&I Engineered Solutions MUSH Engineered Solution - Engineering GAS PROGRAM $20,653.86
C&I Engineered Solutions MUSH Engineered Solution - Construction Begins (1st Pay) ELEC PROGRAM $129,696.98
C&I Engineered Solutions MUSH Engineered Solution - Construction Begins (1st Pay) GAS PROGRAM $61,033.87
C&I Engineered Solutions MUSH Engineered Solution - 50% Complete (2nd Pay) ELEC PROGRAM $129,696.98
C&I Engineered Solutions MUSH Engineered Solution - 50% Complete (2nd Pay) GAS PROGRAM $61,033.87
C&I Engineered Solutions MUSH Engineered Solution - Construction Finished (3rd Pay) ELEC PROGRAM $129,696.98
C&I Engineered Solutions MUSH Engineered Solution - Construction Finished (3rd Pay) GAS PROGRAM $61,033.87
C&I Streetlight STREETLIGHTING - HPS 58 TO LED 36 ELEC PER FIXTURE $305.83
C&I Streetlight STREETLIGHTING - HPS 117 TO LED 56 ELEC PER FIXTURE $309.23
C&I Streetlight STREETLIGHTING - HPS 171 TO LED 73 ELEC PER FIXTURE $353.44
C&I Streetlight STREETLIGHTING - HPS 300 TO LED 107 ELEC PER FIXTURE $353.41
C&I Streetlight STREETLIGHTING - HPS 450 TO LED 180 ELEC PER FIXTURE $473.49
C&I Streetlight LED CONTROLLER ELEC PER FIXTURE $124.74
C&I Streetlight LED CONTROLLER INSTALL ELEC PER FIXTURE $0.00
C&I Streetlight INDUCTION CONTROLLER ELEC PER FIXTURE $124.74
C&I Streetlight INDUCTION CONTROLLER INSTALL ELEC PER FIXTURE $61.43
C&I Streetlight Smart City Pilot ELEC Per Controller $90.33

ATTACHMENT 1
39
APPENDIX B: Enrollment
Subprogram Enrollment
Residential Efficient Products Customer application received
Residential Existing Homes Customer application received
Residential Behavioral Customer included in treatment group
Residential Multi-Family Customer application received
Residential Income Eligible Customer application received
C&I Prescriptive Customer application received
C&I Custom Customer application received
C&I Small Non-Residential
Efficiency
Customer application received (Audit Access
Agreement)
C&I Energy Management Customer application received
C&I Engineered Solutions Customer application received (Customer Access
Consent Agreement )

1
ATTACHMENT 2 – IT COST BREAKDOWN
Platform Description Investment
($M)
SAP ERP/Billing platform 8.9
Salesforce Customer relationship management platform 5.5
Mulesoft Integration system using Application Programming Interfaces (APIs)
2.9
Online Integration
Web based customer self-service portal, Mobile App, Digital Assistant, IVR integration, and e-signature enablement
6.1
Energy Efficiency Tracking System
Platform for tracking EE program investments, energy savings, enrollments and customer participation, and tracking BPU reporting requirements
2.8
Program-specific support
Support for Behavioral and Marketplace platforms 1.0
Analytics Platform to provide insights into program participation, energy savings and overall program effectiveness, leveraging data lakes and advanced algorithms
5.8
Total 33.0
Note: values rounded to the nearest $0.1M
Note: The cost breakdown above is based on program scope as documented in this Stipulation. PSE&G will
have flexibility to move the dollars among the platforms within the approved budget of $33M.

ATTACHMENT 3
Benefit Cost Analysis Results
Subprograms NJCT* SCT TRC PCT PAC RIM
Res Eff Products 1.7 2.3 0.7 7.7 0.9 0.6
Res Existing Homes 1.6 2.4 0.8 4.9 1.2 0.7
Res Behavior 2.2 2.6 1.2 n/a** 1.2 0.6
Res MF 1.3 2.4 0.7 n/a** 0.7 0.5
Income Eligible 1.2 1.8 0.5 n/a** 0.5 0.4
C&I Prescriptive 2.7 3.5 1.3 6.6 2.0 1.2
C&I Custom 3.0 4.7 1.5 6.9 2.1 1.3
C&I Small Non-Residential Efficiency 2.7 4.3 1.3 5.4 1.9 1.1
C&I Energy Management 1.8 4.0 1.3 8.7 1.4 1.0
C&I Engineered Solutions 1.8 3.0 0.9 5.3 1.1 0.9
Residential Programs 1.7 2.4 0.8 8.7 1.0 0.6
Commercial & Industrial Programs 2.5 3.7 1.2 6.1 1.8 1.1
Low Income Programs 1.2 1.8 0.5 n/a* 0.5 0.4
Total Portfolio 2.2 3.2 1.0 7.0 1.4 0.9
*- NJCT assumptions and calculations are consistent with the August 24th, 2020 order and subsequent guidance
**- PCT results for Res Behavior, Res MF, & Income Eligible are n/a as these subprograms are provided at no cost

ATTACHMENT 3
Cost-to-Achieve Savings Analysis
CEF-EE CTA
Electric ($/annualized kWh) Gas ($/annualized therm)
Guidance +/- 10%*
CEF-EE CTA Guidance +/-
10%* CEF-EE CTA
Residential Sector 0.29 - 0.35 0.19 7.82 - 9.56 2.06
Eff Products 0.32 3.42
Existing Homes 0.59 12.50
Behavior 0.05 0.68
C&I Sector 0.33 - 0.41 0.46 3.72 - 4.54 2.36
Prescriptive 0.45 0.16
Custom 0.31 2.46
Direct Install 0.27 1.94
Energy Management 0.17 3.16
Engineered Solutions 1.91 9.03
Multifamily Sector 1.09 - 1.33 0.35 16.82 - 20.56 2.54
Multifamily 0.35 2.54
Low Income Sector**
1.89 - 2.31 0.88 25.53 - 31.21 20.98
Income Eligible 0.88 20.98 * Guidance is based on Core Program Cost Guidelines established in the June 10th Board Order.
** Co-managed low income sector targets used for income eligible subprogram

ATTACHMENT 3
Values for the QPIs in years 1-3
Electric Results* PY1 (Jul21-Jun22)
PY2 (Jul22-Jun23)
PY3 (Jul23-Jun24)
Annual Energy Savings (kWh) 439,366,569 487,189,790 368,845,495
Annual Peak Demand Savings (MW) 38,277 50,580 41,190
Lifetime Energy Savings (kWh) 2,985,212,297 4,705,957,570 4,110,966,390
Lifetime Persistent Peak Demand Savings (MW) 376,882 634,685 525,044
Utility Cost Test (NPV of Benefits)** 1.43 1.43 1.43
Low-Income Lifetime Savings (kWh) 137,524,557 33,327,854 20,891,897
Small Business Lifetime Savings (kWh) 547,176,929 615,127,006 920,902,348
Gas Results* PY1 (Jul21-Jun22)
PY2 (Jul22-Jun23)
PY3 (Jul23-Jun24)
Annual Energy Savings (Therms) 12,425,905 19,736,673 11,701,416
Annual Peak Demand Savings*** - - -
Lifetime Energy Savings (Therms) 94,604,425 151,631,297 108,635,745
Lifetime Persistent Peak Demand Savings*** - - -
Utility Cost Test (NPV of Benefits)** 1.43 1.43 1.43
Low-Income Lifetime Savings (Therms) 13,104,732 18,229,550 11,427,375
Small Business Lifetime Savings (Therms) 2,162,032 2,430,520 3,638,714
* QPIs are based on July 2021 to June 2024 program years as established in the June 10th Board Order. Should PSE&G's program
year be changed to align with the schedule of its program, these values will be adjusted accordingly. Currently PY3 represents a
partial year of programs that would be supplemented with PSE&G’s second triennial program approval.
** The Utility Cost Test, also known as the Program Administrator Cost Test (PAC) result represents the result across the entire
program cycle.
*** The approach to calculating the Gas Peak Demand Savings has not yet been finalized. Collaboration with other utilities to
establish the appropriate methodology is ongoing.

Attachment 4
PSE&G Clean Energy Future Energy Efficiency Program Schedule SS-CEF-EE-1Weighted Average Cost of Capital (WACC)
Revenue Pre-TaxWeighted Conversion Weighted Discount
Percent Cost Cost Factor Cost RateLong Term Debt 45.53% 3.9567% 1.8017% 1.0000 1.8017%Custumer Deposits 0.47% 0.8700% 0.0041% 1.0000 0.0041%
Sub-total 46.00% 1.8058% 1.8058% 1.2982%
Common Equity 54.00% 9.60% 5.1836% 1.3910 7.2105% 5.1836%Total 100.00% 6.99% 9.02% 6.4818%
Monthly WACC 0.5825% 0.7514%
Reflects a tax rate of 28.11%

Attachment 4
PSE&G Clean Energy Future Energy Efficiency Program Schedule SS-CEF-EE-2EElectric Revenue Requirements Calculation Page 1 of 2
Monthly WACC effective 11/1/2018 0.75136%Inc. tax rate effective 11/1/2018 28.11%
(1) (2) (3) (4) (5) (6) (7) (8) (9) (10) (11) (12)
PSE&G Program Investment
Program Investment
from/to Partner utility
Capitalized IT Costs Gross Plant
PSE&G + Partner Utility
Program Investment
AmortizationIT Cost
Amortization Accumulated Amortization Net Plant Tax Depreciation
Book Depreciation
Tax BasisDeferred Income
Tax
Beginning Acumulated
Deferred Income Tax
Monthly Calculation
Jan-20 - - - - - - - - - - - - Feb-20 - - - - - - - - - - - - Mar-20 - - - - - - - - - - - - Apr-20 - - - - - - - - - - - -
May-20 - - - - - - - - - - - - Jun-20 - - - - - - - - - - - - Jul-20 - - - - - - - - - - - -
Aug-20 - - - - - - - - - - - - Sep-20 - - - - - - - - - - - - Oct-20 1,176,140 - - 1,176,140 4,901 - 4,901 1,171,239 1,127,626 4,895 79,826 - Nov-20 1,130,607 - - 2,306,746 14,512 - 19,413 2,287,334 1,082,291 14,298 75,934 79,826 Dec-20 1,148,983 - - 3,455,729 24,010 - 43,423 3,412,306 1,100,865 23,588 76,594 155,760 Jan-21 1,594,628 - - 5,050,357 35,442 - 78,865 4,971,492 1,570,964 34,815 109,220 232,355 Feb-21 1,631,273 - - 6,681,630 48,883 - 127,748 6,553,882 1,607,708 48,152 110,884 341,575 Mar-21 1,669,128 - 1,079,699 9,430,457 62,635 8,997 199,381 9,231,076 1,675,654 70,797 114,105 452,459 Apr-21 5,557,437 - - 14,987,893 92,746 17,995 310,121 14,677,772 2,736,810 111,421 186,665 566,565
May-21 5,557,437 - - 20,545,330 139,058 17,995 467,174 20,078,156 2,750,365 147,412 185,070 753,230 Jun-21 5,575,813 - 538,053 26,659,196 185,446 22,479 675,099 25,984,097 2,797,243 187,964 185,520 938,300 Jul-21 5,558,892 - - 32,218,088 231,841 26,963 933,902 31,284,186 4,025,683 227,541 270,048 1,123,820
Aug-21 14,067,634 - - 46,285,723 313,618 17,965 1,265,485 45,020,238 9,797,815 294,631 675,676 1,393,868 Sep-21 15,544,425 - 4,619,024 66,449,172 437,002 65,454 1,767,941 64,681,231 11,422,265 448,332 780,247 2,069,544
Program Assumption
Investment in Shared Service Territory shared
with Partner Utility
See WP-SS-CEF-EE-1.xlsx'ITCap-E' wksht
Prior Month + (Col 1 + Col 1a + Col 2)
See WP-SS-CEF-EE-1.xlsx
'BkTaxSum' wksht
See WP-SS-CEF-EE-1.xlsx
'BkTaxSum' wksht
Prior Month + (Col 4 + Col 5) Col 3 - Col 6
See WP-SS-CEF-EE-1.xlsx
'BkTaxSum' wksht
See WP-SS-CEF-EE-1.xlsx
'BkTaxSum' wksht
See WP-SS-CEF-EE-1.xlsx
'BkTaxSum' wksht
See WP-SS-CEF-EE-1.xlsx
'BkTaxSum' wksht
Annual Summary
2019 - - - - - - - - - - - - 2020 3,455,729 - - 3,455,729 43,423 - 43,423 3,412,306 3,310,782 42,782 232,355 155,760 2021 99,654,053 - 10,863,771 113,973,553 3,588,398 523,761 4,155,583 109,817,970 69,063,488 3,692,730 4,647,861 4,211,396 2022 239,530,305 - 12,478,752 365,982,611 20,957,581 3,360,096 28,473,260 337,509,350 162,949,482 21,538,237 10,054,340 13,986,581 2023 279,773,822 - 3,218,796 648,975,229 46,558,204 5,043,982 80,075,446 568,899,782 189,887,627 44,811,604 10,314,905 24,164,264 2024 125,289,009 - - 774,264,237 70,371,913 5,312,264 155,759,623 618,504,614 71,713,143 68,084,403 258,003 25,591,912 2025 32,434,923 - - 806,699,160 76,457,933 5,312,264 237,529,820 569,169,340 48,486,675 83,158,064 (2,465,136) 23,291,523 2026 7,938,174 - - 814,637,334 78,456,999 4,865,553 320,852,372 493,784,962 46,648,952 93,434,179 (3,326,430) 20,008,840 2027 - - - 814,637,334 78,807,601 1,901,990 401,561,963 413,075,371 - 47,278,621 (3,361,510) 16,628,966 2028 - - - 814,637,334 78,807,601 241,410 480,610,974 334,026,360 - 45,618,041 (3,243,443) 13,379,802 2029 - - - 814,637,334 78,807,601 - 559,418,576 255,218,758 - 45,376,631 (3,226,278) 10,153,524 2030 - - - 814,637,334 78,764,179 - 638,182,754 176,454,580 - 45,335,035 (3,223,321) 6,928,568 2031 - - - 814,637,334 75,219,203 - 713,401,957 101,235,377 - 42,878,837 (3,048,685) 3,842,556 2032 - - - 814,637,334 57,850,020 - 771,251,977 43,385,356 - 31,337,150 (2,228,071) 1,525,463 2033 - - - 814,637,334 32,249,397 - 803,501,375 11,135,959 - 15,296,581 (1,087,587) 337,153 2034 - - - 814,637,334 8,435,688 - 811,937,063 2,700,271 - 3,153,014 (224,179) 82,627 2035 - - - 814,637,334 2,349,668 - 814,286,731 350,603 - 891,253 (63,368) 11,418 2036 - - - 814,637,334 350,603 - 814,637,334 - - 132,987 (9,455) - 2037 - - - 814,637,334 - - 814,637,334 - - - - - 2038 - - - 814,637,334 - - 814,637,334 - - - - - 2039 - - - 814,637,334 - - 814,637,334 - - - - - 2040 - - - 814,637,334 - - 814,637,334 - - - - - 2041 - - - 814,637,334 - - 814,637,334 - - - - - 2042 - - - 814,637,334 - - 814,637,334 - - - - - 2043 - - - 814,637,334 - - 814,637,334 - - - - - 2044 - - - 814,637,334 - - 814,637,334 - - - - - Total 788,076,014 - 26,561,319 788,076,014 26,561,319 592,060,149 592,060,149 (0)
Oct 20 - Sep 21 60,212,396 - 1,590,093 177,848 41,695,290 1,613,847 2,849,791

Attachment 4
Monthly Calculation
Jan-20Feb-20Mar-20Apr-20
May-20Jun-20Jul-20
Aug-20Sep-20Oct-20Nov-20Dec-20Jan-21Feb-21Mar-21Apr-21
May-21Jun-21Jul-21
Aug-21Sep-21
Annual Summary
20192020202120222023202420252026202720282029203020312032203320342035203620372038203920402041204220432044Total
Oct 20 - Sep 21
PSE&G Clean Energy Future Energy Efficiency Program Schedule SS-CEF-EE-2EElectric Revenue Requirements Calculation Page 2 of 2
Monthly WACC effective 11/1/2018 0.75136%Inc. tax rate effective 11/1/2018 28.11%
(13) (14) (15) (16) (17) (18) (19) (20) (21) (22)
Ending Acumulated
Deferred Income Tax
Average Net Investment Return Requirement
Program Investment Repayments Expenses Revenue Offsets Tax Flow-through
Tax Flow-Through Gross-up
Tax Adjustment on Loan
Revenue Requirements
- - - - - - - - - - - - - - - - - - - - - - - - - - - - - - - - - - - - - - - - - - - - - - - - - - - - - - - - - - - - - - - - - - - - - - - - - - - - - - - - - - - - - - - - - -
79,826 545,706 4,100 (1,002) 1,544,650 - (235,774) (92,191) (313) 1,224,371 155,760 1,611,493 12,108 (2,005) 1,544,650 - (224,278) (87,696) (546) 1,256,745 232,355 2,655,762 19,954 (3,007) 1,544,650 - (226,228) (88,458) (779) 1,270,142 341,575 3,904,934 29,340 (3,508) 1,544,650 - (322,591) (126,138) (856) 1,156,338 452,459 5,365,669 40,315 (4,010) 1,544,650 - (327,507) (128,060) (973) 1,173,299 566,565 7,382,967 55,473 (4,511) 1,544,650 - (337,020) (131,780) (1,089) 1,197,355 753,230 11,294,527 84,862 (65,398) 1,544,650 - (551,332) (215,578) (20,190) 887,755 938,300 16,532,199 124,216 (126,286) 1,544,650 - (546,620) (213,736) (34,662) 904,615
1,123,820 22,000,067 165,299 (187,173) 1,544,650 - (547,948) (214,256) (49,134) 919,363 1,393,868 27,375,298 205,687 (221,470) 1,693,621 - (797,610) (311,877) (55,226) 771,929 2,069,544 36,420,506 273,649 (313,233) 1,693,621 - (1,995,669) (780,334) (81,315) (871,699) 2,849,791 52,391,067 393,645 (404,997) 1,693,621 - (2,304,526) (901,102) (102,913) (1,123,818)
See WP-SS-CEF-EE-1.xlsx
'BkTaxSum' wksht
(Prev Col 7 - Col 11 + Col 7 - Col 12) / 2
Col 15* Monthly Pre Tax
WACC Program Assumption Program
Assumption Program
Assumption
See WP-SS-CEF-EE-1.xlsx
'BkTaxSum' wksht
See WP-SS-CEF-EE-1.xlsx
'BkTaxSum' wksht
See WP-SS-CEF-EE-1.xlsx
'BkTaxSum' wksht
Col 4 + Col 5 + Col 14 + Col 15 + Col 68 + Col 17 + Col 18 + Col 19 +
Col 20
- - - - - - - - - - 232,355 2,655,762 36,163 (6,014) 4,633,949 - (686,280) (268,345) (1,637) 3,751,257
4,880,216 96,342,826 3,219,489 (3,099,098) 19,429,621 - (13,727,859) (5,367,786) (785,349) 3,781,178 14,934,555 311,294,740 18,353,621 (18,386,694) 21,092,020 - (29,696,361) (11,611,695) (4,484,382) (415,814) 25,249,460 530,542,055 37,834,675 (41,320,776) 16,667,803 - (30,465,965) (11,912,620) (9,713,815) 12,691,488 25,507,464 593,032,269 52,976,305 (72,606,000) 7,731,777 - (762,035) (297,967) (17,383,587) 45,342,670 23,042,328 548,677,208 51,433,652 (93,135,722) 2,880,357 - 7,280,992 2,846,970 (23,915,657) 29,160,789 19,715,898 477,375,614 46,027,738 (105,755,396) 1,040,221 - 9,824,898 3,841,673 (28,364,957) 9,936,727 16,354,388 399,907,578 39,237,031 - 516,795 - 9,928,510 3,882,187 13,071,979 147,346,094 13,110,946 324,064,636 32,346,228 - 422,115 - 9,579,789 3,745,832 13,071,979 138,214,954 9,884,667 248,483,313 25,527,377 - 249,541 - 9,529,093 3,726,009 13,071,979 130,911,600 6,661,346 172,931,267 18,713,060 - 94,352 - 9,520,357 3,722,593 13,071,265 123,885,806 3,612,661 100,391,324 11,984,336 - 97,182 - 9,004,556 3,520,908 12,645,538 112,471,722 1,384,590 43,838,449 6,121,047 - 100,098 - 6,580,801 2,573,186 10,366,905 83,592,057
297,003 11,577,462 2,179,155 - 103,101 - 3,212,282 1,256,047 6,628,789 45,628,772 72,824 2,804,292 518,269 - 52,312 - 662,133 258,903 2,065,600 11,992,905 9,455 376,549 109,011 - - - 187,163 73,183 570,261 3,289,286
- - 9,503 - - - 27,927 10,920 85,091 484,044 - - 0 - - - - - - 0 - - 0 - - - - - - 0 - - 0 - - - - - - 0 - - 0 - - - - - - 0 - - 0 - - - - - - 0 - - 0 - - - - - - 0 - - 0 - - - - - - 0 - - - - - - - - - -
346,626,660 (334,309,700) 75,111,241 - (0) 0 (0) 902,065,534
1,408,648 (1,336,600) 18,982,707 - (8,417,103) (3,291,206) (347,994) 8,766,394

Attachment 4
PSE&G Clean Energy Future Energy Efficiency Program Schedule SS-CEF-EE-2GGas Revenue Requirements Calculation Page 1 of 2
Monthly WACC effective 11/1/2018 0.75136%Inc. tax rate effective 11/1/2018 28.11%
(1) (1a) (2) (3) (4) (5) (6) (7) (8) (9) (10) (11)
PSE&G Program Investment
Program Investment
from/to Partner utility
Capitalized IT Costs Gross Plant
PSE&G + Partner Utility
Program Investment
AmortizationIT Cost
Amortization Accumulated Amortization Net Plant Tax Depreciation
Book Depreciation
Tax BasisDeferred Income
Tax
Beginning Acumulated
Deferred Income Tax
Monthly Calculation
Jan-20 - - - - - - - - - - - - Feb-20 - - - - - - - - - - - - Mar-20 - - - - - - - - - - - - Apr-20 - - - - - - - - - - - -
May-20 - - - - - - - - - - - - Jun-20 - - - - - - - - - - - - Jul-20 - - - - - - - - - - - -
Aug-20 - - - - - - - - - - - - Sep-20 - - - - - - - - - - - - Oct-20 507,155 - - 507,155 2,113 - 2,113 505,042 462,150 2,496 32,681 - Nov-20 485,728 - - 992,884 6,250 - 8,363 984,520 441,295 6,825 30,891 32,681 Dec-20 494,376 - - 1,487,259 10,334 - 18,697 1,468,562 450,515 11,101 31,242 63,572 Jan-21 899,980 - - 2,387,240 16,144 - 34,841 2,352,399 879,194 16,912 61,308 94,815 Feb-21 880,082 - - 3,267,322 23,561 - 58,402 3,208,920 859,583 24,425 59,380 156,123 Mar-21 890,199 - 269,897 4,427,418 30,937 2,249 91,588 4,335,830 877,483 34,147 59,961 215,503 Apr-21 1,020,595 - - 5,448,013 38,898 4,498 134,984 5,313,028 912,406 45,268 61,654 275,464
May-21 1,020,595 - - 6,468,608 47,403 4,498 186,886 6,281,722 913,910 54,278 61,120 337,117 Jun-21 1,029,242 - 134,499 7,632,349 55,944 5,619 248,450 7,383,900 927,797 64,446 61,384 398,237 Jul-21 1,461,993 - - 9,094,343 66,325 6,740 321,514 8,772,829 1,199,440 77,834 79,746 459,621
Aug-21 3,878,186 - - 12,972,529 88,575 4,491 414,580 12,557,949 3,064,136 103,753 210,483 539,368 Sep-21 4,573,146 - 1,154,637 18,700,312 123,789 16,362 554,731 18,145,580 3,801,799 154,412 259,329 749,851
Program Assumption
Investment in Shared Service Territory shared
with Partner Utility
See WP-SS-CEF-EE-1.xlsx'ITCap-E' wksht
Prior Month + (Col 1 + Col 1a + Col 2)
See WP-SS-CEF-EE-1.xlsx
'BkTaxSum' wksht
See WP-SS-CEF-EE-1.xlsx
'BkTaxSum' wksht
Prior Month + (Col 4 + Col 5) Col 3 - Col 6
See WP-SS-CEF-EE-1.xlsx
'BkTaxSum' wksht
See WP-SS-CEF-EE-1.xlsx
'BkTaxSum' wksht
See WP-SS-CEF-EE-1.xlsx
'BkTaxSum' wksht
See WP-SS-CEF-EE-1.xlsx
'BkTaxSum' wksht
Annual Summary
2019 - - - - - - - - - - - - 2020 1,487,259 - - - 18,697 - - 18,697 1,353,960 20,422 94,815 31,242 2021 27,250,846 - 2,715,662 1,156,629 1,066,868 130,927 35,622 1,216,492 22,841,563 1,301,031 1,531,532 198,903 2022 62,141,088 - 3,119,366 402,312 5,581,838 839,937 93,898 7,638,267 49,804,758 7,000,332 3,043,395 291,141 2023 80,242,992 - 804,616 - 12,679,129 1,260,865 110,661 21,578,261 61,319,860 14,977,401 3,294,949 322,589 2024 24,802,695 - - - 18,337,416 1,327,929 110,661 41,243,606 17,902,923 20,885,185 (212,039) 2,764 2025 15,263,493 - - - 20,386,672 1,327,929 110,661 62,958,207 15,160,029 23,770,732 (612,221) (69,327) 2026 3,735,611 - - - 21,327,409 1,216,262 84,677 85,501,878 11,733,070 25,589,120 (985,165) (90,141) 2027 - - - - 21,492,399 475,448 20,115 107,469,725 - 14,673,001 (1,043,250) (85,551) 2028 - - - - 21,492,399 60,346 - 129,022,470 - 14,257,899 (1,013,737) (84,121) 2029 - - - - 21,492,399 - - 150,514,869 - 14,197,553 (1,009,446) (84,121) 2030 - - - - 21,473,701 - - 171,988,570 - 14,180,565 (1,008,238) (83,453) 2031 - - - - 20,425,531 - - 192,414,101 - 13,274,221 (943,797) (70,960) 2032 - - - - 15,910,561 - - 208,324,661 - 9,694,892 (689,307) (43,815) 2033 - - - - 8,813,269 - - 217,137,931 - 4,613,887 (328,047) (11,461) 2034 - - - - 3,154,983 - - 220,292,913 - 1,197,926 (85,173) (4,613) 2035 - - - - 1,105,726 - - 221,398,640 - 419,413 (29,820) (924) 2036 - - - - 164,989 - - 221,563,629 - 62,582 (4,450) - 2037 - - - - - - - 221,563,629 - - - - 2038 - - - - - - - 221,563,629 - - - - 2039 - - - - - - - 221,563,629 - - - - 2040 - - - - - - - 221,563,629 - - - - 2041 - - - - - - - 221,563,629 - - - - 2042 - - - - - - - 221,563,629 - - - - 2043 - - - - - - - 221,563,629 - - - - 2044 - - - - - - - 221,563,629 - - - - Total 214,923,986 - 6,639,644 214,923,986 6,639,644 180,116,163 180,116,163 (0)
Oct 20 - Sep 21 17,141,279 - 510,274 44,457 14,789,709 595,897 1,009,180

Attachment 4
Monthly Calculation
Jan-20Feb-20Mar-20Apr-20
May-20Jun-20Jul-20
Aug-20Sep-20Oct-20Nov-20Dec-20Jan-21Feb-21Mar-21Apr-21
May-21Jun-21Jul-21
Aug-21Sep-21
Annual Summary
20192020202120222023202420252026202720282029203020312032203320342035203620372038203920402041204220432044Total
Oct 20 - Sep 21
PSE&G Clean Energy Future Energy Efficiency Program Schedule SS-CEF-EE-2GGas Revenue Requirements Calculation Page 2 of 2
Monthly WACC effective 11/1/2018 0.75136%Inc. tax rate effective 11/1/2018 28.11%
(12) (13) (14) (15) (16) (17) (18) (19) (20) (21)
Ending Acumulated
Deferred Income Tax
Average Net Investment Return Requirement
Program Investment Repayments Expenses Revenue Offsets Tax Flow-through
Tax Flow-Through Gross-up
Tax Adjustment on Loan
Revenue Requirements
- - - - - - - - - - - - - - - - - - - - - - - - - - - - - - - - - - - - - - - - - - - - - - - - - - - - - - - - - - - - - - - - - - - - - - - - - - - - - - - - -
32,681 236,180 1,775 (1,325) 524,340 (96,527) (37,744) (444) 392,188 63,572 696,654 5,234 (2,650) 524,340 (91,239) (35,676) (814) 405,446 94,815 1,147,348 8,621 (3,976) 524,340 (92,277) (36,082) (1,183) 409,777
156,123 1,785,012 13,412 (4,638) 524,340 (181,079) (70,805) (1,331) 296,043 215,503 2,594,847 19,497 (5,301) 524,340 (175,383) (68,577) (1,516) 316,620 275,464 3,526,892 26,500 (5,964) 524,340 (177,101) (69,249) (1,701) 330,012 337,117 4,518,139 33,947 (9,446) 524,340 (182,099) (71,203) (2,830) 336,106 398,237 5,429,698 40,796 (12,928) 524,340 (180,523) (70,587) (3,801) 349,199 459,621 6,403,881 48,116 (16,411) 524,340 (181,304) (70,892) (4,773) 360,640 539,368 7,578,870 56,944 (24,681) 572,406 (235,537) (92,098) (7,348) 342,750 749,851 10,020,779 75,292 (49,296) 572,406 (621,681) (243,086) (15,130) (188,429)
1,009,180 14,472,249 108,738 (73,912) 572,406 (765,951) (299,498) (21,997) (340,062)
See WP-SS-CEF-EE-1.xlsx
'BkTaxSum' wksht
(Prev Col 7 - Col 11 + Col 7 - Col 12) / 2
Col 15* Monthly Pre Tax
WACC Program Assumption Program
Assumption Program
Assumption
See WP-SS-CEF-EE-1.xlsx
'BkTaxSum' wksht
See WP-SS-CEF-EE-1.xlsx
'BkTaxSum' wksht
See WP-SS-CEF-EE-1.xlsx
'BkTaxSum' wksht
Col 4 + Col 5 + Col 14 + Col 15 + Col 68 + Col 17 + Col 18 + Col 19 +
Col 20
- - - - - - - - - - 63,572 94,815 15,630 (7,951) 1,573,020 - (280,043) (109,501) (2,441) 1,207,411
1,427,443 1,626,346 932,227 (571,464) 6,580,479 - (4,523,512) (1,768,757) (167,326) 1,679,442 4,378,600 4,669,741 4,807,551 (3,838,899) 7,087,828 - (8,988,929) (3,514,798) (1,079,090) 895,437 7,642,101 7,964,690 10,192,106 (9,570,699) 5,806,282 - (9,731,917) (3,805,316) (2,531,908) 4,298,543 7,749,887 7,752,651 13,610,437 (15,185,839) 2,687,298 - 626,275 244,882 (3,850,726) 17,797,672 7,209,757 7,140,430 13,621,233 (20,065,205) 784,992 - 1,808,248 707,050 (5,261,748) 13,309,172 6,245,406 6,155,265 12,535,441 (23,708,399) 260,028 - 2,909,771 1,137,761 (6,457,973) 9,220,301 5,197,565 5,112,015 10,764,574 - 129,185 - 3,081,330 1,204,843 2,852,387 40,000,167 4,182,398 4,098,278 8,898,731 - 105,518 - 2,994,159 1,170,758 2,852,387 37,574,297 3,172,952 3,088,832 7,050,873 - 62,379 - 2,981,486 1,165,803 2,852,387 35,605,327 2,164,047 2,080,594 5,204,208 - 23,585 - 2,977,919 1,164,408 2,851,719 33,695,540 1,207,756 1,136,797 3,385,371 - 24,293 - 2,787,586 1,089,985 2,796,263 30,509,029
491,305 447,490 1,795,788 - 25,022 - 2,035,927 796,076 2,430,414 22,993,788 130,903 119,442 712,780 - 25,773 - 968,916 378,860 1,642,017 12,541,616 38,883 34,270 231,028 - 13,077 - 251,564 98,365 765,237 4,514,254 5,373 4,450 51,299 - - - 88,077 34,439 268,358 1,547,899
- - 4,472 - - - 13,142 5,139 40,043 227,785 - - (0) - - - - - - (0) - - (0) - - - - - - (0) - - (0) - - - - - - (0) - - (0) - - - - - - (0) - - (0) - - - - - - (0) - - (0) - - - - - - (0) - - (0) - - - - - - (0) - - - - - - - - - -
93,813,750 (72,948,457) 25,188,759 - 0 0 (0) 267,617,681
438,873 (210,528) 6,436,280 - (2,980,701) (1,165,496) (62,868) 3,010,291

Attachment 4
PSE&G Clean Energy Future Energy Efficiency Program Schedule SS-CEF-EE-3Proposed Rate Calculations($'s Unless Specified)
Current SUT Rate 6.625%
Line Date(s) Electric Gas Source/Description
1 Oct 20 - Sep 21
Revenue Requirements 8,766,394 3,010,291 SS-2E/G, Col 23
2 Oct 20 - Sep 21 Forecasted ($/kWh or $/Therm) 40,681,934 2,852,756
3 Proposed Rate w/o SUT ($/kWh or $/Therm) 0.000215 0.001055 Line 1 / Line 2 [Rnd 6)
4 Public Notice Rate w/o SUT ($/kWh) 0.000215 0.001055 Line 3
5 Proposed Rate w/ SUT ($/kWh or $/Therm) 0.000229 0.001125 (Line 3 * (1 + SUT Rate)) [Rnd 6]
6 Existing Rate w/o SUT ($/kWh or $/Therm) 0.000000 0.000000
7 Difference in Proposed and Existing Rate 0.000215 0.001055 (Line 3 - Line 6)
8 Resultant CEF-EE Program Revenue Increase / (Decrease) 8,746,616 3,009,657 (Line 2 * Line 7 * 1,000)

Attachment 4
PSE&G Clean Energy Future Energy Efficiency Program Schedule SS-CEF-EE-4E
Electric GPRC Recovery Charge (GPRC) - Rate Impact Analysis6,920 Avg RS kWh / yr.
740 Avg RS kWh / Summer Month6.625% SUT Rate effective 1/1/2018 495 Avg RS kWh / Winter Month
40,681,934 kWh Sales (000) - Oct 20 - Sep 2140,681,934 kWh Sales (000) - Oct 20 - thereafter 0.001901 Current electric GPRC ($/kWh)
(1) (2) (3) (4) (5) (6) (7) (8) (9) (10) (11) (12) (13) (14) (15) (16)Typical RS GPRC ($)
Electric CEF-EE Revenue
Requirements 2
ElectricCEF-EEC w/o SUT ($/kWh)
Electric CEF-EEC
w/ SUT ($/kWh)3 RS RHS RLM GLP LPL-S LPL-P HTS-S
SummerMonthly
Bill
WinterMonthly
Bill Annual Bill
Change in RS Typical Annual Bill
($'s)
RS Typical Annual Bill
($'s) 3
% Change in RS Typical Annual Bill
Current 0.189699 0.143870 0.188949 0.168403 0.130598 0.105895 0.090674 1.41 0.94 13.16 1,312.72 Oct 20 - Sep 21 8,766,394 0.000215 0.000229 0.189928 0.144099 0.189178 0.168632 0.130827 0.106124 0.090903 1.58 1.05 14.72 $1.56 1,314.28 0.12%Oct 21 - Sep 22 (2,310,773) (0.000057) (0.000061) 0.189638 0.143809 0.188888 0.168342 0.130537 0.105834 0.090613 1.36 0.91 12.72 -$0.44 1,312.28 -0.03%Oct 22 - Sep 23 11,493,290 0.000283 0.000302 0.190001 0.144172 0.189251 0.168705 0.130900 0.106197 0.090976 1.63 1.09 15.24 $2.08 1,314.80 0.16%Oct 23 - Sep 24 35,878,508 0.000882 0.000940 0.190639 0.144810 0.189889 0.169343 0.131538 0.106835 0.091614 2.10 1.41 19.68 $6.52 1,319.24 0.50%Oct 24 - Sep 25 36,083,142 0.000887 0.000946 0.190645 0.144816 0.189895 0.169349 0.131544 0.106841 0.091620 2.11 1.41 19.72 $6.56 1,319.28 0.50%Oct 25 - Sep 26 12,344,026 0.000303 0.000323 0.190022 0.144193 0.189272 0.168726 0.130921 0.106218 0.090997 1.65 1.10 15.40 $2.24 1,314.96 0.17%Oct 26 - Sep 27 113,476,801 0.002789 0.002974 0.192673 0.146844 0.191923 0.171377 0.133572 0.108869 0.093648 3.61 2.41 33.72 $20.56 1,333.28 1.57%Oct 27 - Sep 28 140,246,121 0.003447 0.003675 0.193374 0.147545 0.192624 0.172078 0.134273 0.109570 0.094349 4.13 2.76 38.60 $25.44 1,338.16 1.94%Oct 28 - Sep 29 132,693,551 0.003262 0.003478 0.193177 0.147348 0.192427 0.171881 0.134076 0.109373 0.094152 3.98 2.66 37.20 $24.04 1,336.76 1.83%Oct 29 - Sep 30 125,644,735 0.003088 0.003293 0.192992 0.147163 0.192242 0.171696 0.133891 0.109188 0.093967 3.84 2.57 35.92 $22.76 1,335.48 1.73%Oct 30 - Sep 31 116,766,520 0.002870 0.003060 0.192759 0.146930 0.192009 0.171463 0.133658 0.108955 0.093734 3.67 2.46 34.36 $21.20 1,333.92 1.61%Oct 31 - Sep 32 92,363,341 0.002270 0.002420 0.192119 0.146290 0.191369 0.170823 0.133018 0.108315 0.093094 3.20 2.14 29.92 $16.76 1,329.48 1.28%Oct 32 - Sep 33 55,444,874 0.001363 0.001453 0.191152 0.145323 0.190402 0.169856 0.132051 0.107348 0.092127 2.48 1.66 23.20 $10.04 1,322.76 0.76%Oct 33 - Sep 34 17,734,940 0.000436 0.000465 0.190164 0.144335 0.189414 0.168868 0.131063 0.106360 0.091139 1.75 1.17 16.36 $3.20 1,315.92 0.24%Oct 34 - Sep 35 4,558,249 0.000112 0.000119 0.189818 0.143989 0.189068 0.168522 0.130717 0.106014 0.090793 1.49 1.00 13.96 $0.80 1,313.52 0.06%Oct 35 - Sep 36 854,834 0.000021 0.000022 0.189721 0.143892 0.188971 0.168425 0.130620 0.105917 0.090696 1.42 0.95 13.28 $0.12 1,312.84 0.01%Oct 36 - Sep 37 26,982 0.000001 0.000001 0.189700 0.143871 0.188950 0.168404 0.130599 0.105896 0.090675 1.41 0.94 13.16 $0.00 1,312.72 0.00%Oct 37 - Sep 38 0 - - 0.189699 0.143870 0.188949 0.168403 0.130598 0.105895 0.090674 1.41 0.94 13.16 $0.00 1,312.72 0.00%Oct 38 - Sep 39 0 - - 0.189699 0.143870 0.188949 0.168403 0.130598 0.105895 0.090674 1.41 0.94 13.16 $0.00 1,312.72 0.00%Oct 39 - Sep 40 0 - - 0.189699 0.143870 0.188949 0.168403 0.130598 0.105895 0.090674 1.41 0.94 13.16 $0.00 1,312.72 0.00%Oct 40 - Sep 41 0 - - 0.189699 0.143870 0.188949 0.168403 0.130598 0.105895 0.090674 1.41 0.94 13.16 $0.00 1,312.72 0.00%Oct 41 - Sep 42 0 - - 0.189699 0.143870 0.188949 0.168403 0.130598 0.105895 0.090674 1.41 0.94 13.16 $0.00 1,312.72 0.00%Oct 42 - Sep 43 0 - - 0.189699 0.143870 0.188949 0.168403 0.130598 0.105895 0.090674 1.41 0.94 13.16 $0.00 1,312.72 0.00%Oct 43 - Sep 44 0 - - 0.189699 0.143870 0.188949 0.168403 0.130598 0.105895 0.090674 1.41 0.94 13.16 $0.00 1,312.72 0.00%
From Schedule SS-CEF-EE-2E
Col 23
Col 1 / [kWh Sales] (Rnd
to 6 dec.)
Col 2 * (1 + SUT Rate) Rnd 6
(Cur. eGPRC +
Col 3) * Avg RS kWh Sum Mo Rnd 2
(Cur. eGPRC +
Col 3) * Avg RS kWh Win MoRnd 2
(4 * Col 11) +
(8 * Col 12)
Col 13 - CurrentCol 13
CurrentCol 15 +Col 14
Col 14 /Current Col
15Rnd 4
RS RHS RLM GLP LPL-S LPL-P HTS-SApr 19 - Sep 20 0.00% 0.00% 0.00% 0.00% 0.00% 0.00% 0.00%Oct 20 - Sep 21 0.12% 0.16% 0.12% 0.14% 0.18% 0.22% 0.25%Oct 21 - Sep 22 -0.03% -0.04% -0.03% -0.04% -0.05% -0.06% -0.07%Oct 22 - Sep 23 0.16% 0.21% 0.16% 0.18% 0.23% 0.29% 0.33%Oct 23 - Sep 24 0.50% 0.65% 0.50% 0.56% 0.72% 0.89% 1.04%Oct 24 - Sep 25 0.50% 0.66% 0.50% 0.56% 0.72% 0.89% 1.04%Oct 25 - Sep 26 0.17% 0.22% 0.17% 0.19% 0.25% 0.31% 0.36%Oct 26 - Sep 27 1.57% 2.07% 1.57% 1.77% 2.28% 2.81% 3.28%Oct 27 - Sep 28 1.94% 2.55% 1.94% 2.18% 2.81% 3.47% 4.05%Oct 28 - Sep 29 1.83% 2.42% 1.84% 2.07% 2.66% 3.28% 3.84%Oct 29 - Sep 30 1.74% 2.29% 1.74% 1.96% 2.52% 3.11% 3.63%Oct 30 - Sep 31 1.61% 2.13% 1.62% 1.82% 2.34% 2.89% 3.37%Oct 31 - Sep 32 1.28% 1.68% 1.28% 1.44% 1.85% 2.29% 2.67%Oct 32 - Sep 33 0.77% 1.01% 0.77% 0.86% 1.11% 1.37% 1.60%Oct 33 - Sep 34 0.25% 0.32% 0.25% 0.28% 0.36% 0.44% 0.51%Oct 34 - Sep 35 0.06% 0.08% 0.06% 0.07% 0.09% 0.11% 0.13%Oct 35 - Sep 36 0.01% 0.02% 0.01% 0.01% 0.02% 0.02% 0.02%Oct 36 - Sep 37 0.00% 0.00% 0.00% 0.00% 0.00% 0.00% 0.00%Oct 37 - Sep 38 0.00% 0.00% 0.00% 0.00% 0.00% 0.00% 0.00%Oct 38 - Sep 39 0.00% 0.00% 0.00% 0.00% 0.00% 0.00% 0.00%Oct 39 - Sep 40 0.00% 0.00% 0.00% 0.00% 0.00% 0.00% 0.00%Oct 40 - Sep 41 0.00% 0.00% 0.00% 0.00% 0.00% 0.00% 0.00%Oct 41 - Sep 42 0.00% 0.00% 0.00% 0.00% 0.00% 0.00% 0.00%Oct 42 - Sep 43 0.00% 0.00% 0.00% 0.00% 0.00% 0.00% 0.00%
1 All customers assumed to have BGS Supply2 Initial Rate period is October 2020 to September 2021 for the CEF-EE Program 3 SUT is assumed at the current SUT rate effective January 1, 2018 through the life of the Program4 The rates are based on a typical residential bill as of September 1, 2020
Class Average Rate w/SUT - $/kWh 1
Current Class Avg Rate + Col 3 for Each Rate Class (Col 4 thru Col 11)
% Change from Current Class Average Rate w/SUT

Attachment 4
PSE&G Clean Energy Future Energy Efficiency Program Schedule SS-CEF-EE-4G
Gas GPRC Recovery Charge (GPRC) - Rate Impact Analysis
1,040 Typical RSG Therms / yr.6.625% SUT Rate effective 1/1/2018 0.004361 Current gas GPRC ($/therm)
2,852,756 Therm Sales (000) 172 89 29 Monthly Therms2,852,756 Therm Sales (000) 4 2 6 # of Months/year
(1) (2) (3) (4) (5) (6) (7) (8) (9) (10) (11) (12) (13) (14) (15) (16)Typical RSG GPRC ($)
Gas CEF-EE Revenue
Requirements 2
GasCEF-EEC w/o SUT ($/therm)
GasCEF-EEC
w/ SUT ($/therm) 3 RSG GSG LVG TSG-F TSG-NF CIGDec-Mar
Monthly BillNov & Apr
Monthly BillMay-Oct
Monthly Bill Annual Bill
Change in RSG Typcial Annual Bill
($'s)
RSG Typical Annual Bill
($'s)4
% Change in RSG Typical Annual Bill
Current 0.839154 0.905645 0.728062 0.614771 0.570814 0.413154 0.75 0.39 0.13 4.56 872.72Oct 20 - Sep 21 3,010,291 0.001055 0.001125 0.840279 0.906770 0.729187 0.615896 0.571939 0.414209 0.94 0.49 0.16 5.70 $1.14 873.86 0.13%Oct 21 - Sep 22 339,194 0.000119 0.000127 0.839281 0.905772 0.728189 0.614898 0.570941 0.413273 0.77 0.40 0.13 4.66 $0.10 872.82 0.01%Oct 22 - Sep 23 3,657,933 0.001282 0.001367 0.840521 0.907012 0.729429 0.616138 0.572181 0.414436 0.99 0.51 0.17 6.00 $1.44 874.16 0.17%Oct 23 - Sep 24 14,760,013 0.005174 0.005517 0.844671 0.911162 0.733579 0.620288 0.576331 0.418328 1.70 0.88 0.29 10.30 $5.74 878.46 0.66%Oct 24 - Sep 25 14,685,113 0.005148 0.005489 0.844643 0.911134 0.733551 0.620260 0.576303 0.418302 1.69 0.88 0.29 10.26 $5.70 878.42 0.65%Oct 25 - Sep 26 9,791,235 0.003432 0.003659 0.842813 0.909304 0.731721 0.618430 0.574473 0.416586 1.38 0.71 0.23 8.32 $3.76 876.48 0.43%Oct 26 - Sep 27 32,421,115 0.011365 0.012118 0.851272 0.917763 0.740180 0.626889 0.582932 0.424519 2.83 1.47 0.48 17.14 $12.58 885.30 1.44%Oct 27 - Sep 28 38,117,867 0.013362 0.014247 0.853401 0.919892 0.742309 0.629018 0.585061 0.426516 3.20 1.66 0.54 19.36 $14.80 887.52 1.70%Oct 28 - Sep 29 36,086,599 0.012650 0.013488 0.852642 0.919133 0.741550 0.628259 0.584302 0.425804 3.07 1.59 0.52 18.58 $14.02 886.74 1.61%Oct 29 - Sep 30 34,181,256 0.011982 0.012776 0.851930 0.918421 0.740838 0.627547 0.583590 0.425136 2.95 1.53 0.50 17.86 $13.30 886.02 1.52%Oct 30 - Sep 31 31,682,744 0.011106 0.011842 0.850996 0.917487 0.739904 0.626613 0.582656 0.424260 2.79 1.44 0.47 16.86 $12.30 885.02 1.41%Oct 31 - Sep 32 25,257,132 0.008854 0.009441 0.848595 0.915086 0.737503 0.624212 0.580255 0.422008 2.37 1.23 0.40 14.34 $9.78 882.50 1.12%Oct 32 - Sep 33 15,335,201 0.005376 0.005732 0.844886 0.911377 0.733794 0.620503 0.576546 0.418530 1.74 0.90 0.29 10.50 $5.94 878.66 0.68%Oct 33 - Sep 34 5,731,956 0.002009 0.002142 0.841296 0.907787 0.730204 0.616913 0.572956 0.415163 1.12 0.58 0.19 6.78 $2.22 874.94 0.25%Oct 34 - Sep 35 2,145,058 0.000752 0.000802 0.839956 0.906447 0.728864 0.615573 0.571616 0.413906 0.89 0.46 0.15 5.38 $0.82 873.54 0.09%Oct 35 - Sep 36 402,275 0.000141 0.000150 0.839304 0.905795 0.728212 0.614921 0.570964 0.413295 0.78 0.40 0.13 4.70 $0.14 872.86 0.02%Oct 36 - Sep 37 12,697 0.000004 0.000004 0.839158 0.905649 0.728066 0.614775 0.570818 0.413158 0.75 0.39 0.13 4.56 $0.00 872.72 0.00%Oct 37 - Sep 38 (0) - - 0.839154 0.905645 0.728062 0.614771 0.570814 0.413154 0.75 0.39 0.13 4.56 $0.00 872.72 0.00%Oct 38 - Sep 39 (0) - - 0.839154 0.905645 0.728062 0.614771 0.570814 0.413154 0.75 0.39 0.13 4.56 $0.00 872.72 0.00%Oct 39 - Sep 40 (0) - - 0.839154 0.905645 0.728062 0.614771 0.570814 0.413154 0.75 0.39 0.13 4.56 $0.00 872.72 0.00%Oct 40 - Sep 41 (0) - - 0.839154 0.905645 0.728062 0.614771 0.570814 0.413154 0.75 0.39 0.13 4.56 $0.00 872.72 0.00%Oct 41 - Sep 42 (0) - - 0.839154 0.905645 0.728062 0.614771 0.570814 0.413154 0.75 0.39 0.13 4.56 $0.00 872.72 0.00%Oct 42 - Sep 43 (0) - - 0.839154 0.905645 0.728062 0.614771 0.570814 0.413154 0.75 0.39 0.13 4.56 $0.00 872.72 0.00%Oct 43 - Sep 44 (0) - - 0.839154 0.905645 0.728062 0.614771 0.570814 0.413154 0.75 0.39 0.13 4.56 $0.00 872.72 0.00%
From Schedule SS-CEF-EE-2G
Col 23
Col 1 / Therm Sales
Col 2 * (1 + SUT Rate) Rnd 6
(Cur. GPRC + Col 3) * Dec-Mar Monthly ThermsRnd 2
(Cur. GPRC + Col 3) * Nov & Apr Monthly ThermsRnd 2
(Cur. GPRC + Col 3) * May-Oct Monthly ThermsRnd 2
(4 * Col 10) +
( 2 * Col 11) +
(6 * Col 12)
Col 13 - CurrentCol 13
CurrentCol 15 +Col 14
Col 14 /Current Col
15Rnd 4
RSG GSG LVG TSG-F TSG-NF CIGApr 19 - Sep 20 0.00% 0.00% 0.00% 0.00% 0.00% 0.00%Oct 20 - Sep 21 0.13% 0.12% 0.15% 0.18% 0.20% 0.27%Oct 21 - Sep 22 0.02% 0.01% 0.02% 0.02% 0.02% 0.03%Oct 22 - Sep 23 0.16% 0.15% 0.19% 0.22% 0.24% 0.33%Oct 23 - Sep 24 0.66% 0.61% 0.76% 0.90% 0.97% 1.34%Oct 24 - Sep 25 0.65% 0.61% 0.75% 0.89% 0.96% 1.33%Oct 25 - Sep 26 0.44% 0.40% 0.50% 0.60% 0.64% 0.89%Oct 26 - Sep 27 1.44% 1.34% 1.66% 1.97% 2.12% 2.93%Oct 27 - Sep 28 1.70% 1.57% 1.96% 2.32% 2.50% 3.45%Oct 28 - Sep 29 1.61% 1.49% 1.85% 2.19% 2.36% 3.26%Oct 29 - Sep 30 1.52% 1.41% 1.75% 2.08% 2.24% 3.09%Oct 30 - Sep 31 1.41% 1.31% 1.63% 1.93% 2.07% 2.87%Oct 31 - Sep 32 1.13% 1.04% 1.30% 1.54% 1.65% 2.29%Oct 32 - Sep 33 0.68% 0.63% 0.79% 0.93% 1.00% 1.39%Oct 33 - Sep 34 0.26% 0.24% 0.29% 0.35% 0.38% 0.52%Oct 34 - Sep 35 0.10% 0.09% 0.11% 0.13% 0.14% 0.19%Oct 35 - Sep 36 0.02% 0.02% 0.02% 0.02% 0.03% 0.04%Oct 36 - Sep 37 0.00% 0.00% 0.00% 0.00% 0.00% 0.00%Oct 37 - Sep 38 0.00% 0.00% 0.00% 0.00% 0.00% 0.00%Oct 38 - Sep 39 0.00% 0.00% 0.00% 0.00% 0.00% 0.00%Oct 39 - Sep 40 0.00% 0.00% 0.00% 0.00% 0.00% 0.00%Oct 40 - Sep 41 0.00% 0.00% 0.00% 0.00% 0.00% 0.00%Oct 41 - Sep 42 0.00% 0.00% 0.00% 0.00% 0.00% 0.00%Oct 42 - Sep 43 0.00% 0.00% 0.00% 0.00% 0.00% 0.00%
1 All customers assumed to have BGSS Supply2 Initial Rate period is October 2020 to September 2021 for the CEF-EE Program 3 SUT is assumed at the current SUT rate effective January 1, 2018 through the life of the Program4 The rates are based on a typical residential bill as of September 1, 2020
Oct 20 - Sep 21Oct 20 - thereafter
Class Average Rate w/SUT - $/therm1
Current Class Avg Rate + Col 3 for Each Rate Class (Col 4 thru Col 10)
% Change from Current Class Average Rate w/SUT

Attachment 4
PSE&G Clean Energy Future Energy Efficiency Program Schedule SS-CEF-EE-6EElectric Over/(Under) Calculation
Reflects a tax rate of 28.11%Existing Rate / kWh (w/o SUT) 0.000000Proposed Rate / kWh (w/o SUT) 0.000215
(1) (2) (3) (4) (5) (6) (7) (8) (9) (10)
Over / (Under) Recovery Beginning
BalanceElectric
RevenuesRevenue
RequirementOver / (Under)
Recovery
Over / (Under) Recovery Ending
Balance
Over / (Under) Average Monthly
BalanceInterest Rate (Annualized)
Interest On Over / (Under) Average Monthly Balance Interest Roll-In
Cumulative Interest
Monthly Calculation
Jan-20 - - - - - - 2.14% - - - Feb-20 - - - - - - 2.14% - - - Mar-20 - - - - - - 2.14% - - - Apr-20 - - - - - - 2.14% - - -
May-20 - - - - - - 2.14% - - - Jun-20 - - - - - - 2.14% - - - Jul-20 - - - - - - 2.14% - - -
Aug-20 - - - - - - 2.14% - - - Sep-20 - - - - - - 2.14% - - - Oct-20 - 666,051 1,224,371 (558,320) (558,320) (279,160) 2.14% (358) - (358) Nov-20 (558,320) 629,938 1,256,745 (626,807) (1,185,127) (871,724) 2.14% (1,118) - (1,475) Dec-20 (1,185,127) 718,729 1,270,142 (551,413) (1,736,540) (1,460,833) 2.14% (1,873) - (3,348) Jan-21 (1,736,540) 758,469 1,156,338 (397,869) (2,134,409) (1,935,474) 2.14% (2,481) - (5,830) Feb-21 (2,134,409) 688,465 1,173,299 (484,834) (2,619,243) (2,376,826) 2.14% (3,047) - (8,877) Mar-21 (2,619,243) 692,767 1,197,355 (504,587) (3,123,830) (2,871,537) 2.14% (3,681) - (12,558) Apr-21 (3,123,830) 599,517 887,755 (288,237) (3,412,068) (3,267,949) 2.14% (4,190) - (16,748)
May-21 (3,412,068) 671,801 904,615 (232,814) (3,644,881) (3,528,475) 2.14% (4,524) - (21,272) Jun-21 (3,644,881) 781,108 919,363 (138,255) (3,783,137) (3,714,009) 2.14% (4,762) - (26,033) Jul-21 (3,783,137) 911,272 771,929 139,343 (3,643,794) (3,713,465) 2.14% (4,761) - (30,794)
Aug-21 (3,643,794) 908,713 (871,699) 1,780,412 (1,863,382) (2,753,588) 2.14% (3,530) - (34,324) Sep-21 (1,863,382) 719,786 (1,123,818) 1,843,604 (19,778) (941,580) 2.14% (1,207) - (35,531)
(Prior Col 5) + (Col 9)
Forecasted kWh * Proposed Rate
See Revenue Requirements Schedule for
Details
Col 2 - Col 3 Col 1 + Col 4 (Col 1 + Col 5) / 2 (Col 6 * (Col 7) / 12)*net of tax rate
Prior Month + Col 8 - Col 9

Attachment 4
PSE&G Clean Energy Future Energy Efficiency Program Schedule SS-CEF-EE-6GGas Over/(Under) Calculation
Reflects a tax rate of 28.11%Existing Rate / Therms (w/o SUT) 0.000000Proposed Rate /Therms (w/o SUT) 0.001055
(1) (2) (3) (4) (5) (6) (7) (8) (9) (10)
Over / (Under) Recovery Beginning
Balance Gas RevenuesRevenue
RequirementOver / (Under)
Recovery
Over / (Under) Recovery Ending
Balance
Over / (Under) Average Monthly
BalanceInterest Rate (Annualized)
Interest On Over / (Under) Average Monthly Balance Interest Roll-In
Cumulative Interest
Monthly Calculations
Jan-20 - - - - - - 2.14% - - - Feb-20 - - - - - - 2.14% - - - Mar-20 - - - - - - 2.14% - - - Apr-20 - - - - - - 2.14% - - -
May-20 - - - - - - 2.14% - - - Jun-20 - - - - - - 2.14% - - - Jul-20 - - - - - - 2.14% - - -
Aug-20 - - - - - - 2.14% - - - Sep-20 - - - - - - 2.14% - - - Oct-20 - 154,120 392,188 (238,067) (238,067) (119,034) 2.14% (153) - (153) Nov-20 (238,067) 293,829 405,446 (111,617) (349,684) (293,875) 2.14% (377) - (529) Dec-20 (349,684) 441,840 409,777 32,063 (317,621) (333,652) 2.14% (428) - (957) Jan-21 (317,621) 537,726 296,043 241,683 (75,938) (196,779) 2.14% (252) - (1,209) Feb-21 (75,938) 479,764 316,620 163,144 87,206 5,634 2.14% 7 - (1,202) Mar-21 87,206 388,702 330,012 58,690 145,896 116,551 2.14% 149 - (1,053) Apr-21 145,896 241,498 336,106 (94,608) 51,288 98,592 2.14% 126 - (926)
May-21 51,288 122,145 349,199 (227,054) (175,766) (62,239) 2.14% (80) - (1,006) Jun-21 (175,766) 101,527 360,640 (259,113) (434,880) (305,323) 2.14% (391) - (1,398) Jul-21 (434,880) 80,892 342,750 (261,858) (696,737) (565,809) 2.14% (725) - (2,123)
Aug-21 (696,737) 84,379 (188,429) 272,808 (423,929) (560,333) 2.14% (718) - (2,841) Sep-21 (423,929) 83,234 (340,062) 423,296 (634) (212,281) 2.14% (272) - (3,113)
(Prior Col 5) + (Col 9)
See Revenue Requirements Schedule for
Details
Col 2 - Col 3 Col 1 + Col 4 (Col 1 + Col 5) / 2
PSE&G CP/STD Wght Avg Rate from Previous
Month
(Col 6 * (Col 7) / 12)*net of tax rate
Prior Month + Col 8 - Col 9

PUBLIC SERVICE ELECTRIC AND GAS COMPANY XXX Revised Sheet No. 65
Superseding B.P.U.N.J. No. 16 ELECTRIC XXX Revised Sheet No. 65
GREEN PROGRAMS RECOVERY CHARGE
Charge (per kilowatt-hour)
Component:
Carbon Abatement Program ................................................................................................ $0.000022 Energy Efficiency Economic Stimulus Program ................................................................... ($0.000060) Demand Response Program ............................................................................................... $0.000000 Solar Generation Investment Program ................................................................................ $0.000767 Solar Loan II Program .......................................................................................................... $0.000282 Energy Efficiency Economic Extension Program ................................................................. ($0.000079) Solar Generation Investment Extension Program ............................................................... ($0.000035) Solar Loan III Program ......................................................................................................... ($0.000060) Energy Efficiency Economic Extension Program II .............................................................. $0.000274 Solar Generation Investment Extension II Program ............................................................ ($0.000035) Energy Efficiency 2017 Program ......................................................................................... $0.000175 Transition Renewable Energy Certificate Program ............................................................... $0.000532 Clean Energy Future - Energy Efficiency Program ............................................................... $0.000000 Sub-total per kilowatt-hour .................................................................................................... $0.001783
Charge including New Jersey Sales and Use Tax (SUT) ........................................................ $0.001901
GREEN PROGRAMS RECOVERY CHARGE
This charge is designed to recover the revenue requirements associated with the PSE&G Green Programs and other Board of Public Utilities (BPU) Programs approved for collection via this charge. The charge will be reset nominally on an annual basis. Interest at the weighted average of the interest rates on PSE&G’s commercial paper and bank credit lines utilized in the prior month will be accrued monthly on any under- or over- recovered balances. The interest rates shall be reset each month.
Date of Issue: Effective: Issued by SCOTT S. JENNINGS, SVP - Corporate Planning, Strategy and Utility Finance – PSE&G
80 Park Plaza, Newark, New Jersey 07102 Filed pursuant to Order of Board of Public Utilities dated
in Docket No.
Attachment 5 Page 1 of 13

PUBLIC SERVICE ELECTRIC AND GAS COMPANY XXX Revised Sheet No. 65
Superseding B.P.U.N.J. No. 16 ELECTRIC XXX Revised Sheet No. 65
GREEN PROGRAMS RECOVERY CHARGE
Charge (per kilowatt-hour) Component:
Carbon Abatement Program ................................................................................................ $0.000022 Energy Efficiency Economic Stimulus Program ................................................................... ($0.000060) Demand Response Program ............................................................................................... $0.000000 Solar Generation Investment Program ................................................................................ $0.000767 Solar Loan II Program .......................................................................................................... $0.000282 Energy Efficiency Economic Extension Program ................................................................. ($0.000079) Solar Generation Investment Extension Program ............................................................... ($0.000035) Solar Loan III Program ......................................................................................................... ($0.000060) Energy Efficiency Economic Extension Program II .............................................................. $0.000274 Solar Generation Investment Extension II Program ............................................................ ($0.000035) Energy Efficiency 2017 Program ......................................................................................... $0.000175 Transition Renewable Energy Certificate Program ............................................................... $0.000532 Clean Energy Future - Energy Efficiency Program ............................................................... $0.000000 Sub-total per kilowatt-hour .................................................................................................... $0.001783 Charge including New Jersey Sales and Use Tax (SUT) ........................................................ $0.001901
GREEN PROGRAMS RECOVERY CHARGE
This charge is designed to recover the revenue requirements associated with the PSE&G Green Programs and other Board of Public Utilities (BPU) Programs approved for collection via this charge. The charge will be reset nominally on an annual basis. Interest at the weighted average of the interest rates on PSE&G’s commercial paper and bank credit lines utilized in the prior month will be accrued monthly on any under- or over- recovered balances. The interest rates shall be reset each month.
Date of Issue: Effective:
Issued by SCOTT S. JENNINGS, SVP - Corporate Planning, Strategy and Utility Finance – PSE&G 80 Park Plaza, Newark, New Jersey 07102
Filed pursuant to Order of Board of Public Utilities dated in Docket No.
Attachment 5 Page 2 of 13

PUBLIC SERVICE ELECTRIC AND GAS COMPANY XXX Revised Sheet No. 44
Superseding
B.P.U.N.J. No. 16 GAS XXX Revised Sheet No. 44
GREEN PROGRAMS RECOVERY CHARGE
CHARGE APPLICABLE TO
RATE SCHEDULES RSG, GSG, LVG, SLG,
TSG-F, TSG-NF, CIG, CSG
(Per Therm)
Component:
Carbon Abatement Program ................................................................................................ $ 0.000834 Energy Efficiency Economic Stimulus Program ................................................................... (0.000555) Energy Efficiency Economic Extension Program ................................................................. (0.000369) Energy Efficiency Economic Extension Program II .............................................................. 0.002340 Energy Efficiency 2017 Program ......................................................................................... 0.001840 Clean Energy Future - Energy Efficiency Program .............................................................. 0.000000 Green Programs Recovery Charge ..................................................................................... $ 0.004090 Green Programs Recovery Charge including New Jersey Sales and Use Tax (SUT)…… . $ 0.004361
Green Programs Recovery Charge
This charge is designed to recover the revenue requirements associated with the PSE&G Green Programs. The charge will be reset nominally on an annual basis. Interest at the weighted average of the interest rates on PSE&G’s commercial paper and bank credit lines utilized in the prior month will be accrued monthly on any under- or over- recovered balances. The interest rate shall be reset each month. See Section 16 of the Standard Terms and Conditions for exemptions from this charge. Date of Issue: Effective:
Issued by SCOTT S. JENNINGS, SVP - Corporate Planning, Strategy and Utility Finance – PSE&G 80 Park Plaza, Newark, New Jersey 07102
Filed pursuant to Order of Board of Public Utilities dated in Docket No.
Attachment 5 Page 3 of 13

PUBLIC SERVICE ELECTRIC AND GAS COMPANY XXX Revised Sheet No. 44
Superseding
B.P.U.N.J. No. 16 GAS XXX Revised Sheet No. 44
GREEN PROGRAMS RECOVERY CHARGE
CHARGE APPLICABLE TO
RATE SCHEDULES RSG, GSG, LVG, SLG,
TSG-F, TSG-NF, CIG, CSG
(Per Therm)
Component:
Carbon Abatement Program ................................................................................................ $ 0.000834 Energy Efficiency Economic Stimulus Program ................................................................... (0.000555) Energy Efficiency Economic Extension Program ................................................................. (0.000369) Energy Efficiency Economic Extension Program II .............................................................. 0.002340 Energy Efficiency 2017 Program ......................................................................................... 0.001840 Clean Energy Future - Energy Efficiency Program .............................................................. 0.000000 Green Programs Recovery Charge ..................................................................................... $ 0.004090 Green Programs Recovery Charge including New Jersey Sales and Use Tax (SUT)…… . $ 0.004361
Green Programs Recovery Charge
This charge is designed to recover the revenue requirements associated with the PSE&G Green Programs. The charge will be reset nominally on an annual basis. Interest at the weighted average of the interest rates on PSE&G’s commercial paper and bank credit lines utilized in the prior month will be accrued monthly on any under- or over- recovered balances. The interest rate shall be reset each month. See Section 16 of the Standard Terms and Conditions for exemptions from this charge. Date of Issue: Effective:
Issued by SCOTT S. JENNINGS, SVP - Corporate Planning, Strategy and Utility Finance – PSE&G 80 Park Plaza, Newark, New Jersey 07102
Filed pursuant to Order of Board of Public Utilities dated in Docket No.
Attachment 5 Page 4 of 13

PUBLIC SERVICE ELECTRIC AND GAS COMPANY
B.P.U.N.J. No. 16 ELECTRIC Original Sheet No. XX
CONSERVATION INCENTIVE PROGRAM
CHARGE APPLICABLE TO RATE SCHEDULES RS, RHS, RLM, GLP, LPL-S
Conservation
Incentive Program
Conservation Incentive Program
including SUT
RS & RHS $0.000000 $0.000000 Per kilowatt-hour RLM $0.000000 $0.000000 Per kilowatt-hour GLP $0.0000 $0.0000 Per kilowatt of monthly peak demand LPL-S $0.0000 $0.0000 Per kilowatt of monthly peak demand
Conservation Incentive Program This charge shall be applicable to the rate schedules listed above. The Conservation Incentive Program shall be based on the differences between actual and allowed revenue per customer during the preceding annual period. The Conservation Incentive Program mechanism shall be determined as follows: I. DEFINITION OF TERMS AS USED HEREIN 1. Actual Number of Customers - the Actual Number of Customers (“ANC”) shall be determined on a monthly basis for each of the Customer Class Groups to which the Conservation Incentive Program (“CIP”) Clause applies. The ANC shall equal the aggregate actual monthly Service Charge revenue for each class of customers subject to the CIP as recorded on the Company’s books, divided by the service charge rate applicable to such class of customers in each Customer Class Group. 2. Actual Revenue Per Customer – the Actual Revenue per Customer (“ARC”) shall be determined in dollars per customer on a monthly basis for each of the Customer Class Groups to which the CIP applies. The ARC shall equal the aggregate actual booked variable margin revenue per applicable rate schedule for the month as recorded on the Company’s books divided by the Actual Number of Customers for the corresponding month. Actual revenues shall include Distribution Kilowatt-hour and Distribution Kilowatt charges as well as any Infrastructure Investment Program revenues, and shall not include the Service Charge and any non-base rate charges such as the Societal Benefits, Non-Utility Generation Charge, Securitization Transition Charges, Solar Pilot Recovery Charges, Green Programs Recovery Charges, or the Technology Innovation Charge. 3. Adjustment Period – shall be the year beginning immediately following the conclusion of the Annual Period. 4. Annual Period – shall be the twelve consecutive months from June 1 of one calendar year through May 31 of the following calendar year. 5. Average 13 Month Common Equity Balance – shall be the average of the beginning and ending common equity balances based on the latest publically available financials available before the end of the Annual Period. The Company shall provide the most recently available actual months plus forecasted data at the time of each Initial Filing. The forecasted data will be updated with actuals once the financial statements for the months have been disclosed. Date of Issue: Effective:
Issued by SCOTT S. JENNINGS, SVP - Corporate Planning, Strategy and Utility Finance – PSE&G 80 Park Plaza, Newark, New Jersey 07102
Filed pursuant to Order of Board of Public Utilities dated in Docket No.
Attachment 5 Page 5 of 13

PUBLIC SERVICE ELECTRIC AND GAS COMPANY
B.P.U.N.J. No. 16 ELECTRIC Original Sheet No. XX
CONSERVATION INCENTIVE PROGRAM (Continued)
6. Baseline Revenue per Customer – the Baseline Revenue per Customer (“BRC”) shall be stated in dollars per customer on a monthly basis for each of the Customer Class Groups to which the CIP applies. The BRC shall be calculated as the current variable margin revenue per rate schedule, including any revenue from Infrastructure Investment Program rate adjustments, divided by the number of customers from the most recent approve base rate case for the rate schedule. Baseline revenues shall include Distribution Kilowatt-hour and Distribution Kilowatt charges, and shall not include the Service Charge and any non-base rate charges such as the Societal Benefits, Non-Utility Generation Charge, Securitization Transition Charges, Solar Pilot Recovery Charges, Green Programs Recovery Charges, or the Technology Innovation Charge. 7. Customer Class Group – For purposes of determining and applying the CIP, customers shall be aggregated into four separate recovery class groups. The Customer Class Groups shall be as follows: Group I: RS & RHS Group IA: RLM Group II: GLP Group III: LPL-S 8. Forecast Annual Usage – the Forecast Annual Usage (“FAU”) shall be the projected total annual throughput for all customers within the applicable Customer Class Group. The FAU shall be estimated based on normal weather. 9. Degree Days (DD) - the difference between 65oF and the mean daily temperature. The mean daily temperature is the simple average of the 24 hourly temperature observations for a day. Heating Degree Days (HDD) are used to measure winter weather. 10. Temperature Humidity Index (THI) - a measure of the degree of discomfort experienced by an individual in warm weather that includes temperature and humidity which is included by incorporating the dew point in the measure. The daily THI is the sum of the 24 hourly THI observations for a day. THI is used to measure summer weather. 11. Actual Calendar Month HDD and THI - the accumulation of the actual HDD and THI for each day of a calendar month. Date of Issue: Effective:
Issued by SCOTT S. JENNINGS, SVP - Corporate Planning, Strategy and Utility Finance – PSE&G 80 Park Plaza, Newark, New Jersey 07102
Filed pursuant to Order of Board of Public Utilities dated
in Docket No.
Attachment 5 Page 6 of 13

PUBLIC SERVICE ELECTRIC AND GAS COMPANY
B.P.U.N.J. No. 16 ELECTRIC Original Sheet No. XX
CONSERVATION INCENTIVE PROGRAM (Continued)
12. Normal Calendar Month HDD and THI - the level of calendar month HDD and THI to which the weather portion of this CIP applies. The normal calendar month HDD and THI will be based on the twenty-year average of the National Oceanic and Atmospheric Administration (NOAA) First Order Weather Observation Station hourly observations at the Newark airport and will be updated annually. The base level of normal HDD and THI for the defined winter and summer period months for the XXX-XXX Periods are set forth in the table below:
Month Normal Heating
Degree Days
Normal Temperature
Humidity Index January XXX
February XXX March XXX
April XXX XXX May XXX XXX
June XXX July XXX
August XXX September XXX
October XXX XXX November XXX
December XXX 13. Winter Period - shall be the eight consecutive calendar months from October of one calendar year through May of the following calendar year. 14. Summer Period - shall be the seven consecutive calendar months from April of one calendar year through October of the calendar year. Date of Issue: Effective:
Issued by SCOTT S. JENNINGS, SVP - Corporate Planning, Strategy and Utility Finance – PSE&G 80 Park Plaza, Newark, New Jersey 07102
Filed pursuant to Order of Board of Public Utilities dated in Docket No.
Attachment 5 Page 7 of 13

PUBLIC SERVICE ELECTRIC AND GAS COMPANY
B.P.U.N.J. No. 16 ELECTRIC Original Sheet No. XX
CONSERVATION INCENTIVE PROGRAM (Continued)
15. Consumption Factors - the use per HDD and THI component by month used in forecasting sales for the applicable rate schedules. These factors will be updated annually. Consumption Factors for the XXX-XXX Winter Period for HDD and XXX Summer Period for THI are set forth below and presented as kWh per degree day: Consumption Factors
(kWh per HDD and THI)
RS RHS RLM
Month HDD THI HDD THI HDD THI
January XXX XXX XXX XXX XXX XXX
February XXX XXX XXX XXX XXX XXX
March XXX XXX XXX XXX XXX XXX
April XXX XXX XXX XXX XXX XXX
May XXX XXX XXX XXX XXX XXX
June XXX XXX XXX XXX XXX XXX
July XXX XXX XXX XXX XXX XXX
August XXX XXX XXX XXX XXX XXX
September XXX XXX XXX XXX XXX XXX
October XXX XXX XXX XXX XXX XXX
November XXX XXX XXX XXX XXX XXX
December XXX XXX XXX XXX XXX XXX
II. BASELINE REVENUE PER CUSTOMER – The BRC for each Customer Class Group by month are as follows:
Month RS & RHS RLM GLP LPL-S Jun XXX XXX XXX XXX Jul XXX XXX XXX XXX Aug XXX XXX XXX XXX Sep XXX XXX XXX XXX Oct XXX XXX XXX XXX Nov XXX XXX XXX XXX Dec XXX XXX XXX XXX Jan XXX XXX XXX XXX Feb XXX XXX XXX XXX Mar XXX XXX XXX XXX Apr XXX XXX XXX XXX May XXX XXX XXX XXX Total Annual 249.7 458.5 947.6 21,429
Date of Issue: Effective: Issued by SCOTT S. JENNINGS, SVP - Corporate Planning, Strategy and Utility Finance – PSE&G
80 Park Plaza, Newark, New Jersey 07102 Filed pursuant to Order of Board of Public Utilities dated
in Docket No.
Attachment 5 Page 8 of 13

PUBLIC SERVICE ELECTRIC AND GAS COMPANY
B.P.U.N.J. No. 16 ELECTRIC Original Sheet No. XX
CONSERVATION INCENTIVE PROGRAM (Continued)
III. DETERMINATION OF THE CONSERVATION INCENTIVE PROGRAM 1. At the end of the Annual Period, a calculation shall be made that determines for each Customer Class Group the deficiency or excess to be surcharged or credited to customers pursuant to the CIP mechanism. The deficiency or excess shall be calculated each month by multiplying the result obtained from subtracting the Baseline Revenue per Customer from the Actual Revenue per Customer by the Actual Number of Customers. 2. The weather related change in customer usage shall be calculated as the difference between actual HDD and THI and the above HDD and THI multiplied by the consumption factors, and multiplying the result by the margin revenue factors as defined in Section I.10. of this rate schedule to determine the weather-related deficiency or excess. The weather-related amount will be subtracted from the total deficiency or excess to determine the non-weather related deficiency or excess. 3. Recovery of margin deficiency associated with non-weather related changes in customer usage will be subject to a BGS savings test and a Variable Margin Revenue recovery limitation (“recovery tests”). Recovery of non-weather related margin deficiency will be limited to the smaller of (1) the level of BGS savings achieved when such savings are less than 75 percent of the non-weather related margin deficiency, i.e. BGS savings test, and (2) 6.5 percent of variable margins for the CIP Annual Period, i.e., Variable Margin Revenue recovery limitation. Any amount that exceeds the above limitations may be deferred for future recovery and is subject to either or both of the recovery tests in a future year consistent with the amount by which either or both of the non-weather related margin deficiency exceeded the recovery tests. For the purposes of this calculation, the value of the weather related portion shall be calculated as set forth in Section III.2. of this rate schedule. 4. In addition, if the calculated ROE exceeds the allowed ROE from the utility's last base rate case by 50 basis points or more, recovery of lost revenues through the CIP shall not be allowed for the applicable filing period. For purposes of this section, the Company's rate of return on common equity shall be calculated by dividing the Company's net income for the applicable period as defined in the Average 13 Month Common Equity Balance by the Company's average common equity balance for the same period, all as reflected in the Company's monthly reports to the Board of Public Utilities. The Company's net income shall be calculated by subtracting from total operating income, any clause related Net Income, such as the Green Program’s Recovery Charge, the Technology Innovation Charge and interest expenses. The Company's Average 13 Month Common Equity Balance shall be the ratio of Electric Distribution Net Plant (including the Electric Distribution allocation of Common Plant) to total PSE&G Net Plant for the Average 13 Month Common Equity Balance period multiplied by the Company's total common equity for the same period. 5. The amount to be surcharged or credited shall equal the eligible aggregate deficiency or excess for all months during the Annual Period determined in accordance with the provisions herein, divided by the Forecast Annual Usage for the Customer Class Group. IV. TRACKING THE OPERATION OF THE CONSERVATION INCENTIVE PROGRAM The revenues billed, or credits applied, net of taxes and assessments, through the application of the Conservation Incentive Program Rate shall be accumulated for each month of the Adjustment Period and applied against the CIP excess or deficiency from the Annual Period and any cumulative balances remaining from prior periods.
Date of Issue: Effective: Issued by SCOTT S. JENNINGS, SVP - Corporate Planning, Strategy and Utility Finance – PSE&G
80 Park Plaza, Newark, New Jersey 07102 Filed pursuant to Order of Board of Public Utilities dated
in Docket No.
Attachment 5 Page 9 of 13

PUBLIC SERVICE ELECTRIC AND GAS COMPANY
B.P.U.N.J. No. 16 GAS Original Sheet No. XX
CONSERVATION INCENTIVE PROGRAM
CHARGE APPLICABLE TO
RATE SCHEDULES RSG, GSG, LVG (Per Therm)
Conservation
Incentive Program Conservation Incentive Program
including SUT RSG $0.000000 $0.000000 GSG $0.000000 $0.000000 LVG $0.000000 $0.000000
Conservation Incentive Program This charge shall be applicable to the rate schedules listed above. The Conservation Incentive Program shall be based on the differences between actual and allowed revenue per customer during the preceding annual period. The Conservation Incentive Mechanism shall be determined as follows: I. DEFINITION OF TERMS AS USED HEREIN 1. Actual Number of Customers – the Actual Number of Customers (“ANC”) shall be determined on a monthly basis for each of the Customer Class Groups to which the Conservation Incentive Program (“CIP”) Clause applies. The ANC shall equal the aggregate actual monthly Service Charge revenue for each class of customers subject to the CIP as recorded on the Company’s books, divided by the service charge rate applicable to such class of customers in each Customer Class Group. 2. Actual Usage Per Customer – the Actual Usage per Customer (“AUC”) shall be determined in therms on a monthly basis for each of the Customer Class Groups to which the CIP applies. The AUC shall equal the aggregate actual booked sales for the month as recorded on the Company’s books divided by the ANC for the corresponding month. 3. Adjustment Period – shall be the year beginning immediately following the conclusion of the Annual Period. 4. Annual Period – shall be the twelve consecutive months from October 1 of one calendar year through September 30 of the following calendar year. 5. Average 13 Month Common Equity Balance – shall be the average of the beginning and ending common equity balances based on the latest publically available financials available before the end of the Annual Period. The Company shall provide the most recently available actual months plus forecasted data at the time of each Initial Filing. The forecasted data will be updated with actuals once the financial statements for the months have been disclosed. 6. Baseline Usage per Customer – the Baseline Usage per Customer (“BUC”) shall be stated in therms on a monthly basis for each of the Customer Class Groups to which the CIP applies. The BUC shall be rounded to the nearest one tenth of one therm. The BUC shall be reset each time new base rates are placed into effect through a base rate case. Date of Issue: Effective:
Issued by SCOTT S. JENNINGS, SVP - Corporate Planning, Strategy and Utility Finance – PSE&G 80 Park Plaza, Newark, New Jersey 07102
Filed pursuant to Order of Board of Public Utilities dated in Docket No.
Attachment 5 Page 10 of 13

PUBLIC SERVICE ELECTRIC AND GAS COMPANY
B.P.U.N.J. No. 16 GAS Original Sheet No. XX
CONSERVATION INCENTIVE PROGRAM (Continued)
7. Customer Class Group – For purposes of determining and applying the CIP, customers shall be aggregated into three separate recovery class groups. The Customer Class Groups shall be as follows: Group I: RSG Group II: GSG Group III: LVG 8. Forecast Annual Usage – the Forecast Annual Usage (“FAU”) shall be the projected total annual throughput for all customers within the applicable Customer Class Group. The FAU shall be estimated based on normal weather. 9. Margin Revenue Factor – the Margin Revenue Factor (“MRF”) shall be the weighted-average margin rate as quoted in the individual service classes to which the CIP applies. The MRFs by Customer Class Group are as follows: Group I (RSG): $XXX Group II (GSG): $XXX Group III (LVG): $XXX The MRF shall be reset each time new base rates are placed into effect, including through a base rate case or any Infrastructure Investment Program rate adjustment. 10. Degree Days (DD) - the difference between 65oF and the mean daily temperature for the day. The mean daily temperature is the simple average of the 24 hourly temperature observations for a day. 11. Actual Calendar Month Degree Days - the accumulation of the actual Degree Days for each day of a calendar month. 12. Normal Calendar Month Degree Days - the level of calendar month degree days to which the weather portion of the CIP applies. The normal calendar month Degree Days will be the twenty-year average of the National Oceanic and Atmospheric Administration (NOAA) First Order Weather Observation Station at the Newark airport and will be updated annually. The base level of normal HDD for the defined winter period months for the XXX-XXX Winter Period are set forth in the table below:
Month Normal Heating
Degree Days October XXX
November XXX December XXX
January XXX February XXX
March XXX April XXX
May XXX 13. Winter Period - shall be the eight consecutive calendar months from October of one calendar year through May of the following calendar year. Date of Issue: Effective:
Issued by SCOTT S. JENNINGS, SVP - Corporate Planning, Strategy and Utility Finance – PSE&G 80 Park Plaza, Newark, New Jersey 07102
Filed pursuant to Order of Board of Public Utilities dated
in Docket No.
Attachment 5 Page 11 of 13

PUBLIC SERVICE ELECTRIC AND GAS COMPANY
B.P.U.N.J. No. 16 GAS Original Sheet No. XX
CONSERVATION INCENTIVE PROGRAM (Continued)
14. Degree Day Consumption Factors - the use per degree day component of the gas sales equations by month used in forecasting firm gas sales for the applicable rate schedules. These factors will be updated annually in the WNC proceeding. Degree day Consumption Factors for the XXX-XXX Winter Period are set forth below and presented as therms per degree day: Consumption Factors
(therms per degree day)
RSG GSG LVG
Month Heating Non-Heating Heating Non-Heating
October XXX XXX XXX XXX XXX
November XXX XXX XXX XXX XXX
December XXX XXX XXX XXX XXX
January XXX XXX XXX XXX XXX
February XXX XXX XXX XXX XXX
March XXX XXX XXX XXX XXX
April XXX XXX XXX XXX XXX
May XXX XXX XXX XXX XXX
II. BASELINE USE PER CUSTOMER – The BUC for each Customer Class Group by month are as follows:
Month RSG GSG LVG Oct. XXX XXX XXX Nov. XXX XXX XXX Dec. XXX XXX XXX Jan. XXX XXX XXX Feb. XXX XXX XXX Mar. XXX XXX XXX Apr. XXX XXX XXX May XXX XXX XXX Jun. XXX XXX XXX Jul. XXX XXX XXX Aug. XXX XXX XXX Sep. XXX XXX XXX Total Annual 909.7 2,132.3 40,143.9
Date of Issue: Effective:
Issued by SCOTT S. JENNINGS, SVP - Corporate Planning, Strategy and Utility Finance – PSE&G 80 Park Plaza, Newark, New Jersey 07102
Filed pursuant to Order of Board of Public Utilities dated
in Docket No.
Attachment 5 Page 12 of 13

PUBLIC SERVICE ELECTRIC AND GAS COMPANY
B.P.U.N.J. No. 16 GAS Original Sheet No. XX
CONSERVATION INCENTIVE PROGRAM (Continued)
III. DETERMINATION OF THE CONSERVATION INCENTIVE PROGRAM 1. At the end of the Annual Period, a calculation shall be made that determines for each Customer Class Group the deficiency or excess to be surcharged or credited to customers pursuant to the CIP mechanism. The deficiency or excess shall be calculated each month by multiplying the result obtained from subtracting the Baseline Usage per Customer from the Actual Usage per Customer by the Actual Number of Customers and then multiplying the resulting therms by the Margin Revenue Factor. 2. The weather related change in customer usage shall be calculated as the difference between actual degree days and the above normal degree days multiplied by the consumption factors, and multiplying the result by the margin revenue factors as defined in Section I.10. of this rate schedule to determine the weather-related deficiency or excess. The weather-related amount will be subtracted from the total deficiency or excess to determine the non-weather related deficiency or excess. 3. Recovery of margin deficiency associated with non-weather related deficiency in customer usage will be subject to a BGSS savings test and a Variable Margin Revenue recovery limitation (“recovery tests”). Recovery of non-weather related margin deficiency will be limited to the smaller of (1) the level of BGSS savings achieved when such savings are less than 75 percent of the non-weather related margin deficiency, i.e. BGSS savings test, and (2) 6.5 percent of variable margins for the CIP Annual Period, i.e., Margin Revenue recovery limitation. Any amount that exceeds the above limitations may be deferred for future recovery and is subject to either or both of the recovery tests in a future year consistent with the amount by which either or both of the non-weather related margin deficiency exceeded the recovery tests. For the purposes of this calculation, the value of the weather related portion shall be calculated as set forth in Section III.2. of this rate schedule. 4. In addition, if the calculated ROE exceeds the allowed ROE from the utility's last base rate case by 50 basis points or more, recovery of lost revenues through the CIP shall not be allowed for the applicable filing period. For purposes of this section, the Company's rate of return on common equity shall be calculated by dividing the Company's net income for the applicable period as defined in the Average 13 Month Common Equity Balance by the Company's average common equity balance for the same period, all as reflected in the Company's monthly reports to the Board of Public Utilities. The Company's net income shall be calculated by subtracting from total operating income, any clause related Net Income, such as the Green Program’s Recovery Charge, the Technology Innovation Charge and interest expenses. The Company's Average 13 Month Common Equity Balance shall be the ratio of Gas Net Plant (including the Gas allocation of Common Plant) to total PSE&G Net Plant for the Average 13 Month Common Equity Balance period multiplied by the Company's total common equity for the same period. 5. The amount to be surcharged or credited shall equal the eligible aggregate deficiency or excess for all months during the Annual Period determined in accordance with the provisions herein, divided by the Forecast Annual Usage for the Customer Class Group. IV. TRACKING THE OPERATION OF THE CONSERVATION INCENTIVE PROGRAM The revenues billed, or credits applied, net of taxes and assessments, through the application of the Conservation Incentive Program Rate shall be accumulated for each month of the Adjustment Period and applied against the CIP excess or deficiency from the Annual Period and any cumulative balances remaining from prior periods.
Date of Issue: Effective: Issued by SCOTT S. JENNINGS, SVP - Corporate Planning, Strategy and Utility Finance – PSE&G
80 Park Plaza, Newark, New Jersey 07102 Filed pursuant to Order of Board of Public Utilities dated
in Docket No.
Attachment 5 Page 13 of 13

ILLUSTRATIVE PURPOSES ONLY
Attachment 6E
Schedule 1
Page 1 of 3
Conservation Incentive Program
Group I: Residential Service RS and RHS
June 2021 - May 2022
Actual per Books1
Actual/ Total Class Number of Actual Avg. Baseline Margin
Customer Class Estimate Revenues Customers Revenue / Cust. Revenue / Cust.2
Difference Variance
(a) (b) (c) (d) = (b) / (c) (e) (f) = (d) - (e)
Residential
June e 49,371,972 1,921,455 25.7 33.2 (7.5) ($14,451,083)
July e 66,562,969 1,923,694 34.6 42.4 (7.8) ($15,061,780)
August e 62,183,411 1,916,474 32.5 42.5 (10.0) ($19,204,604)
September e 39,442,052 1,916,615 20.6 20.4 0.2 $419,197
October e 27,262,574 1,914,216 14.2 12.2 2.1 $3,958,738
November e 28,180,670 1,921,687 14.7 12.5 2.2 $4,160,448
December e 35,710,474 1,916,894 18.6 14.3 4.3 $8,271,811
January e 37,910,446 1,911,763 19.8 15.1 4.7 $8,997,068
February e 31,534,835 1,916,381 16.5 13.9 2.6 $4,936,039
March e 29,979,266 1,866,048 16.1 13.5 2.5 $4,706,744
April e 24,767,541 1,995,221 12.4 11.4 1.0 $1,954,531
May e 31,047,164 1,906,131 16.3 18.3 (2.0) ($3,824,224)
Total 463,953,374 241.9 249.7 (7.8) ($15,137,116)
Margin Deficiency/ (Credit) 15,137,116$
Prior Period (Over) / Under Recovery3
-$
Total Deficiency/(Credit) 15,137,116$
Projected Residential kWh Use 12,735,566,204
Pre-tax CIP Charge/(Credit) per kWh 0.0012$
BPU/RC Assessment Factor 1.002569
CIP Charge/(Credit) including assessments 0.0012$
6.625% Sales Tax 0.0001$
Proposed After-tax CIP Charge/(Credit) per kWh 0.0013$
Current After-tax CIP Charge/(Credit) per kWh -$
Increase/ (Decrease) in After-tax CIP Charge/(Credit) per kWh 0.0013$
1 Per Exhibit C, Schedule 1, Page 22 From latest base rate adjustment for Madison and Marshall divided by billing determinants approved in the 2018 Base Rate Case3 Per Exhibit C, Schedule 1, Page 3
Public Service Electric and Gas

ILLUSTRATIVE PURPOSES ONLY
Attachment 6E
Schedule 1
Page 2 of 3
Public Service Electric and Gas
Customers and Therms
Group I: Residential Service RS and RHS
Estimate Estimate Estimate Estimate Estimate Estimate Estimate Estimate Estimate Estimate Estimate Estimate
Jun-21 Jul-21 Aug-21 Sep-21 Oct-21 Nov-21 Dec-21 Jan-22 Feb-22 Mar-22 Apr-22 May-22
Customers
Service Charge Revenues 8,915,549 8,925,942 8,892,438 8,893,095 8,881,964 8,916,629 8,894,386 8,870,582 8,892,006 8,658,464 9,257,826 8,844,450
Service Charge Rate (pre-tax) 4.64 4.64 4.64 4.64 4.64 4.64 4.64 4.64 4.64 4.64 4.64 4.64
Total Customers 1,921,455 1,923,694 1,916,474 1,916,615 1,914,216 1,921,687 1,916,894 1,911,763 1,916,381 1,866,048 1,995,221 1,906,131 1,918,263
Volumes
RS kWh 1,249,731,621 1,660,904,132 1,555,566,043 1,067,201,231 812,603,869 839,597,043 1,063,517,481 1,127,566,843 937,651,870 892,211,731 737,944,250 869,949,572
RHS kWh 5,492,583 6,297,597 6,294,388 4,952,544 6,178,453 8,090,827 12,380,098 15,996,419 13,230,413 10,650,572 6,702,851 4,729,049
Total Volumes 1,255,224,204 1,667,201,729 1,561,860,431 1,072,153,774 818,782,322 847,687,870 1,075,897,579 1,143,563,262 950,882,282 902,862,303 744,647,102 874,678,621 7,043,583,705

ILLUSTRATIVE PURPOSES ONLY Attachment 6E
Schedule 1
Page 3 of 3
PUBLIC SERVICE ELECTRIC AND GAS
STATEMENT OF ESTIMATED UNDER/(OVER) RECOVERED CIP BALANCE
Group I: Residential Service RS and RHS
Estimate Estimate Estimate Estimate Estimate Estimate Estimate Estimate Estimate Estimate Estimate Estimate
Jun-21 Jul-21 Aug-21 Sep-21 Oct-21 Nov-21 Dec-21 Jan-22 Feb-22 Mar-22 Apr-22 May-22 TOTAL
Beginning Under/(Over) Recovery $ 0 0 0 0 0 0 0 0 0 0 0 0 0
kWh Sales 1,667,201,729 1,561,860,431 1,072,153,774 818,782,322 847,687,870 1,075,897,579 1,143,563,262 950,882,282 902,862,303 744,647,102 874,678,621 1,255,224,204 12,915,441,480
Pre-tax Recovery Rate per kWh1 0.0000 0.0000 0.0000 0.0000 0.0000 0.0000 0.0000 0.0000 0.0000 0.0000 0.0000 0.0000
Recovery $ 0 0 0 0 0 0 0 0 0 0 0 0 0
Ending Under/(Over) Recovery $ 0 0 0 0 0 0 0 0 0 0 0 0 0
June 2021 - May 2022
1 Pre-tax Recovery Rate per therm excluding BPU and RC assessments.

ILLUSTRATIVE PURPOSES ONLY
Attachment 6E
Schedule 1a
Page 1 of 3
Conservation Incentive Program
Group Ia: Residential Load Management (RLM)
June 2021 - May 2022
Actual per Books1
Actual/ Total Class Number of Actual Avg. Baseline Margin
Customer Class Estimate Revenues Customers
Revenue /
Cust.
Revenue /
Cust.2
Difference Variance
(a) (b) (c) (d) = (b) / (c) (e) (f) = (d) - (e)
Residential Load Management
June e 833,526 11,427 73.0 61.0 12.0 $136,744
July e 1,157,983 11,540 100.3 77.9 22.5 $259,110
August e 975,534 11,475 85.0 78.0 7.0 $80,869
September e 570,198 11,811 48.3 37.4 10.9 $128,776
October e 168,969 11,545 14.6 22.3 (7.7) ($88,939)
November e 160,451 11,511 13.9 22.9 (9.0) ($103,562)
December e 210,289 11,542 18.2 26.3 (8.1) ($92,998)
January e 218,345 11,559 18.9 27.8 (8.9) ($102,553)
February e 184,553 11,609 15.9 25.5 (9.6) ($111,296)
March e 182,328 11,233 16.2 24.9 (8.6) ($97,040)
April e 155,299 11,576 13.4 21.0 (7.6) ($87,543)
May e 342,186 11,781 29.1 33.6 (4.5) ($53,437)
Total 5,159,660 446.9 458.5 (11.6) ($131,868)
Margin Deficiency/ (Credit) 131,868$
Prior Period (Over) / Under Recovery3
-$
Total Deficiency/(Credit) 131,868$
Projected Residential kWh Use 186,694,277
Pre-tax CIP Charge/(Credit) per kWh 0.0007$
BPU/RC Assessment Factor 1.002569
CIP Charge/(Credit) including assessments 0.000708$
6.625% Sales Tax -$
Proposed After-tax CIP Charge/(Credit) per kWh 0.0007$
Current After-tax CIP Charge/(Credit) per kWh -$
Increase/ (Decrease) in After-tax CIP Charge/(Credit) per kWh 0.0007$
1 Per Exhibit C, Schedule 1a, Page 22 From latest base rate adjustment for Madison and Marshall divided by billing determinants approved in the 2018 Base Rate Case3 Per Exhibit C, Schedule 1, Page 3
Public Service Electric and Gas

ILLUSTRATIVE PURPOSES ONLY
Attachment 6E
Schedule 1a
Page 2 of 3
Public Service Electric and Gas
Customers and Therms
Group Ia: RLM
Estimate Estimate Estimate Estimate Estimate Estimate Estimate Estimate Estimate Estimate Estimate Estimate
Jun-21 Jul-21 Aug-21 Sep-21 Oct-21 Nov-21 Dec-21 Jan-22 Feb-22 Mar-22 Apr-22 May-22
Customers
Service Charge Revenues 149,346 150,829 149,980 154,366 150,892 150,449 150,854 151,070 151,729 146,810 151,298 153,973
Service Charge Rate (pre-tax) 13.07 13.07 13.07 13.07 13.07 13.07 13.07 13.07 13.07 13.07 13.07 13.07
Total Customers 11,427 11,540 11,475 11,811 11,545 11,511 11,542 11,559 11,609 11,233 11,576 11,781
Volumes
RLM kWh 20,896,208 27,849,888 25,509,789 17,611,308 11,449,339 10,873,364 14,251,120 14,837,393 12,531,596 12,380,556 10,545,170 14,082,828
Total Volumes 20,896,208 27,849,888 25,509,789 17,611,308 11,449,339 10,873,364 14,251,120 14,837,393 12,531,596 12,380,556 10,545,170 14,082,828 192,818,561

ILLUSTRATIVE PURPOSES ONLY Attachment 6E
Schedule 1a
Page 3 of 3
PUBLIC SERVICE ELECTRIC AND GAS
STATEMENT OF ESTIMATED UNDER/(OVER) RECOVERED CIP BALANCE
Group Ia: Residential Load Management (RLM)
Estimate Estimate Estimate Estimate Estimate Estimate Estimate Estimate Estimate Estimate Estimate Estimate
Jun-21 Jul-21 Aug-21 Sep-21 Oct-21 Nov-21 Dec-21 Jan-22 Feb-22 Mar-22 Apr-22 May-22 TOTAL
Beginning Under/(Over) Recovery $ 0 0 0 0 0 0 0 0 0 0 0 0 0
kWh Sales 27,849,888 25,509,789 17,611,308 11,449,339 10,873,364 14,251,120 14,837,393 12,531,596 12,380,556 10,545,170 14,082,828 20,896,208 192,818,561
Pre-tax Recovery Rate per kWh1 0.0000 0.0000 0.0000 0.0000 0.0000 0.0000 0.0000 0.0000 0.0000 0.0000 0.0000 0.0000
Recovery $ 0 0 0 0 0 0 0 0 0 0 0 0 0
Ending Under/(Over) Recovery $ 0 0 0 0 0 0 0 0 0 0 0 0 0
June 2021 - May 2022
1 Pre-tax Recovery Rate per therm excluding BPU and RC assessments.

ILLUSTRATIVE PURPOSES ONLY
Attachment 6E
Schedule 2
Page 1 of 3
Conservation Incentive Program
Group II: General Power & Light (GLP)
June 2021 - May 2022
Actual per Books1
Actual/ Total Class Number of Actual Avg. Baseline Margin
Customer Class Estimate Revenues Customers Revenue / Cust.
Revenue /
Cust.2
Difference Variance
(a) (b) (c) (d) = (b) / (c) (e) (f) = (d) - (e)
Residential Heating
June e 32,681,689 286,513 114.1 134.2 (20.1) ($5,759,173)
July e 36,480,013 283,243 128.8 148.9 (20.1) ($5,705,520)
August e 37,048,243 268,939 137.8 156.5 (18.7) ($5,042,047)
September e 24,295,879 295,678 82.2 101.7 (19.5) ($5,766,077)
October e 14,966,985 288,457 51.9 46.9 5.0 $1,435,801
November e 12,280,664 280,410 43.8 46.9 (3.1) ($855,537)
December e 12,319,359 284,876 43.2 45.2 (2.0) ($558,163)
January e 13,020,503 282,497 46.1 45.9 0.2 $60,502
February e 12,583,581 283,851 44.3 46.8 (2.4) ($689,008)
March e 13,114,961 272,327 48.2 46.2 1.9 $530,016
April e 12,148,504 292,470 41.5 46.0 (4.4) ($1,299,656)
May e 22,334,793 284,631 78.5 82.5 (4.0) ($1,145,607)
Total 243,275,174 860.3 947.6 (87.3) ($24,794,468)
Margin Deficiency/ (Credit) 24,794,468$
Prior Period (Over) / Under Recovery3
-$
Total Deficiency/(Credit) 24,794,468$
Projected GLP Annual kW Use 27,884,493
Pre-tax CIP Charge/(Credit) per kW 0.8892$
BPU/RC Assessment Factor 1.002569
CIP Charge/(Credit) including assessments 0.8915$
6.625% Sales Tax 0.0591$
Proposed After-tax CIP Charge/(Credit) per kW 0.9506$
Current After-tax CIP Charge/(Credit) per kW -$
Increase/ (Decrease) in After-tax CIP Charge/(Credit) per kW 0.9506$
1 Per Exhibit C, Schedule 2, Page 22 From latest base rate adjustment for Madison and Marshall divided by billing determinants approved in the 2018 Base Rate Case3 Per Exhibit C, Schedule 2, Page 3
Public Service Electric and Gas

ILLUSTRATIVE PURPOSES ONLY
Attachment 6E
Schedule 2
Page 2 of 3
Public Service Electric and Gas
Customers and Therms
Group II: General Power & Light (GLP)
Estimate Estimate Estimate Estimate Estimate Estimate Estimate Estimate Estimate Estimate Estimate Estimate
Jun-21 Jul-21 Aug-21 Sep-21 Oct-21 Nov-21 Dec-21 Jan-22 Feb-22 Mar-22 Apr-22 May-22
Customers
Service Charge Revenues 1,269,252 1,254,767 1,191,401 1,309,853 1,277,865 1,242,218 1,262,002 1,251,462 1,257,459 1,206,409 1,295,640 1,260,914
Service Charge Rate (pre-tax) 4.43 4.43 4.43 4.43 4.43 4.43 4.43 4.43 4.43 4.43 4.43 4.43
Total Customers 286,513 283,243 268,939 295,678 288,457 280,410 284,876 282,497 283,851 272,327 292,470 284,631
Demand
GLP kW 2,504,424 2,595,005 2,707,023 2,332,346 2,566,230 2,162,933 2,023,033 2,129,087 2,131,198 2,210,824 2,123,320 2,528,576
Total Demand 2,504,424 2,595,005 2,707,023 2,332,346 2,566,230 2,162,933 2,023,033 2,129,087 2,131,198 2,210,824 2,123,320 2,528,576 28,013,999

ILLUSTRATIVE PURPOSES ONLY Attachment 6E
Schedule 2
Page 3 of 3
PUBLIC SERVICE ELECTRIC AND GAS
STATEMENT OF ESTIMATED UNDER/(OVER) RECOVERED CIP BALANCE
Group II: General Power & Light (GLP)
Estimate Estimate Estimate Estimate Estimate Estimate Estimate Estimate Estimate Estimate Estimate Estimate
Jun-21 Jul-21 Aug-21 Sep-21 Oct-21 Nov-21 Dec-21 Jan-22 Feb-22 Mar-22 Apr-22 May-22 TOTAL
Beginning Under/(Over) Recovery $ 0 0 0 0 0 0 0 0 0 0 0 0 0
kW Demand 2,595,005 2,707,023 2,332,346 2,566,230 2,162,933 2,023,033 2,129,087 2,131,198 2,210,824 2,123,320 2,528,576 2,504,424 28,013,999
Pre-tax Recovery Rate per kW1 0.0000 0.0000 0.0000 0.0000 0.0000 0.0000 0.0000 0.0000 0.0000 0.0000 0.0000 0.0000
Recovery $ 0 0 0 0 0 0 0 0 0 0 0 0 0
Ending Under/(Over) Recovery $ 0 0 0 0 0 0 0 0 0 0 0 0 0
June 2021 - May 2022
1 Pre-tax Recovery Rate per therm excluding BPU and RC assessments.

ILLUSTRATIVE PURPOSES ONLY
Attachment 6E
Schedule 3
Page 1 of 3
Conservation Incentive Program
Group III: Large Power & Light - Seconday (LPLS)
June 2021 - May 2022
Actual per Books1
Actual/ Total Class Number of Actual Avg. Baseline Margin
Customer Class Estimate Therms Customers Use / Cust. Use / Cust.2
Difference Variance
(a) (b) (c) (d) = (b) / (c) (e) (f) = (d) - (e)
General Service Small
June e 8,638,705 9,018 958 2,464 (2,536) ($22,868,738)
July e 9,103,155 9,251 984 3,494 (2,622) ($24,254,873)
August e 9,431,600 9,153 1,030 3,606 (1,221) ($11,178,685)
September e 8,533,046 9,122 935 2,252 (681) ($6,213,948)
October e 8,789,688 8,912 986 1,617 (122) ($1,088,393)
November e 14,464,383 9,026 1,603 1,108 542 $4,891,640
December e 24,818,028 9,234 2,688 1,061 1,718 $15,861,232
January e 29,836,602 8,927 3,342 970 2,237 $19,971,315
February e 29,402,661 9,273 3,171 1,105 2,092 $19,401,571
March e 21,209,712 8,598 2,467 1,078 1,457 $12,525,184
April e 9,727,248 9,819 991 1,010 (674) ($6,615,493)
May e 9,030,553 8,978 1,006 1,664 (1,458) ($13,090,450)
Total 182,985,380 20,161 21,429 (1,269) ($12,659,637)
Margin Deficiency/ (Credit) 12,659,637$
Prior Period (Over) / Under Recovery3
-$
Total Deficiency/(Credit) 12,659,637$
Projected LPLS Annual kW Use 27,994,029
Pre-tax CIP Charge/(Credit) per kW 0.4522$
BPU/RC Assessment Factor 1.002569
CIP Charge/(Credit) including assessments 0.4534$
6.625% Sales Tax 0.0300$
Proposed After-tax CIP Charge/(Credit) per kW 0.4834$
Current After-tax CIP Charge/(Credit) per kW -$
Increase/ (Decrease) in After-tax CIP Charge/(Credit) per kW 0.4834$
1 Per Exhibit C, Schedule 3, Page 22 From latest base rate adjustment for Madison and Marshall divided by billing determinants approved in the 2018 Base Rate Case3 Per Exhibit C, Schedule 3, Page 3
Public Service Electric and Gas

ILLUSTRATIVE PURPOSES ONLY
Attachment 6E
Schedule 3
Page 2 of 3
Public Service Electric and Gas
Customers and Therms
Group III: LPLS
Estimate Estimate Estimate Estimate Estimate Estimate Estimate Estimate Estimate Estimate Estimate Estimate
Jun-21 Jul-21 Aug-21 Sep-21 Oct-21 Nov-21 Dec-21 Jan-22 Feb-22 Mar-22 Apr-22 May-22
Customers
Service Charge Revenues 3,136,159 3,217,067 3,182,982 3,172,309 3,099,319 3,138,913 3,211,214 3,104,484 3,224,986 2,990,179 3,414,691 3,122,387
Service Charge Rate (pre-tax) 348 348 348 348 348 348 348 348 348 348 348 348
Total Customers 9,018 9,251 9,153 9,122 8,912 9,026 9,234 8,927 9,273 8,598 9,819 8,978
Demand
LPLS kW 2,448,613 2,580,259 2,673,356 2,418,664 2,491,408 2,211,925 1,982,675 2,184,804 2,193,451 2,182,891 2,066,302 2,559,680
Total Demand 2,448,613 2,580,259 2,673,356 2,418,664 2,491,408 2,211,925 1,982,675 2,184,804 2,193,451 2,182,891 2,066,302 2,559,680 27,994,029

ILLUSTRATIVE PURPOSES ONLY Attachment 6E
Schedule 3
Page 3 of 3
PUBLIC SERVICE ELECTRIC AND GAS
STATEMENT OF ESTIMATED UNDER/(OVER) RECOVERED CIP BALANCE
Group III: Large Power & Light - Seconday (LPLS)
Estimate Estimate Estimate Estimate Estimate Estimate Estimate Estimate Estimate Estimate Estimate Estimate
Jun-21 Jul-21 Aug-21 Sep-21 Oct-21 Nov-21 Dec-21 Jan-22 Feb-22 Mar-22 Apr-22 May-22 TOTAL
Beginning Under/(Over) Recovery $ 0 0 0 0 0 0 0 0 0 0 0 0 0
kW Demand 2,580,259 2,673,356 2,418,664 2,491,408 2,211,925 1,982,675 2,184,804 2,193,451 2,182,891 2,066,302 2,559,680 2,448,613 27,994,029
Pre-tax Recovery Rate per kW1 0.0000 0.0000 0.0000 0.0000 0.0000 0.0000 0.0000 0.0000 0.0000 0.0000 0.0000 0.0000
Recovery $ 0 0 0 0 0 0 0 0 0 0 0 0 0
Ending Under/(Over) Recovery $ 0 0 0 0 0 0 0 0 0 0 0 0 0
June 2021 - May 2022
1 Pre-tax Recovery Rate per therm excluding BPU and RC assessments.

ILLUSTRATIVE PURPOSES ONLY Attachment 6E
Schedule 4
Group I
RS
DEGREE DEGREE DEGREE HDD DEGREE THI
DAYS DAYS DAYS CONSUMPTION DAYS THI THI THI CONSUMPTION THI TOTAL MARGIN MARGIN
NORMAL ACTUAL VARIANCE FACTOR kWh NORMAL ACTUAL VARIANCE FACTOR kWh kWh FACTOR2
IMPACT
Jun-21 e 989 1,010 21 383,845 8,089,540 1 0 -1 154,244 (137,662) 7,951,878 $0.0334 $265,911
Jul-21 e 836 814 (22) 382,431 (8,462,078) 0 0 0 153,675 (69,538) (8,531,616) $0.0334 ($285,297)
Aug-21 e 685 734 48 385,559 18,591,967 30 23 -7 154,932 (1,122,483) 17,469,484 $0.0334 $584,180
Sep-21 e 350 302 (48) 381,946 (18,330,399) 182 169 -13 153,480 (1,987,571) (20,317,970) $0.0334 ($679,433)
Oct-21 e 126 127 2 386,245 580,976 925 791 -134 155,208 (20,815,678) (20,234,702) $0.0334 ($676,648)
Nov-21 e 14 2 (12) 386,226 (4,519,654) 3,009 2,814 -195 155,200 (30,331,589) (34,851,243) $0.0380 ($1,324,347)
Dec-21 e 0 0 (0) 387,218 (9,680) 5,275 6,710 1,436 155,599 223,406,438 223,396,757 $0.0380 $8,489,077
Jan-22 e 1 0 (1) 386,022 (260,565) 4,673 4,522 -151 155,118 (23,394,951) (23,655,516) $0.0380 ($898,910)
Feb-22 e 24 8 (16) 388,852 (6,355,305) 2,116 2,216 100 156,256 15,583,759 9,228,454 $0.0380 $350,681
Mar-22 e 240 178 (62) 387,280 (23,975,359) 345 476 131 155,624 20,462,203 (3,513,155) $0.0334 ($117,480)
Apr-22 e 511 650 139 389,194 54,106,315 21 0 -21 156,393 (3,315,921) 50,790,394 $0.0334 $1,698,431
May-22 e 824 836 12 387,107 4,808,194 6 0 -6 155,554 (866,049) 3,942,145 $0.0334 $131,825
TOTAL 4,600 4,662 61 24,263,952 16,583 17,721 1,138 177,410,958 201,674,910 $7,537,989
Group I
RHS
DEGREE DEGREE DEGREE HDD DEGREE THI
DAYS DAYS DAYS CONSUMPTION DAYS THI THI THI CONSUMPTION THI TOTAL MARGIN MARGIN
NORMAL ACTUAL VARIANCE FACTOR kWh NORMAL ACTUAL VARIANCE FACTOR kWh kWh FACTOR2
IMPACT
Jun-21 e 989 1,010 21 14,674 309,255 1 0 -1 729 (651) 308,604 $0.0328 $10,117
Jul-21 e 836 814 (22) 14,576 (322,516) 0 0 0 724 (328) (322,844) $0.0328 ($10,584)
Aug-21 e 685 734 48 14,560 702,100 30 23 -7 724 (5,242) 696,858 $0.0328 $22,846
Sep-21 e 350 302 (48) 14,458 (693,883) 182 169 -13 719 (9,305) (703,188) $0.0328 ($23,053)
Oct-21 e 126 127 2 14,386 21,639 925 791 -134 715 (95,884) (74,245) $0.0328 ($2,434)
Nov-21 e 14 2 (12) 14,287 (167,192) 3,009 2,814 -195 710 (138,768) (305,960) $0.0486 ($14,874)
Dec-21 e 0 0 (0) 14,260 (356) 5,275 6,710 1,436 709 1,017,505 1,017,149 $0.0486 $49,447
Jan-22 e 1 0 (1) 14,136 (9,541) 4,673 4,522 -151 702 (105,951) (115,492) $0.0486 ($5,614)
Feb-22 e 24 8 (16) 14,018 (229,109) 2,116 2,216 100 697 69,480 (159,629) $0.0486 ($7,760)
Mar-22 e 240 178 (62) 13,949 (863,548) 345 476 131 693 91,150 (772,398) $0.0328 ($25,322)
Apr-22 e 511 650 139 13,906 1,933,227 21 0 -21 691 (14,653) 1,918,574 $0.0328 $62,899
May-22 e 824 836 12 13,802 171,437 6 0 -6 686 (3,819) 167,618 $0.0328 $5,495
TOTAL 4,600 4,662 61 851,511 16,583 17,721 1,138 803,535 1,655,046 $61,162
Group Ia
RLM
DEGREE DEGREE DEGREE HDD DEGREE THI
DAYS DAYS DAYS CONSUMPTION DAYS THI THI THI CONSUMPTION THI TOTAL MARGIN MARGIN
NORMAL ACTUAL VARIANCE FACTOR kWh NORMAL ACTUAL VARIANCE FACTOR kWh kWh FACTOR2
IMPACT
Jun-21 e 989 1,010 21 6,104 128,637 1 0 -1 2,440 (2,178) 126,459 $0.0147 $1,862
Jul-21 e 836 814 (22) 6,015 (133,099) 0 0 0 2,405 (1,088) (134,187) $0.0147 ($1,976)
Aug-21 e 685 734 48 6,104 294,329 30 23 -7 2,440 (17,681) 276,648 $0.0147 $4,074
Sep-21 e 350 302 (48) 6,077 (291,660) 182 169 -13 2,430 (31,466) (323,126) $0.0147 ($4,759)
Oct-21 e 126 127 2 6,040 9,085 925 791 -134 2,415 (323,864) (314,779) $0.0147 ($4,636)
Nov-21 e 14 2 (12) 6,019 (70,431) 3,009 2,814 -195 2,406 (470,298) (540,730) $0.0705 ($38,146)
Dec-21 e 0 0 (0) 6,047 (151) 5,275 6,710 1,436 2,418 3,471,476 3,471,324 $0.0705 $244,888
Jan-22 e 1 0 (1) 6,026 (4,068) 4,673 4,522 -151 2,409 (363,389) (367,456) $0.0705 ($25,923)
Feb-22 e 24 8 (16) 5,999 (98,041) 2,116 2,216 100 2,398 239,200 141,159 $0.0705 $9,958
Mar-22 e 240 178 (62) 6,089 (376,968) 345 476 131 2,435 320,118 (56,850) $0.0147 ($837)
Apr-22 e 511 650 139 6,095 847,372 21 0 -21 2,437 (51,671) 795,701 $0.0147 $11,718
May-22 e 824 836 12 5,990 74,397 6 0 -6 2,395 (13,333) 61,063 $0.0147 $899
TOTAL 4,600 4,662 61 379,402 16,583 17,721 1,138 2,755,824 3,135,227 $197,124
Total TOTAL MARGIN
All Groups kWh IMPACT
Jun-21 a 8,386,941 277,890
Jul-21 a (8,988,647) (297,858)
Aug-21 a 18,442,989 611,100
Sep-21 a (21,344,284) (707,245)
Oct-21 a (20,623,726) (683,718)
Nov-21 a (35,697,933) (1,377,367)
Dec-21 a 227,885,230 8,783,411
Jan-22 a (24,138,465) (930,447)
Feb-22 a 9,209,985 352,879
Mar-22 a (4,342,403) (143,639)
Apr-22 a 53,504,669 1,773,048
May-22 a 4,170,827 138,220
TOTAL 206,465,182 $7,796,274
Public Service Electric and Gas
Conservation Incentive Program
Weather Normalization Calculation

ILLUSTRATIVE PURPOSES ONLY Attachment 6E
Schedule 5
Page 1 of 5
Determine Weather and Non-Weather CIP Impacts
Weather Non-Weather Total
CIP Group I RS RHS 7,599,151$ 7,537,965$ 15,137,116$
CIP Group II RLM 197,124$ (65,255)$ 131,868$
CIP Group III GLP -$ 24,794,468$ 24,794,468$
CIP Group IV LPLS -$ 12,659,637$ 12,659,637$
Total Deficiency/(Credit) 7,796,274$ 44,926,815$ 52,723,089$
Step 2: Apply Modified BGSS Savings Test
A. Non-weather Impact Subject to Modified BGS Savings Test
Non-Weather Impact 44,926,815$
75% Factor 75%
Subtotal 33,695,111$
Prior Year Carry-Forward (Modified BGSS Savings Test) -$
Non-weather Impact Subject to Test 33,695,111$
B. BGS Savings
Permanent Capacity Savings (Exhibit C, Schedule 6, Page 3) 64,505,906$
Additional Capacity BGS Savings (Exhibit C, Schedule 6, Page 3) -$
Avoided Cost BGS Savings (Exhibit C, Schedule 6, Page 4) 26,508,428$
Total BGS Savings 91,014,334$
C. Results
Non-Weather Impacts Passing Test (current accrual) 44,926,815$
Non-Weather Impacts Passing Test (prior year carry-forward) -$
Non-Weather Impacts Exceeding Test -$
Public Service Electric and Gas
Conservation Incentive Program Filing
June 2021 - May 2022
CIP Recovery Tests
Summary

ILLUSTRATIVE PURPOSES ONLY
Attachment 6E
Schedule 5
Page 2 of 5
Step 3: Apply Variable Margin Revenue Test
A. Non-weather Impact Subject to Variable Margin Revenue Test
Non-Weather Impact 44,926,815$
Prior Year Carry-Forward (Variable Margin Revenue Test) -$
Non-weather Impact Subject to Test 44,926,815$
B. Variable Margin Revenues
Variable Margin Revenues (Exhibit C, Schedule 6, Page 5) 949,240,295$
6.5% Factor 6.5%
Total Fixed Recovery Cap 61,700,619$
C. Results
Non-Weather Impacts Passing Test (current accrual) 44,926,815$
Non-Weather Impacts Passing Test (prior year carry-forward) -$
Non-Weather Impacts Exceeding Test -$
Step 4: Determine Recoverable Non-Weather CIP Impacts
A. Current Year Accrual Recoverable Non-Weather Impacts
Amount Passing Modified BGSS Savings Test 44,926,815$
Amount Passing Variable Margin Revenue Test 44,926,815$
Recoverable Amount 44,926,815$
B. Previous Carry-Forward Recoverable Amounts
Amount Passing Modified BGSS Savings Test -$
Amount Passing Variable Margin Revenue Test -$
Deduction for any amount also included in above -$
-$
Total Non-Weather Recoverable CIP Amount 44,926,815$
Summary
CIP Recovery Tests
Public Service Electric and Gas
Conservation Incentive Program Filing
June 2021 - May 2022

Attachment 6E
Schedule 5
Page 3 of 5
CIP Recovery Tests
I. Permanent BGS Savings
Year WN Summer PeakFinal Zonal UCAP
Obligation
PS Zonal Net
Load Price
$/MW-Day
PS Zonal Net
Load Price
$/kW-yr
2011/2012 10,340 12,333 $116.15 $42.42
2012/2013 10,150 11,645 $157.73 $57.61
2013/2014 10,100 11,629 $248.30 $90.69
2014/2015 10,120 11,564 $170.95 $62.44
2015/2016 10,160 11,398 $166.29 $60.74
2016/2017 9,490 11,043 $224.70 $82.07
2017/2018 9,530 10,932 $208.59 $76.19
2018/2019 9,450 11,272 $218.96 $79.97
2019/2020 9,370 11,281 $115.83 $42.31
2020/2021 9,480 11,320 $174.32 $63.67
Permanent Capacity Savings 1,013
2021 PS Zonal Net Load Capacity Cost per kW-year $63.67
Total Permanent Reductions $64,505,906
II. Additional Capacity BGS Savings
CIP Recovery
Year WN Summer PeakFinal Zona lUCAP
Obligation
PS Zonal Net
Load Price
$/MW-Day
2019/2020 9,370 11,281 $42.31
2020/2021* 9,480 11,320 $63.67
Incremental Capacity Savings* 0
PS Zonal Net Load Capacity Cost per kW-year $63.67
Total Additional Capacity Reductions -$
III. Avoided Capacity
CIP Recovery
Year Annual $
2019/2020 26,508,428$
VI. Total of all Savings
CIP
Recovery
Year
Permanent
Capacity
Savings
Additional Capacity BGSS
Savings
Avoided Cost BGSS
Savings Annual $
2019/2020 64,505,906$ -$ 26,508,428$ 91,014,334$
Public Service Electric and Gas
CIP BGS Savings
* Due to the potential for Peak increases due to Electric Vehicles and Electrification, incremental savings
is set as a minimum of the incremental obligation savings or zero

ILLUSTRATIVE PURPOSES ONLY Attachment 6E
Schedule 5
Page 4 of 5
Base Year Current Year
Net Increase/
(Decrease) Base Year Current Year Avoided
Month Customer Count Customer Count Customer Count
Unforced
Capacity /
Customer
(kW)
Capacity Rate /
Cust.
($/kW) Capacity
(a) (b) (c) (d) = (b) / (c) (e) (f)
(g) = (d) * (e) * (f)
* 1,000
Group 1: RS
June 1,882,438 1,921,455 45,393 2.3 $5.31 559,726
July 1,876,061 1,923,694 58,192 2.3 $5.31 720,245
August 1,865,502 1,916,474 43,971 2.3 $5.31 544,190
September 1,872,503 1,916,615 43,447 2.3 $5.31 538,382
October 1,873,168 1,914,216 41,351 2.3 $5.31 510,417
November 1,872,865 1,921,687 35,139 2.3 $5.31 434,824
December 1,886,548 1,916,894 26,299 2.3 $5.31 326,307
January 1,890,595 1,911,763 31,675 2.3 $5.31 392,062
February 1,880,088 1,916,381 64,008 2.4 $5.31 813,641
March 1,852,372 1,866,048 (52,315) 2.2 $5.31 (621,957)
April 1,918,364 1,995,221 131,146 2.3 $5.31 1,632,007
May 1,864,076 1,906,131 28,250 2.3 $5.31 348,742
Subtotal 1,877,882 1,918,882 41,380 $6,198,587
Group 2: RLM
June 12,114 11,427 (971) 7.4 $5.31 (38,152)
July 12,213 11,540 (574) 7.4 $5.31 (22,690)
August 11,549 11,475 (738) 7.2 $5.31 (28,337)
September 12,247 11,811 262 7.4 $5.31 10,287
October 12,179 11,545 (702) 7.4 $5.31 (27,654)
November 12,329 11,511 (668) 7.4 $5.31 (26,261)
December 12,188 11,542 (787) 7.4 $5.31 (30,898)
January 12,017 11,559 (630) 7.4 $5.31 (24,612)
February 12,039 11,609 (408) 7.6 $5.31 (16,480)
March 12,316 11,233 (806) 7.4 $5.31 (31,589)
April 12,310 11,576 (740) 7.3 $5.31 (28,477)
May 12,397 11,781 (529) 7.5 $5.31 (21,014)
Subtotal 12,158 11,551 (608) ($285,878)
Group 3: GLP
June 269,005 286,513 21,754 8.9 $5.31 1,030,287
July 264,759 283,243 23,892 9.4 $5.31 1,191,750
August 259,351 268,939 4,401 8.6 $5.31 199,656
September 264,539 295,678 48,029 8.8 $5.31 2,233,630
October 247,648 288,457 29,778 9.0 $5.31 1,424,579
November 258,679 280,410 13,735 8.9 $5.31 646,784
December 266,675 284,876 23,772 8.9 $5.31 1,128,831
January 261,105 282,497 19,522 8.9 $5.31 922,614
February 262,975 283,851 27,296 9.3 $5.31 1,344,609
March 256,555 272,327 4,903 8.6 $5.31 224,882
April 267,424 292,470 27,829 8.9 $5.31 1,311,598
May 264,641 284,631 15,626 8.8 $5.31 731,611
Subtotal 261,946 283,658 21,711 $12,390,832
Group 4: LPLS
June 8,883 9,018 162 267.1 $5.31 229,325
July 8,727 9,251 368 270.0 $5.31 526,705
August 8,370 9,153 425 270.9 $5.31 611,195
September 8,140 9,122 752 277.3 $5.31 1,106,538
October 9,014 8,912 772 273.8 $5.31 1,120,956
November 7,780 9,026 11 267.6 $5.31 16,100
December 8,886 9,234 1,454 276.8 $5.31 2,135,451
January 8,481 8,927 41 266.5 $5.31 57,568
February 8,891 9,273 793 287.4 $5.31 1,208,750
March 8,867 8,598 (293) 251.7 $5.31 (391,031)
April 8,846 9,819 952 275.2 $5.31 1,390,334
May 8,856 8,978 133 274.0 $5.31 192,996
Subtotal 8,645 9,109 464 $8,204,886
Total Avoided Capacity Cost BGS Savings $26,508,428
Notes:
(1)Base Year Customer Count is equal to the test year customer count used to set base rates in a base rate case
(2)Current Year Customer Count is equal to the customer count in the CIP accrual year.
(3)Base Year Unforced capacity is equal to the 2017/2018 Unforced capacity from PJM by rate schedule divided by number of customers
(4)Current Year Capacity rate is the current year PS Zonal Net Load Price $/kW-yr divided by 12
Public Service Electric and Gas
CIP Recovery Tests
Avoided Capacity Cost BGS Savings
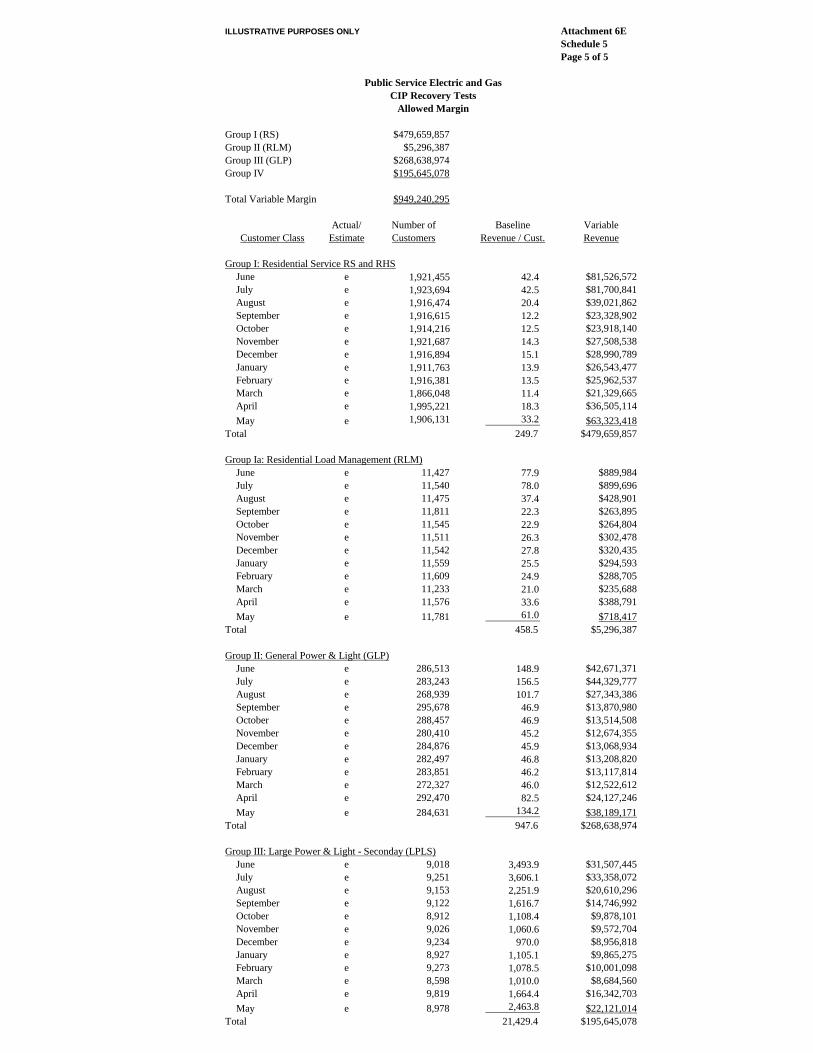
ILLUSTRATIVE PURPOSES ONLY Attachment 6E
Schedule 5
Page 5 of 5
Group I (RS) $479,659,857
Group II (RLM) $5,296,387
Group III (GLP) $268,638,974
Group IV $195,645,078
Total Variable Margin $949,240,295
Actual/ Number of Baseline Variable
Customer Class Estimate Customers Revenue / Cust. Revenue
Group I: Residential Service RS and RHS
June e 1,921,455 42.4 $81,526,572
July e 1,923,694 42.5 $81,700,841
August e 1,916,474 20.4 $39,021,862
September e 1,916,615 12.2 $23,328,902
October e 1,914,216 12.5 $23,918,140
November e 1,921,687 14.3 $27,508,538
December e 1,916,894 15.1 $28,990,789
January e 1,911,763 13.9 $26,543,477
February e 1,916,381 13.5 $25,962,537
March e 1,866,048 11.4 $21,329,665
April e 1,995,221 18.3 $36,505,114
May e 1,906,131 33.2 $63,323,418
Total 249.7 $479,659,857
Group Ia: Residential Load Management (RLM)
June e 11,427 77.9 $889,984
July e 11,540 78.0 $899,696
August e 11,475 37.4 $428,901
September e 11,811 22.3 $263,895
October e 11,545 22.9 $264,804
November e 11,511 26.3 $302,478
December e 11,542 27.8 $320,435
January e 11,559 25.5 $294,593
February e 11,609 24.9 $288,705
March e 11,233 21.0 $235,688
April e 11,576 33.6 $388,791
May e 11,781 61.0 $718,417
Total 458.5 $5,296,387
Group II: General Power & Light (GLP)
June e 286,513 148.9 $42,671,371
July e 283,243 156.5 $44,329,777
August e 268,939 101.7 $27,343,386
September e 295,678 46.9 $13,870,980
October e 288,457 46.9 $13,514,508
November e 280,410 45.2 $12,674,355
December e 284,876 45.9 $13,068,934
January e 282,497 46.8 $13,208,820
February e 283,851 46.2 $13,117,814
March e 272,327 46.0 $12,522,612
April e 292,470 82.5 $24,127,246
May e 284,631 134.2 $38,189,171
Total 947.6 $268,638,974
Group III: Large Power & Light - Seconday (LPLS)
June e 9,018 3,493.9 $31,507,445
July e 9,251 3,606.1 $33,358,072
August e 9,153 2,251.9 $20,610,296
September e 9,122 1,616.7 $14,746,992
October e 8,912 1,108.4 $9,878,101
November e 9,026 1,060.6 $9,572,704
December e 9,234 970.0 $8,956,818
January e 8,927 1,105.1 $9,865,275
February e 9,273 1,078.5 $10,001,098
March e 8,598 1,010.0 $8,684,560
April e 9,819 1,664.4 $16,342,703
May e 8,978 2,463.8 $22,121,014
Total 21,429.4 $195,645,078
Public Service Electric and Gas
CIP Recovery Tests
Allowed Margin

ILLUSTRATIVE PURPOSES ONLY
Attachment 6E
Schedule 6
CONSERVATION INCENTIVE PROGRAM
EARNINGS TEST
JANUARY 1, 2021 THROUGH DECEMBER 31, 2021
NINE MONTHS ACTUAL, THREE MONTHS ESTIMATE
in $000
1 Equity Base for Earnings Test 3,000,000
2 Allowed ROE 9.6% 2018 Base Rate Case
3 ROE Limit buffer 0.5% From IIP
4 Maximum ROE 10.1% = ln 2 + ln 3
5 Actual Net Income 250,000
6 ROE for Earnings Test 8.33% = ln 5 / ln 1
7 Earnings Test Pass / Fail Pass = IF ln 4 > 6, Pass else Fail
PUBLIC SERVICE ELECTRIC AND GAS

ILLUSTRATIVE PURPOSES ONLY
Attachment 6G
Schedule 1
Page 1 of 3
Conservation Incentive Program
Group I: Residential Heat & Non-Heating
October 2021 - September 2022
Actual per Books1
Actual/ Total Class Number of Actual Avg. Baseline Aggregate Margin Margin
Customer Class Estimate Therms Customers Use / Cust. Use / Cust.2
Difference Therm Impact Factor Variance
(a) (b) (c) (d) = (b) / (c) (e) (f) = (d) - (e) (g) = (f) * (c)
Residential Non-Heating
October e 67,342,776 1,660,099 40.6 38.8 1.8 2,981,652 $0.3686 $1,098,986
November e 156,785,130 1,664,795 94.2 87.3 6.9 11,432,341 $0.3686 $4,213,767
December e 233,972,053 1,663,080 140.7 144.0 (3.3) (5,484,489) $0.3743 ($2,052,674)
January e 295,224,713 1,661,673 177.7 179.4 (1.7) (2,875,459) $0.3800 ($1,092,545)
February e 254,970,665 1,662,634 153.4 153.1 0.3 461,869 $0.3800 $175,490
March e 196,889,032 1,643,868 119.8 125.3 (5.5) (9,097,576) $0.3800 ($3,456,669)
April e 115,198,363 1,684,260 68.4 69.2 (0.8) (1,412,867) $0.3800 ($536,826)
May e 52,555,770 1,669,027 31.5 36.7 (5.2) (8,745,217) $0.3800 ($3,322,789)
June e 41,511,324 1,669,739 24.9 21.0 3.9 6,520,385 $0.3851 $2,510,883
July e 29,156,563 1,674,659 17.4 17.3 0.1 128,099 $0.3902 $49,985
August e 27,497,947 1,672,495 16.4 18.1 (1.6) (2,728,931) $0.3902 ($1,064,853)
September e 30,310,167 1,670,608 18.1 19.5 (1.3) (2,249,715) $0.3902 ($877,859)
Total 1,501,414,504 903.0 909.7 (11,069,907) ($4,355,105)
Margin Deficiency/ (Credit) 4,355,105$
Prior Period (Over) / Under Recovery3
-$
Total Deficiency/(Credit) 4,355,105$
Projected Residential Non-Heating Throughput for Recovery Period 1,521,598,100
Pre-tax CIP Charge/(Credit) 0.0029$
BPU/RC Assessment Factor 1.002569
CIP Charge/(Credit) including assessments 0.0029$
6.625% Sales Tax 0.0002$
Proposed After-tax CIP Charge/(Credit) per Therm 0.0031$
Current After-tax CIP Charge/(Credit) per Therm -$
Increase/ (Decrease) in After-tax CIP Charge/(Credit) per Therm 0.0031$
1 Per Exhibit C, Schedule 1, Page 22 From 2018 Base Rate Case3 Per Exhibit C, Schedule 1, Page 3
Public Service Electric and Gas Company

ILLUSTRATIVE PURPOSES ONLY
Attachment 6G
Schedule 1
Page 2 of 3
Public Service Electric and Gas CompanyCustomers and Therms
Group I: Residential Heat & Non-Heating
Estimate Estimate Estimate Estimate Estimate Estimate Estimate Estimate Estimate Estimate Estimate Estimate
Oct-21 Nov-21 Dec-21 Jan-22 Feb-22 Mar-22 Apr-22 May-22 Jun-22 Jul-22 Aug-22 Sep-22
CustomersRSG heating 1,432,278 1,435,713 1,434,502 1,424,074 1,430,635 1,416,067 1,456,991 1,442,691 1,443,720 1,448,951 1,446,908 1,444,193
RSG non-heating 227,821 229,083 228,577 237,599 231,999 227,801 227,269 226,336 226,019 225,708 225,587 226,415
Total Customers 1,660,099 1,664,795 1,663,080 1,661,673 1,662,634 1,643,868 1,684,260 1,669,027 1,669,739 1,674,659 1,672,495 1,670,608
VolumesRSG heating 65,270,130 148,604,339 225,403,007 289,967,465 250,424,912 193,012,074 111,867,103 49,912,548 39,212,812 26,571,828 25,387,358 28,285,580 1,453,919,157
RSG non-heating 2,072,647 8,180,791 8,569,046 5,257,248 4,545,753 3,876,959 3,331,260 2,643,222 2,298,511 2,584,736 2,110,589 2,024,586 47,495,348
Total Volumes 67,342,776 156,785,130 233,972,053 295,224,713 254,970,665 196,889,032 115,198,363 52,555,770 41,511,324 29,156,563 27,497,947 30,310,167 1,501,414,504

ILLUSTRATIVE PURPOSES ONLY Attachment 6G
Schedule 1
Page 3 of 3
PUBLIC SERVICE ELECTRIC AND GAS COMPANYSTATEMENT OF ESTIMATED UNDER/(OVER) RECOVERED CIP BALANCE
Group I: Residential Heat & Non-Heating
Estimate Estimate Estimate Estimate Estimate Estimate Estimate Estimate Estimate Estimate Estimate Estimate
Oct-21 Nov-21 Dec-21 Jan-22 Feb-22 Mar-22 Apr-22 May-22 Jun-22 Jul-22 Aug-22 Sep-22 TOTAL
Beginning Under/(Over) Recovery $ 0 0 0 0 0 0 0 0 0 0 0 0 0
Therm Sales 67,342,776 156,785,130 233,972,053 295,224,713 254,970,665 196,889,032 115,198,363 52,555,770 41,511,324 29,156,563 27,497,947 30,310,167 1,501,414,504
Pre-tax Recovery Rate per Therm1 0.0000 0.0000 0.0000 0.0000 0.0000 0.0000 0.0000 0.0000 0.0000 0.0000 0.0000 0.0000
Recovery $ 0 0 0 0 0 0 0 0 0 0 0 0 0
Ending Under/(Over) Recovery $ 0 0 0 0 0 0 0 0 0 0 0 0 0
October 2021 - September 2022
1 Pre-tax Recovery Rate per therm excluding BPU and RC assessments.
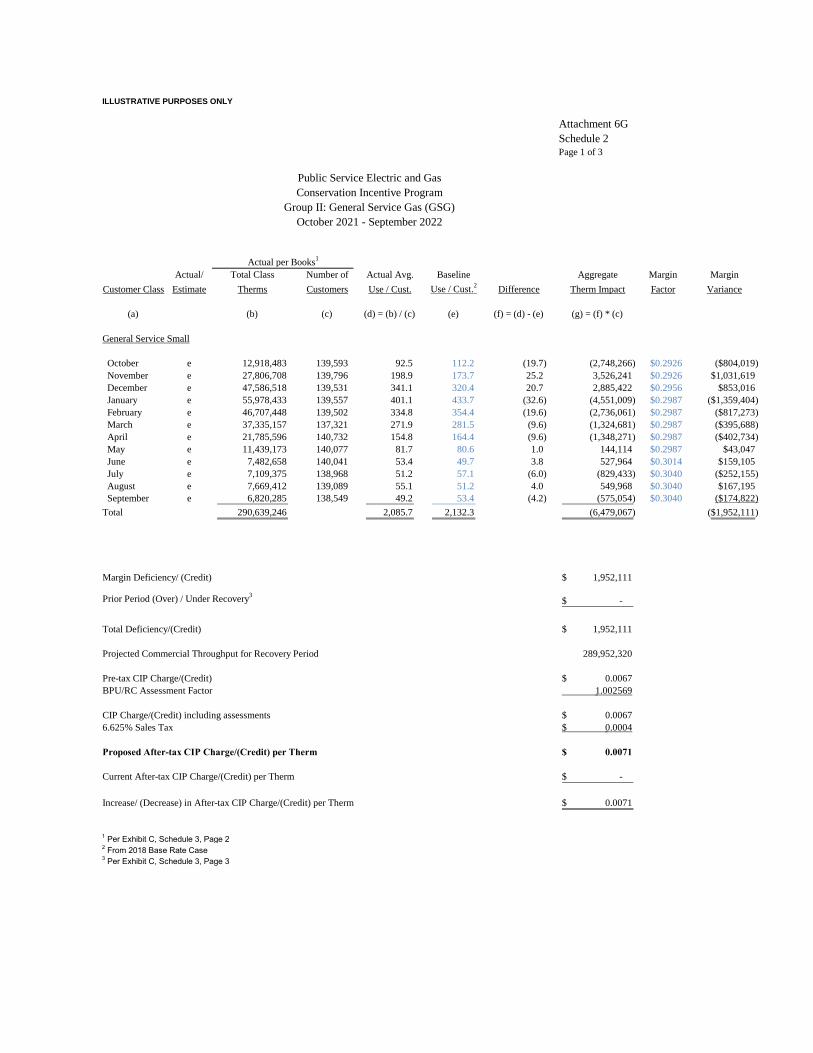
ILLUSTRATIVE PURPOSES ONLY
Attachment 6G
Schedule 2
Page 1 of 3
Conservation Incentive Program
Group II: General Service Gas (GSG)
October 2021 - September 2022
Actual per Books1
Actual/ Total Class Number of Actual Avg. Baseline Aggregate Margin Margin
Customer Class Estimate Therms Customers Use / Cust. Use / Cust.2
Difference Therm Impact Factor Variance
(a) (b) (c) (d) = (b) / (c) (e) (f) = (d) - (e) (g) = (f) * (c)
General Service Small
October e 12,918,483 139,593 92.5 112.2 (19.7) (2,748,266) $0.2926 ($804,019)
November e 27,806,708 139,796 198.9 173.7 25.2 3,526,241 $0.2926 $1,031,619
December e 47,586,518 139,531 341.1 320.4 20.7 2,885,422 $0.2956 $853,016
January e 55,978,433 139,557 401.1 433.7 (32.6) (4,551,009) $0.2987 ($1,359,404)
February e 46,707,448 139,502 334.8 354.4 (19.6) (2,736,061) $0.2987 ($817,273)
March e 37,335,157 137,321 271.9 281.5 (9.6) (1,324,681) $0.2987 ($395,688)
April e 21,785,596 140,732 154.8 164.4 (9.6) (1,348,271) $0.2987 ($402,734)
May e 11,439,173 140,077 81.7 80.6 1.0 144,114 $0.2987 $43,047
June e 7,482,658 140,041 53.4 49.7 3.8 527,964 $0.3014 $159,105
July e 7,109,375 138,968 51.2 57.1 (6.0) (829,433) $0.3040 ($252,155)
August e 7,669,412 139,089 55.1 51.2 4.0 549,968 $0.3040 $167,195
September e 6,820,285 138,549 49.2 53.4 (4.2) (575,054) $0.3040 ($174,822)
Total 290,639,246 2,085.7 2,132.3 (6,479,067) ($1,952,111)
Margin Deficiency/ (Credit) 1,952,111$
Prior Period (Over) / Under Recovery3
-$
Total Deficiency/(Credit) 1,952,111$
Projected Commercial Throughput for Recovery Period 289,952,320
Pre-tax CIP Charge/(Credit) 0.0067$
BPU/RC Assessment Factor 1.002569
CIP Charge/(Credit) including assessments 0.0067$
6.625% Sales Tax 0.0004$
Proposed After-tax CIP Charge/(Credit) per Therm 0.0071$
Current After-tax CIP Charge/(Credit) per Therm -$
Increase/ (Decrease) in After-tax CIP Charge/(Credit) per Therm 0.0071$
1 Per Exhibit C, Schedule 3, Page 22 From 2018 Base Rate Case3 Per Exhibit C, Schedule 3, Page 3
Public Service Electric and Gas

ILLUSTRATIVE PURPOSES ONLY
Attachment 6G
Schedule 3
Page 2 of 3
Public Service Electric and GasCustomers and Therms
Group II: General Service Gas (GSG)
Estimate Estimate Estimate Estimate Estimate Estimate Estimate Estimate Estimate Estimate Estimate Estimate
Oct-21 Nov-21 Dec-21 Jan-22 Feb-22 Mar-22 Apr-22 May-22 Jun-22 Jul-22 Aug-22 Sep-22
CustomersGSG Heating 114,183 114,527 114,337 114,295 114,273 112,674 115,341 114,934 114,880 113,941 114,194 113,625
GSG Non-Heating 25,410 25,269 25,194 25,263 25,229 24,647 25,391 25,142 25,162 25,027 24,895 24,924
Total Customers 139,593 139,796 139,531 139,557 139,502 137,321 140,732 140,077 140,041 138,968 139,089 138,549
VolumesGSG Heating 10,454,149 24,089,750 41,550,122 50,222,054 40,967,187 32,276,661 18,277,654 8,821,668 5,244,883 5,013,542 5,501,554 5,136,675 247,555,900
GSG Non-Heating 2,464,334 3,716,958 6,036,396 5,756,379 5,740,261 5,058,496 3,507,942 2,617,505 2,237,775 2,095,833 2,167,858 1,683,610 43,083,346
Total Volumes 12,918,483 27,806,708 47,586,518 55,978,433 46,707,448 37,335,157 21,785,596 11,439,173 7,482,658 7,109,375 7,669,412 6,820,285 290,639,246

ILLUSTRATIVE PURPOSES ONLY Attachment 6G
Schedule 3
Page 3 of 3
PUBLIC SERVICE ELECTRIC AND GAS COMPANYSTATEMENT OF ESTIMATED UNDER/(OVER) RECOVERED CIP BALANCE
Group II: General Service Gas (GSG)
Estimate Estimate Estimate Estimate Estimate Estimate Estimate Estimate Estimate Estimate Estimate Estimate
Oct-21 Nov-21 Dec-21 Jan-22 Feb-22 Mar-22 Apr-22 May-22 Jun-22 Jul-22 Aug-22 Sep-22 TOTAL
Beginning Under/(Over) Recovery $ 0 0 0 0 0 0 0 0 0 0 0 0 0
Therm Sales 12,918,483 27,806,708 47,586,518 55,978,433 46,707,448 37,335,157 21,785,596 11,439,173 7,482,658 7,109,375 7,669,412 6,820,285 290,639,246
Pre-tax Recovery Rate per Therm1 0.0000 0.0000 0.0000 0.0000 0.0000 0.0000 0.0000 0.0000 0.0000 0.0000 0.0000 0.0000
Recovery $ 0 0 0 0 0 0 0 0 0 0 0 0 0
Ending Under/(Over) Recovery $ 0 0 0 0 0 0 0 0 0 0 0 0 0
October 2021 - September 2022
1 Pre-tax Recovery Rate per therm excluding BPU and RC assessments.
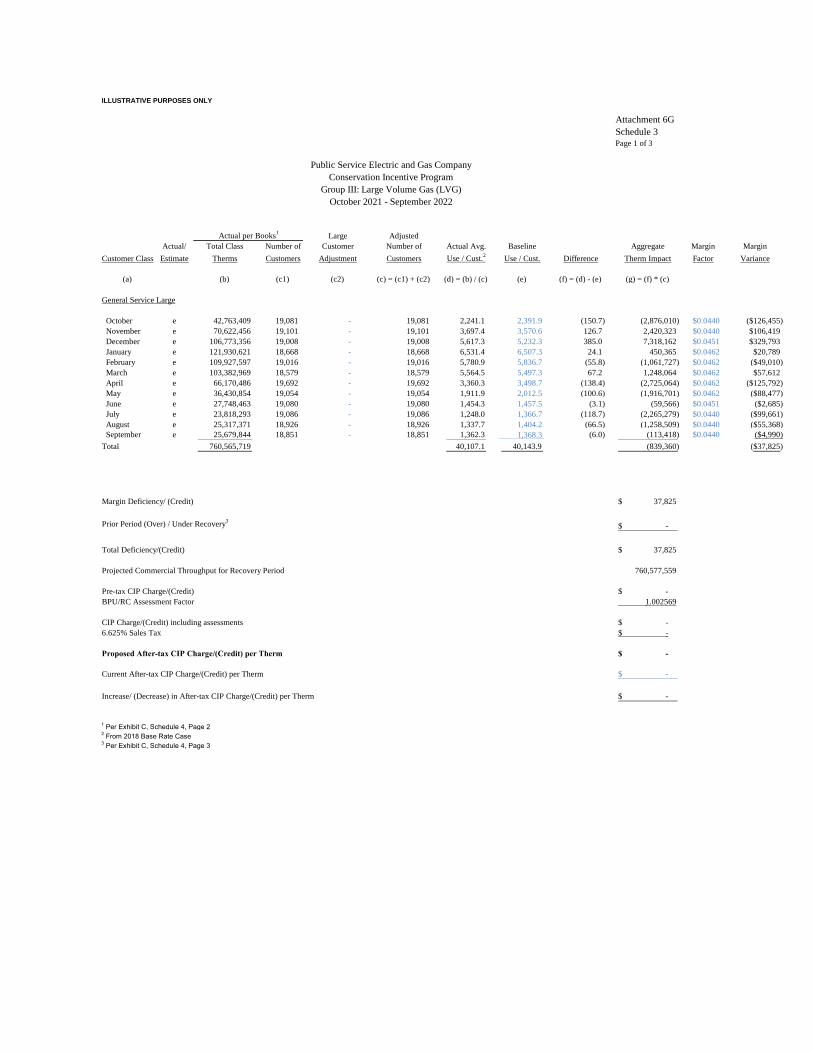
ILLUSTRATIVE PURPOSES ONLY
Attachment 6G
Schedule 3
Page 1 of 3
Conservation Incentive Program
Group III: Large Volume Gas (LVG)
October 2021 - September 2022
Actual per Books1
Large Adjusted
Actual/ Total Class Number of Customer Number of Actual Avg. Baseline Aggregate Margin Margin
Customer Class Estimate Therms Customers Adjustment Customers Use / Cust.2
Use / Cust. Difference Therm Impact Factor Variance
(a) (b) (c1) (c2) (c) = (c1) + (c2) (d) = (b) / (c) (e) (f) = (d) - (e) (g) = (f) * (c)
General Service Large
October e 42,763,409 19,081 - 19,081 2,241.1 2,391.9 (150.7) (2,876,010) $0.0440 ($126,455)
November e 70,622,456 19,101 - 19,101 3,697.4 3,570.6 126.7 2,420,323 $0.0440 $106,419
December e 106,773,356 19,008 - 19,008 5,617.3 5,232.3 385.0 7,318,162 $0.0451 $329,793
January e 121,930,621 18,668 - 18,668 6,531.4 6,507.3 24.1 450,365 $0.0462 $20,789
February e 109,927,597 19,016 - 19,016 5,780.9 5,836.7 (55.8) (1,061,727) $0.0462 ($49,010)
March e 103,382,969 18,579 - 18,579 5,564.5 5,497.3 67.2 1,248,064 $0.0462 $57,612
April e 66,170,486 19,692 - 19,692 3,360.3 3,498.7 (138.4) (2,725,064) $0.0462 ($125,792)
May e 36,430,854 19,054 - 19,054 1,911.9 2,012.5 (100.6) (1,916,701) $0.0462 ($88,477)
June e 27,748,463 19,080 - 19,080 1,454.3 1,457.5 (3.1) (59,566) $0.0451 ($2,685)
July e 23,818,293 19,086 - 19,086 1,248.0 1,366.7 (118.7) (2,265,279) $0.0440 ($99,661)
August e 25,317,371 18,926 - 18,926 1,337.7 1,404.2 (66.5) (1,258,509) $0.0440 ($55,368)
September e 25,679,844 18,851 - 18,851 1,362.3 1,368.3 (6.0) (113,418) $0.0440 ($4,990)
Total 760,565,719 40,107.1 40,143.9 (839,360) ($37,825)
Margin Deficiency/ (Credit) 37,825$
Prior Period (Over) / Under Recovery3
-$
Total Deficiency/(Credit) 37,825$
Projected Commercial Throughput for Recovery Period 760,577,559
Pre-tax CIP Charge/(Credit) -$
BPU/RC Assessment Factor 1.002569
CIP Charge/(Credit) including assessments -$
6.625% Sales Tax -$
Proposed After-tax CIP Charge/(Credit) per Therm -$
Current After-tax CIP Charge/(Credit) per Therm -$
Increase/ (Decrease) in After-tax CIP Charge/(Credit) per Therm -$
1 Per Exhibit C, Schedule 4, Page 22 From 2018 Base Rate Case3 Per Exhibit C, Schedule 4, Page 3
Public Service Electric and Gas Company

ILLUSTRATIVE PURPOSES ONLY
Attachment 6G
Schedule 3
Page 2 of 3
Public Service Electric and Gas CompanyCustomers and Therms
Group III: Large Volume Gas (LVG)
Estimate Estimate Estimate Estimate Estimate Estimate Estimate Estimate Estimate Estimate Estimate Estimate
Oct-21 Nov-21 Dec-21 Jan-22 Feb-22 Mar-22 Apr-22 May-22 Jun-22 Jul-22 Aug-22 Sep-22
CustomersLVG 19,081 19,101 19,008 18,668 19,016 18,579 19,692 19,054 19,080 19,086 18,926 18,851
Total Customers 19,081 19,101 19,008 18,668 19,016 18,579 19,692 19,054 19,080 19,086 18,926 18,851
VolumesLVG 42,763,409 70,622,456 106,773,356 121,930,621 109,927,597 103,382,969 66,170,486 36,430,854 27,748,463 23,818,293 25,317,371 25,679,844 760,565,719
Total Volumes 42,763,409 70,622,456 106,773,356 121,930,621 109,927,597 103,382,969 66,170,486 36,430,854 27,748,463 23,818,293 25,317,371 25,679,844 760,565,719
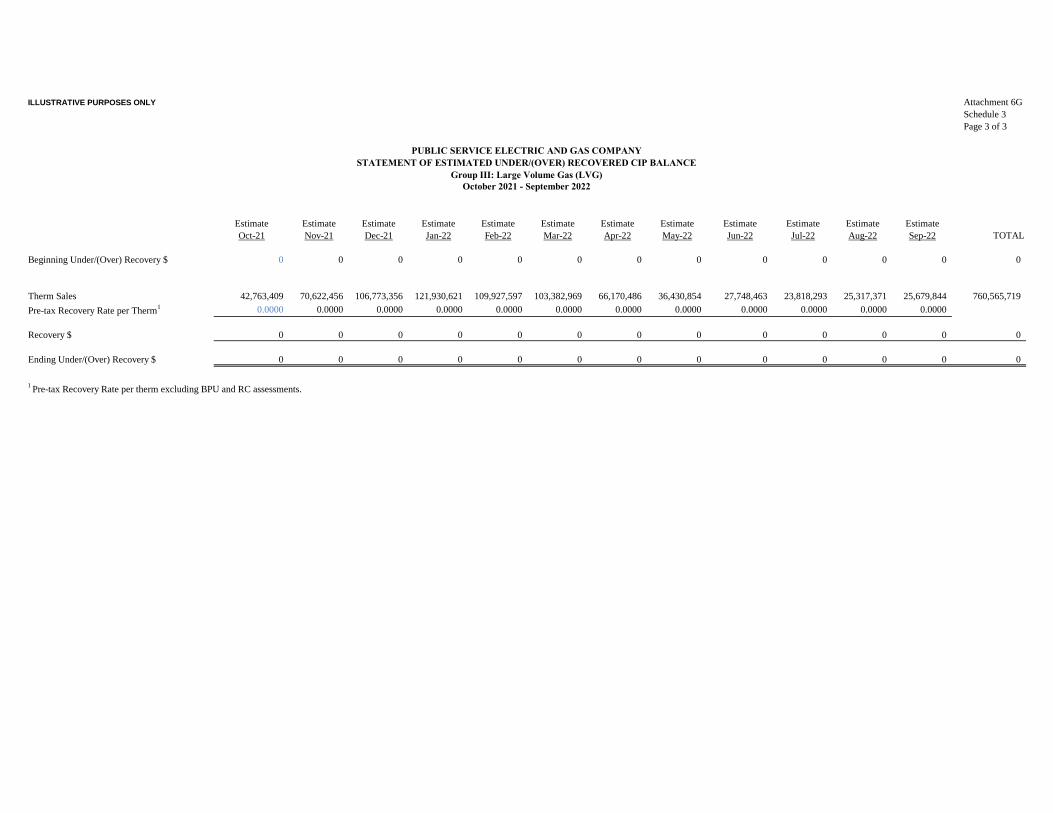
ILLUSTRATIVE PURPOSES ONLY Attachment 6G
Schedule 3
Page 3 of 3
PUBLIC SERVICE ELECTRIC AND GAS COMPANYSTATEMENT OF ESTIMATED UNDER/(OVER) RECOVERED CIP BALANCE
Group III: Large Volume Gas (LVG)
Estimate Estimate Estimate Estimate Estimate Estimate Estimate Estimate Estimate Estimate Estimate Estimate
Oct-21 Nov-21 Dec-21 Jan-22 Feb-22 Mar-22 Apr-22 May-22 Jun-22 Jul-22 Aug-22 Sep-22 TOTAL
Beginning Under/(Over) Recovery $ 0 0 0 0 0 0 0 0 0 0 0 0 0
Therm Sales 42,763,409 70,622,456 106,773,356 121,930,621 109,927,597 103,382,969 66,170,486 36,430,854 27,748,463 23,818,293 25,317,371 25,679,844 760,565,719
Pre-tax Recovery Rate per Therm1 0.0000 0.0000 0.0000 0.0000 0.0000 0.0000 0.0000 0.0000 0.0000 0.0000 0.0000 0.0000
Recovery $ 0 0 0 0 0 0 0 0 0 0 0 0 0
Ending Under/(Over) Recovery $ 0 0 0 0 0 0 0 0 0 0 0 0 0
October 2021 - September 2022
1 Pre-tax Recovery Rate per therm excluding BPU and RC assessments.

ILLUSTRATIVE PURPOSES ONLY Attachment 6GSchedule 4
Step 1: Determine the degree day variance from the dead band.0.50%
Normal Dead Actual Normalization
Degree Days Band Low End High End Degree Days Amount (1)
October 243 1 242 244 243 - November 516 3 514 519 516 - December 827 4 823 831 827 - January 1,003 5 998 1,008 1,003 - February 858 4 854 862 858 - March 692 3 688 695 692 - April 358 2 356 359 358 - May 124 1 123 124 124 -
Step 2: Determine the normalized volumes by rate class.
RSG GSG LVG RSG GSG LVG
October 155,872 17,368 88,550 - - - November 249,538 31,588 88,550 - - - December 246,824 54,161 88,550 - - - January 284,118 68,715 89,001 - - - February 291,909 59,983 89,001 - - - March 292,968 61,432 89,001 - - - April 270,873 61,014 89,001 - - - May 196,672 17,503 89,001 - - -
Step 3: Calculate the margin revenue to be deferred.
Margin Revenue Factor:
December 2020- May 2021 0.36071 0.28830 0.04198
October 2020 - November 2020 0.35139 0.28326 0.04181 Total
October -$ -$ -$ -$ November -$ -$ -$ -$ December -$ -$ -$ -$ January -$ -$ -$ -$ February -$ -$ -$ -$ March -$ -$ -$ -$ April -$ -$ -$ -$ May -$ -$ -$ -$ Winter Period Total -$ -$ -$ -$
(1) Amount above or below the Dead Band
(2) Consumption factors to be true-up at the end of the Winter Period for actual # of customers.
(3) Normalization degree days x Therms Per Degree Day
(4) Normalization Volumes x Margin Revenue Factor
Margin Revenue Deferral (4)
Public Service Electric and GasWeather Normalization
2021-2022 Winter Period
Dead Band
Therms Per Degree Day (2) Normalization Volumes (3)

ILLUSTRATIVE PURPOSES ONLY Attachment 6GSchedule 5Page 1 of 5
Determine Weather and Non-Weather CIP ImpactsWeather Non-Weather Total
CIP Group 1 (RSG) -$ 4,355,105$ 4,355,105$
CIP Group 2 (GSG) -$ 1,952,111$ 1,952,111$
CIP Group 3 (LVG) -$ 37,825$ 37,825$
Total Deficiency/(Credit) -$ 6,345,041$ 6,345,041$
Step 2: Apply Modified BGSS Savings Test
A. Non-weather Impact Subject to Modified BGSS Savings Test
Non-Weather Impact 6,345,041$
75% Factor 75%
Subtotal 4,758,781$
Prior Year Carry-Forward (Modified BGSS Savings Test) -$
Non-weather Impact Subject to Test 4,758,781$
B. BGSS Savings
Permanent Capacity Savings (Exhibit C, Schedule 6, Page 3) 45,394,957$
Additional Capacity BGSS Savings (Exhibit C, Schedule 6, Page 3) -$
Avoided Cost BGSS Savings (Exhibit C, Schedule 6, Page 4) 3,387,831$
Total BGSS Savings 48,782,788$
C. Results
Non-Weather Impacts Passing Test (current accrual) 6,345,041$ Non-Weather Impacts Passing Test (prior year carry-forward) -$ Non-Weather Impacts Exceeding Test -$
Public Service Electric and GasConservation Incentive Program Filing
October 2021 - September 2022CIP Recovery Tests
Summary

ILLUSTRATIVE PURPOSES ONLY
Attachment 6GSchedule 6Page 2 of 5
Step 3: Apply Variable Margin Revenue Test
A. Non-weather Impact Subject to Variable Margin Revenue Test
Non-Weather Impact 6,345,041$
Prior Year Carry-Forward (Variable Margin Revenue Test) -$
Non-weather Impact Subject to Test 6,345,041$
B. Variable Margin Revenues
Variable Margin Revenues (Exhibit C, Schedule 6, Page 5) 695,148,298$
6.5% Factor 6.5%
Total Fixed Recovery Cap 45,184,639$
C. Results
Non-Weather Impacts Passing Test (current accrual) 6,345,041$ Non-Weather Impacts Passing Test (prior year carry-forward) -$ Non-Weather Impacts Exceeding Test -$
Step 4: Determine Recoverable Non-Weather CIP Impacts
A. Current Year Accrual Recoverable Non-Weather Impacts
Amount Passing Modified BGSS Savings Test 6,345,041$
Amount Passing Variable Margin Revenue Test 6,345,041$
Recoverable Amount 6,345,041$
B. Previous Carry-Forward Recoverable Amounts
Amount Passing Modified BGSS Savings Test -$
Amount Passing Variable Margin Revenue Test -$
Deduction for any amount also included in above -$
-$
Total Non-Weather Recoverable CIP Amount 6,345,041$
Summary
Public Service Electric and GasConservation Incentive Program Filing
October 2021 - September 2022CIP Recovery Tests

Attachment 6GSchedule 5Page 3 of 5
I. Permanent BGSS SavingsPipeline Contract No. Type of Transaction Quantity Dth Annual $
Texas Eastern 870146 Contract Terminated 88,321 3,539,906$
Texas Eastern 870145 Contract Terminated 25,000 821,250
Texas Eastern 911678 Contract Reduced 33,376 1,400,000
Texas Eastern 911677 Contract Reduced 56,493 2,000,000
Texas Eastern 911679 Contract Reduced 59,817 2,200,000
Dominion 200318/200315 Contract Terminated 43,300 1,089,237
Dominion 525445 Contract Reduced 48,526 2,537,483
Dominion 200482 Contract Reduced 55,737 4,271,190
National Fuel F11135 Contract Terminated 48,400 3,545,087
National Fuel F10833 Contract Terminated 30,795 1,265,702
National Fuel F10845 Contract Terminated 20,000 822,018
Steuben 4 Contract Terminated 11,111 1,084,634
Steuben 3 Contract Terminated 30,955 3,333,011
Trunkline 21079 Contract Terminated 89,392 6,630,062
Trunkline 20912 Contract Terminated 25,242 998,725
Panhandle 22945 Contract Terminated 88,498 2,994,348
Panhandle 22652 Contract Terminated 25,000 718,138
Texas Gas T025024 Contract Terminated 85,417 6,144,167
Total Permanent Reductions 45,394,957$
II. Additional Capacity BGSS Savings
CIP Recovery
Year Annual $
2020-2021 -$
III. Avoided Capacity
CIP Recovery
Year Annual $
2020-2021 3,387,831$
VI. Total of all Savings
CIP Recovery Year
Permanent
Capacity Savings
Additional Capacity BGSS
Savings
Avoided Cost
BGSS Savings Annual $
2020-2021 45,394,957$ -$ 3,387,831$ 48,782,788$
Public Service Electric and Gas Company
CIP BGSS SavingsCIP Recovery Tests

ILLUSTRATIVE PURPOSES ONLY Attachment 6GSchedule 5Page 4 of 5
Base Year Current Year Net Increase/ (Decrease) Baseline Avoided
Month Customer Count Customer Count Customer Count Use / Cust. Capacity
(a) (b) (c) (d) = (b) / (c) (e) (f) = (d) * (e)
Group 1: RSG
October 1,624,278 1,660,099 35,821 38.8 1,388,915
November 1,630,996 1,664,795 33,799 87.3 2,951,107
December 1,635,566 1,663,080 27,514 144.0 3,961,612
January 1,636,952 1,661,673 24,721 179.4 4,434,874
February 1,630,001 1,662,634 32,633 153.1 4,995,253
March 1,615,444 1,643,868 28,424 125.3 3,561,676
April 1,653,790 1,684,260 30,470 69.2 2,109,693
May 1,636,600 1,669,027 32,427 36.7 1,191,044
June 1,631,876 1,669,739 37,863 21.0 793,411
July 1,683,288 1,674,659 (8,629) 17.3 (149,565)
August 1,621,557 1,672,495 50,938 18.1 920,535
September 1,630,455 1,670,608 40,153 19.5 782,444
Subtotal 909.7 26,940,999
Average Per Unit BGSS Capacity Cost 0.12575
Total Avoided Capacity Cost BGSS Savings $3,387,831
Notes:
(1) Base Year Customer Count is equal to the test year customer count used to set base rates in a base rate case
(2) Current Year Customer Count is equal to the customer count in the CIP accrual year.
(3) The average per unit BGSS Capacity Cost represents the average of all capacity costs in the BGSS portfolio
included in the annual BGSS filing for the prospective BGSS year. This value is used as a proxy for the avoided cost of incremental capacity.
Avoided Capacity Cost BGSS Savings
Public Service Electric and GasCIP Recovery Tests

ILLUSTRATIVE PURPOSES ONLY Attachment 6GSchedule 5Page 5 of 5
Group I (RSG) $572,054,911
Group II (GSG) $88,504,755
Group III (LVG) $34,588,632
Total Variable Margin $695,148,298
Actual/ Number of Baseline Margin Variable
Customer Class Estimate Customers Use / Cust. Factor Revenue
RSG
October e 1,660,099 38.8 $0.3686 $23,725,156
November e 1,664,795 87.3 $0.3686 $53,576,514
December e 1,663,080 144.0 $0.3743 $89,623,633
January e 1,661,673 179.4 $0.3800 $113,266,416
February e 1,662,634 153.1 $0.3800 $96,699,726
March e 1,643,868 125.3 $0.3800 $78,264,526
April e 1,684,260 69.2 $0.3800 $44,308,922
May e 1,669,027 36.7 $0.3800 $23,292,338
June e 1,669,739 21.0 $0.3851 $13,473,757
July e 1,674,659 17.3 $0.3902 $11,326,878
August e 1,672,495 18.1 $0.3902 $11,793,969
September e 1,670,608 19.5 $0.3902 $12,703,075
Total 909.7 $572,054,911
GSG
October e 139,593 112.2 $0.2926 $4,583,213
November e 139,796 173.7 $0.2926 $7,103,377
December e 139,531 320.4 $0.2956 $13,215,149
January e 139,557 433.7 $0.2987 $18,080,212
February e 139,502 354.4 $0.2987 $14,769,162
March e 137,321 281.5 $0.2987 $11,547,748
April e 140,732 164.4 $0.2987 $6,910,111
May e 140,077 80.6 $0.2987 $3,373,728
June e 140,041 49.7 $0.3014 $2,095,763
July e 138,968 57.1 $0.3040 $2,413,539
August e 139,089 51.2 $0.3040 $2,164,358
September e 138,549 53.4 $0.3040 $2,248,396
Total 2,132.3 $88,504,755
LVG
October e 19,081 2,391.9 $0.0440 $2,006,715
November e 19,101 3,570.6 $0.0440 $2,998,783
December e 19,008 5,232.3 $0.0451 $4,481,945
January e 18,668 6,507.3 $0.0462 $5,607,648
February e 19,016 5,836.7 $0.0462 $5,123,380
March e 18,579 5,497.3 $0.0462 $4,714,650
April e 19,692 3,498.7 $0.0462 $3,180,291
May e 19,054 2,012.5 $0.0462 $1,770,159
June e 19,080 1,457.5 $0.0451 $1,253,530
July e 19,086 1,366.7 $0.0440 $1,147,551
August e 18,926 1,404.2 $0.0440 $1,169,202
September e 18,851 1,368.3 $0.0440 $1,134,777
Total 40,143.9 $34,588,632
Public Service Electric and GasCIP Recovery Tests
Variable Margin

ILLUSTRATIVE PURPOSES ONLY
Attachment 6GSchedule 6
PUBLIC SERVICE ELECTRIC AND GASCONSERVATION INCENTIVE PROGRAM
EARNINGS TESTAPRIL 1, 2021 THROUGH MARCH 31, 2022
NINE MONTHS ACTUAL, THREE MONTHS ESTIMATE
in $000
1 Equity Base for Earnings Test 3,000,000
2 Allowed ROE 9.6% 2018 Base Rate Case
3 ROE Limit buffer 0.5% From IIP
4 Maximum ROE 10.1% = ln 2 + ln 3
5 Actual Net Income 250,000
6 ROE for Earnings Test 8.33% = ln 5 / ln 1
7 Earnings Test Pass / Fail Pass = IF ln 4 > 6, Pass else Fail