STATE OF EVALUATION 2016 · Criteria for adequate evaluation capacity may ... evaluation capacity...
24
A RESEARCH STUDY BY: STATE OF EVALUATION 2016 Evaluation Practice and Capacity in the Nonprofit Sector
Transcript of STATE OF EVALUATION 2016 · Criteria for adequate evaluation capacity may ... evaluation capacity...

A RESEARCH STUDY BY:
STATE OF EVALUATION2016Evaluation Practice and Capacityin the Nonprofit Sector
#SOE2016
We appreciate the support of the David and Lucile Packard Foundation, the Robert Wood Johnson Foundation, and the Bruner Foundation for funding this research. The findings and conclusions presented in this report are those of the authors alone and do not necessarily reflect the opinions of our funders. This project was informed by seven advisors: Diana Scearce, Ehren Reed, Lester Baxter, Lori Nascimento, Kelci Price, Michelle M. Doty, and J McCray. Thank you for your time and suggestions. The authors acknowledge Innovation Network staff Natalia Goldin, Elidé Flores-Medel, and Laura Lehman for their contributions to this report and Stephanie Darby for the many ways she makes our work possible, and consultant Erin Keely O’Brien for her indispensible survey design advice. We also thank former Innovation Network staff Katherine Haugh, Yuqi Wang, and Smriti Bajracharya for their contributions to project design, and our evaluation colleagues and former State of Evaluation authors Ehren Reed and Ann K. Emery. And finally, we recognize the 1,125 staff of nonprofit organizations throughout the United States who took the time to thoughtfully complete the State of Evaluation 2016 survey.
stateofevaluation.org
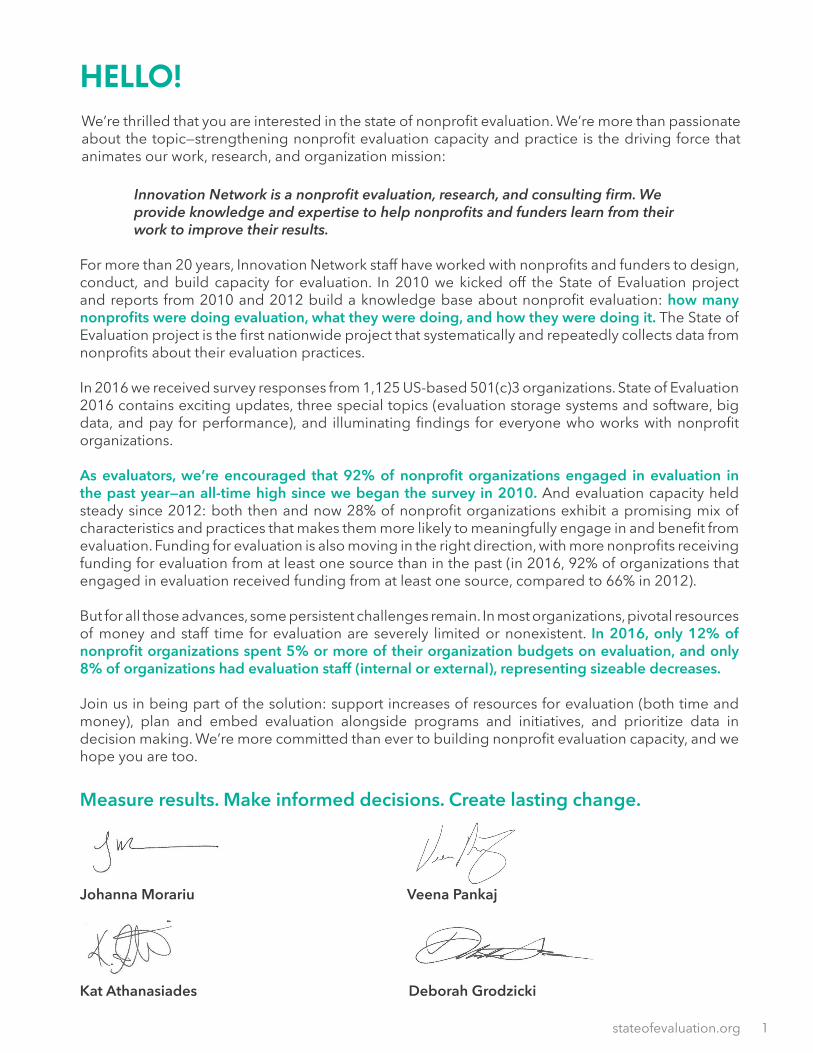
We’re thrilled that you are interested in the state of nonprofit evaluation. We’re more than passionate about the topic—strengthening nonprofit evaluation capacity and practice is the driving force that animates our work, research, and organization mission:
For more than 20 years, Innovation Network staff have worked with nonprofits and funders to design, conduct, and build capacity for evaluation. In 2010 we kicked off the State of Evaluation project and reports from 2010 and 2012 build a knowledge base about nonprofit evaluation: how many nonprofits were doing evaluation, what they were doing, and how they were doing it. The State of Evaluation project is the first nationwide project that systematically and repeatedly collects data from nonprofits about their evaluation practices.
In 2016 we received survey responses from 1,125 US-based 501(c)3 organizations. State of Evaluation 2016 contains exciting updates, three special topics (evaluation storage systems and software, big data, and pay for performance), and illuminating findings for everyone who works with nonprofit organizations.
As evaluators, we’re encouraged that 92% of nonprofit organizations engaged in evaluation in the past year—an all-time high since we began the survey in 2010. And evaluation capacity held steady since 2012: both then and now 28% of nonprofit organizations exhibit a promising mix of characteristics and practices that makes them more likely to meaningfully engage in and benefit from evaluation. Funding for evaluation is also moving in the right direction, with more nonprofits receiving funding for evaluation from at least one source than in the past (in 2016, 92% of organizations that engaged in evaluation received funding from at least one source, compared to 66% in 2012).
But for all those advances, some persistent challenges remain. In most organizations, pivotal resources of money and staff time for evaluation are severely limited or nonexistent. In 2016, only 12% of nonprofit organizations spent 5% or more of their organization budgets on evaluation, and only 8% of organizations had evaluation staff (internal or external), representing sizeable decreases.
Join us in being part of the solution: support increases of resources for evaluation (both time and money), plan and embed evaluation alongside programs and initiatives, and prioritize data in decision making. We’re more committed than ever to building nonprofit evaluation capacity, and we hope you are too.
Measure results. Make informed decisions. Create lasting change.
HELLO!
Innovation Network is a nonprofit evaluation, research, and consulting firm. We provide knowledge and expertise to help nonprofits and funders learn from their work to improve their results.
Johanna Morariu Veena Pankaj
Kat Athanasiades Deborah Grodzicki
1

#SOE2016
State of evaluation 2016Evaluation is the tool that enables nonprofit organizations to define success and measure results in order to create lasting change. Across the social sector, evaluation takes many forms. Some nonprofit organizations conduct randomized control trial studies, and other nonprofits use qualitative designs such as case studies. Since this project launched in 2010, we have seen a slow but positive trend of an increasing percentage of nonprofit organizations engaging in evaluation. In 2016, 92% of nonprofit organizations engaged in evaluation.
Promising Capacity
Evaluation capacity is the extent to which an organization has the culture, expertise, and resources to continually engage in evaluation (i.e., evaluation as a continuous lifecycle of assessment, learning, and improvement). Criteria for adequate evaluation capacity may differ across organizations. We suggest that promising evaluation capacity is comprised of some internal evaluation capacity, the existence of some foundational evaluation tools, and a practice of at least annually engaging in evaluation. Applying these criteria, 28% of nonprofit organizations exhibit promising evaluation capacity (exactly the same percentage as in 2012).
2016
2012
2010
92%
90%
85%
28% of nonprofit organizations have promising evaluation capacity
evaluated their work [n=1,125]
evaluated their work [n=535]
evaluated their work [n=1,043]
74%
8%
62%
83%92%
of those with logic models or similar documents updated them within the past year
of those had a logic model or similar document
of those had medium or high internal capacitydid not evaluate their work or did not know if their organi-zation eval- uated its work
evaluated their work
2

stateofevaluation.org
The nonprofit evaluation report card is a round-up of key indicators about resources, behaviors, and culture. Comparing 2016 to 2012, what’s gotten better, worse, or stayed the same?
Nonprofit Evaluation Report Card
92%
92%
85%
28%
58%
12%
8%
of nonprofit organizations engaged in evaluation, compared to 90% of nonprofits in 2012
of nonprofit organizations received funding for evaluation from at least one source, compared to 66% of nonprofits in 2012
of nonprofit organizations agree that they need evaluation to know that their approach is working, compared to 68% of nonprofits in 2012
of nonprofit organizations exhibited promising evaluation capacities, compared to 28% of nonprofits in 2012
of nonprofit organizations had a logic model or theory of change, compared to 60% of nonprofits in 2012
of nonprofit organizations spent 5% or more of their budgets on evaluation, compared to 27% of nonprofits in 2012
of nonprofit organizations have evaluation staff primarily responsible for evaluation, compared to 25% of nonprofits in 2012
3

#SOE2016
Purpose & Resourcing
Nonprofit organizations conduct evaluation for a variety of reasons. Evaluation can help nonprofits better understand the work they are doing and inform strategic adjustments to programming. In 2016, nonprofits continue to prioritize evaluation for the purpose of strengthening future work (95% of respondents identified it as a priority), learning whether objectives were achieved (94%), and learning about outcomes (91%). [n=877]
Funding for EvaluationIn 2016, 92% of organizations identified at least one source of funding for evaluation and 68% of organizations that received funding identified foundations and philanthropy as the top funding source for evaluation. [n=775]
Priorities for Conducting Evaluation
Strengthenfuture work
Learn about outcomes
Contribute to
knowledge in the field
Learn whether original
objectives were achieved
Learn from
implementation
Respond to funder demands
Strengthenpublic policy
25%
70%
61%
55%
43%
26%
18%
56%
33%35%
31% 42%Moderate
priority
39%
30%
68% 65%
51% 48%
34%
Foundation or Philanthropic Contributions
Individual Donor
Contributions
Corporate Charitable
Conbritutions
Government Grants or Contracts
Dues, Fees, or Other
Direct Charges
Essentialpriority
Organizations funded by philanthropy were more likely to measure outcomes
4

stateofevaluation.org
100%
90%
80%
70%
60%
50%
40%
30%
20%
10%
0%
2010 2012 2016
A majority of organizations spend less than the recommended amount on evaluation. Based on our experience working in the social sector, nonprofit organizations should be allocating 5% to 10% of organization budgets to evaluation. In 2016, 84% of the organizations spent less than the recommended amount on evaluation. [n=740]
Organizations spent less on evaluation than in prior years. The gap between how much an organization should spend on evaluation and what they actually spend has increased. [n=775]
Budgeting for Evaluation
Percent of Annual Budget Spent on Evaluation
0%
2%Less than
2-5%
5-10%10%or more 4% of organizations
8% of organizations
25% of organizations
43% of organizations
16% of organizations
84%of organizations spend less than 5% on evaluation
The percentage of organizations that spend less than 5% of the organization budget on evaluation has increased from 76% in 2010 to 84% in 2016.
The percentage of organizations that spend no money on evaluation has increased from 12% in 2010 to 16% in 2016.
The percentage of organizations that spend 5% or more of the organization budget has declined from 23% in 2010 to 12% in 2016.
84%
73%76%
12%
27%23%
16%
7%
12%
5

#SOE2016
EVALUATION DESIGN & PRACTICE
Across the sector, nonprofits are more likely to use quantitative data collection methods. Large organizations (organizations with annual budgets of $5 million or more) continue to engage in a higher percentage of both quantitative and qualitative data collection methods than small organizations (annual budgets of less than $500,000) and medium-sized organizations (annual budgets of $500,000 to $4.99 million).
There are a variety of evaluation approaches available to nonprofit organizations. In 2016, over 90% of organizations have selected approaches to understand the difference they are making through their work (outcomes evaluation), how well they are implementing their programs (process/implementation evaluation), and to assess overall performance accountability (performance measurement).
Common Evaluation Designs
91% 86% 85%
77% 66% 53%
OutcomesEvaluation
PerformanceMeasurement
Process/Implementation
Evaluation
FormativeEvaluation
ImpactEvaluation
Return on Investment
Surveys
Client/Participant
Tracking Forms
Social Media Statistics
and/or Web Analytics
Focus Groups
Interviews
Observations
88% 35%
79% 63%
63% 61%
94% 50%
80% 72%
72% 71%
78% 21%
66% 60%
57% 54%
QUANTITATIVE PRACTICES QUALITATIVE PRACTICES
Small organizations
Small organizations
Medium organizations
Medium organizations
Large organizations
Large organizations
Data Collection Methods
For this analysis, n values for small organizations ranged from 235 to 241, n values for medium organizations ranged from 370 to 380, and n values for large organizations ranged from 110 to 112.
6

stateofevaluation.org
100%
90%
80%
70%
60%
50%
40%
30%
20%
10%
0%
2010 2012 2016
Logic models and theories of change are common tools used by organizations to guide evaluation design and practice. They demonstrate the connections between the work being done by an organization and the types of changes programs are designed to achieve. Having a logic model or theory of change is seen as a positive organizational attribute and demonstrates an organization’s ability to plan for an evaluation.
Since 2010, more large organizations have created or revised their logic model/theory of change at least annually, in comparison to small organizations.
Evaluation Planning
In 2016, 56% of large organizations created or revised their logic model or theory of change within the past year (up from 45% in 2012, and on par with 2010). [2016: n=112]
In 2016, 35% of small organizations created or revised their logic model or theory of change within the past year (up from 30% in 2012, and on par with 2010). [2016: n=242]
56%
34% 30% 35%
56%
45%
58%
44%
All organizations[n=812]
Organizations that have a logic model/theory of change
Organizations that have created or revised a logic model/theory of change in the past year
Organizations that have a logic model/theory of change are more likely to:
• agree that evaluation is needed to know that an approach is working
• have higher organizational budgets
• have more supports for evaluation
• have foundation or philanthropic charitable contributions support their evaluation
7

#SOE2016
Staffing
Evaluation staffing varies dramatically among nonprofit organizations. One in five large organizations and almost one in ten medium organizations have evaluation staff. Not surprisingly, small organizations are very unlikely to have evaluation staff. While this difference in staff resources is intuitive, organizations without evaluation staff are still frequently expected to collect data, measure their results, and report data to internal and external audiences. Furthermore, organizations with evaluation staff were found to be more likely to exhibit the mix of characteristics and behaviors of promising evaluation capacity.
Who is primarily responsible for conducting evaluation work within an organization varies dramatically. Of organizations that evaluate, most nonprofit organizations (63%) report that the executive leadership or program staff were primarily responsible for conducting evaluations. Only 6% of nonprofit organizations report having internal evaluation staff, and 2% indicate that evaluation work was led by an external evaluator. [n=786]
Board of Directors
Executive Leadership
Program Administrative
Only 6% of organizations have internal evaluators
Evaluation Fundraising & Development
Financial
4%
34%
29%
8%
6% 5%
1%
63% of organizations have executives and
program staff primarily responsible for evaluation
Less than1%of organizations do not have someone responsible for conducting evaluations
Large and medium organizations were significantly more likely to have evaluation
staff (20% and 8%, respectively), compared to small
organizations (2%), p < .001.
Significantly more organizations with evaluation staff reported having promising evaluation capacity (60%), compared to
organizations without evaluation staff (36%), p < .001.
ORGANIZATION SIZE ORGANIZATION CAPACITY
Organization Size, Staffing, and Capacity
8
stateofevaluation.org
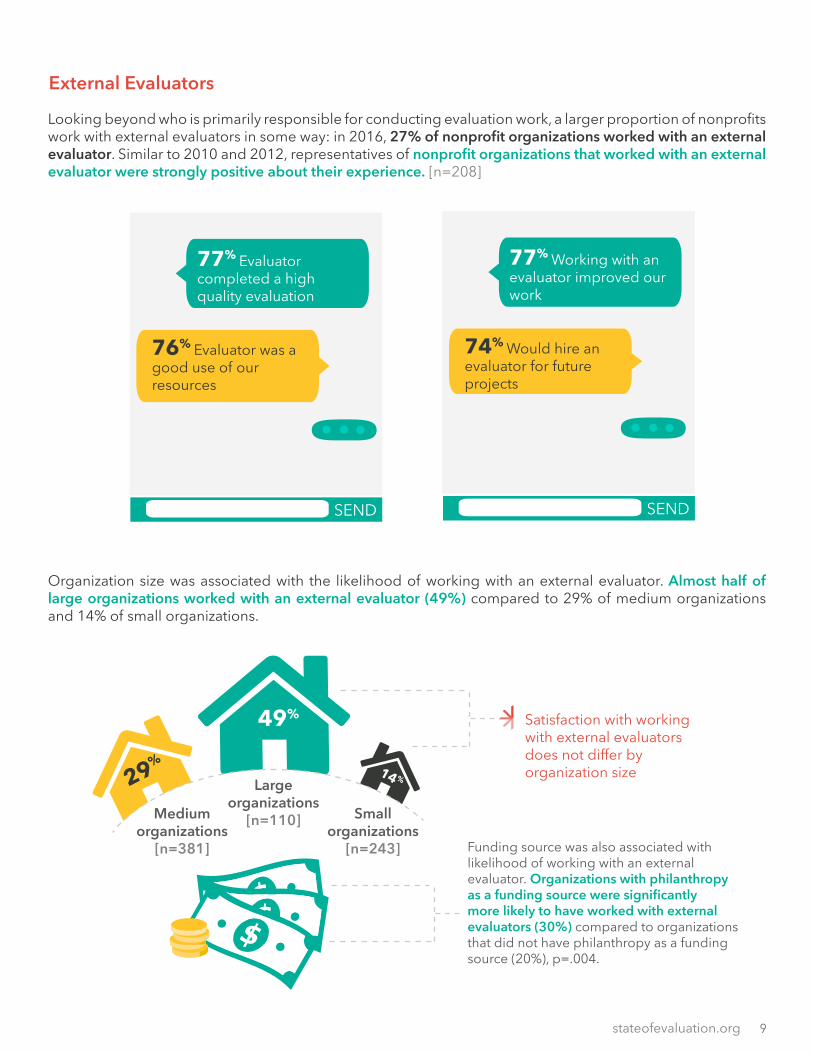
Looking beyond who is primarily responsible for conducting evaluation work, a larger proportion of nonprofits work with external evaluators in some way: in 2016, 27% of nonprofit organizations worked with an external evaluator. Similar to 2010 and 2012, representatives of nonprofit organizations that worked with an external evaluator were strongly positive about their experience. [n=208]
Organization size was associated with the likelihood of working with an external evaluator. Almost half of large organizations worked with an external evaluator (49%) compared to 29% of medium organizations and 14% of small organizations.
External Evaluators
Funding source was also associated with likelihood of working with an external evaluator. Organizations with philanthropy as a funding source were significantly more likely to have worked with external evaluators (30%) compared to organizations that did not have philanthropy as a funding source (20%), p=.004.
Satisfaction with working with external evaluators does not differ by organization size
49%
29% 14 %
Small organizations
[n=243]
Medium organizations
[n=381]
Large organizations
[n=110]
77% Evaluator completed a high quality evaluation
77% Working with an evaluator improved our work
76% Evaluator was a good use of our resources
74% Would hire an evaluator for future projects
9

#SOE2016
AUDIENCE & USEIn 2016, 85% of nonprofit organizations reported that executive staff (CEO or ED) were the primary audience for evaluation, a 10% increase from 2012. Over three-quarters of nonprofit organizations also identified the Board of Directors as a primary audience. [n=842]
Similar to previous years, most nonprofit organizations use evaluation to measure outcomes, answering the question of What difference did we make? Almost as many nonprofit organizations focus on measuring quality and quantity, answering the questions of How well did we do? and How much did we do? This finding highlights the importance nonprofit organizations place on measuring quality and quantity in addition to outcomes. [n=953]
% NOT AN AUDIENCE % PRIMARY AUDIENCE % SECONDARY AUDIENCE
3% 85%
76%
70%
40%
29%
23%
8% 52%
37%
37%
46%
25%
21%
11%
3%
4%
13%
32%
37%
38%
Executive Staff (CEO/ED)
Funders
Board of Directors
Non-executive Staff
Clients
Policymakers
Peer Organizations
How well did we do?
What difference did we make?
How much did we do?
90.6%
91.3%
89.6%
Evaluation Focus
10

stateofevaluation.org
Organizations use evaluation results for internal and external purposes, with 94% of nonprofit organizations using results to report to the Board of Directors (internal) and 93% of nonprofit organizations using results to report to funders (external). [n=869]
Nonprofit organizations were asked to indicate the extent to which they use evaluation results to support new initiatives, compare organization performance to a specific goal or benchmark, and/or assess organization performance without comparing results to a specific goal or benchmark. Over 85% of organizations regularly use evaluation results to support the development of new initiatives, demonstrating a growing number of organizations using evaluation to inform and develop their work. [n=851]
52%
91%
57%
94%
82%
93%
86%
73%
Plan/Revise Program Initiatives
Advocate for a Cause
Share Findings with
Peers
Reporting to Board of Directors
Report to Stakeholders
Make Allocation Decisions
Report to Funders
Plan/Revise General
Strategies
Support development of new Initiatives
Compare to specific goal or benchmark
Assess performance without comparing to goal or
benchmark
44% 51% 43%
42% 33% 38%
often often often
sometimes sometimes sometimes
Evaluation Use
11

#SOE2016
Barriers & SupportsTime, staff, money, knowledge—these and other factors can heavily influence whether organizations conduct evaluation. Support from organizational leadership, sufficient staff knowledge, skills, and/or tools, and an organization culture in support of evaluation were far and away the most helpful organizational supports for evaluation.
Limited staff time, insufficient financial resources, and limited staff expertise in evaluation continue to be the top three barriers organizations face in evaluating their work. These are the same top three challenges named in State of Evaluation 2012 and 2010. Having staff who did not believe in the importance of evaluation has become a much greater barrier than in the past: more than twice the percentage of organizations now report this as a challenge to carrying out evaluation (2012: 12%).
BARRIERS [n=830]
SUPPORTS [n=777]
Insufficient support from organization leadership
Limited staff knowledge, skills, and/or tools
Having staff who did not believe in the importance of evaluation
Limited staff time
Disagreements related to data between your organization and a funder
Insufficient financial resources
Not knowing where or how to find an external evaluator
Stakeholders being resistant to data collection
13% 77%
69%
67%
50%
36%
34%
26%
48%
25%
79%
8%
52%
12%
21%
Support from organization
leadership
Sufficient staff knowledge,
skills, and/or tools
Organization culture in
support of evaluation
Staff dedicated to
evaluation tasks
Funder support for evaluation
Sufficient funding
Working with an external
evaluator
12

stateofevaluation.org
Most organizations view evaluation favorably. It is a tool that gives organizations the confidence to say whether their approach works. However, a little under half feel too pressured to measure their results. [n=901]
Of organizations that evaluate their work, 83% talk with their funders about evaluation. This dialogue with funders is generally deemed useful by nonprofits. [n values range from 661 to 800]
Communication and Reporting
Our organization needs evaluation to know that our
approach is working
Data collection interfered with our relationships with clients
Most data that is collected in our organization is not used
There is too much pressure on our organization to measure
our results
85%
73%
69%
57%
AGREE
DISAGREE
DISAGREE
DISAGREE
of funders are accepting of failure
as an opportunity for learning
of nonprofits find discussing findings with funders useful
of nonprofits’ funders are open to including evaluation results in
decisionmaking
49%32%
15%
44% 42% 54%
oftennever ignore
often
sometimes sometimes sometimes
93% 74% 69%
13

#SOE2016
Big Data
Data Trends
Big data is a collection of data, or a dataset, that is very large. A classic example of big data is US Census data. Using US Census data, staff of a nonprofit organization that provided employment services could learn more about employment trends in their community, or monitor changes in employment over time. The ability to work with big data is important, as it enables nonprofits to learn about trends and better target services and other interventions. Thirty-eight percent of organizations are currently using big data, and an additional 9% of organizations report having the ability to use big data but are not currently doing so. [n=820]
Big Data: What It Takes
Organizations that used big data had more supports for evaluation and larger budgets.
9%
38%41%of nonprofits do not have the ability to use big data
of nonprofits are currently using big data
of nonprofits have the ability to use big data but are not currently using it
Organizations that use big data had more supports for evaluation (4.06 supports) than those that did not use big data (3.23 supports), p<.001.
Organizations that use big data hadlarger budgets (budgets of approximately $2-2.49 million, mean=5.56) than those that did not use big data (budgets of approximately $1.5-1.99 million, mean=4.13), p=.003.
mean=3.23
Do not use big data
Do not use big data
mean=4.06
Use big data Use big data
mean=4.13mean=5.56
$2.0M - 2.49M avg
budget $1.5-1.99M
avg budget
14

stateofevaluation.org
Pay for performance (PFP) is when a nonprofit is compensated based on a certain outcome being achieved. Pay for performance funding requires a nonprofit to track information over time about participant outcomes. Often this tracking will need to continue after the program has concluded. For example, in a job training program, participant data would likely need to be tracked for months or years after program participation to be able to report on outcomes such as employment or continued reemployment. Pay for performance arrangements have grown in popularity as a way to reward service providers for affecting change (compared to just providing services). Currently, 13% of organizations receive pay for performance funding, and an additional 35% of organizations report having the ability to meet pay for performance data requirements (but are not currently receiving pay for performance funding). [n=833]
Pay for Performance: What It Takes
35%
13%
48%of nonprofits have the ability or currently receive funding through pay for performance arrangements
of nonprofits receive PFP funding
of nonprofits have the ability but don’t receive PFP funding
Organizations that received pay for performance funding had more supports for evaluation and larger budgets.
43% of nonprofits do not have the ability to collect data sufficient to participate in PFP funding
Organizations that receive pay for performance (PFP) funding had more supports for evaluation (4.26 supports) than those that did not receive PFP funding (3.50 supports), p<.001.
Organizations that receive pay for performance (PFP) funding had larger budgets (budgets of approximately $3.5-3.99 million, mean=8.34) than those that did not receive PFP funding (budgets of approximately $1.5-1.99 million, mean=4.14), p<.001.
mean=3.50
Do not receive PFP
Do not receive PFP
mean=4.26
Receive PFP Receive PFP
mean=4.14
mean=8.34$3.5M – 3.99M
avg budget
$1.5M – 1.99M
avg budget
Pay for Performance
15

#SOE2016
Data storage systems & SoftwareNonprofits store their evaluation data in many different ways, both low- and high-tech. Overall, 92% of nonprofit organizations that engaged in evaluation in 2016 stored evaluation data in some type of storage system. [n=794]
In most organizations, data that can be used for evaluation will come from multiple places. Top data storage methods include spreadsheet software (92%), word processing software (82%), and paper copies/hard copies (82%). Less frequently used methods include survey software (60%) and database solutions (58%). [n=727]
55% of nonprofit organizations are using 4 or more data storage methods. Multiple methods likely represent multiple data collection methods and data types, which could indicate a well-rounded evaluation approach. Having multiple data storage methods makes data analysis and tracking more challenging.
The vast majority (85%) of nonprofit organizations are using 3 or more data storage methods.
of nonprofit organizations store their evaluation data92%
92%
3% 11%
30% 34% 21%
82% 60% 58%82%
Spreadsheet software
1 method
Word processing
software
2 methods
Paper copies or
hard copies
3 methods
Survey software
4 methods
Database
5 methods
16

stateofevaluation.org
Custom database solutions are the frontrunner when it comes to satisfying the needs of nonprofits. These databases may better meet the data storage needs of nonprofits, but also require a level of technical proficiency that may be out of reach for some. On average, nonprofits are satisfied almost half the time. There is room for improvement in matching data storage systems to the needs and resources of nonprofits.
Over half of nonprofit organizations (58%) that evaluated in 2016 used databases to store their evaluation data. Databases were not the most common method, but were still relatively commonplace, which is encouraging. Often, there is a higher barrier to entry to working with databases as they require set-up, some expertise, and maintenance.
Databases
Satisfaction with Data Storage Systems
of organizations that store evaluation data use a custom database, of these 395 organizations:
58%
DISSATISFIED SATISFIED
18% 47%
55%
47%
45%
45%
44%
16%
18%
19%
18%
19%
AVERAGE
Custom database solution
Survey software
Spreadsheet software
Word processing software
Paper copies or hard copies
14% 5% 4%
Use Salesforce
Use CTK Use ETO
17

#SOE2016
Evaluation in the social sectorAcross the social sector, funders work hand in hand with grantee partners to provide services, implement initiatives, track progress, and make an impact. Evaluation in the nonprofit sector has a symbiotic relationship with evaluation in the philanthropic sector. Decisions made by funders affect which nonprofits engage in evaluation, how evaluation is staffed, how evaluation is funded, which types of evaluation are conducted, and other factors.
Evaluation is more likely to be a staffed responsibility in funding institutions compared with nonprofits.
For both funding and nonprofit organizations, reporting to the Board of Directors is the most prevalent use of evaluation data (94% of nonprofits, 87% of funders). The use of evaluation data to plan/revise programs or initiatives and to plan/revise general strategies was also a relatively high priority for both funders and nonprofits. Where funders and nonprofits differ is using data with each other: 93% of nonprofits use their data to report to funders and 45% of funders use their data to report to grantees.
Use of Evaluation Data
NONPROFITS FUNDERS
94% 87%
45%
51%
65%
20%
49%
93%
91%
57%
86%
52%
Report to Board of Directors
Report to funders Report to grantees
Plan/revise program or initiatives
Plan/revise general strategies
Advocacy or influence
Share findings with peers
75%
50%
92%
8%
of funders evaluate their work
of funders have evaluation staff
of nonprofits evaluate their work
of nonprofits have evaluation staff
Source: McCray (2014) Is Grantmaking Getting Smarter?
Source: Buteau & Coffman (2016) Benchmarking Foundation Evaluation Practices. The Center for Effective Philanthropy and the Center for Evaluation Innovation surveyed 127 individuals who were the most senior evaluation or program staff at their foundations. Foundations included in the sample were US-based independent foundations that provided $10 million or more in annual giving or were members of the Center for Evaluation Innovation’s Evaluation Roundtable. Only foundations that were known to have staff with evaluation-related responsibilities were included in the sample; therefore, results are not generalizable.
Source: McCray (2014) Is Grantmaking Getting Smarter?
18
stateofevaluation.org
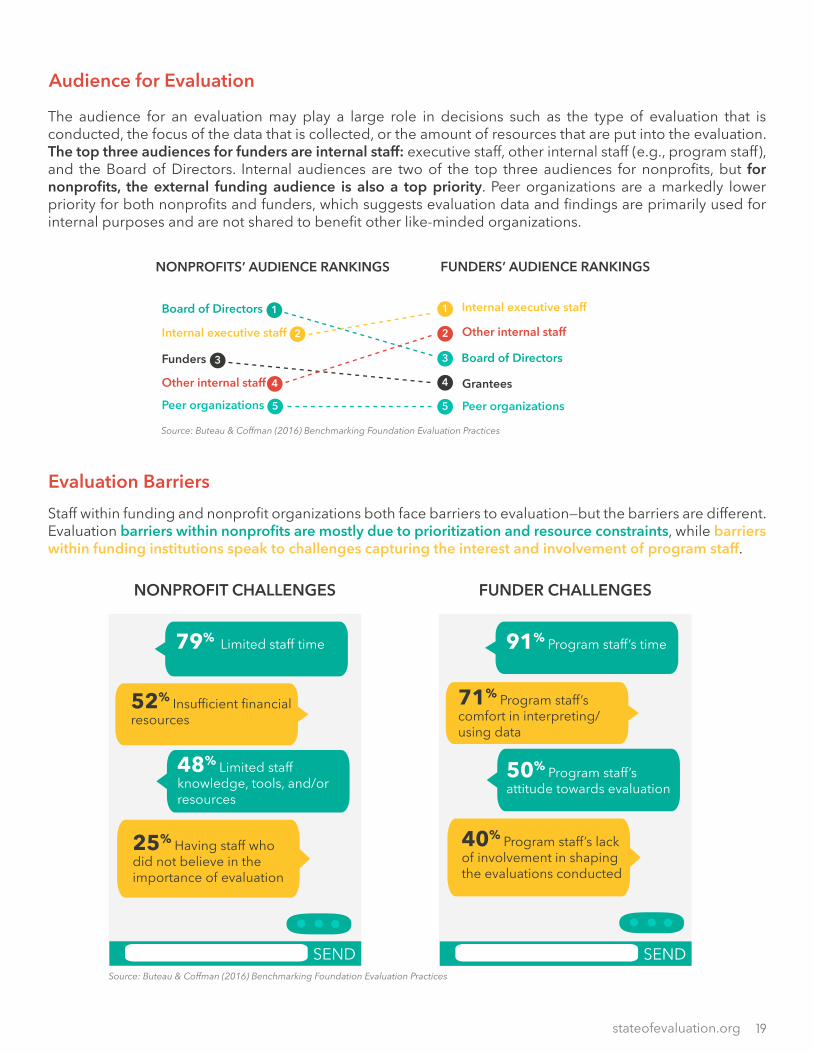
Staff within funding and nonprofit organizations both face barriers to evaluation—but the barriers are different. Evaluation barriers within nonprofits are mostly due to prioritization and resource constraints, while barriers within funding institutions speak to challenges capturing the interest and involvement of program staff.
The audience for an evaluation may play a large role in decisions such as the type of evaluation that is conducted, the focus of the data that is collected, or the amount of resources that are put into the evaluation. The top three audiences for funders are internal staff: executive staff, other internal staff (e.g., program staff), and the Board of Directors. Internal audiences are two of the top three audiences for nonprofits, but for nonprofits, the external funding audience is also a top priority. Peer organizations are a markedly lower priority for both nonprofits and funders, which suggests evaluation data and findings are primarily used for internal purposes and are not shared to benefit other like-minded organizations.
Audience for Evaluation
Evaluation Barriers
NONPROFITS’ AUDIENCE RANKINGS FUNDERS’ AUDIENCE RANKINGS
1 1
2 2
3 3
4 4
5 5
Board of Directors
Board of Directors
Internal executive staff
Internal executive staff
Funders
GranteesOther internal staff
Other internal staff
Peer organizations Peer organizations
79% Limited staff time 91% Program staff’s time
48% Limited staff knowledge, tools, and/or resources
50% Program staff’s attitude towards evaluation
52% Insufficient financial resources
71% Program staff’s comfort in interpreting/using data
25% Having staff who did not believe in the importance of evaluation
40% Program staff’s lack of involvement in shaping the evaluations conducted
Source: Buteau & Coffman (2016) Benchmarking Foundation Evaluation Practices
Source: Buteau & Coffman (2016) Benchmarking Foundation Evaluation Practices
NONPROFIT CHALLENGES FUNDER CHALLENGES
19
#SOE2016
Purpose. The State of Evaluation project is the first nationwide project that systematically and repeatedly collects data from US nonprofits about their evaluation practices. Survey results are intended to build understanding for nonprofits, to compare their evaluation practices to their peers; for donors and funders, to better understand how they can support evaluation practice throughout the sector; and for evaluators, to have more context about the existing evaluation practices and capacities of their nonprofit clients.
Sample. The State of Evaluation 2016 sampling frame is 501(c)3 organizations in the US that updated their IRS Form 990 in 2013 or more recently and provided an email address in the IRS Form 990. Qualified organizations were identified through a GuideStar dataset. We sent an invitation to participate in the survey to one unique email address for each of the 37,440 organizations in the dataset. With 1,125 responses, our response rate is 3.0%. The adjusted response rate for the survey is 8.35% (removing from the denominator bounced invitations, unopened invitations, and individuals who had previously opted out from SurveyMonkey). The survey was available online from June 13, 2016, through August 6, 2016, and six reminder messages were sent during that time. Organizations were asked to answer questions based on their experiences in 2015.
Analysis. Once the survey closed, the data was cleaned and many relationships between responses were tested for significance in SPSS. In State of Evaluation 2016, we note which findings are statistically significant and the significance level. Not all of the findings contained herein are statistically significant, but we believe that they have practical value to funders, nonprofits, and evaluators and so are included in these results.
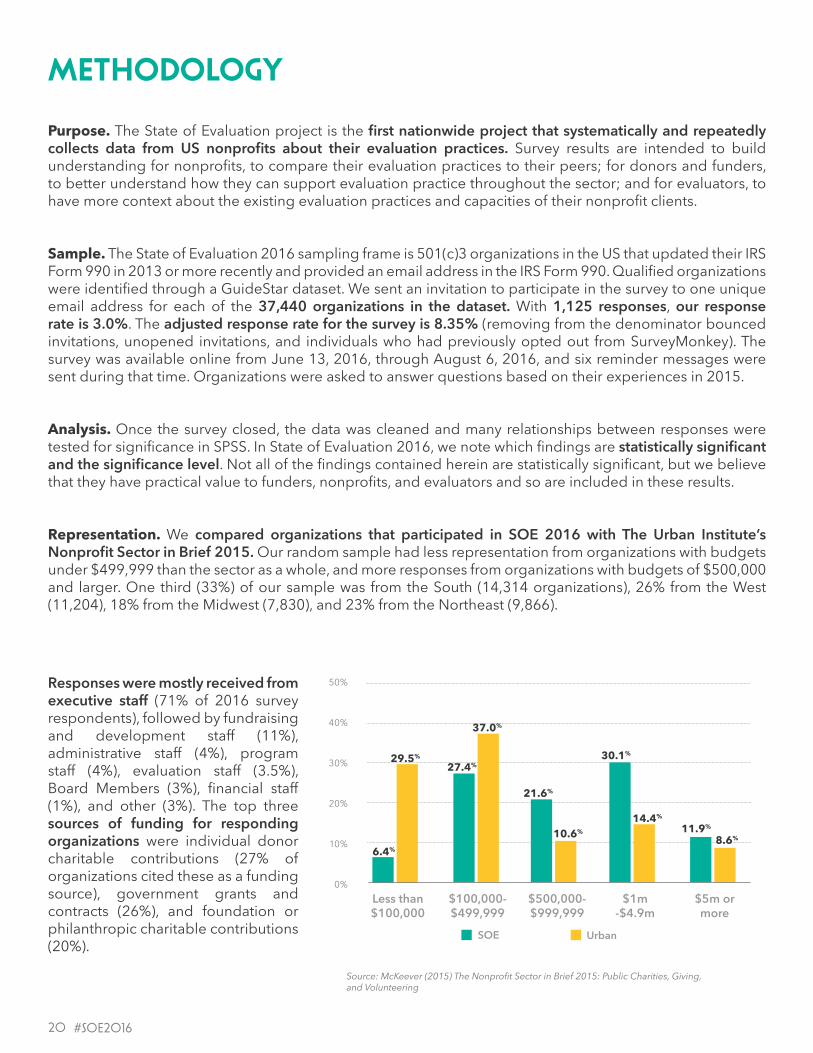
Representation. We compared organizations that participated in SOE 2016 with The Urban Institute’s Nonprofit Sector in Brief 2015. Our random sample had less representation from organizations with budgets under $499,999 than the sector as a whole, and more responses from organizations with budgets of $500,000 and larger. One third (33%) of our sample was from the South (14,314 organizations), 26% from the West (11,204), 18% from the Midwest (7,830), and 23% from the Northeast (9,866).
METHODOLOGY
Responses were mostly received from executive staff (71% of 2016 survey respondents), followed by fundraising and development staff (11%), administrative staff (4%), program staff (4%), evaluation staff (3.5%), Board Members (3%), financial staff (1%), and other (3%). The top three sources of funding for responding organizations were individual donor charitable contributions (27% of organizations cited these as a funding source), government grants and contracts (26%), and foundation or philanthropic charitable contributions (20%).
50%
40%
30%
20%
10%
0%Less than $100,000
$100,000-$499,999
$1m -$4.9m
SOE Urban
$500,000-$999,999
$5m or more
6.4%
29.5%
27.4%
37.0%
21.6%
10.6%
30.1%
14.4%
11.9%
8.6%
Source: McKeever (2015) The Nonprofit Sector in Brief 2015: Public Charities, Giving, and Volunteering
20

stateofevaluation.org
ABOUT INNOVATION NETWORK
Innovation Network is a nonprofit evaluation, research, and consulting firm. We provide knowledge and expertise to help nonprofits and funders learn from their work to improve their results.
ABOUT THE AUTHORS
Johanna Morariu, Director, Innovation NetworkJohanna is the Co-Director of Innovation Network and provides organizational leadership, project leadership, and evaluation expertise to funder and nonprofit partners. She has over a decade of experience in advocacy evaluation, including advocacy field evaluation, campaign evaluation, policy advocacy evaluation, organizing and social movements evaluation, and leadership development evaluation.
Kat Athanasiades, Senior Associate, Innovation NetworkKat leads and supports many of Innovation Network’s engagements across the evaluation spectrum—from evaluation planning to using analysis to advise organizations on strategy. She brings skills of evaluation design and implementation, advocacy evaluation, evaluation facilitation and training, data collection tool design, qualitative and quantitative data analysis, and other technical assistance provision.
Veena Pankaj, Director, Innovation NetworkVeena is the Co-Director of Innovation Network and has more than 15 years of experience navigating organizations through the evaluation design and implementation process. She has an array of experience in the areas of health promotion, advocacy evaluation and health equity. Veena leads many of the organization’s consulting projects and works closely with foundations and nonprofits to answer questions about program design, implementation, and impact.
Deborah Grodzicki PhD, Senior Associate, Innovation NetworkDeborah provides project leadership, backstopping, and staff management in her role as Senior Associate at Innovation Network. With nearly a decade of experience in designing, implementing, and managing evaluations, Deborah brings skills of evaluation theory and design, advocacy evaluation, quantitative and qualitative methodology, and capacity building.
October 2016
This work is licensed under the Creative Commons BY-NC-SA License. It is attributed to Innovation Network, Inc.

[email protected] @InnoNet_Eval