
State of Connecticut · in the case of individuals, trusts and estates required to pay the federal...
292
NEW ISSUE $650,000,000 State of Connecticut General Obligation Bonds $585,000,000 General Obligation Bonds (2016 Series E) $65,000,000 General Obligation Bonds (2016 Series F - Green Bonds) Dated: Date of Delivery Due: As shown on inside front cover page The $650,000,000 State of Connecticut General Obligation Bonds consist of $585,000,000 General Obligation Bonds (2016 Series E) (the “Series E Bonds”) and $65,000,000 General Obligation Bonds (2016 Series F - Green Bonds) (the “Series F Bonds”, and together with the Series E Bonds, the “Bonds”). The Bonds will be general obligations of the State of Connecticut (the “State”) and the full faith and credit of the State will be pledged for the payment of the principal of and interest on the Bonds as the same become due. See THE BONDS - Nature of Connecticut’s General Obligation herein. Interest on the Bonds will be payable on April 15, 2017 and semiannually thereafter on October 15 and April 15 in each year until maturity or earlier redemption, as applicable. Interest on the Bonds will be calculated on the basis of a 360-day year of twelve 30-day months at the annual rates set forth on the inside front cover page. The Bonds are subject to optional redemption prior to maturity as more fully described herein. See THE BONDS – Redemption Provisions herein. (See inside front cover page for maturities, interest rates and prices or yields.) _____________ The Bonds are issuable only as fully registered bonds, without interest coupons, in denominations of $5,000 or any integral multiple thereof. When issued, the Bonds will be registered in the name of Cede & Co., as Bondowner and nominee for The Depository Trust Company (“DTC”), New York, New York. DTC will act as securities depository for the Bonds. Purchases of the Bonds will be made in book-entry-only form. Purchasers will not receive certificates representing their interest in the Bonds. So long as Cede & Co. is the registered owner, as nominee of DTC, reference herein to the Bondowner or owner shall mean Cede & Co., as aforesaid, and shall not mean the Beneficial Owners (as defined herein) of the Bonds. See THE BONDS - Book- Entry-Only System herein. Principal of and interest on the Bonds will be paid directly to DTC by U.S. Bank National Association, as Paying Agent, at its corporate trust office in Hartford, Connecticut, so long as DTC or its nominee, Cede & Co., is the Bondowner. Disbursement of such payments to the DTC Participants is the responsibility of DTC and disbursement of such payments to the Beneficial Owners is the responsibility of the DTC Participants and the Indirect Participants, as more fully described herein. _____________ In the opinion of Bond Counsel and Tax Counsel, rendered in reliance upon and assuming the accuracy of and continuing compliance by the State with its representations and covenants relating to certain requirements of the Internal Revenue Code of 1986, as amended (the “Code”), under existing law, interest on the Bonds is excluded from gross income for federal income tax purposes and is not an item of tax preference for purposes of the federal alternative minimum tax; however, with respect to certain corporations (as defined for federal income tax purposes) subject to the federal alternative minimum tax, such interest is taken into account in computing the federal alternative minimum tax, as described under TAX EXEMPTION OF THE BONDS herein. In the opinion of Bond Counsel and Tax Counsel, under existing statutes, interest on the Bonds is excluded from Connecticut taxable income for purposes of the Connecticut income tax on individuals, trusts and estates and is excluded from amounts on which the net Connecticut minimum tax is based in the case of individuals, trusts and estates required to pay the federal alternative minimum tax. See TAX EXEMPTION OF THE BONDS herein. _____________ The Bonds are offered when, as and if issued and received by the Underwriters, subject to approval as to legality by Bond Counsel and certain other conditions. Certain legal matters will be passed upon for the State by its Disclosure Counsel. Certain legal matters will be passed upon for the State by its Tax Counsel. Certain legal matters will be passed upon for the Underwriters by Underwriters’ Counsel. The Bonds are expected to be available for delivery through the facilities of DTC in New York, New York, on or about October 26, 2016. Honorable Denise L. Nappier Treasurer of the State of Connecticut Wells Fargo Securities Morgan Stanley Loop Capital Markets Roosevelt & Cross Incorporated William Blair Baird Barclays Blaylock Beal Van, LLC J.P. Morgan Janney Montgomery Scott Jefferies KeyBanc Capital Markets Inc. Piper Jaffray & Co. Prager & Co., LLC Ramirez & Co., Inc. RBC Capital Markets Rice Financial Products Company Stifel The Williams Capital Group, L.P. Dated: October 19, 2016 RATINGS: Moody’s: Aa3 S&P: AA- Fitch: AA- Kroll: AA- (See RATINGS herein)
Transcript of State of Connecticut · in the case of individuals, trusts and estates required to pay the federal...

NEW ISSUE
$650,000,000 State of Connecticut
General Obligation Bonds $585,000,000 General Obligation Bonds (2016 Series E)
$65,000,000 General Obligation Bonds (2016 Series F - Green Bonds)
Dated: Date of Delivery Due: As shown on inside front cover page
The $650,000,000 State of Connecticut General Obligation Bonds consist of $585,000,000 General Obligation Bonds (2016 Series E) (the “Series E Bonds”) and $65,000,000 General Obligation Bonds (2016 Series F - Green Bonds) (the “Series F Bonds”, and together with the Series E Bonds, the “Bonds”). The Bonds will be general obligations of the State of Connecticut (the “State”) and the full faith and credit of the State will be pledged for the payment of the principal of and interest on the Bonds as the same become due. See THE BONDS - Nature of Connecticut’s General Obligation herein. Interest on the Bonds will be payable on April 15, 2017 and semiannually thereafter on October 15 and April 15 in each year until maturity or earlier redemption, as applicable. Interest on the Bonds will be calculated on the basis of a 360-day year of twelve 30-day months at the annual rates set forth on the inside front cover page. The Bonds are subject to optional redemption prior to maturity as more fully described herein. See THE BONDS – Redemption Provisions herein.
(See inside front cover page for maturities, interest rates and prices or yields.) _____________
The Bonds are issuable only as fully registered bonds, without interest coupons, in denominations of $5,000 or any integral multiple thereof. When issued, the Bonds will be registered in the name of Cede & Co., as Bondowner and nominee for The Depository Trust Company (“DTC”), New York, New York. DTC will act as securities depository for the Bonds. Purchases of the Bonds will be made in book-entry-only form. Purchasers will not receive certificates representing their interest in the Bonds. So long as Cede & Co. is the registered owner, as nominee of DTC, reference herein to the Bondowner or owner shall mean Cede & Co., as aforesaid, and shall not mean the Beneficial Owners (as defined herein) of the Bonds. See THE BONDS - Book-Entry-Only System herein. Principal of and interest on the Bonds will be paid directly to DTC by U.S. Bank National Association, as Paying Agent, at its corporate trust office in Hartford, Connecticut, so long as DTC or its nominee, Cede & Co., is the Bondowner. Disbursement of such payments to the DTC Participants is the responsibility of DTC and disbursement of such payments to the Beneficial Owners is the responsibility of the DTC Participants and the Indirect Participants, as more fully described herein.
_____________ In the opinion of Bond Counsel and Tax Counsel, rendered in reliance upon and assuming the accuracy of and continuing compliance by the
State with its representations and covenants relating to certain requirements of the Internal Revenue Code of 1986, as amended (the “Code”), under existing law, interest on the Bonds is excluded from gross income for federal income tax purposes and is not an item of tax preference for purposes of the federal alternative minimum tax; however, with respect to certain corporations (as defined for federal income tax purposes) subject to the federal alternative minimum tax, such interest is taken into account in computing the federal alternative minimum tax, as described under TAX EXEMPTION OF THE BONDS herein.
In the opinion of Bond Counsel and Tax Counsel, under existing statutes, interest on the Bonds is excluded from Connecticut taxable income for purposes of the Connecticut income tax on individuals, trusts and estates and is excluded from amounts on which the net Connecticut minimum tax is based in the case of individuals, trusts and estates required to pay the federal alternative minimum tax. See TAX EXEMPTION OF THE BONDS herein.
_____________ The Bonds are offered when, as and if issued and received by the Underwriters, subject to approval as to legality by Bond Counsel and certain
other conditions. Certain legal matters will be passed upon for the State by its Disclosure Counsel. Certain legal matters will be passed upon for the State by its Tax Counsel. Certain legal matters will be passed upon for the Underwriters by Underwriters’ Counsel. The Bonds are expected to be available for delivery through the facilities of DTC in New York, New York, on or about October 26, 2016.
Honorable Denise L. Nappier Treasurer of the State of Connecticut
Wells Fargo Securities Morgan Stanley Loop Capital Markets Roosevelt & Cross Incorporated William Blair Baird Barclays Blaylock Beal Van, LLC J.P. Morgan Janney Montgomery Scott Jefferies KeyBanc Capital Markets Inc. Piper Jaffray & Co. Prager & Co., LLC Ramirez & Co., Inc. RBC Capital Markets Rice Financial Products Company Stifel The Williams Capital Group, L.P.
Dated: October 19, 2016
RATINGS: Moody’s: Aa3 S&P: AA- Fitch: AA- Kroll: AA- (See RATINGS herein)

State of Connecticut $585,000,000 General Obligation Bonds (2016 Series E)
Maturity October 15,
Amount
Interest Rate
Yield
Price
CUSIP1
2017 $ 32,500,000 2.000% 0.95% 101.010% 20772J4D1 2018 32,500,000 4.000 1.08 105.674 20772J4E9 2019 32,500,000 4.000 1.33 107.748 20772J3N0 2020 870,000 4.000 1.50 109.598 20772J4F6 2020 31,630,000 5.000 1.50 113.438 20772J3P5 2021 2,725,000 4.000 1.63 111.268 20772J4G4 2021 29,775,000 5.000 1.63 116.023 20772J3Q3 2022 990,000 4.000 1.77 112.579 20772J4H2 2022 31,510,000 5.000 1.77 118.220 20772J3R1 2023 1,730,000 4.000 1.95 113.298 20772J4J8 2023 30,770,000 5.000 1.95 119.785 20772J3S9 2024 1,525,000 2.000 2.14 98.978 20772J4L3 2024 30,975,000 5.000 2.14 120.852 20772J3T7 2025 32,500,000 5.000 2.30 121.769 20772J3U4 2026 2,560,000 3.000 2.45 104.838 20772J4K5 2026 29,940,000 5.000 2.45 122.433 20772J3V2 2027* 32,500,000 5.000 2.58 121.152 20772J3W0 2028* 32,500,000 5.000 2.69 120.081 20772J3X8 2029* 32,500,000 5.000 2.77 119.309 20772J3Y6 2032 32,500,000 3.000 3.28 96.540 20772J4P4 2033* 5,105,000 4.000 3.29 105.992 20772J3Z3 2033* 27,395,000 5.000 3.04 116.747 20772J4M1 2034* 1,825,000 4.000 3.35 105.469 20772J4A7 2034* 30,675,000 5.000 3.07 116.466 20772J4N9 2035* 32,500,000 4.000 3.41 104.950 20772J4B5 2036 32,500,000 3.375 3.53 97.791 20772J4C3
(plus accrued interest, if any)
* Priced at the stated yield to the October 15, 2026 optional redemption date at a redemption price of 100%; however, any such redemption is at the election of the Treasurer. See THE BONDS – Redemption Provisions herein.
State of Connecticut $65,000,000 General Obligation Bonds (2016 Series F - Green Bonds)
Maturity October 15,
Amount
Interest Rate
Yield
Price
CUSIP1
2030* $ 8,835,000 4.000% 3.10% 107.666% 20772J4S8 2030* 23,665,000 5.000 2.85 118.543 20772J4R0 2031* 32,500,000 5.000 2.92 117.877 20772J4Q2
(plus accrued interest, if any)
* Priced at the stated yield to the October 15, 2026 optional redemption date at a redemption price of 100%; however, any such redemption is at the election of the Treasurer. See THE BONDS – Redemption Provisions herein.
1 Copyright, American Bankers Association. CUSIP® is a registered trademark of the American Bankers Association. CUSIP numbers have been assigned by an independent company not affiliated with the State and are included solely for the convenience of the holders of the Bonds. The State is not responsible for the selection or use of these CUSIP numbers, does not undertake any responsibility for their accuracy, and makes no representation as to their correctness on the Bonds or as indicated above. The CUSIP number for a specific maturity is subject to being changed after the issuance of the Bonds as a result of various subsequent actions including, but not limited to, a refunding in whole or in part of such maturity or as a result of the procurement of secondary market portfolio insurance or other similar enhancement by investors that is applicable to all or a portion of certain maturities of the Bonds.

(i)
This Official Statement is not to be construed as a contract or agreement between the State and the purchasers or holders of any of the Bonds. The information and expressions of opinion herein are subject to change without notice and neither the delivery of this Official Statement nor any sale made hereunder shall, under any circumstances, create any implication that there has been no change in the affairs of the State since the date hereof. Any statements in this Official Statement involving matters of opinion or estimates, whether or not expressly so stated, are intended as such and not as representations of fact. No representation is made that any of such statements will be realized. All quotations from and summaries and explanations of provisions of laws of the State contained in this Official Statement do not purport to be complete and are qualified in their entirety by reference to the official compilations thereof. All references to the Bonds and the resolutions and proceedings of the State Bond Commission relating thereto are qualified in their entirety by reference to the definitive forms of the Bonds and such resolutions. This Official Statement is submitted only in connection with the sale of the Bonds by the State and may not be reproduced or used in whole or in part for any other purpose, except as specifically authorized by the State. No dealer, broker, salesperson or other person has been authorized to give any information or to make any representations other than as contained in this Official Statement and, if given or made, such other information or representations must not be relied upon. This Official Statement does not constitute an offer to sell or the solicitation of an offer to buy nor shall there be any sale of the Bonds by any person in any jurisdiction in which it is unlawful for such person to make such offer, solicitation or sale. IN CONNECTION WITH THIS OFFERING, THE UNDERWRITERS MAY OVER-ALLOT OR EFFECT TRANSACTIONS WHICH STABILIZE OR MAINTAIN THE MARKET PRICES OF THE BONDS AT LEVELS ABOVE THOSE WHICH MIGHT OTHERWISE PREVAIL IN THE OPEN MARKET. SUCH STABILIZING, IF COMMENCED, MAY BE DISCONTINUED AT ANY TIME. TABLE OF CONTENTS
Page Summary .................................................................. (ii) Introduction ............................................................. (iii) Part I - Information Concerning the Bonds
Table of Contents to Part I ................................. (iv) The Bonds ........................................................... I-1 Legality for Investment ....................................... I-7 Ratings ................................................................. I-7 Tax Exemption of the Bonds ............................... I-7 Continuing Disclosure Agreement ...................... I-10 Documents Accompanying Delivery of
the Bonds ...................................................... I-10 Financial Advisor ................................................ I-12 Underwriting ....................................................... I-12 Additional Information ........................................ I-13
Appendix I-A – Series E Bonds Table of Statutory Authorizations ................ I-A-1 Series F Bonds Table of Statutory Authorizations ................ I-A-5 Appendix I-B – Forms of Bond Counsel Opinions ... I-B-1 Appendix I-C – Form of Continuing Disclosure Agreement ...................................... I-C-1 Part II - Information Supplement to Annual Information Statement of the State of Connecticut Dated October 19, 2016 ..................................... II-1
Page Part III - Annual Information Statement of
the State of Connecticut Dated February 24, 2016
Table of Contents to Part III .......................... III-2 Introduction ..................................................... III-8 The State of Connecticut ................................. III-10 Financial Procedures ....................................... III-11 State General Fund .......................................... III-21 State Debt ........................................................ III-42 Other Funds, Debt and Liabilities .................... III-57 Pension and Retirement Systems ..................... III-68 Litigation ......................................................... III-95 Other Matters ................................................... III-98 Appendices Index to Appendices ....................................... III-99 Appendix III-A - Governmental Organization and Services ............................................. III-A-1 Appendix III-B - State Economy ..................... III-B-1 Appendix III-C - June 30, 2015 Basic (GAAP-Based) Financial Statements ....... III-C-1 Appendix III-D - June 30, 2011 - June 30, 2013 Budgetary (Modified Cash Basis) and June 30, 2014 – June 30, 2015 Statutory Basis General Fund Financial Statements .......... III-D-1 Appendix III-E – Fiscal Year 2015 Adopted Budget and Final Financial Results, Fiscal Year 2016 Adopted and Estimated Budget and Fiscal Year 2017 Adopted Budget ....................................... III-E-1

(ii)
SUMMARY This Summary does not constitute a part of the Official Statement for the issuance and sale by the State of Connecticut of its $650,000,000 General Obligation Bonds consisting of $585,000,000 General Obligation Bonds (2016 Series E) (the “Series E Bonds”) and $65,000,000 General Obligation Bonds (2016 Series F - Green Bonds) (the “Series F Bonds”, and together with the Series E Bonds, the “Bonds”). This Summary is for informational purposes only and is subject in all respects to a more complete discussion contained in the Official Statement.
Security The Bonds will be general obligation bonds of the State of Connecticut, and the full faith and credit of the State will be pledged for the payment of the principal of and interest on the Bonds as the same become due.
Tax Exemption In the opinion of Bond Counsel and Tax Counsel, rendered in reliance upon and assuming the accuracy of and continuing compliance by the State with its representations and covenants relating to certain requirements of the
Internal Revenue Code of 1986, as amended (the “Code”), under existing law, interest on the Bonds is excluded from gross income for federal income tax purposes and is not an item of tax preference for purposes of the federal alternative minimum tax; however, with respect to certain corporations (as defined for federal income tax purposes) subject to the federal alternative minimum tax, such interest is taken into account in computing the federal alternative minimum tax, as described under TAX EXEMPTION OF THE BONDS herein.
In the opinion of Bond Counsel and Tax Counsel, under existing statutes, interest on the Bonds is excluded from
Connecticut taxable income for purposes of the Connecticut income tax on individuals, trusts and estates and is excluded from amounts on which the net Connecticut minimum tax is based in the case of individuals, trusts and estates required to pay the federal alternative minimum tax. See TAX EXEMPTION OF THE BONDS herein.
Interest Payment Dates Interest on the Bonds will be payable on April 15, 2017 and semiannually thereafter on October 15 and April 15 in
each year until maturity or earlier redemption, as applicable. Interest is calculated on the basis of a 360-day year of twelve 30-day months at the annual rates set forth on the inside front cover page.
Principal Payment Dates Principal of the Bonds is payable on October 15 in the years and in the amounts shown on the inside front cover page.
Denominations The Bonds will be issued only in registered book-entry form, without coupons, in denominations of $5,000 or any integral multiple thereof.
Redemption The Bonds are subject to optional redemption prior to maturity at the election of the Treasurer as specified in the final Official Statement. See THE BONDS – Redemption Provisions herein.
Delivery and Clearance The Bonds are expected to be available for delivery through the facilities of DTC in New York, New York, on or about October 26, 2016.
Paying Agent U.S. Bank National Association, 225 Asylum Street, Hartford, Connecticut 06103, is the State’s Paying Agent. Legal Counsel Day Pitney LLP of Hartford, Connecticut is Lead Bond Counsel; Hawkins Delafield & Wood LLP of Hartford,
Connecticut; Lewis & Munday, A Professional Corporation of Detroit, Michigan with offices in Glastonbury, Connecticut; Pullman & Comley, LLC of Bridgeport, Connecticut; Robinson & Cole LLP of Hartford, Connecticut; Shipman & Goodwin LLP of Hartford, Connecticut; Schiff Hardin LLP of New York, New York and Squire Patton Boggs (US) LLP of New York, New York are Bond Counsel with respect to certain series of the Bonds. Day Pitney LLP is Lead Disclosure Counsel and Soeder & Associates, LLC of Hartford, Connecticut, is Co-Disclosure Counsel. Robinson & Cole LLP is Lead Tax Counsel and Soeder & Associates, LLC is Co-Tax Counsel. Wiggin and Dana LLP of New Haven, Connecticut and Locke Lord LLP of Boston, Massachusetts are Co-Underwriters’ Counsel.
Additional Information Additional information may be obtained upon request to the Office of the State Treasurer, Denise L. Nappier, Attn: Sarah K. Sanders, Assistant Treasurer for Debt Management, 55 Elm Street, Hartford, Connecticut 06106, (860) 702-3288.

(iii)
OFFICIAL STATEMENT $650,000,000
STATE OF CONNECTICUT GENERAL OBLIGATION BONDS
$585,000,000 General Obligation Bonds (2016 Series E) $65,000,000 General Obligation Bonds (2016 Series F - Green Bonds)
INTRODUCTION
This Official Statement, including the cover page and inside front cover page, this Introduction, Part I, Part II and Part III and the Appendices thereto, of the State of Connecticut (the “State”) is provided for the purpose of presenting certain information relating to the State in connection with the sale of $585,000,000 aggregate principal amount of its General Obligation Bonds (2016 Series E) (the “Series E Bonds”) and $65,000,000 aggregate principal amount of its General Obligation Bonds (2016 Series F - Green Bonds) (the “Series F Bonds”, and together with the Series E Bonds, the “Bonds”).
Part I of this Official Statement, including the cover page and inside front cover page and the Appendices thereto, contains information relating to the Bonds. Part II of this Official Statement contains information that supplements, as of its date, certain information contained in the most recent Annual Information Statement of the State. Part III of this Official Statement, including the Appendices thereto, is the most recent Annual Information Statement of the State and contains certain information about the State as of its date. The cover page, inside front cover page, this Introduction, and Parts I, II and III and the Appendices thereto should be read collectively and in their entirety.
__________________________

(iv)
PART I
INFORMATION CONCERNING THE BONDS TABLE OF CONTENTS TO PART I Page
THE BONDS ..................................................................................................................................................................................... I-1
Description of the Bonds ..................................................................................................................................................... I-1
Redemption Provisions ........................................................................................................................................................ I-3
Green Bond Designation ...................................................................................................................................................... I-3
Nature of Connecticut’s General Obligation ........................................................................................................................ I-4
Book-Entry-Only System ..................................................................................................................................................... I-5
Sources and Uses of Bond Proceeds .................................................................................................................................... I-7
LEGALITY FOR INVESTMENT ..................................................................................................................................................... I-7
RATINGS .......................................................................................................................................................................................... I-7
TAX EXEMPTION OF THE BONDS .............................................................................................................................................. I-7
Opinion of Bond Counsel and Tax Counsel - Federal Tax Exemption ................................................................................ I-7
Original Issue Discount ....................................................................................................................................................... I-8
Original Issue Premium ....................................................................................................................................................... I-9
Other Federal Tax Matters ................................................................................................................................................... I-9
State Taxes ........................................................................................................................................................................... I-9
General ................................................................................................................................................................................. I-9
CONTINUING DISCLOSURE AGREEMENT .............................................................................................................................. I-10
DOCUMENTS ACCOMPANYING DELIVERY OF THE BONDS .............................................................................................. I-10
State Treasurer’s Certificate .............................................................................................................................................. I-10
Absence of Litigation ......................................................................................................................................................... I-11
Approving Opinions of Bond Counsel and Opinions of Disclosure Counsel, Tax Counsel and Underwriters’ Counsel .. I-11
FINANCIAL ADVISOR.................................................................................................................................................................. I-12
UNDERWRITING ........................................................................................................................................................................... I-12
ADDITIONAL INFORMATION .................................................................................................................................................... I-13
Appendix I-A -
Series E Bonds - Table of Statutory Authorizations ................................................................................................. I-A-1
Series F Bonds - Table of Statutory Authorizations ................................................................................................. I-A-5
Appendix I-B - Forms of Bond Counsel Opinions ........................................................................................................... I-B-1
Appendix I-C - Form of Continuing Disclosure Agreement ............................................................................................ I-C-1

I-1
PART I
INFORMATION CONCERNING THE BONDS $650,000,000
STATE OF CONNECTICUT GENERAL OBLIGATION BONDS
$585,000,000 General Obligation Bonds (2016 Series E) $65,000,000 General Obligation Bonds (2016 Series F - Green Bonds)
THE BONDS Description of the Bonds
The State of Connecticut (the “State”) is issuing $585,000,000 General Obligation Bonds (2016 Series E) (the “Series E Bonds”) comprised of the following issues:
$ 47,265,000 General Obligation Bonds (2016 Series E-1) $ 204,020,000 General Obligation Bonds (2016 Series E-2) $ 90,780,000 General Obligation Bonds (2016 Series E-3) $ 133,785,000 General Obligation Bonds (2016 Series E-4) $ 94,405,000 General Obligation Bonds (2016 Series E-5) $ 14,745,000 General Obligation Bonds (2016 Series E-6)
and $65,000,000 General Obligation Bonds (2016 Series F - Green Bonds) (the “Series F Bonds”, and together with the Series E Bonds, the “Bonds”) comprised of the following issue:
$ 65,000,000 General Obligation Bonds (2016 Series F-1 - Green Bonds)
The Bonds will be dated the date of delivery, and will bear interest from their date payable on April 15, 2017 and semiannually thereafter on October 15 and April 15 in each year, until maturity or earlier redemption, as applicable, at the rate or rates indicated on the inside front cover page of this Official Statement.
Interest on the Bonds will be calculated on the basis of a 360-day year of twelve 30-day months and will be payable to the registered owner as of the close of business on the last business day of March and September in each year. The Bonds are issuable only as fully registered bonds, without interest coupons, in denominations of $5,000 or any integral multiple thereof.
The Bonds will mature on the dates and in the years and in the principal amounts set forth on the inside front cover page of this Official Statement.
The Bonds will be general obligation bonds of the State and the full faith and credit of the State will be pledged for the payment of the principal of and interest on the Bonds as the same become due. The Bonds will be issued pursuant to (i) the State general obligation bond procedure act (Section 3-20 of the General Statutes of Connecticut, as amended) and (ii) resolutions adopted by the State Bond Commission and other proceedings related thereto, including a Certificate of Determination of the Treasurer. See THE BONDS - Nature of Connecticut’s General Obligation herein.
Principal of and interest on the Bonds will be paid directly to The Depository Trust Company (“DTC”) by U.S. Bank National Association, as Paying Agent, so long as DTC or its nominee, Cede & Co., is the Bondowner. See THE BONDS - Book-Entry-Only System herein.

I-2
The Series E Bonds are being issued for various projects and purposes and are authorized by the bond acts listed in Appendix I-A. The Series E Bonds of each series will mature on October 15 in the years and in the principal amounts set forth in the following table:
$585,000,000 Series E
Maturity Series Total October 15, 2016 E-1 2016 E-2 2016 E-3 2016 E-4 2016 E-5 2016 E-6 2016 Series E
2017 $ 32,500,000 $ 32,500,000
2018 14,765,000 $ 2,990,000 $ 14,745,000 32,500,000
2019 32,500,000 32,500,000
2020 32,500,000 32,500,000
2021 $ 6,085,000 26,415,000 32,500,000
2022 32,500,000 32,500,000
2023 32,500,000 32,500,000
2024 32,500,000 32,500,000
2025 $ 2,300,000 30,200,000 32,500,000
2026 32,500,000 32,500,000
2027 32,500,000 32,500,000
2028 $ 9,020,000 23,480,000 32,500,000
2029 32,500,000 32,500,000
2032 32,500,000 32,500,000
2033 32,500,000 32,500,000
2034 32,500,000 32,500,000
2035 32,500,000 32,500,000
2036 32,500,000 32,500,000
TOTAL $ 47,265,000 $ 204,020,000 $ 90,780,000 $ 133,785,000 $ 94,405,000 $ 14,745,000 $ 585,000,000
[INTENTIONALLY LEFT BLANK]

I-3
The Series F Bonds are being issued for various projects and purposes and are authorized by the bond acts listed in Appendix I-A. Series F Bonds of each series will mature on October 15 in the years and in the principal amounts set forth in the following table:
$65,000,000 Series F Maturity Series Total
October 15, 2016 F-1 2016 Series F
2030 $ 32,500,000 $ 32,500,000
2031 32,500,000 32,500,000
$ 65,000,000 $ 65,000,000
Redemption Provisions
The Bonds maturing after October 15, 2026 are subject to optional redemption, at the election of the Treasurer, on or after October 15, 2026 at any time, in whole or in part prior to maturity. The redeemed Bonds may be in such amounts and in such order of maturity and in such Series and bear such interest rate or rates (but by lot among bonds bearing the same interest rate within a maturity of a Series) as the Treasurer may determine. The redemption price (expressed as percentages of the principal amounts of bonds to be redeemed) is set forth in the following table, to which will be added interest accrued and unpaid to the redemption date:
Redemption Date Redemption Price From October 15, 2026 and thereafter 100%
Notice of Redemption
Notice of redemption shall be mailed not less than twenty (20) nor more than sixty (60) days prior to the redemption date to the registered owner of such Bond at such Bondowner’s address as it appears on the registration books of the State. So long as Cede & Co., as nominee of DTC, is the registered owner of the Bonds, all notices of redemption will be sent only to DTC.
Green Bond Designation
The Series F Bonds are being identified as “Green Bonds”. The Series F Bonds will finance a portion of various high priority clean water projects across the State for design, construction and improvements to wastewater treatment plants and related energy efficiency upgrades designed to reduce water pollution in the State according to State and federal standards. Other important purposes include projects designed to improve water quality in the State’s rivers and Long Island Sound by separating storm water from sanitary sewer systems in urban areas.
The purpose of designating the Series F Bonds as “Green Bonds” is to provide investors the opportunity to invest directly in bonds that are specifically targeted to support such environmentally beneficial projects. Because the repayment obligation of the State is not conditioned on completion of the projects, holders of the Series F Bonds do not assume any risk with respect to the funded projects. Wastewater Treatment
The State’s wastewater treatment program is administered by the State’s Department of Energy and Environmental Protection (“DEEP”), the State agency established to carry out the environmental policy of the State, including conserving, improving and protecting the State’s natural resources and environment and mitigating water, land and air pollution. DEEP is also responsible for enforcement of, and compliance with, State and federal laws, rules and regulations pertaining to pollution control in the State generally and supervising research related to restoring and rehabilitating the Long Island Sound.
I-4
DEEP ranks each wastewater project according to a priority system using criteria it developed in 1992 and
establishes the biennial project priority list used to allocate all federal and State financial assistance. In order to develop the project priority list, each wastewater project is evaluated and awarded priority points based on the project’s anticipated positive environmental impact. Projects that will improve water quality standards to larger populations and/or larger water basins receive higher points. The priority list system also awards points to projects based on its anticipated positive impact on nutrient removal from Long Island Sound and/or its ability to enhance specific fishery, shellfish, and recreational water resources. Points are also awarded for projects that will have a positive impact on human health and/or eliminate nuisance odors and a number of other factors. All of the projects are then ranked by total points on the project priority list. The projects awarded the highest total number of points are identified as being the top priority for funding based on total State and federal funds available during the biennium.
Clean Water Fund
The State’s Clean Water Fund (the “CWF”) was created by the State pursuant to the General Statutes Sections 22a-475 to 22a-483. It is jointly managed by DEEP, the Office of the Treasurer and the State Department of Public Health. The CWF offers a program of grants and loans to fund specific projects for which application has been made by municipalities. Eligible projects include wastewater treatment plant upgrades and expansions, sewer separation and supplemental combined sewer overflow treatment, new sewer system construction, new interceptor sewers, nutrient removal and other green projects. The CWF is divided into the following six accounts: (1) the water pollution control federal revolving loan account, (2) the water pollution control state account, (3) the Long Island Sound clean-up account, (4) the drinking water federal revolving loan account, (5) the drinking water state account and (6) the river restoration account. The CWF maintains a separate account for the receipt of proceeds of general obligation bonds issued to fund the CWF, such as the Series F Bonds. The Series F Bond Proceeds
The expenditure of the net proceeds of the Series F Bonds will be tracked by the State. The proceeds of the Series F Bonds will be used to finance water pollution control projects. Pending such disbursement, the net proceeds will be invested in accordance with the State’s investment policy. See Page III-20 of this Official Statement under the heading Investment and Payment of Bond Proceeds.
Commencing with the delivery of the Clean Water State Revolving Fund Program Annual Report for the fiscal year ending June 30, 2017, the State shall provide on an annual basis a report that includes a description of the projects funded with the Series F Bonds and the amount of Series F Bond proceeds spent on such projects, but only until the proceeds of the Series F Bonds have been spent. Such information shall be posted to the Electronic Municipal Market Access website of the Municipal Securities Rulemaking Board on an annual basis on or before the date eight months after the close of the fiscal year for which such information is being provided. Once the State has spent all of the proceeds of the Series F Bonds, the State shall no longer report such information to the Series F bondholders.
Nature of Connecticut’s General Obligation
Each Bond when duly issued and paid for will constitute a contract between the State and the owner thereof.
The State general obligation bond procedure act, pursuant to which the Bonds are issued, provides that the Bonds shall be general obligations of the State and that the full faith and credit of the State are pledged for the payment of the principal of and interest on said Bonds as the same become due. Such act further provides that, as part of the contract of the State with the owners of said Bonds, appropriation of all amounts necessary for the punctual payment of such principal and interest is made, and the Treasurer shall pay such principal and interest as the same become due.

I-5
The doctrine of governmental immunity (the right of a state not to be sued without its consent) applies to the State, however, legislation gives jurisdiction to the Connecticut courts to enter judgment against the State founded upon any express contract between the State and the purchasers and subsequent owners and transferees of bonds and notes issued by the State, including the Bonds, reserving to the State all legal defenses except governmental immunity.
In the opinion of Bond Counsel, the above provisions impose a clear legal duty on the Treasurer to pay principal of and interest on the Bonds when due and, in the event of failure by the State to make such payment when due, a bondowner may sue the Treasurer to compel such payment from any monies available. Chapter 9 of Title 11 of the United States Code does not apply to the State of Connecticut or any other U.S. state.
For the payment of principal of or interest on the Bonds, the State, acting through the General Assembly, has the power to levy ad valorem taxes on all taxable property in the State without limitation as to rate or amount. The State does not presently levy such a tax.
The State has never defaulted in the punctual payment of principal or interest on any general obligation indebtedness and has never attempted to prevent or delay such required payments.
Book-Entry-Only System
The Depository Trust Company, New York, New York, will act as securities depository for the Bonds. The Bonds will be issued as fully-registered securities registered in the name of Cede & Co. (DTC’s partnership nominee) or such other name as may be requested by an authorized representative of DTC. One or more fully-registered Bond certificates will be issued for each maturity and interest rate of a given series of the Bonds in the aggregate principal amount of such maturity, and will be deposited with DTC.
DTC, the world’s largest securities depository, is a limited-purpose trust company organized under the New York Banking Law, a “banking organization” within the meaning of the New York Banking Law, a member of the Federal Reserve System, a “clearing corporation” within the meaning of the New York Uniform Commercial Code, and a “clearing agency” registered pursuant to the provisions of Section 17A of the Securities Exchange Act of 1934. DTC holds and provides asset servicing for over 3.5 million issues of U.S. and non-U.S. equity issues, corporate and municipal debt issues, and money market instruments (from over 100 countries) that DTC’s participants (“Direct Participants”) deposit with DTC. DTC also facilitates the post-trade settlement among Direct Participants of sales and other securities transactions in deposited securities, through electronic computerized book-entry transfers and pledges between Direct Participants’ accounts. This eliminates the need for physical movement of securities certificates. Direct Participants include both U.S. and non-U.S. securities brokers and dealers, banks, trust companies, clearing corporations, and certain other organizations. DTC is a wholly-owned subsidiary of The Depository Trust & Clearing Corporation (“DTCC”). DTCC is the holding company for DTC, National Securities Clearing Corporation and Fixed Income Clearing Corporation all of which are registered clearing agencies. DTCC is owned by the users of its regulated subsidiaries. Access to the DTC system is also available to others such as both U.S. and non-U.S. securities brokers and dealers, banks, trust companies and clearing corporations that clear through or maintain a custodial relationship with a Direct Participant, either directly or indirectly (“Indirect Participants”). DTC has a Standard & Poor’s rating of AA+. The DTC Rules applicable to its Participants are on file with the Securities and Exchange Commission. More information about DTC can be found at www.dtcc.com.
Purchases of Bonds under the DTC system must be made by or through Direct Participants, which will receive a credit for the Bonds on DTC’s records. The ownership interest of each actual purchaser of each Bond (“Beneficial Owner”) is in turn to be recorded on the Direct and Indirect Participants’ records. Beneficial Owners will not receive written confirmations from DTC of their purchase. Beneficial Owners are, however, expected to receive written confirmation providing details of the transaction, as well as periodic statements of their holdings, from the Direct or Indirect Participant through which the Beneficial Owner entered into the transaction. Transfers of ownership interests in the Bonds are to be accomplished by entries made on the books of Direct and Indirect Participants acting on behalf of Beneficial Owners. Beneficial Owners will not receive certificates representing their ownership interests in Bonds, except in the event that use of the book-entry system for the Bonds is discontinued.
I-6
To facilitate subsequent transfers, all Bonds deposited by Direct Participants with DTC are registered in the name of DTC’s partnership nominee, Cede & Co. or such other name as may be requested by an authorized representative of DTC. The deposit of Bonds with DTC and their registration in the name of Cede & Co. or such other DTC nominee do not effect any change in beneficial ownership. DTC has no knowledge of the actual Beneficial Owners of the Bonds; DTC’s records reflect only the identity of the Direct Participants to whose accounts such Bonds are credited, which may or may not be the Beneficial Owners. The Direct and Indirect Participants will remain responsible for keeping account of their holdings on behalf of their customers.
Conveyance of notices and other communications by DTC to Direct Participants, by Direct Participants to Indirect Participants, and by Direct Participants and Indirect Participants to Beneficial Owners will be governed by arrangements among them, subject to any statutory or regulatory requirements as may be in effect from time to time.
Redemption notices shall be sent to DTC. If less than all of the Bonds within an issue are being redeemed, DTC’s practice is to determine by lot the amount of the interest of each Direct Participant in such issue to be redeemed.
Neither DTC nor Cede & Co. (nor any other DTC nominee) will consent or vote with respect to the Bonds unless authorized by a Direct Participant in accordance with DTC’s MMI Procedures. Under its usual procedures, DTC mails an Omnibus Proxy to the State as soon as possible after the record date. The Omnibus Proxy assigns Cede & Co.’s consenting or voting rights to those Direct Participants to whose accounts the Bonds are credited on the record date (identified in a listing attached to the Omnibus Proxy).
Principal and interest payments on, and redemption premium, if any, with respect to the Bonds will be made to Cede & Co., or such other nominee as may be requested by an authorized representative of DTC. DTC’s practice is to credit Direct Participants’ accounts upon DTC’s receipt of funds and corresponding detail information from the State or the Paying Agent, on the payable date in accordance with their respective holdings shown on DTC’s records. Payments by Participants to Beneficial Owners will be governed by standing instructions and customary practices, as is the case with securities held for the accounts of customers in bearer form or registered in “street name”, and will be the responsibility of such Participant and not of DTC, the Paying Agent, or the State, subject to any statutory or regulatory requirements as may be in effect from time to time. Payment of principal and interest, and redemption premium, if any, to Cede & Co. (or such other nominee as may be requested by an authorized representative of DTC) is the responsibility of the State or the Paying Agent, disbursement of such payments to Direct Participants will be the responsibility of DTC, and disbursement of such payments to the Beneficial Owners will be the responsibility of Direct and Indirect Participants.
DTC may discontinue providing its services as depository with respect to the Bonds at any time by giving reasonable notice to the State or the Paying Agent. Under such circumstances, in the event that a successor depository is not obtained, bond certificates are required to be printed and delivered.
The State may decide to discontinue use of the system of book-entry-only transfers through DTC (or a successor securities depository). In that event, bond certificates will be printed and delivered to DTC.
The information in this section concerning DTC and DTC’s book-entry system has been provided by DTC. The State and the Underwriters take no responsibility for the accuracy thereof.

I-7
Sources and Uses of Bond Proceeds
Proceeds of the Bonds are to be applied as follows:
Sources: Series E
Series F
Par Amount of Bonds ....................... $ 585,000,000.00 $ 65,000,000.00 Net Original Issue Premium ............. 76,131,298.75 10,875,517.05 Total Sources ........................... $ 661,131,298.75 $ 75,875,517.05
Uses: Project Fund Deposit ........................ $ 585,000,000.00 $ 65,000,000.00 Other Monies Available to State1 ..... 73,131,188.00 10,479,358.99 Costs of Issuance .............................. 717,639.28 82,360.72 Underwriters’ Discount .................... 2,282,471.47 313,797.34
Total Uses ................................ $ 661,131,298.75 $ 75,875,517.05
1 Funds to be used to pay (i) capitalized interest on the Bonds and (ii) interest on other tax-exempt obligations of the State.
LEGALITY FOR INVESTMENT
Under existing State law, the Bonds are legal investments for the State and for municipalities, regional school districts, fire districts, and any municipal corporation or authority authorized to issue bonds, notes or other obligations, State chartered or organized insurance companies, bank and trust companies, savings banks, savings and loan associations and credit unions, as well as executors, administrators, trustees and certain other fiduciaries. Subject to any contrary provisions in any agreement with noteholders or bondholders or other contract, the Bonds also are legal investments for virtually all public authorities in the State.
The Bonds may be accepted by the Comptroller as a substitution for amounts paid as retainage under any State contract or subcontract.
RATINGS
Moody’s Investors Service (“Moody’s”), S&P Global Ratings (“S&P”), Fitch Ratings (“Fitch”) and Kroll Bond Rating Agency (“Kroll”) have assigned their municipal bond ratings of Aa3, AA-, AA- and AA-, respectively, to the Bonds. Fitch, S&P and Kroll have each assigned a “stable” credit outlook on the State’s general obligation debt. Moody’s has assigned a “negative” credit outlook on the State’s general obligation debt. Each such rating and credit outlook reflects only the views of the respective rating agency, and an explanation of the significance of such rating and credit outlook may be obtained from such rating agency. There is no assurance that such ratings will continue for any given period of time or that they will not be revised or withdrawn entirely by such rating agency if in the judgment of such rating agency circumstances so warrant. A downward revision or withdrawal of any such rating may have an adverse effect on the market prices of the Bonds.
TAX EXEMPTION OF THE BONDS
Opinion of Bond Counsel and Tax Counsel - Federal Tax Exemption
In the opinion of Bond Counsel and Tax Counsel, under existing law, interest on the Bonds is excluded from gross income for federal income tax purposes and is not an item of tax preference for purposes of the federal alternative minimum tax; however, with respect to certain corporations (as defined for federal income tax purposes) subject to the federal alternative minimum tax, such interest is taken into account in computing the federal alternative minimum tax. The Series F Bonds shall not be designated as qualified private activity bonds under Section 142(a)(14) of the Code.

I-8
Bond Counsel’s and Tax Counsel’s opinions with respect to the Bonds will be rendered in reliance upon and assuming the accuracy of and continuing compliance by the State with its representations and covenants relating to certain requirements of the Internal Revenue Code of 1986, as amended (the “Code”). The Code establishes certain requirements that must be met at and subsequent to the issuance of the Bonds in order that interest on the Bonds be and remain excluded from gross income of the owners thereof for federal income tax purposes. Failure to comply with the continuing requirements may cause interest on the Bonds to be included in gross income for federal income tax purposes retroactively to the date of their issuance irrespective of the date on which such noncompliance occurs. In the Tax Compliance Agreement and the Tax Certificate, which will be delivered concurrently with the issuance of the Bonds, the State will covenant to comply with certain provisions of the Code and will make certain representations designed to assure compliance with such requirements of the Code.
Pursuant to Section 3-20 of the General Statutes of the State, as amended, the State covenants that it will at all times comply with all requirements of the Code that must be satisfied subsequent to the issuance of the Bonds to ensure that interest on the Bonds will be excluded from gross income of the owners thereof for federal income tax purposes, including covenants regarding, among other matters, the use, expenditure and investment of the proceeds of the Bonds and the timely payment to the United States of any arbitrage rebate amounts with respect to the Bonds.
No other opinion is expressed by Bond Counsel or Tax Counsel regarding the federal tax consequences of the ownership of, or the receipt or accrual of interest on, the Bonds.
Original Issue Discount
The initial public offering prices of certain maturities of the Bonds are less than their stated principal amounts (the “OID Bonds”). Under existing law, the difference between the stated principal amount and the initial offering price of each maturity of the OID Bonds to the public (excluding bond houses and brokers) at which a substantial amount of such maturity of the OID Bonds is sold will constitute original issue discount (“OID”). The offering prices relating to the yields set forth on the inside front cover page of this Official Statement for the OID Bonds are expected to be the initial offering prices to the public at which a substantial amount of each maturity of the OID Bonds are sold. Under existing law, OID on the OID Bonds accrued and properly allocable to the owners thereof under the Code is excluded from gross income for federal income tax purposes if interest on the OID Bonds is excluded from gross income for federal income tax purposes.
Under the Code, for purposes of determining an owner’s adjusted basis in an OID Bond, OID treated as having accrued while the owner holds the OID Bond will be added to the owner’s basis. OID will accrue on a constant-yield-to-maturity method based on regular compounding. The owner’s adjusted basis will be used to determine taxable gain or loss upon the sale or other disposition (including redemption or payment at maturity) of an OID Bond. For certain corporations (as defined for federal income tax purposes) a portion of the OID that accrues in each year to such an owner of an OID Bond will be included in the calculation of the corporation’s federal alternative minimum tax liability. As a result, ownership of an OID Bond by such a corporation may result in an alternative minimum tax liability even though such owner has not received a corresponding cash payment.
Prospective purchasers of OID Bonds should consult their tax advisors regarding the calculation of accrued OID, the accrual of OID in the case of owners of the OID Bonds purchasing such OID Bonds after the initial offering and sale, and the state and local tax consequences of owning or disposing of such OID Bonds.
I-9
Original Issue Premium
The initial public offering prices of certain maturities of the Bonds are more than their stated principal amounts (the “OIP Bonds”). An owner who purchases an OIP Bond must amortize bond premium as provided in applicable Treasury Regulations, and amortized premium reduces the owner’s basis in the OIP Bond for federal income tax purposes. Prospective purchasers of OIP Bonds should consult their tax advisors regarding the amortization of premium and its effect upon basis.
Other Federal Tax Matters
In addition to the matters addressed above, prospective purchasers of the Bonds should be aware that the ownership of tax-exempt obligations, such as the Bonds, may result in collateral federal income tax consequences to certain taxpayers, including without limitation, taxpayers eligible for the earned income credit, recipients of Social Security and certain Railroad Retirement benefits, taxpayers that may be deemed to have incurred or continued indebtedness to purchase or carry tax-exempt obligations, financial institutions, certain insurance companies, certain S corporations with excess net passive income, and foreign corporations subject to the branch profits tax. Prospective purchasers of the Bonds should consult their tax advisors regarding the applicability and impact of such consequences. Prospective purchasers of the Bonds may also wish to consult with their tax advisors with respect to the need to furnish certain taxpayer information in order to avoid backup withholding.
State Taxes
In the opinion of Bond Counsel and Tax Counsel, under existing statutes, interest on the Bonds is excluded from Connecticut taxable income for purposes of the Connecticut income tax on individuals, trusts and estates and is excluded from amounts on which the net Connecticut minimum tax is based in the case of individuals, trusts and estates required to pay the federal alternative minimum tax.
Interest on the Bonds is included in gross income for purposes of the Connecticut corporation business tax.
Accrued original issue discount on an OID Bond is also excluded from Connecticut taxable income for purposes of the Connecticut income tax on individuals, trusts and estates and is excluded from amounts on which the net Connecticut minimum tax is based in the case of individuals, trusts and estates required to pay the federal alternative minimum tax.
Owners of OID Bonds or OIP Bonds should consult their tax advisors with respect to the determination for state and local income tax purposes of original issue discount or original issue premium accrued upon sale or redemption thereof, and with respect to the state and local tax consequences of owning or disposing of OID Bonds or OIP Bonds.
Owners of the Bonds should consult their tax advisors with respect to other applicable state and local tax consequences of ownership of the Bonds and the disposition thereof.
General
The opinions of Bond Counsel and Tax Counsel are rendered as of their date and Bond Counsel and Tax Counsel assume no obligation to update or supplement their opinions to reflect any facts or circumstances that may come to their attention or any changes in law or the interpretation thereof that may occur after the date of their opinions.
Federal, state or local legislation, administrative pronouncements or court decisions may affect the tax-exempt status of interest on the Bonds, gain from the sale or other disposition of the Bonds, the market value of the Bonds, or the marketability of the Bonds, or otherwise prevent the owners of the Bonds from realizing the full current benefit of the exclusion from gross income of the interest thereon. For example, federal legislative proposals have been made

I-10
recently and in recent years that would, among other things, limit the exclusion from gross income of interest on obligations such as the Bonds for higher-income taxpayers. If enacted into law, such proposals could affect the tax exemption of interest on the Bonds or the market price for, or marketability of, the Bonds. No assurance can be given with respect to the impact of future legislation on the Bonds. Prospective purchasers of the Bonds should consult their own tax and financial advisors regarding such matters.
The discussion above does not purport to address all aspects of federal, state or local taxation that may be relevant to a particular owner of a Bond. Prospective owners of the Bonds, particularly those who may be subject to special rules, are advised to consult their tax advisors regarding the federal, state and local tax consequences of owning and disposing of the Bonds.
CONTINUING DISCLOSURE AGREEMENT
The General Statutes of Connecticut give the State the specific authority to enter into continuing disclosure agreements in accordance with the requirements of Securities and Exchange Commission Rule 15c2-12 (the “Rule”). The State will enter into a Continuing Disclosure Agreement with respect to the Bonds for the benefit of the beneficial owners of the Bonds, substantially in the form attached as Appendix I-C to this Official Statement (the “Continuing Disclosure Agreement”), pursuant to which the State will agree to provide or cause to be provided, in accordance with the requirements of the Rule: (i) certain annual financial information and operating data, (ii) in a timely manner not in excess of ten business days after the occurrence of the event, notice of the occurrence of certain events with respect to the Bonds, and (iii) timely notice of a failure by the State to provide the required annual financial information on or before the date specified in the Continuing Disclosure Agreement. The Underwriters’ obligation to purchase the Bonds shall be conditioned upon their receiving, at or prior to the delivery of the Bonds, an executed copy of the Continuing Disclosure Agreement.
To its knowledge, in the last five years the State has not failed to comply in any material respect with its undertakings pursuant to a continuing disclosure agreement executed by the State. Certain prior annual reports of the State and other required reports are available from the Electronic Municipal Market Access website (“EMMA”) of the Municipal Securities Rulemaking Board (the “MSRB”), or such other website as may be designated from time to time by the MSRB or the Securities and Exchange Commission. Filings through EMMA are linked to particular obligations by a 9-digit CUSIP number, based on base (6-digit) CUSIP numbers, which are subject to being changed after the issuance of obligations as a result of various actions. The State has entered into continuing disclosure agreements requiring filings to be made with respect to thousands of CUSIP numbers. Most filings by the State through EMMA, such as annual reports, are made using the base 6-digit CUSIP numbers. Although the State endeavors through this process to link each report filed through EMMA to the correct CUSIP number (including those assigned without its knowledge), there can be no guarantee of complete accuracy in this process, given the large number of 9-digit CUSIP numbers assigned to the State’s obligations. The State does not believe an inaccuracy resulting from such CUSIP process is a material failure to comply with its continuing disclosure obligations.
DOCUMENTS ACCOMPANYING DELIVERY OF THE BONDS
State Treasurer’s Certificate
Upon delivery of the Bonds, the State shall furnish a certificate of the Treasurer, dated the date of delivery of the Bonds, stating that the Official Statement, as of its date, did not contain any untrue statement of a material fact or omit to state any material fact necessary to make the statements therein, in light of the circumstances under which they were made, not misleading and that there has been no material adverse change (other than in the ordinary course of the operations of the State) in the financial condition of the State from that set forth in or contemplated by this Official Statement. In providing such certificate, the Treasurer will state that she has not undertaken independently to verify information obtained or derived from various publications of agencies of the Federal government and presented in Appendix III-B to this Official Statement under the caption STATE ECONOMY.

I-11
Absence of Litigation
Upon delivery of the Bonds, the State shall furnish a certificate of the Attorney General of the State, dated the date of delivery of the Bonds, to the effect that there is no controversy or litigation of any nature pending or threatened to restrain or enjoin the issuance, sale, execution or delivery of the Bonds, or in any way contesting or affecting the validity of the Bonds or any of the proceedings taken with respect to the issuance and sale thereof or the application of monies to the payment of the Bonds. In addition, such certificate shall state that, except as disclosed in this Official Statement, there is no controversy or litigation of any nature now pending by or against the State which, in the opinion of the Attorney General, will be finally determined so as to result individually or in the aggregate in a final judgment against the State which would materially adversely affect its financial condition or the power of the State to levy, collect and enforce the collection of taxes or other revenues for the payment of its bonds.
Approving Opinions of Bond Counsel and Opinions of Disclosure Counsel, Tax Counsel and Underwriters’ Counsel
The State Treasurer, with the approval of the Attorney General of the State of Connecticut, has appointed the following firms to serve as Bond Counsel with respect to the Series E Bonds, and delivery of the Series E Bonds will be subject to the approving opinions of Bond Counsel as follows:
(a) Hawkins Delafield & Wood LLP with respect to the $47,265,000 General Obligation Bonds (2016 Series E-1);
(b) Lewis & Munday, A Professional Corporation with respect to the $204,020,000 General Obligation Bonds (2016 Series E-2);
(c) Pullman & Comley, LLC with respect to the $90,780,000 General Obligation Bonds (2016 Series E-3);
(d) Robinson & Cole LLP with respect to the $133,785,000 General Obligation Bonds (2016 Series E-4);
(e) Shipman & Goodwin LLP with respect to the $94,405,000 General Obligation Bonds (2016 Series E-5); and
(f) Squire Patton Boggs (US) LLP with respect to the $14,745,000 General Obligation Bonds (2016 Series E-6).
The State Treasurer, with the approval of the Attorney General of the State of Connecticut, has appointed the following firm to serve as Bond Counsel with respect to the Series F Bonds, and delivery of the Series F Bonds will be subject to the approving opinion of Bond Counsel as follows:
(a) Schiff Hardin LLP with respect to the $65,000,000 General Obligation Bonds (2016 Series F-1 - Green Bonds).
The opinion of each Bond Counsel with respect to the series of the Bonds indicated above will be substantially in the form included as Appendix I-B to this Official Statement. Certain Bond Counsel have served as underwriters’ counsel in connection with other State bond issues.
Certain legal matters will be passed upon for the State by its Disclosure Counsel, Day Pitney LLP of Hartford, Connecticut. In addition, the firm of Soeder & Associates, LLC of Hartford, Connecticut, serves as Co-Disclosure Counsel.
Certain legal matters will be passed upon for the State by its Tax Counsel, Robinson & Cole LLP of Hartford, Connecticut. In addition, the firm of Soeder & Associates, LLC serves as Co-Tax Counsel.
Certain legal matters will be passed upon for the Underwriters by their co-counsel, Wiggin and Dana LLP of New Haven, Connecticut and Locke Lord LLP of Boston, Massachusetts.

I-12
FINANCIAL ADVISOR
The State has appointed Acacia Financial Group, Inc., A.C. Advisory, Inc. and PFM Financial Advisors LLC, to serve as financial advisors to assist the State in the issuance of the Bonds.
UNDERWRITING
The aggregate initial offering price of the Series E Bonds to the public is $661,131,298.75 plus accrued interest, if any. The Underwriters have jointly and severally agreed, subject to certain conditions precedent to closing, to purchase the Series E Bonds from the State at an aggregate purchase price of $658,848,827.28, reflecting an underwriters’ discount of $2,282,471.47.
The aggregate initial offering price of the Series F Bonds to the public is $75,875,517.05 plus accrued interest, if any. The Underwriters have jointly and severally agreed, subject to certain conditions precedent to closing, to purchase the Series F Bonds from the State at an aggregate purchase price of $75,561,719.71, reflecting an underwriters’ discount of $313,797.34.
The Underwriters will be obligated to purchase all of the Bonds, if any such Bonds are purchased. The Bonds may be offered and sold to certain dealers (including unit investment trusts and other affiliated portfolios of certain underwriters and other dealers depositing the Bonds into investment trusts) at prices lower than such initial public offering prices, and such initial public offering prices may be changed, from time to time, by the Underwriters.
Wells Fargo Securities is the trade name for certain securities-related capital markets and investment banking services of Wells Fargo & Company and its subsidiaries, including Wells Fargo Bank, N.A, acting through its Municipal Products Group.
[INTENTIONALLY LEFT BLANK]

I-13
ADDITIONAL INFORMATION
It is the present policy of the State to make available, upon request to the Office of the State Treasurer, electronic copies of this Official Statement or parts hereof and subsequent official statements or parts thereof relating to the issuance of its general obligation bonds.
Additional information may be obtained upon request to the Office of the State Treasurer, Attn: Sarah K. Sanders, Assistant Treasurer for Debt Management, 55 Elm Street, Hartford, Connecticut 06106, (860) 702-3288.
STATE OF CONNECTICUT Dated at Hartford, Connecticut this 19th day of October, 2016 /s/ Denise L. Nappier
Denise L. Nappier State Treasurer

[THIS PAGE INTENTIONALLY LEFT BLANK]
I-A-1
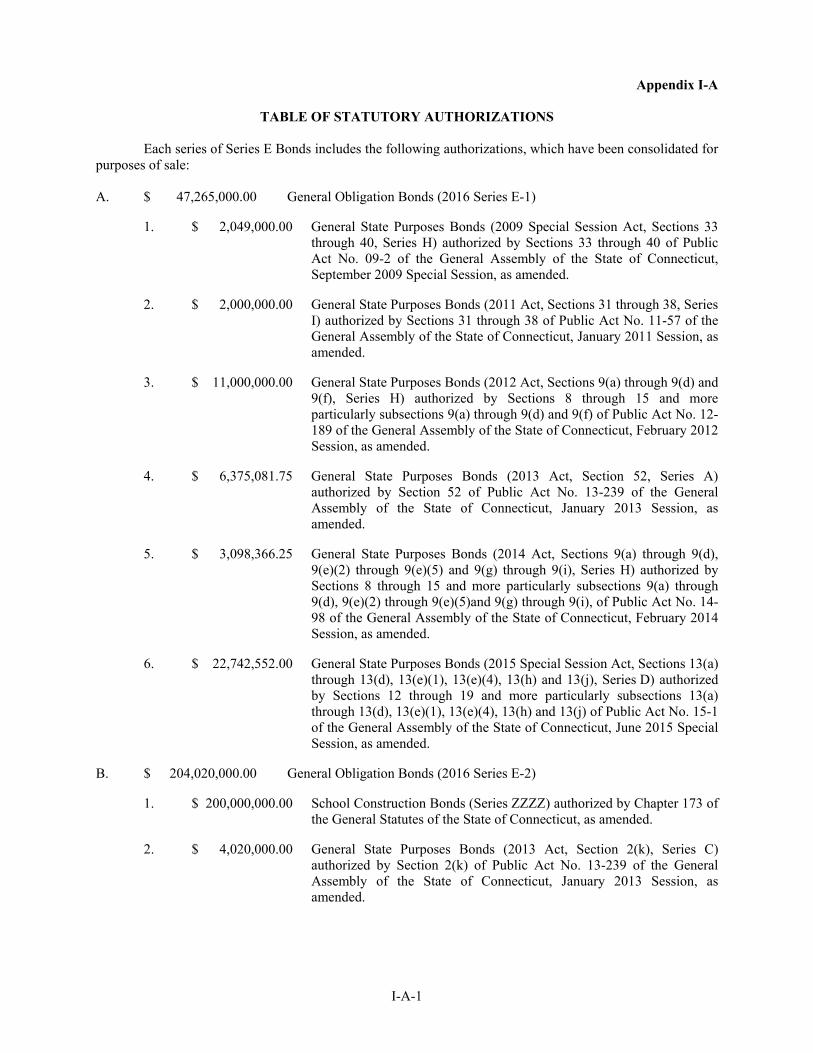
Appendix I-A
TABLE OF STATUTORY AUTHORIZATIONS
Each series of Series E Bonds includes the following authorizations, which have been consolidated for purposes of sale:
A. $ 47,265,000.00 General Obligation Bonds (2016 Series E-1)
1. $ 2,049,000.00 General State Purposes Bonds (2009 Special Session Act, Sections 33 through 40, Series H) authorized by Sections 33 through 40 of Public Act No. 09-2 of the General Assembly of the State of Connecticut, September 2009 Special Session, as amended.
2. $ 2,000,000.00 General State Purposes Bonds (2011 Act, Sections 31 through 38, Series I) authorized by Sections 31 through 38 of Public Act No. 11-57 of the General Assembly of the State of Connecticut, January 2011 Session, as amended.
3. $ 11,000,000.00 General State Purposes Bonds (2012 Act, Sections 9(a) through 9(d) and 9(f), Series H) authorized by Sections 8 through 15 and more particularly subsections 9(a) through 9(d) and 9(f) of Public Act No. 12-189 of the General Assembly of the State of Connecticut, February 2012 Session, as amended.
4. $ 6,375,081.75 General State Purposes Bonds (2013 Act, Section 52, Series A) authorized by Section 52 of Public Act No. 13-239 of the General Assembly of the State of Connecticut, January 2013 Session, as amended.
5. $ 3,098,366.25 General State Purposes Bonds (2014 Act, Sections 9(a) through 9(d), 9(e)(2) through 9(e)(5) and 9(g) through 9(i), Series H) authorized by Sections 8 through 15 and more particularly subsections 9(a) through 9(d), 9(e)(2) through 9(e)(5)and 9(g) through 9(i), of Public Act No. 14-98 of the General Assembly of the State of Connecticut, February 2014 Session, as amended.
6. $ 22,742,552.00 General State Purposes Bonds (2015 Special Session Act, Sections 13(a) through 13(d), 13(e)(1), 13(e)(4), 13(h) and 13(j), Series D) authorized by Sections 12 through 19 and more particularly subsections 13(a) through 13(d), 13(e)(1), 13(e)(4), 13(h) and 13(j) of Public Act No. 15-1 of the General Assembly of the State of Connecticut, June 2015 Special Session, as amended.
B. $ 204,020,000.00 General Obligation Bonds (2016 Series E-2)
1. $ 200,000,000.00 School Construction Bonds (Series ZZZZ) authorized by Chapter 173 of the General Statutes of the State of Connecticut, as amended.
2. $ 4,020,000.00 General State Purposes Bonds (2013 Act, Section 2(k), Series C) authorized by Section 2(k) of Public Act No. 13-239 of the General Assembly of the State of Connecticut, January 2013 Session, as amended.

I-A-2
C. $ 90,780,000.00 General Obligation Bonds (2016 Series E-3)
1. $ 37,855,507.39 Community Conservation Development Bonds (1979 Act, Section 21(a), Series UU) authorized by Section 21(a) of Public Act No. 79-607 of the General Assembly of the State of Connecticut, as amended.
2. $ 13,633,000.00 Economic Development and Manufacturing Assistance Bonds (1990 Act, Section 33, Series VV) authorized by Section 33 of Public Act No. 90-270 of the General Assembly of the State of Connecticut, as amended.
3. $ 13,000,000.00 Energy Service Bonds (2007 Act, Section 73, Series A) authorized by Section 73 of Public Act No. 07-242 of the General Assembly of the State of Connecticut, June 2007 Special Session, as amended.
4. $ 5,575,411.61 Housing Development and Rehabilitation Bonds (January 2011 Session Act, Sections 27 to 30, Series G) authorized by Sections 27 to 30 of Public Act No. 11-57 of the General Assembly of the State of Connecticut, January 2011 Session, as amended.
5. $ 10,753,448.00 Housing Development and Rehabilitation Bonds (January 2013 Session Act, Sections 8 to 11, Series C) authorized by Sections 8 to 11 of Public Act No. 13-239 of the General Assembly of the State of Connecticut, January 2013 Session, as amended.
6. $ 9,962,633.00 Housing Development and Rehabilitation Bonds (January 2013 Session Act, Sections 27 to 30, Series C) authorized by Sections 27 to 30 of Public Act No. 13-239 of the General Assembly of the State of Connecticut, January 2013 Session, as amended.
D. $ 133,785,000.00 General Obligation Bonds (2016 Series E-4)
1. $ 10,000,000.00 General State Purposes Bonds (1999 Act, Sections 2(a) through 2(i) and 2(m) through 2(p), Series G) authorized by Sections 2(a) through 2(i) and 2(m) through 2(p) of Public Act No. 99-242 of the General Assembly of the State of Connecticut, January 1999 Session, as amended.
2. $ 5,940,328.82 General State Purposes Bonds (2007 Act, Sections 2(a) through 2(q), 2(u) through 2(w) and Section 13(a)(4), Series H) authorized by Sections 2(a) through 2(q), 2(u) through 2(w) and Section 13(a)(4) of Public Act. No. 07-7 of the General Assembly of the State of Connecticut, June 2007 Special Session, as amended.
3. $ 125,000.00 General State Purposes Bonds (2011 Act, Section 25, Series B) authorized by Section 25 of Public Act No. 11-1 of the General Assembly of the State of Connecticut, October 2011 Special Session, as amended.
4. $ 35,042,743.00 General State Purposes Bonds (2011 Act, Sections 2(a) through 2(k) and 2(n) through 2(q), Series H) authorized by Sections 2(a) through 2(k) and 2(n) through 2(q) of Public Act. No. 11-57 of the General Assembly of the State of Connecticut, June 2011 Session, as amended.

I-A-3
5. $ 10,179,550.18 General State Purposes Bonds (2011 Act, Sections 21(a) through 21(j) and 21(m) through 21(n), Series I) authorized by Sections 21(a) through 21(j) and 21(m) through 21(n) of Public Act No. 11-57 of the General Assembly of the State of Connecticut, June 2011 Session, as amended.
6. $ 59,397,378.00 General State Purposes Bonds (2013 Act, Sections 21(a) through 21(g), 21(i) through 21(j) and 21(m) through 21(o), Series C) authorized by Sections 21(a) through 21(g), 21(i) through 21(j) and 21(m) through 21(o) of Public Act No. 13-239 of the General Assembly of the State of Connecticut, January 2013 Session, as amended.
7. $ 13,100,000.00 General State Purposes Bonds (2014 Act, Sections 2(a) through 2(h) and 2(j) through 2(k), Series C) authorized by, Sections 2(a) through 2(h) and 2(j) through 2(k) of Public Act No. 14-98 of the General Assembly of the State of Connecticut, February 2014 Session, as amended.
E. $ 94,405,000.00 General Obligation Bonds (2016 Series E-5)
1. $ 60,392,802.00 General State Purposes Bonds (2007 Special Session Act, Section 105, Series L) authorized by Section 105 of Public Act No. 07-7 of the General Assembly of the State of Connecticut, June 2007 Special Session, as amended.
2. $ 8,006,199.00 General State Purposes Bonds (2009 Special Session Act, Section 42(e), Series F) authorized by Section 42(e) of Public Act No. 09-2 of the General Assembly of the State of Connecticut, September 2009 Special Session, as amended.
3. $ 1,861,326.00 General State Purposes Bonds (2011 Act, Section 2(m), Series F) authorized by Section 2(m) of Public Act No. 11-57 of the General Assembly of the State of Connecticut, January 2011 Session, as amended.
4. $ 1,681,451.00 General State Purposes Bonds (2013 Act, Section 2(l), Series E) authorized by Section 2(l) of Public Act No. 13-239 of the General Assembly of the State of Connecticut, January 2013 Session, as amended.
5. $ 2,963,222.00 General State Purposes Bonds (2013 Act, Section 21(l), Series C) authorized by Section 21(l) of Public Act No. 13-239 of the General Assembly of the State of Connecticut, January 2013 Session, as amended.
6. $ 19,500,000.00 General State Purposes Bonds (2015 Special Session Act, Section 2(n), Series B) authorized by Section 2(n) of Public Act No. 15-1 of the General Assembly of the State of Connecticut, June 2015 Special Session, as amended.
F. $ 14,745,000.00 General Obligation Bonds (2016 Series E-6)
1. $ 7,495,946.90 General State Purposes Bonds (2013 Act, Section 2(h), Series E) authorized by Section 2(h) of Public Act No. 13-239 of the General Assembly of the State of Connecticut, January 2013 Session, as amended.

I-A-4
2. $ 4,000.00 General State Purposes Bonds (2013 Act, Section 21(h), Series C) authorized by Section 21(h) of Public Act No. 13-239 of the General Assembly of the State of Connecticut, January 2013 Session, as amended.
3. $ 4,750,000.00 General State Purposes Bonds (2014 Act, Section 2(i), Series A) authorized by, Section 2(i) of Public Act No. 14-98 of the General Assembly of the State of Connecticut, February 2014 Session, as amended.
4. $ 1,500,000.00 General State Purposes Bonds (2015 Special Session Act, Section 13(g), Series A) authorized by Section 13(g) of Public Act No. 15-1 of the General Assembly of the State of Connecticut, June 2015 Special Session, as amended.
5. $ 995,053.10 General State Purposes Bonds (2015 Special Session Act, Section 32(h), Series A) authorized by Section 32(h) of Public Act No. 15-1 of the General Assembly of the State of Connecticut, June 2015 Special Session, as amended.

I-A-5
Appendix I-A
TABLE OF STATUTORY AUTHORIZATIONS
Each series of Series F Bonds includes the following authorizations, which have been consolidated for purposes of sale:
A. $ 65,000,000.00 General Obligation Bonds (2016 Series F-1 - Green Bonds)
1. $ 65,000,000.00 Water Pollution Control Bonds (1986 Act, Series OO) authorized by Sections 1 through 12 of Public Act No. 86-420 of the General Assembly of the State of Connecticut, as amended.

[THIS PAGE INTENTIONALLY LEFT BLANK]
I-B-1
Appendix I-B
FORM OF BOND COUNSEL OPINION – SERIES E BONDS
The opinion of each Bond Counsel with respect to the series of the Series E Bonds for which such firm has been appointed to serve as Bond Counsel will be dated the date of original issuance of the Series E Bonds and will be substantially in the following form:
Honorable Denise L. Nappier Treasurer, State of Connecticut Hartford, Connecticut
We have acted as bond counsel to our client, the State of Connecticut (the “State”), in connection with, and have examined a record of proceedings relative to, the issuance of $__________ General Obligation Bonds (2016 Series E-_) of the State (the “Bonds”). The Bonds are issued contemporaneously with other general obligation bonds of the State of the same series in the aggregate principal amount of $585,000,000.
The Bonds are comprised of the issue[s] of bonds identified within the Bonds which were authorized by the statutory provision[s] identified therein [and have been consolidated as a single issue]. The Bonds are issued under and pursuant to proceedings taken in accordance with Section 3-20 of the General Statutes of Connecticut, Revision of 1958, as amended, resolutions adopted by the State Bond Commission and proceedings taken in conformity therewith, including a Certificate of Determination executed by the State Treasurer and filed with the Secretary of the State Bond Commission, a Tax Certificate and a Tax Compliance Agreement.
As to questions of fact material to our opinion we have relied upon the certified proceedings and other certifications of public officials furnished to us without undertaking to verify the same by independent investigation.
We have not been engaged and we have not undertaken to review the accuracy, completeness or sufficiency of the Official Statement or other offering material relating to the Bonds and we express no opinion relating thereto (excepting only the matters set forth as our opinion in the Official Statement and certain matters which are the subject of a supplemental opinion provided by us to the State).
We are of the opinion that (i) the Bonds, when duly certified by U.S. Bank National Association, as Registrar, will be valid and legally binding general obligations of the State for the payment of the principal of and interest on which the full faith and credit of the State are pledged, and (ii) the State, acting through the General Assembly, has the power to levy ad valorem taxes upon all taxable property within the State without limitation as to rate or amount to pay the principal of and interest thereon. We are further of the opinion that the Tax Compliance Agreement is a valid and binding agreement of the State and that the Tax Certificate and the Tax Compliance Agreement were duly authorized by the State.
The Internal Revenue Code of 1986, as amended (the “Code”), establishes certain requirements that must be met at and subsequent to the issuance and delivery of the Bonds in order that interest on the Bonds be excluded from gross income for federal income tax purposes. In the Tax Compliance Agreement and the Tax Certificate, the State has made covenants and representations designed to assure compliance with such requirements of the Code. The State has covenanted in the Tax Compliance Agreement that it will at all times comply with all requirements of the Code that must be satisfied subsequent to the issuance of the Bonds to ensure that interest on the Bonds shall be excluded from the gross income of the owners thereof for federal income tax purposes, retroactively to

I-B-2
the date of issue or otherwise, including covenants regarding, among other matters, the use, expenditure and investment of the proceeds of the Bonds, and the timely payment to the United States of any arbitrage rebate amounts with respect to the Bonds.
We are of the opinion that, under existing law, interest on the Bonds (a) is excluded from gross income for federal income tax purposes, and (b) is not an item of tax preference for purposes of the federal alternative minimum tax imposed on individuals and corporations; however, with respect to certain corporations (as defined for federal income tax purposes) subject to the federal alternative minimum tax, such interest is taken into account in computing the federal alternative minimum tax.
In rendering the foregoing opinions regarding the federal income tax treatment of interest on the Bonds, we have relied upon and assumed without undertaking to verify the same by independent investigation, but have no knowledge of any inaccuracies, (i) the material accuracy of the representations, statements of intention and reasonable expectations, and certifications of fact contained in the Tax Certificate and the Tax Compliance Agreement, and (ii) the continuing compliance by the State with all requirements of the Code that must be satisfied subsequent to the issuance of the Bonds in order that the interest thereon be, or continues to be, excluded from gross income for federal income tax purposes, as provided in the covenants set forth in the Tax Compliance Agreement as to such matters. We also have relied upon, with no independent investigation, the approving opinions of bond counsel with respect to the other general obligation bonds of the State of Connecticut issued contemporaneously with the Bonds in the aggregate principal amount of $650,000,000 as to the validity and legality of such bonds and as to the exclusion of the interest thereon from gross income of the owners thereof for federal income tax purposes.
We are further of the opinion that, under existing statutes, interest on the Bonds is excluded from Connecticut taxable income for purposes of the Connecticut income tax on individuals, trusts and estates and is excluded from amounts on which the net Connecticut minimum tax is based in the case of individuals, trusts and estates required to pay the federal alternative minimum tax.
We express no opinion regarding other federal or state tax consequences of the ownership of or receipt or accrual of interest on the Bonds.
The rights of the owners of the Bonds and the enforceability of the Bonds may be limited by insolvency, reorganization, moratorium, and other similar laws affecting creditors’ rights generally, and by equitable principles, and the exercise of judicial discretion, whether considered at law or in equity. This opinion is given as of the date hereof, and we assume no obligation to revise or supplement this opinion to reflect any facts or circumstances that may hereafter come to our attention or any changes in law that may hereafter occur.
Respectfully yours,

I-B-3
Appendix I-B
FORM OF BOND COUNSEL OPINION – SERIES F BONDS
The opinion of each Bond Counsel with respect to the series of the Series F Bonds for which such firm has been appointed to serve as Bond Counsel will be dated the date of original issuance of the Series F Bonds and will be substantially in the following form:
Honorable Denise L. Nappier Treasurer, State of Connecticut Hartford, Connecticut
We have acted as bond counsel to our client, the State of Connecticut (the “State”), in connection with, and have examined a record of proceedings relative to, the issuance of $65,000,000 General Obligation Bonds (2016 Series F-1 - Green Bonds) of the State (the “Bonds”).
The Bonds are comprised of the issue of bonds identified within the Bonds which were authorized by the statutory provision identified therein. The Bonds are issued under and pursuant to proceedings taken in accordance with Section 3-20 of the General Statutes of Connecticut, Revision of 1958, as amended, resolutions adopted by the State Bond Commission and proceedings taken in conformity therewith, including a Certificate of Determination executed by the State Treasurer and filed with the Secretary of the State Bond Commission, a Tax Certificate and a Tax Compliance Agreement.
As to questions of fact material to our opinion we have relied upon the certified proceedings and other certifications of public officials furnished to us without undertaking to verify the same by independent investigation.
We have not been engaged and we have not undertaken to review the accuracy, completeness or sufficiency of the Official Statement or other offering material relating to the Bonds and we express no opinion relating thereto (excepting only the matters set forth as our opinion in the Official Statement and certain matters which are the subject of a supplemental opinion provided by us to the State).
We are of the opinion that (i) the Bonds, when duly certified by U.S. Bank National Association, as Registrar, will be valid and legally binding general obligations of the State for the payment of the principal of and interest on which the full faith and credit of the State are pledged, and (ii) the State, acting through the General Assembly, has the power to levy ad valorem taxes upon all taxable property within the State without limitation as to rate or amount to pay the principal of and interest thereon. We are further of the opinion that the Tax Compliance Agreement is a valid and binding agreement of the State and that the Tax Certificate and the Tax Compliance Agreement were duly authorized by the State.
The Internal Revenue Code of 1986, as amended (the “Code”), establishes certain requirements that must be met at and subsequent to the issuance and delivery of the Bonds in order that interest on the Bonds be excluded from gross income for federal income tax purposes. In the Tax Compliance Agreement and the Tax Certificate, the State has made covenants and representations designed to assure compliance with such requirements of the Code. The State has covenanted in the Tax Compliance Agreement that it will at all times comply with all requirements of the Code that must be satisfied subsequent to the issuance of the Bonds to ensure that interest on the Bonds shall be excluded from the gross income of the owners thereof for federal income tax purposes, retroactively to the date of issue or otherwise, including covenants regarding, among other matters, the use,
I-B-4
expenditure and investment of the proceeds of the Bonds, and the timely payment to the United States of any arbitrage rebate amounts with respect to the Bonds.
We are of the opinion that, under existing law, interest on the Bonds (a) is excluded from gross income for federal income tax purposes, and (b) is not an item of tax preference for purposes of the federal alternative minimum tax imposed on individuals and corporations; however, with respect to certain corporations (as defined for federal income tax purposes) subject to the federal alternative minimum tax, such interest is taken into account in computing the federal alternative minimum tax.
In rendering the foregoing opinions regarding the federal income tax treatment of interest on the Bonds, we have relied upon and assumed without undertaking to verify the same by independent investigation, but have no knowledge of any inaccuracies, (i) the material accuracy of the representations, statements of intention and reasonable expectations, and certifications of fact contained in the Tax Certificate and the Tax Compliance Agreement, and (ii) the continuing compliance by the State with all requirements of the Code that must be satisfied subsequent to the issuance of the Bonds in order that the interest thereon be, or continues to be, excluded from gross income for federal income tax purposes, as provided in the covenants set forth in the Tax Compliance Agreement as to such matters. We also have relied upon, with no independent investigation, the approving opinions of bond counsel with respect to the other general obligation bonds of the State of Connecticut issued contemporaneously with the Bonds in the aggregate principal amount of $650,000,000 as to the validity and legality of such bonds and as to the exclusion of the interest thereon from gross income of the owners thereof for federal income tax purposes.
We are further of the opinion that, under existing statutes, interest on the Bonds is excluded from Connecticut taxable income for purposes of the Connecticut income tax on individuals, trusts and estates and is excluded from amounts on which the net Connecticut minimum tax is based in the case of individuals, trusts and estates required to pay the federal alternative minimum tax.
We express no opinion regarding other federal or state tax consequences of the ownership of or receipt or accrual of interest on the Bonds.
The rights of the owners of the Bonds and the enforceability of the Bonds may be limited by insolvency, reorganization, moratorium, and other similar laws affecting creditors’ rights generally, and by equitable principles, and the exercise of judicial discretion, whether considered at law or in equity. This opinion is given as of the date hereof, and we assume no obligation to revise or supplement this opinion to reflect any facts or circumstances that may hereafter come to our attention or any changes in law that may hereafter occur.
Respectfully yours,
I-C-1
Appendix I-C
FORM OF CONTINUING DISCLOSURE AGREEMENT
In accordance with the requirements of Rule 15c2-12 promulgated by the Securities and Exchange Commission, the State will agree, pursuant to a Continuing Disclosure Agreement for the Bonds to be executed by the State substantially in the following form, to provide, or cause to be provided, (i) certain annual financial information and operating data, (ii) in a timely manner not in excess of ten business days after the occurrence of the event, notice of the occurrence of certain events with respect to the Bonds, and (iii) timely notice of a failure by the State to provide the required annual financial information on or before the date specified in the Continuing Disclosure Agreement for the Bonds.
Continuing Disclosure Agreement This Continuing Disclosure Agreement (“Agreement”) is made as of the 26th day of October, 2016 by the State of Connecticut (the “State”) acting by its undersigned officer, duly authorized, in connection with the issuance of $585,000,000 General Obligation Bonds (2016 Series E) (the “Series E Bonds”) and $65,000,000 General Obligation Bonds (2016 Series F - Green Bonds) (the “Series F Bonds”) dated as of the date hereof (collectively, the Series E Bonds and the Series F Bonds are referred to herein as the “Bonds”), for the benefit of the beneficial owners from time to time of the Bonds.
Section 1. Definitions. For purposes of this Agreement, the following capitalized terms shall have the following meanings: “Final Official Statement” means the official statement of the State dated October 19, 2016 prepared in connection with the Bonds. “MSRB” means the Municipal Securities Rulemaking Board established under the Securities Exchange Act of 1934 as amended, or any successor thereto.
“Repository” means the MSRB or any other information repository established pursuant to the Rule as amended from time to time.
“Rule” means rule 15c2-12 under the Securities Exchange Act of 1934, as of the date of this Agreement. “SEC” means the Securities and Exchange Commission of the United States, or any successor thereto.
Section 2. Annual Financial Information.
(a) The State agrees to provide or cause to be provided to each Repository, in accordance with the provisions of the Rule and of this Agreement, annual financial information and operating data (commencing with information and data for the fiscal year ending June 30, 2016) as follows: (i) Financial statements of the State’s general fund, special revenue funds, debt service funds, capital projects funds, enterprise funds, internal service funds and trust and agency (fiduciary) funds and the general long-term debt account group for the prior fiscal year, which statements shall be prepared in accordance with generally accepted accounting principles or mandated state statutory principles as in effect from time to time. As of the date of this Agreement, the State is required to prepare financial statements of its various funds and accounts on a budgeted basis (i.e., on the basis of the modified cash method of accounting as described in Part III to the Final Official Statement, under the caption FINANCIAL PROCEDURES - Accounting Procedures). As of the date of this Agreement, the State also prepares its financial statements in accordance with generally accepted accounting principles but is not required to do so. The financial statements will be audited.
(ii) To the extent not included in the financial statements described in (i) above, the financial information and operating data within the meaning of the Rule described below (with references to the Final Official Statement); provided, however, that references to the Final Official Statement for the Bonds as a means of

I-C-2
identifying such financial information and operating data shall not prevent the State from reorganizing such material in subsequent official statements or annual information reports:
1. Until such time as the State’s only method of presenting its financial statements is substantially in accordance with generally accepted accounting principles (“GAAP”):
a. General Fund - Summary of Operating Results - Budgetary (Modified Cash/Statutory)
Basis (for most recent fiscal year) (See Table 2 and Appendices III-D-6 and III-D-7).
b. General Fund - Summary of Operating Results - Budgetary (Modified Cash/Statutory) Basis vs. GAAP Basis (for most recent fiscal year) (See Table 3).
c. General Fund - Unreserved Fund Balance - Budgetary (Modified Cash/Statutory) Basis
as of the end of the most recent fiscal year) (See Table 4 and Appendices III-D-4 and III-D-5).
d. General Fund - Unreserved Fund Balance - Budgetary (Modified Cash/Statutory) Basis
vs. GAAP Basis (as of the end of the most recent fiscal year) (See Table 5).
2. Statutory Debt Limit (as of end of most recent fiscal year or a later date) (See Table 7).
3. Direct General Obligation Indebtedness - Principal Amount Outstanding (as of end of most recent fiscal year or a later date) (See Table 8).
4. Summary of Principal, Mandatory Sinking Fund Payments, and Interest on Long-Term Direct
General Obligation Debt (as of end of most recent fiscal year or a later date) (See Table 10).
5. Outstanding Long-Term Direct General Obligation Debt (as of end of most recent fiscal year) (See Table 11).
6. Authorized But Unissued Direct General Obligation Debt (as of end of most recent fiscal year or
a later date) (See Table 12).
7. Statutory General Obligation Bond Authorizations and Reductions (for recent fiscal years, if any legislative action) (See Table 13).
8. Special Capital Reserve Fund Debt (as of end of most recent fiscal year or a later date) (See
Table 16).
9. Funding status of the State Employees’ Retirement Fund and the Teachers’ Retirement Fund. (b) The financial statements and other financial information and operating data described above will be provided on or before the date eight months after the close of the fiscal year for which such information is being provided. The State’s fiscal year currently ends on June 30. (c) Annual financial information and operating data may be provided in whole or in part by cross-reference to other documents available to the public on the MSRB's Internet Web site referenced in the Rule as amended from time to time or filed with the SEC. All or a portion of the financial information and operating data may be provided in the form of a comprehensive annual financial report or an annual information statement of the State. (d) The State reserves the right (i) to provide financial statements which are not audited if no longer required by law, (ii) to modify from time to time the format of the presentation of such information or data, and (iii) to modify the accounting principles it follows to the extent required by law, by changes in generally accepted accounting principles, or by changes in mandated state statutory principles as in effect from time to time; provided that the State agrees that the exercise of any such right will be done in a manner consistent with the Rule.

I-C-3
(e) Commencing with the delivery of the Clean Water State Revolving Fund Program Annual Report for the fiscal year ending June 30, 2017, the State shall provide on an annual basis a report which includes a description of the projects funded with the Series F Bonds and the amount of Series F Bond proceeds spent on such projects (but only until the proceeds of the Series F Bonds have been spent). Such information shall be posted to the Electronic Municipal Market Access website of the MSRB on an annual basis on or before the date eight months after the close of the fiscal year for which such information is being provided. Once the State has spent all of the proceeds of the Series F Bonds, the State shall no longer be obligated to report the information included in this subsection (e).
Section 3. Notice of Certain Events. The State agrees to provide or cause to be provided, in a timely manner not in excess of ten business days after the occurrence of the event, to each Repository notice of the occurrence of any of the following events with respect to the Bonds: (a) principal and interest payment delinquencies; (b) non-payment related defaults, if material; (c) unscheduled draws on debt service reserves reflecting financial difficulties; (d) unscheduled draws on credit enhancements reflecting financial difficulties; (e) substitution of credit or liquidity providers, or their failure to perform; (f) adverse tax opinions, the issuance by the Internal Revenue Service of proposed or final
determinations of taxability, Notices of Proposed Issue (IRS Form 5701-TEB) or other material notices or determinations with respect to the tax status of the bonds, or other material events affecting the tax status of the Bonds;
(g) modifications to rights of holders of the Bonds, if material; (h) Bond calls, if material, and tender offers; (i) Bond defeasances; (j) release, substitution, or sale of property securing repayment of the Bonds, if material; (k) rating changes; (l) bankruptcy, insolvency, receivership or similar event of the State; (m) the consummation of a merger, consolidation, or acquisition involving the State or the sale of all
or substantially all of the assets of the State, other than in the ordinary course of business, the entry into a definitive agreement to undertake such an action or the termination of a definitive agreement relating to any such actions, other than pursuant to its terms, if material; and
(n) appointment of a successor or additional trustee or the change of name of a trustee, if material.
Section 4. Notice of Failure to Provide Annual Financial Information. The State agrees to provide or cause to be provided, in a timely manner, to each Repository notice of any failure by the State to provide annual financial information as set forth in Section 2(a) hereof on or before the date set forth in Section 2(b) hereof.
Section 5. Use of Agents. Annual financial information and operating data and notices to be provided pursuant to this Agreement may be provided by the State or by any agents which may be employed by the State for such purpose from time to time.
Section 6. Termination. The obligations of the State under this Agreement shall terminate upon the earlier of (i) payment or legal defeasance, at maturity or otherwise, of all of the Bonds, or (ii) such time as the State ceases to be an obligated person with respect to the Bonds within the meaning of the Rule.

I-C-4
Section 7. Enforcement. The State acknowledges that its undertakings set forth in this Agreement are intended to be for the benefit of, and enforceable by, the beneficial owners from time to time of the Bonds. In the event the State shall fail to perform its duties hereunder, the State shall have the option to cure such failure within a reasonable time (but not exceeding 30 days with respect to the undertakings set forth in Section 2 of this Agreement or five business days with respect to the undertakings set forth in Sections 3 and 4 of this Agreement) from the time the State’s Assistant Treasurer for Debt Management, or a successor, receives written notice from any beneficial owner of the Bonds of such failure. The present address of the Assistant Treasurer for Debt Management is 55 Elm Street, 6th Floor, Hartford, Connecticut 06106. In the event the State does not cure such failure within the time specified above, the beneficial owner of any Bonds shall be entitled only to the remedy of specific performance. The State expressly acknowledges and the beneficial owners are hereby deemed to expressly agree that no monetary damages shall arise or be payable hereunder nor shall any failure to comply with this Agreement constitute an event of default with respect to the Bonds.
Section 8. Miscellaneous. (a) All documents provided by the State to a Repository pursuant to the State's undertakings set forth in Sections 2, 3 and 4 of this Agreement shall be in an electronic format as prescribed by the MSRB from time to time and shall be accompanied by identifying information as prescribed by the MSRB from time to time. (b) The State shall have no obligation to provide any information, data or notices other than as set forth in this Agreement; provided however, nothing in this Agreement shall be construed as prohibiting the State from providing such additional information, data or notices from time to time as it deems appropriate in connection with the Bonds. If the State elects to provide any such additional information, data or notices, the State shall have no obligation under this Agreement to update or continue to provide further additional information, data or notices of the type so provided. (c) This Agreement shall be governed by the laws of the State of Connecticut. (d) Notwithstanding any other provision of this Agreement, the State may amend this Agreement, and any provision of this Agreement may be waived, if (i) such amendment or waiver is made in connection with a change of circumstances that arises from a change in legal requirements, a change in law, or a change in the identity, nature or status of the State, (ii) the provisions of the Agreement as so amended or waived would have complied with the requirements of the Rule, taking into account any amendments or interpretations of the Rule as well as any changes in circumstances, in each case as of the date of such amendment to the Agreement or waiver, and (iii) such amendment or waiver is supported by either an opinion of counsel expert in federal securities laws to the effect that such amendment or waiver would not materially adversely affect the beneficial owners of the Bonds or an approving vote by the holders of not less than 60% of the aggregate principal amount of the Bonds then outstanding. A copy of any such amendment or waiver will be filed in a timely manner with each Repository. The annual financial information provided on the first date following adoption of any such amendment or waiver will explain, in narrative form, the reasons for the amendment or waiver. (e) This Agreement may be executed in any number of counterparts, each of which shall be deemed an original, but such counterparts shall together constitute but one and the same instrument. STATE OF CONNECTICUT By _____________________________________
Denise L. Nappier Treasurer

II-1
PART II
INFORMATION SUPPLEMENT
OF THE STATE OF CONNECTICUT
OCTOBER 19, 2016 The Annual Information Statement of the State of Connecticut (the “State”), dated February 24, 2016, appears in this Official Statement as Part III and contains information through February 24, 2016. The State expects to provide an updating Information Supplement from time to time in the future, which will appear in this location as Part II of future Official Statements or Reoffering Circulars of the State. This Information Supplement updates certain information in the February 24, 2016 Annual Information Statement through October 19, 2016. The information in this Part II and Part III is subject to change without notice, and investors should not assume that there has been no change in the affairs of the State since the date of this Part II.
STATE GENERAL FUND
Page III-34. The information under the section “Fiscal Year 2016 Operations” is supplemented with the following information and the table titled “OPM and Comptroller Estimates Fiscal Year 2016 (in Millions)” under the heading Fiscal Year 2016 Operations is revised as follows:
OPM and Comptroller Estimates Fiscal Year 2016 (in Millions)
OPM’s Report Comptroller’s Report Period Ending:
Revenues
Expenditures(a)
Surplus/ (deficit)
Revenues
Expenditures(a)
Surplus/ (deficit)
June 30, 2016 $17,709.1 $17,988.5 $(279.4)(b) $17,780.8 $17,951.2 $(170.4) (c) _______________ (a) Expenditures include net appropriations, continued and estimated lapses and miscellaneous adjustments. (b) The Secretary of OPM noted that in accordance with existing law, the projected deficit would be extinguished via
transfer from the Budget Reserve Fund. The Secretary noted that GAAP accrual adjustments will not be finalized for several months and could potentially materially impact such projections.
(c) Based on the Comptroller’s September 30, 2016 letter to the Governor and accompanying unaudited legal financial statements.
By Statute, the Comptroller is required to submit its annual report to the Governor by September 30th in accordance with GAAP. However, the financial results reported in the Comptroller’s financial statements described above have been prepared in accordance with specific budgetary basis accounting standards set forth by statute, which incorporate new budgeted expenditure accruals consistent with specific statutory reporting requirements. In addition, GAAP accrual adjustments will not be finalized for several months and could potentially materially impact final audited results. As indicated in the table above, in such unaudited report, the Comptroller reported that the State ended Fiscal Year 2016 with a General Fund deficit of $170.4 million. In such report, the Comptroller noted that the deficit will be eliminated through a transfer from the State’s Budget Reserve Fund. As a result of such transfer, the balance in the Budget Reserve Fund will be reduced from the current level of $406.0 million to $235.6 million which is equal to 1.3% of the net General Fund appropriations for Fiscal Year 2017.

II-2
The above projections are only estimates and no assurances can be given that future events will materialize as estimated, or that subsequent estimates or adjustments by OPM, the Comptroller or other State agencies will not reflect changes in the estimated or final result of Fiscal Year 2016 operations of the General Fund. In addition, adjustments or audit or actions of the State may also result in changes in the final result of Fiscal Year 2016 operations of the General Fund.
Fiscal Year 2017 Operations
The Comptroller is required to issue cumulative monthly financial reports concerning the State General Fund on or before the first day of the following month. OPM provides estimates to the Comptroller by the twentieth day of each month of the revenues and expenditures for the current fiscal year for use by the Comptroller in preparing the Comptroller’s monthly report. The Legislature’s Office of Fiscal Analysis is not required by statute to issue monthly statements on the State’s operations, but does so from time to time.
OPM and Comptroller Estimates Fiscal Year 2017 (in Millions)
OPM’s Report Comptroller’s Report Period Ending(a):
Revenues
Expenditures(b)
Surplus/ (deficit)
Revenues
Expenditures(b)
Surplus/ (deficit)
July 31, 2016 $17,886.7 $17,886.5 $0.2(c) $17,886.7 $17,886.5 $0.2 August 31, 2016 17,886.7 17,886.5 0.2(c) 17,886.7 17,887.1 (0.4)
_______________ (a) Estimates reflect projections for Fiscal Year 2017 as of the period ending date. (b) Expenditures include net appropriations, continued and estimated lapses and miscellaneous adjustments. (c) The Secretary of OPM noted that the estimate assumes that the Governor’s line item vetoes will offset any
unbudgeted expenditures resulting from enactment of Public Act No. 16-82 as well as failure to pass Emergency Certified Bill 501 which would have implemented budgeted savings associated with specific criminal justice policy changes.
On October 13, 2016, the Legislature’s Office of Fiscal Analysis projected a deficit of $77.9 million (0.4% of budgeted expenditures) in the General Fund for Fiscal Year 2017, based on its projected changes in several revenue and expense items.
The next monthly report of OPM is expected on October 20, 2016 and the next monthly report of the Comptroller is expected on November 1, 2016. The projections discussed above are only estimates and no assurances can be given that future events will materialize as estimated, or that subsequent estimates, adjustments or actions of the State will not reflect changes in the operations of the General Fund or in the estimated or final results of Fiscal Year 2017.
Page III-34. The information under caption Consensus Revenue Estimates under the section “Forecasted Operation” is replaced with the following:
Consensus Revenue Estimates. Pursuant to Section 2-36c of the Connecticut General Statutes, on April 29, 2016, OPM and the Legislature’s Office of Fiscal Analysis issued their consensus revision to their January 15, 2016 consensus revenue estimates for the current biennium and the three ensuing fiscal years as follows:

II-3
General Fund Consensus Revenue Estimate (in Millions)
Fiscal Year
2016 2017 2018 2019 2020 Revenue Estimate January 15, 2016 ..... $18,053.9 $18,150.5 $18,321.9 $18,822.7 $19,385.6 Revenue Estimate April 29, 2016 ......... 17,732.4 17,750.4 17,847.7 18,300.1 18,824.5 Amount Changed .................................. (321.5) (400.1) (474.2) (522.6) (561.1)
The projections in the consensus revenue estimates are only estimates and no assurances can be given that future events will materialize as estimated or that subsequent estimates, adjustments or actions of the State will not indicate changes in the final results of the fiscal years reported.
Page III-35. The following information supplements the information under the heading Governor’s Midterm Budget Revisions for Fiscal Year 2017:
The General Assembly passed Public Act No. 16-2 of the May Special Session, as amended which makes mid-term budget revisions for Fiscal Year 2017 along with additional legislation to implement the budget and policy changes reflected in the budget. Based upon the most recent consensus revenue estimate issued on April 29, 2016 by the Office of Policy and Management and the legislature’s Office of Fiscal Analysis and adjusted for policy changes contained in the budget, revenues are anticipated to be $17,886.7 million, expenditures are anticipated to be $17,886.5 million, and the revised budget is estimated to result in a General Fund surplus of $0.2 million for Fiscal Year 2017 and would be approximately $612.8 million below the expenditure cap.
The revised Fiscal Year 2017 budget includes policy changes that are projected to result in
approximately $136.3 million in additional revenue above the consensus revenue forecast. The most significant change includes:
• A reduction in sales and use tax revenue transfers to both the Municipal Revenue Sharing
Account and the Special Transportation Fund.
The revised budget represents a reduction in appropriations of approximately $824.7 million compared to the originally adopted budget for Fiscal Year 2017. The more significant changes include:
• Across-the-board reductions to funding for personal services ($255.0 million) and other
expenses ($50.0 million) • Fringe benefits reductions, principally as a result of the personnel reductions noted above
($70.5 million) • Funding eliminations for wage increases ($67.6 million) • Block grant reductions for higher education ($54.5 million) • Funding reductions for municipal payment in lieu of taxes grants, public school and non-
public school transportation grants, adult education, and education cost sharing grants (net of the originally budgeted lapse) ($68.3 million)
• Reduced hospital supplemental grant payments ($44 million)
The Governor signed such bill, however he exercised his line-item veto authority for amounts totaling $22.5 million in appropriations in order to offset projected savings anticipated from proposed legislation which was not passed by the General Assembly.

II-4
Pursuant to Public Act No. 16-4 of the May Special Session, which was passed by the General Assembly and signed into law by the Governor, the revised Fiscal Year 2017 budget includes cancellations of $1,000.9 million in general obligation bond authorizations and $358.6 million in new general obligation bond authorizations, resulting in a net decrease of $642.3 million in general obligation bond authorizations to take effect in Fiscal Year 2017. It also includes an increase of $68.6 million in special tax obligation bonds to take effect in Fiscal Year 2017.
The midterm budget adjustments have been reflected in Appendix III-E to this Annual Information Statement but do not include the adjustments made by the Governor’s line-item veto discussed above.
A special session of the General Assembly was held on September 28, 2016 pursuant to which Public Act No. 16-1 of the September 2016 Special Session was passed and signed into law. The Public Act allows the DECD commissioner to enter into an agreement with Lockheed Martin regarding the production of U.S. Navy heavy lift helicopters at Sikorsky, a subsidiary of Lockheed Martin. Lockheed Martin will have the opportunity to earn up to $220 million over the 14 years of the agreement, provided they retain and grow full time employment to over 8,000 employees, nearly double spending with suppliers throughout the State (an increase of over $300 million), and increase capital spending by 22% (approximately $17 million).
STATE DEBT
Page III-44, TABLE 7 is revised as follows:
TABLE 7 Statutory Debt Limit
As of July 1, 2016
Total General Fund Tax Receipts $ 15,519,900,000 Multiplier 1.6 Debt Limit $24,831,840,000 Outstanding Debt(a) $ 13,580,234,060 Guaranteed Debt(b) $ 1,304,915,000 Authorized Debt(c) $ 7,001,581,828 Total Subject to Debt Limit $21,886,730,888 Less Debt Retirement Funds(d) $ 697,347 Aggregate Net Debt $21,886,033,541 Debt Incurring Margin $ 2,945,806,459
______________ (a) See Table 8. Includes accreted value of capital appreciation bonds. Excludes General Obligation Notes
(Economic Recovery Notes 2013 Series A and 2014 Series A), Pension Obligation Bonds, UConn 2000 Bonds, tax increment financings, CRDA Bonds, CHFA Supportive Housing Bonds, CHFA Emergency Mortgage Assistance Program Bonds, CHEFA Child Care Facilities Bonds and lease financings other than the Juvenile Training School.
(b) See OTHER FUNDS, DEBT AND LIABILITIES – Contingent Liability Debt. Includes only guarantees for certain outstanding debt of Southeastern Connecticut Water Authority and UConn 2000 Bonds secured by the State’s debt service commitment.
(c) Includes UConn 2000 Bonds secured by the State’s debt service commitment that are authorized but unissued under the statutory cap for Fiscal Year 2017.
(d) Includes debt service funds available for self-liquidating debt issued to finance facilities at the University of Connecticut and the Connecticut State University System.
SOURCE: State Treasurer’s Office

II-5
Page III-48, TABLE 8 is revised as follows:
TABLE 8 Direct General Obligation Indebtedness(a)
Principal Amount Outstanding as of July 1, 2016 (In Thousands)
General Obligation Bonds $ 13,691,218 Pension Obligation Bonds 2,340,149 UConn 2000 Bonds 1,303,870 Other (b) 292,988
Long Term General Obligation Debt Total $ 17,628,225 Short Term General Obligation Debt Total --
Gross Direct General Obligation Debt $ 17,628,225 Deduct: University Auxiliary Services(c) 697
Net Direct General Obligation Debt $ 17,627,528 ______________ (a) The table does not include refunded bonds for which escrow funds and investments are sufficient to pay all
debt service. The table also does not include limited or contingent liabilities of the State or obligations of the State to towns for participation in the construction and alteration of school buildings. See OTHER FUNDS, DEBT AND LIABILITIES.
(b) “Other” includes lease financings, tax increment financings, CHFA Supportive Housing Bonds and CHFA Emergency Mortgage Assistance Program Bonds. However, it does not include CRDA Bonds or CHEFA Child Care Facilities Bonds. See OTHER FUNDS, DEBT AND LIABILITIES – Other Debt Service and Contractual Commitments.
(c) These bonds are considered self-liquidating; the proceeds of such bonds have been used to build facilities for the State University System and the University of Connecticut. Student fees, other than tuition, for use of such facilities are deposited into enterprise funds and are used for the operation of such facilities and for deposit annually into a debt service fund maintained by the Treasurer for payment of the debt service on such bonds.
SOURCE: State Treasurer’s Office

II-6
Page III-51, TABLE 10 is revised as follows:
TABLE 10 Summary of Principal, Mandatory Sinking Fund Payments,
and Interest on Long-Term Direct General Obligation Debt(a)
As of July 1, 2016 Fiscal Year
Principal Payments(b)
Interest Payments(b)(c)
Total Debt Service
2017 $ 1,387,569,988 $ 772,981,116 $ 2,160,551,104 2018 1,452,877,299 732,149,766 2,185,027,065 2019 1,225,446,471 672,536,827 1,897,983,298 2020 1,169,330,614 621,451,069 1,790,781,683 2021 1,148,436,206 570,989,986 1,719,426,192 2022 1,113,204,111 571,009,198 1,684,213,309 2023 1,146,716,122 531,710,523 1,678,426,645 2024 1,047,119,066 507,272,484 1,554,391,550 2025 990,982,437 462,061,971 1,453,044,407 2026 964,805,000 331,577,858 1,296,382,858 2027 918,060,000 283,945,412 1,202,005,412 2028 890,265,000 236,944,145 1,127,209,145 2029-2036 4,060,850,000 602,926,807 4,663,776,807
Totals $ 17,515,662,314 $ 6,897,557,160 $ 24,413,219,474 ______________ (a) Includes long-term general obligation debt as outlined in Table 8. The future principal payments
($17,515,662,314), plus accreted interest ($111,865,263), total the amount of such long-term debt ($17,627,527,577) as shown in Table 8. See footnotes (b) and (c) for further explanation.
(b) Principal payments include aggregate stated initial values of capital appreciation bonds. Interest payments include the difference between the aggregate stated initial values and the aggregate maturity amounts of capital appreciation bonds. Capital appreciation bonds mature in Fiscal Years 2017 through 2025.
(c) Some of the State’s direct debt pays interest at variable rates. For purposes of this Table 10, the interest on such debt is calculated based on the following assumed average rates:
Year Issued
Amount Issued
Amount Outstanding
Maturities
Interest Rate
2005 $ 300,000,000 $ 100,000,000 2019-2023 3.50% 2005* 20,000,000 20,000,000 2017 5.07 2005* 20,000,000 20,000,000 2020 5.20 2011 337,620,000 129,485,000 2017-2018 3.50 2011 75,000,000 25,000,000 2019 3.50 2012 212,400,000 118,000,000 2017-2020 3.50 2012 219,865,000 144,865,000 2016-2024 3.50 2013 244,570,000 184,570,000 2017-2025 3.50 2013 115,000,000 85,000,000 2016-2020 3.50 2013 314,295,000 233,975,000 2017-2018 3.00 2014 47,000,000 47,000,000 2017-2023 3.50 2014 61,610,000 41,140,000 2017-2018 3.50 2015 200,000,000 200,000,000 2017-2024 3.50 2015 180,745,000 145,275,000 2016-2022 3.50 2016 300,000,000 300,000,000 2019-2034 3.50
Totals $2,648,105,000 $1,794,310,000
______________ * Assumed average interest rate based on interest rate swap agreement(s), including projected basis risk.
SOURCE: State Treasurer’s Office

II-7
Page III-52, TABLE 11 is revised as follows:
TABLE 11
Outstanding Long-Term Direct General Obligation Debt As of June 30
(In Thousands)
Fiscal Year Gross Debt Net Debt
2006 $10,403,634 $10,361,2262007 10,615,810 10,580,3592008 13,102,857 13,068,4392009 14,008,863 13,985,4802010 15,066,507 15,048,8632011 14,680,676 14,667,8292012 14,678,736 14,670,2762013 14,762,696 14,758,1082014 15,819,826 15,817,3092015 16,879,336 16,878,1622016 17,704,949 17,704,252
SOURCE: State Treasurer’s Office

II-8
Page III-53, TABLE 12 is revised as follows:
TABLE 12 Authorized but Unissued Direct General Obligation Debt
As of July 1, 2016 (In Thousands)
State Direct
Debt(a)
Pension Obligation
Bonds(b)
UCONN 2000(c)
Tax
Increment(d)
Total Bond Acts in Effect $37,404,885 $2,276,578 $2,814,577 $ 74,750 $42,570,790 Amount Authorized(e) 33,576,660 2,276,578 2,814,577 74,750 38,742,565 Amount Issued 30,854,278 2,276,578 2,362,177 68,040 35,561,073 Authorized but Unissued 2,722,382 0 452,400 6,710 3,181,492 Available for Authorization 3,828,225 0 0 0 3,828,225 ______________ (a) Includes CHFA Supportive Housing Bonds and CHFA Emergency Mortgage Assistance Program Bonds
and GAAP Deficit Bonds. Excludes CRDA Bonds, CHEFA Child Care Facilities Bonds, General Obligation Notes (Economic Recovery Notes 2013 Series A and 2014 Series A) and lease financings.
(b) The amount available does not include additional amounts which may exceed the cap to finance issuance costs and capitalized interest.
(c) Includes bonds that may be issued under the cap in effect on the date of the table. The amount available for authorization does not include additional amounts which may exceed the cap to finance reserve funds, issuance costs and capitalized interest. The amount issued has been adjusted to reflect increases due to closing costs and decreases due to premiums.
(d) The amount of tax increment bonds authorized is based on the amount authorized by the State Bond Commission, since there is no statutory amount of authorization.
(e) The amount authorized reflects amounts allocated by the State Bond Commission.
SOURCE: State Treasurer’s Office; Office of Policy and Management
Page III-44, Table 7; Page III-48, Table 8; Page III-51, Table 10; Page III-53, Table 12. The following information supplements the information included in such pages and tables as they have been further revised in this Part II:
On August 3, 2016, the State issued $250,000,000 General Obligation Bonds (2016 Series D) maturing in varying amounts between August 15, 2017 and August 15, 2036 and bearing interest at rates ranging from 3.00% per annum to 5.00% per annum and $250,000,000 Taxable General Obligation Bonds (2016 Series A) maturing in varying amounts between August 15, 2017 and August 15, 2026 and bearing interest at rates ranging from 1.00% per annum to 2.60% per annum.

II-9
Page III-54, TABLE 13 is revised as follows:
TABLE 13(a)
Statutory General Obligation Bond Authorizations and Reductions (In Millions of Dollars)
Fiscal Year 2006 2007 2008 2009 2010 2011 2012 2013 2014 2015 2016 2017 New Authorizations 1,290.4 1,388.7 1,965.0 1,564.5 1,195.4 1,147.2 1,724.8 2,673.3 1,993.6 2,843.6 2,391.5 2,661.3 Reductions (41.3) 0.0 (206.9) 0.0 (140.5) (474.6) (10.8) (22.3) (12.0) (27.8) (272.5) (985.7)Net New Authorizations 1,249.1 1,388.7 1,758.1 1,564.5 1,054.9 672.6 1,714.0 2,651.0 1,981.6 2,815.8 2,119.0 1,675.6
______________ (a) Does not include Pension Obligation Bonds, Economic Recovery Notes, lease financings, tax increment or cash flow
borrowings. Does not include GAAP Deficit Bonds authorized in Fiscal Year 2014 in an aggregate principal amount sufficient to generate net proceeds of not more than $750 million. Includes amount for UConn 2000 bonds available under the cap for Fiscal Years 2006 through 2017, as amended, but does not include additional amounts which may exceed the cap to finance reserve funds, issuance costs and capitalized interest. Amounts are listed in the fiscal year that the bond authorizations become effective. Does not include any authorizations which take effect after Fiscal Year 2017. See Table 14.
Page III-55, TABLE 14 is revised as follows:
TABLE 14(a) New Agency Authorizations (Does Not Include Reductions)
(In Thousands)
Fiscal Year 2013 2014 2015 2016 2017
Purpose Governmental Accountability .... $ 0 $ 0 $ 1,000 $ 100 $ 500 Office of Policy and
Management ..........................
198,659
335,330
388,930
348,600 286,700 Secretary of the State .................. 2,000 0 0 0 0 State Comptroller ....................... 7,000 0 57,000 20,000 0 Veterans Affairs ......................... 0 750 2,959 2,145 5,550 Administrative Services(d) .......... 216,500 577,300 530,800 633,500 812,100 Construction Services(d) .............. 635,000 0 0 0 0 Emergency Services and
Public Protection.. .................
17,420
30,000
54,000
3,000 2,000 Motor Vehicles ........................... 0 1,703 1,697 1,420 0 Military ....................................... 5,000 6,150 3,000 4,471 3,108 Consumer Protection .................. 0 0 100 0 0 Health Care Advocate ................ 0 0 1,900 0 0 Agriculture ................................. 10,000 10,500 10,500 0 1,000 Agricultural Experiment
Station ...................................
0
0
1,000
0 11,700 Energy and Environmental
Protection ..............................
171,000
127,900
334,400
137,850 150,075 Labor .......................................... 15,000 5,000 0 5,000 5,000 Economic and Community
Development:(d)
Housing ............................. 147,500 0 0 0 0 Housing Trust Fund .......... 25,000 0 0 0 0 Economic Development .... 355,000 150,000 225,000 190,000 168,921 Other ................................. 24,000 56,500 39,100 2,000 5,000
Department of Housing:(d) Housing ............................. 0 92,000 130,000 135,000 120,000

II-10
Fiscal Year 2013 2014 2015 2016 2017
Housing Trust Fund ........... 0 30,000 30,000 40,000 25,000 Other .................................. 0 0 0 20,000 34,000
Capital Region Economic Development Authority .........
60,000
39,122
33,728
57,000 54,500
Connecticut Innovations, Incorporated ..........................
120,113
94,728
69,690
71,425 31,108
Public Health .............................. 52,000 10,000 50,000 0 5,000 Developmental Services ............. 7,000 5,000 5,000 7,500 0 Mental Health and Addiction
Services .................................
10,000
2,275
9,175
5,000 0 Social Services(d) ....................... 10,000 0 1,000 0 0 Rehabilitation Services ............... 0 0 6,000 0 0 Education ................................... 107,645 62,250 98,400 51,000 15,750 Early Childhood ......................... 0 0 15,000 0 0 State Library ............................... 0 5,000 7,200 8,600 5,000 Board of Regents for Higher
Education ..............................
76,723
24,990
98,600
100,800 76,522 Correction ................................... 0 10,000 10,000 - 73,000 Children and Families ................ 7,285 1,231 1,515 3,828 2,073 Judicial ....................................... 11,000 11,500 30,000 28,400 7,500 CPTV ......................................... 0 0 3,300 0 0 Legislative Management ............ 0 0 8,122 1,799 345 UConn ........................................ 154,500 0 0 0 0 UConn 2000(b) ............................ 143,000 204,400 315,500 312,100 240,400 Transportation ............................ 25,000 5,000 95,000 82,500 60,000 Connecticut Port Authority ........ 0 0 0 0 13,500 CSUS 2020(c) .............................. 95,000 95,000 175,000 118,500 40,000 Totals ......................................... $2,708,345 $1,993,629 $2,843,616 $2,391,538 $2,255,352
______________ (a) Does not include authorizations that take effect after Fiscal Year 2017. Does not include Pension Obligation
Bonds, Economic Recovery Notes, tax increment or cash flow borrowings, CHFA Supportive Housing Bonds and CHFA Emergency Mortgage Assistance Program Bonds, CHEFA Child Care Facilities Bonds, GAAP Deficit Bonds or lease financings. Totals may not match TABLE 13 (New Authorizations) due to authorizations having been approved in the first year of the biennium, but cancelled prior to the start of the second fiscal year of the biennium.
(b) To be issued by University of Connecticut based on cap for the year indicated prior to actual bond issuance. Does not include additional amounts that may exceed cap to finance reserve funds, issuance costs and capitalized interest.
(c) The Connecticut State University Infrastructure Act authorizes $95 million per year from Fiscal Year 2009 through Fiscal Year 2018.
(d) During the 2013 session of the General Assembly various agency consolidations and realignments were enacted as follows: The Department of Construction Services was consolidated into the Department of Administrative Services. The Department of Housing was created and assumed the housing duties of the Department of Economic and Community Development, the Office of Policy and Management and the Department of Social Services.
SOURCE: Office of Policy and Management

II-11
OTHER FUNDS, DEBT AND LIABILITIES
Page III-58, TABLE 15 is revised as follows:
TABLE 15 Special Tax Obligation Bonds
As of July 1, 2016 (In Millions)
New Money Refundings(a) Total Bond Acts in Effect $ 14,704.2 N/A $ 14,704.2 Amount Authorized(b) 13,144.6 N/A 13,144.6 Amount Issued 9,920.2 $ 4,158.6 14,078.8 Authorized but Unissued 4,784.0 N/A 4,784.0 Available for Authorization 3,224.5 N/A 3,224.5 Amount Outstanding 3,637.2 855.1 4,492.3
______________ (a) Refunding Bonds do not require legislative approval. (b) The Amount Authorized reflects amounts allocated by the State Bond Commission.
SOURCE: State Treasurer’s Office
Page III-58, Table 15. The following information supplements the information included in such pages and table as it has been further revised in this Part II:
On September 28, 2016, the State issued $800,000,000 Special Tax Obligation Bonds Transportation Infrastructure Purposes, 2016 Series A maturing in varying amounts between September 1, 2017 and September 1, 2036 and bearing interest at rates ranging from 3.00% per annum to 5.00% per annum and $68,265,000 Special Tax Obligation Refunding Bonds Transportation Infrastructure Purposes, 2016 Series B maturing in varying amounts between September 1, 2019 and September 1, 2028 and bearing interest at rates ranging from 2.00% per annum to 5.00% per annum.
Page III-65, TABLE 16 is updated with the following information.
On June 30, 2016 Connecticut Higher Education Supplemental Loan Authority issued $15,000,000 State Supported Revenue Bonds (CHESLA Loan Program), 2016 Series A to fund education loans and certain funds and accounts supported by the special capital reserve fund.
As of July 15, 2016, the Connecticut Housing Finance Authority had $3,575.4 million outstanding debt secured by the special capital reserve fund under the Housing Mortgage Finance Program. Since February 15, 2016, the Connecticut Housing Finance Authority has issued an additional net $202.1 million bonds under the Housing Mortgage Finance Program supported by the special capital reserve fund which amount accounts for bonds supported by the special capital reserve fund which have been issued, defeased and paid off since that date.
On September 13, 2016, the State of Connecticut Health and Educational Facilities Authority issued $55,030,000 Revenue Bonds, Connecticut State University System Issue, Series P-1 maturing in varying amounts between November 1, 2017 and November 1, 2036 and bearing interest at rates ranging from 2.50% per annum to 5.00% per annum for various projects and $19,530,000 Revenue Refunding Bonds, Connecticut State University System Issue, Series P-2 maturing in varying amounts

II-12
between November 1, 2017 and November 1, 2035 and bearing interest at rates ranging from 2.50% per annum to 4.00% per annum supported by the special capital reserve fund.
PENSION AND RETIREMENT SYSTEMS
Page III-68. The following information supplements the information contained under the headings State Employees’ Retirement Fund and Teachers’ Retirement Fund:
The State expects to receive the biennial actuarial valuation reports as of June 30, 2016, with respect to both the State Employees’ Retirement Fund and the Teachers’ Retirement Fund in late October or November 2016. Such reports will calculate the actuarial value of assets, actuarial accrued liability, UAAL, funded ratio and ARC for Fiscal Years 2018 and 2019 for each fund. The reports will reflect actual experience compared to assumptions during the last two years as well as the impact of any revised assumptions.
It is anticipated that the actuarial value of assets, actuarial accrued liability, UAAL, funded ratio, and ARC will change and such changes may be material. There are many factors and assumptions used to make such calculations. One such factor is the actual investment returns of each fund as compared to the investment return assumptions. Investment return experience as of June 30, 2016, is further described below. Given that the recent actual investment return experience has been less than the assumed rate of return, all other things being equal, this factor would have the effect of increasing the UAAL and causing a corresponding decrease in the funded ratio of each fund. However, other factors could affect these results and the State’s full funding of the ARCs each year as well as the State’s use of actuarial smoothing of investment returns over five and four years respectively for the two plans, could mitigate the impact of recent lower than assumed investment returns on these actuarial valuations.
Page III-69. The following information supplements the last paragraph on Page III-69 under the heading Pension System -- Overview:
The Task Force, working with the plan actuaries, met and reviewed several scenarios and strategies for SERS. Implementation of certain changes requires the approval of SEBAC. OPM selected the following scenario for discussion with SEBAC and OPM’s Office of Labor Relations is currently in active discussions with SEBAC regarding the specific parameters that will be used for the June 30, 2016 valuation, which will be produced in November. The scenario being discussed with SEBAC is:
• Continuing to pre-fund all liabilities on an actuarial basis • Reducing the assumed investment rate of return from 8% to 7% • Transitioning from level percent of payroll to a level dollar amortization for unfunded liabilities • Transitioning the actuarial cost method from Projected Unit Credit to Entry Age Normal • Maintaining the original 40 year amortization schedule for the current unfunded liability attributable to Tier I employees and amortizing the remaining unfunded liability over a new period yet to be determined • Amortizing future gains or losses over a new fixed period
The effect of these changes would be to slightly increase the State’s ARC payment in the short term and extend the amortization of the UAAL. In addition, these changes would also have the effect of leveling out future ARC contributions at a more stable level while reducing the risk of relatively high contributions in the final years of the original fixed amortization period.

II-13
No specific recommendations with respect to TRS have been made by either the Task Force or OPM at this time.
Page III-71. The following information supplements the information contained under the heading State Employees’ Retirement Fund:
As of June 30, 2016, the market value of the State Employees’ Retirement Fund’s investment assets was $10,586.9 million, including cash in custody and certain receivables, as compared to $10,668.4 million as of June 30, 2015. The market value of the fund’s investment assets is continually subject to change based on a variety of factors, including changes in the financial and credit markets and general economic conditions.
While it was anticipated that the adopted budget for Fiscal Years 2016 and 2017 contained appropriations sufficient, together with anticipated grant reimbursement from federal and other funds to fully fund the employer contribution requirement, a preliminary analysis of Fiscal Year 2016 year-end results shows that the State will contribute approximately 99.2 percent of the employer contribution requirement for the State Employees’ Retirement Fund. Federal and other fund recoveries were approximately $12.6 million less than the budgeted target for such amounts. These are preliminary unaudited results which may result in changes in the final result.
Page III-81. The following information supplements the information contained under the heading Teachers’ Retirement Fund:
As of June 30, 2016, the market value of the Teachers’ Retirement Fund’s investment assets was $15,515.7 million, as compared to $16,110.4 million as of June 30, 2015. The market value of the fund’s investment assets is continually subject to change based on a variety of factors, including changes in the financial and credit markets and general economic conditions.
Page III-88. The following information updates the information under the caption Investment Returns under the heading Investment and Pension Funds:
Investment Returns
Annualized Net Returns on Investment Assets in Retirement Funds
Periods Ending June 30, 2016
5 Year 10 Year 15 Year 20 Year 25 Year State Employees’ 5.74% 5.14% 5.43% 6.78% 7.47% Teachers’ 5.71% 5.25% 5.54% 6.90% 7.56%

II-14
Page III-89. The following information supplements the information contained under the caption Other Post-Employment Benefits – State Employees under the heading Social Security and Other Post-Employment Benefits:
The State received an actuarial report dated August 24, 2016 (“2016 OPEB Report”) with respect to the State’s liability for post-retirement health care benefits (which include medical, prescription drug, dental and life insurance benefits) for eligible persons covered under SERS and other State retirement systems, excluding the Teachers’ Retirement System from The Segal Company which indicated the following as of June 30, 2015:
Actuarial Accrued Liability $19,119.6 million
UAAL $18,889.9 million
Actuarial Value of Assets $229.6 million Based on Market Value at June 30, 2015.
Funded Ratio 1.20%
Annual Required Contribution
$1,443.7 million (Fiscal Year 2016) (comprised of normal cost of $364.4 million, amortization of UAAL of $1,036.8 million, and adjustment for timing of $42.5 million)
Based on a projected unit credit actuarial cost method and level percent-of-payroll amortization over 30 years (with 22 years remaining as of June 30, 2015).
Annual OPEB Cost $1,435.6 million (Fiscal Year 2016) The annual OPEB cost adjusts the annual required contribution and contribution in relation to the annual required contribution. The annual OPEB cost is the cost of OPEB actually booked as an expense for the fiscal year.
In Fiscal Year 2015, the State contributed 36.10% of the Annual Required Contribution and 35.43% of the Annual OPEB Cost.
The 2016 OPEB Report includes the following assumptions, among others:
• A discount rate of 5.7% • Payroll growth rate of 3.75% • Medical cost trend rate of 5.0% • Drug cost trend rate of 10.0% graded to 5.0% over 5 years • Dental and Medicare Part B trend rates of 5.0% • Projected salary increases of 3.25% to 20.0% • Updated medical, prescription drug and dental claim costs for recent experience and adjusting trend rates for medical and prescription drug • Explicit administrative expense of $250 per participant through June 30, 2018 and increasing at 3% per year thereafter • Average contribution of $174 was used for plans requiring contributions in the valuation year. An average contribution of $356 was used in the valuation year for dental benefits.

II-15
Average premium used to calculate the early retirement premiums was updated to $14,271 • Adjustment of the retiree contribution increase • Adjustment of the assumption for Medicare Part B • Includes certain plan changes made pursuant to revised agreements with SEBAC
LITIGATION
Page III-95. The last sentence is replaced with the following sentences under the caption Sheff v. O’Neill:
The parties entered into a stipulation extending current efforts through June 30, 2017 and which included a commitment to mediation which may provide the opportunity to negotiate a long term resolution of this litigation. The parties continue mediation efforts.
Page III-95. The following information supplements the information contained under the caption State Employees Bargaining Agent Coalition (“SEBAC”) v. Rowland:
The parties are in the process of calculating economic damages for each class member who sustained damages as a result of the layoffs.
Page III-96. The following information supplements the information contained under the caption Connecticut Coalition for Justice in Education Funding et al. v. Rell, et al.:
On September 7, 2016, the court issued a decision in part for the plaintiffs, and in part for the defendants. The court ruled that the overall amount spent by the State on education was more than the amount constitutionally required, and that the court could not dictate the amount of education spending. It ruled, however, that the State must propose a plan to distribute its education funding in the future according to a more rational and consistent system. It also required the State to propose plans to change certain policies relating to elementary school completion, high school graduation, teachers' compensation and evaluations, and special education. The court did not order any increase in spending on any aspect of education. On September 15, 2016, the State applied to the Chief Justice for certification to appeal the trial court's judgment. On September 20, 2016, the Chief Justice granted the application for certification to appeal and also granted the plaintiffs’ request to review issues decided adversely to the plaintiffs. In addition, the Supreme Court stayed the trial court's order. An appeal was filed on September 23, 2016.
Page III-96. The following information supplements the information contained under the caption American Indian Tribes:
The Historical Eastern Pequot Tribe has filed a petition with the federal Bureau of Indian Affairs seeking to be acknowledged as a federal American Indian Tribe.
In October, 2016, the Schaghticoke Tribal Nation initiated a lawsuit against the State and the Commissioner of Energy and Environmental Protection seeking approximately $610.5 million for the alleged unconstitutional taking of reservation lands in the nineteenth and early twentieth centuries. The suit alleges that from 1801 to 1918, state-appointed overseers sold portions of the Schaghticoke reservation and used the proceeds of those sales to lend monies to State residents in the form of mortgages and loans and not for the benefit of the Schaghticoke. It alleges that these actions were in violation of the federal and state constitutional prohibitions against taking property without just compensation and in breach of the State’s fiduciary duties. It seeks money damages and declaratory and injunctive relief to account for the funds allegedly due and to make the Schaghticoke whole. The matter is pending in state superior court.

II-16
Page III-96. The following information supplements the information contained under the caption Bouchard v. State Employees Retirement Commission:
On September 2, 2016, the Supreme Court transferred this matter to itself pursuant to Connecticut Practice Book Section 65-1.
Page III-97. The following information is added under the heading LITIGATION:
Martinez v. Malloy is a federal district court suit brought in August of 2016 in which several students, and their parents or legal guardians, from the Hartford and Bridgeport school districts brought suit asserting federal constitutional claims. They allege that they are not receiving a minimally adequate education in the traditional public schools that they attend, in violation of the Due Process Clause and the Equal Protection Clause of the U.S. Constitution. In particular, they allege that the State's failure to provide a minimally adequate education is the result of various statutes ("the Alternative Choice Statutes") and educational policies that limit the number of students who may attend charter and magnet schools or who may participate in the Open Choice program, which permits certain urban students to attend school in nearby suburban towns. By way of relief, plaintiffs ask the Court to declare the Alternative Choice Statutes unconstitutional and to enjoin their enforcement.
Page III-97. The following information is added under the heading LITIGATION:
D.J. v. Conn. State Board of Ed is a recently filed case in federal district court. D.J. is a case brought by a special education student and a purported class of similarly situated special education students. Plaintiffs allege that state law violates the Individuals with Disabilities in Education Act (IDEA) by terminating the obligation of local school districts to provide special education at the end of the school year in which a special education student turns 21. Plaintiffs' allegations are premised on the fact that Connecticut provides education services to non-special education students beyond the age of 21 and that such a distinction is not permitted under the IDEA. Plaintiffs seek a declaration that Connecticut violates the IDEA by limiting public schools' obligation to provide education services to all special education students before the end of the school year of their 22nd birthday. The plaintiffs further seek compensatory education for the class which is made up of all special education students deprived of special education services after reaching the of age 21 for the two years before the action was filed and during the pendency of the case. If plaintiffs are successful, the State could be ordered to ensure the provision of a one year extension of current duration of services for all special education students.
APPENDIX III-A
Page III-A-7. The following information supplements the information included in TABLE A-4:
With the exception of the State Police bargaining unit, all collective bargaining contracts expired on June 30, 2016. The State and the remaining bargaining units are currently in active negotiations to establish successor contracts, with one unit in the early stages of binding arbitration. Notwithstanding, the parties continue to negotiate and resolve open issues. The State is in mediation with one bargaining unit. Following expiration of the contracts, the State engaged in negotiations regarding extension agreements in order to clarify the terms to be extended in the absence of successor agreements. Unused funds for negotiated items such as tuition reimbursement, conferences and professional development were carried over for use, but with no additional funding. While many terms were extended, negotiations continue on proposals notwithstanding the status quo. The agreements reflect that the parties maintain their respective contrary positions with respect to whether protection against layoff in the event of subcontracting ends upon expiration of the contract.
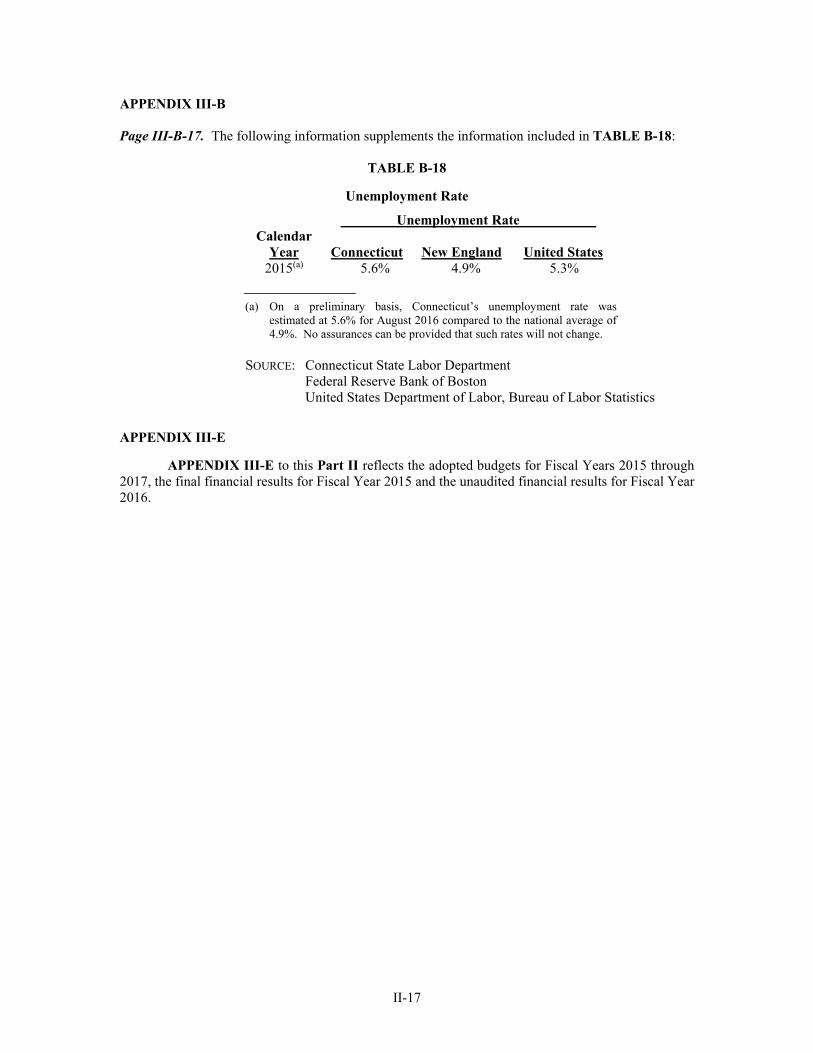
II-17
APPENDIX III-B
Page III-B-17. The following information supplements the information included in TABLE B-18:
TABLE B-18
Unemployment Rate Unemployment Rate Calendar
Year
Connecticut
New England
United States 2015(a) 5.6% 4.9% 5.3%
______________ (a) On a preliminary basis, Connecticut’s unemployment rate was
estimated at 5.6% for August 2016 compared to the national average of 4.9%. No assurances can be provided that such rates will not change.
SOURCE: Connecticut State Labor Department Federal Reserve Bank of Boston United States Department of Labor, Bureau of Labor Statistics
APPENDIX III-E
APPENDIX III-E to this Part II reflects the adopted budgets for Fiscal Years 2015 through 2017, the final financial results for Fiscal Year 2015 and the unaudited financial results for Fiscal Year 2016.

II-18
APPENDIX III-E GENERAL FUND REVENUES AND EXPENDITURES
REVISED ADOPTED BUDGET AND FINAL FINANCIAL RESULTS FOR FISCAL YEAR 2015 ADOPTED AND UNAUDITED RESULTS FOR FISCAL YEAR 2016
REVISED ADOPTED BUDGET FOR FISCAL YEAR 2017 (In Millions)
Revised Adopted Budget
Fiscal Year 2015(d)
Financial Results
Fiscal Year 2015(f)
Adopted Budget
Fiscal Year 2016(h)
Unaudited Results
Fiscal Year 2016(i)
Revised Adopted Budget
Fiscal Year 2017(j)
Revenues Taxes Personal Income Tax $ 9,264.5 $ 9,151.0 $9,834.4 $ 9,181.6 $ 9,519.0 Sales & Use 4,167.4 4,205.1 4,121.1 4,181.9 4,328.7 Corporation 704.3 814.8 902.2 880.4 839.3 Public Service 295.6 276.8 308.0 289.9 283.9 Inheritance & Estate 173.0 176.8 173.4 221.8 174.6 Insurance Companies 256.2 220.6 243.8 238.8 245.4 Cigarettes 360.9 358.7 361.2 373.5 371.1 Real Estate Conveyance 186.9 186.0 194.7 196.5 201.8 Oil Companies(a) 34.8 -- -- 0.2 -- Alcoholic Beverages 60.7 61.7 61.7 63.1 62.2 Admissions and Dues 38.3 38.4 38.3 39.3 39.0 Health Provider Tax 509.5 454.9 676.9 701.7 683.4 Miscellaneous 95.2(g) 19.1 20.8 17.0 20.1 Total Taxes $16,147.2 $15,963.9 $16,936.5 $16,386.0 $16,768.5 Less Refunds of Taxes (1,105.1) (1,064.0) (1,090.4) (1,120.2) (1,106.5) Less Earned Income Tax (120.7) (99.6 ) (127.4) (103.0) (133.6) Less R&D Credit Exchange (6.8) (7.9) (7.1) (7.6) (8.5) Net Taxes $14,914.6 $14,792.4 $15,711.6 $15,155.2 $15,519.9 Other Revenues Transfers- Special Revenues $ 323.1 $ 323.3 $ 343.4 $ 340.0 $ 355.5 Indian Gaming Payments 278.5 268.0 258.8 265.9 267.0 Licenses, Permits, Fees 256.2 257.4 308.5 296.5 269.2 Sales of Commodities &
Services 43.5 35.8
38.0 43.5 42.6 Rents, Fines & Escheats 118.4 168.7 126.0 141.7 128.0 Investment Income 0.6 0.9 2.5 0.9 3.8 Miscellaneous 161.9 185.0 171.3 179.8 219.0 Less Refunds of Payments (72.9) (64.3) (74.2) (60.3) (66.1) Total Other Revenue $ 1,109.3 $ 1,174.8 $ 1,174.3 $ 1,208.0 $ 1,219.0 Other Sources Federal Grants $ 1,299.6 $ 1,241.2 $ 1,265.2 $ 1,301.5 $ 1,257.6 Transfers to the Resources of
the General Fund -- 38.0
-- -- -- Transfers from Tobacco
Settlement Funds 120.0 97.4
106.6 110.6 108.5 Transfers to the Resources of
STF(a) -- --
-- -- -- Transfers to Other Funds(b) 14.6 (61.8) (95.4) 5.6 (218.3) GAAP Conversion Bond
proceeds -- --
--
-- -- Total Other Sources $ 1,434.1 $ 1,314.8 $ 1,276.5 $ 1,417.7 $ 1,147.8 Total Budgeted Revenue(c) $17,458.0 $17,282.0 $18,162.4 $17,780.8 $17,886.7

II-19
Revised Adopted Budget
Fiscal Year 2015(d)
Financial Results
Fiscal Year 2015(f)
Adopted Budget
Fiscal Year 2016(h)
Unaudited Results
Fiscal Year 2016(i)
Revised Adopted Budget
Fiscal Year 2017(j)
Appropriations/ Expenditures
Legislative $ 86.7 $ 74.5
$ 83.9 $ 73.3 $ 74.1 General Government 680.0 661.9 670.0 623.5 602.2 Regulation & Protection 276.6 287.8 301.0 288.0 278.8 Conservation &
Development 216.3 204.2
211.3 192.4 194.8 Health & Hospitals 1,802.7 1,784.9 1,817.4 1,765.8 1,217.0 Human Services 3,026.9 3,076.6 3,196.2 3,133.0 3,708.8 Education, Libraries &
Museums 5,075.3 5,029.8
5,166.4 5,116.5 5,067.8 Corrections 1,493.1 1,477.1 1,514.8 1,462.8 1,417.9 Judicial 601.9 593.7 625.4 597.2 593.9 Non- Functional Debt Service 1,784.2(e) 1,691.5(e) 1,937.6(e) 1,967.7(e) 2,063.1(e) Miscellaneous 2,546.2 2,516.8 2,838.1 2,732.6 2,857.4 Subtotal $ 17,589.8 $17,398.7 $18,362.1 $17,952.9 $ 18,075.8 Other Reductions and Lapses (132.1) -- (200.6) -- (189.3) Net Appropriations/
Expenditures $ 17,457.7 $17,398.7
$ 18,161.6 $17,952.9 $17,886.4 Surplus (or Deficit) from
Operations 0.3 (116.7)
0.8 (172.0) 0.2 Miscellaneous Adjustments -- 3.5 -- 1.6 -- Reserve for Future Fiscal
Years -- --
-- -- -- Reserve for GAAP
Conversions -- --
-- -- -- Reserve from Reserved Fund
Balance -- --
-- --
-- Balance(c) $ 0.3 $ (113.2) $ 0.8 $ (170.4) $ 0.2 ___________ NOTE: Columns may not add due to rounding.
(a) Per subsection 91 of Public Act No. 15-244, beginning in Fiscal Year 2016, all revenue from the oil companies tax will be deposited to the Special Transportation Fund.
(b) Includes transfers to the Mashantucket Pequot Fund for grants to towns. The amounts for Fiscal Years 2015 through 2016 include transfers of $61.8 million in each year to the Mashantucket Pequot Fund for grants to towns. In Fiscal Year 2017 this amount was reduced to $58.1 million. The transfers for Fiscal Year 2015 include $30.0 million from the Fiscal Year 2013 surplus.
(c) Does not include revenues or expenditures with respect to Restricted Accounts and Federal & Other Grants, which are not included in this Appendix. The amount of such expenditures is generally the same as the amount of grants received. Per Section 4-30a of the Connecticut General Statutes, after the accounts for the General Fund have been closed for each fiscal year and the Comptroller has determined the amount of unappropriated surplus in said fund, after any amounts required by provision of law to be transferred for other purposes have been deducted, the amount of such surplus shall be transferred by the State Treasurer to the Budget Reserve Fund.
(d) Per Public Act No. 14-47 and Public Act No. 14-217 and Public Act No. 15-244. (e) Sections 90 and 91 of Public Act No. 13-184 extend the maturity of the 2009 Economic Recovery Notes from
Fiscal Year 2016 to Fiscal Year 2018. (f) Per the Comptroller’s audited financial results for Fiscal Year 2015 as adjusted by the Office of Policy and
Management to exclude expenditures of appropriations carried over from the prior fiscal year and to include expenditures of appropriations carried into the next fiscal year.
(g) The adopted budget for Fiscal Year 2015 included $75 million from a Department of Revenue Services enhanced Tax Collections Initiative.

II-20
(h) Per Public Act No. 15-244, as amended by various implementer legislation and as amended by Public Act No. 15-05 of the June Special Session. These amounts do not include updates to revenues and expenditures made at the December 8, 2015 Special Session of the General Assembly which provided for (i) $137.5 million in additional revenue in Fiscal Year 2016 and a reduction of $17.5 million in revenue in Fiscal Year 2017 and (ii) a reduction in appropriated expenditures by $195.8 million in both Fiscal Years 2016 and 2017.
(i) Per the Comptroller’s unaudited financial results dated September 30, 2015 for Fiscal Year 2016 as adjusted by the Office of Policy and Management to exclude expenditures of appropriations carried over from the prior fiscal year and to include expenditures of appropriations carried into the next fiscal year.
(j) Per Public Act No. 16-2 of the May Special Session, as amended and Public Act No. 16-3 of the May Special Session, as amended. Such amounts do not reflect the Governor’s line-item veto of $22.5 million in appropriations.
NOTE: The information in Appendix III-E of this Part II contains projections and no assurances can be given that subsequent projections or adjustments will not result in changes in the items of revenue and expenditure and in the final result of the operations of the General Fund. Changes may also occur as the result of legislative action adjusting the budget or taking other actions which impact revenues or expenditures.

III-1
PART III ANNUAL INFORMATION STATEMENT
STATE OF CONNECTICUT
FEBRUARY 24, 2016
This Annual Information Statement of the State of Connecticut (the “State”) contains information through February 24, 2016. For information about the State after February 24, 2016, the State expects to update this Annual Information Statement from time to time. This Annual Information Statement and any appendices attached hereto, should be read collectively and in their entirety.
This Annual Information Statement contains the State’s June 30, 2015 audited financial statements prepared using the guidance of Generally Accepted Accounting Principles (“GAAP”) as prescribed by the Governmental Accounting Standards Board and June 30, 2015 audited legal accounting basis financial statements. The State expects generally to update certain information contained in this Annual Information Statement from time to time. Such updates are expected to include certain interim financial information prepared on a statutory basis, but are not expected to include interim financial information prepared in accordance with GAAP.
The State’s fiscal year begins on July 1 and ends on June 30. References to “Fiscal Year” throughout this Annual Information Statement refer to the referenced fiscal year ending June 30. For example, Fiscal Year 2015 refers to the fiscal year beginning July 1, 2014 and ending June 30, 2015.
This Annual Information Statement may be obtained electronically, by contacting the Office of the State Treasurer, Attn.: Assistant Treasurer for Debt Management, 55 Elm Street, Hartford, Connecticut 06106, (860) 702-3288.
Constitutional Elected Officers Governor * Dannel P. Malloy
Lieutenant Governor Nancy S. Wyman
Secretary of the State Denise W. Merrill
Treasurer * Denise L. Nappier
Comptroller * Kevin P. Lembo
Attorney General * George C. Jepsen
Executive Branch Officers Secretary of the Office of Policy and Management * Benjamin Barnes
Commissioner of Administrative Services * Melody A. Currey
Commissioner of Transportation James P. Redeker
Legislative Branch Officers President Pro Tempore of the Senate Sen. Martin M. Looney
Speaker of the House of Representatives Rep. J. Brendan Sharkey
Co-chairpersons of the Joint Standing Committee on Finance, Revenue and Bonding *
Sen. John W. Fonfara Rep. Jeffrey J. Berger
Ranking Minority Members of the Joint Standing Committee on Finance, Revenue and Bonding *
Sen. L. Scott Frantz Rep. Christopher Davis
Auditors of Public Accounts John C. Geragosian Robert M. Ward
______________ * Denotes member of the State Bond Commission

III-2
PART III
FEBRUARY 24, 2016
ANNUAL INFORMATION STATEMENT OF THE STATE OF CONNECTICUT
TABLE OF CONTENTS
Introduction ...........................................................................................................................................III-8 Forward-Looking Information and Bondholder Considerations ............................................................III-9 The State of Connecticut .................................................................................................................... III-10 Governmental Organization and Services .................................................................................... III-10 State Economy .............................................................................................................................. III-10 Financial Procedures .......................................................................................................................... III-11 The Budgetary Process ................................................................................................................. III-12 Balanced Budget Requirement .......................................................................................... III-12 Biennium Budget ............................................................................................................... III-12 Budget Document .............................................................................................................. III-13 Preparation of the Budget .................................................................................................. III-13 Adoption of the Budget ..................................................................................................... III-13 Line Item Veto .................................................................................................................. III-13 Consensus Revenue Estimates .......................................................................................... III-13 Fiscal Accountability Report ............................................................................................. III-13 Financial Controls ......................................................................................................................... III-14 Expenditures ...................................................................................................................... III-14 Governor’s Role in Expenditure Control .............................................................. III-14 Comptroller’s Role in Expenditure Control .......................................................... III-14 Treasurer’s Role in Expenditure Control .............................................................. III-15 Use of Appropriations ....................................................................................................... III-15 Unexpended Appropriations ............................................................................................. III-15 Unappropriated Surplus – Budget Reserve Fund.............................................................. III-15 Revenues ........................................................................................................................... III-15 Accounting Procedures ..................................................................................................... III-16 Books and Records ................................................................................................ III-16 Financial Reporting ............................................................................................... III-16 Transition to GAAP ............................................................................................... III-17 Investment and Cash Management ............................................................................................... III-19 Cash Management ............................................................................................................. III-19 Short-Term Investment Fund ............................................................................................ III-19 Other Funds ....................................................................................................................... III-19 Investment and Payment of Bond Proceeds ...................................................................... III-20 Investment Advisory Council ........................................................................................... III-20 Investment of Pension Funds ............................................................................................ III-20 State General Fund............................................................................................................................. III-21 General Fund Revenues ................................................................................................................ III-21 Forecasted, Adopted and Historical Revenues ................................................................. III-21 Procedure for Forecasting Revenues ..................................................................... III-21 Fiscal Year 2016 and 2017 Adopted Revenues ..................................................... III-21 Historical General Fund Revenues ........................................................................ III-23 Components of Revenue ................................................................................................... III-24 Personal Income Tax ............................................................................................. III-24 Sales and Use Taxes .............................................................................................. III-24 Corporation Business Taxes .................................................................................. III-24 Other Taxes ............................................................................................................ III-25 Federal Grants ........................................................................................................ III-25

III-3
Other Non-Tax Revenues ...................................................................................... III-26 General Fund Expenditures .......................................................................................................... III-26 Appropriated and Historical Expenditures ........................................................................ III-26 Fiscal Year 2016 and 2017 Appropriated Expenditures ....................................... III-26 Historical General Fund Expenditures .................................................................. III-28 Components of Expenditures ............................................................................................ III-29 Human Services ..................................................................................................... III-29 Education, Libraries and Museums ....................................................................... III-29 Non-Functional ...................................................................................................... III-29 Health and Hospitals .............................................................................................. III-29 Corrections ............................................................................................................. III-29 General Government .............................................................................................. III-29 Judicial ................................................................................................................... III-29 Regulation and Protection ..................................................................................... III-29 Conservation and Development............................................................................. III-29 Legislative .............................................................................................................. III-29 Expenditures by Type........................................................................................................ III-30 Fiscal Year 2015 Operations ........................................................................................................ III-32 Adopted Biennium Budget for Fiscal Years 2016 and 2017........................................................ III-33 Fiscal Year 2016 Operations ........................................................................................................ III-34
Forecasted Operation .................................................................................................................... III-34 Consensus Revenue Estimates .......................................................................................... III-34 Fiscal Accountability Report ............................................................................................. III-35 Governor’s Midterm Budget Revisions for Fiscal Year 2017 ..................................................... III-35 State Economic Initiatives ............................................................................................................ III-36 First Five ............................................................................................................................ III-36 Bioscience Connecticut ..................................................................................................... III-37 Bioscience Innovation Fund .............................................................................................. III-37 Economic and Manufacturing Assistance Act .................................................................. III-37 Small Business Assistance Revolving Loan Program ...................................................... III-37 Small Business Express Program ...................................................................................... III-37 Subsidized Training and Employment Program ............................................................... III-37 Business Tax Credits ......................................................................................................... III-38 General Fund Budget History ....................................................................................................... III-38 State Debt ............................................................................................................................................ III-42 Constitutional Provisions .............................................................................................................. III-42 Types of State Debt....................................................................................................................... III-42 State Direct General Obligation Debt ........................................................................................... III-42 Statutory Authorization and Security Provisions .............................................................. III-42 Statutory Debt Limit .......................................................................................................... III-42 State Bond Commission .................................................................................................... III-44 Types of Direct General Obligation Debt..................................................................................... III-44 General Obligation Bonds ................................................................................................. III-44 Teachers’ Retirement Fund Pension Obligation Bonds .................................................... III-45 UConn 2000 Financing Program ...................................................................................... III-45 Lease Financing ................................................................................................................. III-46 Tax Increment Financing .................................................................................................. III-46 Supportive Housing Financing .......................................................................................... III-46 Emergency Mortgage Assistance Program ....................................................................... III-46 Economic Recovery Notes ................................................................................................ III-46 Certain Short-Term Borrowings ....................................................................................... III-47 Forms of Debt .................................................................................................................... III-47 Derivatives ......................................................................................................................... III-47

III-4
Debt Statement .................................................................................................................. III-48 Debt Ratios ........................................................................................................................ III-49 Aggregate State and Local Debt ................................................................................................... III-49 Debt Service Schedule ...................................................................................................... III-50 Outstanding Long-Term Direct General Obligation Debt ................................................ III-52 Future Issuance of Direct General Obligation Debt ..................................................................... III-52 Authorized But Unissued Direct General Obligation Debt .............................................. III-52 Bond Authorizations and Reductions ............................................................................... III-53 Purposes of Recent Bond Authorizations ......................................................................... III-55 Other Funds, Debt and Liabilities .................................................................................................... III-57 Special Transportation Fund and Debt ......................................................................................... III-57 Other Special Revenue Funds and Debt ....................................................................................... III-59 Bradley International Airport ............................................................................................ III-59 Clean Water Fund .............................................................................................................. III-59 Unemployment Compensation .......................................................................................... III-60 Second Injury Fund ........................................................................................................... III-60 Contingent Liability Debt ............................................................................................................. III-60 Special Capital Reserve Funds .......................................................................................... III-60 Quasi-Public Agencies ...................................................................................................... III-61 Connecticut Airport Authority ............................................................................... III-61 The Connecticut Green Bank ................................................................................ III-61 Connecticut Health and Educational Facilities Authority ..................................... III-61 Connecticut Higher Education Supplemental Loan Authority ............................. III-62 Connecticut Housing Finance Authority ............................................................... III-62 Connecticut Innovations ........................................................................................ III-63 Capital Region Development Authority ................................................................ III-63 Materials Innovation and Recycling Authority ..................................................... III-63 UConn 2000 Special Obligation Financing ........................................................... III-64 Assistance to Municipalities ............................................................................................. III-64 Southeastern Connecticut Water Authority ........................................................... III-64 State Treasurer’s Role ....................................................................................................... III-64 Outstanding Special Capital Reserve Fund Debt .............................................................. III-65 Other Debt Service and Contractual Commitments ..................................................................... III-66 CHEFA Child Care Program ............................................................................................ III-66 Capital Region Development Authority ........................................................................... III-66 School Construction Grant Commitments ........................................................................ III-66 Connecticut Lottery Corporation ...................................................................................... III-67 Pension and Retirement Systems ...................................................................................................... III-68 Pension Systems -- Overview ....................................................................................................... III-68 Actuarial Valuations ..................................................................................................................... III-70 State Employees’ Retirement Fund .............................................................................................. III-71 November 2014 Actuarial Valuations and the Fiscal Year 2016 and 2017 Annual Required Contributions ............................................................................. III-71 Modeling of Future Funded Ratios and Annual Contributions through Fiscal Year 2046 .................................................................................................... III-75 Contribution, Eligibility and Benefits Requirements ....................................................... III-77 GASB 67 Disclosure ......................................................................................................... III-80 Teachers’ Retirement Fund ........................................................................................................... III-81 October 2014 Actuarial Valuation .................................................................................... III-81 October 2015 Experience Study........................................................................................ III-84 Pension Obligation Bonds ................................................................................................. III-85 Contribution, Eligibility and Benefits Requirements ....................................................... III-85 GASB 67 Disclosure ......................................................................................................... III-86

III-5
Investment of Pension Funds ........................................................................................................ III-87 Investment Returns ............................................................................................................ III-88 Other Retirement Systems ............................................................................................................ III-88 Social Security and Other Post-Employment Benefits ................................................................. III-88 Social Security ................................................................................................................... III-88 Other Post-Employment Benefits – State Employees ...................................................... III-89 Other Post-Employment Benefits – Teachers ................................................................... III-92 Additional Information ................................................................................................................. III-94 Litigation ............................................................................................................................................. III-95 Sheff v. O’Neill ............................................................................................................................. III-95 State Employees Bargaining Agent Coalition (“SEBAC”) v. Rowland ...................................... III-95 Connecticut Coalition for Justice in Education Funding et al. v. Rell, et al. ............................... III-96 American Indian Tribes ................................................................................................................ III-96 Bouchard v. State Employees Retirement Commission ............................................................... III-96 Other Matters ..................................................................................................................................... III-98 Index to Appendices to Annual Information Statement .................................................................... III-99 Appendix III-A Governmental Organization and Services .............................................................. III-A-1 Introduction ................................................................................................................................. III-A-1 State Government Organization ................................................................................................. III-A-1 Legislative Department ................................................................................................... III-A-3 Executive Department ..................................................................................................... III-A-3 Judicial Department ......................................................................................................... III-A-4 Quasi-Public Agencies .................................................................................................... III-A-5 State Employees .......................................................................................................................... III-A-5 Employment Statistics ..................................................................................................... III-A-5 Collective Bargaining Units and Process ........................................................................ III-A-6 Governmental Services ............................................................................................................... III-A-8 Department of Emergency Services and Public Protection ............................................ III-A-9 Appendix III-B State Economy ........................................................................................................ III-B-1 Economic Resources ................................................................................................................... III-B-1 Population Characteristics ............................................................................................... III-B-1 Education ......................................................................................................................... III-B-2 Industry Landscape ......................................................................................................... III-B-2 Transportation ................................................................................................................. III-B-2 Utility Services ................................................................................................................ III-B-2 Economic Performance ............................................................................................................... III-B-4 Personal Income .............................................................................................................. III-B-4 Gross State Product ......................................................................................................... III-B-6 Employment ................................................................................................................................ III-B-8 Composition of Employment .......................................................................................... III-B-9 Manufacturing ........................................................................................................................... III-B-10 Exports ........................................................................................................................... III-B-12 Defense Industry ........................................................................................................... III-B-12 Non-manufacturing ....................................................................................................... III-B-13 Retail Trade ................................................................................................................... III-B-15 Unemployment Rates .................................................................................................... III-B-16 Appendix III-C June 30, 2015 Basic (GAAP-Based) Financial Statements.................................... III-C-1 Appendix III-D June 30, 2011 - June 30, 2013 Budgetary (Modified Cash Basis) and June 30, 2014 - June 30, 2015 Statutory Basis General Fund Financial Statements ............. III-D-1 Appendix III-E Fiscal Year 2015 Adopted Budget and Final Financial Results, Fiscal Year 2016 Adopted and Estimated Budget and Fiscal Year 2017 Adopted Budget ................ III-E-1

III-6
PART III
FEBRUARY 24, 2016
ANNUAL INFORMATION STATEMENT OF THE STATE OF CONNECTICUT
INDEX TO TABLES
Table Number
Page
1 Fixed Charges – General Fund Summarized by Function of Government
And Expenditure Category Including Major Expenditure Items ............................................... III-302 Summary of Operating Results – Budgetary (Modified Cash/Statutory) Basis ................................ III-383 General Fund Summary of Operating Results — Budgetary (Modified Cash/Statutory)
Basis vs. GAAP Basis ................................................................................................................ III-394 General Fund Unreserved Fund Balance — Budgetary (Modified Cash/Statutory) Basis ............... III-395 General Fund Unreserved Fund Balance — Budgetary (Modified Cash/Statutory) Basis
vs. GAAP Basis .......................................................................................................................... III-406 General Fund Fund Balances-GAAP Basis ....................................................................................... III-417 Statutory Debt Limit ........................................................................................................................... III-448 Direct General Obligation Indebtedness - Principal Amount Outstanding ...................................... IIII-489 Debt Ratios - Long Term General Obligation Debt ........................................................................... III-499a Combined State and Local Debt Compared to State Personal Income .............................................. III-50 10 Summary of Principal, Mandatory Sinking Fund Payments, and Interest on Long-Term
Direct General Obligation Debt ........................................................................................................ III-5111 Outstanding Long-Term Direct General Obligation Debt ................................................................. III-5212 Authorized but Unissued Direct General Obligation Debt ................................................................ III-5313 Statutory General Obligation Bond Authorizations and Reductions ................................................. III-5414 New Agency Authorizations (Does Not Include Reductions) ........................................................... III-5515 Special Tax Obligation Bonds ............................................................................................................ III-58 16 Special Capital Reserve Fund Debt .................................................................................................... III-6517 State Employees’ Retirement Fund .................................................................................................... III-7418 Normal Cost by Tier ........................................................................................................................... III-7519 Modeling Of State Employees’ Retirement Fund - Future Funded Ratios and
Annual Contribution Requirements ............................................................................................ III-7620 State Employees’ Retirement System Member Contribution Requirements, Eligibility
Requirements and Normal Retirement Benefits......................................................................... III-7821 State Employees’ Retirement Benefit Cost-Of-Living Allowances .................................................. III-8022 Teachers’ Retirement Fund ................................................................................................................ III-8323 Teachers’ Retirement Benefit Cost-Of-Living Allowances ............................................................... III-86 24 Pension Fund Investment Allocations ............................................................................................... III-8725 State Employee Retirees Health Care and Life Insurance Benefits ................................................... III-9226 Teachers’ Retirement Health Insurance Fund .................................................................................... III-94
A-1 Structure of State Government ......................................................................................................... III-A-2A-2 State Employees By Function of Government ................................................................................. III-A-5A-3 State Employees By Function of Government and Fund Categories .............................................. III-A-6A-4 Full-Time Work Force Collective Bargaining Units and Those Not Covered by Collective
Bargaining................................................................................................................................. III-A-7A-5 Function of Government Headings .................................................................................................. III-A-8B-1 Population ......................................................................................................................................... III-B-1B-2 Connecticut Personal Income by Place of Residence ...................................................................... III-B-5B-3 Annual Growth Rates in Personal Income By Place of Residence .................................................. III-B-5

III-7
Table Number
Page
B-4 Sources of Personal Income By Place of Residence ........................................................................ III-B-6B-5 Gross State Product (In Millions) ..................................................................................................... III-B-6B-6 Gross State Product (In Millions of 2009 Chained Dollars) ............................................................ III-B-7B-7 Gross State Product by Industry in Connecticut .............................................................................. III-B-8B-8 Non-agricultural Employment .......................................................................................................... III-B-9B-9 Connecticut Non-agricultural Employment, Calendar Year 2014 ................................................... III-B-9
B-10 Connecticut Non-agricultural Employment (Annual Averages) ................................................... III-B-10B-11 Manufacturing Employment ........................................................................................................... III-B-11B-12 Manufacturing Employment By Industry ...................................................................................... III-B-11B-13 Exports Originating in Connecticut ................................................................................................ III-B-12B-14 Defense Contract Awards ............................................................................................................... III-B-13B-15 Non-manufacturing Employment ................................................................................................... III-B-14B-16 Connecticut Non-manufacturing Employment By Industry .......................................................... III-B-15B-17 Retail Trade In Connecticut ........................................................................................................... III-B-16B-18 Unemployment Rate ....................................................................................................................... III-B-17

III-8
INTRODUCTION
This Annual Information Statement of the State of Connecticut (the “State”) contains certain information that a potential investor might consider material in reaching a decision to invest in securities of the State. All quotations from and summaries and explanations of provisions of laws of the State contained in this Annual Information Statement do not purport to be complete and are qualified in their entirety by reference to such provisions of law.
The information included in this Annual Information Statement is organized as follows:
The State of Connecticut comprises a brief introductory summary of the governmental organization of the State and the services it provides, as well as a historical overview of the State’s economic performance. A more detailed discussion of these topics, including additional information, is contained in Appendices III-A and III-B to this Annual Information Statement.
Financial Procedures discusses the legal and administrative processes, procedures, controls and policies that generally apply to all State funds.
State General Fund discusses the State’s General Fund, which is the source of financing for most operating activity of the State. The discussion includes both prospective and historical information about the General Fund. Additional information regarding General Fund activity is included in Appendices III-C, III-D and III-E to this Annual Information Statement.
State Debt describes the procedures for the authorization of the State to incur debt and the various ways in which the State may borrow funds to finance State functions and capital projects. This section provides both current and historical information about the State’s borrowing practices and State indebtedness.
Other Funds, Debt and Liabilities provides an overview of certain obligations of the State that are not accounted for in the General Fund but that are contingent liabilities of the State. These include the budget and debt of the Special Transportation Fund, certain special revenue funds and debt, contingent liability debt, and other debt service and contractual commitments. Certain additional information regarding these other funds, debt and liabilities of the State is included in Appendix III-C to this Annual Information Statement.
Pension and Retirement Systems describes the major pension and retirement systems of the State. Additional information regarding these systems is included in Appendix III-C to this Annual Information Statement.
Litigation comprises a summary of pending legal actions in which the fiscal impact of an adverse decision may not be determined at this time and the Attorney General is unable to opine that a final judgment against the State in such suits would not materially adversely affect the State’s financial position.
Other Matters includes additional matters that do not fall within the other headings.
Appendices III-A through III-E to this Annual Information Statement contain detailed information relating to the information summarized in the Annual Information Statement and should be read in their entirety with the other information contained therein.
The Annual Information Statement speaks only as of its date. For information about the State after February 24, 2016, the State expects to update this Annual Information Statement from time to time in a Part II Information Supplement and the reader should refer to Part II and Part III collectively and in their entirety. This Annual Information Statement and any appendices attached hereto should be read collectively and in their entirety.

III-9
FORWARD-LOOKING INFORMATION AND BONDHOLDER CONSIDERATIONS
This Annual Information Statement includes “forward-looking statements” within the meaning of Section 27A of the Securities Act of 1933, as amended, and Section 21E of the Securities Exchange Act of 1934, as amended. Without limiting the foregoing, the words “may,” “believe,” “could,” “might,” “possible,” “potential,” “project,” “will,” “should,” “expect,” “intend,” “plan,” “predict,” “anticipate,” “estimate,” “approximate,” “contemplate,” “continue,” “target,” “goal” and similar expressions are intended to identify forward-looking statements, although not all forward-looking statements contain these words. All forward-looking statements included in this Annual Information Statement are based on information available to the State up to, and including, the date of this document, and the State assumes no obligation to update any such forward-looking statements to reflect events or circumstances that arise after the date hereof or after the date of any report containing such forward-looking statement, as applicable. Actual results could differ materially from those anticipated in these forward-looking statements as a result of certain important factors, including, but not limited to, those contained in this Annual Information Statement. Investors should carefully review those factors.
Actual results could vary significantly from estimates and projections for many reasons including the effect of and from, future federal budgetary matters, including federal grants and other forms of financial aid to the State; macroeconomic economic and business developments, both for the country as a whole and particularly affecting the State; future energy costs; health care related matters including Medicaid reimbursements; federal defense spending; financial services industry; litigation or arbitration; natural disasters and other acts of God; and changes in retirement rates, inflation rates, interest rates, increases in healthcare costs, longevity rates and other factors used in estimating future obligations of the State; among others.

III-10
THE STATE OF CONNECTICUT
Governmental Organization and Services
The State Constitution divides the functions and powers of State government into three distinct branches, referred to in the Constitution as “departments”. The State government’s legislative, executive and judicial functions and powers are vested in the legislative department, the executive department and the judicial department, respectively.
In addition to the State government, a number of other governmental bodies exist in Connecticut. These bodies include: State-wide and regional special purpose authorities, districts and similar bodies, 169 cities and towns, and numerous local special purpose authorities, districts and similar bodies. County government was functionally abolished in Connecticut in 1960. Local governmental functions are generally performed by the 169 cities and towns, or by special purpose authorities, districts and similar bodies located within these cities and towns. In certain instances, regional bodies perform governmental functions that would otherwise be performed at the local or county level.
Services provided by the State or financed through State appropriations are classified under a major government function heading or are classified as “non-functional”. The major function headings accounted for in the General Fund are: Human Services; Education, Libraries and Museums; Health and Hospitals; Corrections; General Government; Judicial; Regulation and Protection; Conservation and Development; Legislative; and Non-Functional (debt service and miscellaneous expenditures including fringe benefits). These function headings apply to the General Fund as well as to other funds of the State that are used to account for appropriated moneys. State expenditures for the Department of Transportation are primarily paid from the Transportation Fund, not the General Fund. For budgetary purposes, State agencies, boards, commissions and other bodies are each assigned to one of the function headings.
A detailed discussion of the organization of State government, including information on state employees, as well as services provided at the various levels of government in the State, is included as Appendix III-A to this Annual Information Statement.
State Economy
Connecticut is a highly developed and urbanized state. It is situated directly between the financial centers of Boston and New York. Connecticut is located on the northeast coast and is the southernmost of the New England States. It is bordered by Long Island Sound, New York, Massachusetts and Rhode Island. More than one-quarter of the total population of the United States and more than 50% of the Canadian population live within 500 miles of the State. The State’s population growth rate trailed the national average during the past four decades, but from 2006 to 2015, within New England, only Massachusetts experienced growth higher than Connecticut. The State has extensive transportation and utility services to support its economy.
Connecticut’s economic performance is measured by personal income, which has been among the highest in the nation on a per capita basis, and gross state product (the market value of all final goods and services produced by labor and property located within the State), which has demonstrated slower growth over the last five years than the New England region and the nation. Connecticut’s nonagricultural employment reached a high in March of 2008 with 1,699,000 persons employed, but began declining with the onset of the recession falling to 1,607,000 jobs in 2010, and has since risen to 1,665,700.
A detailed summary of economic resources including population information and services, and economic performance indicators, including personal income, gross state product and employment in the State is included as Appendix III-B to this Annual Information Statement.
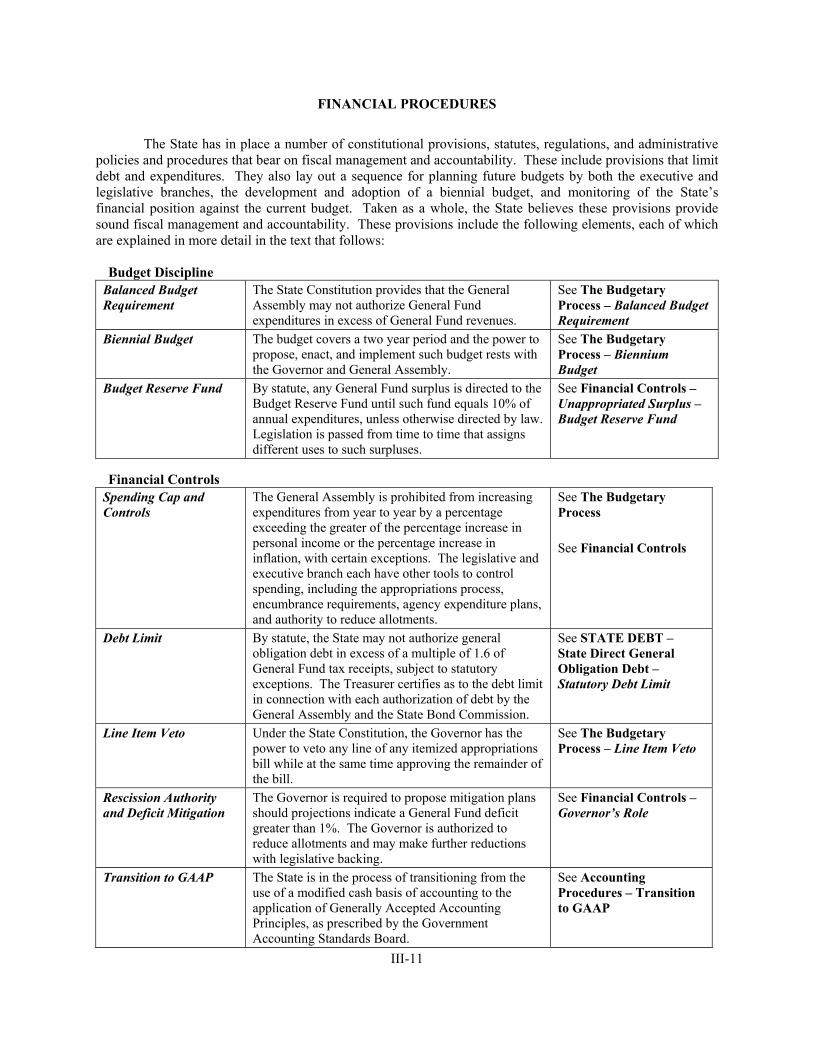
III-11
FINANCIAL PROCEDURES
The State has in place a number of constitutional provisions, statutes, regulations, and administrative policies and procedures that bear on fiscal management and accountability. These include provisions that limit debt and expenditures. They also lay out a sequence for planning future budgets by both the executive and legislative branches, the development and adoption of a biennial budget, and monitoring of the State’s financial position against the current budget. Taken as a whole, the State believes these provisions provide sound fiscal management and accountability. These provisions include the following elements, each of which are explained in more detail in the text that follows:
Budget Discipline Balanced Budget Requirement
The State Constitution provides that the General Assembly may not authorize General Fund expenditures in excess of General Fund revenues.
See The Budgetary Process – Balanced Budget Requirement
Biennial Budget The budget covers a two year period and the power to propose, enact, and implement such budget rests with the Governor and General Assembly.
See The Budgetary Process – Biennium Budget
Budget Reserve Fund By statute, any General Fund surplus is directed to the Budget Reserve Fund until such fund equals 10% of annual expenditures, unless otherwise directed by law. Legislation is passed from time to time that assigns different uses to such surpluses.
See Financial Controls – Unappropriated Surplus – Budget Reserve Fund
Financial Controls Spending Cap and Controls
The General Assembly is prohibited from increasing expenditures from year to year by a percentage exceeding the greater of the percentage increase in personal income or the percentage increase in inflation, with certain exceptions. The legislative and executive branch each have other tools to control spending, including the appropriations process, encumbrance requirements, agency expenditure plans, and authority to reduce allotments.
See The Budgetary Process See Financial Controls
Debt Limit By statute, the State may not authorize general obligation debt in excess of a multiple of 1.6 of General Fund tax receipts, subject to statutory exceptions. The Treasurer certifies as to the debt limit in connection with each authorization of debt by the General Assembly and the State Bond Commission.
See STATE DEBT – State Direct General Obligation Debt – Statutory Debt Limit
Line Item Veto Under the State Constitution, the Governor has the power to veto any line of any itemized appropriations bill while at the same time approving the remainder of the bill.
See The Budgetary Process – Line Item Veto
Rescission Authority and Deficit Mitigation
The Governor is required to propose mitigation plans should projections indicate a General Fund deficit greater than 1%. The Governor is authorized to reduce allotments and may make further reductions with legislative backing.
See Financial Controls – Governor’s Role
Transition to GAAP The State is in the process of transitioning from the use of a modified cash basis of accounting to the application of Generally Accepted Accounting Principles, as prescribed by the Government Accounting Standards Board.
See Accounting Procedures – Transition to GAAP

III-12
Forecasting and Monitoring Regular Revenue Forecasting, Monitoring of Fiscal Progress and Multiple-Year Planning Tools
Monthly reports from the Comptroller and the Office of Policy and Management within the executive branch, and periodic reports from other governmental entities, including the legislature’s Office of Fiscal Analysis.
See The Budgetary Process – Consensus Revenue Estimates and Fiscal Accountability Report See Financial Controls – Comptroller’s Role
The Budgetary Process
Balanced Budget Requirement. In November 1992 electors approved an amendment to the State Constitution providing that the amount of general budget expenditures authorized for any fiscal year shall not exceed the estimated amount of revenue for such fiscal year. This amendment also provides a framework for a cap on budget expenditures. The General Assembly is precluded from authorizing an increase in general budget expenditures for any fiscal year above the amount of general budget expenditures authorized for the previous fiscal year by a percentage that exceeds the greater of the percentage increase in personal income or the percentage increase in inflation unless the Governor declares an emergency or the existence of extraordinary circumstances and at least three-fifths of the members of each house of the General Assembly vote to exceed such limit for the purposes of such emergency or extraordinary circumstances. The constitutional limitation on general budget expenditures does not include expenditures for the payment of bonds, notes or other evidences of indebtedness. There is no statutory or constitutional prohibition against bonding for general budget expenditures.
In 1996, the Connecticut Supreme Court ruled in Nielson v. State that the provisions of the constitutional budget cap require the passage of additional legislation by a three-fifths majority in each house of the General Assembly for implementation of the cap, which has not yet occurred. Legislation enacted in December 2015 established a spending cap commission to create proposed definitions for the constitutional budget cap. The commission is required to submit their proposed definitions by December 1, 2016 to a committee of the General Assembly. The enactment of any proposed definitions will require the vote of three-fifths members of each house to the General Assembly. In the interim, the General Assembly has been following a provision of the General Statutes that contains the same budget cap as the constitutional amendment. In addition to the exclusion of debt service from the budget cap, this statute also excludes statutory grants to distressed municipalities, expenditures to implement federal mandates and court orders in the first fiscal year in which such expenditures are authorized, and payments from surplus for certain debt retirement and additional state employee pension contributions.
In an opinion dated November 17, 2015, the Attorney General of the State concluded that unless and until the General Assembly adopts, by the necessary three-fifths vote of the members of each house of the General Assembly, the definitions required by the constitutional spending cap, the constitutional spending cap has no legal effect. The Attorney General further concluded that a court would likely hold that the General Assembly could exceed the statutory spending cap by a majority vote.
Biennium Budget. The State’s fiscal year begins on July 1 and ends on June 30. The General Statutes require that the budgetary process be on a biennium basis. The Governor is required to transmit a budget document to the General Assembly in February of each odd-numbered year setting forth the financial program for the ensuing biennium with a separate budget for each of the two fiscal years and a report that sets forth estimated revenues and expenditures for the three fiscal years after the biennium to which the budget document relates. In each even-numbered year, the Governor must prepare a report on the status of the budget enacted in the previous year with any recommendations for adjustments and revisions, and a report, with revisions, if any, that sets forth estimated revenues and expenditures for the three fiscal years after the biennium in progress.

III-13
Budget Document. By statute, the budget document shall contain the Governor’s budget message, the Governor’s program for meeting the expenditure needs of the State, as well as financial statements detailing the condition of State debt, the financial position of all major State operating funds, recommended appropriations and State revenues on an actual basis for the last completed fiscal year and on an estimated basis for the fiscal year in progress and the fiscal years to which the budget relates. If a budget deficit or surplus is projected, the Governor will recommend the manner in which the deficit will be met or surplus used. The budget document also includes the Governor’s recommended appropriations from the General Fund and all special and agency funds. Appropriations are set forth for meeting the cost of each major function and program. An accounting of federal funds and recommendations for the capital program are also included. In addition, based on the consensus revenues described below under Consensus Revenue Estimates, the budget document consists of drafts of appropriations and revenue bills to carry out the Governor’s budget recommendations. Finally, the budget document contains the Governor’s recommendations concerning the State’s economy and analysis of the impact on the economy of the proposed spending and revenue programs.
Preparation of the Budget. Formulation of the budget document commences with the preparation of estimates of expenditure requirements for each fiscal year of the next biennium by the administrative head of each budgeted agency. These estimates are submitted on or before September 1 of each even-numbered year to OPM and to the joint legislative standing committee on appropriations and the committee having cognizance of matters relating to such budgeted agency. On or before September 1 of each odd-numbered year, each agency submits its recommended adjustments or revisions of such estimates. In addition, the administrative head of each budgeted agency transmits to the Legislature’s Office of Fiscal Analysis copies of the respective agency’s monthly status reports relating to finances, personnel, and nonappropriated moneys. A detailed statement showing revenue and estimated revenue for the current fiscal year and estimated revenue for the next fiscal year, and in the even-numbered year, for the next biennium, must also be submitted by such agency heads to OPM on or before September 1 and the joint legislative standing committee on finance on or before November 15. Upon receipt of such agency reports, it is OPM’s practice to prepare a preliminary budget report.
Adoption of the Budget. The budget document, as finally developed by the Governor with the assistance of OPM, is published and transmitted to the General Assembly in February of each odd-numbered year. A report summarizing recommended adjustments or revisions is submitted by the Governor to the General Assembly on the day on which the General Assembly first convenes in even-numbered years. The Governor or a representative then appears before the appropriate committee of the General Assembly to explain and address questions concerning the budget document or related reports. Prior to June 30 of each odd-numbered year, the General Assembly enacts legislation making appropriations for the next two fiscal years and setting forth revenue estimates for those years.
Line Item Veto. Under the State Constitution, the Governor has the power to veto any line of any itemized appropriations bill while at the same time approving the remainder of the bill. A statement identifying the items so disapproved and explaining the reasons therefor must be transmitted with the bill to the Secretary of the State and, when in session, the General Assembly. The General Assembly may separately reconsider and repass such disapproved appropriation items by a two-thirds vote of each house.
Consensus Revenue Estimates. OPM and the Legislature’s Office of Fiscal Analysis are required by statute to issue consensus revenue estimates each year by November 10. The estimates must cover a five-year period that includes the current biennium and the three following fiscal years. It also requires the two offices, by January 15 and April 30 each year, to issue either (1) a consensus revision of their previous estimate or (2) a statement that no revision is needed. If the two agencies cannot arrive at a consensus estimate, they must issue separate ones. In such a case, the Comptroller must issue the consensus estimate based upon the separate estimates. The Comptroller’s estimate must equal one of the separate estimates or fall between the two.
Fiscal Accountability Report. By November fifteenth annually, the Secretary of OPM and the Director of the Legislature’s Office of Fiscal Analysis each submit the following to the joint standing

III-14
committees of the General Assembly having cognizance of matters relating to appropriations and the budgets of State agencies and to finance, revenue and bonding: (1) an estimate of State revenues, expenditures and ending balance for each fund for the current biennium and the next ensuing three fiscal years, and the assumptions on which such estimates are based; (2) the projected tax credits to be used in the current biennium and the next ensuing three fiscal years, and the assumptions on which such projections are based; (3) a summary of any estimated deficiencies in the current fiscal year, the reasons for such deficiencies, and the assumptions upon which such estimates are based; (4) the projected balance in the Budget Reserve Fund at the end of each uncompleted fiscal year of the current biennium and the next ensuing three fiscal years; (5) the projected bond authorizations, allocations and issuances in each of the next ensuing five fiscal years and their impact on the debt service of the major funds of the State; (6) an analysis of revenue and expenditure trends and of the major cost drivers affecting State spending, including identification of any areas of concern and efforts undertaken to address such areas, including efforts to obtain federal funds; and (7) an analysis of possible uses of surplus funds, including the Budget Reserve Fund, debt retirement and funding of pension liabilities.
By November 30, annually, the legislative committees then meet with the Secretary of OPM and the Director of the Legislature’s Office of Fiscal Analysis to consider the submitted reports.
Financial Controls
Expenditures. The financial control procedures utilized by the State in the expenditure of State funds are described below and may be generally summarized as follows: initially, the legislature appropriates funds for a particular purpose; such funds must then be allotted for such purpose by the Governor; and thereafter such funds are encumbered by the Comptroller upon the request of the responsible State agency. Once this appropriation, allotment and encumbrance procedure (which may be modified as described below) has been completed, State funds are paid by the Treasurer upon a warrant, draft or order of the Comptroller drawn at the request of the responsible agency. Certain receivables from the federal government or other sources do not require allotment by the Governor.
Governor’s Role in Expenditure Control. Before an appropriation for a budgeted agency becomes available for expenditure, the agency must submit to the Governor, through the Secretary of OPM, not less than 20 days before the beginning of the fiscal year for which the appropriation is made, a requisition for the allotment of funds needed for each quarter of the fiscal year. Appropriations for capital outlays may be allotted in any manner the Governor deems advisable. The Governor may reduce the budget allotment request by not more than three percent of the total appropriation from any fund or not more than five percent of any appropriation under certain circumstances. Such allotments are subject to further modification by the Governor throughout the course of the fiscal year if conditions warrant. If the cumulative monthly financial statement issued by the Comptroller indicates a projected General Fund deficit greater than one per cent of the total of General Fund appropriations, the Governor is required, within thirty days of such statement date, to file a report with the joint standing committees of the General Assembly on appropriations and on finance, revenue and bonding. The report shall include a plan that the Governor shall implement to modify agency allotments to the extent necessary to prevent a deficit. The Governor is not authorized to reduce allotment requisitions or allotments in force concerning aid to municipalities or any budgeted agency of the legislative or judicial branch, except that the Governor may propose an aggregate allotment reduction of a specified amount for the legislative or judicial branch.
Comptroller’s Role in Expenditure Control. The Comptroller is responsible for keeping an account in connection with each appropriation. No warrant, draft or order may be issued by the Comptroller in excess of the available balance of the applicable account unless the General Assembly has passed a deficiency bill for the purpose or unless such appropriation has been increased by the Governor in the limited circumstances of emergency expenditures or allotment modifications as authorized by statute. The Comptroller is required to issue cumulative monthly financial reports
III-15
concerning the State General Fund on or before the first day of the following month. OPM provides estimates to the Comptroller by the twentieth day of each month of the revenues and expenditures for the current fiscal year for use by the Comptroller in preparing the Comptroller’s monthly report.
Treasurer’s Role in Expenditure Control. The Treasurer is required to honor all warrants, drafts and orders properly drawn by the Comptroller. Payments of principal or interest of State bonds and payments of interest on funds held by the Treasurer on which the Treasurer is required to pay interest do not require specific appropriations.
By statute, the Treasurer may not pay compensation, expenses or fees or otherwise enter into contractual arrangements with any firm providing legal services, investment banking services, investment advisory services, underwriting services, financial advisory services or brokerage firm services if such firm, through its political committee or certain managerial level officers or employees, makes or solicits contributions to any committee established by a candidate for nomination or election to the Office of Treasurer of the State. The statute also prohibits the making or solicitation of contributions by such firms.
Use of Appropriations. No appropriation or part thereof may be used for any purpose other than for the purpose for which it was made, except with respect to certain transfers and revisions of appropriations permitted to be made by the Governor with the concurrence of the Finance Advisory Committee, composed of members of the executive and legislative departments. Civil sanctions may be imposed pursuant to statute upon persons who willfully expend or authorize the expenditure of State funds for any purpose in excess of the amount specifically appropriated for such purpose.
Unexpended Appropriations. All unexpended balances of appropriations for each fiscal year lapse on the last day of such fiscal year and revert to the unappropriated surplus of the fund from which the appropriations were made, except for certain continuing appropriations. Such continuing appropriations include those continuing into the succeeding fiscal year to permit the liquidation of obligations of the prior fiscal year in the case of programs that were not renewed the succeeding fiscal year; those continuing for the entire succeeding fiscal year in the case of highway and other capital construction projects, and limited amounts for certain special programs.
Unappropriated Surplus – Budget Reserve Fund. The State Constitution provides that any resulting unappropriated surplus shall be used to fund a budget reserve fund, to reduce bonded indebtedness or for any other purpose authorized by at least three-fifths of each house of the General Assembly. The General Statutes provide that the Treasurer shall transfer any unappropriated surplus in the General Fund to a budget reserve fund, unless otherwise directed by law. When the amount in the budget reserve fund in any fiscal year equals 10% of the net General Fund appropriations, no further transfers shall be made by the Treasurer. Effective July 1, 2019 the maximum cap on the total allowable deposits is raised to 15% of the net General Fund appropriation. Commencing in Fiscal Year 2020, an automatic funding mechanism is triggered when certain revenue sources exceed an average historical growth rate; and commencing in Fiscal Year 2021 as deposits to the budget reserve fund rise, a portion of those increases are to be diverted to the State Employees Retirement Fund according to a formula set forth in the general statutes.
Notwithstanding the above, legislation is passed from time to time that assigns different uses to such surpluses. Legislation enacted in 2013 provided for the transfer of up to $220.8 million of the Fiscal Year 2013 surplus to be used in the 2014-2015 biennium prior to any deposits to the budget reserve fund. Fiscal Year 2015 ended with a deficit of $113.2 million. This deficit was eliminated through a transfer from the budget reserve fund. The balance in the budget reserve fund as of June 30, 2015 is $406.0 million.
Revenues. The Treasurer superintends the collection and receipt of all taxes and revenues belonging to the State and is authorized to deposit the same in any qualified public depository as defined by statute. Each State department, institution, board, commission or other State agency and any official or employee thereof

III-16
that receives any money for revenue of the State must, within 24 hours of its receipt or within seven days of receipt for amounts less than $500, account for and pay the same to the Treasurer or, with the approval of the Treasurer and the Comptroller, deposit the same in an account in a qualified public depository in the name of the State or in the name of the public official as such official. The Treasurer is authorized to make exceptions to the limitations on amounts and timing of payments or deposits or reporting of receipts provided the Treasurer files a written statement of such exception with the Comptroller and the State’s Auditors of Public Accounts. Any public official who deposits funds or moneys in an account in the name of the State or in such official’s name must submit a list of all such accounts as of the preceding June 30 to the Treasurer and the Comptroller not later than September 1 of each year.
Accounting Procedures
Books and Records. The State uses an enterprise resource planning system called Core-CT to address its automated financial accounting and human resources needs. This statewide system uses technology to manage financial transaction activities ranging from contracting and purchasing to payment and reporting. The State's financial applications are fully integrated with human resources, providing a single comprehensive management and reporting system. Core-CT is currently the book of record for all of the Comptroller's monthly and annual financial reports and provides formatted reports to all State agencies. Core-CT also provides a data warehouse used to develop custom reporting. Core-CT is fully implemented and stabilized with updates completed on a routine basis.
Financial Reporting. For a number of years, the State has prepared annual financial statements in two ways: financial statements prepared using the guidance of Generally Accepted Accounting Principles (“GAAP”), as prescribed by the Government Accounting Standards Board (“GASB”), and financial statements prepared on a statutory basis (that is, following the adopted budget). As described below, the State transitioned to both budgeting and statutory financial statement reporting more in line with GAAP standards.
The State was not required to prepare financial statements in accordance with GAAP. However, since 1988 the State has issued comprehensive annual financial reports in accordance with the guidelines established by the Governmental Accounting Standards Board. These reports include audited annual financial statements prepared using the guidance of GAAP. The State does not prepare GAAP statements on an interim basis.
Financial statements of the State are also prepared annually on a statutory basis of accounting for all civil list funds. The Comptroller prepares the statements for submission to the Governor by September 30 of each year, unless extended by State law. The State’s Auditors of Public Accounts must audit the books and accounts of the Treasurer and the Comptroller at least annually and have discretion to audit them at more frequent intervals.
As specifically permitted by statute or decision of the Comptroller, the only present modifications from the cash basis in recording revenues under the statutory basis are: (1) the accrual of sales and use taxes to be received for the calendar quarter ending at the close of such fiscal year as estimated by the Secretary of OPM; (2) the accrual of cigarette tax revenue received by the Commissioner of Revenue Services no later than five business days after the last day of July immediately following the end of such fiscal year; (3) the accrual of alcoholic beverage tax revenue received by the Commissioner of Revenue Services no later than five business days after the last day of July immediately following the end of such fiscal year; (4) the accrual of motor fuels tax revenue and motor carrier road tax revenue on all fuel sold or used prior to the end of such fiscal year and received by the Commissioner of Revenue Services no later than five business days after the last day of July immediately following the end of such fiscal year; (5) the accrual of utility company tax revenue and tax revenue on gross earnings from the sale of petroleum products which is received by the Commissioner of Revenue Services no later than five business days after the last day of July immediately following the end of such fiscal year; (6) pursuant to the Comptroller’s constitutional powers under Section 24, Article Fourth of the Connecticut State Constitution and his statutory powers under Public Act No. 08-111, the

III-17
accrual of corporation business tax revenue received by the Department of Revenue Services no later than five business days after the last day of July immediately following the end of such fiscal year; (7) the accrual of income tax revenue received by the Commissioner of Revenue Services no later than five business days after the last day of July immediately following the end of such fiscal year; (8) the accrual of nursing home provider tax received by the Commissioner of Revenue Services no later than five business days after the last day of July immediately following the end of such fiscal year; (9) the accrual of payments received from any Indian tribe, pursuant to a memorandum of understanding, received by the Treasurer no later than the last day of July immediately following the end of such fiscal year; (10) the accrual of real estate conveyance tax revenue received by the Commissioner of Revenue Services no later than five business days after the last day of July immediately following the end of such fiscal year; (11) the recording as grants receivable of certain amounts of restricted grants for which the State has the contractual right to be reimbursed by the federal government or other parties; (12) the accrual of hospital provider tax received by the Commissioner of Revenue Services no later than five business days after the last day of July immediately following the end of such fiscal year; (13) the accrual of intermediate care use fee received by the Commissioner of Revenue Services no later than five business days after the last day of July immediately following the end of such fiscal year; and (14) the accrual of the amount of the outstanding balances required to be paid to the State for bottle deposits pursuant to Section 22a-245a of the General Statutes, and that is received by the State no later than five business days after the last day of July immediately following the end of such fiscal year.
Expenditures are recorded in the fiscal year in which the payment is processed. In addition, there is a recording of expenditure accruals to the fiscal year in which specific goods and services are received even though payment is not processed until the next fiscal year. Such accrued expenditures include State of Connecticut payroll expenses, general agency operating expenses, and Medicaid expenses. Certain appropriations that have not lapsed are reflected in the balance sheet through a reserve for continuing appropriations.
The statutory basis of accounting used for budgetary financial reporting and the modified accrual basis used for GAAP financial reporting are different and, as a result, often produce varying financial results, primarily because of differences in the recognition of revenues and expenditures. As described below under “Transition to GAAP”, commencing in Fiscal Year 2014 appropriations have been made in line with the accrual of expenses for GAAP purposes, and the differences between the two methods are less significant than in past years.
The audited budgetary/statutory basis financial statements for the fiscal year ending June 30, 2015 and the audited financial statements of the State prepared using the guidance of GAAP for the fiscal year ending June 30, 2015 appear in Parts III-C and III-D.
Transition to GAAP. Legislation passed in 2011 directed the transition from the previously used modified cash basis of accounting to GAAP. This legislation required that the budget, commencing with Fiscal Year 2014, be prepared in accordance with GAAP, commonly referred to as GAAP budgeting. While GASB does not prescribe standards for GAAP budgeting, the State interprets the policy objectives of GAAP budgeting to authorize expenditures in line with the accrual of the expenditures for GAAP purposes, estimate revenues in line with the accrual of revenues for GAAP purposes, eliminate or mitigate the growth of the GAAP deficit (discussed below) reported in the comprehensive annual financial report, and in future years eliminate the GAAP deficit. The Secretary of OPM initiated a process intended to result in the implementation of the use of GAAP accrual principles with respect to the preparation of the biennial budget. This transition included changing the meaning of a deficit as it relates to the requirement that the Governor’s budget includes recommendations to the General Assembly regarding the manner in which any deficit shall be met. Commencing in Fiscal Year 2014, the Governor accounts for the amount necessary to extinguish any unreserved negative balance in each budgeted fund as addressed in the most recently issued statutory basis (GAAP based budgeting) annual financial report issued by the Comptroller, prior to the start of the biennium in the budget document transmitted to the General Assembly.

III-18
The Comptroller initiated a process intended to result in the implementation of the policy objectives of GAAP with respect to the preparation and maintenance of the biennial budget and the annual financial statements of the State previously prepared on a modified cash basis. The Comptroller established an opening combined balance sheet for each appropriated fund reflecting GAAP accrual principles. This combined balance sheet reflected as a deferred charge the accumulated deficit in the General Fund on June 30, 2013 of $1,217.1 million, as determined on the modified accrual basis of GAAP and identified in the comprehensive annual financial report of the State as the unassigned fund balance in the General Fund, commonly referred to as the accumulated GAAP deficit. Such deferred charge is required to be amortized in equal increments in each fiscal year of each biennial budget commencing with the fiscal year ended June 30, 2016, and for the next succeeding twelve fiscal years. Additionally, the unreserved negative balance in the General Fund reported in the comprehensive annual financial report of the State for Fiscal Year 2014, reduced by (i) the negative unassigned balance of the General Fund for Fiscal Year 2013 and (ii) any funds from resources deposited in the General Fund for the purpose of reducing the negative unassigned balance of the General Fund, resulting in $108.7 million, is required to be amortized in equal increments in each fiscal year of each biennial budget commencing with Fiscal Year 2017 and for the succeeding 11 fiscal years.
The Comptroller is required by statute to submit its annual report to the Governor by September 30th in accordance with GAAP. However, the financial results reported in the Comptroller’s financial statements for Fiscal Year 2014 have been prepared in accordance with specific budgetary basis accounting standards set forth by statute which incorporate new budgeted expenditure accruals consistent with specific statutory reporting requirements. Specifically, commencing in Fiscal Year 2015,
• Appropriations were made to budgeted State agencies and to the non-functional spending group in order to account for expense accruals. The new appropriation accruals were posted exclusively to the budgeted funds, which include the General Fund, Transportation Fund and the other special revenue funds that received legal appropriations within Public Act No. 13-184 as adjusted by Public Act No. 13-247. The accruals relate to payments that were made after the close of the fiscal year on June 30th but are directly related to obligations incurred within that fiscal year.
• Revenues within the Fiscal Year 2015 report are recognized when received except in the General and Transportation Fund. Certain accrued taxes and Indian Gaming Payments within these funds are recognized within a statutory accrual period that is accepted by the Comptroller.
• In addition, as part of a two-part plan, the State issued bonds in October 2013 in the amount of $560.43 million generating net proceeds of approximately $600 million, which was deposited in the General Fund and applied to reduce the accumulated GAAP deficit (“GAAP Bonds”). The second part of the plan was additional legislation that deemed appropriated the amounts needed to amortize the difference between the remaining accumulated GAAP deficit in each year from Fiscal Year 2016 to Fiscal Year 2028. Finally, the GAAP Bonds contain a contractual covenant with bondholders that no future action of the General Assembly shall diminish the appropriation so long as the GAAP Bonds are outstanding, unless the Governor declares an emergency or there are other extraordinary circumstances. While delaying the amortization of the accumulated GAAP deficit, this plan is intended to result in the elimination of the accumulated GAAP deficit as of June 30, 2013 by the end of Fiscal Year 2028. Although the State’s two-part plan has resulted in the reduction of the overall GAAP deficit and the mitigation of its growth, the GAAP deficit has continued to grow over time largely due to the growth in spending accruals within the budgeted funds. As described above, the increase in the accumulated GAAP deficit incurred between Fiscal Year 2013 and Fiscal Year 2014 of $108.7 million will be amortized over a twelve year period commencing in Fiscal Year 2017.
The statutory balanced budget provisions were amended to require that future budgets include the amount necessary to eliminate any unassigned negative balance arising after June 30, 2013 as reported in the Comptroller’s most recently issued statutory basis (GAAP based budgeting) annual financial report.

III-19
Investment and Cash Management
The Treasurer has the investment responsibility for all funds of the State and functions as the trustee of all State pension, retirement and trust funds. The Treasurer is authorized to invest funds under the control of the Treasurer, subject to certain conditions, including in certain circumstances the approval of the Investment Advisory Council, in a variety of investments allowed by statute. The Treasurer is required to report by December 31 annually to the Governor and the Investment Advisory Council as to the activities of the Office of the Treasurer for the preceding fiscal year.
Cash Management. The cash management system and the investment by the Treasurer of State monies, other than monies invested on a longer-term basis, including pension and certain trust funds, are based on the concept of available cash. Available cash consists of the State’s common cash pool and funds invested in certain accounts in the Short-Term Investment Fund (“STIF”), including proceeds of various State bonding programs and miscellaneous other STIF accounts. The common cash pool is comprised of the operating cash of most State funds, including the General Fund and the Budget Reserve Fund, and is held or invested in bank deposits, STIF, and other short term investments. It is the State’s practice, pursuant to a longstanding and established policy, to permit temporary inter-fund transfers to the common cash pool as needed to address mismatches in the timing of receipts and disbursements. This cash management policy is intended to provide flexibility for expenditures to occur when they are needed without the need to resort to short-term financing mechanisms that could impose additional costs on the State. Cash transferred pursuant to these temporary inter-fund transfers is returned as cash pool balances allow. The State’s available cash varies from day to day. The average week-ending balances of available cash for Fiscal Year 2015 exceeded approximately $1.5 billion.
In addition, the Treasurer has the authority to establish, and has in the past established, lines of credit and other short-term financing mechanisms to secure the availability of cash. In each of 2009 and 2012 the Treasurer arranged a 364-day revolving credit facility in the amount of $580 million and $300 million respectively, neither of which was ever drawn upon or extended beyond its 364-day term. See STATE DEBT – Type of Direct General Obligation Debt – Certain Short-Term Borrowings.
On a daily basis, the Treasurer calculates expected cash receipts and disbursements, necessary bank balances, and amounts available for investment. The Treasurer is required to submit a monthly report to certain legislative members and the Office of Fiscal Analysis which includes among other items, a weekly list of the State’s cash balance, a year to date total of authorized but unissued bonds, debt instruments or commercial paper of the State, and the amounts in the State’s common cash pool.
Short-Term Investment Fund. STIF is a combined investment pool of high quality, short-term money market instruments, which is an investment vehicle for the temporarily surplus cash of all funds for which the Treasurer is custodian and/or trustee, except certain bond funds, State pension funds and selected trust funds. All agencies, instrumentalities and political subdivisions of the State are permitted to invest in STIF. The State is responsible to these governmental entities to manage their deposits and accumulated earnings in a prudent manner. Individual participants in STIF can add or withdraw monies on a daily basis with interest earned from date of deposit to date of withdrawal. The primary investment objectives of STIF are the preservation of principal and the provision of liquidity to meet participants’ daily cash flow needs, while seeking to earn competitive yields. STIF is managed in accordance with the investment guidelines established by the Treasurer and the investment restrictions of Section 3-27d of the Connecticut General Statutes (“CGS”). These investment guidelines prohibit investment in derivative securities other than floating rate securities that vary in the same direction as individual short-term money market indices, and limit the ability to enter into reverse repurchase agreements to amounts not to exceed five percent (5%) of the STIF’s net assets at the time of execution. STIF is rated “AAAm” by Standard & Poor’s.
Other Funds. Other State monies are held in certain other funds. Up to $100 million of the State’s operating cash may be invested in certificates of deposit of community banks and credit unions, pursuant to

III-20
Section 3-24k of the CGS. In addition, investments are made in individual securities pursuant to Section 3-31a of the CGS. Allowable investments under Section 3-31a of the CGS include United States government and agency obligations, shares or interests in an investment company or investment trust registered under the Investment Company Act of 1940, whose portfolio is limited to obligations of the United States, its agencies or instrumentalities, or repurchase agreements collateralized by such obligations, certificates of deposit, commercial paper, savings accounts, and bank acceptances. The Treasurer has adopted guidelines for investments made under Section 3-31a of the CGS, which specify credit and diversification standards, and limit individual security maturities to three years and the total amount invested to $900 million. Pursuant to Section 3-28a of the CGS and guidelines adopted by the Treasurer, the Treasurer is authorized to invest funds of the Medium-Term Investment Fund in obligations of the United States government and its agencies and instrumentalities, certificates of deposit, commercial paper, corporate debt securities, savings accounts and bankers acceptances, repurchase agreements collateralized by such securities and investment funds or pools comprised of securities in which the Medium-Term Investment Fund may directly invest.
Investment and Payment of Bond Proceeds. Proceeds of bonds are accounted for in various bond funds. Generally, all invested assets of the bond funds are invested in STIF. Bond proceeds are expended in accordance with the authorization and allotment procedure of the State Bond Commission and the Governor, respectively. Assets of the bond funds may from time to time be transferred temporarily to the common cash pool in accordance with the State’s overall cash flow needs. Under the State’s accounting system, transfer of the assets of the bond funds to the common cash pool is reflected in the accounts of the bond funds as an uninvested cash balance. That accounting balance can be reduced only when an approved payment for an expenditure is charged to the bond funds. In no case does the temporary transfer of bond fund assets to the common cash pool alter the timing or the extent of expenditures for the purposes for which the bonds were issued.
Investment Advisory Council. Trust fund investments by the Treasurer are reviewed by the Investment Advisory Council, comprised of the Treasurer and the Secretary of OPM as ex-officio members, five members of the public with experience in investment matters, three representatives of the teachers’ union and two representatives of the State employees’ unions. The Treasurer, with the approval of the Council, adopts an Investment Policy Statement for trust funds. Under certain limited circumstances, all private equity or real estate investments require approval of the Investment Advisory Council. The Governor may direct the Treasurer to change any investments when, in the judgment of the Council, such action is in the best interest of the State. At the close of each fiscal year, a report is submitted to the Governor on the value of all security investments of the State.
Investment of Pension Funds. Twelve investment funds serve as the investment medium for the various pension, retirement and trust funds of which the Treasurer is the trustee. They are the Mutual Equity Fund, the Developed Markets International Stock Fund, the Emerging Markets International Stock Fund, the Core Fixed Income Fund, the Inflation Linked Bond Fund, the Emerging Markets Debt Fund, the High Yield Debt Fund, the Private Investment Fund, the Real Estate Fund, the Liquidity Investment Fund, the Commercial Mortgage Fund, and the Alternative Investment Fund. The pension, retirement and trust funds acquire units, in varying proportions depending on the investment policies of the funds, in one or more of the twelve investment funds. By statute no more than 60% of any of the State’s trust funds may be invested in common stock and if market fluctuations cause this limit to be exceeded, after six months no more than 65% of the State’s trust funds may remain invested in common stock. Other than these limits, the statutes of the State permit investment in securities under the “Prudent Investor” rule. See also PENSION AND RETIREMENT SYSTEMS herein.
III-21
STATE GENERAL FUND
The State finances most of its operations through its General Fund. Certain State functions, such as the State’s transportation budget, are financed through other State funds. See OTHER FUNDS, DEBT AND LIABILITIES herein. For budgetary purposes, the State’s General Fund has been accounted for in accordance with accounting standards prescribed by statutes (“budgetary-basis”) . The State has not been required by law to prepare generally accepted accounting principles (“GAAP”) financial statements, although it has prepared such statements annually since 1988. Legislation was passed in 2011 which facilitated a transition from the prior modified cash basis of accounting to a statutory basis of accounting that incorporates certain policy objectives of GAAP. For an explanation of the differences between the budgetary-basis and GAAP based accounting and a discussion of the transition to GAAP, see FINANCIAL PROCEDURES — Accounting Procedures herein.
GAAP based audited financial statements for all civil list funds of the State for Fiscal Year 2015 are included as Appendix III-C to this Annual Information Statement. Budgetary-basis audited financial statements for the General Fund for Fiscal Years 2011 through 2015 are included in Appendix III-D to this Annual Information Statement. The adopted budget and final financial budgetary-basis results for Fiscal Year 2015, the adopted budget and estimated (as of December 31, 2015) budget for Fiscal Year 2016, and the adopted budget for Fiscal Year 2017 are included as Appendix III-E to this Annual Information Statement. Unless otherwise stated, amounts set forth in the discussion that follows under this caption STATE GENERAL FUND refer to such amounts as calculated on the budgetary-basis of accounting.
General Fund Revenues
Forecasted, Adopted and Historical Revenues
Procedure For Forecasting Revenues. Revenues are forecast by the Legislature in adopting a budget and by the executive branch in proposing a budget and tracking performance through the year and for other planning purposes. Revenue forecasting in Connecticut incorporates a blend of econometric modeling and economic advice obtained from an array of expert sources. Some of these major sources include: “Blue Chip Economic Indicators”, which is a compilation of the consensus forecast for major national economic indicators from the top 50 economic and financial institutions and IHS Global Inc., a nationally recognized econometric forecasting firm.
Because of the vast number of variables that can impact the revenue forecast, the State considers forecasting to be a process and not a product. While the economic data from available sources is analyzed and used to anticipate overall direction and trends, the revenue forecast is generated through a consensus interpretation of all available data. Annual revenue estimates from the beginning of each year attempt to account for possible variations in economic activity during the year. Periodic economic data, such as seasonal adjustments to estimated personal income growth, or a monthly drop in employment, are analyzed on an on-going basis. Adjustments are made when the aggregate values of such changes deviate beyond tolerance levels derived from aggregate and historical estimates. The State believes that the process followed in developing Connecticut’s revenue forecast is consistent with approaches taken in many other states.
Fiscal Year 2016 and 2017 Adopted Revenues. General Fund revenues are forecasted by the Legislature at the adoption of the revised budgets for Fiscal Years 2016 and 2017 (“Adopted Revenues”) and are reflected in Appendix III-E to this Annual Information Statement.
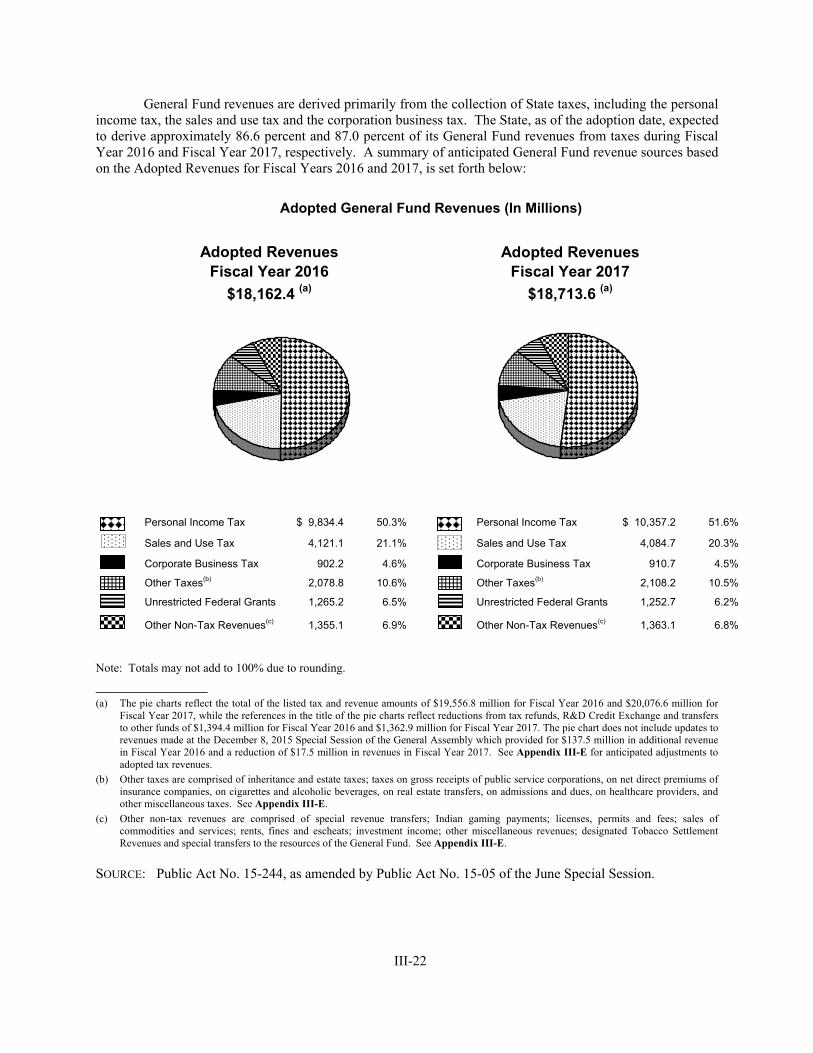
III-22
Adopted Revenues Fiscal Year 2016
$18,162.4 (a)
Adopted Revenues Fiscal Year 2017
$18,713.6 (a)
General Fund revenues are derived primarily from the collection of State taxes, including the personal income tax, the sales and use tax and the corporation business tax. The State, as of the adoption date, expected to derive approximately 86.6 percent and 87.0 percent of its General Fund revenues from taxes during Fiscal Year 2016 and Fiscal Year 2017, respectively. A summary of anticipated General Fund revenue sources based on the Adopted Revenues for Fiscal Years 2016 and 2017, is set forth below:
Adopted General Fund Revenues (In Millions)
Personal Income Tax $ 9,834.4 50.3% Personal Income Tax $ 10,357.2 51.6%
Sales and Use Tax 4,121.1 21.1% Sales and Use Tax 4,084.7 20.3%
Corporate Business Tax 902.2 4.6% Corporate Business Tax 910.7 4.5%
Other Taxes(b) 2,078.8 10.6% Other Taxes(b) 2,108.2 10.5%
Unrestricted Federal Grants 1,265.2 6.5% Unrestricted Federal Grants 1,252.7 6.2%
Other Non-Tax Revenues(c) 1,355.1 6.9% Other Non-Tax Revenues(c) 1,363.1 6.8%
Note: Totals may not add to 100% due to rounding.
______________
(a) The pie charts reflect the total of the listed tax and revenue amounts of $19,556.8 million for Fiscal Year 2016 and $20,076.6 million for Fiscal Year 2017, while the references in the title of the pie charts reflect reductions from tax refunds, R&D Credit Exchange and transfers to other funds of $1,394.4 million for Fiscal Year 2016 and $1,362.9 million for Fiscal Year 2017. The pie chart does not include updates to revenues made at the December 8, 2015 Special Session of the General Assembly which provided for $137.5 million in additional revenue in Fiscal Year 2016 and a reduction of $17.5 million in revenues in Fiscal Year 2017. See Appendix III-E for anticipated adjustments to adopted tax revenues.
(b) Other taxes are comprised of inheritance and estate taxes; taxes on gross receipts of public service corporations, on net direct premiums of insurance companies, on cigarettes and alcoholic beverages, on real estate transfers, on admissions and dues, on healthcare providers, and other miscellaneous taxes. See Appendix III-E.
(c) Other non-tax revenues are comprised of special revenue transfers; Indian gaming payments; licenses, permits and fees; sales of commodities and services; rents, fines and escheats; investment income; other miscellaneous revenues; designated Tobacco Settlement Revenues and special transfers to the resources of the General Fund. See Appendix III-E.
SOURCE: Public Act No. 15-244, as amended by Public Act No. 15-05 of the June Special Session.

III-23
Historical General Fund Revenues. Actual General Fund revenues for Fiscal Years 2011 through 2015 are set forth in Appendix III-D to this Annual Information Statement. A summary of the composition of General Fund gross revenues for the last five fiscal years is illustrated below:
General Fund Revenues(a) Fiscal Year Ending June 30
(In Thousands)
______________ (a) The bar graph reflects the gross listed tax and revenue amounts and does not reflect the listed adjustments for tax credits and refunds and transfers to or from other funds.
See Appendix III-D for adjustments to revenues.
(b) Other taxes are comprised of inheritance and estate taxes; taxes on gross receipts of public service corporations, on net direct premiums of insurance companies, on oil companies, on cigarettes and alcoholic beverages, on real estate transfers, on admissions and dues, on healthcare providers; electric generation and other miscellaneous taxes.
(c) Other non-tax revenues are comprised of special revenue transfers; Indian gaming payments; licenses, permits and fees; sales of commodities and services; rents, fines and escheats; investment income; other miscellaneous revenues; designated Tobacco Settlement Revenues and special transfers to the resources of the General Fund less refunds of payments.
(d) Totals do not include the release of the reserved fund balance in the amount of $449,868,589.
(e) Beginning with Fiscal Year 2014, the State significantly altered the manner in which it handles federal Medicaid grants for budget and accounting purposes. Previously, the State appropriated Medicaid expenditures on a gross basis within the Department of Social Services, and reflected any federal reimbursements related to those expenditures as revenues, resulting in both the State and federal share of Medicaid costs being included in the State appropriation for Medicaid. Beginning with Fiscal Year 2014, the State commenced net budgeting Medicaid expenditures within the Department of Social Services, resulting in only the State’s share of Medicaid expenditures being appropriated.
(f) The Fiscal Year 2014 amount includes $598.5 million in GAAP Conversion Bonds, the proceeds of which were used to reduce the cumulative GAAP deficit of the state.
SOURCE: 2011, 2012, 2013, 2014 and 2015 Annual Reports of the State Comptroller.
2011 2012 2013 2014 2015
Taxes: Personal Income Tax ................ $ 7,246,431 $ 8,310,820 $ 8,719,245 $ 8,718,659 $ 9,151,037 Sales Tax .................................. 3,353,230 3,830,117 3,896,998 4,100,564 4,205,051 Corporate Business Tax ............ 794,473 716,522 742,515 782,239 814,805 Other Taxes(b) ........................... 1,619,985 2,055,644 2,343,005 1,909,126 1,792,973 Subtotal ............................... $13,014,119 $14,913,103 $15,701,763 $15,510,588 $15,963,866 R & D Credit Exchange………. (8,598) (3,563) (4,086) (5,055) (7,878) Refunds of Taxes ...................... (956,054) (1,105,171) (1,144,993) (1,182,397) (1,163,639) Total Net Taxes .................. $12,049,467 $13,804,369 $14,552,684 $14,323,136 $14,792,349 Other Revenue: Federal Grants (Unrestricted) .........................
$ 4,235,178
$ 3,607,163
$ 3,733,909
$ 1,243,861(e)
$ 1,241,244(e)
Other Non-Tax Revenues(c) ...... 1,273,290 1,207,800 1,143,366 1,229,032 1,174,912 Transfers to Other Funds .......... (61,800) (61,800) (128,028) (61,800) (61,780) Transfers from Other Funds ...... 211,319 4,101 103,100 873,828(f) 135,313 Total Other Revenues .......... $ 5,657,987 $ 4,757,264 $ 4,852,347 $ 3,284,921 $ 2,489,689 Total Revenues ................... $17,707,454(d) $18,561,633 $19,405,031 $17,608,057 $17,282,038
0
1,000,000
2,000,000
3,000,000
4,000,000
5,000,000
6,000,000
7,000,000
8,000,000
9,000,000
10,000,000
2011 2012 2013 2014 2015
Personal Income Tax Sales and Use Tax Unrestricted Federal Grants Other Taxes Other Non-Tax Revenues Corporate Business Tax
$

III-24
Components of Revenue
Personal Income Tax. The State imposes a Personal Income Tax on the income of residents of the State (including resident trusts and estates), part-year residents and certain non-residents who have taxable income derived from or connected with sources within Connecticut. The current tax is imposed on a graduated scale, with a maximum rate of 6.99%, on Connecticut taxable income. Depending on federal income tax filing status, the taxable year and Connecticut adjusted gross income, personal exemptions are available to taxpayers, ranging from $12,000 to $24,000, with the lower-end of the range increasing annually to $15,000 by taxable year 2016 for certain taxpayers. In addition, tax credits ranging from 1% to 75% of a taxpayer’s Connecticut tax liability are also available depending upon federal income tax filing status, the taxable year and Connecticut adjusted gross income. Such exemptions and tax credits are phased out at higher income levels. Under the current structure, the top rate increases to 6.99% with a rate of 3% applicable to taxable income up to certain amounts. The first $20,000 of taxable income for a joint filer and the first $10,000 of taxable income for a single filer is taxed at the 3% rate, rising thereafter to 6.99%. Lower rates are phased out for all filers who exceed certain income thresholds. An income tax credit for property taxes paid of $500 per filer for tax years beginning on or after January 1, 2006, was decreased to $300 per filer for tax years beginning on or after January 1, 2011, and to $200 per filer for tax years beginning on or after January 1, 2016. Taxpayers also are subject to a Connecticut minimum tax, based on their liability, if any, for payment of the federal alternative minimum tax. Neither the personal exemption nor the tax credits described above are available to trusts or estates.
Sales and Use Taxes. A Sales Tax is imposed, subject to certain limitations, on the gross receipts from certain transactions within the State of persons engaged in business in the State, including (a) retail sales of tangible personal property, (b) the rendering of certain services, (c) the leasing or rental of tangible personal property, (d) the production, fabrication, processing, printing, or imprinting of tangible personal property to special order or with materials furnished by the consumer, (e) the furnishing, preparation or serving of food, meals, or drinks, and (f) hotel or lodging house rooms for a period not exceeding thirty consecutive calendar days. A Use Tax is imposed, with certain exceptions, on the consideration paid for certain services or purchases or rentals of tangible personal property used within the State pursuant to a transaction not subject to the Sales Tax. The tax rate for each of the Sales and Use Taxes is 6.35%. A separate rate of 15% is charged on the occupancy of hotel rooms. Various exemptions from the Sales and Use Taxes are provided, based on the nature, use or price of the property or services involved or the identity of the purchaser. Tax returns and accompanying payments with respect to these taxes are generally due monthly on or before the last day of the month next succeeding the taxable month.
Corporation Business Taxes. A Corporation Business Tax is imposed on any corporation, joint stock company or association, any dissolved corporation that continues to conduct business, any electric distribution company or fiduciary of any of the foregoing that carries on or has the right to carry on business within the State, owns or leases property, maintains an office within the State, or is a general partner in a partnership or a limited partner in a limited partnership, except an investment partnership, which does business, owns or leases property or maintains an office within the State. Certain financial services companies and domestic insurance companies are exempt from this tax. Corporations compute their tax liability under three methods, determine which calculation produces the greatest tax, and pay that amount to the State.
• The first method of computing the Corporation Business Tax is a tax measured by the net income of a taxpayer (the “Income-Base Tax”). Net income means federal gross income with limited variations less certain deductions, most of which correspond to the deductions allowed under the Internal Revenue Code of 1986, as amended. The Income-Base Tax is at a rate of 7.5% for taxable years commencing on and after January 1, 2000.
• The second method of computing the Corporation Business Tax is a tax on capital. This tax is determined either as a specific maximum dollar amount or at a flat rate on a defined base, usually related in whole or in part to the corporation’s capital stock and balance sheet surplus, profit and deficit.
III-25
• The third method of computing the Corporation Business Tax is a minimum tax in the amount of $250.
The State limits corporation credits from reducing tax liability by more than 50.01% for most credits. The State imposed a corporation business tax surcharge of 10% for income years 2009, 2010 and 2011 for businesses with over $100 million in federal adjusted gross income, and increased it to 20% for tax years 2012 through 2017. Under current law, the surcharge will decrease to 10% for income year 2018 and phase out completely for income year 2019.
A $250 charge is levied on LLCs, LLPs and S corporations. The tax extends to single-member LLCs that are not considered entities separate from their owners for federal tax purposes. Beginning with taxable year 2013, this tax is due biennially.
Other Taxes. Other tax revenues are derived from inheritance and estate taxes; taxes on gross receipts of public service corporations, on net direct premiums of insurance companies, on cigarettes and alcoholic beverages, on real estate transfers, on admissions and dues, on healthcare providers; and other miscellaneous taxes.
Federal Grants. Depending upon the particular program being funded, federal grants-in-aid are normally conditioned, to some degree, on resources provided by the State. Most unrestricted federal grant revenue is based on expenditures. The largest components of federal grants in Fiscal Year 2015 were related to medical assistance provided to low income individuals under Medicaid and temporary assistance for needy families. The State also receives certain restricted federal grants that are not reflected in annual appropriations but that nonetheless are accounted for in the General Fund. In addition, the State receives certain federal grants that are not accounted for in the General Fund but are allocated to the Special Transportation Fund, various Capital Project Funds and other funds.
For the periods presented in this Annual Information Statement, three matters affect comparability.
• The American Recovery and Reinvestment Act (“ARRA”) provided the State with increased Medicaid and Title IV-E (foster care) grants as well as new funding for education, transportation, and other general government functions in Fiscal Years 2009, 2010 and 2011.
• Beginning with Fiscal Year 2014, the State significantly altered the manner in which it handles federal Medicaid grants for budget and accounting purposes. Previously, the State appropriated Medicaid expenditures on a gross basis within the Department of Social Services, and reflected any federal reimbursements related to those expenditures as revenues, resulting in both the State and federal share of Medicaid costs being included in the State appropriation for Medicaid. Beginning with Fiscal Year 2014, the State commenced net budgeting Medicaid expenditures within the Department of Social Services, resulting in only the State’s share of Medicaid expenditures being appropriated. These changes reduced both appropriations and revenues by $2,768.7 million in Fiscal Year 2014 and $3,204.9 million in Fiscal Year 2015, compared to the prior method.
• Beginning January 1, 2014, the federal Affordable Care Act increased income eligibility under Medicaid from 53% of the federal poverty level to 133% of the federal poverty level, referred to as Medicaid expansion. The expansion of Medicaid will be off-budget and funded entirely from federal revenue. Effective April 1, 2010, Connecticut was the first state in the nation to expand its Medicaid program under the Affordable Care Act by extending Medicaid coverage to low-income childless adults with incomes up to 53% of the federal poverty level. Until that time, the State operated a more limited health benefit program serving approximately 45,000 low-income adults. Enrollment under the April 1, 2010 expansion greatly exceeded expectations and led to a doubling of the previous program’s caseload in

III-26
only three years, resulting in considerable unbudgeted costs that the State was forced to address mid-year. Beginning January 1, 2014, the federal government assumed full financial responsibility for costs associated with serving these populations under the Affordable Care Act. As a result, it is expected that this shift will mean not only that the State will realize annualized net budgetary savings of more than $400 million, but will also eliminate from State budgetary responsibility the program component that has been the least predictable and the most responsible for expenditure overruns for the past three years.
Other Non-Tax Revenues. Other non-tax revenues are derived from special revenue transfers; Indian gaming payments; licenses, permits and fees; sales of commodities and services; rents, fines and escheats; investment income; other miscellaneous revenue sources; and designated Tobacco Settlement Revenues.
General Fund Expenditures
Appropriated and Historical Expenditures
Fiscal Year 2016 and 2017 Appropriated Expenditures. State expenditures are categorized for budget and appropriation purposes under ten functional headings, with expenditures by agency generally shown as subheadings in the following functional categories, listed in order of magnitude of expenditure for the current budget biennium: Human Services; Education, Libraries and Museums; Non-Functional (debt service and miscellaneous expenditures including fringe benefits); Health and Hospitals; Corrections; General Government; Judicial; Regulation and Protection; Conservation and Development; and Legislative. State expenditures for Department of Transportation functions are generally paid from the Special Transportation Fund, although minor expenditures for transportation related expenditures are occasionally paid from the General Fund. See – OTHER FUNDS, DEBT AND LIABILITIES - Special Transportation Fund and Debt herein.
The final financial budgetary-basis results for Fiscal Year 2015, the adopted and estimated (as of December 31, 2015) budget for Fiscal Year 2016 and the adopted budget for Fiscal Year 2017 are included as Appendix III-E to this Annual Information Statement. A summary of appropriated General Fund expenditures for Fiscal Years 2016 and 2017 is set forth below.
.

III-27
Appropriated Expenditures Fiscal Year 2016
$18,161.6 (a)
Appropriated Expenditures Fiscal Year 2017
$18,711.2 (a)
Appropriated General Fund Expenditures (In Millions)
______________
(a) The pie charts reflect the total listed expenditures of $18,362.1 million for Fiscal Year 2016 and $18,916.9 million for Fiscal Year 2017, while the references in the title of the pie charts reflect adjustments for unallocated lapses of $200.5 million for Fiscal Year 2016 and $205.7 million for Fiscal Year 2017. The pie chart does not include updates to expenditures made at the December 8, 2015 Special Session of the General Assembly which reduced appropriated expenditures by $195.8 million in both Fiscal Years 2016 and 2017. See Appendix III-E for anticipated adjustments to appropriated expenditures.
(b) Other expenditures are comprised of appropriations for Regulation and Protection; Conservation and Development; and Legislative.
SOURCE: Public Act No. 15-244, as amended by Public Act No. 15-5 of the June Special Session.
Human Services $ 3,196.2 17.4% Human Services $ 3,273.8 17.3%
Education, Libraries and Museums 5,166.4 28.1% Education, Libraries and Museums 5,242.5 27.7%
Non-Functional 4,775.7 26.0% Non-Functional 5,066.9 26.8% Health and Hospitals 1,817.4 9.9% Health and Hospitals 1,872.7 9.9% Corrections 1,514.8 8.3% Corrections 1,524.2 8.1% General Government 670.0 3.7% General Government 680.5 3.6% Judicial 625.4 3.4% Judicial 647.7 3.4%
Other Expenditures(b) 596.2 3.2% Other Expenditures(b) 608.6 3.2%
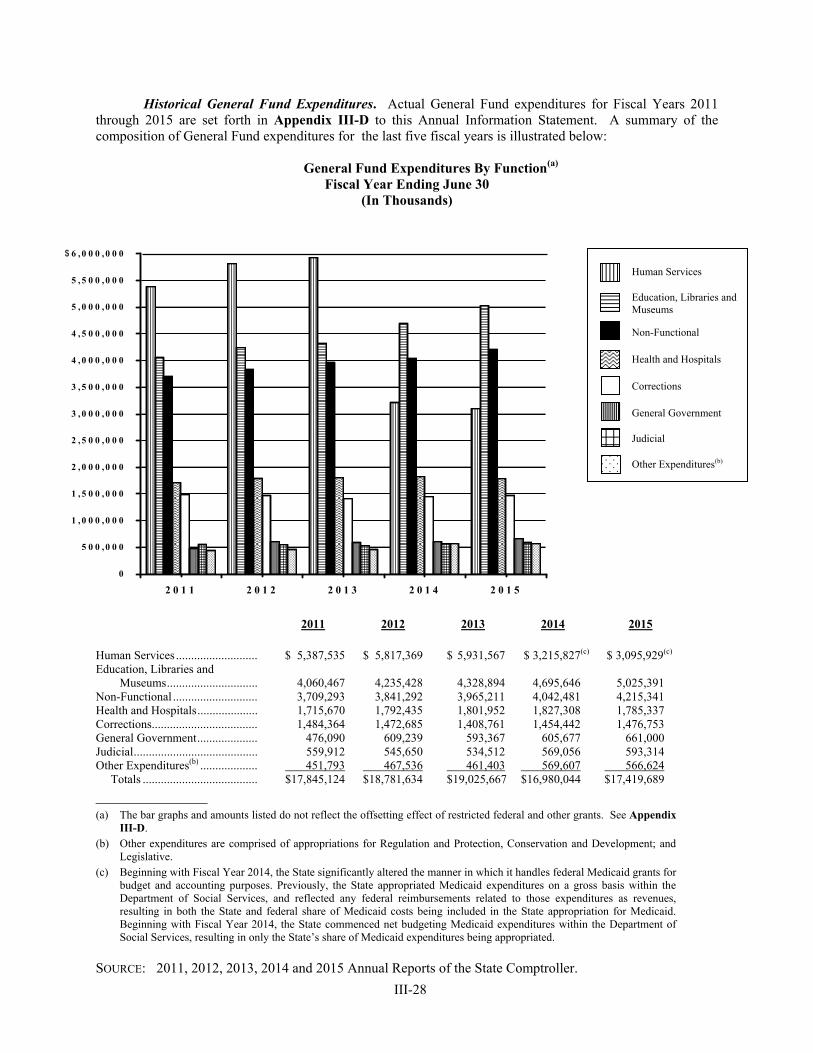
III-28
Historical General Fund Expenditures. Actual General Fund expenditures for Fiscal Years 2011 through 2015 are set forth in Appendix III-D to this Annual Information Statement. A summary of the composition of General Fund expenditures for the last five fiscal years is illustrated below:
General Fund Expenditures By Function(a)
Fiscal Year Ending June 30 (In Thousands)
2011 2012 2013 2014 2015
Human Services ........................... $ 5,387,535 $ 5,817,369 $ 5,931,567 $ 3,215,827(c) $ 3,095,929(c) Education, Libraries and Museums ..............................
4,060,467
4,235,428 4,328,894 4,695,646 5,025,391
Non-Functional ............................ 3,709,293 3,841,292 3,965,211 4,042,481 4,215,341 Health and Hospitals .................... 1,715,670 1,792,435 1,801,952 1,827,308 1,785,337 Corrections................................... 1,484,364 1,472,685 1,408,761 1,454,442 1,476,753 General Government .................... 476,090 609,239 593,367 605,677 661,000 Judicial ......................................... 559,912 545,650 534,512 569,056 593,314 Other Expenditures(b) ................... 451,793 467,536 461,403 569,607 566,624 Totals ...................................... $17,845,124 $18,781,634 $19,025,667 $16,980,044 $17,419,689
______________
(a) The bar graphs and amounts listed do not reflect the offsetting effect of restricted federal and other grants. See Appendix III-D.
(b) Other expenditures are comprised of appropriations for Regulation and Protection, Conservation and Development; and Legislative.
(c) Beginning with Fiscal Year 2014, the State significantly altered the manner in which it handles federal Medicaid grants for budget and accounting purposes. Previously, the State appropriated Medicaid expenditures on a gross basis within the Department of Social Services, and reflected any federal reimbursements related to those expenditures as revenues, resulting in both the State and federal share of Medicaid costs being included in the State appropriation for Medicaid. Beginning with Fiscal Year 2014, the State commenced net budgeting Medicaid expenditures within the Department of Social Services, resulting in only the State’s share of Medicaid expenditures being appropriated.
SOURCE: 2011, 2012, 2013, 2014 and 2015 Annual Reports of the State Comptroller.
0
5 0 0 , 0 0 0
1 , 0 0 0 , 0 0 0
1 , 5 0 0 , 0 0 0
2 , 0 0 0 , 0 0 0
2 , 5 0 0 , 0 0 0
3 , 0 0 0 , 0 0 0
3 , 5 0 0 , 0 0 0
4 , 0 0 0 , 0 0 0
4 , 5 0 0 , 0 0 0
5 , 0 0 0 , 0 0 0
5 , 5 0 0 , 0 0 0
6 , 0 0 0 , 0 0 0
2 0 1 1 2 0 1 2 2 0 1 3 2 0 1 4 2 0 1 5
Human Services
Education, Libraries and Museums
Non-Functional
Health and Hospitals
Corrections
General Government
Judicial
Other Expenditures(b)
$

III-29
Components of Expenditures
Human Services. Virtually all of the State expenditures for Human Services are allocated to the Department of Social Services for various programs and services, including Medicaid payments, Temporary Assistance to Families, and General Assistance payments. Beginning with Fiscal Year 2014, the State significantly altered the manner in which it appropriates for Medicaid. Previously, the State appropriated Medicaid expenditures on a gross basis within the Department of Social Services, and reflected any federal reimbursements related to those expenditures as revenues, resulting in both the State and federal share of Medicaid costs being included in the State appropriation for Medicaid. Beginning with Fiscal Year 2014, the State commenced net budgeting Medicaid expenditures within the Department of Social Services, resulting in only the State’s share of payments to private Medicaid providers being appropriated. These changes reduced both appropriations and revenues by $2,768.7 million in Fiscal Year 2014 and $3,204.9 million in Fiscal Year 2015 compared to current services.
Education, Libraries and Museums. The majority of State expenditures for Education, Libraries and Museums is allocated to the Department of Education, the largest share of which consists of payments to local governments. The remaining consists of expenditures for higher education (including the University of Connecticut, the Board of Regents and Financial & Academic Affairs for Higher Education), the Office of Early Childhood Education, the Teachers’ Retirement Board and the State Library.
Non-Functional. Non-Functional State expenditures consist of debt service payments, State employee fringe benefit accounts and other miscellaneous appropriations.
Health and Hospitals. State expenditures for Health and Hospitals are allocated primarily for programs and services provided by the State Departments of Public Health, Developmental Services, and Mental Health and Addiction Services.
Corrections. Appropriations to the State Department of Correction and the Department of Children and Families comprise the largest portion of State expenditures for Corrections.
General Government. State expenditures for General Government may be classified into three categories: executive, financial administration and legal, the largest of which is expenditures for financial administration. Such expenditures are primarily for salaries and other miscellaneous expenses of various State departments.
Judicial. Judicial expenditures are comprised of salaries, expenses and payments for special programs of the Judicial Department and the Public Defender Services Commission.
Regulation and Protection. State expenditures for Regulation and Protection consist primarily of appropriations for the Department of Public Safety for salaries, equipment, training and other services and expenses. Other agencies and programs for which appropriations are made include the Police Officer Standards and Training Council, the Board of Firearms Permit Examiners, the Military Department, the Commission on Fire Prevention and Control, the Department of Consumer Protection, the Department of Labor, the Commission on Human Rights and Opportunities, the Office of Protection and Advocacy for Persons with Disabilities, and the Office of the Child Advocate.
Conservation and Development. State expenditures for Conservation and Development fall into three general categories: agriculture; development of housing, historical sites, commerce and industry; and environment.
Legislative. Legislative expenditures are comprised primarily of salaries, equipment and other expenses necessary for Legislative Management and the Auditors of Public Accounts.

III-30
Expenditures by Type
General Fund appropriations and the corresponding State expenditures are categorized for both administrative and budgetary purposes based on the type of appropriation. Appropriation account types may be grouped conceptually into two broad categories: payments to third parties and costs of State administration. Payments to third parties consist of two major appropriation account types: payments to local governments and payments to parties other than local governments (which include debt service payments for purposes of Table 1; see footnote g to Table 1 below). Such payments to third parties amount to approximately 58.2% of total General Fund expenditures for Fiscal Year 2015. Costs of State administration consist of three major appropriation account types: personal services, equipment, and other expenses. These expenditures are used directly to operate the facilities and programs of State agencies and include such items as salaries, wages, pension and other benefits for State employees; utility and fuel costs; food; institutional and office supplies; equipment; rent for office space and other facilities; and other current expenses. Appropriations for costs of State administration represent approximately 56.8% of all General Fund appropriations under the revised adopted budget for Fiscal Year 2016.
Appropriations categorized as payments to third parties are generally referred to for budgetary purposes as “fixed charges.” Contractually required payments to third parties include debt service payments. Statutorily required payments to third parties include grants to local governments and individual beneficiaries under a wide variety of programs established by statute. The amount of such payments is generally either specifically set forth in the statutes for such payment or is calculated in accordance with a formula set forth in such statutes. Despite the characterization of these statutorily determined payments to third parties as “fixed charges,” the Governor’s budgetary recommendations routinely include proposed modifications in the amounts and formulas for calculating the amounts of such appropriations, and such modifications are often adopted by the General Assembly. A summary of fixed charges is shown below. This summary includes a breakdown of total fixed charges into payments to local governments and total payments, as well as information as to the most significant types of expenditures in each category.
TABLE 1(a)(b)
Fixed Charges - General Fund Summarized by Function of Government and Expenditure Category
Including Major Expenditure Items (In Thousands of Dollars)
Fiscal Year 2014 (Actual)
Fiscal Year 2015 (Unaudited)
Fiscal Year 2016 (Appropriated)
Total
Payments
Payments to Local
Governments Total
Payments
Payments to Local
Governments Total
Payments
Payments to Local
Governments
LEGISLATIVE Total – Legislative .......................... 545 0 220 0 574 0
GENERAL GOVERNMENT Tax Relief for Elderly Renters(c) ........ 0 0 25,305 0 26,700 0 Property Tax Relief Elderly Circuit
Breaker ........................................... 20,506 20,506 20,506 20,506 20,506 20,506 Reimbursement to Towns for Loss
of Taxes on State Property(e) .......... 73,642 73,642 83,642 83,642 83,642 83,642 Reimbursement to Towns for Loss
of Taxes on Private Tax-exempt Property .......................................... 115,432 115,432 125,432 125,432 125,432 125,432
Undesignated ..................................... 14,845 14,360 15,285 14,817 9,862 9,290
Total – General Government .......... 224,424 223,939 270,169 244,396 266,142 238,869

III-31
Fiscal Year 2014
(Actual) Fiscal Year 2015
(Unaudited) Fiscal Year 2016
(Appropriated)
Total
Payments
Payments to Local
Governments Total
Payments
Payments to Local
Governments Total
Payments
Payments to Local
Governments REGULATION AND PROTECTION
Total - Regulation and Protection ...... 1,032 0 995 0 925 0
CONSERVATION AND DEVELOPMENT
Total - Conservation and Development .................................. 102,406 8,584 88,041 8,256 94,390 5,893
HEALTH AND HOSPITALS Employment Opportunities and Day
Services (Dept. of Developmental Services) ........................................ 212,128 0 215,982 0 227,626 0
Community Residential Services (Dept. of Developmental
Services) ......................................... 440,306 0 463,611 0 483,872 0 Grants for Substance Abuse Services ........................................... 20,596 0 17,567 0 22,668 0 Grants for Mental Health Services ..... 66,135 0 58,910 0 72,280 0 Undesignated ..................................... 40,359 16,599 40,174 16,319 34,539 16,206
Total - Health and Hospitals ........... 779,524 16,599 796,244 16,319 840,986 16,206
HUMAN SERVICES Medicaid(d) ......................................... 2,451,457 0 2,347,719 0 2,468,416 0 Old Age Assistance ............................ 36,631 0 37,321 0 37,944 0 Aid to the Disabled ............................ 60,396 0 59,933 0 61,116 0 Temporary Assistance to Families –
TANF ............................................. 107,076 0 102,478 0 99,425 0 Medicaid - Disproportionate Share -
Mental Health ................................. 108,935 0 108,935 0 108,935 0 Connecticut Home Care Program ...... 44,499 0 43,114 0 43,430 0 Child Care Services - TANF/CCDBG .............................. 96,452 0 5,000 0 0 0 Housing/Homeless Services ............... 5,211 0 5,211 0 0 0 State Administered General
Assistance ....................................... 19,026 0 22,702 0 23,155 0 Undesignated ..................................... 49,016 227 57,899 216 48,161 204
Total - Human Services .................. 2,978,698 227 2,790,312 216 2,890,582 204
EDUCATION, LIBRARIES AND MUSEUMS
Adult Education ................................. 19,983 19,983 20,004 20,004 21,035 21,035 Transportation of School Children ..... 24,885 24,885 24,885 24,885 23,329 23,329 Education Equalization Grants ........... 2,067,196 2,067,196 2,122,677 2,122,677 2,155,834 2,155,834 Priority School Districts ..................... 47,427 47,427 46,947 46,947 43,747 43,747 Excess Cost - Student Based .............. 139,806 139,806 139,830 139,830 139,806 139,806 Open Choice Program ........................ 30,488 30,488 32,990 32,990 38,296 38,296 Magnet Schools .................................. 287,172 287,172 310,660 310,660 328,420 328,420 Child Care Services – TANF/CCDBG(e) ............................... 0 0 104,776 0 120,930 0 Connecticut Aid for Public College Students .......................................... 39,642 0 40,993 0 39,638 0 Teachers' Retirement Contributions ... 948,540 0 984,110 0 975,578 0 Undesignated ..................................... 169,954 116,884 183,131 127,633 187,951 129,829
Total – Education ............................ 3,775,093 2,733,841 4,011,003 2,825,626 4,074,565 2,880,296
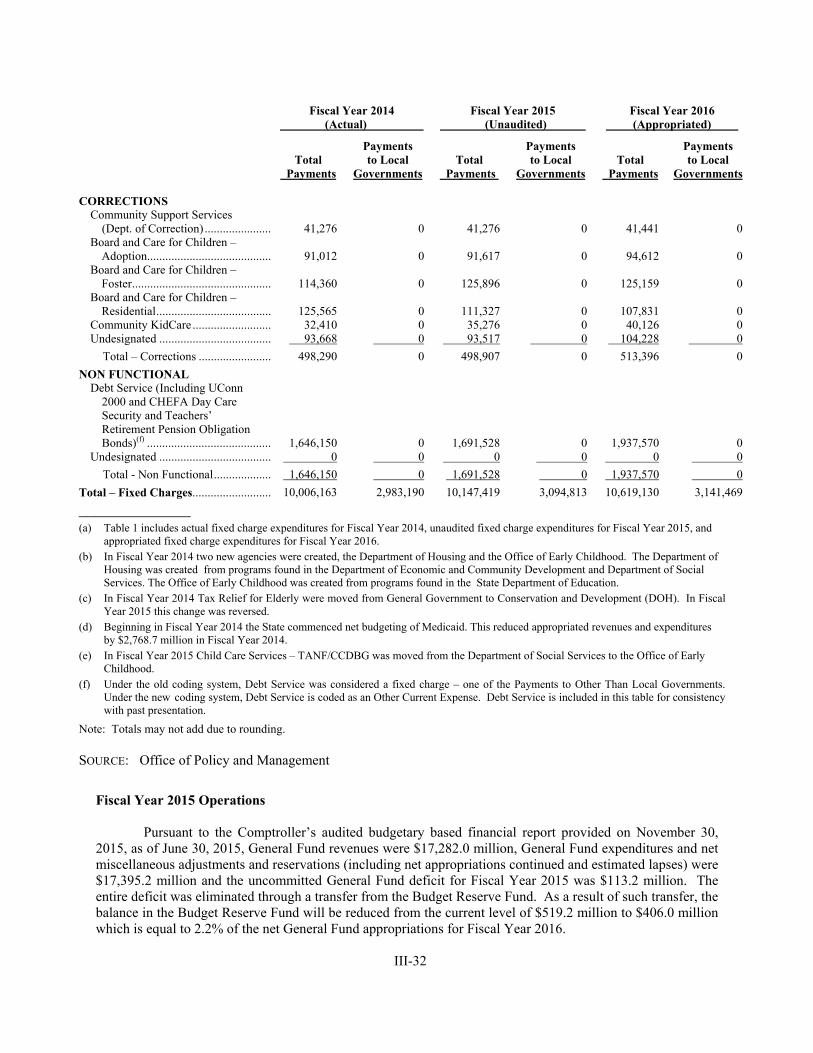
III-32
Fiscal Year 2014
(Actual) Fiscal Year 2015
(Unaudited) Fiscal Year 2016
(Appropriated)
Total
Payments
Payments to Local
Governments Total
Payments
Payments to Local
Governments Total
Payments
Payments to Local
Governments
CORRECTIONS Community Support Services
(Dept. of Correction) ...................... 41,276 0 41,276 0 41,441 0 Board and Care for Children –
Adoption......................................... 91,012 0 91,617 0 94,612 0 Board and Care for Children – Foster .............................................. 114,360 0 125,896 0 125,159 0 Board and Care for Children –
Residential ...................................... 125,565 0 111,327 0 107,831 0 Community KidCare .......................... 32,410 0 35,276 0 40,126 0 Undesignated ..................................... 93,668 0 93,517 0 104,228 0
Total – Corrections ......................... 498,290 0 498,907 0 513,396 0
NON FUNCTIONAL Debt Service (Including UConn
2000 and CHEFA Day Care Security and Teachers’ Retirement Pension Obligation Bonds)(f) ......................................... 1,646,150 0 1,691,528 0 1,937,570 0
Undesignated ..................................... 0 0 0 0 0 0
Total - Non Functional .................... 1,646,150 0 1,691,528 0 1,937,570 0
Total – Fixed Charges .......................... 10,006,163 2,983,190 10,147,419 3,094,813 10,619,130 3,141,469
______________
(a) Table 1 includes actual fixed charge expenditures for Fiscal Year 2014, unaudited fixed charge expenditures for Fiscal Year 2015, and appropriated fixed charge expenditures for Fiscal Year 2016. (b) In Fiscal Year 2014 two new agencies were created, the Department of Housing and the Office of Early Childhood. The Department of Housing was created from programs found in the Department of Economic and Community Development and Department of Social Services. The Office of Early Childhood was created from programs found in the State Department of Education. (c) In Fiscal Year 2014 Tax Relief for Elderly were moved from General Government to Conservation and Development (DOH). In Fiscal Year 2015 this change was reversed. (d) Beginning in Fiscal Year 2014 the State commenced net budgeting of Medicaid. This reduced appropriated revenues and expenditures by $2,768.7 million in Fiscal Year 2014. (e) In Fiscal Year 2015 Child Care Services – TANF/CCDBG was moved from the Department of Social Services to the Office of Early
Childhood. (f) Under the old coding system, Debt Service was considered a fixed charge – one of the Payments to Other Than Local Governments. Under the new coding system, Debt Service is coded as an Other Current Expense. Debt Service is included in this table for consistency with past presentation.
Note: Totals may not add due to rounding.
SOURCE: Office of Policy and Management
Fiscal Year 2015 Operations
Pursuant to the Comptroller’s audited budgetary based financial report provided on November 30, 2015, as of June 30, 2015, General Fund revenues were $17,282.0 million, General Fund expenditures and net miscellaneous adjustments and reservations (including net appropriations continued and estimated lapses) were $17,395.2 million and the uncommitted General Fund deficit for Fiscal Year 2015 was $113.2 million. The entire deficit was eliminated through a transfer from the Budget Reserve Fund. As a result of such transfer, the balance in the Budget Reserve Fund will be reduced from the current level of $519.2 million to $406.0 million which is equal to 2.2% of the net General Fund appropriations for Fiscal Year 2016.

III-33
The audited results for the final Fiscal Year 2015 operations of the General Fund have been outlined in Appendix III-D to this Annual Information Statement.
Adopted Biennium Budget for Fiscal Years 2016 and 2017
On June 3, 2015, the General Assembly passed a budget bill for the biennium ending June 30, 2017, subsequently amended during a June Special Session. The Governor signed the budget bill as amended by various implementer legislation into law. The act made General Fund appropriations of $18,161.6 million in Fiscal Year 2016, which represented 3.9% growth over Fiscal Year 2015 appropriations, and $18,711.2 million in Fiscal Year 2017. The budget projected General Fund revenues of $18,162.4 million in Fiscal Year 2016 and $18,713.6 million in Fiscal Year 2017, resulting in a projected surplus of $0.8 million in Fiscal Year 2016 and $2.5 million in Fiscal Year 2017.
The budget bill included $802.1 million in revenue enhancements in Fiscal Year 2016 and $664.4 million in Fiscal Year 2017. The significant revenue changes included:
• An increase to the top personal income tax marginal rate
• Sales and use tax changes including the elimination of the exemption for clothing and footwear less than $50
• Limits on the use of net operating losses against the corporate tax
• Rebasing the hospital net revenue tax
• An intercept of sales and use tax revenue for the “Let’s Go CT!” transportation initiative and for property tax relief
• Beginning in Fiscal Year 2016, all revenue from the Oil Companies tax will be deposited to the Special Transportation Fund
• Eliminating the subsidy from the resources of the General Fund to the Special Transportation Fund
The significant expenditure changes as compared to current services included:
• Capping various statutory formula grants
• Programmatic and rate changes to Medicaid
• Hiring, wage and overtime savings
Section 2-33a of the Connecticut General Statutes sets out the State’s expenditure cap. The adopted budget would be $23.0 million below the expenditure cap for Fiscal Year 2016 and $106.2 million below the expenditure cap for Fiscal Year 2017, as calculated under Section 35 of the budget bill. The calculations as specified in such section made two changes in the manner in which the expenditure cap is calculated: first, the five year personal income growth rate is calculated on a calendar year rather than a fiscal year basis, and second, calculations assume that appropriations for the unfunded liabilities of the State’s retirement systems are exempt from being counted as general budget expenditures under the expenditure cap.
On December 8, 2015, the General Assembly passed Public Act No. 15-1, of the December Special Session, to make structural changes to the amended budget bill described above for Fiscal Year 2017. The Governor signed the bill into law on December 29, 2015. The bill reduced appropriated expenditures by $195.8 million in both Fiscal Year 2016 and 2017. In addition, the bill made several revenue adjustments, including the delay of the sales tax revenue diversions from the General Fund to the Municipal Revenue Sharing Account and Special Transportation Fund, expected to result in $137.5 million in additional revenue in Fiscal Year 2016. For Fiscal Year 2017, revenues were reduced by $17.5 million due to the expansion of various tax credits, modifications of the cap on unitary combined reporting method under the corporation tax, and changes to certain transfers.

III-34
See Appendix III-E of this Annual Information Statement for more information regarding the adopted budget for Fiscal Years 2016 and 2017.
Fiscal Year 2016 Operations
By statute, the State’s fiscal position is reported on or before the first day of each month by the Comptroller. Pursuant to Section 4-66 of the Connecticut General Statutes, by the twentieth day of each month, OPM provides projected estimates to the Comptroller on revenues and expenditures for the current fiscal year for use by the Comptroller in preparing the Comptroller’s monthly report. The following summarizes OPM’s and the Comptroller’s estimates of General Fund revenues; expenditures and miscellaneous adjustments (including net appropriations continued and estimated lapses); and surplus/(deficit) balance in the General Fund for the 2016 Fiscal Year as of the referenced ending period in accordance with specific budgetary basis accounting standards set forth by statute which incorporate new budgeted expenditure accruals consistent with specific statutory reporting requirements:
OPM and Comptroller Estimates Fiscal Year 2016 (in Millions)
OPM’s Report Comptroller’s Report
Period Ending:
Revenues
Expenditures(a)
Surplus/ (deficit)
Revenues
Expenditures(a)
Surplus/ (deficit)
November 30, 2015 $18,080.7 $18,080.5 $ 0.2 $18,080.7 $18,080.3 $ 0.4
December 31, 2015 18,053.9 18,046.8 7.1 18,053.9 18,047.1 6.8
January 31, 2016 18,053.9 18,073.8 (19.9) N/A(b) N/A(b) N/A(b) _______________ (a) Expenditures include net appropriations continued and estimated lapses and miscellaneous adjustments. (b) Estimates are expected March 1, 2016 and not yet available.
The Office of Policy and Management’s estimate for the Fiscal Year 2016 operations of the General Fund (as of the period ending December 31, 2015) has been outlined in Appendix III-E to this Annual Information Statement. The next monthly report of OPM is expected on March 21, 2016 and the next monthly report of the Comptroller is expected on March 1, 2016. The projections discussed above are only estimates and no assurances can be given that future events will materialize as estimated, or that subsequent estimates or adjustments by OPM, the Comptroller or other State agencies will not reflect changes in the estimated or final result of Fiscal Year 2016 operations of the General Fund. In addition, adjustments or audit or actions of the State may also result in changes in the final result of Fiscal Year 2016 operations of the General Fund.
Forecasted Operation
Consensus Revenue Estimates. Pursuant to Section 2-36c of the Connecticut General Statutes, on January 15, 2016, OPM and the Legislature’s Office of Fiscal Analysis issued their consensus revision to their November 10, 2015 consensus revenue estimates for the current fiscal year and the three ensuing fiscal years as follows:
General Fund Consensus Revenue Estimate (in Millions)
Fiscal Year 2016 2017 2018 2019 2020
Revenue Estimate ............... $17,944.9 $18,311.8 $18,530.9 $19,066.6 $19,628.7

III-35
The projections in the consensus revenue estimates are only estimates and no assurances can be given that future events will materialize as estimated or that subsequent estimates, adjustments or actions of the State will not indicate changes in the final results of the fiscal years reported.
Fiscal Accountability Report. On November 13, 2015, OPM and the Legislature’s Office of Fiscal Analysis each submitted a fiscal accountability report projecting the ending balance in the General Fund for Fiscal Year 2016 and the four ensuing fiscal years as follows:
General Fund Operating Surplus/(Deficit) Projections (In Millions)
Fiscal Year 2016 2017 2018 2019 2020
Office of Policy and Management .............. $ (122.4) $ (508.1) $ (1,283.0) $ (1,231.8) $ (1,428.3)Office of Fiscal Analysis ............................ $ (254.4) $ (552.0) $ (1,722.8) $ (1,872.9) $ (2,211.5)
The difference between the projections of the two offices reflects differences in methodology. The projections in the OPM report were based upon a current practices approach and assume the continuation of certain budgetary policies that have been customarily enacted in prior years. The projections in the Legislature’s Office of Fiscal Analysis report were based on current services.
OPM and the Legislature’s Office of Fiscal Analysis also projected the amounts by which the estimates of the expenditures would be below or above the State’s expenditure cap as follows:
Projection of Amounts Above/(Below) Expenditure Cap (In Millions)
Fiscal Year 2017 2018 2019 2020
Office of Policy and Management .................... $ (78.6) $ 149.4 $ 169.2 $ 19.8 Office of Fiscal Analysis .................................. $ 2.1 $ 629.1 $ 685.3 $ 625.1
The reports also estimate general obligation bond authorizations, allocations, issuance and debt service for the current fiscal year and succeeding four fiscal years. The reports estimated fairly stable general obligation bond issuances over the five year period of $2.0 billion with the expenditure on debt service generally gradually increasing over such period.
The projections of OPM and the Legislature’s Office of Fiscal Analysis are only estimates and no assurances can be given that future events will materialize as estimated, or that subsequent estimates, adjustments or actions of the State will not reflect changes in the operations of the General Fund or in the estimated or final results of such fiscal years. In addition, the State has a balanced budget requirement and an expenditure cap as discussed at Page III-7 under the heading The Budgetary Process – Balanced Budget Requirement. As such, budgets adopted for future fiscal years will need to comply with those requirements. As a result, the figures included in the report do not represent a projection of the actual financial results that might be expected, but instead serve as a planning tool.
Governor’s Midterm Budget Revisions for Fiscal Year 2017 Per Section 4-71 of the Connecticut General Statutes, the Governor is required to submit a status report to the General Assembly on the biennial budget enacted in the previous year. The status report shall include any recommendations for adjustments and revisions to the enacted budget. On February 3, 2016, the Governor presented to the General Assembly a status report including detailed projections of expenditures and revenues and proposed midterm budget revisions for Fiscal Year 2017. This proposal closed an approximate

III-36
$560 million shortfall between the originally adopted budget for Fiscal Year 2017 and the latest consensus revenue estimate issued on January 15, 2016. For Fiscal Year 2017, General Fund revenues are projected to be $18,152.3 million and General Fund appropriations total $18,141.7 million, resulting in a projected surplus of $10.6 million. Under the Governor’s proposal, General Fund appropriations would grow by 0.4% over estimated expenditures for Fiscal Year 2016. The Governor’s proposed midterm budget revisions addresses the projected shortfall in three ways. First, the Governor proposes to roll-forward the Fiscal Year 2016 savings that are expected from the December 2015 deficit mitigation plan totaling $90.5 million. Second, the Governor’s proposal identifies specific budget reductions in Fiscal Year 2017 totaling $118.2 million. Finally, the Governor’s proposal calls for an across-the-board reduction of 5.75% from most agency accounts totaling $360.8 million. These across-the-board reductions would not be applied to the Education Cost Sharing formula for municipal aid, entitlements, debt service and fringe benefits. In effectuating the across-the-board reductions, the Governor is proposing to combine appropriated line items in the budget of each agency in order to give agencies greater flexibility in achieving their savings target. Further, the Governor is proposing that most fringe benefit costs be allocated to each agency instead of being budgeted centrally as is current practice in order to more accurately reflect the true cost of agency operations. Article XXVIII of the Amendments to the Constitution of the State of Connecticut and Section 2-33a of the Connecticut General Statutes set out the State’s expenditure cap. The Governor’s budget proposal would be below the expenditure cap for Fiscal Year 2017 by $648.9 million. The Governor’s proposed budget also includes $279.0 million in new general obligation bond authorizations, offset with cancellations of $385.4 million in prior bond authorizations, resulting in a net decrease in general obligation bond authorizations of $106.4 million in Fiscal Year 2017. The largest proposed new authorization is $181 million for renovations of the State Office Building in Hartford along with a new parking garage. The largest cancellation totals $151.5 million for the unissued portion of the GAAP deficit bonds authorized in 2013. Cancellation of prior authorizations were necessary to remain below ninety percent of the State’s debt limit given the downward revision to the State’s revenue forecast as part of the January 15, 2016 consensus revenue estimate. Deliberations on the Governor’s budget recommendations are expected to continue throughout the legislative session with a scheduled adjournment date of May 4, 2016. See Appendix III-E of this Part II for more information regarding the Governor’s Proposed Midterm Budget Revisions.
State Economic Initiatives
The General Assembly has enacted formal programs targeted at encouraging economic growth within the State. Below is a summary of certain of these programs, including several new initiatives.
First Five. Legislation passed in 2011 allowed the State’s existing incentive and tax credit programs to be combined and augmented in order to create incentive packages for the first five companies that promise to either create not less than 200 new jobs within two years or invest not less than $25 million and create not less than 200 new jobs within five years. Eight companies including Cigna, ESPN, NBC Sports and Bridgewater Associates have agreed to participate in this program, pledging to create over 1,050 combined jobs in Connecticut in return for $132.45 million in forgivable loans, grants, and tax credits from the State and potential further tax credits depending on expenditure levels of certain of the companies. After securing these commitments, legislation was passed to expand the program to allow incentives to be bundled in this manner for up to 15 companies.
III-37
Bioscience Connecticut. Legislation was passed in 2011 to expand the University of Connecticut Health Center (“Health Center”) by making programmatic changes, providing State funding for expansion (including the construction of a new patient tower and renovation of existing facilities), and setting the framework for strengthening research capabilities in the State, including at the Health Center. Later in 2011, the State passed legislation to expand this initiative into an effort to promote the expansion of the bioscience industries in the State. The State reached an agreement to collaborate with Jackson Laboratory, the University of Connecticut, and Yale University for the construction of a new research laboratory on the Health Center campus with a particular focus on personalized medicine. The State is providing $290.7 million in support for this project over ten years, with $145 million in the form of a secured, forgivable construction loan; $46.7 million in the form of a secured, forgivable equipment loan; and $99 million in research partnership funding. These funds are to be provided through the issuance of general obligation bonds over the next ten years. The Jackson Laboratory project is expected to generate short-term construction jobs in addition to 6,800 permanent jobs over the next 20 years. No assurances can be given that future events will materialize as estimated or that subsequent estimates, adjustments, legislative actions, or other events will not indicate changes in the final results of this initiative.
Bioscience Innovation Fund. Legislation passed in 2013 which, in concert with the Bioscience Initiative above, would support the State's growing bioscience sector by strengthening the State’s capacity to create competitive investment tools and attract additional federal and private dollars. The State will invest $200 million in the new Bioscience Innovation Fund over ten years which will be administered by Connecticut Innovations, Inc.
Economic and Manufacturing Assistance Act. Since 1990, the Economic and Manufacturing Assistance Act program has been one of the State’s primary economic development incentive tools. The program provides incentive-driven direct loans for projects with strong economic development potential. The loan funds may be used for the planning of a municipal development project or business development project; the acquisition of real property, machinery or equipment; the construction of site and infrastructure improvements relating to a municipal development or business development project; the construction, renovation and demolition of buildings; relocation expenses for the purpose of assisting an eligible business to locate, construct, renovate or acquire a facility; or such other reasonable expenses necessary or appropriate for the initiation, implementation and completion of the project, including administrative expenses and business support services such as labor training, day care, energy conservation, and pollution control and recycling.
Small Business Assistance Revolving Loan Program. Legislation passed in 2010 provides for loans and lines of credit for businesses with less than 100 employees. The program provides financing of up to $500,000 per business at 4% interest for up to ten years and is capped at $15 million of such loans and lines of credit outstanding at any time.
Small Business Express Program. Legislation passed in 2011 created a program to support the retention and growth of small businesses with 50 or fewer employees through a streamlined process that provides financial assistance in the form of revolving loans, job creation incentives, and matching grants. Loans are available from the revolving loan fund for a maximum of $100,000 per loan to assist small businesses with capital and operational needs. Job creation incentive loans of up to $250,000 per loan are also available to assist small businesses to spur growth, and payments on these loans may be deferred or forgiven if certain prescribed job creation goals are attained. A matching grant component provides grants up to $100,000 per grant to small businesses for training, working capital, acquisition of machinery and equipment, construction or leasehold improvements, relocation within the State, or other authorized expenses so long as the small business matches any funds awarded to it under this program.
Subsidized Training and Employment Program. Legislation passed in 2011 provides for job creation incentives to employers to expand opportunities for unemployed workers. Under the program, small businesses and manufacturers with less than 50 full-time workers may receive wage and training subsidies of up to
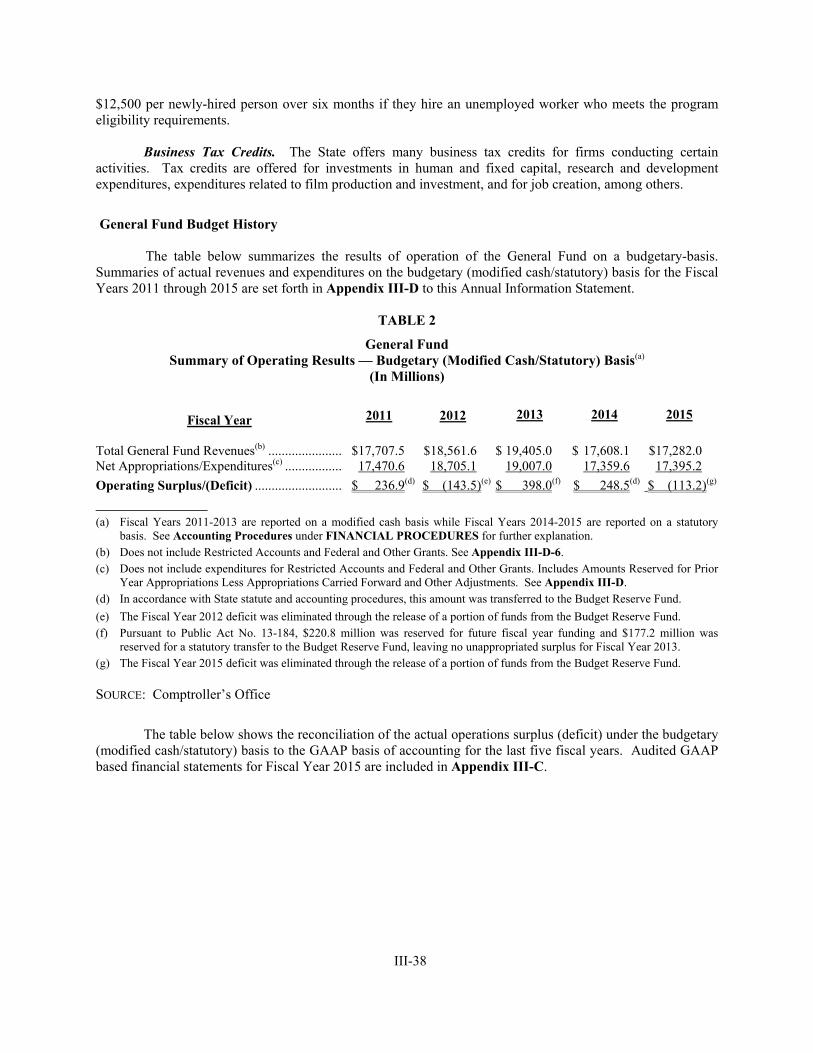
III-38
$12,500 per newly-hired person over six months if they hire an unemployed worker who meets the program eligibility requirements.
Business Tax Credits. The State offers many business tax credits for firms conducting certain activities. Tax credits are offered for investments in human and fixed capital, research and development expenditures, expenditures related to film production and investment, and for job creation, among others.
General Fund Budget History
The table below summarizes the results of operation of the General Fund on a budgetary-basis. Summaries of actual revenues and expenditures on the budgetary (modified cash/statutory) basis for the Fiscal Years 2011 through 2015 are set forth in Appendix III-D to this Annual Information Statement.
TABLE 2
General Fund Summary of Operating Results — Budgetary (Modified Cash/Statutory) Basis(a)
(In Millions)
Fiscal Year 2011 2012 2013 2014 2015
Total General Fund Revenues(b) ....................... $17,707.5 $18,561.6 $ 19,405.0 $ 17,608.1 $17,282.0 Net Appropriations/Expenditures(c) .................. 17,470.6 18,705.1 19,007.0 17,359.6 17,395.2
Operating Surplus/(Deficit) ........................... $ 236.9(d) $ (143.5)(e) $ 398.0(f) $ 248.5(d) $ (113.2)(g)
______________
(a) Fiscal Years 2011-2013 are reported on a modified cash basis while Fiscal Years 2014-2015 are reported on a statutory basis. See Accounting Procedures under FINANCIAL PROCEDURES for further explanation.
(b) Does not include Restricted Accounts and Federal and Other Grants. See Appendix III-D-6. (c) Does not include expenditures for Restricted Accounts and Federal and Other Grants. Includes Amounts Reserved for Prior
Year Appropriations Less Appropriations Carried Forward and Other Adjustments. See Appendix III-D. (d) In accordance with State statute and accounting procedures, this amount was transferred to the Budget Reserve Fund.
(e) The Fiscal Year 2012 deficit was eliminated through the release of a portion of funds from the Budget Reserve Fund. (f) Pursuant to Public Act No. 13-184, $220.8 million was reserved for future fiscal year funding and $177.2 million was
reserved for a statutory transfer to the Budget Reserve Fund, leaving no unappropriated surplus for Fiscal Year 2013. (g) The Fiscal Year 2015 deficit was eliminated through the release of a portion of funds from the Budget Reserve Fund.
SOURCE: Comptroller’s Office
The table below shows the reconciliation of the actual operations surplus (deficit) under the budgetary (modified cash/statutory) basis to the GAAP basis of accounting for the last five fiscal years. Audited GAAP based financial statements for Fiscal Year 2015 are included in Appendix III-C.

III-39
TABLE 3
General Fund Summary of Operating Results — Budgetary (Modified Cash/Statutory) Basis vs. GAAP Basis(a)
(In Millions)
Fiscal Year 2011 2012 2013 2014 2015
Modified Cash/Statutory Basis Operating Surplus/(Deficit) ...........................................................
$ 236.9
$ --
$ 398.0
$ 656.8
$ (113.2)
Adjustments: Increases (decreases) in revenue accruals:
Governmental Receivables .................................. (103.3) (178.1) (38.7) (29.5) 147.7 Other Receivables ............................................... 85.2 (117.2) (74.5) 44.6 44.0 (Increases) decreases in expenditure accruals: Accounts Payable and Other Liabilities .............. (100.4) 590.2 87.8 (110.2) (213.7) Salaries and Fringe Benefits Payable .................. 4.4 131.3 (32.8) 12.0 8.7 Increase (decrease) in Continuing Appropriations .... 79.5 (70.6) (17.9) (26.5) (21.0) Reclassification of equity adjustments ...................... -- -- -- -- -- Proceeds of Recovery Notes ..................................... -- -- -- -- -- Transfer of restricted resources ................................. (103.2) -- -- -- -- Transfer of prior year surplus .................................... (449.9) (143.5) -- -- --
GAAP Based Operating Surplus/(Deficit) ................. $ (350.8) $ 212.1 $ 321.9 $ 547.2 $ (147.5)
______________
(a) Fiscal Years 2011-2013 are reported on a modified cash basis while Fiscal Years 2014-2015 are reported on a statutory basis. See Accounting Procedures under FINANCIAL PROCEDURES for further explanation.
SOURCE: Comptroller’s Office
The table below sets forth on the budgetary (modified cash/statutory) basis the actual cumulative unreserved fund balance (deficit) for the General Fund for the last five fiscal years.
TABLE 4
General Fund Unreserved Fund Balance — Budgetary (Modified Cash/Statutory) Basis(a)
(In Millions)
Fiscal Year 2011 2012 2013 2014 2015
Operating Surplus/(Deficit) ....................................... $ 236.9 $ (143.5) $ 398.0 $ 248.5 $ (113.2) Fund Transfers and Reserves Transfers to Budget Reserve Fund ............................. Transfers from Budget Reserve Fund ........................
0.0 --
0.0
143.5
177.2
248.5 --
0.0
113.2 Reserve for Fiscal Year 2011 Operations .................. -- -- -- -- -- Reserve to Reduce Economic Recovery Revenue Bonds(b) -- -- -- -- -- Reserve for Subsequent Fiscal Year Operations(d) ..... 236.9(c) -- 220.8 -- -- Total Transfers/Reserves.................................... $ 236.9 $ 143.5 $ 0.0 $ 0.0(e) $ 0.0 Unreserved Fund Balance Surplus/(deficit) .................................................... $ 0.0 $ 0.0 $ 0.0 $ 0.0 $ 0.0
______________
(a) Fiscal Years 2011-2013 are reported on a modified cash basis while Fiscal Years 2014-2015 are reported on a statutory basis. See Accounting Procedures under FINANCIAL PROCEDURES for further explanation.
(b) The State has since repealed the authorization to issue economic recovery revenue bonds. (c) In accordance with a labor agreement, $14.5 million of this reserve will be deposited in the Other Post Employment Benefit Trust Fund and the remaining balance will be used to pay down Economic Recovery Notes issued in 2009. (d) $30 million reserved in Fiscal Year 2013 is planned to be released in Fiscal Year 2015. (e) Fiscal Year 2014 General Fund balance includes $598.5 million in GAAP Conversion Bonds.
SOURCE: Comptroller’s Office
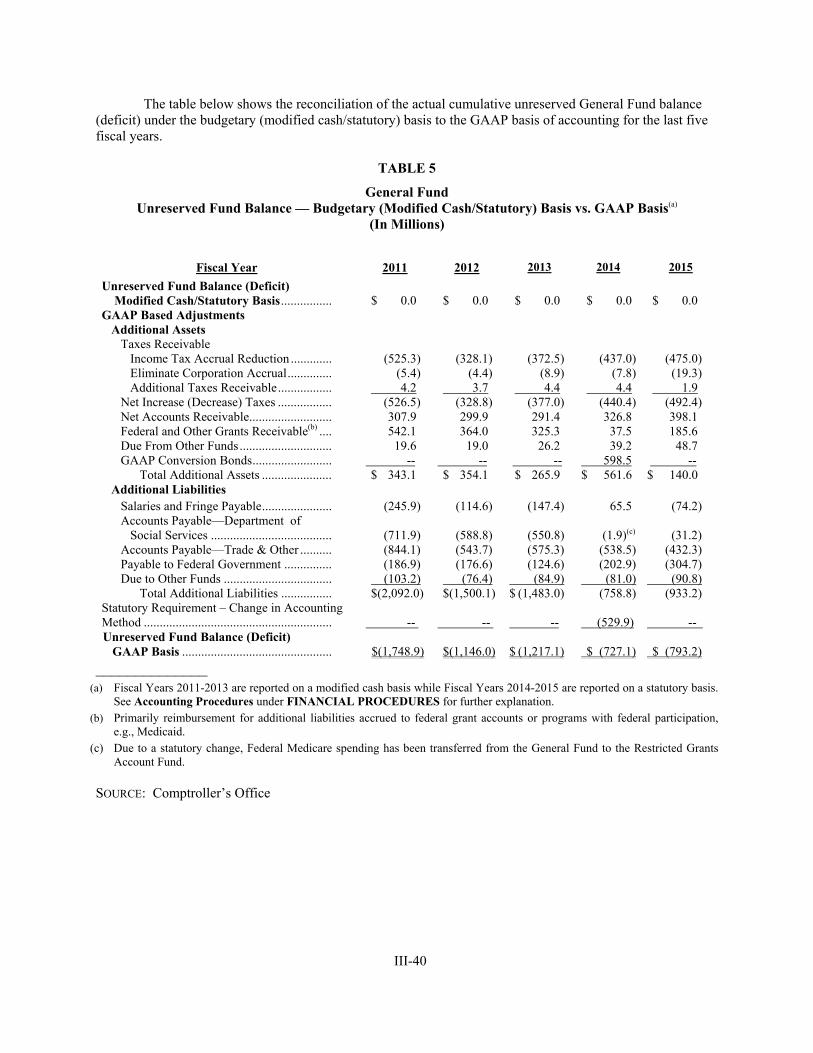
III-40
The table below shows the reconciliation of the actual cumulative unreserved General Fund balance (deficit) under the budgetary (modified cash/statutory) basis to the GAAP basis of accounting for the last five fiscal years.
TABLE 5
General Fund Unreserved Fund Balance — Budgetary (Modified Cash/Statutory) Basis vs. GAAP Basis(a)
(In Millions)
Fiscal Year 2011 2012 2013 2014 2015
Unreserved Fund Balance (Deficit) Modified Cash/Statutory Basis ................ $ 0.0 $ 0.0 $ 0.0 $ 0.0 $ 0.0 GAAP Based Adjustments Additional Assets Taxes Receivable Income Tax Accrual Reduction ............. (525.3) (328.1) (372.5) (437.0) (475.0) Eliminate Corporation Accrual .............. (5.4) (4.4) (8.9) (7.8) (19.3) Additional Taxes Receivable ................. 4.2 3.7 4.4 4.4 1.9 Net Increase (Decrease) Taxes ................. (526.5) (328.8) (377.0) (440.4) (492.4) Net Accounts Receivable.......................... 307.9 299.9 291.4 326.8 398.1 Federal and Other Grants Receivable(b) .... 542.1 364.0 325.3 37.5 185.6 Due From Other Funds ............................. 19.6 19.0 26.2 39.2 48.7 GAAP Conversion Bonds ......................... -- -- -- 598.5 -- Total Additional Assets ...................... $ 343.1 $ 354.1 $ 265.9 $ 561.6 $ 140.0 Additional Liabilities Salaries and Fringe Payable ...................... (245.9) (114.6) (147.4) 65.5 (74.2) Accounts Payable—Department of Social Services ...................................... (711.9) (588.8) (550.8) (1.9)(c) (31.2) Accounts Payable—Trade & Other .......... (844.1) (543.7) (575.3) (538.5) (432.3) Payable to Federal Government ............... (186.9) (176.6) (124.6) (202.9) (304.7) Due to Other Funds .................................. (103.2) (76.4) (84.9) (81.0) (90.8) Total Additional Liabilities ................ $(2,092.0) $(1,500.1) $ (1,483.0) (758.8) (933.2) Statutory Requirement – Change in Accounting Method ........................................................... -- -- -- (529.9) -- Unreserved Fund Balance (Deficit) GAAP Basis ............................................... $(1,748.9) $(1,146.0) $ (1,217.1) $ (727.1) $ (793.2)
______________ (a) Fiscal Years 2011-2013 are reported on a modified cash basis while Fiscal Years 2014-2015 are reported on a statutory basis.
See Accounting Procedures under FINANCIAL PROCEDURES for further explanation. (b) Primarily reimbursement for additional liabilities accrued to federal grant accounts or programs with federal participation, e.g., Medicaid.
(c) Due to a statutory change, Federal Medicare spending has been transferred from the General Fund to the Restricted Grants Account Fund.
SOURCE: Comptroller’s Office

III-41
The table below sets forth on a GAAP basis the components of the fund balance for the General Fund for the last five fiscal years.
TABLE 6
General Fund Fund Balances-GAAP Basis (In Millions)
Fiscal Year 2011 2012 2013 2014 2015
Reserved: Petty Cash ................................................. $ -- $ -- $ -- $ -- $ -- Budget Reserve ........................................ -- 93.4 270.7 519.2 406.0 Loans & Advances to Other Funds ........... 22.5 26.6 30.5 34.7 81.2 Restricted Purposes ................................... 236.9 -- 220.8 30.5 36.5 Inventories................................................. 13.6 13.6 15.5 15.7 14.6 Continuing Appropriations ........................ 178.6 100.0 91.0 85.9 65.0 Debt Service ............................................. -- -- -- -- -- Total ....................................................... $ 451.6 $ 233.6 $ 628.5 $ 686.0 $ 603.3
Unreserved: (1,748.9) (1,146.0) (1,217.1) (727.2) (793.2)
Total Fund Balance .................................... $(1,297.3) $ (912.4) $ (588.6) $ (41.2) $ (189.9)
______________
SOURCE: Comptroller’s Office

III-42
STATE DEBT
Constitutional Provisions
The State has no constitutional limit on its power to issue obligations or incur debt, except that it may borrow only for public purposes. There are no reported court decisions relating to State bonded debt other than two cases validating the legislative determination of the public purpose for improving employment opportunities and related activities. The State Constitution has never required a public referendum on the question of incurring debt. Therefore, the General Statutes govern the authorization and issuance of State debt, including the purpose, amount and nature thereof, the method and manner of the incurrence of such debt, the maturity and terms of repayment thereof, and other related matters.
Types of State Debt
Pursuant to various public and special acts, the State has authorized a variety of types of debt. These types fall generally into the following categories: direct general obligation debt, which is payable from the State’s General Fund; special tax obligation debt, which is payable from specified taxes and other funds that are maintained outside the State’s General Fund; and special obligation and revenue debt, which is payable from specified revenues or other funds that are maintained outside the State’s General Fund. In addition, the State provides annual appropriation support for, or is contingently liable on, the debt of certain State quasi-public agencies and political subdivisions. See OTHER FUNDS, DEBT AND LIABILITIES for information concerning debt and contingent liabilities on debt other than direct general obligation debt.
State Direct General Obligation Debt
Statutory Authorization and Security Provisions. The State issues general obligation bonds pursuant to specific bond acts and Section 3-20 of the General Statutes (the “General Obligation Bond Procedure Act”). That act provides that such bonds shall be general obligations of the State and that the full faith and credit of the State are pledged for the payment of the principal of and interest on such bonds as the same become due. The act further provides that, as a part of the contract of the State with the owners of such bonds, there is made an appropriation of all amounts necessary for the punctual payment of principal and interest on such bonds, and the Treasurer shall pay such principal and interest as the same become due.
There are no State constitutional provisions precluding the exercise of State power by statute to impose any taxes, including taxes on taxable property in the State or on income, in order to pay debt service on bonded debt now or hereafter incurred. The constitutional limit on increases in General Fund expenditures for any fiscal year does not include expenditures for the payment of bonds, notes or other evidences of indebtedness. There are also no constitutional or statutory provisions requiring or precluding the enactment of liens on or pledges of the State’s General Fund revenues or taxes, or the establishment of priorities for payment of debt service on the State’s general obligation bonds. There are no express statutory provisions establishing any priorities in favor of general obligation bondholders over other valid claims against the State.
Statutory Debt Limit. Section 3-21 of the General Statutes provides that no bonds, notes or other evidences of indebtedness for borrowed money payable from General Fund tax receipts of the State shall be authorized by the General Assembly or issued except as shall not cause the aggregate amount of (1) the total amount of bonds, notes or other evidences of indebtedness payable from General Fund tax receipts authorized by the General Assembly but which have not been issued and (2) the total amount of such indebtedness that has been issued and remains outstanding, to exceed 1.6 times the total estimated General Fund tax receipts of

III-43
the State for the fiscal year in which any such authorization will become effective or in which such indebtedness is issued, as estimated for such fiscal year by the joint standing committee of the General Assembly having cognizance of finance, revenue and bonding. However, in computing the aggregate amount of indebtedness at any time, there shall be excluded or deducted the principal amount of revenue anticipation notes having a maturity of one year or less, refunded indebtedness, bond anticipation notes, borrowings payable solely from the revenues of a particular project, the balances of debt retirement funds associated with indebtedness subject to the debt limit as certified by the Treasurer, the amount of federal grants certified by the Secretary of OPM as receivable to meet the principal of certain indebtedness, all authorized and issued indebtedness to fund any budget deficit of the State for any fiscal year ending on or before June 30, 2009, all authorized debt to fund the tax increment bond program of Connecticut Innovations, Inc. (“CI”), any indebtedness represented by agreements entered into pursuant to certain provisions of the General Statutes, provided the indebtedness in connection with which such agreements were entered into shall be included in such aggregate amount of indebtedness, any indebtedness issued for the purpose of meeting cash flow needs, and any indebtedness issued for the purpose of covering emergency needs in times of natural disaster. For purposes of the debt limit statute, all bonds and notes issued or guaranteed by the State and payable from General Fund tax receipts are counted against the limit, except for the exclusions or deductions described above, and certain other debt specifically excluded by statute. In addition, the amount of authorized but unissued debt for the UConn 2000 program is limited to the amount permitted to be issued under the cap. See Types of Direct General Obligation Debt — UConn 2000 Financing Program.
Under the General Statutes, the Treasurer is required to compute the aggregate amount of indebtedness as of January 1 and July 1 each year and to certify the results of such computation to the Governor and the General Assembly. If the aggregate amount of indebtedness reaches 90% of the statutory debt limit, the Governor shall review each bond act for which no bonds, notes or other evidences of indebtedness have been issued, and recommend to the General Assembly priorities for repealing authorizations for remaining projects so that the aggregate amount of indebtedness authorized will be below 90% of the statutory debt limit.
The total tax receipts for Fiscal Year 2015 as last estimated by the General Assembly’s joint standing committee on finance, revenue and bonding, the calculation of the debt limit, the aggregate amount of outstanding debt and of authorized but unissued debt subject to such limit, and the debt incurring margin, all as of February 15, 2016, are described in the following table.

III-44
TABLE 7
Statutory Debt Limit As of February 15, 2016
Total General Fund Tax Receipts $15,711,565,000 Multiplier 1.6 Debt Limit $25,138,504,000 Outstanding Debt(a) $13,361,021,237 Guaranteed Debt(b) $ 1,060,330,000 Authorized Debt(c) $ 6,484,824,072 Total Subject to Debt Limit $20,906,175,309 Less Debt Retirement Funds(d) $ 1,173,230 Aggregate Net Debt $20,905,002,080 Debt Incurring Margin $ 4,233,501,920
______________ (a) See Table 8. Includes accreted value of capital appreciation bonds. Excludes General Obligation Notes
(Economic Recovery Notes 2013 Series A and 2014 Series A), Pension Obligation Bonds, UConn 2000 Bonds, tax increment financings, CRDA Bonds, CHFA Supportive Housing Bonds, CHFA Emergency Mortgage Assistance Program Bonds, CHEFA Child Care Facilities Bonds and lease financings other than the Juvenile Training School.
(b) See OTHER FUNDS, DEBT AND LIABILITIES – Contingent Liability Debt. Includes only guarantees for certain outstanding debt of Southeastern Connecticut Water Authority and UConn 2000 Bonds secured by the State’s debt service commitment.
(c) Includes UConn 2000 Bonds secured by the State’s debt service commitment that are authorized but unissued under the statutory cap for Fiscal Year 2016.
(d) Includes debt service funds available for self-liquidating debt issued to finance facilities at the University of Connecticut and the Connecticut State University System.
SOURCE: State Treasurer’s Office
State Bond Commission. The General Obligation Bond Procedure Act establishes the State Bond Commission (the “Commission”) and empowers it to authorize the issuance of general obligation bonds for purposes and in amounts and subject to other limits established by the legislature in a bond act. The Commission consists of the Governor, the Treasurer, the Comptroller, the Attorney General, the Secretary of the Office of Policy and Management (“OPM”), the Commissioner of Administrative Services, and the Co-Chairpersons and Ranking Minority Members of the Joint Standing Committee on Finance, Revenue and Bonding of the General Assembly. The Secretary of OPM serves as secretary to the Commission.
Subject to satisfaction of certain conditions, the Commission may authorize the issuance of general obligation bonds by the approving vote of at least a majority of the Commission, upon a finding that such authorization will be in the best interest of the State. Upon authorization, the principal amount of bonds so authorized is deemed to be appropriated for such purpose or project and, subject to allotment thereof by the Governor, contracts may be awarded and obligations incurred with respect to the project or purpose in amounts not exceeding the authorized principal amount. Such contracts and obligations may at any particular time exceed the amount of the bond proceeds received by the State up to that time. The Commission also determines the terms and conditions of the bonds authorized or delegates such determination to the Treasurer. The Commission generally meets monthly.
Types of Direct General Obligation Debt
General Obligation Bonds. Pursuant to various public or special bond acts, the General Assembly empowers the Commission to authorize bonds for a variety of projects or purposes. Each bond act is usually specific as to its projects or purposes and the amount of bonds to be issued therefor, although each bond act
III-45
may contain several projects or purposes. Each bond act also generally sets forth a maximum maturity of the bonds.
The types of projects and purposes for which the State has authorized general obligation debt include the following: acquisition, construction, renovation and improvement of buildings and facilities for State departments and agencies, educational institutions, prisons, college and university facilities, library facilities and courthouses, acquisition of development rights to preserve open space and farmland, and the provision of grants and loans to promote economic development within the State. Some bonds authorized for university and college facilities are self-liquidating, and certain fees and charges collected by the college or university are set aside and used to service the debt on these bonds. Bonds are also authorized to fund a wide variety of grant programs. Such grants are made to local governments for local school construction projects or to finance a variety of local government, economic development, highway, bridge and other capital improvement projects. Certain bonds are authorized to finance grants and loans to local housing authorities and developers of affordable housing. Other general obligation debt finances grants and loans to municipalities for design and construction of water pollution control facilities, in addition to loans that are financed under the State’s Clean Water revenue bond program.
Teachers’ Retirement Fund Pension Obligation Bonds. Legislation passed in 2007 authorized the issuance of pension obligation bonds to fund up to $2 billion of the unfunded accrued liability in the Teachers’ Retirement Fund plus capitalized interest and issuance costs. In April 2008 the State issued $2,277 million of such bonds, and $2,346 million (reflecting the accreted value) of such bonds are outstanding as of February 15, 2016. The public act requires the State to appropriate annually the actuarially-determined annual required contribution to the Teachers’ Retirement Fund, while the bonds are outstanding. The bonds are general obligations of the State, but are excluded from the calculation of the statutory debt limit.
UConn 2000 Financing Program. In 1995 the General Assembly established the University of Connecticut as a separate corporate entity and instrumentality of the State empowered to issue bonds and construct certain infrastructure improvements at the University’s various campuses. Known as UConn 2000, the infrastructure improvement program now is estimated to cost $4,619.3 million to be financed over a twenty-nine year period. The UConn 2000 program contemplates total issuance of $4,282.9 million general obligation bonds of the University secured by the State’s debt service commitment, which is an annual amount for any debt service requirements when due and payable. Under the enabling legislation, appropriations of all amounts of the State’s debt service commitment are made out of the resources of the State’s General Fund and the Treasurer is obligated to make such payments. For this reason, all general obligation borrowings by the University that are secured by the State’s debt service commitment are treated as part of the State’s general obligation debt, and are reflected in Tables 8 through 14. The amount of the University’s bonds secured by the State’s debt service commitment is capped for each fiscal year, but any amount not used may be carried forward to future fiscal years. Each resolution approved by the University to borrow money, including bonds secured by the State’s debt service commitment, may be rejected by the Governor within thirty days of submission. As of February 15, 2016, $2,671.4 million of such debt secured by the State’s debt service commitment had been issued (including refunding bonds), of which $1,059.3 million remain outstanding, with a remaining authorization of $512.0 million.
The total amount of University general obligation bonds secured by the State’s debt service commitment authorized by the enabling legislation is approximately $336.4 million less than the estimated total cost of the infrastructure improvements. Approximately $276.5 million of this difference has been addressed. Additional funding needs will be addressed through capital cost reductions, the deferral of certain projects to a future date, and by the securing of additional funding sources, such as private fundraising, general obligations of the University not secured by the State’s debt service commitment, and special obligation bonds of the University. Special obligation bonds are to be secured by particular revenues of the University as further defined in the indenture and are not subject to the cap on the University’s general obligation debt service commitment bonds and are not counted against the State’s debt limit. The University does not have any Special Capital Reserve Fund debt outstanding as of February 15, 2016.

III-46
The General Assembly has and may continue to authorize capital improvements for the University of Connecticut in addition to the UConn 2000 Program. In 2011 general obligation bonds of the State were authorized for the establishment of a bioscience cluster anchored by the Jackson Laboratory for Genomic Medicine, a research laboratory to be located on University of Connecticut Health Center’s Farmington campus, and for creation of a technology park on the University’s Storrs Campus. These are reflected in the Authorized but Unissued Direct General Obligation Debt shown in Table 12. The construction of a new $203 million ambulatory care center at the University of Connecticut Health Center also was authorized in 2011 and has been financed through a lease financing through the University of Connecticut Health Center Finance Corporation and is not reflected in Table 12.
Lease Financing. The State has issued certificates of participation for the development of courthouse facilities (of which none are outstanding) and an energy facility at a juvenile training school, each based upon State rental payments under a lease purchase agreement between the State and the project developer. The State has treated this method of lease financing as general obligation debt. However, the State has entered into other leasing arrangements for the development of government facilities that are not treated as general obligation debt, most often in circumstances where the lease is a standard lease or the State is not a participant in the securitization of rental payments under the lease.
Tax Increment Financing. In 1992 the General Assembly authorized the Connecticut Development Authority, now merged into CI to issue tax increment bonds for certain types of economic development projects. Under the program the amount of such bonds that may be issued is limited so that the debt service on the bonds may not exceed the estimated increases in the sales tax and the admissions, cabaret and dues taxes generated by the project and allocated by CI for debt service on the bonds. Under the General Statutes, debt service on the bonds is required to be paid from such tax receipts (whether or not the actual tax receipts equal or exceed the estimated amount) and is deemed appropriated from the General Fund. The State has classified such tax increment bonds as general obligation debt. No such tax increment bonds may be issued without the approval of the State Bond Commission. Such tax increment bonds are not reflected in Table 7, but are reflected in Tables 8 through 12.
Supportive Housing Financing. In 2005 the General Assembly directed the Connecticut Housing Finance Authority (“CHFA”) in conjunction with other state agencies to develop a collaborative plan to create affordable housing and support services for specified eligible persons and families up to a specified number of units. The program is to be funded in part through mortgages, tax credits and grants from CHFA and the Department of Economic and Community Development. CHFA is authorized to issue bonds in support of the program and the Commission has authorized the Treasurer and OPM to enter into a contract to provide State assistance and pay debt service on the bonds in the form of payments of principal, interest, interest swap payments, liquidity fees, letter of credit fees, trustee fees and other similar bond-related expenses. Bonds supported by such State assistance shall not exceed $105 million in the aggregate. As of February 15, 2016, $63.83 million of such bonds were outstanding. Any provision in the contract providing for the payment of annual debt service will constitute a full faith and credit obligation of the State, and any bonds for which the State provides assistance are excluded from the calculation of the statutory debt limit.
Emergency Mortgage Assistance Program. In 2008 the General Assembly authorized CHFA to issue up to $50 million of bonds to fund an Emergency Mortgage Assistance Program and required the Treasurer and OPM to enter into a contract to provide State assistance to pay debt service on such bonds in the form of payments of principal, interest, interest swap payments, liquidity fees, letter of credit fees, trustee fees and similar bond-related expenses. As of February 15, 2016, the entire $50 million had been issued, of which $42.18 million was then outstanding. Any provision in the contract providing for the payment of annual debt service will constitute a full faith and credit obligation of the State, and any bonds for which the State provides assistance are excluded from the calculation of the statutory debt limit.
Economic Recovery Notes. In 2009 the General Assembly authorized the Treasurer to issue notes to fund the State’s budget deficit for Fiscal Year 2009, to pay costs of issuance of such notes and certain interest

III-47
payable or accrued on such notes and to exempt these notes from the overall limit on state debt. In December 2009, the State issued $915,795,000 of such Economic Recovery Notes. As of February 15, 2016, $352.6 million of such Economic Recovery Notes (including refunding notes) remain outstanding.
Certain Short-Term Borrowings. The General Statutes authorize the Treasurer, subject to the approval of the Governor, to borrow such funds, from time to time, as may be necessary, and to issue obligations of the State therefor, which shall be redeemed by the Treasurer whenever, in the opinion of the Treasurer, there are funds in the treasury available for such purpose, or not later than two years from the date of issuance, whichever is earlier. The State has established programs of temporary note issuances and credit facilities from time to time to cover periodic cash flow requirements. No temporary notes are outstanding and none have been issued since 1991.
Forms of Debt. In addition to the bonds, notes and lease financings described above, the Treasurer has the authority to issue refunding bonds, bond anticipation notes, and capital appreciation bonds. The State General Obligation Bond Procedure Act provides that the Treasurer may issue temporary notes and any renewals thereof in anticipation of the proceeds from the sale of bonds whenever the Commission has adopted a resolution authorizing bonds. The Treasurer is also authorized by the State General Obligation Bond Procedure Act to issue refunding bonds whenever the Treasurer finds that a refunding is in the best interests of the State and that the State reasonably expects to achieve net debt service savings as a result of such refunding.
Certain of the State’s general obligation bonds have been issued as capital appreciation bonds. Capital appreciation bonds are issued at a deep discount and interest on the bonds is compounded semi-annually and only paid at maturity. For purposes of the State’s debt tables, the interest that has accrued on capital appreciation bonds up to the date of the table is added to the principal amount of the State’s outstanding debt. Pursuant to State statute, accrued interest on UConn 2000 capital appreciation bonds is excluded from the calculation of the statutory debt limit.
Derivatives. The Treasurer, with the authorization of the State Bond Commission, has the power to enter into reimbursement and similar agreements in connection with liquidity or credit facilities and to pledge the full faith and credit of the State or other collateral to secure the State’s payment obligations under any such agreement. The Treasurer, with the authorization of the Commission, has the power to enter into contracts to place the obligation of the State as represented by bonds or notes of the State, on such interest rate or cash flow basis as the Treasurer may determine, including swap agreements and other arrangements to manage interest rate risk. When any such arrangement is entered into, the counter-party to the arrangement must have a rating on its unsecured long-term obligations that is the same as or higher than the underlying rating of the State on the applicable bonds. The Commission may authorize the Treasurer to pledge the full faith and credit of the State and any other collateral pledged to secure the applicable bonds to also secure the State’s payment obligations under any such contract.
The State has entered into swap agreements in connection with various bond issues. The swap agreements typically provide for early termination in certain events, and such “termination events” could result in the State being required to make unanticipated termination payments. Such payments, if any are due, may be substantial. In some cases the State has up to 270 days to make any such termination payments. The amounts payable to each swap provider under the respective swap agreement, including any termination payments, will be general obligations of the State. The State is obligated to make debt service payments on its bonds regardless of the performance of the swap provider of its obligations under the swap agreement. Listed below is a summary of the various swap agreements the State has entered into in connection with its general obligation bonds. See also Appendix C, Note 19 – Derivative Financial Instruments.

III-48
Swap Agreements as of February 15, 2016
Bond Issue
Notional Amount
Termination Date
Fixed Rate Paid by State
2005 Series B $ 15,620,000 June 1, 2016 3.99% 2005 Series B $ 20,000,000 June 1, 2017 5.07% 2005 Series B $ 20,000,000 June 1, 2020 5.20%
Debt Statement. The following table shows all direct general obligation indebtedness (including the accreted value of capital appreciation bonds) for the payment of the principal and interest on which the State has pledged its full faith and credit or which is otherwise payable from the State’s General Fund.
TABLE 8
Direct General Obligation Indebtedness(a) Principal Amount Outstanding as of February 15, 2016
(In Thousands)
General Obligation Bonds $13,529,951 Pension Obligation Bonds 2,346,499 UConn 2000 Bonds 1,059,285 Other (b) 320,463
Long Term General Obligation Debt Total
$17,256,199 Short Term General Obligation Debt Total
Gross Direct General Obligation Debt
$17,256,199 Deduct: University Auxiliary Services(c) 1,173
Net Direct General Obligation Debt
$17,255,025 ______________
(a) The table does not include refunded bonds for which escrow funds and investments are sufficient to pay all debt service. The table also does not include limited or contingent liabilities of the State or obligations of the State to towns for participation in the construction and alteration of school buildings. See OTHER FUNDS, DEBT AND LIABILITIES.
(b) “Other” includes lease financings, tax increment financings, CHFA Supportive Housing Bonds and CHFA Emergency Mortgage Assistance Program Bonds. Does not include CRDA Bonds or CHEFA Child Care Facilities Bonds. See OTHER FUNDS, DEBT AND LIABILITIES – Other Debt Service and Contractual Commitments.
(c) These bonds are considered self-liquidating; the proceeds of such bonds have been used to build facilities for the State University System and the University of Connecticut. Student fees, other than tuition, for use of such facilities are deposited into enterprise funds and are used for the operation of such facilities and for deposit annually into a debt service fund maintained by the Treasurer for payment of the debt service on such bonds.
SOURCE: State Treasurer’s Office
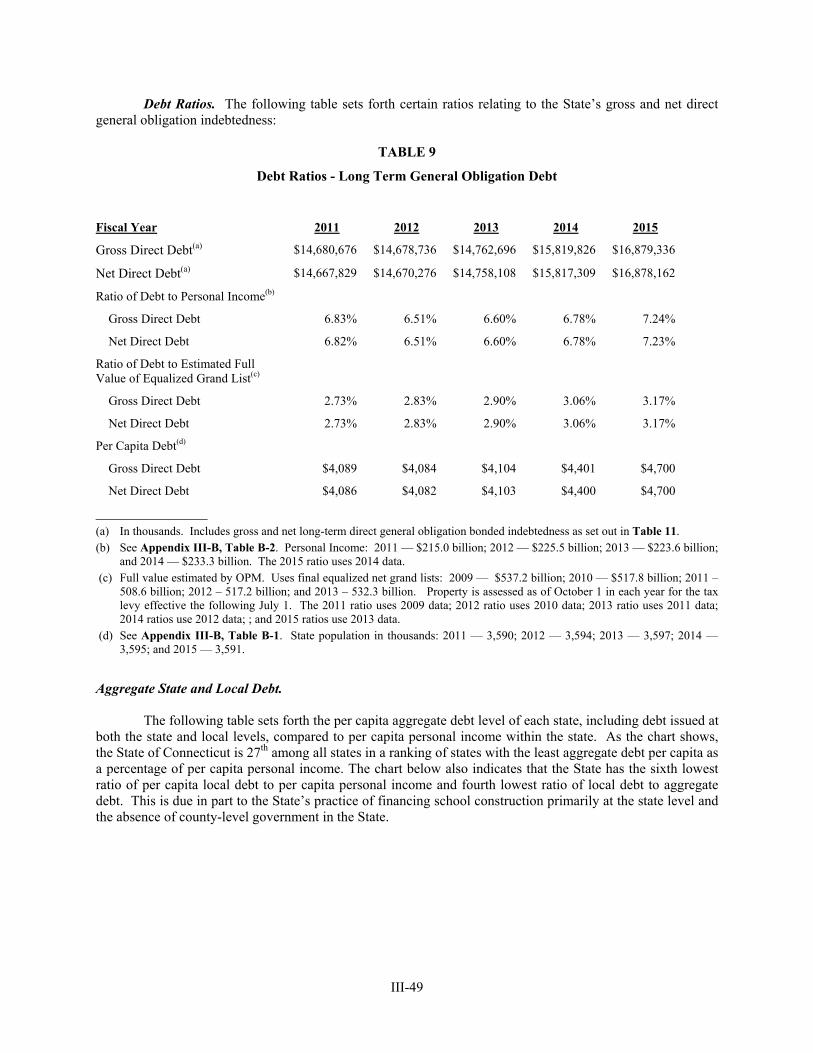
III-49
Debt Ratios. The following table sets forth certain ratios relating to the State’s gross and net direct general obligation indebtedness:
TABLE 9
Debt Ratios - Long Term General Obligation Debt
Fiscal Year 2011 2012 2013 2014 2015
Gross Direct Debt(a) $14,680,676 $14,678,736 $14,762,696 $15,819,826 $16,879,336
Net Direct Debt(a) $14,667,829 $14,670,276 $14,758,108 $15,817,309 $16,878,162
Ratio of Debt to Personal Income(b)
Gross Direct Debt 6.83% 6.51% 6.60% 6.78% 7.24%
Net Direct Debt 6.82% 6.51% 6.60% 6.78% 7.23%
Ratio of Debt to Estimated Full Value of Equalized Grand List(c)
Gross Direct Debt 2.73% 2.83% 2.90% 3.06% 3.17%
Net Direct Debt 2.73% 2.83% 2.90% 3.06% 3.17%
Per Capita Debt(d)
Gross Direct Debt $4,089 $4,084 $4,104 $4,401 $4,700
Net Direct Debt $4,086 $4,082 $4,103 $4,400 $4,700
______________ (a) In thousands. Includes gross and net long-term direct general obligation bonded indebtedness as set out in Table 11. (b) See Appendix III-B, Table B-2. Personal Income: 2011 — $215.0 billion; 2012 — $225.5 billion; 2013 — $223.6 billion;
and 2014 — $233.3 billion. The 2015 ratio uses 2014 data. (c) Full value estimated by OPM. Uses final equalized net grand lists: 2009 — $537.2 billion; 2010 — $517.8 billion; 2011 –
508.6 billion; 2012 – 517.2 billion; and 2013 – 532.3 billion. Property is assessed as of October 1 in each year for the tax levy effective the following July 1. The 2011 ratio uses 2009 data; 2012 ratio uses 2010 data; 2013 ratio uses 2011 data; 2014 ratios use 2012 data; ; and 2015 ratios use 2013 data.
(d) See Appendix III-B, Table B-1. State population in thousands: 2011 — 3,590; 2012 — 3,594; 2013 — 3,597; 2014 — 3,595; and 2015 — 3,591.
Aggregate State and Local Debt.
The following table sets forth the per capita aggregate debt level of each state, including debt issued at both the state and local levels, compared to per capita personal income within the state. As the chart shows, the State of Connecticut is 27th among all states in a ranking of states with the least aggregate debt per capita as a percentage of per capita personal income. The chart below also indicates that the State has the sixth lowest ratio of per capita local debt to per capita personal income and fourth lowest ratio of local debt to aggregate debt. This is due in part to the State’s practice of financing school construction primarily at the state level and the absence of county-level government in the State.

III-50
TABLE 9a(a)(b)
Combined State and Local Debt Compared to State Personal Income
______________
(a) The percentages along the vertical axis are calculated by dividing per capita aggregate debt over per capita personal income. Population figures used in the underlying calculations are the population estimates as of July 1, 2014 from the U.S. Census Bureau, Population Division. State and local debt figures used in the underlying calculations are from the U.S. Census Bureau, 2013 Annual Surveys of State and Local Finances. Per capita income figures used in the underlying calculations are from the Bureau of Economic Analysis, which used data from 2014.
(b) The Census Bureau state and local debt figures include debt obligations of all dependent agencies of the state and local government, respectively, including agencies, boards, commissions, or other organizations, regardless of the responsibility for debt service. This differs from the components of debt in other places within this Annual Information Statement.
SOURCE: United States Department of Commerce, Bureau of Economic Analysis; U.S. Census Bureau
Debt Service Schedule. The following table sets forth the principal, sinking fund and interest payments required on all outstanding long-term direct general obligation debt of the State, as of February 15, 2016. Although not specifically reflected as a result of combining all outstanding long-term direct debt, the State generally issues general obligation bonds maturing within twenty years. The exceptions include thirty-year Rental Housing Term Bonds and certain other bonds with maturities of less than twenty years where required by statute or in instances where the expected period of usefulness of the project or purpose financed does not warrant a maturity of twenty years.

III-51
TABLE 10
Summary of Principal, Mandatory Sinking Fund Payments, and Interest on Long-Term Direct General Obligation Debt(a)
As of February 15, 2016
Fiscal Year
Principal Payments(b)
Interest Payments(b)(c)
Total Debt Service
2016 $ 594,407,177 $ 324,041,022 $ 918,448,199 2017 1,409,884,988 743,463,350 2,153,348,338 2018 1,404,947,299 689,602,071 2,094,549,369 2019 1,178,341,471 631,297,632 1,809,639,104 2020 1,122,035,614 582,708,090 1,704,743,704 2021 1,101,266,206 533,634,455 1,634,900,661 2022 1,070,154,111 536,114,072 1,606,268,183 2023 1,100,431,122 498,505,002 1,598,936,124 2024 1,005,399,066 476,517,793 1,481,916,859 2025 937,127,437 433,378,799 1,370,506,236 2026 910,910,000 305,244,158 1,216,154,158 2027 863,815,000 260,434,588 1,124,249,588 2028-2035 4,450,940,000 739,313,378 5,190,253,378
Totals $17,149,659,491 $6,754,254,411 $23,903,913,901 ______________
(a) Includes long-term general obligation debt as outlined in Table 8. The future principal payments ($17,149,659,491), plus accreted interest ($105,365,915), total the amount of such long-term debt ($17,255,025,406) as shown in Table 8. See footnotes (b) and (c) for further explanation.
(b) Principal payments include aggregate stated initial values of capital appreciation bonds. Interest payments include the difference between the aggregate stated initial values and the aggregate maturity amounts of capital appreciation bonds. Capital appreciation bonds mature in Fiscal Years 2018 through 2025.
(c) Some of the State’s direct debt pays interest at variable rates. For purposes of this Table 10, the interest on such debt is calculated based on the following assumed average rates:
Year Issued
Amount Issued
Amount Outstanding
Maturities
Interest Rate
2005 $ 300,000,000 $ 100,000,000 2016-2023 3.50% 2005* 15,620,000 15,620,000 2016 3.99 2005* 20,000,000 20,000,000 2017 5.07 2005* 20,000,000 20,000,000 2020 5.20 2011 337,620,000 184,485,000 2015-2018 3.50 2011 75,000,000 75,000,000 2016, 2019 3.50 2012 212,400,000 141,600,000 2016-2020 3.50 2012 219,865,000 144,865,000 2016-2024 3.50 2013 244,570,000 204,570,000 2016-2025 3.50 2013 115,000,000 85,000,000 2016-2021 3.50 2013 314,295,000 311,445,000 2016-2018 3.00 2014 47,000,000 47,000,000 2017-2023 3.50 2014 61,610,000 41,140,000 2017-2018 3.50 2015 200,000,000 200,000,000 2017-2024 3.50 2015 180,745,000 180,745,000 2016-2022 3.50
Totals $2,363,725,000 $1,771,470,000
______________ * Assumed average interest rate based on interest rate swap agreement(s), including projected basis risk.
SOURCE: State Treasurer’s Office
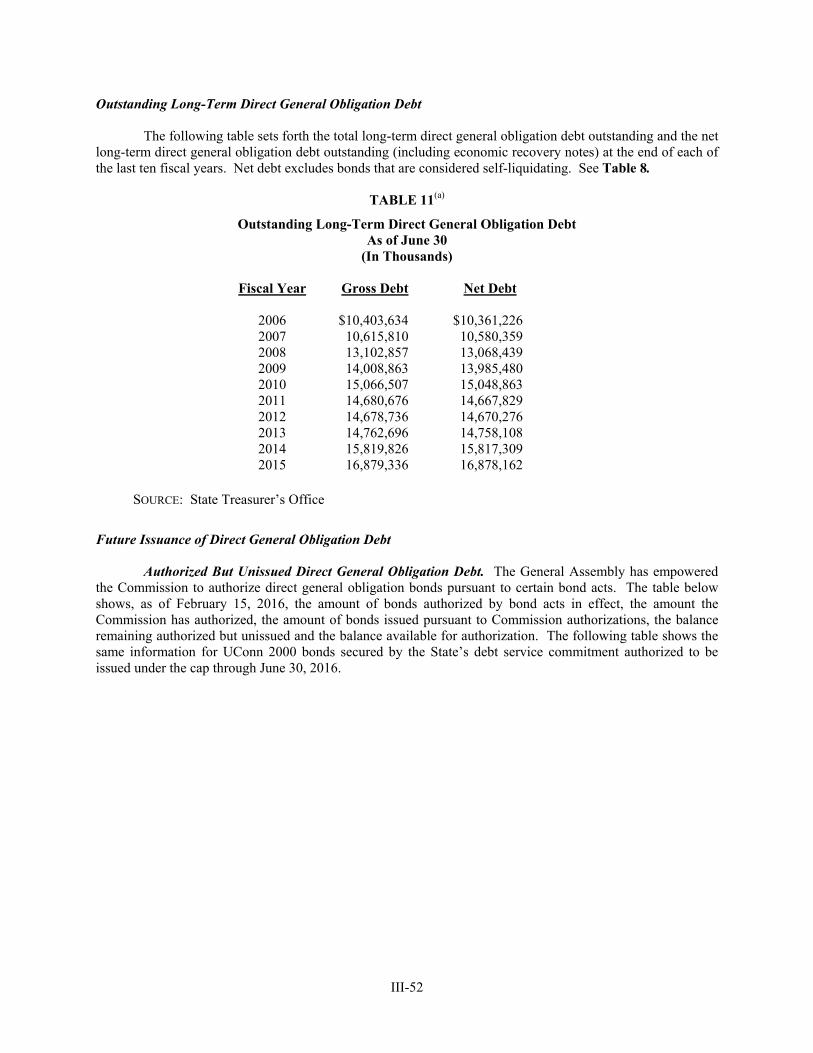
III-52
Outstanding Long-Term Direct General Obligation Debt
The following table sets forth the total long-term direct general obligation debt outstanding and the net long-term direct general obligation debt outstanding (including economic recovery notes) at the end of each of the last ten fiscal years. Net debt excludes bonds that are considered self-liquidating. See Table 8.
TABLE 11(a)
Outstanding Long-Term Direct General Obligation Debt As of June 30
(In Thousands)
Fiscal Year Gross Debt Net Debt
2006 $10,403,634 $10,361,2262007 10,615,810 10,580,3592008 13,102,857 13,068,4392009 14,008,863 13,985,4802010 15,066,507 15,048,8632011 14,680,676 14,667,8292012 14,678,736 14,670,2762013 14,762,696 14,758,1082014 15,819,826 15,817,3092015 16,879,336 16,878,162
SOURCE: State Treasurer’s Office
Future Issuance of Direct General Obligation Debt
Authorized But Unissued Direct General Obligation Debt. The General Assembly has empowered the Commission to authorize direct general obligation bonds pursuant to certain bond acts. The table below shows, as of February 15, 2016, the amount of bonds authorized by bond acts in effect, the amount the Commission has authorized, the amount of bonds issued pursuant to Commission authorizations, the balance remaining authorized but unissued and the balance available for authorization. The following table shows the same information for UConn 2000 bonds secured by the State’s debt service commitment authorized to be issued under the cap through June 30, 2016.

III-53
TABLE 12
Authorized but Unissued Direct General Obligation Debt As of February 15, 2016
(In Thousands)
State Direct
Debt(a)
Pension Obligation
Bonds(b)
UCONN 2000(c)
Tax
Increment(d)
Total Bond Acts in Effect $35,978,527 $2,276,578 $2,612,667 $74,750 $40,942,522 Amount Authorized(e) 32,636,171 2,276,578 2,612,667 74,750 37,600,167 Amount Issued 30,005,738 2,276,578 2,100,667 68,040 34,451,023 Authorized but Unissued 2,630,434 0 512,000 6,710 3,149,144 Available for Authorization 3,342,356 0 0 0 3,342,356 ______________ (a) Includes CHFA Supportive Housing Bonds and CHFA Emergency Mortgage Assistance Program Bonds. Also
includes authorization and allocation for GAAP Deficit Bonds in an aggregate principal amount sufficient to generate net proceeds of not more than $750 million. Excludes CRDA Bonds, CHEFA Child Care Facilities Bonds, General Obligation Notes (Economic Recovery Notes 2013 Series A and 2014 Series A) and lease financings.
(b) The amount available does not include additional amounts which may exceed the cap to finance issuance costs and capitalized interest.
(c) Includes bonds that may be issued under the cap in effect on the date of the table. The amount available for authorization does not include additional amounts which may exceed the cap to finance reserve funds, issuance costs and capitalized interest. The amount issued has been adjusted to reflect increases due to closing costs and decreases due to premiums.
(d) The amount of tax increment bonds authorized is based on the amount authorized by the State Bond Commission, since there is no statutory amount of authorization.
(e) The amount authorized reflects amounts allocated by the State Bond Commission.
SOURCE: State Treasurer’s Office; Office of Policy and Management
Bond Authorizations and Reductions. The General Assembly authorizes bonds in various public and special acts each year or each biennium. In addition to authorizing bonds for new projects and purposes, the General Assembly reviews prior authorizations and may repeal certain projects and bond authorizations or otherwise reduce prior bond authorizations. The following table and graph list the amount of new authorizations of general obligation debt that take effect during the fiscal year listed, and the net amount after subtracting prior bond authorizations that have been repealed or reduced. Pension obligation bonds and economic recovery notes are not included since they are not recurring authorizations.

III-54
TABLE 13
Statutory General Obligation Bond Authorizations and Reductions(a) (In Millions of Dollars)
Fiscal Year 2006 2007 2008 2009 2010 2011 2012 2013 2014 2015 2016 2017 New Authorizations 1,290.4 1,388.7 1,965.0 1,564.5 1,195.4 1,147.2 1,724.8 2,673.3 1,993.6 2,843.6 2,391.5 2,293.8 Reductions (41.3) 0.0 (206.9) 0.0 (140.5) (474.6) (10.8) (22.3) (12.0) (27.8) (272.5) 0.0 Net New Authorizations 1,249.1 1,388.7 1,758.1 1,564.5 1,054.9 672.6 1,714.0 2,651.0 1,981.6 2,815.8 2,119.0 2,293.8
______________ (a) Does not include Pension Obligation Bonds, Economic Recovery Notes, lease financings, tax increment or cash flow borrowings. Does
not include GAAP Deficit Bonds authorized in Fiscal Year 2014 in an aggregate principal amount sufficient to generate net proceeds of not more than $750 million. Includes amount for UConn 2000 bonds available under the cap for Fiscal Years 2006 through 2017, as amended, but does not include additional amounts which may exceed the cap to finance reserve funds, issuance costs and capitalized interest. Amounts are listed in the fiscal year that the bond authorizations become effective. Does not include any authorizations which take effect after Fiscal Year 2017. See Table 14.
SOURCE: State Treasurer’s Office; Office of Policy and Management
Statutory Bond Authorizations and Reductions (In Millions)
-600
-400
-200
0
200
400
600
800
1,000
1,200
1,400
1,600
1,800
2,000
2,200
2,400
2,600
2,800
3,000
2006 2007 2008 2009 2010 2011 2012 2013 2014 2015 2016 2017
New Authorizations Reductions Net New Authorizations
$
Fiscal Years

III-55
Purposes of Recent Bond Authorizations. The purposes for which the State issues its general obligation bonds include those described in the table below. The amounts authorized for each of these purposes for recent fiscal years is reflected in the following table, including amounts authorized for UConn 2000. The table does not reflect any statutory reductions of authorized items from prior years, nor are tax increment or cash flow borrowings, CHFA Supportive Housing Bonds and CHFA Emergency Mortgage Assistance Program Bonds, CHEFA Child Care Facilities Bonds, lease financings, economic recovery notes or pension obligation bonds included.
TABLE 14(a)
New Agency Authorizations (Does Not Include Reductions) (In Thousands)
Fiscal Year 2013 2014 2015 2016 2017
Purpose Governmental Accountability ..... $ 0 $ 0 $ 1,000 $ 100 $ 500 Office of Policy and
Management ..........................
198,659
335,330
388,930
348,600
315,000 Secretary of the State .................. 2,000 0 0 0 0 State Comptroller ........................ 7,000 0 57,000 20,000 0 Attorney General ........................ 0 0 0 0 0 Veterans Affairs .......................... 0 750 2,959 2,145 550 Administrative Services(d) ........... 216,500 577,300 530,800 633,500 651,100 Public Works .............................. 0 0 0 0 0 Construction Services(d) .............. 635,000 0 0 0 0 Emergency Services and
Public Protection.. ..................
17,420
30,000
54,000
3,000
2,000 Motor Vehicles ........................... 0 1,703 1,697 1,420 0 Military ....................................... 5,000 6,150 3,000 4,471 3,108 Consumer Protection .................. 0 0 100 0 0 Health Care Advocate ................. 0 0 1,900 0 0 Agriculture .................................. 10,000 10,500 10,500 0 1,000 Agricultural Experiment
Station ....................................
0
0
1,000
0
11,700 Environmental Protection ........... 0 0 0 0 0 Energy and Environmental
Protection ...............................
171,000
127,900
334,400
137,850
173,575 Labor ........................................... 15,000 5,000 0 5,000 5,000 Economic and Community
Development:(d)
Housing ............................. 147,500 0 0 0 0 Housing Trust Fund ........... 25,000 0 0 0 0 Economic Development .... 355,000 150,000 225,000 190,000 190,000 Other .................................. 24,000 56,500 39,100 2,000 5,000
Department of Housing:(d) Housing .............................. 0 92,000 130,000 135,000 135,000 Housing Trust Fund ........... 0 30,000 30,000 40,000 25,000 Other .................................. 0 0 0 20,000 20,000
Capital Region Economic Development Authority .........
60,000
39,122
33,728
57,000
55,000
Connecticut Innovations, Incorporated ...........................
120,113
94,728
69,690
71,425
56,108
Public Health .............................. 52,000 10,000 50,000 0 0 Developmental Services ............. 7,000 5,000 5,000 7,500 27,500 Mental Health and Addiction
Services ..................................
10,000
2,275
9,175
5,000
5,000 Social Services(d) ........................ 10,000 0 1,000 0 0

III-56
Fiscal Year 2013 2014 2015 2016 2017
Rehabilitation Services ............... 0 0 6,000 0 0 Education .................................... 107,645 62,250 98,400 51,000 47,750 Early Childhood .......................... 0 0 15,000 0 0 State Library ............................... 0 5,000 7,200 8,600 7,000 Regional Community-
Colleges .................................
0
0
0
0
0 Board of Regents for Higher
Education ...............................
76,723
24,990
98,600
100,800
85,615 Correction ................................... 0 10,000 10,000 - 15,000 Children and Families ................. 7,285 1,231 1,515 3,828 2,073 Judicial ........................................ 11,000 11,500 30,000 28,400 15,000 CPTV .......................................... 0 0 3,300 0 0 Legislative Management ............. 0 0 8,122 1,799 345 UConn ......................................... 154,500 0 0 0 0 UConn 2000(b) ............................. 143,000 204,400 315,500 312,100 266,400 Transportation ............................. 25,000 5,000 95,000 82,500 60,000 Connecticut Port Authority ......... 0 0 0 0 17,500 CSUS 2020(c) .............................. 95,000 95,000 175,000 118,500 95,000 Totals ......................................... $2,708,345 $1,993,629 $2,843,616 $2,391,538 $2,293,824
______________ (a) Does not include authorizations that take effect after Fiscal Year 2017. Does not include Pension Obligation Bonds,
Economic Recovery Notes, tax increment or cash flow borrowings, CHFA Supportive Housing Bonds and CHFA Emergency Mortgage Assistance Program Bonds, CHEFA Child Care Facilities Bonds, GAAP Deficit Bonds or lease financings.
(b) To be issued by University of Connecticut based on cap for the year indicated prior to actual bond issuance. Does not include additional amounts that may exceed cap to finance reserve funds, issuance costs and capitalized interest.
(c) The Connecticut State University Infrastructure Act authorizes $95 million per year from Fiscal Year 2009 through Fiscal Year 2018.
(d) During the 2013 session of the General Assembly various agency consolidations and realignments were enacted as follows: The Department of Construction Services was consolidated into the Department of Administrative Services. The Department of Housing was created and assumed the housing duties of the Department of Economic and Community Development, the Office of Policy and Management and the Department of Social Services.
SOURCE: Office of Policy and Management
III-57
OTHER FUNDS, DEBT AND LIABILITIES
The State conducts certain of its operations through State funds other than the State General Fund and, pursuant to legislation, may issue debt secured by the special taxes or revenues pledged to certain of such funds. In addition, the State is contingently liable, or has limited liability, from the resources of the State’s General Fund, for payment of debt service on certain obligations of quasi-public State agencies and municipalities of the State. The State also has committed to apply moneys for debt service on loans to finance certain child care facilities. The State also has made commitments to certain municipalities to make future grant payments for school construction projects, payable over a period of years, and has certain other contingent liabilities for future payments.
Special Transportation Fund and Debt
In 1984 the State adopted legislation establishing a transportation infrastructure program and authorizing Special Tax Obligation (“STO”) bonds to finance the program. The transportation infrastructure program is a continuous program for planning, construction and improvement of State highways and bridges, projects on the interstate highway system, alternate highway projects in the interstate highway substitution program, waterway facilities, mass transportation and transit facilities, the highway safety program, maintenance garages and administrative facilities of the Department of Transportation, payment of the State’s share of the costs of the local bridge program, and payment of State contributions to the local bridge revolving fund. The transportation infrastructure program is administered by the Department of Transportation.
The cost of the transportation infrastructure program for Fiscal Years 1985-2020, which will be met from federal, State, and local funds, is currently estimated at $37.5 billion. The State’s share of such cost, estimated at $18.5 billion, is to be funded from transportation-related taxes, fees and revenues deposited in the Special Transportation Fund, as described below, and from the proceeds of STO bonds. The portion of State program costs not financed by STO bonds is estimated at $0.8 billion and includes the expenses of the transportation infrastructure program that either are not sufficiently large or do not have a long enough life expectancy to justify the issuance of long-term bonds. Such expenses currently include liquid resurfacing, minor bridge repairs, highway maintenance activities, safety improvements, and other minor transportation improvements. The State’s share of the cost of the infrastructure program for Fiscal Years 1985-2020 to be financed by STO bonds currently is estimated at $17.7 billion. The issuance of such STO bonds has eliminated the need for the authorization of additional general obligation bonds of the State for surface transportation purposes. STO bonds also may be issued for the purpose of refunding general obligation bonds of the State issued for transportation infrastructure purposes. During Fiscal Years 1985-2017, $31.6 billion of the total transportation infrastructure program was approved by the appropriate governmental authorities. The remaining $5.9 billion of such infrastructure costs is anticipated to be funded by the issuance of $3.9 billion in STO bonds, $1.8 billion in anticipated federal funds, and $218.1 million in anticipated revenues and other available funds. The State has established the Special Transportation Fund for the purpose of budgeting and accounting for all transportation-related taxes, fees and revenues credited to such Fund and securing the STO bonds. STO bonds are payable solely from revenues of the Special Transportation Fund and other receipts, funds or moneys pledged pursuant to the enabling legislation and indenture. The aggregate of certain motor fuel taxes, the oil companies tax, certain amounts of the general retail sales tax, motor vehicle receipts, motor vehicle related licenses, permits and fees, sales tax on motor vehicles and other transportation related revenue sources, including enacted adjustments to all the foregoing sources, and any direct pay federal interest subsidy received by the State in connection with the issuance of any taxable STO bonds (Build America Bonds) are intended to cover the cost of the State’s share of the infrastructure program, including debt service requirements on STO bonds. After providing for STO debt service requirements, the balance of the receipts

III-58
from such revenue sources may be applied to the payment of general obligation bonds of the State issued for transportation purposes and for the payment of annually budgeted expenses of the Department of Transportation and the Department of Motor Vehicles.
The table below shows the amount of STO bonds authorized by bond acts in effect, the amount the State Bond Commission (the “Commission”) has authorized, the amount of bonds issued pursuant to Commission authorizations, the balance remaining authorized but unissued, the balance available for authorization, and the amount outstanding. It is anticipated that additional STO bonds will be authorized by the General Assembly annually in an amount necessary to finance and complete the transportation infrastructure program. Such additional bonds may be issued on an equal rank with the outstanding bonds provided certain pledged revenue coverage requirements of the STO bond indentures controlling the issuance of such bonds are met.
TABLE 15
Special Tax Obligation Bonds As of February 15, 2016
(In Millions)
New Money Refundings(a) Total
Bond Acts in Effect $ 13,422.0 N/A $ 13,422.0 Amount Authorized(b) 13,125.3 N/A 13,125.3 Amount Issued 9,920.2 $ 4,158.7 14,078.8 Authorized but Unissued 3,205.1 N/A 3,205.1 Available for Authorization 296.8 N/A 296.8 Amount Outstanding 3,649.5 870.2 4,519.7
______________
(a) Refunding Bonds do not require legislative approval. (b) The amount authorized reflects amounts allocated by the State Bond Commission.
SOURCE: State Treasurer’s Office
In addition to STO Bonds, the State has issued direct general obligation bonds for transportation purposes and the debt service on these bonds may be paid from resources of the Special Transportation Fund provided there is sufficient funding first to pay all STO debt service. For Fiscal Year 2015 the Special Transportation Fund paid $0.1 million of State direct general obligation refunding transportation debt service payments. The amount budgeted by the Special Transportation Fund for State direct general obligation transportation debt service payments for Fiscal Year 2016 is $0.6 million.
The Special Transportation Fund’s revenues and expenses undergo periodic legislative adjustment. The revenues currently credited to the Fund consist of (i) the motor fuels tax (which includes the gasoline tax and the special fuels tax, which formerly were levied as separate taxes, and the motor carrier road tax); (ii) the petroleum products gross earnings tax; (iii) specific amounts of the general retail sales tax; (iv) motor vehicle receipts (e.g., fees for registration of motor vehicles); (v) license, permit and fee revenue (e.g., fees for license to sell or repair motor vehicles); (vi) specific amounts of the petroleum products gross earnings tax; (vii) specific amounts of the tax imposed on casual sales of motor vehicles, vessels, snowmobiles and aircraft; (viii) moneys formerly received by the State from the Federal Transit Administration pursuant to the Urban Mass Transportation Act of 1964; (ix) specified amounts to be transferred from the General Fund during certain fiscal years; and (x) other receipts, funds, and moneys credited to the Fund.

III-59
The General Assembly created a new statutory transportation “lock box” which establishes the Special Transportation Fund as a perpetual fund, the resources of which shall remain in the Special Transportation Fund to be expended solely for transportation purposes including the payment of debt service on STO Bonds. All sources of moneys required by State law to be credited to the Special Transportation Fund after June 29, 2015 are to continue to be credited to such fund to the extent the State collects or receives such moneys.
Governor Malloy proposed a 30-year, $100 billion transportation initiative to modernize Connecticut’s infrastructure. In conjunction with that proposal the Governor established the Transportation Finance Panel and appointed its members consisting of experts in transportation, finance and economic development. The panel was charged with examining funding options and developing recommendations for the implementation of Governor Malloy’s transportation initiative and on January 15, 2016 the panel presented its report to the Governor.
Other Special Revenue Funds and Debt
Bradley International Airport
Bradley International Airport, located in Windsor Locks, Connecticut, is owned and operated by the Connecticut Airport Authority (“CAA”), a quasi-public authority of the State governed by an eleven member board. Until July 1, 2013 the Airport was owned by the State and operated by the Bureau of Aviation and Ports in the State’s Department of Transportation. The General Assembly authorized the issuance of revenue bonds for improvements at Bradley International Airport payable from all or a portion of the revenues generated at the Airport. Legislation passed in 2001 removed a bond issuance cap for Bradley International Airport but retained the requirement for Commission approval of any new bond issue. As of February 15, 2016, there were $122.98 million of Bradley International Airport Revenue Refunding Bonds outstanding. In addition, the State is a party to certain interest rate swap agreements with respect to certain outstanding bonds. Any obligations of the State under the interest rate swap agreements are payable from all or a portion of the revenues generated at the Airport. See Quasi Public Agencies - Connecticut Airport Authority (“CAA”).
Additional special obligation bonds to finance self-sustaining special facilities at Bradley International Airport payable solely from the revenues derived from such special facilities were authorized in 1993. In March 2000 the State issued $53.8 million Bradley International Airport Special Obligation Parking Revenue Bonds to finance the construction of a five story parking garage facility at the airport and as of February 15, 2016, $30.6 million of such bonds were outstanding.
Clean Water Fund
The General Assembly has authorized the issue of revenue bonds for the purpose of funding various State and federally mandated water pollution control and drinking water projects for up to $3,195.58 million, of which $1,966.59 million have been issued. The revenue bonds are payable solely from the revenues or other receipts, funds or moneys of the Clean Water Fund. The proceeds of the revenue bonds are loaned primarily to Connecticut municipalities and public water systems to finance water pollution control and drinking water improvements, and the loan repayments by the municipalities and public water systems secure the revenue bonds. The loans are evidenced by interim funding obligations and project loan obligations of the municipalities and public water systems, pursuant to which either the full faith and credit of each such entity, or the revenues and other funds of a municipal sewer or public water system are pledged. As of February 15, 2016, $813.1 million revenue bonds were outstanding (including refunding bonds).

III-60
Unemployment Compensation
The State pays unemployment compensation benefits from the State’s Unemployment Compensation Fund, which is funded by unemployment compensation taxes collected from employers. To fund possible shortfalls, the State has reserved the authority to issue bonds in an aggregate amount outstanding at any time not in excess of $1.0 billion, plus amounts for certain reserves and costs of issuance. In addition, the State may borrow from the Federal Unemployment Trust Fund to fund a deficit in the State’s Unemployment Compensation Fund. As of February 15, 2016, State borrowings outstanding from the Federal Unemployment Trust Fund were $100.89 million. The State anticipates that there will be additional borrowing from the Federal Unemployment Trust Fund in the amount of approximately $41 million during calendar year 2016, and that such additional $41 million will be repaid on or prior to September 1, 2016. The State anticipates excess amounts in the State’s Unemployment Compensation Fund will be applied to reduce its debt and that there will be no borrowings outstanding from the Federal Unemployment Trust Fund at the end of calendar year 2016.
Second Injury Fund
The Second Injury Fund is a State-run workers’ compensation insurance fund that pays lost wages and medical benefits to qualified injured workers. The State established the Second Injury Fund in 1945 to encourage the hiring of persons with pre-existing physical impairments, such as veterans and provide relief to employers when an injured worker, who already had a pre-existing injury or condition, was hurt on the job and the second injury was made worse by the existence of the first injury. In 1995 and 1996, the State enacted legislation to close the Second Injury Fund to future second injury claims. Those laws authorized the issuance of an amount not to exceed $750 million in revenue bonds and notes outstanding at any one time to provide funds for paying past claims. No bonds or short-term borrowings are currently outstanding. The State’s management objective is to pay additional claims and settlements from current income and, if necessary, short term borrowings.
Contingent Liability Debt
The General Assembly has the power to impose limited or contingent liabilities upon the State in such a manner as it may deem appropriate and as may serve a public purpose. This power has been used to support the efforts of quasi-public agencies, municipalities and other authorities formed to carry out essential public and governmental functions by authorizing these entities to issue indebtedness backed, partially or fully, by General Fund resources of the State. Not all entities that are authorized to issue such indebtedness have done so, and the description below of the State’s limited or contingent liability is restricted only to specific indebtedness backed by the State.
Special Capital Reserve Funds
The primary vehicle through which the State has undertaken contingent or limited liability is the special capital reserve fund. A special capital reserve fund (“SCRF”), if established, provides additional security for bonds issued by the entity authorized to establish such a reserve fund. Subject to exceptions in the legislation authorizing the establishment of a particular SCRF, monies held in and credited to a SCRF are intended to be used solely for the payment of the principal of bonds secured by such SCRF, the purchase of such bonds, the payment of interest on such bonds or the payment of any redemption premium required to be paid when such bonds are redeemed prior to maturity. The SCRF is frequently funded with bond proceeds to a specified amount (the minimum of which is often the maximum annual principal and interest payments due on the bonds). The State undertakes the obligation to restore a SCRF to its minimum level. The method for determining such required minimum capital reserve is set out in the legislation authorizing the SCRF. If the SCRF should fall below the required minimum capital reserve amount, an official of the authority or municipality which established the SCRF shall certify to the Secretary of OPM or the Treasurer or both the amount necessary to restore such SCRF to the required minimum capital reserve amount. On or before December 1, annually, there will be deemed to be appropriated from the State’s General Fund such amount as

III-61
specified in the certificate, which amount shall be allotted and paid to the entity that established the SCRF. On an annual basis, the State’s liability under any SCRF mechanism is limited to its obligation to restore that fund to its minimum capital reserve amount.
Quasi-Public Agencies
The State has established a number of quasi-public agencies that are not departments, institutions or agencies of the State. They are, however, bodies politic and corporate that constitute public instrumentalities and political subdivisions of the State and whose exercise of authority granted to them is deemed to be the performance of an essential public and governmental function. These organizations provide a wide range of services that might otherwise be provided directly by the State.
Among the public authorities are: the Connecticut Green Bank; the Connecticut Airport Authority; the Connecticut Health and Educational Facilities Authority; the Connecticut Higher Education Supplemental Loan Authority; the Connecticut Housing Finance Authority; Connecticut Innovations, Incorporated; the Capital Region Development Authority; and the Materials Innovation and Recycling Authority. Each of these public authorities is authorized to issue bonds in its own name to facilitate its activities and, with the exception of the Connecticut Airport Authority and the Connecticut Green Bank, each has issued bonds secured by a SCRF, or other contractual arrangement, for which the State has limited contingent liability.
Connecticut Airport Authority (“CAA”). The Connecticut Airport Authority (“CAA”) was created in 2011 and is governed by an eleven member board comprised of the Treasurer, the Commissioner of Transportation, and the Commissioner of Economic and Community Development, each serving ex officio; four members appointed by the Governor; and a member appointed by each of the President Pro Tempore of the State Senate, the minority leader of the State Senate, the Speaker of the State House of Representatives and the minority leader of the State House of Representatives. On July 1, 2013 ownership, management and operations of Bradley International Airport and the State’s other general aviation airports were transferred from the State’s Department of Transportation to CAA. The CAA is authorized to issue revenue bonds, including bonds backed by a SCRF.
The Connecticut Green Bank (“Green Bank”). The Connecticut Green Bank, formerly called the Clean Energy Finance and Investment Authority was formed in 2011 and was designated the successor agency to Connecticut Innovations, Incorporated for the purposes of administering the Clean Energy Fund. The Green Bank is an energy finance authority, designed to leverage public and private funds to drive investment and increase clean energy deployment in Connecticut. The Green Bank is authorized to issue bonds to facilitate its activities, which bonds may be secured by a SCRF. The Green Bank Board of Directors is comprised of eleven voting and two non-voting members including: the Treasurer, the Commissioner of Energy and Environmental Protection, and the Commissioner of Economic and Community Development, each serving ex-officio; four members appointed by the legislative leadership; and four members appointed by the Governor. The president of the Green Bank and a member of the Board of Directors of Connecticut Innovations, Incorporated, serve in an ex-officio, non-voting capacity.
Connecticut Health and Educational Facilities Authority (“CHEFA”). CHEFA was established to assist in the financing of facilities for educational or health care purposes, including colleges and universities, secondary schools, nursing homes, hospitals, child care facilities, and any other qualified non-profit institutions through the issuance of bonds and other obligations. CHEFA loans the proceeds of its bond issues to client institutions, which make debt service payments on such loans that match CHEFA’s payment obligations under its bonds. CHEFA is also authorized to issue tax-exempt and taxable revenue bonds secured by one or more special capital reserve funds solely to finance projects for “participating nursing homes,” or for housing, student centers, food service facilities and other auxiliary service facilities at public institutions of higher learning, including the Connecticut State University System, or for clinical services projects for the University of Connecticut Health Center, and up to $100.0 million to finance equipment acquisitions by hospitals.

III-62
CHEFA also is authorized to issue bonds and loan the proceeds to various entities to finance child care facilities. The State Treasurer is committed to pay the debt service on these loans, subject to annual appropriation. See Other Debt Service and Contractual Commitments – CHEFA Child Care Program.
The Connecticut Higher Education Supplemental Loan Authority (“CHESLA”) is a subsidiary of CHEFA. See Connecticut Higher Education Supplemental Loan Authority (“CHESLA”) below.
The Board of Directors of CHEFA is comprised of ten members including the Treasurer and the Secretary of OPM, both serving ex officio, and eight members appointed by the Governor based on their qualifications in the areas of health care, higher education, or public finance.
Connecticut Higher Education Supplemental Loan Authority (“CHESLA”). CHESLA provides financial assistance in the form of education loans to students in or from the State. CHESLA is authorized to issue bonds the proceeds of which are used to fund education loans to applicants meeting certain eligibility requirements. The repayment of such loans is used to make debt service payments on CHESLA bonds. CHESLA, in connection with the issuance of its bonds has made certain covenants with respect to such loans, including a covenant to do or cause to be done all such acts and things necessary to receive and collect all revenues due with respect to such loans. CHESLA bonds are further secured by a SCRF. CHESLA is also authorized to provide loans to refinance eligible education loans of qualified borrowers.
CHESLA is a subsidiary of CHEFA. See Connecticut Health and Educational Facilities Authority (“CHEFA”) above. The Board of Directors of CHESLA is comprised of nine members including the Treasurer, the President of the Board of Regents for Higher Education, and the Secretary of OPM, the Chairperson of the Board of Directors of CHEFA, and the Executive Director of CHEFA, each serving ex officio; and four members appointed by the Board of Directors of CHEFA.
Connecticut Housing Finance Authority (“CHFA”). CHFA was established in 1969 to meet the needs of low and moderate income families and persons for decent housing and to encourage and assist the development and construction of multi-family housing by reducing the cost of mortgage financing therefor. CHFA is authorized to issue bonds the proceeds of which are used to fund mortgage loans to applicants meeting certain eligibility requirements including unrestricted statutory income limits in certain urban areas. The enabling act authorizes CHFA to make or purchase construction and permanent mortgage loans that are guaranteed or insured by the United States of America or any agency or instrumentality thereof, by the Federal Home Loan Mortgage Corporation, by a private mortgage insurance company or the State or the Authority itself without limitation as to amount and to make or purchase mortgage loans not so insured or guaranteed in an aggregate amount not to exceed $2.25 billion. In order to finance these activities, CHFA established a Housing Mortgage Finance Program and issued its general obligation bonds under a General Bond Resolution pursuant to which CHFA has pledged all revenues that it may receive in connection with the mortgages financed thereunder including its fees and charges therefor and any recoveries of principal therefrom from any source and any monies received from investments, as well as other mortgages specifically pledged. In addition, such General Bond Resolution provides for general covenants such as a covenant to do all things necessary with respect to the operation of such Housing Mortgage Finance Program in order to pay principal of and interest on its bonds and provides for certification as to self-sufficiency in order to issue any additional bonds. Bonds issued under CHFA’s General Bond Resolution are further secured by a SCRF.
CHFA has also established a Special Needs Housing Mortgage Finance Program (formerly known as the Group Home Mortgage Finance Program) and has issued and expects to issue additional State-Supported Special Obligation Bonds under a separate indenture, including bonds for group homes, assisted living facilities, and residential care homes, which bonds are and will be secured by a SCRF. CHFA also issues bonds for supportive housing and emergency mortgage assistance for which the debt service is paid by the State pursuant to contracts for State assistance. See State Debt – Types of Direct General Obligation Debt – Supportive Housing Financing and Emergency Mortgage Assistance Program.
III-63
The Board of Directors of CHFA is comprised of sixteen members: the Commissioner of Economic and Community Development, the Commissioner of the Department of Housing, the Secretary of OPM, the Commissioner of Banking and the Treasurer, serving ex officio; seven members appointed by the Governor; and a member appointed by each of the President Pro Tempore of the State Senate, the minority leader of the State Senate, the Speaker of the State House of Representatives and the minority leader of the State House of Representatives who among them are experienced in all aspects of housing design, development, finance, management and state and municipal finance. The Chairperson of the Board is appointed by the Governor.
Connecticut Innovations (“CI”). The Connecticut Development Authority (“CDA”) was merged into Connecticut Innovations, effective July 1, 2012. In order to discharge its responsibilities and fulfill its purposes, CI is authorized to offer various financing programs including The Mortgage Insurance and Loan Program (the “Insurance Fund”). As of February 15, 2016, $19.5 million of State bonds have been authorized but remain unissued to fund the Insurance Fund and loans insured by the Insurance Fund totaled $2.1 million.
Under the General Obligation Bond Program, CI may issue bonds to finance eligible economic development and information technology projects. General revenues of CI, which are not otherwise pledged, are made available to service the debt of bonds issued under the General Obligation Bond Program, and such bonds may be secured by a SCRF. As of February 15, 2016, no such bonds are outstanding. Although there remains legislative authority for the issuance of bonds secured by special capital reserve funds under the Umbrella Bond Program, no loans have been initiated under that program since 1985, and CI does not anticipate a resumption of any lending activity under that program.
The Board of Directors of CI is comprised of 17 members: the Treasurer, the Commissioner of Economic and Community Development, the Secretary of OPM, and the president of the Board of Regents for Higher Education, as ex officio members; nine members appointed by the Governor; and four members appointed by legislative leadership.
Capital Region Development Authority (“CRDA”). In 2012 the Capital City Economic Development Authority (“CCEDA”) was re-named the Capital Region Development Authority (“CRDA”). Created in 1998 as CCEDA, it was granted the power to issue revenue bonds for a convention center project in the City of Hartford. The bonds are backed by State contractual assistance equal to annual debt service. CRDA also is authorized to use special capital reserve funds in connection with such revenue bonds, but there are currently no plans to do so. The 2012 legislation broadened the CRDA’s powers to stimulate development and redevelopment in the City of Hartford and the surrounding towns, including East Hartford. CRDA’s Board of Directors is made up of 14 members, four of whom are appointed by the Governor, two of whom are appointed by the Mayor of Hartford, and two of whom are appointed by legislative leadership. The Mayors of Hartford and East Hartford, the Secretary of OPM, and the Commissioners of Transportation, Housing and Economic and Community Development serve as ex-officio members of the Board.
Materials Innovation and Recycling Authority (“MIRA”). Effective June 6, 2014, the Materials Innovation and Recycling Authority (“MIRA”) was designated as successor to the Connecticut Resources Recovery Authority (“CRRA”). As of this date, MIRA assumed control of CRRA’s rights, duties and obligations and continues CRRA’s ongoing business. Under State law, any contract, right of action or matter undertaken or commenced by CRRA may now be undertaken and completed by MIRA in the same manner, under the same terms and conditions, and with the same effect as if completed by CRRA.
MIRA’s purpose, like that of CRRA, continues to be the development and operation of solid waste disposal, volume reduction, recycling, intermediate processing, resource recovery and related support facilities necessary to carry out the State’s Solid Waste Management Plan. Public Act No. 14-94 established a new consultative partnership between MIRA and the State’s Department of Energy and Environmental Protection (DEEP) specifically for redevelopment of MIRA’s Connecticut Solid Waste System (CSWS), and generally for the development of new waste management industries, technologies and commercial enterprises on property owned by MIRA.

III-64
CRRA developed a number of resource recovery and related facilities, including the Mid Connecticut Project (now the CSWS), Southeast, Bridgeport and Wallingford projects. While the underlying Southeast Project bonds previously backed by a SCRF have been fully paid, the operating contracts for the Southeast Project remain in effect under MIRA’s auspices while it undertakes project closeout activities, the Mid Connecticut Project has been transitioned into the CSWS also now under MIRA’s auspices, and the Bridgeport and Wallingford projects have reverted to private ownership and control. MIRA bonds may be secured by a SCRF.
The Board of Directors of MIRA is comprised of eleven members: three members appointed by the Governor; two members appointed by each of the president pro-tempore of the Senate, the speaker of the House of Representatives, the minority leader of the Senate, the minority leader of the House of Representatives. There are three vacancies. In addition, there are four ad hoc members, two representing each of the two facilities remaining active under MIRA. As of February 15, 2016, only one ad hoc seat was filled.
UConn 2000 Special Obligation Financing. The University of Connecticut may issue special obligation bonds that may be secured by a SCRF, which the State undertakes to restore to its minimum level. Before issuing special obligation bonds secured by such a SCRF, the act requires the board of trustees of the University to determine that project revenues, other than those derived from the State’s debt service commitment and the State’s minimum operating provision, are estimated to be sufficient to pay the debt service on the special obligation bonds, to maintain reserves and to operate the physical infrastructure of the University. The act requires the Treasurer to confirm that such determination is not unreasonable or arbitrary. The University may also issue special obligation bonds that are not secured by such a SCRF. As of February 15, 2016, the University has outstanding $112.4 million special obligation student fee revenue bonds that are not secured by such a SCRF.
Assistance to Municipalities
The State has undertaken certain limited or contingent liabilities to assist municipalities. The State currently has limited or contingent liabilities outstanding in connection with bonds issued by the Southeastern Connecticut Water Authority. The State previously was obligated to secure certain SCRF-backed bonds issued by the Cities of Bridgeport, Waterbury and West Haven to fund past budget deficits; however all such bonds have been refunded. Legislation also authorized distressed municipalities, in certain circumstances and subject to various conditions, to issue deficit funding obligations secured by a SCRF. There are no such obligations currently outstanding.
Southeastern Connecticut Water Authority. The Southeastern Connecticut Water Authority was established for the purpose of developing a reliable water supply for southeastern Connecticut. The Commission is authorized to approve a State guarantee of obligations of the Southeastern Connecticut Water Authority. Amounts borrowed by the Southeastern Connecticut Water Authority are to be repaid by July 1, 2045.
State Treasurer’s Role
By statute, the Green Bank, CAA, CHEFA, CHESLA, CHFA, CI, CRDA, and MIRA may not owe any money or issue any bonds or notes that are guaranteed by the State or for which there is a SCRF of any kind which is in any way contributed to or guaranteed by the State until or unless such borrowing or issuance is approved by the Treasurer or the Deputy Treasurer. The approval shall be based on documentation provided by the authority that the authority anticipates receiving sufficient revenues to (1) pay the principal of and interest on the bonds and notes to be issued, (2) establish, increase and maintain any reserves deemed by the authority to be advisable to secure the payment of the principal of and interest on such bonds and notes, (3) pay the cost of maintaining, servicing and properly insuring the purpose for which the proceeds of the bonds and notes have been issued, if applicable, and (4) pay such other costs as may be required.

III-65
Similarly, no municipality may issue any obligation for which there is a SCRF of any kind that is in any way contributed to or guaranteed by the State unless and until such obligation and the agreement establishing the capital reserve fund are approved by the Treasurer. The Treasurer’s approval shall be based upon factors delineated in the general statutes, including the establishment of a property tax intercept procedure to service the municipality’s debt.
Outstanding Special Capital Reserve Fund Debt
The amount of outstanding debt that is secured by special capital reserve funds as described above is outlined in the following table.
TABLE 16
Special Capital Reserve Fund Debt As of February 15, 2016
(In Millions)
Indebtedness Secured by SCRF
Authorized
Debt
Outstanding
Debt
Minimum SCRF
Requirement
Capital Region Development Authority ............................. $ (a) $ 0.0 $ 0.0 Connecticut Airport Authority ........................................... (a) 0.0 0.0 Connecticut Green Bank(b) .................................................. 100.0 0.0 0.0 Connecticut Health and Educational Facilities
Authority Nursing Home Program ...................................................... (a) 0.9 0.9 Connecticut State University System .................................. (a) 302.0 31.3 Hospital Equipment Program .............................................. 100.0 0.0 0.0 UCONN Health Center Program ........................................ (a) 0.0 0.0 Connecticut Higher Education Supplemental Loan
Authority .......................................................................... 300.0 150.2 17.9 Connecticut Housing Finance Authority Housing Mortgage Finance Program .................................. (a) 3,373.2 225.6 Special Needs Housing Mortgage Finance Program .......... (a) 58.1 4.6 Connecticut Innovations(c) .................................................. 450.0 0.0 0.0 Materials Innovation and Recycling Authority(d) ............ 725.0 0.0 0.0 Southeastern Connecticut Water Authority(e) ................... 15.0 1.05 N.A. University of Connecticut .................................................... (a) 0.0 N.A.
______________
(a) No statutory limit. (b) Formerly the Clean Energy Finance and Investment Authority. (c) Includes the former Connecticut Development Authority. (d) Formerly the Connecticut Resources Recovery Authority. (e) Debt is secured by a non SCRF State guarantee.

III-66
Other Debt Service and Contractual Commitments
CHEFA Child Care Program. CHEFA is authorized to issue Child Care Facilities Bonds and loan the proceeds to various entities to finance child care facilities. Debt service payments are made by the State Treasurer and the State Office of Early Childhood is obligated to reimburse a portion of the debt service payments from intercepts of revenues from providers. Any obligation by the State Treasurer to pay such debt service is subject to annual appropriation. As of February 15, 2016 CHEFA had approximately $55.96 million in Child Care Facilities Bonds outstanding under this program with annual debt service of approximately $4.87 million, of which the State Office of Early Childhood is committed to reimburse approximately $0.75 million. The State’s obligation under the assistance agreement is not included in any of the debt calculations in Tables 7, 8, 9, 10, 11, 12 or 16. Two other Child Care Facilities programs also authorize the Commissioner of the State Office of Early Childhood to enter into guaranties of loans made to entities to finance the development of child care and child development centers or programs. CHEFA is administering this program on behalf of the State Office of Early Childhood, and is currently limiting the aggregate amount of guaranties to the balance of monies in the reserve funds for the respective programs. The State’s obligations in connection with these programs are not included in any of the debt calculations in Tables 7, 8, 9, 10, 11, 12 or 16.
Capital Region Development Authority. The State Bond Commission approved up to $122.5 million of revenue bonds and other borrowings for the Hartford convention center project. CCEDA, as predecessor to CRDA, issued $110 million of its revenue bonds backed by the State’s contract assistance agreement equal to annual debt service on the revenue bonds, of which $89.02 million was outstanding as of February 15, 2016. The State’s obligation under the contract assistance agreement is limited to $9.0 million per year, and the Authority’s debt obligations are structured not to exceed this amount. An additional $12.5 million of borrowing, not backed by the contract assistance agreement, has also been incurred. Debt service on the revenue bonds is payable from debt service appropriations in the General Fund and CRDA is obligated to reimburse the State for such contract assistance payments from parking and energy fee revenues after payment of operating expenses of the parking garage and the energy facility. Under the agreement between CRDA and the State, after completion of the convention center project, CRDA is required to maintain pledged revenues equal to 1.2 times debt service, after operating expenses. The State’s obligation under the assistance agreement is not included in any of the debt calculations in Tables 7, 8, 9, 10, 11, 12 or 16. The convention center portion of the project opened in June 2005. Other elements of the project include an adjacent parking structure which opened later in 2005, a second adjacent parking structure underlying the Connecticut Science Center and a retail and entertainment district, including two additional parking structures and 121 residential housing units. Currently, the future UCONN downtown Hartford campus is under construction. The entire project is not expected to be fully placed in service until 2019 at the earliest. Since June 2006, the delay in completion of the additional elements of the project, along with higher than anticipated startup expenses and operating expenses have resulted in insufficient parking revenues, after operating expenses, to fully reimburse the State for debt service payments. This situation is expected to continue at least until all elements of the project are completed and placed in service. As debt service on CRDA's revenue bonds continues to be paid under the contract assistance agreement, CRDA’s reimbursement obligation will increase, and this reimbursement obligation will need to be satisfied before excess parking revenues are available to fund the operations of the convention center, which itself is partially funded by General Fund appropriations from the State to CRDA.
School Construction Grant Commitments. The State is obligated to various cities, towns and regional school districts under a grant-in-aid public school building program to fund certain of the costs of construction and alteration of school buildings or to support part of the debt service payments on municipal debt issued to fund the State’s share of such school building projects. For certain school projects approved by
III-67
the General Assembly, cities, towns and districts are ranked according to their adjusted equalized net grand list per capita and based on such rankings a percentage is assigned that determines the amount of grant money a town or regional school district is eligible to receive for a project or type of project authorized by the legislature and approved by the Commissioner of Administrative Services.
For school construction projects approved during the 1997 legislative session and thereafter, the State pays the costs of its share of construction projects on a progress payment basis during the construction period. Each year the legislature authorizes grant commitments that vary in amounts from year to year. The State has authorized new school construction grant commitments of approximately $732 million that take effect in Fiscal Year 2016. As of June 30, 2015, the Commissioner estimates that current grant obligations under the program for school construction projects approved during the 1997 legislative session and thereafter are approximately $3,029 million, which includes approximately $10,244 million in grants approved as of such date less payments already made of $7,215 million.
Prior to 1997 the grant program was conducted differently. Under the pre-1997 grant program, school construction project grants are paid to the cities, towns and districts in installments that correspond to the number and time of principal payments due on municipal bonds, or temporary notes renewed for a third or subsequent year, issued to finance project costs. If a project is fully paid from sources other than borrowing, such grants are paid in five annual installments. Grants in support of interest payments correspond to the number and time of such interest payments. As of June 30, 2015, under the pre-1997 grant program, the State is obligated to various cities, towns and regional school districts for approximately $91 million in aggregate principal installment payments and $9 million in aggregate interest subsidies, for a total of $100 million.
The legislature has authorized bonds for both grant programs based on the amount of grants that the Commissioner of Administrative Services estimates will be paid during each fiscal year. Since there is generally a lapse of one or more years from the time grant commitments are approved to the time grant payments are required to be made, the amount of unpaid grant commitments will be significantly greater than the amount of bonds authorized to fund the grant commitments.
Connecticut Lottery Corporation. The Connecticut Lottery Corporation (the “Corporation”) was created in 1996 as a public instrumentality of the State to operate the State’s lottery pursuant to the Connecticut Lottery Corporation Act (the “CLC Act”). The State and the Corporation purchase annuities under contracts with insurance companies that provide payments corresponding to the obligation for payments to lottery prize winners. The State has transferred to the Corporation all annuities purchased by it, and the Corporation has assumed responsibility for the collection of revenue generated from the lottery and for the payment of all lottery prizes. Under the CLC Act, the termination of the Corporation would not affect any outstanding contractual obligation of the Corporation and the State would succeed to the obligations of the Corporation under any such contract. As of June 30, 2015 the current and long-term liabilities of the Corporation total $218.4 million.

III-68
PENSION AND RETIREMENT SYSTEMS
The State sponsors several public employee retirement systems and also provides other post-employment benefits. This section will describe these plans in turn. It should be noted that the characteristics of the pension plan systems, where significant assets are available to meet the State’s obligations, are different than the characteristics of the systems providing other post-employment benefits, which have not accumulated significant assets. Both types of plans have unfunded liabilities that represent significant financial obligations of the State, both now and in the future. In round numbers, the unfunded liability of the pension systems aggregate approximately $25.7 billion and the unfunded liability of the other post-employment benefits aggregate approximately $22 billion.
Pension Systems -- Overview
The State sponsors several public employee retirement systems discussed in more detail in this section. The two largest of these are the State Employees’ Retirement System (“SERS”) and the Teachers’ Retirement System (“TRS”). These plans have been in operation for a number of years and have significant assets held for the purposes of the plan. Like other similar plans, each plan began with “pay-as-you-go” funding, where benefits to beneficiaries were paid from the General Fund when due. In 1971 the plans were converted to actuarially funded plans and irrevocable trusts were established to accumulate assets that are invested on a long-term basis to fund future liabilities on an actuarial basis. In an actuarially funded pension plan, plan contributions, plus plan assets and the return on plan assets, are designed to meet the future benefits payments over the life of the plan.
The transition of the plans from a “pay-as-you-go” basis to a fully funded actuarial basis requires setting aside significant assets. As it would be impractical to set aside the accumulated liability in a short period, it was contemplated that the plans would achieve full funding over a period of time. When both of the State’s major pension plans were converted to an actuarial funding method, the original time period set to achieve full funding was set at 40 years, a period which was extended in the past. Under the current funding model, the remaining period to reach full funding is approximately 19.4 years (as of June 30, 2015) for the Teachers’ Retirement Fund and 16 years (as of June 30, 2015) for the State Employees’ Retirement Fund, as long as the State fully funds the annual funding requirement recommended by the actuary, as described below and the actuarial assumptions are realized. This actuarially recommended contribution is referred to as the “ARC”.
One measure of the level of funding is the “funded ratio”, which is calculated by dividing the actuarial
value of the assets of the plan by the actuarial accrued liability of the plan. The funded ratio for each plan is shown herein. Also shown is the funded ratio calculated based on the market value of the assets of the plan. Until 2000, the pension plans made steady progress towards being fully funded; for example, SERS experienced an increase in the funded ratio from 51% in 1993 to 63% in 2000, and the funding required remained fairly constant at 12.8% to 14.9% of payroll. Two factors had a significant impact in reversing this trend. First, significant market downturns experienced in Fiscal Years 2000, 2001 and 2009 reduced the market value of the assets set aside in the plans. Second, prior to Fiscal Year 2009, in the case of TRS, and prior to Fiscal Year 2012 in the case of SERS, the State failed to fully fund its ARC payments. In Fiscal Years 2009-2011 the shortfall in funding of the ARC payments for SERS totaled $314.5 million.
Because of factors such as these, it is important that the funding plan be revisited periodically.
Accordingly, by statute, actuarial valuations are performed with respect to the systems every two years. Because these valuations are estimating future resources and future liabilities, it is necessary to make important assumptions in arriving at these future assets and liabilities. Using these assumptions, the actuarial valuation compares the actuarial accrued liability with the actuarial value of assets and any excess of that liability over the assets forms an unfunded actuarial accrued liability (“UAAL”). This UAAL represents the remaining amortization of the original unfunded status, changes in the UAAL arising from actual experience compared to these assumptions (including actual investment performance compared to assumed performance), changes in

III-69
the actuarial assumptions, and any failure to fully fund actuarially recommended contributions in prior years. The actuarial valuation then arrives at a recalculated actuarially recommended contribution for future years, which represents the sum of benefits to be accrued in these years, plus the amortization of the recalculated UAAL over the remaining amortization period.
In addition to these recalculations, the State has taken several additional steps in the last few years to
address the funding issues with the plans. In the case of SERS, it has negotiated reduced benefits, as described below, made more conservative assumptions which have had the effect of increasing the UAAL, and eliminated the provisions which permitted the State to not fund its full ARC payment. In the case of TRS, it has issued pension obligation bonds to augment the funding of the system, system which included a bond covenant requiring the State to fund the ARC, subject to certain financial exigencies. These additional steps are described in more detail below for each plan.
While the UAAL for each plan is large and the funded ratio is low, the State has been of the view that
the amortization period it has used and its commitment to amortization of the UAAL are indicators of the stronger overall health of its retirement plans, compared to plans of other states using longer or rolling amortization periods but having similar funded ratios. In addition to statutory commitments (which can be, and have been, changed by legislation), and unlike many similar plans, the State now has contractual commitments requiring annual funding of the ARC. In the case of TRS, the State is required to fund the annual amount as a condition of a bond covenant which runs through the end of the plan’s amortization period in 2032. In the case of SERS, the State is required to annually fund the ARC pursuant to its bargaining agreement with the State Employees Bargaining Agent Coalition (“SEBAC”), which runs through 2022; the amortization period continues to 2032.
Recently various State officials have proposed the State begin consideration as to whether the current funding model for pension benefits continues to be appropriate. Concerns have arisen regarding projected increases in State pension contributions under the current funding method that could be required in the latter years of the fixed amortization period in order to achieve 100% funding of the UAAL in 2032. Once 100% funding is reached, the State’s required pension contributions are projected to be significantly reduced to the normal cost amount described below.
Various proposals have been made by the Governor, the State Treasurer, and the State Comptroller for
the use of different methodologies designed to avoiding the need to fund such higher future State contributions towards the end of the current fixed amortization period and to smooth out the future annual cost of funding the State’s pensions over time. These different methodologies, if adopted, could change the manner in which the State funds the pension systems, the time period over which it is funded, and the manner in which the annual funding amount is calculated. To be implemented, any proposal would need to take into account various accounting, actuarial, statutory and contractual factors including the SEBAC agreement and adherence to the TRS pension obligation bond covenant described above. No representation is made about the possible results of the consideration of these proposals and the impact they may have on the State’s current funding model.
The Governor in his February 3, 2016 “State of the State” address before the General Assembly indicated that he had directed the Secretary of the Office of Policy and Management to create a task force of the stakeholders in the State’s retirement systems, including the State Treasurer, the Comptroller, SEBAC and the State employees it represents, and Connecticut teachers, to develop a consensus as to making the State’s retirement systems more affordable and more sustainable. The first meeting of the Task Force is anticipated to be held in March 2016.

III-70
Actuarial Valuations
The actuarial value of the liabilities of the plan are not current liabilities but represent a present value measure of the stream of benefits that the plan is expected to pay over the foreseeable future. These benefits in turn depend on future events, such as the size of the workforce, the rate workers leave the workforce, the rate of retirement, the rate of mortality of retirees, the rate of salary increase and the rate benefits accrued at retirement increase by future cost of living increases, among other factors. The State engages actuaries to assist it in selecting assumptions about these factors, and based on these assumptions, the actuary estimates the current stream of future benefits. In order to come to an estimate of the accrued liabilities of the plan, this stream of estimated future benefits is discounted to a present value based on an assumed discount rate. The State uses a discount rate which is the same as its investment return assumption. The significant assumptions used in making these calculations are described below for each plan.
The actuarial valuation also will state an actuarially recommended contribution, the ARC, which is the recommended payment of the State to the applicable pension plan. These recommendations are used in the next budget cycle. The actuarially recommended contribution consists of two components: (1) normal costs, which represent the portion of the present value of retirement benefits that are allocable to active members’ current year of service, and (2) an amortization of a portion of the UAAL. These additional contributions, made over the length of time chosen as the amortization period, are designed to eliminate the UAAL and bring the plan to the state of being fully funded, after which only the normal cost amount would need to be contributed to maintain this state, plus the effect of actual experience compared to the actuarial assumptions. One of the most significant factors in determining this amount, and determining the point in time when the plan should be fully funded, is the remaining period over which the UAAL will be amortized. This period is approximately 19.4 years (as of June 30, 2015) for the Teachers’ Retirement Fund and 16 years (as of June 30, 2015) for the State Employees’ Retirement Fund, having originally started with an amortization period of 40 years for each. A second important factor is determining how much to amortize in each year of the remaining amortization period. The State plans use a “level percent of payroll” formula for this purpose, where in each year the same percent of assumed payroll for that year, is calculated as the amount to be amortized. This method assumes that the amortization payments increase in future years by the assumed increase in payroll since it calculates amortization payments as a constant percentage of projected payroll over a given number of years. The increase in the contribution rates are primarily attributable to the significant asset losses that are being recognized and increase the UAAL. This results in an increase in required funding to offset these recognized losses over the remaining amortization period. This makes the assumption of the rate at which payroll increases each year an important assumption. SERS uses a “projected unit credit” method to calculate the annual amortization payments needed to amortize the UAAL, while TRS uses an “entry age normal” method. The actuaries have indicated that the entry age normal method is the most widely used cost method of large public sector plans and has demonstrated the highest degree of contribution stability to alternative methods and also is the only method allowed under the new Governmental Accounting Standards Board (“GASB”) reporting standards which came into effect for 2014.
Between actuarial valuations the State generally receives an interim valuation, in which the actuarial value of assets are “rolled forward” but the actuarial value of liabilities are not recalculated. Where these interim valuations have been performed we set out below the new funding ratios that result.
The State began reporting pensions in accordance with GASB 67 and GASB 68 beginning with Fiscal
Year 2014, which prescribe certain methods for comparability and other purposes. These methods are not necessarily the same as those used in calculating the actuarial recommended contribution of the State, which are determined by statute and/or contract.
Set forth below in greater detail is information about the State Employees’ Retirement Fund and the Teachers’ Retirement Fund, including information about the matters discussed above, how plan benefits are calculated, how plan assets are invested, and the investment experience of these plans. With respect to SERS
III-71
in particular, the discussion of plan benefits is complicated because the benefits are not uniform but are divided into “tiers,” which have significantly decreased benefits for newer State employees.
State Employees’ Retirement Fund
The State Employees’ Retirement Fund is one of the systems maintained by the State with approximately (i) 50,556 active members, consisting of 37,597 vested members and 12,959 non-vested members, (ii) 1,453 deferred vested members, and (iii) 46,313 retired members and beneficiaries as of June 30, 2015.
Payments into the fund are made from employee contributions, General and Special Transportation
Fund appropriations and grant reimbursements from Federal and other funds. State contributions to the fund are made monthly on the basis of transfers submitted by the Office of the State Comptroller.
Full actuarial valuations are performed as of June 30th of each even-numbered year. The actuarial
valuation uses recognized actuarial methods to calculate the actuarial value of assets and the actuarial accrued liability of the State Employees’ Retirement Fund. The actuarial accrued liability is determined directly as the present value of benefits accrued to date, where the accrued benefits for each member is the pro-rata portion (based on service to date) of the projected benefit payable at death, disability, retirement or termination. The valuation uses an asset valuation method that smoothes the difference between the market value of assets and actuarial value of assets to prevent extreme fluctuations that may result from short-term or cyclical economic and market conditions. The actuarial value of assets is determined by first projecting the actuarial value forward from the beginning of the prior fiscal year based on the actual cash flow during the fiscal year and the assumed investment rate of return. One fifth of any difference between this expected actuarial value and the actual market value is added to or subtracted from the expected actuarial value to arrive at the actuarial value of assets in order to “smooth” year to year changes in market values. The unfunded actuarial liability is the actuarial accrued liability less the actuarial value of assets. The valuation includes a projection from the valuation date to future years based on certain key assumptions such as the investment return on the market value of assets, the active population count for hazardous and nonhazardous duty members, total payroll growth, age and salary distributions for new entrants, and actual plan experience with respect to terminations, retirement, mortality, and cost of living increases, among other things.
November 2014 Actuarial Valuation and the Fiscal Year 2016 and 2017 Annual Required
Contributions The State Employees Retirement Commission (the “Commission”) received on November 19, 2014
from Cavanaugh Macdonald Consulting, LLC an actuarial valuation as of June 30, 2014. This actuarial valuation was approved by the Commission’s Actuarial Subcommittee and the Commission on November 20, 2014.
The November 2014 actuarial valuation reported the following results as of June 30, 2014 with respect to the State Employees’ Retirement Fund:
Market Value of Assets $10,472.6 million Actuarial Value of Assets $10,584.8 million Actuarial Accrued Liability $25,505.6 million UAAL $14,920.8 million Funded Ratio (based on the actuarial value of assets) 41.5% Funded Ratio (based on the market value of assets) 41.1%
The November 2014 actuarial valuation was based upon the following assumptions among others:
• 8.00% investment return assumption (including inflation at 3.75%)

III-72
• Projected salary increases of 4.0% to 20.0% (including inflation at 3.75%)
• Cost-of-living adjustments of 2.3% to 3.6%
• Social security wage base increase of 3.5% • Payroll growth of 3.75%
• The actuarial value of assets recognizes 20% of the difference between the market value of assets and the expected actuarial value of assets
• Benefits for members retiring from service on or after the Longley v. State Employees Retirement Commission decision were assumed to increase by 0.084% as a result of the revised treatment of longevity pay. Retroactive application of Longley was reflected in the valuation to the extent impacted retiree benefits were recalculated. These recalculations are not reflected in Table 17 below. The Longley decision is described below under “Litigation”.
• Remaining amortization period of UAAL of 17 years
Pursuant to the statutory provisions applicable to the State Employees’ Retirement Fund and agreements between the State and SEBAC, which supplant the statutory provisions in part, the Fund’s UAAL is amortized as a level percent of payroll over a declining period of years, beginning with 40 years as of July 1, 1991. The State is currently amortizing the UAAL over a closed period ending June 30, 2032. While this method of funding should lead to full funding by the end of the amortization period, the repayment of the UAAL is not level. Because of this, even if the State were to contribute the full amount of the actuarially recommended contributions and all other actuarial assumptions were met, the UAAL for the State Employees’ Retirement Fund is not projected to be reduced significantly until the latter years of the amortization period.
The November 2014 actuarial valuation determined the following employer contribution
requirements, based on a projected unit credit actuarial cost method and level percentage-of-payroll contributions, which contributions are: (i) $1,514.5 million for Fiscal Year 2016, resulting in an annual employer contribution rate of 43.42% of payroll and (ii) $1,569.1 million for Fiscal Year 2017, resulting in an annual employer contribution rate of 43.69%. The adopted budget for Fiscal Years 2016 and 2017 contained appropriations sufficient, together with anticipated grant reimbursement from Federal and other funds, to fully fund the employer contribution requirement.
The November 2014 actuarial valuation breaks out the normal cost component and the amortization component as follows for Fiscal Years 2016 and 2017.
Annual Employer Contributions for: 2016 2017 Amount
(in millions)
Percent of Payroll
Amount (in millions)
Percent of Payroll
Employer Normal Cost $278.8 7.99% $287.2 8.00% Net Unfunded Actuarial Accrued liabilities (17 year level percent of payroll amortization)
$1,235.7
35.43%
$1,281.9
35.69%
Total Employer Contribution Requirement $1,514.5 43.42% $1,569.1 43.69% ___________________ SOURCE: November 2014 Actuarial Valuation.
As mentioned, the valuation used the projected unit credit actuarial cost method to calculate the annual amortization payments needed to amortize the State Employees’ Retirement Fund’s UAAL. In this method, the present value, discounted based on the interest rate assumed to be earned in the future (currently 8.00%), of each member’s expected benefits at retirement or death is determined, based on age, service and sex. In an experience investigation report dated September 12, 2012, the actuaries indicated that while this is an accepted actuarial method, the Commission may want to consider changing to the entry age normal cost method used by the Teachers’ Retirement System for several reasons, including that it is the only method allowed under the new GASB reporting standards which came into effect for 2014. Changing to the entry age

III-73
normal cost method would increase the unfunded accrued liability, decrease the funding ratio and increase the employer annual required contribution rate. The valuation cost method currently in place may not be changed without the agreement of the SEBAC and approval by the legislature.
The State Employees Retirement Commission received from Cavanaugh Macdonald Consulting, LLC a “roll forward” actuarial valuation report prepared as of June 30, 2015 and dated October 12, 2015. This roll forward valuation is an informational update to the actuaries’ projected required employer contribution amount, based on the actual experience of the investment return for the June 30, 2015 plan year and roll forward techniques, and offers a best estimate as to what payroll and liabilities were as of June 30, 2015. The actuaries did not perform a reconciliation of census data or development of liabilities as of June 30, 2015 in this roll forward valuation. In addition, there was no change in the actuarial assumptions. The roll forward actuarial valuation reflected actual investment returns for the Fiscal Year ending June 30, 2015 of 2.76%, lower than the assumed rate of 8.0%. As a result, it reported the following results as of June 30, 2015 with respect to the State Employees’ Retirement Fund:
Market Value of Assets $10,668.4 million Actuarial Value of Assets $11,375.8 million Actuarial Accrued Liability $26,255.5 million UAAL $14,879.7 million Funded Ratio (based on the actuarial value of assets) 43.3% Funded Ratio (based on the market value of assets) 40.6%
The actuaries do not recommend that the results of a roll forward valuation be used as the basis for
adjusting the scheduled contribution requirements but rather as information as to the expected condition of the Fund as of the end of the interim year. Using the roll forward valuation results, the actuaries determined that the employer contribution requirement for Fiscal Year 2017, based on a projected unit credit actuarial cost method and level percentage-of-payroll contributions, would be $1,573.3 million, an increase of $4.2 million from the amount calculated in the full November 2014 actuarial valuation and used in the adopted biennium budget for Fiscal Years 2016 and 2017. This would have increased the Fiscal Year 2017 percentage-of-payroll contribution rate from 43.69% to 43.80%.
Set forth in the following table are State contributions to the State Employees’ Retirement Fund, Federal grant programs, employee contributions, investment income, net realized gains and losses, net unrealized gains and losses, benefits paid, actuarial recommended contributions and market value of assets for each of the past five fiscal years, and the actuarial accrued liabilities, the actuarial values of fund assets, the resulting unfunded accrued liabilities and the funded ratios on an actuarial and market basis for the actuarial valuations as of June 30, 2011, June 30, 2012 and June 30, 2014 and interim “roll forward” valuations as of June 30, 2013 and June 30, 2015.

III-74
TABLE 17
State Employees’ Retirement Fund (In Millions)
Fiscal Year 2011 2012 2013 2014 2015 General Fund Contributions .................. $ 563.3 $ 652.6 $ 721.5 $ 916.0 $ 970.9 Transportation Fund Contributions .................. 82.4 90.1 107.9 108.3 130.1 Federal and other Reimbursements ............. 180.0 183.7 228.8 244.5 396.5
Employee Contributions .... 67.6 68.8 164.0 144.8 187.3 Total Contributions ........... $ 893.4 $ 995.1 $ 1,222.2 $ 1,413.6 $ 1,684.8 Benefits Paid(a) .................. $ 1,315.7 $ 1,417.0 $ 1,487.7 $ 1,563.0 $ 1,653.6 Investment Income/Net Gains (Losses) ............................. $ 1,623.4 $ (90.5) $ 997.6 $ 1,447.1 $ 316.3
Actuarial Recommended Contribution ................... $ 944.1 $ 926.4 $ 1,059.7 $ 1,268.9 $ 1,379.2
Percentage of Actuarial Recommended Contribution Made ....... 87.5% 100.0% 99.9% 100.0% 99.5%
Actuarial Accrued Liabilities ....................... $21,126.7 $23,018.8 $23,768.2 $25,505.6 $26,255.5
Actuarial Values of Assets ......................... $10,122.8 $ 9,745.0 $ 9,784.5 $10,584.8 $11,375.8
Unfunded Accrued Liabilities ....................... $11,004.0 $13,273.8 $13,983.7 $14,920.8 $14,879.7
Market Value of Assets ..... $ 8,984.9(c) $ 8,468.5(d) $ 9,182.4(e) $10,472.6(f) $10,668.4 Funded Ratio (actuarial value) .............. 47.9% 42.3% 41.2% 41.5% 43.3%
Funded Ratio (market value) ................ 42.5% 36.8% 38.6% 41.1% 40.6%
Ratio of Actuarial Value of Assets to Market Value of Assets .............. 112.7% 115.1% 106.6% 101.1% 106.6%
______________ (a) Does not include refunds with respect to withdrawals of account balances by inactive members who terminate membership. (b) As reported in Actuarial Valuation. This amount includes $2,087,879 of receivables. (c) As reported in Actuarial Valuation. This amount includes $2,509,578 of receivables. (d) As reported in Actuarial Valuation. This amount includes $6,635,867 of receivables. (e) As reported in Roll Forward Actuarial Valuation. This amount includes $5,839,847 of receivables. (f) As reported in Actuarial Valuation. This amount includes $6,198,255 of receivables.

III-75
The November 2014 actuarial valuation breaks out the normal cost component and the amortization component associated with the several tiers of employees for Fiscal Year 2016 as set forth below:
TABLE 18
Normal Cost by Tier
Group
Number of
Active Members(a)
Average
Age (years)(a)
Average Service (years)(a)
Normal Cost (Millions)
Normal Rate (percent of
payroll) Tier I-Hazardous 61 57.2 30.3 $0 0.0% Tier I-Plan B 2,143 57.9 32.8 $26.9 13.8% Tier I-Plan C 77 60.0 34.3 $0.6 10.0% Tier II-Hazardous 2,580 50.0 20.9 $34.0 13.9% Tier II-Others 12,514 53.7 23.0 $95.2 9.3% Tier IIA-Hazardous 6,168 42.3 10.5 $47.3 10.2% Tier IIA-Others 17,550 46.8 9.3 $57.4 5.2% Tier III-Hazardous 1,678 33.2 1.1 $3.4 4.1% Tier III Hybrid 1,370 50.5 14.8 $7.3 6.3% Tier III-Others 5,835 38.0 1.3 $6.5 2.6% Total 49,976 47.3 13.5 $278.8 8.0%
______________ (a) As of June 30, 2014.
Modeling of Future Funded Ratios and Annual Contributions through Fiscal Year 2046
In 2015, the State Comptroller engaged the consulting actuary for State Employees’ Retirement Fund to prepare various models of future funded ratios and annual contribution requirements for the State Employees’ Retirement Fund through Fiscal Year 2046. The modeling presented in Table 19 is based on the assumptions used for the actuarial valuation and actuarial methods of future annual employer contribution requirement figures as set out in the November 2014 actuarial valuation, and does not represent a forecast, estimate or projection. The modeling does not reflect future factors or conditions that would cause the actual future experience of the State Employees’ Retirement Fund to diverge from the model. In particular, future actuarial valuations mandated by statute over the period of the modeling will result in recalculation of the annual employer contribution requirements for each biennial budget. No representation is made that future annual employer contribution requirements or funded ratios will conform to the modeling.

III-76
TABLE 19
Modeling Of State Employees’ Retirement Fund Future Funded Ratios and Annual Contribution Requirements
(In Thousands)
The funded ratio and annual contributions for each fiscal year have been modeled based on the assumption of an actuarial valuation prepared as of the June 30 two years prior to the end of such fiscal year.
Fiscal Year
Ending June 30
Valuation
Date June 30
Funded Ratio as of Valuation
Date
Normal
Cost
Amortization of Unfunded
Accrued Liability
Total State
Contribution
Employee Contribution
Total State and
Employee Contribution
2016 2014 41.5% $278,813 $1,235,655 $1,514,468 $ 77,122 $1,591,590 2017 2015 43.4 287,225 1,281,918 1,569,143 77,718 1,646,861 2018 2016 44.4 288,492 1,363,814 1,652,306 80,230 1,732,536 2019 2017 46.3 290,235 1,422,446 1,712,681 83,794 1,796,475 2020 2018 48.3 290,090 1,485,491 1,775,581 87,414 1,862,995 2021 2019 50.0 290,044 1,566,009 1,856,053 91,151 1,947,201 2022 2020 52.2 286,489 1,640,525 1,927,014 94,994 2,022,008 2023 2021 54.6 291,218 1,717,941 2,009,159 98,862 2,108,021 2024 2022 57.2 295,671 1,800,992 2,096,663 102,906 2,199,569 2025 2023 60.1 298,528 1,889,683 2,188,211 106,968 2,295,179 2026 2024 63.3 299,678 1,984,547 2,284,225 111,193 2,395,418 2027 2025 66.8 300,069 2,086,945 2,387,014 115,594 2,502,608 2028 2026 70.7 299,926 2,199,463 2,499,389 120,101 2,619,490 2029 2027 75.0 299,768 2,325,648 2,625,416 124,801 2,750,217 2030 2028 79.9 300,002 2,473,929 2,773,931 129,640 2,903,571 2031 2029 85.4 302,427 2,665,742 2,968,169 134,842 3,103,011 2032 2030 91.7 305,626 3,002,817 3,308,443 140,451 3,448,894
2033(a) 2031 100.0 310,579 0 310,579 146,462 457,041 2034 2032 100.0 317,344 0 317,344 152,844 470,188 2035 2033 100.0 325,666 0 325,666 159,571 485,237 2036 2034 100.0 336,360 0 336,360 164,966 501,326 2037 2035 100.0 348,403 0 348,403 170,611 519,014 2038 2036 100.0 361,773 0 361,773 176,583 538,356 2039 2037 100.0 376,710 0 376,710 182,844 559,554 2040 2038 100.0 392,264 0 392,264 189,367 581,631 2041 2039 100.0 407,307 0 407,307 196,076 603,383 2042 2040 100.0 423,710 0 423,710 203,051 626,761 2043 2041 100.0 440,888 0 440,888 210,332 651,220 2044 2042 100.0 458,410 0 458,410 217,877 676,287 2045 2043 100.0 476,310 0 476,310 225,685 701,995 2046 2044 100.0 494,534 0 494,534 233,810 728,344
___________________ (a) In fiscal year ending June 30, 2033 and thereafter the annual employer contribution requirement consists only of the payment of the
normal costs, which represents the portion of the present value of retirement benefits that are allocable to active members’ current year of service. In the model, there no longer remains an unfunded actuarial accrued liability to be amortized.
III-77
Contribution, Eligibility and Benefits Requirements
Generally, State employees hired before July 2, 1984 participate in the Tier I plan of the State Employees’ Retirement Fund, which requires employee contributions. As of July 1, 2015 approximately 3.85% of the total work force was covered under the Tier I Plan. Other employees generally participate in the Tier II plan, which is non-contributory for certain members and provides somewhat lesser benefits. As of July 1, 2015, approximately 27.70% of the total workforce was covered under the Tier II plan. Employees hired after July 1, 1997 participate in the Tier IIA plan, which requires contributions from its employee members. As of July 1, 2015, approximately 45.28% of the total work force was covered under the Tier IIA Plan. SEBAC 2011 provides for two new retirement plans for State employees first hired on and after July 1, 2011, Tier III employees and, for unclassified employees of the Connecticut State System of Higher Education and the central office staff of the Department of Higher Education only, the Hybrid Plan. As of July 1, 2015, approximately 19.12% of the total work force was covered under the Tier III Plan and approximately 4.05% of the total work force was covered under the Hybrid Plan. SEBAC 2011 also provides a one-time, irrevocable opportunity for current members of the Connecticut Alternate Retirement Program to transfer membership to the new Hybrid Plan and purchase credit for their prior State service in that plan at the full actuarial cost. From time-to-time the State has instituted, and in the future may institute, early retirement incentive plans that may impact retirement plan eligibility and benefits.
The average annual benefit payable to a retired Tier I, Tier II, or Tier IIA member in fiscal year ending June 30, 2015 was approximately $41,102, $26,683, and $12,501, respectively. There were no retired Tier III members receiving benefits in Fiscal Year 2015. There were 243 Hybrid retirees in Fiscal Year 2015 with an approximate average annual benefit payable of $33,215. The State Employees’ Retirement Fund also provides disability and pre-retirement death benefits.
Member contribution requirements, and the eligibility for and calculation of normal retirement benefits varies by tier and plan, as set forth in the following table:

III-78
TABLE 20
State Employees’ Retirement System Member Contribution Requirements, Eligibility Requirements and Normal Retirement Benefits
Tier Member Contribution
Requirements Eligibility For Normal Retirement
Benefits Normal Retirement Benefits Based On Final Average Earnings
(“FAE”)(a) Tier I - Hazardous 4% of earnings up to the Social
Security Taxable Wage Base plus 5% of earnings above that level
20 years of hazardous duty credited service 50% of FAE plus 2% for each year of service in excess of 20 years
Tier I - Plan A or C 5% of earnings Earliest of age 55 with 25 years of service, age 60 with 10 years of service, or age 70 with 5 years of service
2% of FAE times years of service, with a minimum benefit with 25 years of service of $833.34 per month
Tier I - Plan B 2% of earnings up to Social Security Taxable Wage Base plus 5% of earnings above that level
Earliest of age 55 with 25 years of service, age 60 with 10 years of service, or age 70 with 5 years of service
2% of FAE times years of service up to age 65; for retirements after age 65, 1% of FAE up to $4,800, plus 2% of FAE in excess of $4,800 times years of service, with a minimum benefit with 25 years of service of $833.34 per month; for retirements at or after age 70, the greater of 1.25% of FAE up to $4,800 plus 2.5% of FAE in excess of $4,800 times years of service (maximum 20 years) or 1.0% of FAE up to $4,800 plus 2% of FAE in excess of $4,800 times year of service
Tier II – Hazardous 4% of earnings 20 years of hazardous duty credited service 2.5% of FAE times years of service up to 20 years plus 2.0% of FAE times years of service in excess of 20 years, if any, with a minimum benefit with 25 years of service of $360 per month
All Other Tier II None Prior to July 1, 2022: Earliest of age 62 with 10 years of vesting service (effective July 1, 1992), age 60 with 25 years of vesting service, age 70 with 5 years of vesting service, or age 62 with 5 years of actual state service for terminations on or after July 1, 1997 Effective July 1, 2022: Earliest of age 63 with 25 years of vesting service or age 65 with at least 10 but less than 25 years of vesting service
1.40% of FAE plus (a) 0.433% of FAE in excess of the year’s breakpoint (which breakpoint equals $10,700 increased by 6% each year after 1982, rounded to nearest $100 but not greater than Social Security Covered Compensation) times years of service up to 35 years, and (b) 1.625% of FAE times any years of service in excess of 35 years, with a minimum benefit with 25 years of service of $360 per month
Tier IIA – Hazardous 5% of earnings 20 years of hazardous duty credited service 2.5% of FAE times years of service up to 20 years plus 2.0% of FAE times years of service in excess of 20 years, if any, with a minimum benefit with 25 years of service of $360 per month
III-79
Tier Member Contribution
Requirements Eligibility For Normal Retirement
Benefits Normal Retirement Benefits Based On Final Average Earnings
(“FAE”)(a) All Other Tier IIA 2% of earnings Prior to July 1, 2022: Earliest of age 62 with
10 years of vesting service (effective July 1, 1992), age 60 with 25 years of vesting service, age 70 with 5 years of vesting service, or age 62 with 5 years of actual state service for terminations on or after July 1, 1997 Effective July 1, 2022: Earliest of age 63 with 25 years of vesting service or age 65 with at least 10 but less than 25 years of vesting service
1.40% of FAE plus (a) 0.433% of FAE in excess of the year’s breakpoint (which breakpoint equals $10,700 increased by 6% each year after 1982, rounded to nearest $100 but not greater than Social Security Covered Compensation) times years of service up to 35 years, and (b) 1.625% of FAE times any years of service in excess of 35 years, with a minimum benefit with 25 years of service of $360 per month
Tier III - Hazardous 5% of earnings 25 years of hazardous duty credited service or age 50 with at least 20 years of hazardous duty credited service
2.5% of FAE times years of service up to 20 years plus 2% for each year of service in excess of 20
All Other Tier III 2% of earnings Earliest of age 63 with 25 years of vesting service or age 65 with at least 10 but less than 25 years of vesting service
1.40% of FAE plus (a) 0.433% of FAE in excess of the year’s breakpoint (which breakpoint equals $10,700 increased by 6% each year after 1982, rounded to nearest $100 but not greater than Social Security Covered Compensation) times years of service up to 35 years, and (b) 1.625% of FAE times any years of service in excess of 35 years, with a minimum benefit with 25 years of service of $360 per month
Hybrid Plan 5% of earnings for members first hired on or after July 1, 2011 5% of earnings for members with original date of hire on or after July 1, 1997 3% of earnings for members with original date of hire prior to July 1, 1997
Earliest of age 63 with 25 years of vesting service or age 65 with at least 10 but less than 25 years of vesting service
1.40% of FAE plus (a) 0.433% of FAE in excess of the year’s breakpoint (which breakpoint equals $10,700 increased by 6% each year after 1982, rounded to nearest $100 but not greater than Social Security Covered Compensation) times years of service up to 35 years, and (b) 1.625% of FAE times any years of service in excess of 35 years, with a minimum benefit with 25 years of service of $360 per month (b)
______________ (a) For all members of all Tiers other than Tier III and Hybrid, “FAE” is defined as the average salary of the three highest paid years of service, provided that, effective January
1, 1986, no one year's earnings can be greater than 130% of the average of the two preceding years for purposes of calculating the FAE. For Tier III and the Hybrid Plan members, FAE is defined as the average salary of the five highest paid years of service, provided that no one year's earnings can be greater than 130% of the average of the preceding two years. Effective July 1, 2014, this limit will be 150% for Tier III and the Hybrid Plan members with mandatory overtime earnings.
(b) The Hybrid Plan provides members with the option to receive at retirement a lump sum payment of their contributions plus a five percent (5%) employer match and four percent (4%) interest in lieu of their receipt of monthly benefit payments.

III-80
The State Employees’ Retirement Fund provides annual cost-of-living allowance adjustments each July 1 as set forth below:
TABLE 21
State Employees’ Retirement Benefit Cost-Of-Living Allowances(a)
Retirement Date Adjustment Based On Minimum Increase
Maximum Increase
Maximum Increase For Members And
Beneficiaries Not Covered By Social Security And
Age 62 And Over
Prior to July 1, 1980
Increase in National Consumer Price Index for Urban Wage Earners and Clerical Workers (“CPI-W”)
3.0% 5.0% 6.0%
On and after July 1, 1980 but prior to July 1, 1997 N/A 3.0% 3.0% 6.0%
On and after July 1, 1997 but prior to July 1, 1999, an irrevocable choice between one of the two following plans required:
(1) 60% of the increase in “CPI-W” up to 6.0% and 75.0% of the increase in the CPI-W over 6.0%
2.5% 6.0% N/A
(2) N/A 3.0% 3.0% N/A
On or after July 1, 1999, but prior to October 1, 2011
60% of the increase in CPI-W up to 6.0% and 75.0% of the increase in the CPI-W over 6.0%
2.5% 6.0% N/A
On or after October 1, 2011
60% of the increase in CPI-W up to 6.0% and 75.0% of the increase in the CPI-W over 6.0%
2.0% 7.5% N/A
______________ (a) An employee from Tier IIA must have at least ten (10) years of actual State service or directly make the transition
into retirement in order to be eligible for annual adjustments.
GASB 67 Disclosure
Governmental Accounting Standards Board Statement No. 67 (“GASB 67”) requires a determination of the Total Pension Liability (“TPL”) for a plan using the Entry Age Normal actuarial funding method. The Net Pension Liability (“NPL”) is then set equal to the TPL minus the plan’s Fiduciary Net Position (“FNP”) which, generally, is the market value of assets in the plan as of the measurement date. Among the assumptions needed for the liability calculation is a Single Equivalent Interest Rate (“SEIR”). To determine the SEIR, the FNP must be projected into the future for as long as there are anticipated benefits payable to the membership and beneficiaries of the system on the measurement date. If the FNP of the plan is not expected to be depleted at any point in the future, the plan may use its long-term expected rate of return as the SEIR. If, on the other hand, the FNP of the plan is expected to be depleted, then the SEIR is the single rate of interest that will generate a present value of benefits equal to the sum of (i) the present value of all benefits through the date of depletion at a discount rate equal to the long-term expected rate of return, plus (ii) the present value of benefits after the date of depletion discounted at a rate based on 20-year, tax-exempt, general obligation municipal bonds, with an average credit rating of AA/Aa or higher.

III-81
The State Employees Retirement Commission received from Cavanaugh Macdonald Consulting, LLC a report prepared as of June 30, 2015 and dated January 20, 2016 containing supplemental information to assist the Commission in meeting the requirements of GASB 67, which the Commission approved at its meeting held February 18, 2016. This supplement reported the following results as of June 30, 2015 with respect to the State Employees’ Retirement Fund in accordance with GASB 67:
Total Pension Liability $27,192.5 million Fiduciary Net Position $10,668.4 million Net Pension Liability $16,524.1 million Ratio of Fiduciary Net Position to Total Pension Liability 39.23 %
The report for the State Employees’ Retirement Fund as of June 30, 2015 used its long term investment rate of 8.00% as the SEIR since the results currently indicate that the FNP will not be depleted at any point in the future. GASB 67 also requires sensitivity calculations based on a SEIR 1% in excess and 1% less than the SEIR used, which would decrease the NPL to $13,885.6 million or increase the NPL to $19,655.9 million, respectively.
Teachers’ Retirement Fund
The Teachers’ Retirement Fund, administered by the Teachers’ Retirement Board, provides benefits for any teacher, principal, supervisor, superintendent or other eligible employee in the public school systems of the State, with certain exceptions. While setting and paying salaries for teachers, municipalities do not provide contributions to the maintenance of the fund. As of June 30, 2015, there were (i) 106,717 active and former employees, consisting of 53,528 active members, 2,010 inactive vested members and 15,138 inactive non-vested members, (ii) 35,745 retired members and beneficiaries, (iii) 296 members on disability allowance, and (iv) 1,782 annuity reserve members.
Contributions to the fund are made by employees and by General Fund appropriations from the State. State contributions to the fund are made quarterly on the basis of certifications submitted by the Teachers’ Retirement Board and are funded with annual appropriations from the General Fund. State contributions to the Fund for Fiscal Year 2008 included $2.0 billion of the proceeds of the State’s Taxable General Obligation Bonds (Teachers’ Retirement Fund 2008 Series), as discussed under “Pension Obligation Bonds”.
October 2014 Actuarial Valuation
Actuarial valuations are performed as of June 30th of each even-numbered year. The actuarial valuation uses recognized actuarial methods to calculate the actuarial value of assets and the actuarial accrued liability of the Teachers’ Retirement Fund. The actuarial accrued liability is determined using the entry age normal cost method as the portion of the present value of future benefits allocated to years of service prior to the valuation date. The valuation uses an asset valuation method of smoothing the difference between the market value of assets and actuarial value of assets to prevent extreme fluctuations that may result from short-term or cyclical economic and market conditions. The actuarial value of assets is determined by first projecting the actuarial value forward from the beginning of the prior fiscal year based on the actual cash flow during the fiscal year and the assumed investment rate of return. One fourth of any difference between this expected actuarial value and the actual market value is added to or subtracted from the expected actuarial value to arrive at the actuarial value of assets in order to “smooth” year to year changes in market values. The unfunded actuarial liability is the actuarial liability less the actuarial value of assets. The valuation includes a projection from the valuation date to future years based on certain key assumptions such as the investment return on the market value of assets, the rates of withdrawal of active members who leave covered employment before qualifying for any monthly benefit, the rates of mortality, the rates of disability, the rates of pay increases and the assumed age or ages at actual retirement.

III-82
The Teachers’ Retirement Fund received from Cavanaugh Macdonald Consulting, LLC an actuarial valuation as of June 30, 2014 dated October 29, 2014. The October 2014 actuarial valuation reported the following results as of June 30, 2014 with respect to the Teachers’ Retirement Fund:
Market Value of Assets $16,220.9 million Actuarial Value of Assets $15,546.6 million Actuarial Accrued Liability $26,349.2 million UAAL $10,802.7 million Funded Ratio (based on the actuarial value of assets) 59.00% Funded Ratio (based on the market value of assets) 61.56%
The October 2014 actuarial valuation was based upon the following assumptions among others:
• 8.5% earnings assumption
• Projected salary increases of 3.75% to 7.0%
• Cost-of-living adjustments of 3.0% annually for members retired before September 1992 and 2.0% for members retired on and after September 1, 1992
• Payroll Growth Rate of 3.75%
• Net effective amortization period for the computed State contribution amounts for Fiscal Year 2014 is 20.4 years
The October 2014 actuarial valuation determined the following employer contribution requirements, based on an individual entry-age actuarial cost method and level percent-of-payroll contributions: (i) $975.6 million for Fiscal Year 2016; and (ii) $1,012.2 million for Fiscal Year 2017, resulting in an annual employer contribution rate of 23.65% of payroll. The adopted biennium budget for Fiscal Year 2016-2017 contains appropriations sufficient to fully fund such employer contribution requirement.
The Teachers’ Retirement Fund uses the Entry Age Normal cost method to calculate the annual amortization payments needed to amortize the unfunded actuarial accrued liability, which method allocates the plan’s actuarial present value of future benefits to various periods based on service. The amortization period begins with 40 years as of July 1, 1991 for the contribution for fiscal year beginning July 1, 1992 and the annual required employer contribution amount is based on a level percentage of payroll payments over such declining period of years. The net effective amortization period for the computed State contribution amounts for Fiscal Year 2015 is approximately 19.4 years. While this method of funding should lead to full funding by the end of the amortization period, the repayment of the UAAL is not level. Because of this, even if the State were to contribute the full amount of the actuarially recommended contributions and all other actuarial assumptions were met, the UAAL for the Teachers’ Retirement Fund is not anticipated to be reduced significantly until the later years of the amortization period. Following full amortization of the UAAL, the actuarially recommended contribution would decrease substantially as it would consist solely of the funding of normal costs representing the portion of the present value of retirement benefits that are allocable to active members’ current year of service.
Set forth in the following table are State contributions to the Teachers’ Retirement Fund, employee contributions, investment income, net realized gains and losses, net unrealized gains and losses, benefits paid, actuarial recommended contributions and market value of assets for each of the past five fiscal years, and the actuarial accrued liabilities, the actuarial values of fund assets, the resulting unfunded accrued liabilities and the funded ratios on an actuarial and market basis for the actuarial valuations as of June 30, 2012 and June 30, 2014.

III-83
TABLE 22
Teachers’ Retirement Fund(a)
(In Millions)
Fiscal Year 2011 2012 2013 2014 2015 General Fund Contributions .................. $ 581.6 $ 757.2 $ 787.5 $ 948.5 $ 984.1 Employee Contributions(b) ............... 256.1 263.5 274.3 275.5 279.0 Total Contributions ........... $ 837.7 $ 1,020.7 $ 1,061.9 $ 1,224.0 $ 1,263.1 Benefits Paid(c) .................. $ 1,499.9 $ 1,531.7 $ 1,625.7 $ 1,714.4 $ 1,773.4 Investment Income/Net Gains (Losses) ............................. $ 2,517.0 $ (145.4) $ 1,584.3 $ 2,250.8 $ 450.1 Actuarial Recommended Contribution ...................
$ 581.6
$ 757.2
$ 787.5
$ 948.5
$ 984.1
Percentage of Actuarial Recommended Contribution Made ...........................
100.0%
100.0%
100.0%
100.0%
100.0% Actuarial Accrued Liabilities ....................... N/A $24,862.2 N/A $26,349.2 N/A Actuarial Values of Assets ............................
N/A
$13,734.8
N/A
$15,546.5
N/A
Unfunded Accrued Liabilities .......................
N/A
$11,127.4
N/A
$10,802.7
N/A
Market Value of Assets ... $14,143.9 $13,473.7(d) $14,480.5 $16,220.9(d) $16,110.4 Funded Ratio (actuarial value) ..............
N/A
55.2%
N/A
59.0%
N/A
Funded Ratio (market value) ................
N/A
54.2%
N/A
61.6%
N/A
Ratio of Actuarial Value of Assets to Market Value of Assets ..............
N/A
102.0%
N/A
96.0%
N/A
______________ (a) As actuarial valuations are performed every two years, not all of the data is available for each year. (b) Includes municipal contributions under early retirement incentive programs ($902,153 during Fiscal Year 2011, $582,142
during Fiscal Year 2012, $361,042 during Fiscal Year 2013, $668,924 during Fiscal Year 2014 and $668,924 during Fiscal Year 2015). Does not include employee contributions to the Teachers’ Retirement Health Insurance Fund.
(c) Does not include refunds with respect to withdrawals of account balances by inactive members who terminate membership ($16,181,894 during Fiscal Year 2011, $13,831,495 during Fiscal Year 2012, $14,658,485 during Fiscal Year 2013, $18,241,716 during Fiscal Year 2014 and $50,328,762 during Fiscal Year 2015).
(d) Figure derived from actuarial valuation.

III-84
October 2015 Experience Study
The Teachers’ Retirement Board received an experience study dated October 29, 2015 prepared by Cavanaugh Macdonald Consulting, LLC, the actuaries for the Teachers’ Retirement Fund, for the five-year period ending June 30, 2015, assessing the reasonability of the actuarial assumptions and valuation methods used by the retirement system. As a result of the study, the actuaries recommended that revised assumptions be adopted by the Teachers’ Retirement Board for future use, which assumptions the Board adopted at its meeting held November 4, 2015. The revised assumptions would be incorporated into the actuarial valuation to be completed as of June 30, 2016, to be used to calculate the State’s employer contribution requirements for the fiscal years ending June 30, 2018 and June 30, 2019. The State’s employer contribution requirements for Fiscal Years 2016 and 2017 will not change.
The actuaries recommended the following changes to the current assumptions, which changes would significantly impact the calculation of the UAAL:
• Decrease in the investment rate of return from 8.5% to 8.0%, reducing the discount of SERS’ liabilities
• Updating the post-retirement mortality assumption to the Retired Pensioner 2014 (RP 2014) mortality table with the rates projected to year 2020 using projection scale BB, to reflect mortality improvements, extending the anticipated duration of pension payments to SERS members
In addition the actuaries recommended the following changes to the current assumptions, which changes would have less significant impact on the calculation of the UAAL:
• Decrease in rate of inflation from 3.0% to 2.75%
• Decrease in the payroll growth rate from 3.75% to 3.25%
• Relating to rates of salary increase:
o Decrease in the annual rate of real wage increase from 0.75% to 0.5% o Minor changes to the merit portion of the salary scale
• Various changes to demographic assumptions:
o Increase rates of withdrawal o Increasing normal retirement rates for females and proratable retirement rates for
males o Decreasing early retirement rates o Decreasing disability rates for males
The actuaries’ analysis of the impact of the recommended changes if applied to the results of the November 2014 actuarial valuation as of June 30, 2014, would result in the following:
• an increase of $189.2 million in the Fiscal Year 2016 employer contribution requirement
• an increase of $1,867.3 million in the UAAL
• an increase in the normal cost rate from 9.73% to 10.48%
• a decrease in the funded ratio from 59.0% to 55.1%
The actuaries also provided the same analysis using a 7.5% earnings assumption which would result in the following:
• an increase of $330.7 million in the Fiscal Year 2016 employer contribution requirement
• an increase of $3,375.5 million in the UAAL
• an increase in the normal cost rate from 9.73% to 11.87%
• a decrease in the funded ratio from 59.0% to 52.3%

III-85
The actuaries performed a statistical analysis of long-term expectations and analyzed the 25th and 75th percentile of long term return expectations consistent with Actuarial Standards of Practice. While the current 8.5% return assumption was found to be within the reasonable range for investment return assumptions of between 6.3% and 8.7%, the actuaries recommended two alternatives for reducing the investment rate of return. The first alternative of decreasing the rate to 8.0% would result in an assumption which was well within the reasonable range. The second alternative would reduce the rate to 7.5%, the midpoint of the range. On November 4, 2015, the Teachers’ Retirement Board approved all of the actuaries’ recommendations and as between the investment rate of return alternatives, approved an 8% investment rate of return assumption.
Pension Obligation Bonds
Public Act No. 07-186 authorized the issuance of general obligation bonds (“TRF Bonds”) of the State in amounts sufficient to fund a $2.0 billion deposit to the Teachers’ Retirement Fund plus amounts required for costs of issuance and up to two years of capitalized interest. The Secretary of the Office of Policy and Management and the State Treasurer subsequently determined that issuance of such bonds would be in the best interests of the State, and in April 2008 the State issued $2,276.6 million of such bonds.
Section 8 of Public Act No. 07-186 provides that in each fiscal year that any TRF Bonds (or any refunding of TRF bonds) are outstanding, there shall be deemed appropriated from the General Fund an amount equal to the annual required contribution to the Teachers’ Retirement Fund, and such amount shall be deposited in the fund in such fiscal year. The amounts of the annual required contributions for each biennial budget shall be based on the actuarial valuation required to be completed by the December 1 prior to the beginning of the next biennial budget. Under Section 8 the State has pledged to and agreed with the holders of any TRF Bonds that, so long as the actuarial evaluation of the Teachers’ Retirement Fund is completed and the certification of the annual contribution amounts is made as required by such Section, no public or special act of the General Assembly shall diminish such required contribution until such bonds, together with interest thereon, are fully met and discharged unless adequate provision is made by law for the protection of the holders of the bonds. Such contributions may be reduced in any biennium, however, if (i) the Governor declares an emergency or the existence of extraordinary circumstances (which may include changes in actuarial methods or accounting standards) in which the provisions of Section 4-85 of the Connecticut General Statutes is invoked, (ii) at least three-fifths of the members of each Chamber of the General Assembly vote to diminish such required contributions during the biennium for which the emergency or extraordinary circumstances are determined, and (iii) the funded ratio of the fund is at least equal to the funded ratio immediately after the sale of the bonds in accordance with the actuarial method used at the time. If such conditions are met, the funding of the annual required actuarial contribution may be diminished, but in no event shall such diminution result in a reduction of the funded ratio of the fund by more than 5% from the funded ratio that would otherwise have resulted had the State funded the full required contribution, or the funded ratio immediately after the sale of the bonds, whichever is greater.
Contribution, Eligibility and Benefits Requirements
Each member of the Teachers’ Retirement Fund is required to contribute 6% of annual salary for the pension benefit. The State’s contribution requirement is determined in accordance with Section 10-183z of the General Statutes, which requires the retirement system to be funded on an actuarial reserve basis.
Eligibility for normal retirement benefits is available at age 60 for those with 20 years of credited Connecticut service, or 35 years of credited service including at least 25 years of service in Connecticut. The normal retirement benefit is 2% of average annual salary received during three years of highest salary times years of credited service (maximum benefit is 75% of average annual salary received during three years of highest salary), subject to certain maximum dollar limits under the Internal Revenue Code of 1986, as amended. In addition, amounts derived from the accumulation of supplemental account contributions made prior to July 1, 1989 and voluntary contributions by the member are payable. Effective January 1, 1999, there is a minimum monthly retirement benefit of $1,200 to members who retire under the normal retirement

III-86
provisions and who have completed at least 25 years of full time Connecticut service at retirement. The plan also provides reduced early retirement and pro-ratable retirement benefit, disability benefits, return with interest on certain contributions upon termination of employment, and pre-retirement death benefits for spouses and dependent children. The average annual benefit payable to a retired member in fiscal year ending June 30, 2015 was approximately $49,406.
The plan includes cost-of-living allowances as set forth below:
TABLE 23
Teachers’ Retirement Benefit Cost-Of-Living Allowances
Retirement Date
Adjustments Consistent With Adjustments To:
Minimum Increase
Maximum Increase
Limitation On Maximum Increase Based On Previous Year’s Plan Assets Return
Prior to September 1, 1992 National Consumer Price Index for Urban Wage Earners and Clerical Workers
3.0% per annum
5.0% per annum
N/A
On or after September 1, 1992, and became System member before July 1, 2007(a)
Social Security benefits
0.0% per annum
6.0% per annum
If asset return less than 8.5% per annum, the maximum increase is 1.5%
On or after July 1, 2007, and became System member after July 1, 2007(a)
Social Security benefits
0.0% per annum
5.0% per annum
If asset return less than 11.5% per annum, the maximum increase is 3.0%; if less than 8.5% per annum, maximum increase is 1.0%.
______________ (a) Based on the current cost-of-living allowances formulas no benefit adjustment for Fiscal Years 2010 and 2011 was granted
for members retiring on or after September 1, 1992. For Fiscal Year 2012, a 3.6% benefit adjustment was granted. For Fiscal Year 2013, a 1.5% benefit adjustment was granted.
A board of education may offer a retirement incentive plan. Such plan is required to provide for the purchase by the board of education and a member of the system who chooses to participate in the plan of additional credited service from the Teachers’ Retirement Fund for such member and for payment by the board of education of not less than 50% of the entire cost of such total cost. Any such plan shall specify a maximum number of years to be purchased, not to exceed five. Members must have attained age 50 and be eligible for retirement with the additional purchased service. The amount of service purchased cannot exceed the lesser of five years or one-fifth of the member’s credited service.
GASB 67 Disclosure
Governmental Accounting Standards Board Statement No. 67 (“GASB 67”) requires a determination of the Total Pension Liability (“TPL”) for a plan using the Entry Age Normal actuarial funding method. The Net Pension Liability (“NPL”) is then set equal to the TPL minus the plan’s Fiduciary Net Position (“FNP”) which, generally, is the market value of assets in the plan as of the measurement date. Among the assumptions needed for the liability calculation is a Single Equivalent Interest Rate (“SEIR”). To determine the SEIR, the FNP must be projected into the future for as long as there are anticipated benefits payable to the membership and beneficiaries of the system on the measurement date. If the FNP of the plan is not expected to be depleted at any point in the future, the plan may use its long-term expected rate of return as the SEIR. If, on the other hand, the FNP of the plan is expected to be depleted, then the SEIR is the single rate of interest that will generate a present value of benefits equal to the sum of (i) the present value of all benefits through the date of depletion at a discount rate equal to the long-term expected rate of return, plus (ii) the present value of benefits after the date of depletion discounted at a rate based on 20-year, tax-exempt, general obligation bonds, with an average credit rating of AA/Aa or higher. The valuation for the Teachers’ Retirement Fund as of June 30,

III-87
2014 used its long term investment rate of 8.5% as the SEIR since the results currently indicate that the FNP will not be depleted at any point in the future.
The October 2014 actuarial valuation prepared as of June 30, 2014 contains supplemental information dated October 27, 2014 to assist the Teachers’ Retirement Board in meeting the requirements of GASB 67. The October 2014 actuarial valuation reported the following results as of June 30, 2014 with respect to the Teachers’ Retirement Fund in accordance with GASB 67:
Total Pension Liability $26,349.2 million Fiduciary Net Position $16,220.9 million Net Pension Liability $10,128.3 million Ratio of Fiduciary Net Position to Total Pension Liability 61.56%
GASB 67 also requires sensitivity calculations based on a SEIR 1% in excess and 1% less than the SEIR used, which would decrease the NPL to $7,747.8 million or increase the NPL to $12,928.8 million, respectively.
The Teachers’ Retirement Board anticipates receiving in late February 2016 from Cavanaugh Macdonald Consulting, LLC a “roll forward” report prepared as of June 30, 2015 to assist the Board in meeting the requirements of GASB 67. The roll forward report will be based on the October 2014 actuarial valuation prepared as of June 30, 2014, and will not reflect any changes to the actuarial assumptions used in the valuation.
Investment of Pension Funds
Twelve investment funds serve as the investment medium for both the State Employees’ Retirement Fund and the Teachers’ Retirement Fund, as follows: the Mutual Equity Fund, the Developed Markets International Stock Fund, the Emerging Markets International Stock Fund, the Core Fixed Income Fund, the Emerging Markets Debt Fund, the High Yield Debt Fund, the Inflation Linked Bond Fund, the Liquidity Investment Fund, the Real Estate Fund, the Private Investment Fund, the Commercial Mortgage Fund, and the Alternative Investment Fund. See also FINANCIAL PROCEDURES herein. Set forth below are the percentage allocation of holdings for the State Employees’ Retirement Fund and the Teachers’ Retirement Fund as of June 30, 215 in each of these funds.
TABLE 24
Pension Fund Investment Allocations As of June 30, 2015
State Employees’ Retirement Fund
Teachers’ Retirement Fund
Mutual Equity Fund ........................ 23.4% 23.7% Developed Markets International Stock Fund ................................. 20.4 20.8 Emerging Markets International Stock Fund ................................. 8.5 8.6 Core Fixed Income Fund ................. 8.8 7.2 Emerging Markets Debt Fund.......... 3.9 4.9 High Yield Fund .............................. 5.2 5.3 Inflation Linked Bonds Fund ........... 4.9 3.0 Liquidity Investment Fund............... 3.8 5.0 Real Estate Fund .............................. 6.0 6.3 Private Investment Fund .................. 9.2 9.3 Commercial Mortgage Fund ............ 0.0 0.0 Alternative Investment Fund............ 5.9 5.9 100.0% 100.0% ___________________ Source: Combined Investment Funds 2015 Comprehensive Annual Financial Report.

III-88
Investment Returns
Annualized Net Returns on Investment Assets in Retirement Funds
Periods Ending June 30, 2015
Other Retirement Systems
The other minor retirement systems funded by the State include the Judges, Family Support Magistrates and Compensation Commissioners Retirement System (the Judicial Retirement System), the General Assembly Pension System, the State Attorneys’ Retirement Fund and the Public Defenders’ Retirement Fund. As of June 30, 2015, there were approximately 208 active members of these plans and approximately 557 retired members.
Unclassified employees of the Connecticut State System of Higher Education and the central office staff of the Department of Higher Education are eligible to participate in the Connecticut Alternate Retirement Program. This program is a defined contribution program, and thus the State has no unfunded liability with respect to the program. All member contributions and State appropriations are held in a separate retirement fund by the third party administrator of the plan, who invests the fund’s assets allocable to a member at the direction of such member in the investment funds available under the plan. A member may not withdraw funds from the plan unless such member has reached age 55 and has terminated from service, retired or died, provided that any member with less than five years of participation in the plan who is under the age of 55 and terminates from service may rollover such member’s entire account into an eligible retirement plan.
The State is the administrator of the Connecticut Municipal Employees’ Retirement System and the Connecticut Probate Judges and Employees’ Retirement System. As the administrator of these systems the State owes a fiduciary obligation to these systems; however, the State has no direct financial liability to pay benefits under these systems.
Social Security and Other Post-Employment Benefits
Social Security
State employees and teachers are treated in various ways for purposes of federal social security. Most state employees are covered under social security, and most teachers are not. As of June 30, 2015, approximately 58,445 State employees were entitled to Social Security coverage. The following table summarizes this treatment.
Category Covered
Teachers No State employees under the State Employees’ Retirement Fund Yes State employees under other retirement systems hired after 2/21/58 No State police hired after 2/21/58 and before 5/8/84 No State police hired after 5/8/84 Yes Employees under the Connecticut Alternate Retirement Program hired after 7/12/90 Yes Employees under the Connecticut Alternate Retirement Program hired before 7/12/90 Could elect
5 Year 10 Year 15 Year 20 Year 25 Year
State Employees’ 9.82% 6.18% 5.15% 7.48% 7.62% Teachers’ 9.72% 6.30% 5.26% 7.60% 7.72%

III-89
The amount expended by the State for Social Security coverage for fiscal year ending June 30, 2015 was $318.2 million. Of this amount, $226.0 million was paid from the General Fund and $15.6 million was paid from the Special Transportation Fund and the balance was recovered from other funds, including federal funds and higher education funds. The State has appropriated $256.7 million for Social Security coverage for fiscal year ending June 30, 2016. Of this amount, $239.0 million has been appropriated from the General Fund and $17.7 million has been appropriated from the Special Transportation Fund.
Other Post-Employment Benefits – State Employees
The State provides post-retirement health care and life insurance benefits to all employees who retire from State employment. The State currently finances the cost of such benefits on a pay-as-you-go basis through a transfer of an appropriation from the General Fund to a trust fund established for the payment of post-retirement health care and life insurance benefits. The State has established the trust also for the accumulation of assets with which to pay post-retirement health care benefits and post-retirement life insurance benefits to future retirees in future years. All employees hired on or after July 1, 2009 are required to contribute 3% of salary for ten years, to be deposited into the trust. Commencing July 1, 2010, employees with less than five years of service are required to contribute 3% of salary for ten years, to be deposited into the trust. SEBAC 2011 extended the requirement of trust contributions to all other State employees to be phased in beginning July 1, 2013, as follows: 0.5% of salary for fiscal year ending June 30, 2013, 2.0% of salary for fiscal year ending June 30, 2014, and 3.0% of salary for fiscal ending June 13, 2015 and thereafter, with a period of required contribution of ten years or to the beginning of retirement (whichever occurs first). As of June 30, 2015, the fair market value of the net assets within the trust totaled $260.3 million. A portion of the trust contributions are invested in the Combined Investment Funds. See also note 15 of Appendix III-C hereto and FINANCIAL PROCEDURES herein. It is not currently anticipated that the trust will provide any significant contribution to the funding for post-retirement health care and life insurance benefits in the near future. The State will need to make significant General Fund appropriations for post-retirement health care and life insurance benefits in upcoming fiscal years. Because the plan is being funded on a pay-as-you-go basis, the amounts are much less than the annual required employer contribution payment calculated for the plan, which includes a component to amortize the UAAL.
Implementation of GASB Statement No. 45 regarding accounting and financial reporting for post-employment benefits other than pensions requires the State to obtain an analysis of the unfunded actuarial accrued liability of such post-retirement health care and life insurance benefits and to recognize the annual required contribution to fund that actuarial liability in its financial statements commencing with those for fiscal year ending June 30, 2008. The State received an actuarial report dated February 20, 2014 (“2014 OPEB Report”) with respect to the State’s liability for post-retirement health care benefits (which include medical, prescription drug, dental and life insurance benefits) for eligible persons covered under SERS and other State retirement systems, excluding the Teachers’ Retirement System from The Segal Company which indicated the following as of June 30, 2013:
Actuarial Accrued Liability $19,676.3 million
UAAL $19,532.5 million
Actuarial Value of Assets $143.8 million Based on Market Value at June 30, 2013.
Funded Ratio 0.73%
Annual Required Contribution
$1,271.3 million (Fiscal Year 2013)
$1,525.4 million (Fiscal Year 2014) (comprised of normal cost of $480.6 million, amortization of UAAL of $999.9 million, and adjustment for timing of $44.9 million)
Based on a projected unit credit actuarial cost method and level percent-of-payroll amortization over 30 years (with 24 years remaining as of June 30, 2013).

III-90
Annual OPEB Cost $1,560.0 million (Fiscal Year 2014) The annual OPEB cost adjusts the annual required contribution and contribution in relation to the annual required contribution. The annual OPEB cost is the cost of OPEB actually booked as an expense for the fiscal year.
In Fiscal Year 2013, the State contributed 42.68% of the Annual Required Contribution and 41.21% of the Annual OPEB Cost.
The 2014 OPEB Report includes the following assumptions, among others:
• A discount rate of 5.7%
• Payroll growth rate of 3.75% (lowered from 4.00% in prior valuation)
• Medical cost trend rate of 7.0% graded to 5.0% over 5 years
• Drug cost trend rate of 6.0% graded to 5.0% over 5 years
• Dental and part B trend rates of 5.0%
• Projected salary increases of 0.0% to 20.0%
• Updated medical, prescription drug and dental claim costs for recent experience and adjusting trend rates for medical and prescription drug
• Explicit administrative expense of $263 (lowered from $271 in prior valuation) per participant increasing at 3% per year
• Average premium used to calculate the early retirement premiums was updated to $10,797
• Adjustment of the retiree contribution increase
• Adjustment of the assumption for Medicare Part B
• Includes certain plan changes made pursuant to revised agreements with SEBAC
For Fiscal Years 2010 through 2015, the State paid $527.9 million, $527.9 million, $490.9 million, $549.1 million, $587.4 million, $548.7 million and $598.6 million, respectively, for retirees’ health care costs. While not a part of post-employment costs, for Fiscal Years 2010 through 2014, the State paid $493.4 million, $490.6 million, $518.4 million, $559.8 million, $614.3 million and $635.1 million, respectively, for General Fund eligible employees’ health care costs. For fiscal year ending June 30, 2016, the projected General Fund expenditures on retirees’ health care costs and on General Fund eligible employees’ health care costs were $658.6 million and $676.5 million, respectively. For fiscal year ending June 30, 2015, General Fund expenditures on life insurance benefits were $7.6 million, and the projected General Fund expenditures for fiscal year ending June 30, 2016 on life insurance benefits was $7.8 million.
The State received from The Segal Company a report dated June 8, 2015 presenting the information necessary to comply with GASB Statements Number 43 and 45 as of June 30, 2015 (“2015 OPEB GASB Report”) with respect to the State’s liability for post-retirement health care benefits (which include medical, prescription drug, dental and life insurance benefits) for eligible persons covered under SERS and other State retirement systems, excluding the Teachers’ Retirement System. The 2015 OPEB GASB Report indicated for Fiscal Year 2015 an Annual Required Contribution of $1,513.3 million and an Annual OPEB Cost of $1,541.7 million. Because the plan is funded on a pay-as-you-go basis, the State contributed approximately $538.3 million for retiree health insurance in Fiscal Year 2015.

III-91
The 2015 OPEB GASB Report applied the assumptions included in the 2014 OPEB Report, except for the following:
• Adjustments to the per-capita costs reflecting more favorable than expected experience for the medical and prescription drug plans included in the OPEB plan, less than anticipated increases in the Medicare Part B premiums and changes to retiree contributions
• Update of the average premium used to calculate the early retirement premiums from $10,797 to $11,157
• Application of the updated assumptions to the calculation of the Annual Required Contribution for the fiscal year ending June 30, 2014 and applying an estimated 4.00% annual growth factor to calculate the Annual Required Contribution for the fiscal year ending June 30, 2015. With the updated assumptions, the Annual Required Contribution for Fiscal Year 2014 would have been $1,455.1 million, a decrease of 0.8% from the Annual Required Contribution amount presented in the 2014 OPEB Report for such fiscal year.
The actuarial calculations presented in the 2015 OPEB GASB Report were prepared in accordance with generally accepted actuarial principles and practices for the internal use of the State.
The State has engaged The Segal Company to prepare an updated actuarial report with respect to the State’s liability for post-retirement health care benefits for eligible persons covered under SERS and other State retirement systems, excluding the Teachers’ Retirement System. It is anticipated that the report will be presented to the State in Spring 2016.
Set forth below for each of the past five fiscal years are the number of employees retired from State employment eligible to receive post-retirement health care and life insurance benefits, the number of retirees, respectively, actually receiving health care benefits and life insurance benefits, and the amount of General Fund appropriations by the State for such coverage.

III-92
TABLE 25
State Employee Retirees Health Care and Life Insurance Benefits
Fiscal Year 2011 2012 2013 2014 2015
Retirees Eligible to Receive Benefits ........................ 43,086 44,770(a) 47,510 48,844 50,356
Retirees Receiving Health Care Benefits ................ 42,905 44,659 45,092 46,037 47,556
Retirees Receiving Life Insurance Benefits ........ 28,017 28,405 28,204 28,580 29,164
General Fund Appropriations for Retiree Health Care and Life Insurance Benefits (millions) ...................... $595.3(b) $574.1(c) $596.1(d) $557.5(e) $598.6(f)
______________ (a) Prior to the conversion of the retirement payroll and retirement benefit systems in May 2013 to the same system, it was not
possible to accurately account for retirees eligible but not enrolled in benefits. (b) Of the $595.3 million appropriated for Fiscal Year 2011, $490.9 million was expended on retiree health care and life
insurance benefits. (c) The $574.1 million appropriated for Fiscal Year 2012 includes a combined appropriation of $8.9 million for active
employee and retiree life insurance benefits. Of the $574.1 million appropriation, $562.2 million was expended on retiree health care benefits and $4.4 million was expended on retiree life insurance benefits.
(d) The $596.1 million appropriated for Fiscal Year 2013 includes a combined appropriation of $8.7 million for active employees and retiree life insurance benefits. Of the $596.1 million appropriation, $587.4 million was expended on retiree health care benefits and $4.4 million was expended on retiree life insurance benefits.
(e) The $557.5 million appropriated for Fiscal Year 2014 includes a combined appropriation of $8.8 million for active employees and retiree life insurance benefits. Of the $557.5 million appropriation, $548.7 million was expended on retiree health care benefits and $4.4 million was expended on retiree life insurance benefits.
(f) The $598.6 million appropriated for Fiscal Year 2015 includes a combined appropriation of $7.6 million for active employees and retiree life insurance benefits. Of the $598.6 million appropriation, $591.1 million was expended on retiree health care benefits and $4.4 million was expended on retiree life insurance benefits.
Other Post-Employment Benefits – Teachers
The State is required to (i) make General Fund appropriations to the Teachers’ Retirement Board to cover one-third of retiree health insurance costs plus any portion of the balance of such costs that is not funded from the amounts available in the Teachers’ Retirement Health Insurance Fund; (ii) subsidize the health insurance costs of retired teachers who are not members of the Teachers’ Retirement Board’s health benefit plan; and (iii) provide an additional health insurance subsidy of at least $110 per month on behalf of retired teachers who are ineligible to participate in Medicare Part A “premium free” and who pay at least $220 per month to participate in the local board of education retiree health benefit plans. No General Fund appropriations to the Teachers’ Retirement Fund to cover retiree health insurance costs were made for Fiscal Years 2010 and 2011. The State made General Fund appropriations of $32.3 million, $34.4 million, $22.4 million, $20.2 million and $19.9 million for Fiscal Years 2012, 2013, 2014, 2015 and 2016 respectively, to subsidize the Teachers’ Retirement Health Insurance Fund. The Governor’s midterm budget adjustments for Fiscal Year 2013, reduced the State’s appropriation from 33% to 25% ($22.3 million) of the Medicare supplemental health insurance program, and utilized retiree drug subsidies which would have otherwise already been available to the Teachers’ Retirement Health Insurance Fund, to offset, in part, the State’s share of retiree health costs. As of Fiscal Year 2015 the retiree drug subsidies have expired. The Teachers’ Retirement Health Insurance Fund is invested in the Short Term Investment Fund. See also FINANCIAL PROCEDURES herein. Fund assets do not constitute plan assets for purposes of GASB Statements Nos. 43 and 45, and for actuarial valuation purposes fund assets are not treated as valuation assets available to offset

III-93
the accrued liability of the plan. Since July 1, 1994, retiree health benefits sponsored through the Teachers’ Retirement Board have been self-insured.
Implementation of GASB Statement No. 45 requires the State to obtain an analysis of the unfunded actuarial accrued liability of such retiree health insurance benefits and to recognize the annual required contribution to fund that actuarial liability in its financial statements. The Teachers’ Retirement Board received an actuarial valuation as of June 30, 2014 dated October 21, 2014 from Cavanaugh Macdonald Consulting, LLC of the State’s liability with respect to post-retirement health care benefits for members of the Teachers’ Retirement Fund and for retired teachers who are not members of the Teachers’ Retirement Board’s health benefit plan. The report indicates an actuarial accrued liability as of June 30, 2014 of $2,433.0 million on an unfunded basis, based upon certain stated assumptions including a 4.5% earnings assumption and a 30 year amortization period and no valuation assets available to offset the liabilities of the plan. Against these liabilities, as of June 30, 2015 the plan had no present assets for valuation purposes. The actuarial valuation determined a $125.6 million employer contribution requirement for Fiscal Year 2015 and $130.3 million for Fiscal Year 2016, based on an individual entry-age actuarial cost method and level percent-of-payroll contributions and applying a 4.5% discount rate resulting in an annual employer contribution of 3.16% of payroll.
Set forth below for each of the past five fiscal years are State contributions to the Teachers’ Retirement Health Insurance Fund to cover retiree health insurance costs and the portions of such contribution attributable to post-retirement Medicare supplement health insurance and to the health insurance cost subsidy for retired teachers who are not members of the Board’s health benefit plan, active and retired teachers’ contributions, investment income, Federal drug subsidy receipts, the expenditures from the Fund, and the reported fund balance of the Fund as of June 30.

III-94
TABLE 26
Teachers’ Retirement Health Insurance Fund (In Thousands)
Fiscal Year 2011 2012 2013 2014 2015 General Fund Contribution Attributable To Post- Retirement Medicare Supplement Health Insurance .................................. $ 0 $ 27,886.3 $ 21,816.2(c) $ 20,793.6(d) $ 19,698.1(a)
General Fund Contribution Attributable To Non-Board Health Insurance Cost Subsidy . 0 7,372.7 5,223.9 5,198.9 5,447.3 Total General Fund Contributions ............................ $ 0 $ 35,259.0 $ 27,040.1 $ 25,992.5 $ 25,145.4 Teacher Contributions (Active and Retired) .............................. 72,388.4 85,483.4 85,483.6 86,225.0 85,566.4 Investment Income ...................... 135.4 99.1 124.5 12,753.0 109.1 Federal Drug Subsidy .................. 5,312.2 14,227.1 0 (c) 0 (d) 0 Total Receipts .............................. $ 78,836.0 $135,068.5 $112,648.2 $ 124,970.5 $ 85,675.5 Fund expenditures ....................... ($ 91,852.8) ($ 96,347.4) ($101,450.5) ($105,325.5) ($124,992.1)(f)
Fund Balance as of June 30 ......... $ 53,055.5 $ 91,776.6 $102,974.3 $ 109,532.4(e) $ 95,361.2 ______________ (a) Correcting adjustment as to prior General Fund contributions; does not reflect an actual receipt. (b) An administrative review of the Fund determined that the reported fund balance as of June 30, 2010 was overstated
by approximately $2.0 million. A correcting adjustment was made as of June 30, 2011. (c) Retiree Federal Drug Subsidy amount of $10,203,832 included in General Fund Contribution Attributable to Post-
Retirement Medicare Supplement Health Insurance and not shown in Federal Drug Subsidy receipts below. (d) Retiree Federal Drug Subsidy amount of $9,362,367 included in General Fund Contribution Attributable to Post-
Retirement Medicare Supplement Health Insurance and not shown in Federal Drug Subsidy receipts below. (e) A fifteen year audit of the fund has determined the reported fund balance of June 30, 2014 was overstated by $13.0
million. A correcting adjustment was made as of June 30, 2015. (f) Correcting adjustment as to prior fund expenditures; does not reflect actual activity.
Additional Information
The audited financial statements for Fiscal Year 2015 which are included as Appendix III-C hereto, and in particular notes 10 through 14 and note 16 and the required PERS Supplementary Information of the accompanying Basic Financial Statements, provide additional information about the foregoing retirement systems and their funding. In addition, paragraph B of note 26 of such financial statements identifies a contingent liability of the State to pay pension liabilities of certain persons who are not employees of the State.
The cumulative value of the annual differences between the State’s contribution to a public employee
pension or OPEB plan and the actuarially recommended contribution to the plan for that fiscal year constitutes the “net pension obligation” or “net OPEB obligation” of the State with respect to such plan, and is reported as a liability in the State’s financial statements. The net pension obligation or net OPEB obligation of the State with respect to a plan is not the equivalent of the State’s actuarial accrued liability with respect to such plan.

III-95
LITIGATION
The State and its officers and employees are parties to numerous legal proceedings, many of which normally occur in government operations. The final outcomes of most of these legal proceedings are not, in the opinion of the Attorney General, either individually or in the aggregate likely to have a material adverse impact on the State’s financial position.
There are, however, several legal proceedings which, if decided adversely against the State, either individually or in the aggregate may require the State to make material future expenditures or may impair revenue sources. It is not possible to determine the impact that the outcomes of these proceedings, either individually or in the aggregate, could have on the State’s financial position. Among these proceedings, an adverse judgment in the matters described below, in the opinion of the Attorney General, individually could have a fiscal impact on the State of $50 million or more.
Sheff v. O’Neill is a Superior Court action originally brought in 1989, on behalf of school children in the Hartford school district. In 1996, the State Supreme Court reversed a judgment the Superior Court had entered for the State, and remanded the case with direction to render a declaratory judgment in favor of the plaintiffs. The Court directed the legislature to develop appropriate measures to remedy the racial and ethnic segregation in the Hartford public schools. The Supreme Court also directed the Superior Court to retain jurisdiction of this matter. The 1997 General Assembly enacted Public Act No. 97-290, An Act Enhancing Educational Choices and Opportunities, in response to the Supreme Court decision.
In December 2000, the plaintiffs filed a motion seeking to have the Superior Court assess the State’s compliance with the State Supreme Court’s 1996 decision. Before the Court ruled upon that motion the parties reached a settlement agreement which was deemed approved by the General Assembly and approved by the Superior Court on March 12, 2003. That agreement obliged the State over a four year period to institute a number of measures and programs designed to advance integration for Hartford Students. That agreement expired in June, 2007, but the State and the plaintiffs have subsequently negotiated a number of follow on agreements obligating the State to programming and other efforts designed to promote achievement of specified integration goals. The parties negotiated a stipulation that governs the parties' obligations through June of 2016 which received legislative approval pursuant to the provisions of Connecticut General Statutes Section 3-125a. Defendants are attempting to negotiate with the plaintiffs a stipulation to be effective through June 30, 2017 and which may include the opportunity to work toward a long term resolution of this litigation.
State Employees Bargaining Agent Coalition (“SEBAC”) v. Rowland is a Federal District Court case in which a purported class of laid off State employees sued the Governor and the Secretary of the Office of Policy and Management alleging that they were laid off in violation of their constitutional rights. The plaintiffs claimed back wages, damages, attorneys’ fees and costs. The defendants moved to dismiss the action based on absolute immunity, and that motion was denied on January 18, 2005. The defendants appealed that decision to the U.S. Court of Appeals. On July 10, 2007 the U.S. Court of Appeals remanded the case back to the District Court for trial. The parties subsequently entered into a stipulation of facts and then filed cross-motions for summary judgment on all remaining claims. By order dated May 31, 2013, the Second Circuit sustained the appeal directing that summary judgment be entered in plaintiff’s favor on the official capacity claims and remanding for entry of appropriate equitable relief. In addition, the remand order required that the individual capacity claims against the former Governor and Secretary of the Office of Policy and Management proceed through discovery and eventually trial. The Attorney General filed a petition for writ of certiorari seeking review of the official capacity claims by the United States Supreme Court, as did the individual capacity defendants. A motion to stay the Second Circuit’s mandate pending the defendants’ petitions for writ of certiorari was granted. Subsequently, the Attorney General withdrew his petition without prejudice to refiling if necessary upon entry of final judgment. The withdrawal was in response to an invitation by the plaintiffs to commence settlement negotiations. Further activity in the case and related state court litigation remained stayed pending settlement discussions. The individual capacity defendants’ petition for writ of certiorari was denied. After lengthy discussions, the parties reached a tentative agreement to resolve all claims
III-96
in the SEBAC cases. The settlement was submitted to the legislature on May 1, 2015 and was deemed approved, in accordance with provisions of Connecticut General Statutes Section 3-125a, on or about June 1, 2015. The court granted a motion for preliminary approval of the settlement. The court held a Final Fairness Hearing on October 1, 2015 and granted final approval of the settlement. The settlement also resolved two related cases that were brought in the Connecticut Superior Court: Conboy v. State of Connecticut and Parzio v. State of Connecticut. The settlement provides for cash payments estimated at approximately $44 million payable over the next three fiscal years, and additional vacation and personal time accruals. The overall value of the settlement is estimated at $100 million to $125 million.
In Connecticut Coalition for Justice in Education Funding et al. v. Rell, et al., brought in Hartford Superior Court, the plaintiffs are a non-profit coalition comprised of parents, teachers, school administrators and educational advocates, as well as several parents on behalf of their minor children who reside in selected rural, suburban and urban municipalities in the State. Plaintiffs claim the students' State constitutional rights to a free public education under Article VIII, Section 1, equality of rights under Article I, Section 1 and equal protection of the laws under Article I, Section 20 are being violated by the alleged inequitable and inadequate financing of their schools by the State. In particular, plaintiffs claim for a variety of reasons that the State's primary statutory mechanism for the distribution of State aid for public schools currently fails to ensure both substantially equal educational opportunities and a suitable education for some students, as purportedly reflected by both the educational challenges they face and their poor performance on state standardized measures. The action seeks a declaratory judgment from the Court, an injunction against the operation of the current system, an order that a new system be devised, the appointment of a special master to oversee such activities, continuing Court jurisdiction and attorney fees and costs. The court ruled that the Coalition, as opposed to the other plaintiffs, lacks legal standing to pursue the claims. The plaintiffs sought to replead to overcome the impact of this ruling. The defendants moved to strike the plaintiffs’ claims for a “suitable” education under the State Constitution. On September 17, 2007 the Superior Court issued a ruling granting the State’s motion to strike three counts of the plaintiffs’ complaint. After the Court's ruling, one count of the plaintiffs’ complaint remained, alleging that the plaintiffs have been denied substantially equal education opportunity in violation of the State constitution. The State did not move to strike that count. The plaintiffs sought and obtained permission to appeal immediately to the Connecticut Supreme Court. On March 30, 2010 a plurality of the Supreme Court reversed the trial court, ruled that the State Constitution guarantees public school students a right to suitable educational opportunities and remanded the case for a determination of whether such opportunities are being provided. Trial began on January 12, 2016, and is scheduled to continue through May, 2016. A trial court decision will probably come several months after the conclusion of evidence and is almost certain to be followed by an appeal. Therefore a final decision is likely years in the future. The State continues to defend the case vigorously.
American Indian Tribes. It is possible that land claims could be brought by American Indian groups who have petitioned the Federal Government for federal recognition. In any of the land claims matters, irrespective of whether federal recognition is granted, denied or upheld, a particular tribe could institute or renew land claims against the State or others, or press the claims it has already asserted. The federal Bureau of Indian Affairs has adopted new regulations for the federal recognition of tribes under relaxed standards, but those regulations do not presently allow for previously denied petitioners, such as the Schaghticoke Tribal Nation, Golden Hill Paugussett Tribe and the Eastern Pequot Tribal Nation, to seek recognition under new regulations.
Bouchard v. State Employees Retirement Commission is a state court proceeding representing an administrative appeal from a denial by the State Employees Retirement Commission (“SERC”) of a request to recalculate the pensions of three retirees, based on the 2007 case of Longley v. State Employees Retirement Commission and its progeny. In Longley the State Supreme Court held that SERC was required to include a retiree’s final prorated longevity payment in their final year salary, for the purpose of calculating retirement benefits. SERC initially interpreted Longley, with the exception of the Longley plaintiffs, as prospective in application. In April 2009, SERC adopted a resolution to extend Longley retroactively to October 2, 2001. The plaintiffs in Bouchard et al., comprise State employees who retired prior to October 2, 2001, who have

III-97
appealed the denial and seek a recalculation of current pension benefits, an award of past underpayment of benefits and attorney’s fees. This case had been certified as a class but the trial court denied plaintiffs' request for a mandatory class action. The approximate size of the class would be 18,000 retirees. On June 18, 2015, the trial court sustained the plaintiffs' administrative appeal (count one) and ordered SERC to apply Longley to the three named plaintiffs' retirement income calculation from the time of retirement. The court also ordered postjudgment interest of 5% per annum from the date of final judgment until the date the judgment is fully paid. The trial court granted SERC's cross-motion for summary judgment as to count two (declaratory ruling seeking mandatory class action relief for those similarly situated) because that claim is barred by the three year statute of limitations under Connecticut General Statutes Section 52-577. The financial exposure of the decision is approximately $10,000. The plaintiffs filed a motion to reargue and to extend the period within which to file an appeal. The SERC objected. The trial court sustained SERC's objection to the plaintiff’s motion to reargue/reconsider dated September 14, 2015. The plaintiff appealed to the Appellate Court on September 30, 2015. SERC cross-appealed to preserve its position that no liability exists. The appeal is pending.

III-98
OTHER MATTERS
In Fiscal Year 2012, the State began levying a tax on the net patient revenue of each hospital in the State. A petition for a declaratory ruling was received by the Department of Social Services (“DSS”) and the Department of Revenue Services (“DRS”) claiming that this tax is invalid as implemented under various constitutional and administrative theories. The determination of DSS and DRS with respect to the petition could affect the collection of the tax going forward, provide the basis for potential refund claims, or result in litigation. No representation is made concerning the possible resolution or financial impact of this matter, or what actions the State might implement in response to any adverse findings.

III-99
INDEX TO APPENDICES
Appendix III-A Governmental Organization and Services ........................................................... III-A-1
Appendix III-B State Economy ..................................................................................................... III-B-1
Appendix III-C June 30, 2015 (GAAP-Based) Audited Basic Financial Statements ................... III-C-1 Comptroller’s Transmittal Letter .................................................................. III-C-2 Independent Auditor’s Report ...................................................................... III-C-3 Management’s Discussion and Analysis (MDA) ......................................... III-C-7 June 30, 2015 Basic Audited Financial Statements ..................................... III-C-19 Notes to June 30, 2015 Audited Financial Statements ................................. III-C-49 Required PERS Supplementary Information ................................................ III-C-81
Appendix III-D June 30, 2011-June 30, 2015 Budgetary (Modified Cash/Statutory Basis) General Fund Financial Statements .............................................................. III-D Comptroller’s Transmittal Letter (June 30, 2011 – June 30, 2015) .............. III-D-1 Auditor’s Letter (June 30, 2011 - June 30, 2015) ........................................ III-D-2 June 30, 2011-June 30, 2013 Budgetary (Modified Cash Basis) and June 30, 2014 - June 30, 2015 Statutory Basis General Fund Financial Statements .................................................................................................... III-D-4
Appendix III-E Fiscal Year 2015 Adopted Budget and Final Financial Results, Fiscal Year 2016 Adopted and Estimated Budget and Fiscal Year 2017 Adopted Budget ............................................................................................ III-E-1

[INTENTIONALLY LEFT BLANK]

III-A-1
Appendix III-A
GOVERNMENTAL ORGANIZATION AND SERVICES
Introduction
The components and structure of State governmental organization are laid out in the State’s Constitution and the General Statutes of Connecticut. A number of State-wide and regional authorities and similar bodies are also created or provided for in the General Statutes or by Special Act of the General Assembly. County government was functionally abolished in Connecticut in 1960. Local governmental functions are generally performed by the 169 cities and towns, or by special purpose authorities, districts and similar bodies located within the cities and towns. A number of regional bodies exist to perform governmental functions that would otherwise be performed at the local level. Most of the State’s 169 cities and towns were established or incorporated during the 18th and 19th centuries, and many are still governed under charters enacted by the General Assembly by Special Act. The State’s Constitution grants home rule powers to cities and towns, within certain limitations. A large number of smaller municipalities lack charters, and the components and structure of these municipalities are determined directly by the General Statutes. The General Statutes also contain a variety of provisions pertaining to the organization and operation of all units of local government, including both those with charters and those without. In addition to the 169 cities and towns that are the basic units of local government in Connecticut, the General Statutes provide procedures for the creation of many types of local special purpose authorities, districts and similar bodies. These include, among others, local housing authorities, regional school districts, and a variety of special tax and service districts.
Under Connecticut law, all municipal governmental bodies have only the powers specifically granted to them by the State and the ancillary powers that are necessarily implied by powers explicitly granted. Municipalities which have the power to tax and to issue debt are explicitly denied the power by statute to file petitions to become debtors under Chapter Nine of Title 11 of the Federal Bankruptcy Code without the prior written consent of the Governor.
State Government Organization
Under the State Constitution, the legislative, executive and judicial functions and powers of State government are divided among three distinct branches referred to in the Constitution as “departments”: the legislative department, the executive department and the judicial department. The following table shows the structure of the three departments.

III-A-2
TABLE A-1
Structure of State Government
Auditors of Public Accounts
Legislative Department
Electorate
State BondCommission
Office of Policy andManagement
Executive Agencies, Departments, Boards and Commission
Supreme Court
Appellate Court
Superior Court
Judicial Department
General Assembly
Senate House of
Represen-tatives
LieutenantGovernor Governor
Secretary ofof the State
Treasurer
Attorney General
Executive Department
Comptroller

III-A-3
Legislative Department. Legislative power is vested in the General Assembly, composed of the Senate and House of Representatives. Currently the Senate consists of 36 members, each representing a single senatorial district, and the House of Representatives consists of 151 members, each representing a single assembly district. Both the number of members and the boundaries of the legislative districts may vary in accordance with the requirements of the State’s Constitution. The General Assembly is assisted by a full-time staff. General Assembly employees are included under the legislative function in Tables A-2 and A-3 below.
General Assembly members are elected biennially at the general election in November in even numbered years and take office in the January following their election. Elections for the General Assembly were held in November 2014, and the new members took office in January 2015.
A regular session of the General Assembly is held each year. These sessions run from January through June in odd-numbered years and February through May in even-numbered years. The General Assembly reconvenes for special sessions in general only in emergencies or to consider bills or appropriations vetoed by the Governor. Even-year sessions are supposed to be limited to budgetary, revenue and financial matters, bills and resolutions raised by committees of the General Assembly and certified emergencies.
Two Auditors of Public Accounts, who cannot be of the same political party, are appointed by the General Assembly to four-year terms. The State Auditors are required to make an annual audit of the accounts of the Treasurer and the Comptroller and, biennially or as frequently as they deem necessary, to audit the accounts of each officer, department, commission, board and court of the State government authorized to expend State appropriations. The Auditors are required to report unauthorized, illegal, irregular or unsafe handling or expenditure of State funds or any actual or contemplated breakdown in the safeguarding of any resources of the State promptly upon discovery to the Governor, the State Comptroller, the Attorney General and appropriate legislative agencies. Each budgeted agency of the State must keep its accounts in such form and by such methods as to exhibit facts required by the State Auditors. A full-time staff assists the State Auditors. Employees of the State Auditors are included under the legislative function in Tables A-2 and A-3 below.
Executive Department. The Governor, Lieutenant Governor, Secretary of the State, Treasurer, Comptroller and Attorney General, whose offices are mandated by the State’s Constitution, were elected at the general election in November 2014 for terms beginning in January 2015. Elections for all of these offices are held every four years. The Governor and Lieutenant Governor are elected as a unit.
The supreme executive power of the State is vested in the Governor. The Governor has the constitutional responsibility for ensuring that the laws are faithfully executed, giving the General Assembly information on the state of the government, and recommending to the General Assembly such measures as the Governor may deem expedient. The Governor is empowered to veto bills and line items in appropriations bills, but the General Assembly may reconsider and repass such matters upon a two-thirds vote of each house, whereupon such bills or appropriations become law. Broad appointive and investigative powers are conferred upon the Governor by statute. The Lieutenant Governor serves as President of the Senate and becomes Governor in case of the inability of the Governor to exercise the powers and perform the duties of the office.
The Treasurer is primarily responsible for receiving and disbursing all monies belonging to the State, superintending the collection of State taxes and revenues and the investment of State funds, administering certain State trust funds and managing State property. Subject to the approval of the Governor, the Treasurer is authorized, when necessary, to make temporary borrowings evidenced by State obligations. In addition, the State Bond Commission may delegate to the Treasurer the responsibility for determining the terms and conditions and carrying out the issuance of State debt.
The Secretary of the State administers elections, has custody of all public records and documents, and certifies to the Treasurer and the Comptroller the amount and purpose of each appropriation made by the General Assembly.

III-A-4
The Comptroller’s primary duties include adjusting and settling public accounts and demands and prescribing the method of keeping and rendering all public accounts. All warrants and orders for the disbursement of public money are registered with the Comptroller. The Comptroller also has authority to require reports from State agencies upon any matter of property or finance and to inspect all records in any public office, and is responsible for examining the amount of all debts and credits of the State. The Comptroller is required to issue monthly reports on the financial condition of the State, which are prepared on a modified cash basis and are not audited.
The Attorney General has general supervision over all legal matters in which the State is an interested party except those legal matters over which prosecuting officers have discretion. The duties of the office include giving advice and, on request, rendering legal opinions to the legislative and executive departments as to questions of law. Among the Attorney General’s statutory duties concerning State financial matters are membership on the State Bond Commission, the approval of all State contracts or leases and appearing before any committee of the General Assembly to represent the State’s best interests when any measure affecting the State Treasury is pending.
In addition to the constitutionally mandated offices, the General Statutes provide for a number of executive branch agencies, departments and commissions, each of which generally has its own agency head appointed by the Governor, in most cases with the advice and consent of one or both houses of the General Assembly. Of these statutorily established offices, the one most directly related to the fiscal operation and condition of the State is the Office of Policy and Management. The Secretary of the Office of Policy and Management is directly responsible to the Governor for policy development in four major areas: budget and financial management, policy development and planning, management and program evaluation, and intergovernmental policy. The Office of Policy and Management has significant responsibility in preparing the State budget, in assisting the Governor in policy development and in representing the State in most collective bargaining negotiations. It is the duty of the Office of Policy and Management to prepare and furnish to the General Assembly and Comptroller financial and accounting statements relating to the State’s financial condition and general accounts, and to examine and assist in the organization, management and policies of departments and institutions supported by the State in order to improve their effectiveness. The Secretary of the Office of Policy and Management, like the Comptroller, is empowered to inspect the financial records and to require reports of State agencies.
Employees of the executive department are included in Tables A-2 and A-3 below under all function headings except the legislative and judicial functions. A list of the major executive branch agencies, departments and commissions, by function headings, is found in Table A-5.
Judicial Department. The State’s judicial department consists of three principal trial and appellate courts: the Superior Court, the Appellate Court, and the Supreme Court.
The Superior Court is vested with original trial court jurisdiction over all civil and criminal matters. By statute, there are 201 authorized Superior Court judges, with approximately 171 sitting judges as of January 1, 2016, each nominated by the Governor and appointed by the General Assembly to eight-year terms.
On July 1, 1983 the Appellate Court was created and the appellate session of the Superior Court was dissolved. The Appellate Court hears appeals from decisions of the Superior Court except for certain matters which are directly appealable to the Supreme Court. There are nine Appellate Court judges nominated by the Governor and appointed by the General Assembly to eight-year terms.
The Connecticut Supreme Court reviews decisions of the Appellate Court and, in certain cases, of the Superior Court. Except in cases where original jurisdiction exists in the Supreme Court, there is no right of review in the Supreme Court unless specifically provided by statute. The Supreme Court consists of seven Justices (one Chief Justice and six Associate Justices) nominated by the Governor and appointed by the General Assembly to eight-year terms.

III-A-5
In addition to the principal trial and appellate courts, there is a Court of Probate in each of 54 probate districts situated throughout the State.
Employees of the judicial department are shown in Tables A-2 and A-3 under the judicial function heading.
Quasi-Public Agencies. In addition to the budgeted components of State government provided for in the State’s Constitution and the General Statutes, important State-wide governmental functions are performed by quasi-public agencies, authorities and similar bodies created under the General Statutes. A number of these entities receive significant funding from the State, although they are not budgeted agencies of the State. Each of these entities is governed by a board of directors chosen in accordance with its respective enabling statute. These boards generally include legislative appointees, gubernatorial appointees and ex-officio directors holding certain executive branch offices.
State Employees
Employment Statistics. Statistics regarding approximate filled permanent full-time positions within budgeted components of State government are shown on the following two tables.
TABLE A-2
State Employees(a) By Function of Government
Function Headings(b) 2011 2012 2013 2014 2015 Legislative .................................... 680 678 660 706 721 General Government ..................... 3,328 3,028 3,064 3,072 3,092 Regulation and Protection ............. 4,276 4,084 4,188 4,349 4,345 Conservation and Development .... 1,347 1,424 1,367 1,381 1,397 Health and Hospitals ..................... 6,874 6,534 7,082 6,979 6,977 Transportation ............................... 3,878 3,646 3,759 3,885 4,008 Human Services ............................ 1,911 1,923 1,817 1,824 1,915 Education ...................................... 17,217 17,272 16,129 16,689 17,272 Corrections ................................... 9,020 8,590 8,446 8,813 8,826 Judicial .......................................... 4,454 4,299 4,479 4,555 4,543 Total ............................................. 52,985 51,478 50,991 52,253 53,096
______________
(a) Table shows count of employees by fund category and function of government paid in April of each year. Employees working in multiple government functions or paid through multiple fund sources are counted multiple times.
(b) A breakdown of the budgeted agencies, boards, commissions and similar bodies included in each of the listed government function headings is shown in Table A-5.
SOURCE: Office of Policy and Management

III-A-6
TABLE A-3
State Employees as of April 30, 2015(a)(b) By Function of Government and Fund Categories
(a) Table shows a count of employees by fund categories. Employees working in multiple government functions or paid through multiple fund sources are counted multiple times. (b) Reflects funding source based on Core-CT chart of accounts coding.
SOURCE: Office of Policy and Management
Collective Bargaining Units and Process. The General Statutes guarantee State employees, other than elected or appointed officials and certain management employees and others with access to confidential information used in collective bargaining, the right to organize and participate in collective bargaining units. There are presently 34 such bargaining units representing State employees.
The General Statutes establish the general parameters of the collective bargaining process with respect to bargaining units representing State employees. At any given point in time, there are generally a number of collective bargaining units with agreements under negotiation. All collective bargaining agreements require approval of the General Assembly. The General Assembly may approve any such agreement as a whole by a majority vote of each house or may reject any such agreement as a whole by a majority vote of either house. Subject to certain parameters set forth in the General Statutes, if the State and the bargaining unit are unable to reach an agreement, one or both parties may initiate arbitration. The award of the arbitrator shall be final and binding upon the parties unless rejected by the legislature. An arbitration award may be rejected in whole by a two-thirds vote of either house of the General Assembly upon a determination that there are insufficient funds for full implementation of the award.
The General Statutes deny State employees the right to strike. Questions concerning employment or bargaining practices prohibited by the sections of the General Statutes governing collective bargaining with regard to State employees may generally be brought before the State Board of Labor Relations.
Information regarding employees participating in collective bargaining units and employees not covered by collective bargaining is shown in the following table:
Function Headings General Fund
Special Transportation Fund
Other Appropriated
Funds
Special Funds – Non-Appropriated
Federal Funds TOTALS
Legislative 721 0 0 0 0 721 General Government 2,827 1 13 123 128 3,092 Regulation and Protection
2,280
635
411
771
248
4,345
Conservation and Development
870
0
117
61
349
1,397
Health and Hospitals 6,332 0 9 0 636 6,977 Transportation 1 3,001 0 1,006 0 4,008 Human Services 1,871 0 0 0 44 1,915 Education 5,796 0 0 11,251 225 17,272 Corrections 8,735 0 0 72 19 8,826 Judicial 4,432 0 65 0 46 4,543 Total 33,865 3,637 615 13,284 1,695 53,096

III-A-7
TABLE A-4
Full-Time Work Force Collective Bargaining Units and
Those Not Covered by Collective Bargaining
Bargaining Unit/Status Group
Percentage of State Employees Represented(a)
Contract Status, if any
Covered by Collective Bargaining Administrative and Residual (P-5) 5.79% Contract in place through 6/30/2016 Administrative Clerical (NP-3) 6.64 Contract in place through 6/30/2016 American Federation of School Administrators 0.11 Contract in place through 6/30/2016 Board for State Academic Awards 0.13 Contract in place through 6/30/2016 Community College Administration - AFSCME 0.18 Contract in place through 6/30/2016 Community College Administration – CCCC 1.36 Contract in place through 6/30/2016 Community College AFT – Counselors/Librarians 0.03 Contract in place through 6/30/2016 Community College Faculty – AFT 0.33 Contract in place through 6/30/2016 Community College Faculty – CCCC 1.28 Contract in place through 6/30/2016 Connecticut Association of Prosecutors 0.48 Contract in place through 6/30/2016 Correctional Officers (NP-4) 9.24 Contract in place through 6/30/2016 Correctional Supervisor (NP-8) 0.97 Contract in place through 6/30/2016 Criminal Justice Inspectors 0.14 Contract in place through 6/30/2016 Criminal Justice Residual 0.25 Contract in place through 6/30/2016 DPDS Chief Public Defenders 0.04 Contract in place through 6/30/2016 DPDS Public Defenders 0.38 Contract in place through 6/30/2016 Education Administrative (P-3A) 0.47 Contract in place through 6/30/2016 Education Technical (P-3B) 1.20 Contract in place through 6/30/2016 Engineering, Scientific and Technical (P-4) 4.96 Contract in place through 6/30/2016 Health Care Unit-Non-Professional (NP-6) 5.77 Contract in place through 6/30/2016 Health Care Unit-Professional (P-1) 6.03 Contract in place through 6/30/2016 Higher Education – Professional Employees 0.04 Contract in place through 6/30/2016 Judicial - Judges 0.38 Contract in place through 6/30/2016 Judicial - Judicial Marshals 1.34 Contract in place through 6/30/2016 Judicial – Law Clerks 0.11 Contract in place through 6/30/2016 Judicial – Non-Professional 2.59 Contract in place through 6/30/2016 Judicial - Professional 2.54 Contract in place through 6/30/2016 Judicial - Supervising Judicial Marshals 0.12 Contract in place through 6/30/2016 Protective Services (NP-5) 1.61 Contract in place through 6/30/2016 Service/Maintenance (NP-2) 7.50 Contract in place through 6/30/2016 Social and Human Services (P-2) 7.76 Contract in place through 6/30/2016 State Vocational Federation of Teachers 2.30 Contract in place through 6/30/2016 State Police (NP-1) 2.11 Contract in place through 6/30/2018 State Police Lieutenants and Captains (NP-9) 0.07 Contract in place through 6/30/2016 State University-Faculty 2.82 Contract in place through 6/30/2016 State University- Non-Faculty Professional 1.56 Contract in place through 6/30/2016 UCHC – Faculty 0.62 Contract in place through 6/30/2016 UCHC University Health Professionals 3.06 Contract in place through 6/30/2016 UConn - Faculty 3.42 Contract in place through 6/30/2016 UConn – Law School Faculty 0.09 Contract in place through 6/30/2016 UConn - Non-Faculty 3.31 Contract in place through 6/30/2016 Total Covered by Collective Bargaining 89.13 % Not Covered by Collective Bargaining Auditors of Public Accounts 0.22% Not Applicable Other Employees 10.65 % Not Applicable Total Not Covered by Collective Bargaining 10.87%
Total Full-Time Work Force 100.00%
______________ (a) Percentage expressed reflects approximately 51,169 filled full-time positions as of February 5, 2016.
SOURCE: Office of Policy and Management

III-A-8
Governmental Services
Services provided by the State or financed by State appropriations are classified under one of ten major government function headings or are classified as “non-functional”. These function headings are used for the State’s General Fund and for other funds of the State used to account for appropriated moneys. State agencies, boards, commissions and other bodies are each assigned to one of the function headings for budgeting purposes. The following table shows a breakdown of the government function headings according to the major agencies, boards, commissions and other bodies assigned to them.
TABLE A-5
Function of Government Headings (a)(b)
Legislative Regulation and Protection Transportation Legislative Management Department of Emergency Services and Department of Transportation Auditors of Public Accounts Public Protection Commission on Aging Department of Motor Vehicles Human Services Commission on the Status of Women Military Department Department of Social Services Commission on Children Department of Banking State Department on Aging Latino and Puerto Rican Affairs Insurance Department Department of Rehabilitation Commission Office of Consumer Counsel Services African-American Affairs Office of the Health Care Advocate Commission Department of Consumer Protection Education, Libraries andAsian Pacific American Affairs Department of Labor Museums Commission Commission on Human Rights and Department of Education Opportunities State Library General Government Office of Protection and Advocacy for Office of Early Childhood Governor’s Office Persons with Disabilities University of Connecticut Lieutenant Governor’s Office Workers’ Compensation Commission University of Connecticut Health Secretary of the State Center Office of Governmental Conservation and Development Board of Regents for Higher Accountability Department of Agriculture Education State Treasurer Department of Energy and Office of Higher Education State Comptroller Environmental Protection Teachers’ Retirement Board Department of Revenue Services Council on Environmental Quality Office of Policy and Management Department of Economic and Corrections Department of Veterans’ Affairs Community Development Department of CorrectionDepartment of Administrative Department of Housing Department of Children and Services Agricultural Experiment Station Families Attorney General Division of Criminal Justice Health and Hospitals Judicial Department of Public Health Judicial Department Office of the Chief Medical Examiner Public Defender Services Department of Developmental Services Commission Department of Mental Health and Addiction Services Psychiatric Security Review Board
______________
(a) In addition to the ten listed government function headings, the State also employs a “non-functional” heading under which are grouped various miscellaneous accounts including debt service and State employee fringe benefit accounts.
(b) Listing of agencies, boards, commissions and similar bodies is as of July 1, 2015.
SOURCE: Office of Policy and Management

III-A-9
In addition to services provided directly by the State, various State-wide and regional quasi-public agencies, authorities and similar bodies also provide services. Such entities principally assist in the financing of various types of facilities and projects. In addition to their own budgetary resources and the proceeds of their borrowings, a number of such entities have received substantial funding from the State, which the entities generally use to provide financial assistance to the general public and the private and nonprofit sectors.
Because Connecticut does not have an intermediate county level of government between State and local government, local entities provide all governmental services not provided by the State and quasi-public agencies. Such services are financed principally from property tax revenues, State funding of various types and federal funding.
Department of Emergency Services and Public Protection. The Department of Emergency Services and Public Protection is responsible for providing a coordinated, integrated program for the protection of life and property and for state-wide emergency management and homeland security. Through the Division of Emergency Management and Homeland Security (DEMHS), the Department is responsible for the preparation of a comprehensive civil preparedness plan and program, including integration and coordination with planning and activities of the federal government, other states, and towns, cities and tribal nations within the State. The State’s plans include the State Response Framework and the State Recovery Framework. For planning purposes, DEMHS has given priority for preparedness to the following potential scenarios: (i) a Category 3 hurricane hitting the State coast and all of New England, (ii) a large scale terrorist attack in New York City, and (iii) a release of contamination from the Millstone Power Plant. DEMHS also operates the State fusion center – the Connecticut Intelligence Center, a multi-agency, multi-jurisdictional entity which collects, analyzes and disseminates intelligence information to law enforcement and other related groups. Pursuant to the Connecticut General Statutes, the Commissioner of the Department is required to file an annual report each January to the joint standing committee of the General Assembly having cognizance of matters relating to public safety, which report specifies and evaluates statewide emergency management and homeland security activities during the preceding calendar year. In April 2015, the State received accreditation for its emergency management and homeland security activities from the nationally recognized Emergency Management Accreditation Program.

[INTENTIONALLY LEFT BLANK]
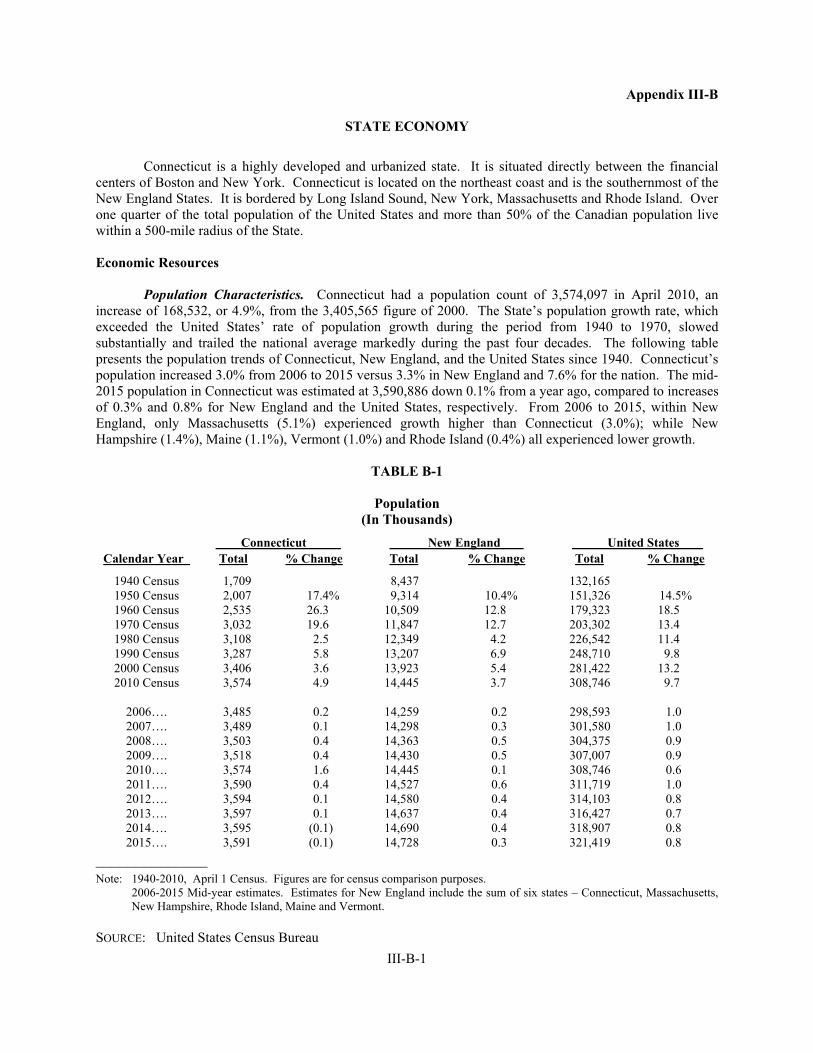
III-B-1
Appendix III-B
STATE ECONOMY
Connecticut is a highly developed and urbanized state. It is situated directly between the financial centers of Boston and New York. Connecticut is located on the northeast coast and is the southernmost of the New England States. It is bordered by Long Island Sound, New York, Massachusetts and Rhode Island. Over one quarter of the total population of the United States and more than 50% of the Canadian population live within a 500-mile radius of the State.
Economic Resources
Population Characteristics. Connecticut had a population count of 3,574,097 in April 2010, an increase of 168,532, or 4.9%, from the 3,405,565 figure of 2000. The State’s population growth rate, which exceeded the United States’ rate of population growth during the period from 1940 to 1970, slowed substantially and trailed the national average markedly during the past four decades. The following table presents the population trends of Connecticut, New England, and the United States since 1940. Connecticut’s population increased 3.0% from 2006 to 2015 versus 3.3% in New England and 7.6% for the nation. The mid-2015 population in Connecticut was estimated at 3,590,886 down 0.1% from a year ago, compared to increases of 0.3% and 0.8% for New England and the United States, respectively. From 2006 to 2015, within New England, only Massachusetts (5.1%) experienced growth higher than Connecticut (3.0%); while New Hampshire (1.4%), Maine (1.1%), Vermont (1.0%) and Rhode Island (0.4%) all experienced lower growth.
TABLE B-1
Population (In Thousands)
Connecticut New England United States Calendar Year Total % Change Total % Change Total % Change
1940 Census 1,709 8,437 132,165 1950 Census 2,007 17.4% 9,314 10.4% 151,326 14.5% 1960 Census 2,535 26.3 10,509 12.8 179,323 18.5 1970 Census 3,032 19.6 11,847 12.7 203,302 13.4 1980 Census 3,108 2.5 12,349 4.2 226,542 11.4 1990 Census 3,287 5.8 13,207 6.9 248,710 9.8 2000 Census 3,406 3.6 13,923 5.4 281,422 13.2 2010 Census 3,574 4.9 14,445 3.7 308,746 9.7
2006…. 3,485 0.2 14,259 0.2 298,593 1.0 2007…. 3,489 0.1 14,298 0.3 301,580 1.0 2008…. 3,503 0.4 14,363 0.5 304,375 0.9 2009…. 3,518 0.4 14,430 0.5 307,007 0.9 2010…. 3,574 1.6 14,445 0.1 308,746 0.6 2011…. 3,590 0.4 14,527 0.6 311,719 1.0 2012…. 3,594 0.1 14,580 0.4 314,103 0.8 2013…. 3,597 0.1 14,637 0.4 316,427 0.7
2014…. 3,595 (0.1) 14,690 0.4 318,907 0.8 2015…. 3,591 (0.1) 14,728 0.3 321,419 0.8
______________ Note: 1940-2010, April 1 Census. Figures are for census comparison purposes. 2006-2015 Mid-year estimates. Estimates for New England include the sum of six states – Connecticut, Massachusetts, New Hampshire, Rhode Island, Maine and Vermont.
SOURCE: United States Census Bureau

III-B-2
The State is highly urbanized with a 2015 population density of 741 persons per square mile, as compared with 91 for the United States as a whole. Of the eight counties in the State, according to the U.S. Bureau of Census for the 2010 Census count, 75% of the population resides within Fairfield (26%), Hartford (25%), and New Haven (24%) counties.
Education. In 2014 Connecticut ranked 4th in the nation with 16.4% of the state population over the age of 25 holding an advanced degree and 20.6% of the same population holding a college degree or higher.
Connecticut is home to over 45 colleges and universities, including among others: Yale University, Wesleyan University, Trinity College, Connecticut College, University of Connecticut, Southern Connecticut State University, Central Connecticut State University, Eastern Connecticut State University, Western Connecticut State University, Fairfield University, Quinnipiac University, Hartford Seminary, Coast Guard Academy, University of New Haven, University of Hartford, and Sacred Heart University.
Industry Landscape. Connecticut is home to some of the country’s leading companies, including the following members of the 2014 Fortune 500: United Technologies, Aetna, Cigna, Hartford Financial Services, Praxair, Stanley Black & Decker, Terex, Emcor Group, and Priceline.com. The historical presence of the insurance industry in the State, and especially in its capital city of Hartford, has caused it to be referred to as the “insurance capital of the world”.
Transportation. Connecticut has an extensive network of expressways and major arterial highways which provide easy access to local and regional markets. Bradley International Airport, in Windsor Locks, currently offers approximately 82 weekday departures to 28 non-stop destinations and is served by virtually all the major passenger and cargo air carriers. It is accessible from all areas of the State and western Massachusetts.
The Connecticut Department of Transportation funds and oversees the operation of rail, bus, paratransit and ferry services throughout the State. The New Haven Line (including the Waterbury, Danbury and New Canaan branch lines) and Shore Line East provide service to communities between New London and New York City and intermediate points, serving approximately 40 million passengers per year. State-sponsored public bus and paratransit transportation programs provide over 42 million passenger trips a year on urban transit, commuter express bus, rural transit, and Americans with Disabilities Act paratransit services. The overall program includes state-owned CTtransit bus services in 8 urbanized areas and CTfastrak bus rapid transit services provided in the greater Hartford area, as well as urban and rural transit and paratransit services provided by 13 independent transit districts. The State also operates two historic passenger and vehicular ferries, linking communities on the Connecticut River.
Railroad freight service is provided to most major towns and cities in the State, and connections are provided with major eastern railroads, as well as direct access to Canadian markets. Positioned between the ports of New York and Boston, with access to European and South American markets, the State’s deep draft harbors at Bridgeport, New Haven, and New London offer similar direct access to international markets and U.S. ports.
Utility Services. The power grid that supplies electricity to the entire State is owned and operated by both private and municipal electric companies. Transmission lines connect Connecticut with New York, Massachusetts and Rhode Island. These interconnections allow the companies serving Connecticut to meet large or unexpected electric load requirements from resources located outside of Connecticut’s boundaries. All electric utilities in the State are members of the New England Power Pool and operate as part of the regional bulk power system, the Regional Transmission Organization for New England. An independent system operator, ISO New England, Inc., operates this regional system.
Most consumers in Connecticut can choose an independent electric supplier as their provider of electricity. Consumers that do not choose an independent electric supplier will automatically be placed on
III-B-3
Connecticut’s standard service. The electricity is delivered to the consumer over the wires of the regulated distribution companies (Eversource Energy and The United Illuminating Company). Electric suppliers are not subject to rate regulation by the State Public Utilities Regulatory Authority (PURA), formerly known as the Department of Public Utility Control (DPUC), but must receive a license issued by the PURA before commencing service to consumers. In general, Connecticut consumers located in a municipally owned electric service territory can continue to purchase and receive their electrical needs from the municipal electric company.
Legislation enacted in 2011 merged PURA under a new Department of Energy and Environmental Protection (DEEP) structure, where it continues its mandates related to rates, reliability and safety, but now must also be guided in accordance with the goals of DEEP as outlined in its Integrated Resource Plan and Comprehensive Energy Strategy. These include a focus on clean energy, creating jobs and building a state energy economy. The legislation declares DEEP as a successor to the PURA, and divides DEEP into three bureaus, Energy, Environmental Protection and PURA. This legislation also established the position of a procurement manager which now resides within PURA.
The procurement manager is responsible for developing a plan for the procurement of electric generation services and related wholesale electricity market products that will enable each electric distribution company to manage a portfolio of contracts to reduce the average cost of “standard service” while maintaining “standard service” cost volatility within reasonable levels.
Lastly, the legislation created a quasi-public authority, the Clean Energy Finance and Investment Authority (CEFIA) to administer the Clean Energy Fund which is funded by a charge on consumer’s electric bills. Pursuant to legislation, CEFIA’s scope was expanded to include more types of projects the fund can support with respect to the financing of clean energy sources and energy efficiency.
Natural gas is delivered to Connecticut through pipelines that traverse the State. Natural gas pipeline supplies are generally shipped to Connecticut from Canada and the Gulf of Mexico area. Connecticut also receives natural gas through the interstate pipelines from a terminal located in Boston, Massachusetts which is supplied by tanker ships. Natural gas service is provided to parts of the State through one municipal and three private gas distribution companies, including Eversource Energy, Connecticut Natural Gas Company, and Southern Connecticut Gas Company. Over the past few years, UIL Holdings Corp. has acquired both Connecticut Natural Gas and Southern Connecticut Gas. UIL Holdings Corp., the parent company of The United Illuminating Company, is a New Haven, Connecticut-based utility holding company.
Since 1996 the PURA has allowed some competitive market forces to enter the natural gas industry in Connecticut. Commercial and industrial gas consumers can choose non-regulated suppliers for their natural gas requirements. The gas is delivered to the consumer using the local distribution company’s mains and pipelines. This competitive market is not yet available to the residential consumer.
In addition to the electric and natural gas industries, telecommunications services are also open to competition. Local exchange telephone service is provided in the State by local exchange carriers (LECs) and competitive local exchange carriers (CLECs). Two LECs currently offer local telephone services in Connecticut. They are Frontier Corporation and Verizon New York, Inc. Connecticut also has 120 CLECs certified to provide local exchange services including Comcast Phone of Connecticut, Inc., Cox Connecticut Telecommunication, LLC and Connecticut Telephone and Communications Systems, Inc.
Connecticut is dependent upon oil, including imported oil, for a portion of its energy requirements. This dependence is greatest in the transportation sector. Connecticut also relies on heating oils in both the residential and commercial sectors, and is reliant on residual oils and diesel fuels for the production of electricity. This petroleum dependence can make Connecticut particularly affected by developments in the oil commodity markets. Events that affect the international or domestic production of oil, the domestic and

III-B-4
international refining capabilities, or the transportation of petroleum products within the United States or into the New England region can affect Connecticut’s local oil markets.
Although Connecticut is heavily dependent upon petroleum, the State is ranked one of the most efficient states for energy consumption. According to the most recent available data from the Energy Information Administration, an independent agency within the U.S. Department of Energy that collects and analyzes energy data, Connecticut consumed 3.2 thousand British Thermal Units (BTU) per 2009 chained dollar of Gross State Product in 2013, the latest available data, ranking it the 2nd most efficient state among the 50 states and 48.4% less than the national average of 6.2 thousand BTU. When compared to the national per person average, Connecticut residents use a moderate amount of energy. Connecticut consumed 208 million BTU of energy per person in 2013, ranking it 46th among the 50 states and 32.3% less than the national average of 307 million BTU.
Energy prices trended downward in Connecticut during 2015, however they remain elevated relative to the nation. Nationally, home heating oil, gasoline and natural gas prices have fallen to 10 year lows due to a dramatic increase in supply globally. For the past decade the United States has experienced a significant rise in oil production, due in large part to technological innovations in the area of shale oil fracking. To maintain market share oil exporters have increased production, even as prices decline, as many of their economies rely heavily on such energy resources. All of this, in combination with a reduction in demand in Europe and the signs of weakening economic growth in China and emerging markets, have led to a historic oversupply in the oil market which are driving prices down.
Economic Performance
Personal Income. Connecticut has a high level of personal income. Historically, the State’s average per capita income has been among the highest in the nation. The high per capita income is due to the State’s concentration of relatively high paying manufacturing jobs along with a higher portion of residents working in the non-manufacturing sector in such areas as finance, insurance, and real estate, as well as educational services. A concentration of major corporate headquarters located within the State also contributes to the high level of income. In calendar year 2014, per capita personal income in Connecticut equaled $64,862, the highest of any state in the nation. This high level of personal income is not concentrated in a single county, but is widely distributed throughout the State. County-level data from the United States Department of Commerce, Bureau of Economic Analysis for calendar year 2013 indicates that if they were states, seven of the State’s eight counties would each rank within the top ten of all states in the nation for state per capita personal income. The eighth county, Windham, would rank 33rd in the nation. The following table shows total and per capita personal income for Connecticut residents during the period from 2005 to 2014 and compares Connecticut per capita personal income as a percentage of both New England and the United States.

III-B-5
TABLE B-2
Connecticut Personal Income by Place of Residence
Connecticut Connecticut Per Capita as Percent of Calendar Year
Total
(Millions of Dollars) Per Capita (Dollars)
New England United States
2005 $173,529 $49,463 114.7% 138.2% 2006 187,702 53,345 115.3 140.1 2007 200,077 56,677 116.8 142.7 2008 204,850 57,746 115.6 140.9 2009 197,697 55,472 114.2 141.1 2010 205,265 57,334 114.7 142.5 2011 215,017 59,884 114.2 141.2 2012 225,503 62,726 114.5 141.9 2013 223,561 62,126 113.9 140.0 2014 233,293 64,862 114.2 141.0
______________
SOURCE: United States Department of Commerce, Bureau of Economic Analysis
The following table indicates the annual growth rate of personal income, on a current and constant dollar basis, of Connecticut, New England and the United States.
TABLE B-3
Annual Growth Rates in Personal Income By Place of Residence
Calendar Year
Conn. (Current)
New England (Current)
U.S. (Current)
Conn. (Constant)
New England (Constant)
U.S. (Constant)
2005 5.4% 4.2% 5.6% 2.5% 1.4% 2.7% 2006 8.2 7.4 7.3 5.4 4.7 4.6 2007 6.6 5.2 5.3 4.0 2.7 2.7 2008 2.4 3.3 4.2 (0.6) 0.4 1.1 2009 (3.5) (2.4) (3.3) (3.2) (2.0) (3.2) 2010 3.8 3.3 3.2 3.0 2.0 1.5 2011 4.8 5.4 6.2 2.6 3.1 3.7 2012 4.9 4.8 5.0 2.9 3.2 3.0 2013 (0.9) 0.0 1.1 (1.6) (1.2) (0.3) 2014 4.4 4.4 4.4 3.1 2.9 3.0
______________ Note — Real dollars are adjusted for inflation using the national personal consumption expenditures price index and regional price parities.
SOURCE: United States Department of Commerce, Bureau of Economic Analysis

III-B-6
The following table indicates the sources of personal income by place of residence for Connecticut and the United States in 2014.
TABLE B-4
Sources of Personal Income By Place of Residence Calendar Year 2014
(In Millions)
Conn.
Percent of Total U.S.
Percent of Total
Wages in Non-manufacturing ...................................... $107,570 46.1% $ 6,696,875 45.6% Property Income (Div., Rents & Int.) .......................... 48,208 20.7 2,728,350 18.6 Wages in Manufacturing ............................................. 14,570 6.2 780,875 5.3 Transfer Payments less Social Insurance Paid ............. 12,446 5.3 1,370,200 9.3 Other Labor Income ..................................................... 28,186 12.1 1,771,200 12.1 Proprietor’s Income ..................................................... 22,313 9.6 1,346,700 9.2 Personal Income — Total ............................................ $233,293 100.0% $14,694,200 100.0%
______________ Note—Columns may not add due to rounding.
SOURCE: United States Department of Commerce, Bureau of Economic Analysis
Gross State Product. The State’s and the region’s economic vitality are evidenced in the rate of growth of their respective Gross State Products. The State’s Gross State Product is the current market value of all final goods and services produced by labor and property located within the State.
In 2014, the State produced $253.0 billion worth of goods and services and $232.6 billion worth of goods and services in 2009 chained dollars.
The following table shows the Gross State Product in current dollars for Connecticut, New England, and the United States.
TABLE B-5
Gross State Product (In Millions)
Connecticut New England(a) United States(b)
Calendar
Year $
Percent Growth
$
Percent Growth
$
Percent Growth
2005 208,154 4.6 723,205 4.5 13,093,700 6.7 2006 220,994 6.2 758,827 4.9 13,855,900 5.8 2007 235,143 6.4 795,167 4.8 14,477,625 4.5 2008 231,745 (1.4) 799,309 0.5 14,718,575 1.7 2009 227,003 (2.0) 792,927 (0.8) 14,418,725 (2.0) 2010 232,470 2.4 820,973 3.5 14,964,400 3.8 2011 233,960 0.6 840,420 2.4 15,517,925 3.7 2012 239,878 2.5 867,592 3.2 16,155,250 4.1 2013 246,897 2.9 893,812 3.0 16,663,150 3.1 2014 253,036 2.5 924,937 3.5 17,348,075 4.1
______________ (a) Sum of the New England States’ Gross State Products. (b) Denotes the Gross Domestic Product, which is the total market value of all final goods and services produced in the U.S.
SOURCE: United States Department of Commerce, Bureau of Economic Analysis
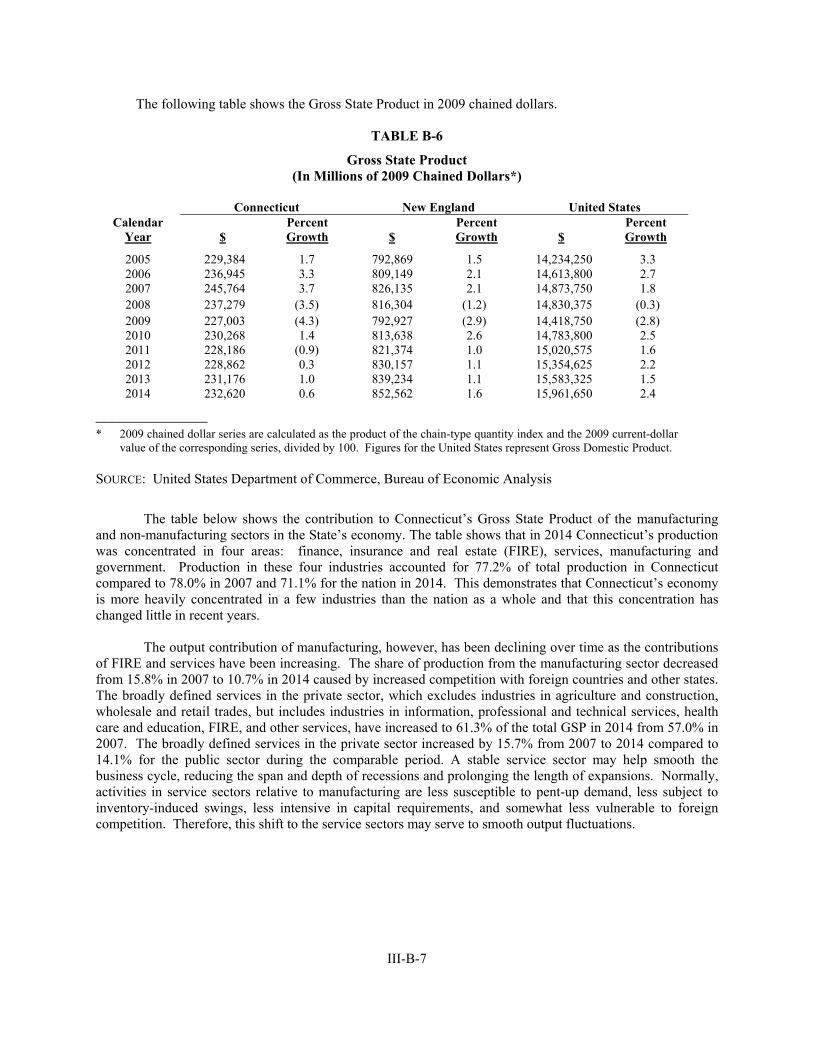
III-B-7
The following table shows the Gross State Product in 2009 chained dollars.
TABLE B-6
Gross State Product (In Millions of 2009 Chained Dollars*)
Connecticut New England United States Calendar
Year $
Percent Growth
$
Percent Growth
$
Percent Growth
2005 229,384 1.7 792,869 1.5 14,234,250 3.3 2006 236,945 3.3 809,149 2.1 14,613,800 2.7 2007 245,764 3.7 826,135 2.1 14,873,750 1.8 2008 237,279 (3.5) 816,304 (1.2) 14,830,375 (0.3) 2009 227,003 (4.3) 792,927 (2.9) 14,418,750 (2.8) 2010 230,268 1.4 813,638 2.6 14,783,800 2.5 2011 228,186 (0.9) 821,374 1.0 15,020,575 1.6 2012 228,862 0.3 830,157 1.1 15,354,625 2.2 2013 231,176 1.0 839,234 1.1 15,583,325 1.5 2014 232,620 0.6 852,562 1.6 15,961,650 2.4
______________ * 2009 chained dollar series are calculated as the product of the chain-type quantity index and the 2009 current-dollar value of the corresponding series, divided by 100. Figures for the United States represent Gross Domestic Product.
SOURCE: United States Department of Commerce, Bureau of Economic Analysis
The table below shows the contribution to Connecticut’s Gross State Product of the manufacturing and non-manufacturing sectors in the State’s economy. The table shows that in 2014 Connecticut’s production was concentrated in four areas: finance, insurance and real estate (FIRE), services, manufacturing and government. Production in these four industries accounted for 77.2% of total production in Connecticut compared to 78.0% in 2007 and 71.1% for the nation in 2014. This demonstrates that Connecticut’s economy is more heavily concentrated in a few industries than the nation as a whole and that this concentration has changed little in recent years.
The output contribution of manufacturing, however, has been declining over time as the contributions of FIRE and services have been increasing. The share of production from the manufacturing sector decreased from 15.8% in 2007 to 10.7% in 2014 caused by increased competition with foreign countries and other states. The broadly defined services in the private sector, which excludes industries in agriculture and construction, wholesale and retail trades, but includes industries in information, professional and technical services, health care and education, FIRE, and other services, have increased to 61.3% of the total GSP in 2014 from 57.0% in 2007. The broadly defined services in the private sector increased by 15.7% from 2007 to 2014 compared to 14.1% for the public sector during the comparable period. A stable service sector may help smooth the business cycle, reducing the span and depth of recessions and prolonging the length of expansions. Normally, activities in service sectors relative to manufacturing are less susceptible to pent-up demand, less subject to inventory-induced swings, less intensive in capital requirements, and somewhat less vulnerable to foreign competition. Therefore, this shift to the service sectors may serve to smooth output fluctuations.
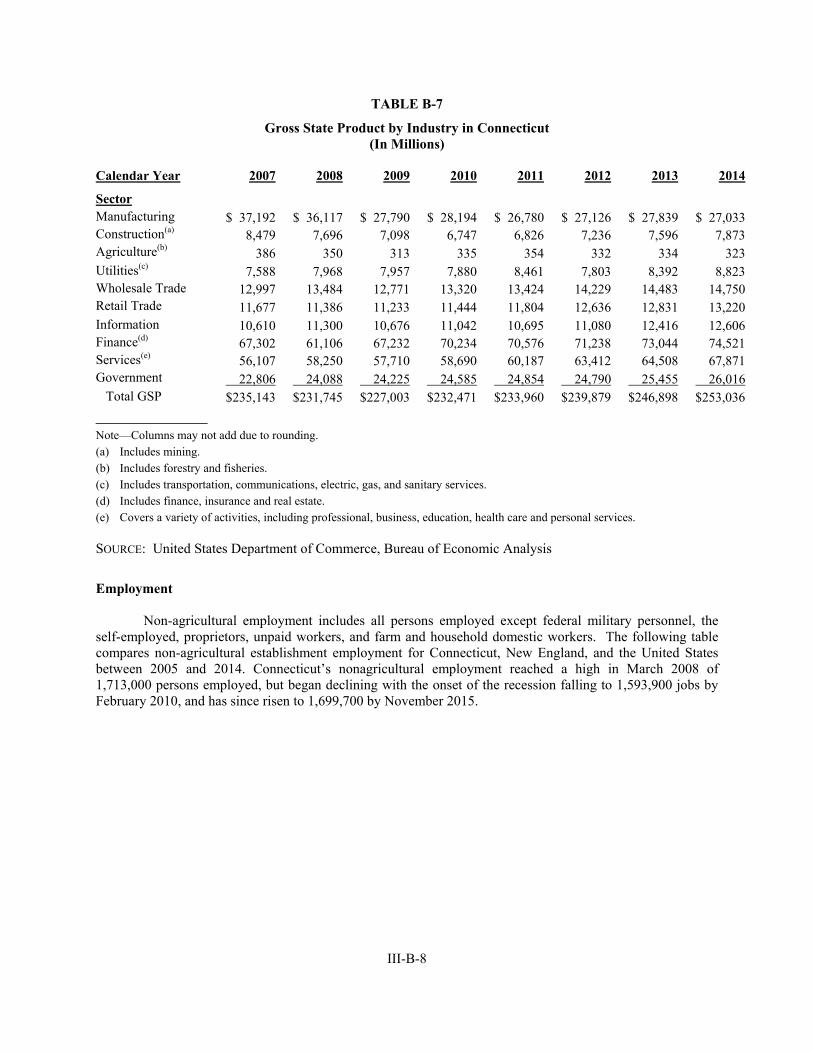
III-B-8
TABLE B-7
Gross State Product by Industry in Connecticut (In Millions)
Calendar Year 2007 2008 2009 2010 2011 2012 2013 2014
Sector Manufacturing $ 37,192 $ 36,117 $ 27,790 $ 28,194 $ 26,780 $ 27,126 $ 27,839 $ 27,033Construction(a) 8,479 7,696 7,098 6,747 6,826 7,236 7,596 7,873Agriculture(b) 386 350 313 335 354 332 334 323Utilities(c) 7,588 7,968 7,957 7,880 8,461 7,803 8,392 8,823Wholesale Trade 12,997 13,484 12,771 13,320 13,424 14,229 14,483 14,750Retail Trade 11,677 11,386 11,233 11,444 11,804 12,636 12,831 13,220Information 10,610 11,300 10,676 11,042 10,695 11,080 12,416 12,606Finance(d) 67,302 61,106 67,232 70,234 70,576 71,238 73,044 74,521Services(e) 56,107 58,250 57,710 58,690 60,187 63,412 64,508 67,871Government 22,806 24,088 24,225 24,585 24,854 24,790 25,455 26,016 Total GSP $235,143 $231,745 $227,003 $232,471 $233,960 $239,879 $246,898 $253,036
______________ Note—Columns may not add due to rounding. (a) Includes mining. (b) Includes forestry and fisheries. (c) Includes transportation, communications, electric, gas, and sanitary services. (d) Includes finance, insurance and real estate. (e) Covers a variety of activities, including professional, business, education, health care and personal services.
SOURCE: United States Department of Commerce, Bureau of Economic Analysis
Employment
Non-agricultural employment includes all persons employed except federal military personnel, the self-employed, proprietors, unpaid workers, and farm and household domestic workers. The following table compares non-agricultural establishment employment for Connecticut, New England, and the United States between 2005 and 2014. Connecticut’s nonagricultural employment reached a high in March 2008 of 1,713,000 persons employed, but began declining with the onset of the recession falling to 1,593,900 jobs by February 2010, and has since risen to 1,699,700 by November 2015.

III-B-9
TABLE B-8
Non-agricultural Employment(a)(b) (In Thousands)
Connecticut New England United States Calendar
Year Employment
Percent Growth
Employment
Percent Growth
Employment
Percent Growth
2005 1,662.4 0.8% 6,933.1 0.7% 133,996.4 1.7% 2006 1,681.0 1.1 7,001.8 1.0 136,403.3 1.8 2007 1,698.4 1.0 7,064.4 0.9 137,934.8 1.1 2008 1,699.0 0.0 7,065.5 0.0 137,169.3 (0.6) 2009 1,626.2 (4.3) 6,811.0 (3.6) 131,220.4 (4.3) 2010 1,607.9 (1.1) 6,796.0 (0.2) 130,268.6 (0.7) 2011 1,625.3 1.1 6,859.7 0.9 131,843.2 1.2 2012 1,640.8 0.9 6,945.5 1.3 134,098.3 1.7 2013 1,653.7 0.8 7,033.0 1.3 136,393.8 1.7 2014 1,665.7 0.7 7,119.7 1.2 139,023.3 1.9
_________________ (a) Non-agricultural employment excludes agricultural workers, proprietors, self-employed individuals, domestic workers,
family workers and members of the armed forces. (b) In March 2009, the Connecticut Department of Labor revised and updated employment statistics back to 2004.
SOURCE: United States Department of Labor, Bureau of Labor Statistics
Composition of Employment. The following table shows the distribution of non-agricultural employment in Connecticut and the United States in 2014. The table shows that Connecticut has a larger share of employment in services, manufacturing, and finance than the nation as a whole.
TABLE B-9
Connecticut Non-agricultural Employment, Calendar Year 2014 (In Thousands)
Connecticut United States Total Percent Total Percent
Services(a) 750.6 45.1% 60,849.9 43.8%Trade(b) 301.3 18.1 26,376.1 19.0Manufacturing 159.6 9.6 12,188.2 8.8Government 237.9 14.3 21,856.9 15.7Finance(c) 128.6 7.7 7,978.0 5.7Information(d) 31.8 1.9 2,740.4 2.0Construction(e) 56.0 3.4 7,033.8 5.1Total(f) 1,665.7 100.0% 139,023.3 100.0%
______________ (a) Covers a considerable variety of activities, including professional, business, education, health care and personal services.
(b) Includes wholesale and retail trade, transportation, and utilities. (c) Includes finance, insurance, and real estate. (d) Includes publishing, broadcasting, telecommunications, internet providers, and data processing. (e) Includes natural resources and mining. (f) Totals may not equal sum of individual categories due to rounding and seasonal statistical data adjustments.
SOURCE: United States Department of Labor, Bureau of Labor Statistics

III-B-10
Recent trends in the State’s non-agricultural employment are reflected in the following table. Throughout the last five decades, while manufacturing employment in Connecticut has been steadily declining, employment in the services industries has surged. In calendar year 2014, approximately 90.4% of the State’s workforce was employed in non-manufacturing jobs, up from roughly 50% in the early 1950s.
TABLE B-10
Connecticut Non-agricultural Employment (Annual Averages In Thousands)
Calendar
Year
Manufacturing
Trade(a)
Services(b)
Government
Finance(c)
Information(d)
Construction(e)
Total Non- agricultural
Employment(f)
2005 194.8 310.6 666.0 243.8 142.3 38.1 66.7 1,662.4 2006 193.1 311.0 680.8 246.0 144.3 37.9 68.0 1,681.0 2007 190.2 311.8 694.7 249.3 144.6 38.4 69.4 1,698.4 2008 186.6 310.0 702.7 252.5 143.4 37.8 66.1 1,699.0 2009 170.6 293.3 687.0 248.2 137.6 34.3 55.2 1,626.2 2010 164.9 289.8 691.7 244.0 135.2 31.7 50.6 1,607.9 2011 165.6 292.9 708.0 240.4 135.0 31.4 52.1 1,625.3 2012 164.1 295.8 725.3 238.9 133.2 31.3 52.2 1,640.8 2013 162.6 298.4 737.4 238.2 130.7 32.0 54.3 1,653.7 2014 159.6 301.3 750.6 237.9 128.6 31.8 56.0 1,665.7
______________ (a) Includes wholesale and retail trade, transportation, and utilities. (b) Covers a considerable variety of activities, including professional, business, education, health care and personal services. (c) Includes finance, insurance, and real estate.
(d) Includes publishing, broadcasting, telecommunications, internet providers, and data processing. (e) Includes natural resources and mining. (f) Totals may not equal sum of individual categories due to rounding and seasonal statistical adjustments.
SOURCE: United States Department of Labor, Bureau of Labor Statistics, Connecticut Labor Department
Manufacturing
The manufacturing industry, despite its continuing downward employment trend over the past five decades, has traditionally served as an economic base industry and has been of prime economic importance to Connecticut. Based on the level of personal income derived from this sector, Connecticut ranked 20th in the nation for its dependency on manufacturing wages in Fiscal Year 2015. The following table provides a ten-year historical picture of manufacturing employment in Connecticut, the New England region and the United States. This downward movement in manufacturing employment levels is also reflected in the New England region and the nation. The transformation in the State’s manufacturing base confirms that the State’s employment share in the manufacturing sector is converging to the national average. In calendar year 2014 approximately 9.6% of the State’s workforce, versus 8.8% for the nation, was employed in the manufacturing sector, down from roughly 50% in the early 1950s.

III-B-11
TABLE B-11
Manufacturing Employment (In Thousands)
Connecticut New England United States Calendar
Year Number
Percent Growth
Number
Percent Growth
Number
Percent Growth
2005 194.8 (1.1)% 733.5 (1.8)% 14,225.7 (0.6)% 2006 193.1 (0.9) 720.2 (1.8) 14,156.5 (0.5) 2007 190.2 (1.5) 708.8 (1.6) 13,877.8 (2.0) 2008 186.6 (1.9) 690.6 (2.6) 13,403.4 (3.4) 2009 170.6 (8.6) 622.9 (9.8) 11,847.8 (11.6) 2010 164.9 (3.3) 605.4 (2.8) 11,528.7 (2.7) 2011 165.6 0.4 606.6 0.2 11,725.4 1.7 2012 164.1 (0.9) 604.5 (0.3) 11,925.8 1.7 2013 162.6 (0.9) 601.7 (0.5) 12,018.3 0.8 2014 159.6 (1.8) 598.4 (0.5) 12,188.2 1.4
______________
SOURCE: United States Department of Labor, Bureau of Labor Statistics, Connecticut State Labor Department
Connecticut has a diverse manufacturing sector, with the construction of transportation equipment (primarily aircraft engines and submarines) being the dominant industry. The State is also a leading producer of military and civilian helicopters. Employment in the transportation equipment sector is followed by fabricated metals, machinery, and computer and electronics for the total number employed in 2014.
TABLE B-12
Manufacturing Employment By Industry
(In Thousands)
Calendar
Year
Transportation
Equipment
Fabricated
Metals
Computer & Electronics
Machinery
Other(a)
Total Manufacturing Employment (b)
2005 43.5 33.7 15.0 18.1 84.5 194.8 2006 43.6 33.8 14.4 18.1 83.2 193.1 2007 43.6 33.4 14.1 18.2 81.0 190.2 2008 44.3 33.1 14.2 17.7 77.2 186.6 2009 43.1 29.4 13.4 16.0 68.6 170.6 2010 42.2 28.1 13.3 15.0 66.3 164.9 2011 42.2 28.6 13.4 14.8 66.6 165.6 2012 42.0 29.3 13.0 14.5 65.3 164.1 2013 41.4 30.0 12.8 14.1 64.2 162.6 2014 40.1 29.8 12.5 13.9 63.2 159.6
______________ (a) Includes other industries such as wood products, furniture, glass/stone, primary metals, and instruments in the durable
sector, as well as all industries such as chemicals, paper, and plastics in the nondurable sector. (b) Totals may not equal sum of individual categories due to rounding and seasonal statistical adjustments.
SOURCE: United States Department of Labor, Bureau of Labor Statistics
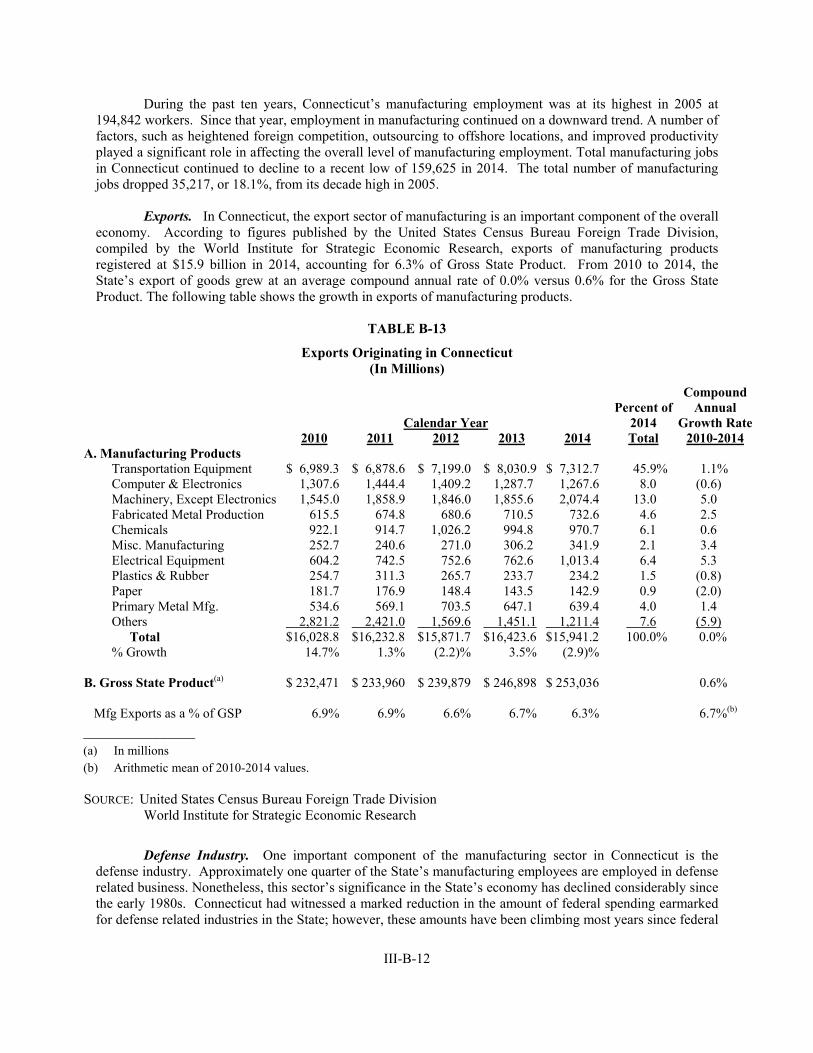
III-B-12
During the past ten years, Connecticut’s manufacturing employment was at its highest in 2005 at 194,842 workers. Since that year, employment in manufacturing continued on a downward trend. A number of factors, such as heightened foreign competition, outsourcing to offshore locations, and improved productivity played a significant role in affecting the overall level of manufacturing employment. Total manufacturing jobs in Connecticut continued to decline to a recent low of 159,625 in 2014. The total number of manufacturing jobs dropped 35,217, or 18.1%, from its decade high in 2005.
Exports. In Connecticut, the export sector of manufacturing is an important component of the overall economy. According to figures published by the United States Census Bureau Foreign Trade Division, compiled by the World Institute for Strategic Economic Research, exports of manufacturing products registered at $15.9 billion in 2014, accounting for 6.3% of Gross State Product. From 2010 to 2014, the State’s export of goods grew at an average compound annual rate of 0.0% versus 0.6% for the Gross State Product. The following table shows the growth in exports of manufacturing products.
TABLE B-13
Exports Originating in Connecticut (In Millions)
Calendar Year
Percent of
2014
Compound Annual
Growth Rate2010 2011 2012 2013 2014 Total 2010-2014
A. Manufacturing Products Transportation Equipment $ 6,989.3 $ 6,878.6 $ 7,199.0 $ 8,030.9 $ 7,312.7 45.9% 1.1% Computer & Electronics 1,307.6 1,444.4 1,409.2 1,287.7 1,267.6 8.0 (0.6) Machinery, Except Electronics 1,545.0 1,858.9 1,846.0 1,855.6 2,074.4 13.0 5.0 Fabricated Metal Production 615.5 674.8 680.6 710.5 732.6 4.6 2.5 Chemicals 922.1 914.7 1,026.2 994.8 970.7 6.1 0.6 Misc. Manufacturing 252.7 240.6 271.0 306.2 341.9 2.1 3.4 Electrical Equipment 604.2 742.5 752.6 762.6 1,013.4 6.4 5.3 Plastics & Rubber 254.7 311.3 265.7 233.7 234.2 1.5 (0.8) Paper 181.7 176.9 148.4 143.5 142.9 0.9 (2.0) Primary Metal Mfg. 534.6 569.1 703.5 647.1 639.4 4.0 1.4 Others 2,821.2 2,421.0 1,569.6 1,451.1 1,211.4 7.6 (5.9) Total $16,028.8 $16,232.8 $15,871.7 $16,423.6 $15,941.2 100.0% 0.0% % Growth 14.7% 1.3% (2.2)% 3.5% (2.9)% B. Gross State Product(a) $ 232,471 $ 233,960 $ 239,879 $ 246,898 $ 253,036 0.6% Mfg Exports as a % of GSP 6.9% 6.9% 6.6% 6.7% 6.3% 6.7%(b) ______________ (a) In millions (b) Arithmetic mean of 2010-2014 values.
SOURCE: United States Census Bureau Foreign Trade Division World Institute for Strategic Economic Research
Defense Industry. One important component of the manufacturing sector in Connecticut is the defense industry. Approximately one quarter of the State’s manufacturing employees are employed in defense related business. Nonetheless, this sector’s significance in the State’s economy has declined considerably since the early 1980s. Connecticut had witnessed a marked reduction in the amount of federal spending earmarked for defense related industries in the State; however, these amounts have been climbing most years since federal
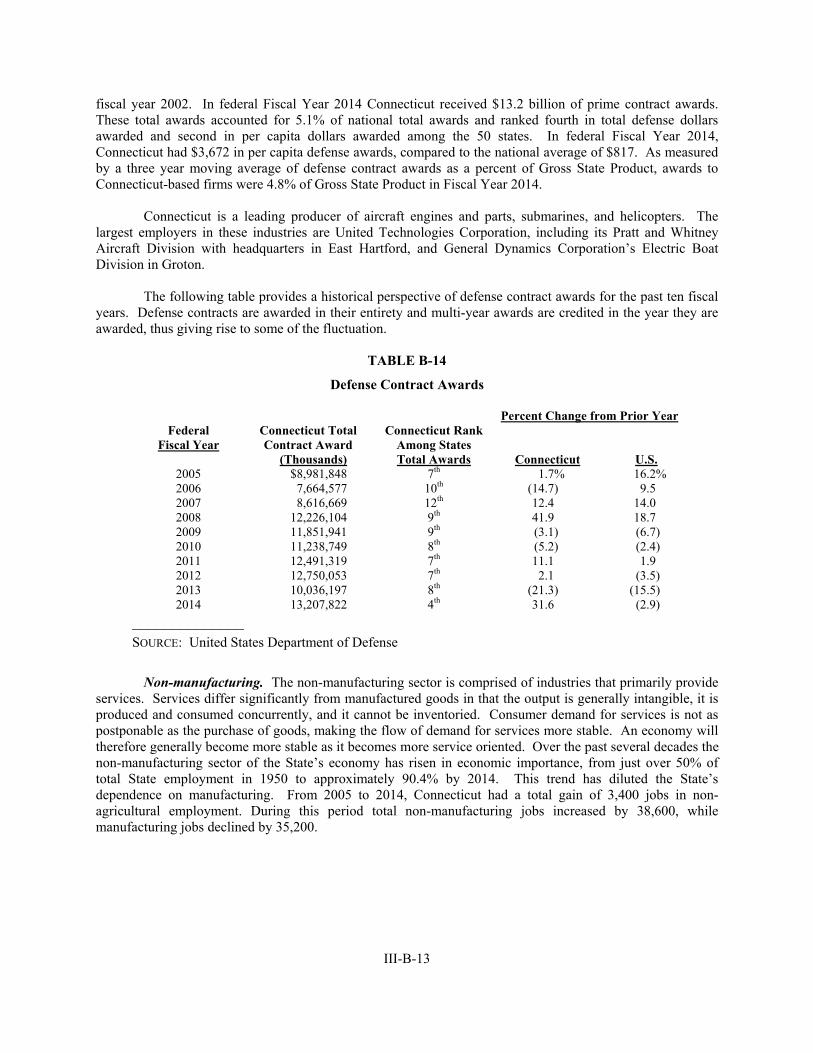
III-B-13
fiscal year 2002. In federal Fiscal Year 2014 Connecticut received $13.2 billion of prime contract awards. These total awards accounted for 5.1% of national total awards and ranked fourth in total defense dollars awarded and second in per capita dollars awarded among the 50 states. In federal Fiscal Year 2014, Connecticut had $3,672 in per capita defense awards, compared to the national average of $817. As measured by a three year moving average of defense contract awards as a percent of Gross State Product, awards to Connecticut-based firms were 4.8% of Gross State Product in Fiscal Year 2014.
Connecticut is a leading producer of aircraft engines and parts, submarines, and helicopters. The largest employers in these industries are United Technologies Corporation, including its Pratt and Whitney Aircraft Division with headquarters in East Hartford, and General Dynamics Corporation’s Electric Boat Division in Groton.
The following table provides a historical perspective of defense contract awards for the past ten fiscal years. Defense contracts are awarded in their entirety and multi-year awards are credited in the year they are awarded, thus giving rise to some of the fluctuation.
TABLE B-14
Defense Contract Awards
Percent Change from Prior YearFederal
Fiscal Year Connecticut Total Contract Award
(Thousands)
Connecticut Rank Among States Total Awards
Connecticut
U.S.2005 $8,981,848 7th 1.7% 16.2% 2006 7,664,577 10th (14.7) 9.5 2007 8,616,669 12th 12.4 14.0 2008 12,226,104 9th 41.9 18.7 2009 11,851,941 9th (3.1) (6.7) 2010 11,238,749 8th (5.2) (2.4) 2011 12,491,319 7th 11.1 1.9 2012 12,750,053 7th 2.1 (3.5) 2013 10,036,197 8th (21.3) (15.5) 2014 13,207,822 4th 31.6 (2.9)
______________ SOURCE: United States Department of Defense
Non-manufacturing. The non-manufacturing sector is comprised of industries that primarily provide services. Services differ significantly from manufactured goods in that the output is generally intangible, it is produced and consumed concurrently, and it cannot be inventoried. Consumer demand for services is not as postponable as the purchase of goods, making the flow of demand for services more stable. An economy will therefore generally become more stable as it becomes more service oriented. Over the past several decades the non-manufacturing sector of the State’s economy has risen in economic importance, from just over 50% of total State employment in 1950 to approximately 90.4% by 2014. This trend has diluted the State’s dependence on manufacturing. From 2005 to 2014, Connecticut had a total gain of 3,400 jobs in non-agricultural employment. During this period total non-manufacturing jobs increased by 38,600, while manufacturing jobs declined by 35,200.
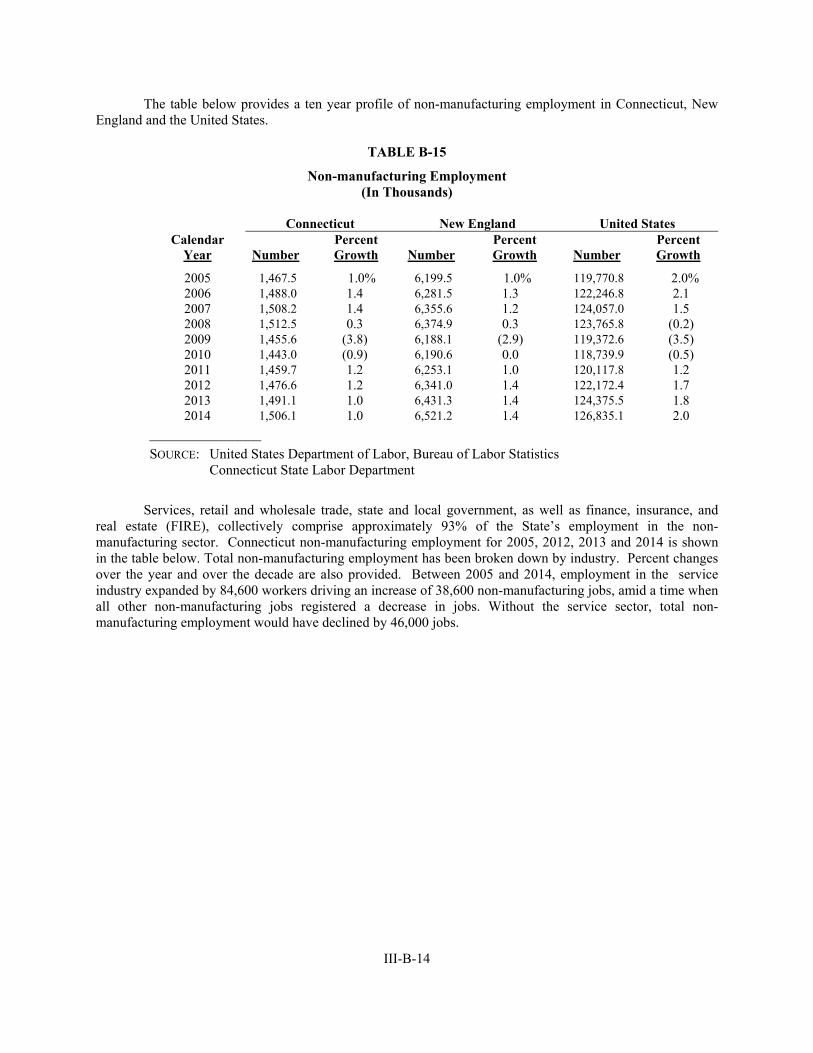
III-B-14
The table below provides a ten year profile of non-manufacturing employment in Connecticut, New England and the United States.
TABLE B-15
Non-manufacturing Employment (In Thousands)
Connecticut New England United States Calendar
Year
Number Percent Growth
Number
Percent Growth
Number
Percent Growth
2005 1,467.5 1.0% 6,199.5 1.0% 119,770.8 2.0% 2006 1,488.0 1.4 6,281.5 1.3 122,246.8 2.1 2007 1,508.2 1.4 6,355.6 1.2 124,057.0 1.5 2008 1,512.5 0.3 6,374.9 0.3 123,765.8 (0.2) 2009 1,455.6 (3.8) 6,188.1 (2.9) 119,372.6 (3.5) 2010 1,443.0 (0.9) 6,190.6 0.0 118,739.9 (0.5) 2011 1,459.7 1.2 6,253.1 1.0 120,117.8 1.2 2012 1,476.6 1.2 6,341.0 1.4 122,172.4 1.7 2013 1,491.1 1.0 6,431.3 1.4 124,375.5 1.8 2014 1,506.1 1.0 6,521.2 1.4 126,835.1 2.0
______________
SOURCE: United States Department of Labor, Bureau of Labor Statistics Connecticut State Labor Department
Services, retail and wholesale trade, state and local government, as well as finance, insurance, and real estate (FIRE), collectively comprise approximately 93% of the State’s employment in the non-manufacturing sector. Connecticut non-manufacturing employment for 2005, 2012, 2013 and 2014 is shown in the table below. Total non-manufacturing employment has been broken down by industry. Percent changes over the year and over the decade are also provided. Between 2005 and 2014, employment in the service industry expanded by 84,600 workers driving an increase of 38,600 non-manufacturing jobs, amid a time when all other non-manufacturing jobs registered a decrease in jobs. Without the service sector, total non-manufacturing employment would have declined by 46,000 jobs.

III-B-15
TABLE B-16
Connecticut Non-manufacturing Employment By Industry (In Thousands)
Industry
Calendar Year 2005
Calendar Year 2012
Calendar Year 2013
Calendar Year 2014
Percent Change 2013-14
Percent Change 2005-14
Construction(a) 66.7 52.2 54.3 56.0 3.1% (16.0)% Information(b) 38.1 31.3 32.0 31.8 (0.6) (16.5) Trade(c) 310.6 295.8 298.4 301.3 0.9 (3.0) Finance, Insurance & Real Estate 142.3 133.2 130.7 128.6 (1.6) (9.6) Services(d) 666.0 725.3 737.4 750.6 1.8 12.7 Federal Government 19.8 17.6 17.3 17.4 0.6 (12.2) State and Local Government 224.0 221.2 220.9 220.4 (0.2) (1.6) Total Non-manufacturing Employment(d)
1,467.5
1,476.7
1,491.1
1,506.1
1.0%
2.6%
______________ (a) Includes natural resources and mining. (b) Covers a considerable variety of activities, including professional, business, education, health care and personal
services. (c) Includes wholesale & retail trade, transportation, and utilities. (d) Totals may not agree with detail due to rounding and seasonal statistical data adjustments.
SOURCE: Connecticut State Labor Department
Retail Trade. Personal spending on goods and services generally accounts for over two-thirds of the Gross Domestic Product. Approximately half of personal spending is generally done through retail stores. At the State level, retail trade therefore constitutes approximately one third of the State’s economic activity, measured by Gross State Product. During the last decade, variations in retail trade closely matched variations in Gross State Product growth, making retail trade an important barometer of economic health.
The following table shows the major group in each North American Industry Classification System (NAICS) code as well as the State’s retail trade history for the past five fiscal years. Connecticut retail trade in Fiscal Year 2015 totaled $54.8 billion, an increase of 1.1% from Fiscal Year 2014. Sales in the durable goods category, which were severely impacted during the recession, registered three consecutive yearly declines before beginning to recover in Fiscal Year 2011 and accelerating further through Fiscal Year 2015. Durable goods are mostly big ticket items such as appliances, furnishings, and automobiles.

III-B-16
TABLE B-17
Retail Trade In Connecticut(a)
(In Millions)
NAICS
Fiscal Year 2011
Percent
of Fiscal Year 2011 Total
Fiscal Year 2012
Percent
of Fiscal Year 2012 Total
Fiscal Year 2013
Percent
of Fiscal Year 2013 Total
Fiscal Year 2014
Percent
of Fiscal Year 2014 Total
Fiscal Year 2015
Percent
of Fiscal Year 2015 Total
CompoundAnnual Growth
Rate 2011-2015
441 Motor Vehicle and Parts Dealers $ 7,610 15.4% $ 7,996 15.0% $ 8,393 16.0% $9,099 16.8% $ 9,585 17.5% 5.9%
442 Furniture and Home Furnishings Stores 1,221 2.5 1,182 2.2 1,205 2.3 1,253 2.3 1,306 2.4 1.6
443 Electronics and Appliance Stores 1,582 3.2 1,748 3.3 1,620 3.1 1,641 3.0 1,653 3.0 0.3
444 Building Material and Garden Supply Stores 2,845 5.8 3,023 5.7 3,028 5.8 3,161 5.8 2,828 5.2 (1.0)
445 Food and Beverage Stores(b) 10,222 20.7 10,799 20.3 11,102 21.2 11,184 20.6 10,743 19.6 (0.4)
446 Health and Personal Care Stores 5,066 10.2 4,667 8.8 4,413 8.4 4,715 8.7 4,848 8.8 1.0
447 Gasoline Stations 3,426 6.9 3,788 7.1 3,790 7.2 3,774 7.0 3,330 6.1 (1.3)
448 Clothing and Clothing Accessories Stores 2,739 5.5 2,827 5.3 2,920 5.6 2,946 5.4 2,993 5.5 0.2
451 Sporting Goods, Hobby, Book and Music Stores 1,013 2.0 979 1.8 1,071 2.0 1,055 1.9 1,055 1.9 (0.1)
452 General Merchandise Stores 5,275 10.7 5,376 10.1 5,439 10.4 5,381 9.9 5,509 10.1 0.1
453 Miscellaneous Store Retailers 4,757 9.6 5,016 9.4 5,163 9.8 5,053 9.3 5,740 10.5 0.8
454 Nonstore Retailers 3,677 7.4 5,809 10.9 4,343 8.3 4,956 9.1 5,208 9.5 1.2 Total(a) $49,433 100.0% $53,209 100.0% $52,485 100.0% $54,217 100.0% $54,796 100.0% 0.3% Durables (NAICS 441, 442, 443, 444) $13,258 26.8% $13,949 26.2% $14,244 27.1% $15,154 28.0% $15,372 28.1% 0.5% Non Durables (all other NAICS) $36,175 73.2% $39,260 73.8% $38,241 72.9% $39,063 72.0% $39,424 71.9% 0.2%
______________ (a) Totals may not agree with detail due to rounding.
SOURCE: Connecticut Department of Revenue Services
Unemployment Rates. The unemployment rate is the proportion of persons in the civilian labor force who do not have jobs but are actively looking for work. Unemployment rates tend to be high during economic slowdowns and low when the economy is expanding. The rate is widely utilized as a proxy for consumer confidence. In general, when the unemployment rate is high consumer spending is lower and vice versa.
After enjoying an extraordinary boom during the late 1990s, Connecticut, as well as the rest of the Northeast and the Nation, experienced an economic slowdown during the recession of the early 2000s. The unemployment rate in the State reached its low of 2.4% in 2000, compared to New England’s average of 2.8% and the national average of 4.0%. After climbing to 5.4% in 2003, Connecticut’s unemployment rate declined to 4.3% by 2006, but climbed during the most recent recession to 9.1% in 2010. During the subsequent weak economic recovery, Connecticut’s average unemployment rate fell to 5.7% in 2015 (on a preliminary basis)

III-B-17
compared to the New England average of 4.9% (preliminary) and the national average of 5.3% for the same period.
The following table compares the unemployment rate averages of Connecticut, New England, and the United States for the calendar years 2006 through 2015.
TABLE B-18
Unemployment Rate
Unemployment Rate Calendar
Year
Connecticut
New England
United States
2006 4.3% 4.5% 4.6% 2007 4.5 4.5 4.6 2008 5.7 5.6 5.8 2009 8.1 8.2 9.3 2010 9.1 8.3 9.6 2011 8.8 7.7 8.9 2012 8.3 7.2 8.1 2013 7.6 6.8 7.4 2014 6.6 5.8 6.2 2015(a) 5.7 4.9 5.3
______________
(a) On a preliminary basis. No assurances can be provided that such rates will not change.
SOURCE: Connecticut State Labor Department Federal Reserve Bank of Boston United States Department of Labor, Bureau of Labor Statistics

[INTENTIONALLY LEFT BLANK]

APPENDIX III-C
State Comptrollerns Letter
Independent Auditor's Report
Management's Discussion and Analysis (MDA)
Basic Financial Statements
Statement of Net Position
Statement of ActivitiesBalance Sheet - Governmental Funds
Reconciliation of Governmental Funds Balance Sheet to Statement of Net Position
Statement ofRevenues, Expenditures, and Changes in Fund Balance - Governmental Funds
Reconciliation of the Statement of Revenues, Expenditures, and Changes in Fund Balances ofGovernmental Funds to the Statement of Activities
Statement of Net Position - Proprietary Funds
Statement of Revenues, Expenses, and Changes in Fund Net Position - Proprietary Funds
Statement of Cash Flows - Proprietary Funds
Statement of Fiduciary Net Position -Fiduciary Funds
Statement of Changes in Fiduciary Net Position - Fiduciary Funds
Statement of Net Position - Component Units
Statement of Activities - Component Units
Notes to the Financial Statements
Required PERS Supplementary Information
tIr-c-2
III-C-3
III.C.7
III-C-19III-C-21It-c-22ilI-C-26|t-c-27ItI-C-28
ill-c-29IIt-C-32III-C-34III-C-36III-C-40III-C-4IIII-C-45ilt-c-46ilt-c-49
IIt-C-81
m-c-l

Kevin LemboState Comptroller
STATE OF CONNECTICUTOFFICE OF THE STATE COMPTROLLER
55 ELM STREET
HARTFORD, CONNECTICUT
06106-1775
Martha CarlsonDeputy Comptroller
January 29,2016
The Honorable Denise L. NappierState Treasurer55 Elm StreetHartford, CT 06106
Dear Ms. Nappier
I have reviewed the accompanying general purpose financial statements of the State ofConnecticut for the Fiscal Year ended June 30, 2015. The statements and the subsequentIndependent Auditors' Report are incorporated within the Comprehensive Annual Report of theState of Connecticut, which is prepared by my office using the guidance of generally acceptedaccounting principles.
Sincerely,
Kevin LemboState Comptroller
ïrr-c-2

STATE OF CONNECTICUT
AUDITORS OF PUBLIC ACCOUNTS
JOHN C. GERAGOSIAN
STATE CAPITOL
210 CAPITOL AVENUE
HARTFORD, CONNECTICUT 061 06.,1 559
ROBERT M. WARD
INDEPENDENT AUDITORS' REPORT
Governor Dannel P. MalloyMembers of the General Assembly
Report on the Financial StatementsWe have audited the accompanying financial statements of the governmental activities, the business-typeactivities, the aggregate discretely presented component units, each major fund, and the aggregate remainingfund information of the State of Connecticut as of and for the year ended June 30, 2015, and the related notes tothe financial statements, which collectively comprise the state's basic financial statements as listed in the tableofcontents.
Mønøgement's Responsíbílíty for the Fínancíal StstementsManagement is responsible for the preparation and fair presentation of these financial statements in accordancewith accounting principles generally accepted in the United States of America; this includes the design,implementation, and maintenance of internal control relevant to the preparation and fair presentation of financialstatements that are free from material misstatement, whether due to fraud or effor.
Audìtor's ResponsíbìlítyOur responsibility is to express opinions on these financial statements based on our audit. We did not audit
Government-wide Financial Statements¡ the financial statements of the Special Transportation Fund account within the Transportation Fund and
the Transportation Special Tax Obligations account within the Debt Service Fund, which in theaggregale, represent six percent of the assets, two percent of the net position and eight percent of therevenues of the Governmental Activities;
o the financial statements of the John Dempsey Hospital account within the University of Connecticut andHealth Center, the Connecticut State University System, Connecticut Community Colleges, ConnecticutAirport Authority, Bradley Intemational Airport Parking Facility, and the Federal accounts for the Clean'Water Fund and Drinking Water Fund, which in the aggregate, represent 58 percent of the assets, 32percent of the net position and,32 percent of the revenues of the Business Type Activities;
o the financial statements of the discretely presented component units;
Fund Financial Statementsr the financial statements of the Special Transportation Fund account, which represents 97 percent of the
assets and 96 percent ofthe revenues ofthe Transportation Fund;r the financial statements of the Transportation Special Tax Obligations account, which represents 100
percent ofthe assets and 100 percent ofthe revenues ofthe Debt Service Fund;o the financial statements of the John Dempsey Hospital account within the University of Connecticut and
Health Center, the Connecticut State University System, the Connecticut Community Colleges, BradleyIntemational Airport Parking Facility, and the federal accounts for the Clean Water Fund and DrinkingWater Fund, which in the aggregate, represent 58 percent of the assets, 32 percent of the net positionand32 percent of the revenues of the Enterprise Funds;
III-C-3
Those fìnancial statements were audited by other auditors whose reports thereon have been furnished to us, andour opinion, insofar as it relates to the amounts included for the aforementioned funds and accounts, is based onthe reports ofthe other auditors.
We conducted our audit in accordance with auditing standards generally accepted in the United States ofAmerica and the standards applicable to financial audits contained in Government Auditing Standards, issued bythe Comptroller General of the United States. Those standards require that we plan and perform the audit toobtain reasonable assurance about whether the financial statements are free from material misstatement. Inaddition, the financial statements of the Special Transportation Fund, Transportation Special Tax ObligationsFund, Drinking Water Fund, Clean Water Fund, Connecticut Airport Authority, Capital Region DevelopmentAuthority, Connecticut Lottery Corporation, Materials Innovation and Recycling Authority, Connecticut Healthand Educational Facilities Authority, Connecticut Health Insurance Exchange, Connecticut Housing FinanceAuthority, Connecticut Innovations Incorporated and the Connecticut Green Bank were audited by otherauditors in accordance with standards applicable to financial audits contained in Government AuditingStandards, issued by the Comptroller General of the United States. The audits of the financial statements of theBradley International Airport Parking Facility, John Dempsey Hospital, Connecticut State University System,Connecticut Community Colleges and the University of Connecticut Foundation and University of ConnecticutLaw School Foundation were not conducted in accordance with Government Auditing Standards.
An audit involves performing procedures to obtain audit evidence about the amounts and disclosures in thefinancial statements. The procedures selected depend on the auditor's judgment, including the assessment of therisks of material misstatement of the financial statements, whether due to fraud or error. In making those riskassessments, the auditor considers internal control relevant to the entity's preparation and fair presentation of thefinancial statements in order to design audit procedures that are appropriate in the circumstances, but not for thepurpose of expressing an opinion on the effectiveness of the entity's internal control. Accordingly, we expressno such opinion. An audit also includes evaluating the appropriateness of accounting policies used and thereasonableness of significant accounting estimates made by management, as well as evaluating the overallpresentation of the financial statements.
'We believe that the audit evidence we have obtained is sufficient and appropriate to provide a basis for our auditopinions.
OpíníonsIn our opinion, based upon our audit and the reports ofother auditors, the financial statements referred to abovepresent fairly, in all material respects, the respective financial position of the governmental activities, thebusiness-type activities, the aggregate discretely presented component units, each major fund, and the aggregateremaining fund information, for the State of Connecticut, as of June 30, 2015,and the respective budgetarycomparison for the General Fund and the Transportation Fund, and the respective changes in financial positionand where applicable, cash flows thereof for the year then ended in conformity with accounting principlesgenerally accepted in the United States of America.
Emphøsís of MalterAs discussed in Notes 23 and, 25 to the basic financial statements, in the 20i5 fiscal year the State ofConnecticut adopted Govemmental Accounting Standards Board (GASB) Statement No. 68, Accounting andFinqncial Reporting þr Pensions. This statement revises accounting and financial reporting for pensions bystate and local govemment employers. As a result of the implementation of GASB Statement No. 68 the Statereported a restatement for a change in accounting principle by a net reduction of its beginning net position forgovemmental funds totaling $25,552,318,000. The amounts reported for ending net position reflect the newlyrequired net pension assets, defened outflows of resources, net pension liabilities, and deferred inflows ofresources related to the State's participation in defined benefit retirement systems. Our opinions are notmodified in respect to this matter.
Other MsttersRequired Suppl ementøry Inþ rmatio nAccounting principles generally accepted in the United States of America require that the management'sdiscussion and analysis, the budgetary comparison schedules, the pension plans schedules and information andthe other post-employment benefits schedule, as listed in the accompanying table of contents be presented tosupplement the basic financial statements. Such information, although not a part of the basic financial
III-C-4
statements, is required by the Governmental Accounting Standards Board who considers it to be an essentialpart of financial reporting for placing the basic financial statements in an appropriate operational, economic, orhistorical context. We have applied certain limited procedures to the required supplementary information, inaccordance with auditing standards generally accepted in the United States of America, which consisted ofinquiries of management about the methods of preparing the information and comparing the information forconsistency with management's responses to our inquiries, the basic financial statements, and other knowledgewe obtained during the course of our audit of the basic financial statements. We do not express an opinion orprovide any assurance on the information because the limited procedures do not provide us with sufficientevidence to express an opinion or provide any assurance.
Supplementary and Other InþrmationOur audit was conducted for the purpose of forming opinions on the financial statements that collectivelycomprise the State of Connecticut's basic financial statements. The combining and individual nonmajor fundfinancial statements are presented for purposes of additional analysis and are not a required part of the basicfinancial statements.
The combining and individual nonmajor fund financial statements are the responsibility of management andwere derived from and relates directly to the underlying accounting and other records used to prepare thefinancial statements. The information has been subjected to the auditing procedures applied in the audit of thefinancial statements and certain additional procedures, including comparing and reconciling such informationdirectly to the underlying accounting and other records used to prepare the financial statements or to thefinancial statements themselves, and other additional procedures in accordance with auditing standards generallyaccepted in the United States of America. In our opinion, the combining and individual nonmajor fund financialstatements are fairly stated in all material respects in relation to the financial statements taken as a whole.
The introductory and statistical sections are presented for purposes ofadditional analysis and are not a requiredpart of the basic financial statements. Such information has not been subjected to the auditing proceduresapplied in the audit of the basic financial statements and, accordingly, we do not express an opinion or provideany assurance on them.
Other Reporting Required by Government Audítíng StsndardsIn accordance with Government Auditing Standards, we have also issued our report dated January 29,2016, onour consideration of the State of Connecticut's internal control over financial reporting and on our tests of itscompliance with certain provisions of laws, regulations, contracts and grant agreements and other matters. Thepurpose of that report is to describe the scope of our testing of internal control over financial reporting andcompliance and the results of that testing, and not to provide an opinion on the intemal control over financialreporting or on compliance. That report will be issued under separate cover in the Auditors' Report on InternalControl over Financial Reporting and on Compliance and Other Matters þr the Fiscal Year Ended June 30,2015, State of Connecticut Comprehensive Annual Financiql Report and is an integral part of an auditperformed in accordance with Government Auditing Standqrds and should be considered in assessing the resultsof our audit.
ßu>{fr /r""ÅJohn C. GeragosianAuditor of Public Accounts
January 29,2016State CapitolHartford, Connecticut
Robert M. WardAuditor of Public Accounts
m-c-5

Connecticut
THIS PAGE LEFT INTENTIONALLV BLANK
III-C-6

Connecticut
MANAGEMENT'S DISCUSSION AND ANALYSIS (MDA)
The following is a discussion and analysis of the State's financial performance and condition providing anoverview of the State's activities for the fiscal year ended June 30,2015. The information provided here should beread in conjunction with the letter of transmittal and in the basic financial statements.
FINANCIAL HIGHLIGHTS
Government-wide:The primary government's liabilities and deferred inflows of resources exceeded assets and deferred outflows ofresources by $38.1 billion (reported as net position deficit). Of this amount, $46.8 billion reported as unrestrictednet position deficit while $l 1.5 billion is restricted for specific uses or invested in capital assets.
Net position deficit of govemmental activities decreased by $2.1 billion and net position of business-typeactivities increased by $71 8.2 million. Component units reported an increase of $ I 1 L4 million from June 30,2014.
As a result of implementing GASB Statement 68, Accounting ønd Finqncial Reporting þr Pensions, the Staterecorded $2,360.8 billion deferred outflows of resources, $24,568.3 billion net pension liability, and $1,423.3billion deferred inflows of resources for the primary government. As explained in Note 22 útis was the primaryreason for a $25.6 billion adjustment to the beginning unrestricted net position in fiscal year 2015.
Fund:The governmental funds reported combined ending fund balance of $2.1 billion, an increase of $0.1 million incomparison with the prior year. Of this total fund balance, $190.5 million represents nonspendable fund balance,
$2.1 billion represents restricted fund balance, $585.5 million represents committed fund balance, and,5223million represents assigned fund balance. A negative $801.9 million unassigned fund balance offsets theseamounts. This deficit, which belongs primarily to the General Fund, increased by $66.9 million during the fiscalyear.
The State's stabilization account, the General Fund Budget Reserve Account (Rainy Day Fund) ended the fiscalyear with a balance of $406.0 million.
The Enterprise funds reported net position of $5.5 billion at year-end, an increase of $718.2 million during theyear, substantially all of which was invested in capital assets or restricted for specific purposes.
Long-Term Debt:Total long-term debt was $57.3 billion for govemmental activities at year-end, of which $22.4 billion was bondeddebt.
Total long-term debt was $2.1 billion for business-type activities at year-end, of which 51.6 billion was bondeddebt.
OVERVIEW OF THE FINA¡ICIAL STATEMENTS
This discussion and analysis is an introduction to the State's basic {inancial statements. The State's basic financialstatements comprise three components: l) government-wide financial statements, 2) fund financial statements,and 3) notes to the financial staternents. The report also contains other supplementary information to provideadditional support to the basic financial statements.
Government-wide Financial Statements:The government-wide financial statements are designed to provide readers with a broad overview of the State'sfinances, in a manner similar to a private-sector business. All revenues and expenses are recognized regardless ofwhen cash is received or spent, and all assets, deferred outflows ofresources, liabilities and deferred inflows of
ITI-C-7
Connectícut
resources, including capital assets and long-term debt, are reported at the entity level. The government-widestatements report the State's net position and changes in net position. Over time, increases and decreases in netposition measure whether the State's overall financial condition is getting better or worse. Non-financial factorssuch as the State's economic outlook, changes in its demographics, and the condition of capital assets andinfrastructure should also be considered when evaluating the State's overall condition.
The statement of net position presents information on all of the State's assets and deferred outflows of resources,and liabilities and deferred inflows of resources with the difference between all reported as net position. Netposition is displayed in three components - net investment in capital assets; restricted; and unrestricted.
The statement of activities presents information showing how the State's net position changed during fiscal year2015. All changes in net position are reported as soon as the underlying event giving rise to the change occurs,regardless of the timing of the related cash flows. Thus, revenues and expenses are reported in this statement forsome items that will result in cash flows in fufure fiscal periods (e.g., uncollected taxes and earned but unusedvacation leave).
Both the Statement of Net Position and Statement of Activities report three separate activities. These activitiesare described as follows:
Governmental Activities - The State's basic services fall under this activity including legislative,general govemment, regulation and protection, conservation and development, health and hospital,transportation, human services, education, corrections, and judicial. Taxes and intergovernmentalrevenues are major funding sources for these programs.
Business-type Activities - The State operates certain activities much like private-sector companies bycharging fees to cover all or most of the costs of providing goods and services. The major business-typeactivities of the State include the University of Connecticut and Health Center, State Universities,Connecticut Community Colleges, Employment Security Fund, and Clean Water Fund.
a
a
a Discretely Presented Component Units - A number of entities are legally separate from the State, yetthe State remains financially accountable for them. The major component units of the State areConnecticut Housing Finance Authority, Connecticut Lottery Corporation, and Connecticut AirportAuthority.
Fund Financial Statements:
A fund is a grouping of related accounts that is used to maintain control over resources that have been segregatedfor specific activities or objectives. The State uses fund accounting to ensure and demonstrate compliance withfinance-related legal requirements. All of the funds of the State can be divided into three categories: govemmentalfunds, proprietary funds, and fiduciary funds. Each of these categories uses different accounting approaches.Fund financial statements begin on page 36.
Governmental Funds - Most of the State's basic services are accounted for in govemmental funds andare essentially the same functions reported as goveffimental activities in the government-wide financialstatements. Governmental funds use the modified accrual basis of accounting, which measures the flow ofcurrent financial resources that can be converted to cash and the balances left at year-end that areavailable for future spending. This short-term view of the State's financial position helps determinewhether the State has sufficient resources to cover expenditures for its basic services in the near future.
Because the focus of govemmental funds is narrower than that of the government-wide financialstatements, it is useful to compare the information presented for governmental funds with similarinformation presented for govemmental activities in the government-wide financial statements. By doingso, readers may better understand the long-term impact of the State's near-term financing decisions. Boththe governmental fund balance sheet and the governmental fund statement of revenues, expenditures, andchanges in fund balance provide a reconciliation to facilitate the comparison between govemmental funds
a
III-C-8

a
and governmental activities. These reconciliations are presented on the page immediately following eachgovernmental fund financial statement.
The State reports five individual governmental funds. Information is presented separately in thegovernmental fund statements for the General Fund, Debt Service Fund, Transportation Fund, Restricted
Grants and Accounts Fund, and Grants and Loan Programs Fund, all of which are considered majorfunds. Data from the other eighteen governmental funds is combined into a single, aggregatedpresentation. Individual fund data for each of these nonmajor governmental funds is provided in thecombining statements immediately following the required supplementary information.
Proprietary Funds - Proprietary funds include enterprise funds and intemal service funds and accountfor activities that operate more like private-sector businesses and use the full accrual basis of accounting.Enterprise funds charge fees for services provided to outside customers. Enterprise funds are reported as
business-type activities on the government-wide financial statements. Internal Service funds are anaccounting device used to accumulate and allocate costs intemally among the State's various functions.The State uses Internal Service funds to account for correction industries, information technology, andadministrative services. Because these services predominately benefit governmental rather than business-type functions, they have been included within govemmental activities in the government-wide financialstatements.
The State reports five individual proprietary funds. Information is presented separately in the proprietaryfund statements for the University of Connecticut and Health Center, State Universities, ConnecticutCommunity Colleges, Employment Security, and Clean Water all of which are considered major funds.Data from the other enterprise funds is combined into a single, aggregated presentation. Individual funddata for all nonmajor proprietary funds is provided in the combining statements immediately followingthe required supplementary information.
a FÍduciary Funds - Fiduciary funds account for resources held by the State in a trustee or agency capacityfor others. Fiduciary funds are not included in the government-wide financial statements because theresources of those funds are not available to support the State's own programs. The accounting used forfiduciary funds is much like that used for proprietary funds. The State's fiduciary activities are reportedin separate Statements of Fiduciary Net Position and Changes in Fiduciary Net Position.
a Component Units - The government-wide financial statements report information for all componentunits into a single, aggregated presentation. lnformation is provided separately in the component unitfund statements for the Connecticut Housing Finance Authority, Connecticut Lottery, and ConnecticutAirport Authority. Data from the other component units is combined into a single, aggregatedpresentation. Individual fund data for all other nonmajor component units is provided in the combiningstatements immediately following the required supplementary information.
Notes to the Financial Statements
The notes to the financial statements provide additional information that is essential to a full understanding of thedata provided in the govemment-wide and fund financial statements. The notes to the financial statements can befound immediately following the component unit fund financial statements.
Required Supplementary Information (RSI)
Following the basic financial statements are budgetary comparison schedules for major and nonmajor funds withlegally adopted budgets. ln addition, within the RSI there is a reconciliation schedule for budgetary vs. GAAPbasis of accounting. The RSI also includes information regarding the State's funding progress and employercontributions for pension and other postemployment benefits, and change in employers' net pension liability.
III-C-9
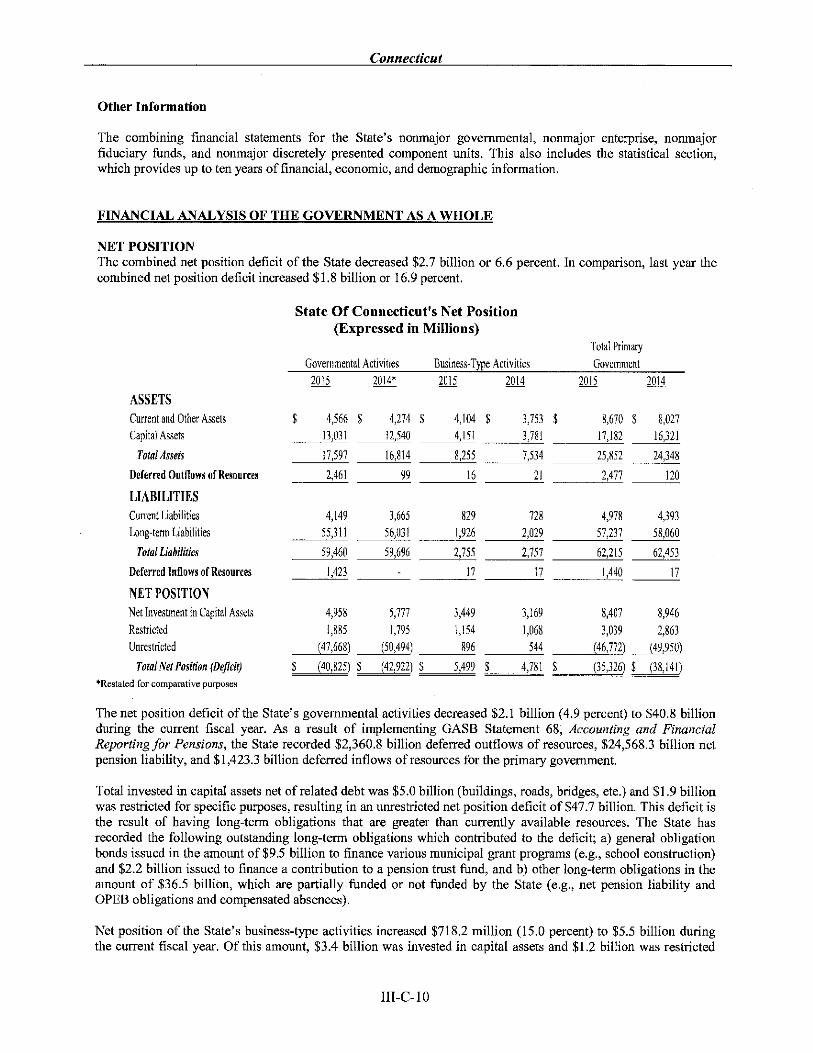
Other Information
The combining financial statements for the State's nonmajor governmental, nonmajor enterprise, nonmajorfiduciary funds, and nonmajor discretely presented component units. This also includes the statistical section,which provides up to ten years of financial, economic, and demographic information.
FINANCIAL ANALYSIS OF THE GOVERNMENT AS A WHOLE
NET POSITIONThe combined net position deficit of the State decreased $2.7 billion or 6.6 percent. In comparison, last year thecombined net position deficit increased $1.8 billion or 16.9 percent.
State Of Connecticutrs Net Position(Expressed in Millions)
Total Primary
Govemment
2015 2014* 2015 2014 2015 2014
ASSETS
Cunent and Other Assets
Capital Assets
Total Assets
Deferred Outfl ows of Resources
TIABITITIES
Cunent Liabilities
Long{erm Liabilities
Totul Linhilities
Deferred Inflows of Resources
NET POSITION
Net Investment in Capital Asets
Re$ricted
Unrestricted
T otal N et P osition (D eficþ*Restated for comparative purposes
13,031 12,540 4,151 781 l7 t82 16,321
17,597 16,814 8,255 7,534 24,349
461 99 16 2l t20
IT
(47,668) (50,494) 896
$ 4,566 $ 4,274 $ 4,104 $ 3,753 $ 8,670 S 8,027
Govemmental Activities Activities
4,149 3,665 829 728
55,31 I 56,031 1,926
25,952
2,477
4,979
51,237
4,393
58,060
62,453
n
59,460 59,696
1,423
2,757 62,215
11 1,440
755
4,958 5,771 3,449 3,169
1,885 1,795 |,154 1,069
544
$ (40,82Ð S (42,922) $ 5,499 $ 4,781
8,407 8,946
3,039 2,863
(46,772\
s (35,326)
(49,950)
$ (38,141)
The net position deficit of the State's governmental activities decreased $2.1 billion (4.9 percent) to $40.8 billionduring the current fiscal year. As a result of implementing GASB Statement 68, Accounting and FinqncialReporting þr Pensions, the State recorded $2,360.8 billion deferred outflows of resources, ß24,5683 billion netpension liability, andSl,423.3 billion deferred inflows of resources for the primary government.
Total invested in capital assets net of related debt was $5.0 billion (buildings, roads, bridges, etc.) and $1.9 billionwas restricted for specific pulposes, resulting in an unrestricted net position deficit of 547 .7 billion. This deficit isthe result of having long-term obligations lhal are greater than currently available resources. The State hasrecorded the following outstanding long-term obligations which contributed to the deficit; a) general obligationbonds issued in the amount of $9.5 billion to finance various municipal grant programs (e.g., school construction)and$2.2 billion issued to finance a contribution to a pension trust fund, and b) other long-term obligations in theamount of $36.5 billion, which are partially funded or not funded by the State (e.g., net pension liability andOPEB obligations and compensated absences).
Net position of the State's business-type activities increased $718.2 million (15.0 percenÐ to $5.5 billion duringthe current fiscal year. Of this amount, $3.4 billion was invested in capital assets and $1.2 billion was restricted
ilI-C-10
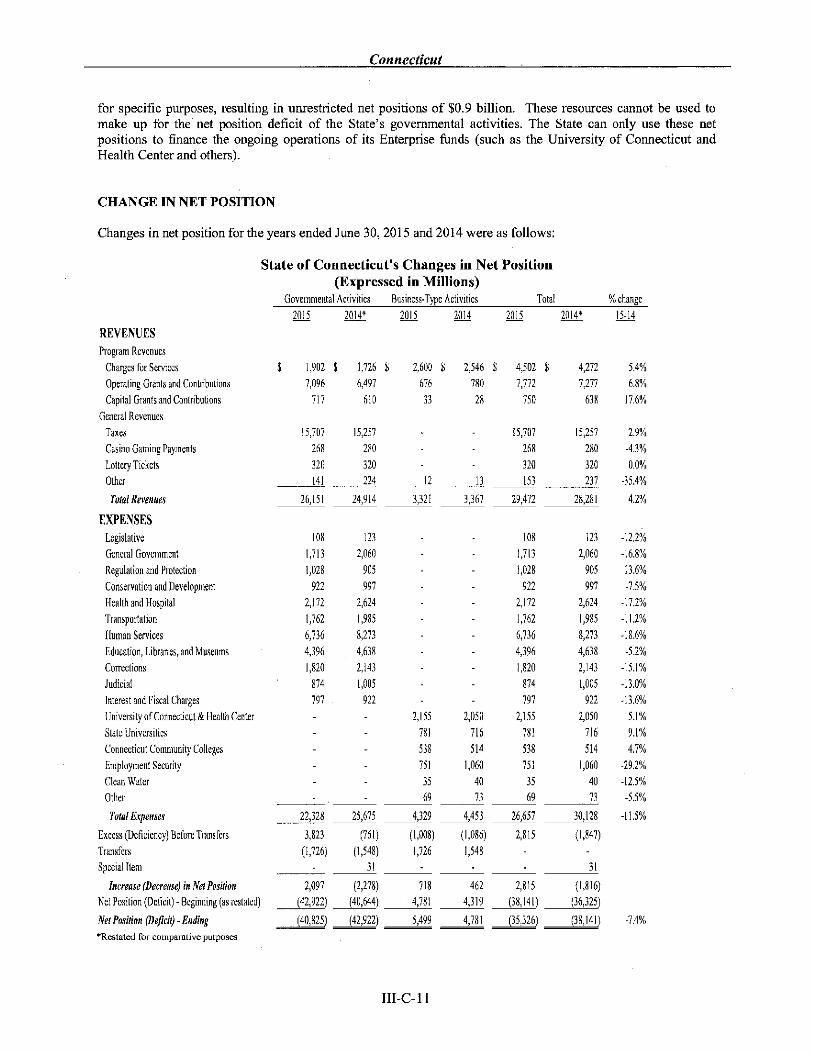
Connectícut
for specific pu{poses, resulting in unrestricted net positions of $0.9 billion. These resources cannot be used tomake up for the net position deficit of the State's governmental activities. The State can only use these netpositions to finance the ongoing operations of its Enterprise funds (such as the University of Connecticut andHealth Center and others).
CHANGE IN NET POSITION
Changes in net position for the years ended June 30, 2015 and 2014 were as follows
State of Connecticutfs Changes in Net Position(Expressed in Millions)
GovemmentalActivities Business-Type Activities Total % change
2015 20t4* 2015 2014 2015 2014" l5-t4
REVENUES
Progmtn Revenues
Charges fol Services
0perating Grants and ContLibutìons
Capital Grants and Contlibutions
General Revenues
Taxes
Casino Gaming Paynents
Lottery Tickets
0ther
Total Rwenues
EXPENSES
Legislative
General Government
Regulation and Protection
Conseryation and Development
Health and Hospital
Transpofation
Human Services
Education, Libraries, and Museums
Conections
Judicial
Intere$ and Fiscal Charges
University olConnecticut & Health Center
State Universities
Connecticut Community Colleges
Employment Security
Clean Water
Othe¡
Totøl Expenses
Excess (Defi ciency) Befole Transfeis
Tmnsfers
Special Item
Increase @eereøse) ín Net Posirton
Net Position (Deficit) - Beginning (as restated)
Net Posítion (Defrcít) - Ending
*Restated for comparative purposes
$
-35.40/o
26,15t 24,9t4 3,321 3,367 29,472 28,281 4.2Y0
(42,e22) (40,644) 781 4,319 (38,14r) (36,32Ð
(40,82Ð (42,922) s,499 4,181 (35,326) (38,14r) -7.4%
1,902 $
1,096
117
1,126 S
6,497
610
2,546
780
28
2,600
616
33
4,502
7,712
750
$ a )1')
7,277
638
s.4%
6.8%
t1 tntI /.U/0
-4.30/o
l1 10/. LL,L /O
-t6.8%
13.6y0
-75%
-t7.2%
tl nll- L t,L/O
-t8.6%
-s.z%
-15.t%
-t3.0%
-t3.6%
5.t%
9.1%
4.1%
-29.2%
-12.50/0
-5.5%
-[.5%
15,707 15,251
268 280
320 320
l4l 224 12 13
t5,707
268
320
153
5 2.9%
0.0%
,257
280
320
231
108
t,1t3
1,028
922
) 11)
1,762
6,736
4,396
t,820
814
797
t23
2,060
905
997
2,624
1,985
8,273
4,638
2,t43
1,005
922
108
1,713
1,028
01)
2,172
1,762
6,736
4,396
1,820
874
791
2,155
781
538
15t
35
69
123
2,060
905
997
2,624
1,985
8,273
4,638
2,143
t,005
922
2,050
116
514
1,060
40
13
2,155
781
538
751
35
69
2,050
116
514
I,060
40
73
wr| ,s,6',s ^3, w ,6,6s7 30Jrs
3,823 (16t) (r,008) (r,086) 2,815 (1,847)
(1,726) (1,54Ð t,126 1,548
.31312,097 (2,278) 718 462 2,815 (1,810
ilr-c-t I
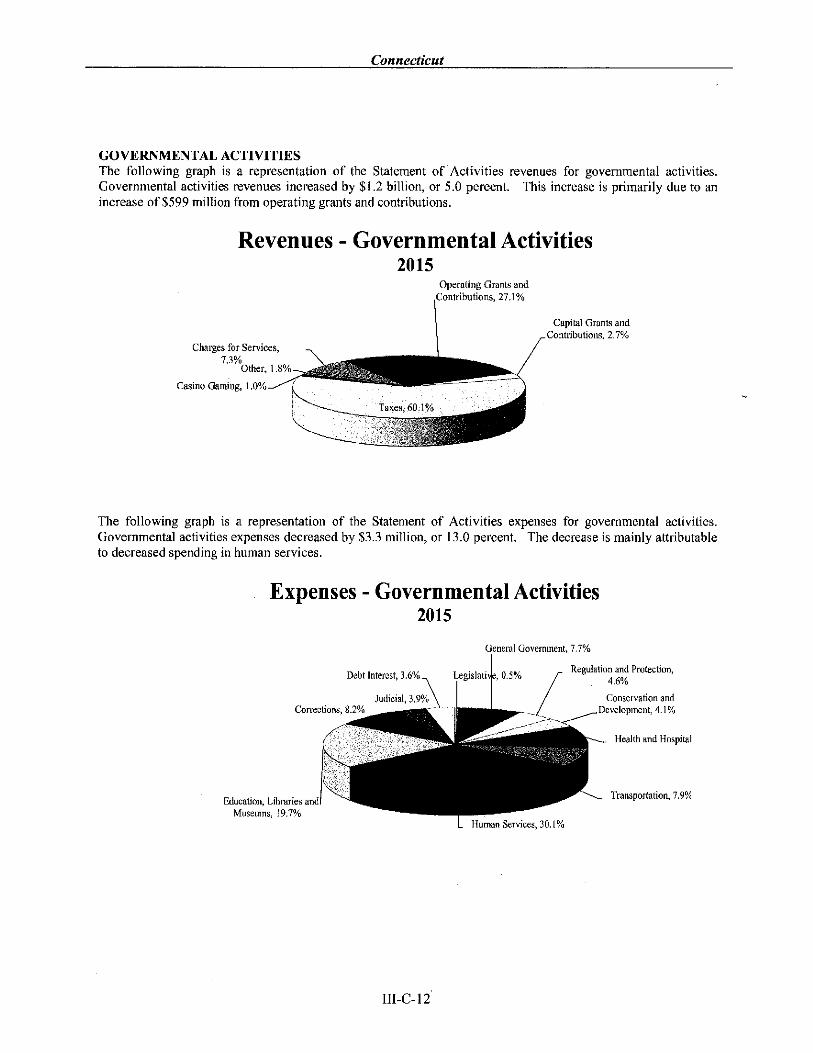
GOVERNMENTAL ACTIVITItrSThe following graph is a representation of the Statement of Activities revenues for governmental activities.Govemmental activities revenues increased by $1.2 billion, or 5.0 percent. This increase is primarily due to anincrease of $599 million from operating grants and contributions.
Revenues - Governmental Activities2015
Operating Grants and27.1%
Capital Grants andContributions, 2.7%
Charges for Services,'73%
Other, 1
Casino Gaming, I
The following graph is a representation of the Statement of Activities expenses for governmental activities.Governmental activities expenses decreased by $3.3 million, or 13.0 percent. The decrease is mainly attributableto decreased spending in human services.
Expenses - Governmental Activities201s
General Government, T.T%
Debt lnterest, 05%
Human Services, 30. I %
Regulation and Protection,4.6%
Conservation and
Development, 4.1%
Health and Hospital
Transportation, 7.9%
Judicial,3,9%Conections,8.2%
Education, LibrariesMuseums, 19.7%
ilr-c-l2

Connectícut
NET POSITION OF BUSTNESS.TYPE ACTIVITIESNet position of business-type activities increased by $718.2 million during the fiscal year. The following charthighlights the changes in net position for the major enterprise funds.
During the year, total revenues of business-type activities remained steady at $3.3 billion, while total expensesdecreased 2.8 percent to $4.3 billion, [n comparison, last year total revenues decreased l0.l percent, while totalexpenses decreased 4.7 percent. The decrease in total expenses of $124 million was due mainly to a decrease inEmployment Security expenses of $309.0 million or 29.2 percent. Although, total expenses exceeded totalrevenues by $ I ,008 million, this deficiency was reduced by transfers of $1,726 million, resulting in an increase innet position of $7 1 8.2 million.
Business-Type ActivitiesProgram Revenue and Expenses
For the Fiscal Year June 30, 2015
(Dollars in Millions)
2,500
2,000
1,500
1,000
500
0UCon¡ & Health
CenterState
Universiities
CT CommunityColleges
EmplovmentSecurity
Clean \\¡ater Othe¡
*\Expeflses * Ito$am Rev-enues
-NN
i\\\\\.\\\\\\
\\\\i\\\\\\\\\r\i¡\\\\\\\\\\l\\\\\
Ns\s*\\\\\ììNNNN\iI
ffi ffi Ñì.NN
[r-c-13

Connecticut
FINANCIAL AÀIALYSIS OF THE STATE'S GOVERNMENTAL FUNDS
As of the end of the fiscal year, the State's governmental funds had fund balances of $2,109.4 million, an increaseof $12.3 million over the prior year ending fund balances. Of the total governmental fund balances, $2,113million represents fund balance that is considered restricted for specific purposes by external constrains orenabling legislation; $190.5 million represents fund balance that is non-spendable; $607.8 million represents fundbalance that is committed or assigned for specific pu{poses. A negative $801.9 million unassigned fund balanceoffsets these amounts.
General tr'und
The General Fund is the chief operating fund of the State. At the end of the fiscal year, the General Fund had afund balance deficit of $189.8 million, an increase of $148.7 million in comparison with the prior year. Of thistotal fund balance, $603.4 million represents non-spendable fund balance or committed for specific pulposes,leaving a deficit of $793.2 million in unassigned fund balance.
At the end of fiscal year 2015, General Fund revenues were 3.2 percent, or $553.4 million, higher than fiscal year2014 revenues. This change in revenue results from increases of $747 million primarily attributable to taxes($525.4 million) and federal grants and aid ($221.6 million). These increases were offset by decreases of $193.6million primarily attributable to licenses, permits, and fees (857.2 million), casino gaming payments ($11.9million), charges for services ($4.7 million), fines, forfeits, and rents ($ZS.q million), and other revenue ($40.qmillion).
At the end of fiscal year 2015, General Fund expenditures were 2.I percent, or $344.6 million, higher than fiscalyear 2014. This was primarily attributable to increases in education, corrections, and judicial of $535.6 million,$41.5 million, and $38.7 million, respectively. Net other financing sources and uses decreased by $903.6 million,which is primarily due to bonds not being issued in fiscal year 2015.
Debt Service Fund
At the end of fiscal year 2015,the Debt Service Fund had a fund balance of $668.4 million, all of which wasrestricted, an increase of $.9 million in comparison with the prior year.
Transportation Fund
The State's Transportation Fund had a fund balance of 5257 .3 million at the end of fiscal 2015. Of this amount,$29.4 million was in nonspendable form and $227.9 million was restricted or committed for specific purposes.Fund balance increased by 30.7 million during the current fiscal year.
At the end offiscal year2015, Transportation Fundrevenues decreasedby $21.1, or 1.5 percent, and expendituresincreased by $52.7 million, or 6.2 percent. The decreased revenue is primarily due to a decrease in taxes.
Restricted Grants and Accounts Fund
At the end of fiscal year 2015, the Restricted Grants and Accounts Fund had a fund balance of $84.8 million, allof which was restricted for specific purposes, an increase of $39.1 million in comparison with the prior year.
Total revenues were 14.2 percent, or $796.4 million, higher than in fiscal year 2014. Overall, total expenditureswere 6.8 percent, or $417.9 million, higher than fiscal year 2014.
Grant and Loan Programs
As of June 30,2015, the Grant and Loan Programs Fund had a fund balance of $753.0 million, all of which wasrestricted for specific puqposes, an increase of $284.5 million in comparison with the prior year.
ul-c-14

Connectìcut
FINANCIAL ANALYSIS OF THE STATE'S PROPRIETARY FUNDS
Proprietary funds report activities of the State that are similar to for-profit business. Proprietary fund financialstatements provide the same type of information as the government-wide financial statements, only in more detail.Accordingly, a discussion of the financial activities of the Proprietary funds is provided in that section.
FINANCIAL ANALYSIS OF THE STATE'S FIDUCIARY FIINDS
The State maintains Fiduciary funds for the assets of Pension and Other Employee Benefit Trust funds, an
Investment Trust fund, and a Private-Purpose Trust fund. The net positions of the State's Fiduciary funds totaled$30.9 billion, an increase of $544.8 mmillion when compared to the prior year ending net position.
Budeet Hiehliehts-General Fund
The revised State budget as adopted for Fiscal Year 2015 was anticipating a small surplus of $0.4 million dollarson gross General Fund appropriations of $17.8 billion. By the end of the fiscal year, a General Fund deficit of$113.2 million had emerged from operations. In accordance with state lavr, a transfer from the State's BudgetReserve Fund was made to cover this deficit, which decreased the total reserve balance in the fund to $406.0million.
As Fiscal Year 2015 progressed, it became clear that the General Fund would not reach the budgeted revenuetargets. By the end of the fiscal year, revenues were $176.2 million short of the original budget projection. In anattempt to eliminate General Fund deficit projections for Fiscal Year 2015, the Governor implemented threedeficit mitigations plans over the course of the fiscal year and implemented other cost cutting initiatives. Thesemeasures proved insufficient to completely eliminate a fiscal year-end deficit, but they did substantially lessenthat deficit.
The State experienced significant job growth throughout Fiscal Year 2015. However, suppressed wage growthduring the fiscal year significantly constrained the growth in major state revenue sources. By the end of FiscalYear 2015, weekly wages in Connecticut were growing by less than2 percent. Considering the level of jobgrowth that the State was experiencing, wage growth was expected to approach 5 percent. As a result of the wagedrag on overall State economic growth, General Fund revenue in Fiscal Year 2015 grew by just 1.6 percent.
As discussed above, significant expenditures controls were implemented in an attempt to keep the budget inbalance. General Fund spending in Fiscal Year 2015 was held to a growth rate of 2.6 percent.In the six fiscalyears following the large Fiscal Year 2009 General Fund deficit, spending growth in the General Fund has
averaged 2.5 percent per year. This compares to average annual General Fund spending growth of7.3 percent inthe four years leading up to that large deficit.
Twenty-six appropriation line-items in the budget account for 87 percent of General Fund spending. In order toconfol the growth in General Fund spending during the Fiscal Year 2009 to 2015 period, actual dollar reductionswere made over the period in several of these large line-items (comparing spending in Fiscal Year 2009 tospending in Fiscal Year 2015). Some notable reductions between those fiscal years included a cut of $155.8million in higher education operating support, a decline of $148.0 million in state employee payroll expense, anda decrease of $84.8 million in the Department of Children and Families residential board and care program.During that six year period, the largest dollar increases were an additional $516.1 million to fund the StateEmployees Retirement System, an increase of $498.9 million in Medicaid spending, and $444.8 million more tofund the Teachers' Retirement system. It is important to note that the vast majority of funding to the retirementsystems is for individuals that have already retired. These obligations were incurred over many decades, but werenot fully funded. These have now become fixed state costs. Pension reforms have substantially lowered pensioncosts for new hires.
Some of the spending trends listed above were reversed between Fiscal Year 2014 and Fiscal Year 2015. GeneralFund spending for Medicaid declined $103.7 million during the period as federal Medicaid spending increased by
ilI-C-15

16.4 percent. The state employee General Fund payroll expense grew by $105.5 million as wage increases thathad been eliminated in past years were reinstituted and critical positions were filled. Higher education operationsalso experienced a $31.5 million increase during Fiscal Year 2015.
Fiscal Year 2015 recorded $13.9 billion in Fiscal Year 2015 operating activity that fell outside the General Fund.The majority of this activity was in the Special Revenue Funds group. These are funds that have dedicatedrevenue sources to support their programs. This fund category includes federally supported programs, theoperating activities ofthe universities, and the Transportation Fund. Federal grants grew by 10.6 percent in FiscalYear 2015 over the prior fiscal year. This equates to $545.8 million in additional federal spending. The largestfederal increase was in Medicaid. This caused the special revenue fund group to grow by 9.8 percent to total $11.5billion in Fiscal Year 2015.
The Transportation Fund ended Fiscal Year 2015 with a positive fund balance of $180.1 million. Spendingincreased by 4.5 percent during Fiscal Year 2015 and totaled $1.3 billion. Since 2009, Transportation Fundspending has grown by an average of 2.7 percent a year.
Capital project spending grew by 12.5 percent between Fiscal Year 2014 and Fiscal Year 2015 to total $1.7billion. Since 2009, the average annual growth in capital spending has been 6.3 percent. This is consistent withgrowth in the private sector use of debt financing as companies took advantage of historically low interest rates.
Within the Required Supplemental Information Section of this report, there is a reconciliation of Fiscal Year 2015General Fund operations for the accrual budgetary basis of accounting and the accounting basis used within thefund financial statements in this report. In Fiscal Year 2014, a new budgetary accrual approach was developedwith the intention of eliminating the growth in the annual General Fund negative unassigned fund balancecontained in this report.
CAPITAL ASSETS AND DEBT ADMINISTRATION
Capital Assets
The State's investment in capital assets for its governmental and business-type activities as of June 30,2015totaled $17.2 billion (net of accumulated depreciation). This investment in capital assets includes land, buildings,improvements other than buildings, equipment, infrastructure, and construction in progress. The net decrease inthe State's investment in capital assets for the fiscal year was $539.5 million.
Major capital asset events for governmental activities during the fiscal year include additions to buildings andlandof $292 million and depreciation expense of $917.6 million.
The following table is a two-year comparison of the investment in capital assets presented for both governmentaland business-type activities:
State of Connecticut's Capital Assets(Net of Depreciation, in Millions)
""älï;J"' "ïffi;lit' p.i,u.#å1r..n,.n,
Land
BuildingsImprovements Other Than Buildings
Equipment
Infrastructure
Construction in Progress
Total
2015 2014 2015 2014
$ 1,709 $ 1,687 $ 68 $ 68
2,505 2,234 2,868 2,706156 158 t66 l7l62 72 332 325
4,934 4,9243,66s 3,465 717 s l I
$___-]],qi! $___ptg $___lJ!l q____¡l!!
20tss r,777
5,373
322
3944,9344,382
$___uJ_qz
2014
$ 1,755
4,940
329
397
4,924
3,976
$___!!t4
Additional information on the State's capital assets can be found in Note 9 of this report.
III-C-I6

Connecticut
Long-Term Debt - Bonded Debt
At the end of the current fiscal year, the State had total debt outstanding of $23.9 billion. Pursuant to variouspublic and special acts, the State has authorized the issuance ofthe following types ofdebt: general obligationdebt þayable from the General Fund), special tax obligation debt (payable from the Debt Service Fund), andrevenue debt (payable from specific revenues of the Enterprise funds).
The following table is a two-year comparison of bonded debt presented for both govemmental and business-typeactivities:
State of Connecticutrs Bonded Debt (in millions)General OblÍgation and Revenue Bonds
Govemmental Business-Type Total
Activies Activities Primary Government
2015 20t4 2015 2014 2015 20t4
General0bligationBonds $ 16,403 $ 15,282 $ $ $ 16,403 S 15,282
Transportation Relatedbonds 4,090 3,771 4,090 3,771
Revenue Bonds 1,357 I ,213 I,357 |,213
Long-TermNotes 520 581 520 581
1,528 1,279
Total
Premiums and Defened Amounts 1.417 1.195 I I I 84
s 22,430
The State's total bonded debt increased by $1.8 million (8.0 percent) during the current fiscal year. This increaseresulted mainly from an increase in general obligation bonds of $1.1 million.
Section 3-21 of the Connecticut General Statutes provides that the total amount of bonds, notes or other evidencesof indebtedness payable from General Fund tax receipts authorized by the General Assembly but have not beenissued and the total amount of such indebtedness which has been issued and remains outstanding shall not exceed1.6 times the total estimated General Fund tax receipts of the State for the current fiscal year. [n computing theindebtedness at any time, revenue anticipation notes, refunded indebtedness, bond anticipation notes, taxincrement financing, budget deficit bonding, revenue bonding, balances in debt retirement funds and otherindebtedness pursuant to certain provisions of the General Statutes shall be excluded from the calculation. As ofJuly 2015, the State had a debt incurring margin of $3.6 billion.
Other Long-Term DebtState of Connecticut Other Long - Term Debt (in Millions)
Net Pension Liability
Net OPEB Obligation
Compensated Absences
Workers Compensation
Federal Loan Payable
Other
Total
Governmental
Activies
2015 2014*
26,t71 $ 27,773
8,983 7,763
499 513
ó51 620
150 129
Business-Type
Activities
201s 2014
.t -t186 t67
103 434
351 302
Total
Primary Government
2015 2014*
26,171 S 27,773
8,983 7,763
685 680
651 620
103 434
501 431
$ 37,094 L__lzlg!*Restated for comparative purposes
The State's other long-term obligations decreased by $607 million (1.6 percent) during the fiscal year. Thisdecrease was due mainly to a decrease in the net pension liability (Governmental activities) of $1.6 million or 5.8percent. Additional information on the State's long-term debt can be found in Notes 16 and 17 of this report.
[r-c-17
EconomÍc Outlook and Next Year's Budget
At this writing, Connecticut has recovered all of its private sector recessionary job losses and is continuing to addprivate sector employment. The State needs to reach the 1,713,000 job level to enter a full nonfarm employmentexpansionaryphase. This will require an additional 13,300 nonfarmjobs. Connecticut's nonfarmjobs recovery is69 months old and is averaging 1,532 new jobs per month since February 2010.
Connecticut has been growing jobs at fairly typical recovery rate; however workers' wage growth has been belownormal recovery levels. There are some early signs that wage increases may be accelerating slightly. Wagesincreased by less than2 percent in Fiscal Year 2015. Current trends point to Connecticut wage growth of betterthan 3 percent. Wage Growth in the United States averaged 6.3 percent from i960 until 2015, reaching an all-timehigh of 13.8 percent in January of 1979 and a record low of -5.77 percent in March of 2009. Historically,Connecticut wages have increased at a faster pace than the national average.
Connecticut, like most other states, has a revenue structure that is dependent on rising wages and the relatedincreases in consumer spending. As wages have been slow to recover, Connecticut's revenue base hasexperienced lower than expected growth. As job expansion continues in the State and as wage acceleration takeshold, Connecticut's recent budget pressures will abate. Exactly when solid wage gains will emerge is as uncertainas it is vital to the State's budgetary health.
Looking forward it is also important to note that Connecticut's economy is dependent on the national economy,which is dependent on world events. Global economic activity has constrained domestic growth. China'seconomy (2nd largest in the world) has been slowing. In response, its central bank cut interest rates in hopes ofboosting growth. Less oil demand from China as the economy slowed has produced a sharp drop in oil prices as
well as coal and other commodities. These falling prices have negatively impacted the stock market.
The cheaper oil has damaged oil exporting economies such as Brazil and Russia, in addition to many MiddleEastern producers. The European economy has struggled to grow at all, advancing at an annual pace of less Than2percent.
All of these economic trends will impact future Connecticut budgets. The Governor is required to submit abalanced budget for Fiscal Year 2017 in February 2016. Currently, the Fiscal Year 2016 budget is facing the sameslow growth in revenue that was experienced in Fiscal Year 2015. Cost controls are in place to avoid endingFiscal Year 2016 with a budget deficit.
CONTACTING THE STATE'S OFFICES OF FINANCIAL MANAGEMENT
This financial report is designed to provide our citizens, taxpayers, customers, investors, and creditors with ageneral overview of the State's finances and to demonstrate the State's accountability for the money it receives. Ifyou have any questions about this report, please contact the State Comptroller's Office at l-860-702-3350.
[I-C-18

BasicFinunciulStatements
ilr-c-19

Connecticut
THIS PAGE LEFT INTENTIONALLY BLANK
III-C-20

Connecticut
Sfatement of Net PositionJune 30, 2015(Expressed in Thousands)
Assets
Cu€nt Assets:
Cash and Cæh EquivalentsDeposits with U.S. TrqsuryInvestrnents
Ræeivables, (Net of A.llowæces)Due from Primry GovmentlnventoriesRestrict€d Ass€ts
lntemal BalmcesOther Curmt Assets
Totâl Cwmt Ass€ts
Noncment Assets:
Cash and Cæh Equivalents
Due From Componqt UnitsInvestments
Ræeivables, (Net of Allowmces)
Rsstricted Assets
Capital Assets, (Net of Accmulated Depræiation)Other Noncumt Assts
Total Noncunent Assets
Total Assets
Deferred Oudlows of Resources
Accumulated Dec¡ease in Fai¡ Value of Hedging Derivatives
Unmo¡tized I¡sses on Bond Refundings
Related to Pmsions
Other Defened OutflowsTotal Defered Outflows of Resouræs
Li8bil¡tiesCwent Liabilities:
Accomts Payable md Acmed LiabilitiesDue to Component UnitsDue to Primary Govm€ntDue to Other GovffientsC\¡ûmt Portion of hng-Tm ObligationsAmount Held for Institutions
Unemed Rgvenug
Medicaid LiabilityLiability for Escheated Ploporty
Othm Cunøt Liabilities
Total Cunat Liabilities
Noncurent Liabilili€s:Non-Cunml Portion of l¡ng-Tem ObligationsTotal Noncunent Liabilitiss
Total Liabilities
Deferred lnllows of Resources
Related 1o Pensions
Oths Defmed Inflows
Total Defened lnflows ofResouæs
Net Positiotr
Net lnvestrnent in Capital Assets
R€striQted For:
TrilsportationDebt SwiceFederal Gmts md Other AccomtsCapital Projects
G¡ant and I¡m hog¡msClean Watq æd Drinking Water kojectsBond Indmtue Requi¡ements
I¡ansPemmmt lnv€strn€nts or Endowgnts:
Expendable
Nonexpmdable
Othq Purposes
Urestricted (Deficit)
Total Net Position (Deficit)
Primsry GovermentGovernmental
Act¡vities
$ 1,227,870 $ 651,813 $t3s,02760 r1)
862,641
10,655
221,928
343,797
38,743
1,879,683 S
t35,027
t82,n72,998,502
58,827,rt ote
Comporcnt
Un¡ts
249,984
424,48s124,557
6,9765,916
1,101,604
t97,445
st9,2974,494,718
798,60260,092
6,070,ts4
7,999,067
Busiress-Type
Activitíes Total
I 12,895
2,t3s,861
48,172
(343,797)
7,4003,188,401
46,t43 15,391
2,333,826 a a1) )11 1,928,9Ì3
36,03s
672,973
668,426t3,03t,241
461,67t
62,4s1
835,108405,44s
4,15t,4455,084
46t,67t36,035
62,4511,508,081
1,073,871
l 7, r82,686
5,084
14,408,675 5,921,204 20,329,8'19
8,25s.030 25.852.10617,597,076
3,3ól
96,ó00
2,360,827
12,873
3,253
3,361
t09,4732,360,827
3,253
t04,894'n,902
7,t6288
2,460,788 t6,126 2,476,914 134,046
861,5t26,976
3t3,861
t,970,99s
t8,4t7539,059
39s,6t743,|9
328,515
757
180,854
226,630
92,633
1,190,027
6,976
3 14,6 l82,t51,849
245,047
539,059
395,6t7t35,'152
l 18,980
36,035
cts,ãtz320,224
48,832
939,9434,149,ss6 829,389 4,9'18,94s
55,310,129 1,925,859 57,235,9881,925,859 57,235,988
2,755,248 62,214,933
4,795,6074,795,607
s,735,550
55,3t0,129
59,459,685
1,423,296
t,423,296
16,902t,423,296
t6,902
1,440,198
5,t76
5,176
526,892
t6,902
155,03 l615,961
7t,89254,315
'766,375
4,957,690 3,448,779
4,508
288,105
oss,s rs
3,74
13,578
t45,706895,770
8,406,469
155,031
620,4697t,892
342,420't66,37s
698,8r8
? 14)
t2t,274259,333
31,238
t02,499
964,6t6
96,702339,80't
70,0s7
107,696
t13,62'7
(47,667;704) (46,771,934) 310,s76
L___ .!?¡110 q___ ____1 9{!q $ __ol¿26J]! $____2A42}yL
The accompanying notes src ûn ¡ntegral pat oÍthe linancíal støtemenls.
rrr-c-21

Connectícut
Statement of ActivitiesFor The Fiscal Year Ended June 30,2015(Expressed in Thousands)
Functions/ProqramsPrimary GovernmentGovemmental Activities:
LegislativeGeneral Govemment
Regulation and Protection
Conservation and DevelopmentHealth and Hospitals
TransportationHuman Services
Education, Libraries, and Museums
Corrections
JudicialInterest and Fiscal Charges
Total Governmental Activities
Business-Type Activities:University of Connecticut & Health Center
State UniversitiesConnecticut Community CollegesEmployment Security
Clean WaterOther
Total Business-Type Activities
Total Primary Govemment
Component UnitsConnecticut Housing Finance Authofiy 02/3 I I 14)Connecticut Lottery CorporationConnecticut Airport AuthorityOther Component Units
Total Component Units
$
$
The accompanying notes are an íntegral parl oflheJìnancíal statements.
22,327 ,891 t ,902,2s7 7 ,095 ,87 4
Prosram Revenues
ExDenses
Charges forServices, Fees,
Fines, andOther
OperatingGrants and
Contributions
CapitalGrants and
Contributions
717,358
107,629 s1,712498t,028,126
92t,8s92,172,348I,761,5006,736,623
4,396,2t21,820,490
873,879796;727
3,421 $
71 1,050
643,620
96,61681,127
53,719
127,999
39,9stt2,t2l
132,633
55,453I 66,585
157,295145,307
5,886,389535,993136,207
12,645
$
717,358
2,1s4,s99781,238538,03ó7s0,573
35,12569,099
1,200,847
379,797
102,444821,69425,96068,936
253,17664,84',7
1 1 1,951
218,384ts,12s12,935
25,4127,395
4,328,670 2,s99,678 676,418 32,807
$ 26,656,561 $ 4,s01,935 S 7,772,292 $ 750,16s
177,765 $
t,149,37994,586
405,039
r 93,068 $
1,144,031
89,918339,479
s
13,136
72,00138,3 t 5
$ 1,826,769 $ 1,766,496 $ 38,315 $ 85 137
General Revenues:
Taxes:
Personal IncomeCorporate Income
Sales and Use
OtherRestricted for Transportation Purposes:
Motor FuelOther
Casino Gaming Paynents
Tobacco Settlement
Lottery Tickets
Unrestricted Investment Eamings
Contributions to Endowments
Special Item
Transfers-lnternal Activities
Total General Revenues, Contributions,
and Transfers
Change in Net PositionNet Position (Deficit)- Beginning (as restated)
Net Position (Deficit)- Ending
ilr-c-22

Connecticut
Net (Expense) Revenue and Chanses in Net Position
Primary GovernmentGovernmental
Activities .
Business-TypeActivities Total
ComponentUnits
$ (104,208) $
(94s,99s)(217,921)(667,948)
(t,945,914)(990,423)(722,235)
(3,820,268)(1,672,162)
(728,601)(796,727)
(104,208) $(945,ees)(217,921)(667,948)
(1,945,914)(990,423\(722,235)
(3,820,268)(1,672,162)
(728,601)(796,727)
$
(12,612,402) (12,612,402)
(675,164)(329,199)(323,641)289,sjs
5,96012,772
(675,164)(329,199)(323,641)289,505
5,96012,772
(r,019,767) (1,019,767',)
(12,612,402) (1,019,767) t3,632,t69J
15,303
(5,348)
8,46844,756
63,179
8,186,946687,347
4,167,0541,735,788
846,06283,868
267,986
l 1 8,988
319,700
22,091
(1,726,281)
8,186,946687,347
4,167,0541,735,788
846,06283,868
267,986
I 18,988
319,700
33,7291 1,638
t,726,281
46,937
1,259
14,709,549 |,137,919 16,447,468
2,815,299(38,14 I,4 I 0)
48,196
2,097,147(42,922,264)
718,1524,780,854
tt1,3752,331,012
s (35,326,111) $(40,82s,117) $ 5,499,006 $
Itr-c-23
2,442,387

Connecticut
THIS PAGE LEFT INTENTIONALLY BLANK
trr-c-24

Governmental Fund Fínancíal Statements
Møjor Funds:
Generøl Fund:This fund is the State's general operating fund. It accounts for the financial resources and transactions not accounted for in otherfimds.
Debt Servíce Fund:This fund is used to account for the accumulation ofresources for and the payment of, principal and interest on special taxobligation bonds of the Transportation fund.
Trønsportatíon Fund:This fund is used to account for motor vehicle taxes, receipts and transporlation related federal revenues collected for thepurposes ofpayment of debt service requirements and budgeted appropriations made to the Department ofTransportation. TheDepartment of Transportation is responsible for all aspects of the planning, development, maintenance, and improvement oftransportation in the state.
Restrìcted Grønts and Accounts Fund:This fund is used to account for resources which are restricted by Federal and other providers to be spent for specific purposes.
Grant and Loan Programs Fund:This fund is used to account for resources that are restricted by state legislation for the purpose ofproviding grants and/or loansto municipalities and organizations located in the State.
Nonmajor Funds:Nonmajor governmental funds are presented, by fund type beginning on page 106.
rII-C-25
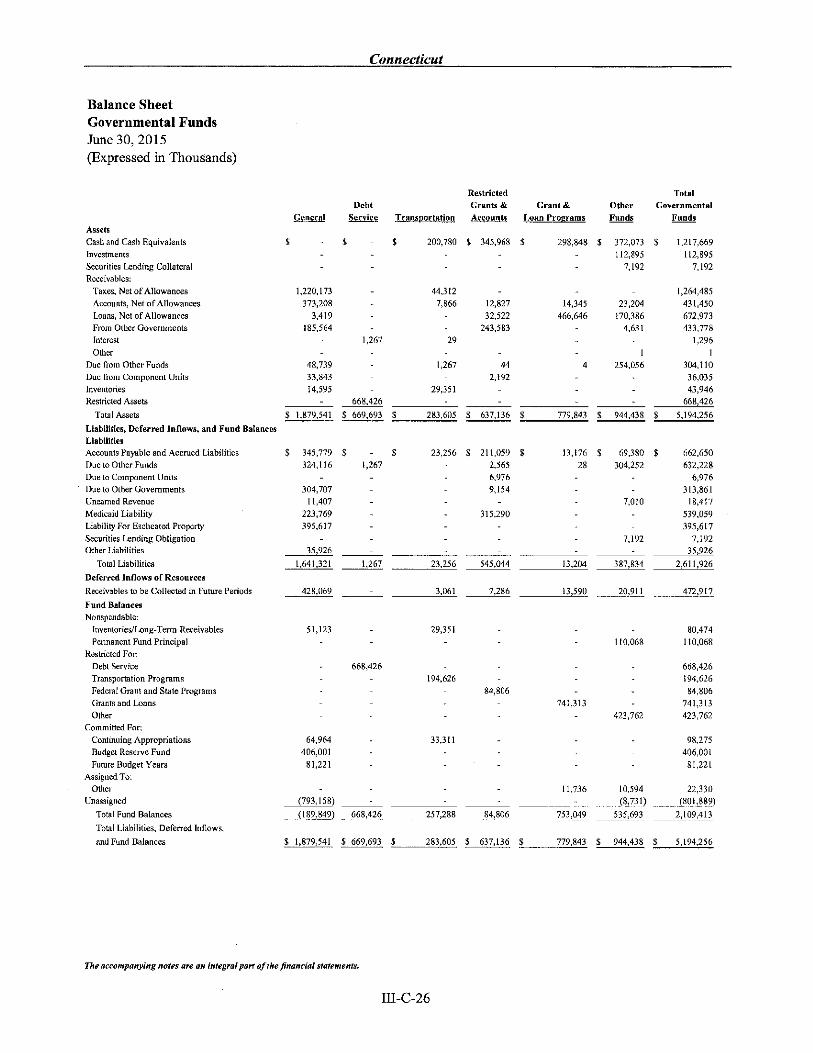
Balance SheetGovernmental FundsJune 30,2015(Expressed in Thousands)
Assets
Cash and Cash Equivalents
Investments
Securities tænding CollateralReceivables:
Taxes, Net of AllowancesAccounts, Net of AllowancesLoans, Net of AllowancesFrom Other Governments
Interest
Other
Due from Other Funds
Due from Component UnitsInventories
Restricted Assets
Total Assets
Liabilities, Deferred Inflows, and Fund Balances
LiabilitiesAccounts Payable and Accrued LiabilitiesDue to Other Funds
Due to Component UnitsDue lo Other Govemments
Uneamed Revenue
Medicaid LiabilityLiability For Escheated Property
Securities tænding ObligationOther Liabilities
Total Liabilities
Deferred Inflows of Resources
Receivables to be Collected in Future Periods
Fund Balances
Nonspendable:
Inventories/Iong-Term Receivables
Permanent Fund PrincipalReshicted For:
Debt Service
T¡ansportation Programs
Federal Grant and Stâte Programs
Grânts and l¡ânsOther
Committed For:
Continuing Appropriations
Budget Reserve Fund
Future Budget YearsAssigned To:
OúerUnassigned
Total Fund Balances
Total Liabilities, Defened Infl ows,
and Fund Balances
DebtService
1,267
Restricted
Grants &Accounts
Grånt &Loan Programs
Tot¡lGovernment¡l
FundsGeneral
1,220,173
373,208
3,419
I 85,564
48,739
33,843
14,595
Transport¡tion
$ 200,780
OtherFunds
$ $ $ 345,968 $ 298,848 $ 372,073
112,895
7,t92
t,217,669
1 12,895
7.192
$
$ 1,879,s41 $ 6ó9,693 $ 283,60s $ 637,136 g 779,843
- 1,264,485
23,204 431,450
170,386 672,973
4,631 433,778_ |,296
l1254,056 304,110
- 36,035
- 43,946
s 944,438 I s,t94,zs6
44,312
7,866
29
1,267
zs,ist
12,827
32,522
243,583
t4,345466,646
44
2,1924
g 34s,779 g
324,116 1,267
304,707
lt,407223,769
395,617
35,926
!,641321 1]67
23,256 g 211,059 $- 2,565- 6,976
- 9,1s4
315,290
13,176 $ 69,380 $28 304,252
7,010
7,192
662,6s0632,228
6,9763 l 3,861
18,417
539,059
395,617
7,19235,926
2,611,92623,256
428,069 3,061
51,123 29,351
668,426
194,626
64,964
406,001
81,221
33,31 1
(793,1 58)
(189,849) 668,426 257,288
$ 1,879,541 $ 669,693 $ 283,605
545,044
7,286
13,204
13,590
387,834
_ 20,911 472,917
1 10,0ó8
80,474
l 10,068
423,7O
668,426
194,626
84,806
741,313
423,762
98,27s
406,001
81,221
10,s94 22,330(8,731) (801,889)
535,693 2,109,413
84,806
741,313
11,736
84,806
$ 637,13ó
7s3,049
s 779,843 9-- l!,ß8 9----i-]21256
The accompanying notes arc an ¡ntegrul part ofthe frnønc¡al støtements.
I[r-c-26
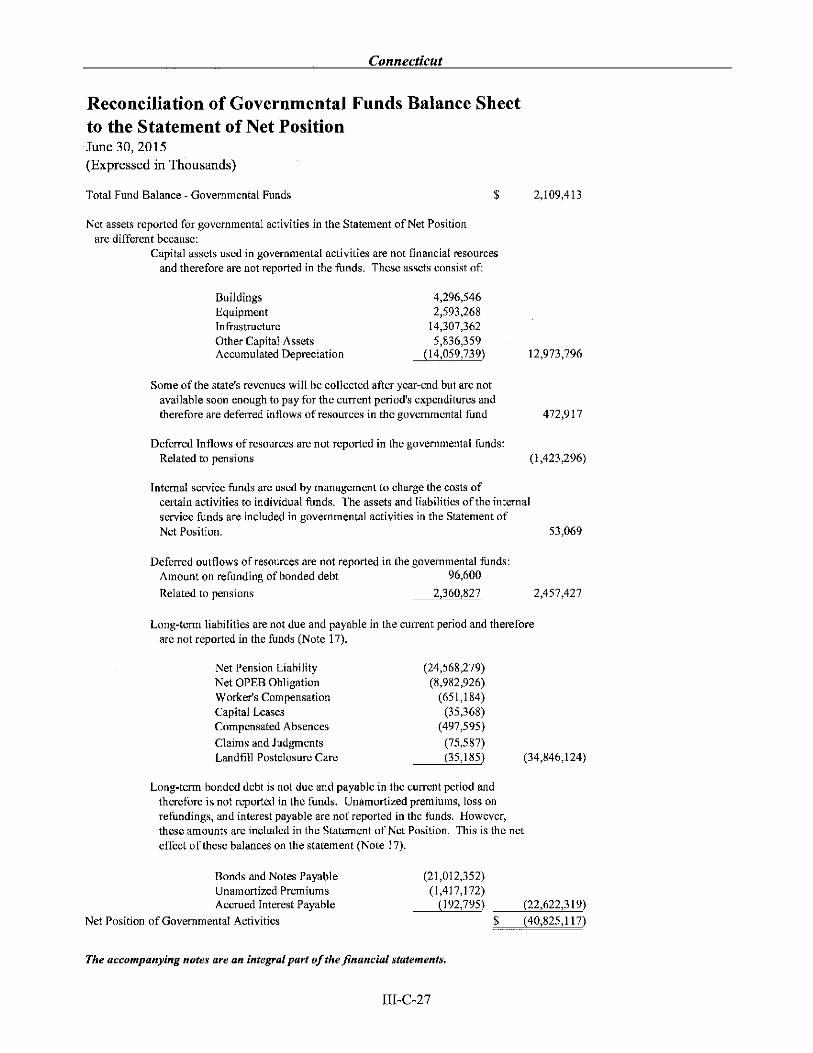
t
Reconciliation of Governmental Funds Balance Sheetto the Statement of Net PositionJune 30,2015(Expressed in Thousands)
Total Fund Balance - Govemmental Funds
Net assets reported for govemmental activities in the Statement of Net Positionare different because:
Capital assets used in governmental activities are not financial resources
and therefore are not reported in the funds. These assets consist of:
(24,568,279)(8,982,926)
(65 I,1 84)(35,368)
(497,s9s)
(7s,s87)(3s,1 85)
(21,012,352)(1,417,r72)
(r92,79s)
$ 2,109,413
(34,846,124)
(22,622,319)
BuildingsEquipmentInfrastructureOther Capital AssetsAccumulated Depreciation
Net Pension LiabilityNet OPEB ObligationWorker's CompensationCapital Leases
Compensated Absences
Claims and Judgments
Landfi 1l Postclosure Care
Bonds and Notes PayableUnamortized PremiumsAccrued Interest Payable
Net Position of Governmental Activities
4,296,5462,593,269
14,307,362
5,836,3s9(r4,0s9,739) 12,973,796
Some ofthe state's revenues will be collected after year-end but are notavailable soon enough to pay for the current period's expenditures and
therefore are deferred inflows of resources in the governmental fund 472,917
Defened Inflows of resources are not reported in the governmental fundsRelated to pensions (1,423,296)
Intemal service funds are used by management to charge the costs ofcertain activities to individual funds. The assets and liabilities of the internalservice funds are included in govemmental activities in the Statement ofNet Position. 53,069
Deferred outflows of resources are not reported in the governmental funds:Amount on refunding of bonded debt 96,600
Related to pensions 2,360,927 2,457,427
Long-term liabilities are not due and payable in the current period and thereforeare not reported in the funds (Note 17).
Long-term bonded debt is not due and payable in the current period and
theref'ore is not reported in the funds. Unamortized premiums, loss on
ref'undings, and interest payable are nof reported in the fi¡nds. However,these amounts are included in the Statement of Net Position. This is the netefIèct of these balances on the statement (Note l7).
The øccompønyíng notes ate øn íntegral part ofthe jìnanciøl statements,
TTT-C-27
q____Eq¡z¡t_!2

Statement of Revenues, Expenditures, andChanges in Fund BalancesGovernmental FundsFor The Fiscal Year Ended June 30, 2015(Expressed in Thousands)
GeneralRevenues
TilesLicflses, Pennits, md Fæs
Tobacco SettlqnentFederal Gmts md AidLottery TicketsChages for SwicesFines, Forfeits, ed RfltsCasino Ganing Payments
InYeshnent Emings (Loss)
Interest on LoðsMiscellmeous
Total ReYmues
ExpendituresCment:
LegislatiYe
Geneml GovmnfltRegulation ild Prolection
Conservation md DeYeloplnent
Health md Hospitals
TmsportationHunm SenicesEducation, Librtries, md Musems
ConrctionsJudicial
Capital Prcjects
Debt Swice:Principal R€tirement
2,234
205,864
(t,374,62s)
95,085(97,t32)
3,036
(l,165,538)
(t47,517)
(4t,t92)(r, r40)
q______c_q2,qÐ
DebtSeryice
RestrictedGrants &Accounts
OtherFunds
TotalGovernmental
Funds
$ 14,783,751
254,257
2,132,399
319,700
35,813
267986856
159,007
n,r53J6'
ù-
6,130
6,1 30
269,845
Transportation
$ 931,149
339,818
t2,n5
o¡,root9,575
818
n,no,
1,3'12,0'16
$-t3,467
5,593,874
,,,,,
't9s,232
6,403,611
Grant &Loan Programs
$
42
,,*t,
13,643
$-'t3,2't7
I t8,988
74,844
910
1,246
3,122
4t136,170
408,598
$ 15,714,900
680,820
I 18,988
'1,8t3,232
319,700
100,465
20,82t26'1,986
t't,85'l4l
I,108,953
26,163,763
lt'7,2sl801,461
434,785
270,565
2,245,026
5,594
105,467
47,449
(480,520)
3,053
3t8,6494t5,326296,53t206;132
767,778
3;t98,48253 I,108
23,045
t9;ts9
213,894
(31,95ó)
699,62t16,5'19
344,469
|;t4080,328
18,358
39,925
2,782
t,475,2't2
127,549
4,000(123,ó85)
5't5
I 18,470
193,584
t43,02636,335
8
3,624
5,2s5t 114
50,324
934,452
1,344,895
186,729
87,346(136,3s2)
120,8't9
t,943,795I,t6s,74t1,054,591
2,499,833
t,643,229
7,762,9t65,041,968
2,069,663
998,1 93
934,452
2,820,t67386,85ó
1,023,698
(2,749,979)
709,2t0(780,530)
3,036
t,412,458
14,508
2,09't,123
(2,218)
$ __2J-q&!l
795,Ú53,9424524,465,680
2,041,564
928,1_10
I, l 5 l,ó73 t,42t,st8Interest md Fiscal Chrges 537,181 190,7'17 1,002 166,074 4,364 5,537 904,935
TotalExpilditws 16,935;148 460,622 907,1'18 6,546,537 1,218,166 1,493,462 2'1,561,'113
Excess (Deficimcy) ofReyenues OverExpenditues 1,018,021 (454,492) 464,898 (142,846\ (1,198,667) (1,084,864) (1,397,950)
Other Financing Sources (Uses)
Bonds Issued
Prerniuns on Bonds Issued
Trmsfers InTmsfers OutRefi.uding Bonds Issued
Paynent to Refunded Bond Escrow Agent
Capital Lmse Obligations
Total Other Finmcing Souces (Uses)
Net Chmge in Fmd Balmces
Fmd Balmces (Defrcit) - Begiming
Chmge in Resewe for Inventories
Fund Balances (Deficit) - Ending ï___968,426 q______2!z¿qq. L____q$!q. $ __2:¡912 q-__-__¡r!{91
'10,344
465,t45(2,841)
614,t25(683,398)
463,37s (433,071) 181,938 r,483,136 882,ó18
8,883 31,82',1 39,092 284,469 (202,246)
659,543 226,539 4s,714 4ó8,580 '137,939
(1,078)
The rccompanyíng notes qrc sn ¡ntegtal pail oÍthe lìnønc¡ol støtements.
III-C-28

Connecticut
Reconciliation of the Statement of Revenueso Expenditures, and Changesin Fund Balances of Governmental Funds to the Statement of ActivitiesJune 30,2015(Expressed in Thousands)
Net Change in Fund Balances - Total Govemmental Funds $ 14,508
Amounts reported for govemmental activities in the Statement of Activitiesare different because:
Bond proceeds provide cunent financial resources to governmental funds. However,issuing debt increases long term-liabilities in the Statement of Net Position. Bondproceeds were received this year from:
Bonds Issued
Refunding Bonds Issued
Premium on Bonds Issued (3,9t6,233)
(2,820,167)(709,210)(386,856)
Repayment of long-term debt is an expenditure in the governmental funds, but the
rçayment reduces long-term liabilities in the Statement of Net Position. Long{erm debt
repayments this year consisted of:Principal RetirementPayments to Refunded Bond Escrow AgentCapital Lease Payments
Some capital assets acquired this year were financed with capital leases. The amount
financed by leases is reported in the govemmental funds as a source offinancing, butlease obligations are reported as long-term liabilities on the Statement ofActivities
Capital outlays are rçorted as expenditures in the govemmental funds. However, in theStatement of Activities the cost of those assets is allocated over their estimated usefullives and reported as dçreciation expense. ln the current period, these amounts and
other reductions were as follows:Capital OutlaysDepreciation Expense
Retirements
Inventories are reported as expenditures in the govemmental funds when purchased.
However, in the Statement of Activities the cost of these assets is recognized when those
assets are consumed. This is the amount by which consumption exceeded purchases ofinventories.
Some expenses reported in the Statement ofActivities do not require the use ofcurrentfinancial resources and therefore are not reported as expenditures in governmental
funds. These activities consist of:Increase in Accrued Interest
Increase in Interest Accreted on Capital Appreciation DebtAmortization oI Bond Premium
Amortization of Loss on Debt Refundings
Decrease in Compensated Absences LiabilityIncrease, in Workers Compensation LiabilityIncrease in Claims and Judgments LiabilityDecrease in Landfill Liability
' Decrease in Net Pension ObligationPension Cost, NetIncrease in Net OPEB Obligation
Because some revenues will not be collected for several months after the state's fiscalyear ends, they are not considered "available" revenues and are deferred in thegovernmental funds. Unearned revenues decreased by this amount this year.
Intemal service funds are used by management to charge the costs of certain activities,such as insurance and telecommunications, to individual funds. The net revenue
(expense) ofinternal service funds is reported with the governrnental activities.
Change in Net Position of Govemmental Activities
The accompanyíng notes are an integrøl part ofthefinancial statements.
1,421,518780,530
5,489 2,207,537
(3,036)
485,073
(2,218)
3,32r,577
(r2,444)
2,383
I,3 88,215(e02,620)
(s22)
(12,064)(1 s,876)154,104(l 8,7s0)
14,172
(3 1,606)(29,436)
566
2,559,621
1,920,711( 1,2 1 9,865)
trr-c-29
ß 2,097,147
Connectícut
THIS PAGE LEFT INTENTIONALLY BLANK
III-C-30

Connectícut
Propríetøry Fund Fínancíøl Støtements
Major Funds:
Universíty of Connectícut ønd Heølth Center:This fund is used to account for the operations of the University of Connecticut a comprehensive institution of highereducation, which includes the University of Connecticut Health Center and John Dempsey Hospital.
State Uníversitíes:This fund is used to account for the operations of the State University System which consist of four uriversities: Central, Eastem,Southern, and Western,
Connectícut Communíg Colleges:This fund is used to account for the operations of the State community colleges system, which consists of twelve regionalcommunity colleges.
Employment SecuríQ:This fund is used to account for the collection of unemployment insurance premiums from employers and the payment ofunemployment benefits to eligible claimants.
Cleøn lløter:This fund is used to account for resources used to provide loans to municipalities to finance waste water treatment projects.
Nonmøjor Funds:Nonmajor proprietary funds are presented, by fund type beginningonpage 124.
III-C-31

Statement of Net PositionProprietary FundsJune 30,2015(Expressed in Thousands)
Assets
Current Assets:
Cash and Cash Equivalents
Deposits with U.S. TreasuryInvestments
Receivables:
Accounts, Net of Allowances[¡ans, Net of AllowancesInterest
From Other GovemmentsDue from Other Funds
Inventories
Restricted Assets
Othe¡ Crirrent Assets
Totâl Current Assets
Noncurent Assets:
Cash and Cash Equivalents
InvestmentsReceivables:
Loans, Net ofAllowancesRestricted Assets
Capital Assets, Net of Accumulated Depreciation
Other Noncunent Assets
Total Noncunent Assets
Total Assets
Deferred Outflows of Resources
Unamortized Losses on Bond RefundingsOther Defened Outflows
Total Defened Outflows of Resources
LiabilitiesCunent Liabilities:
Accounts Payable and Accrued LiabilitiesDue to Other Funds
Due to Other Governments
Current Portion of Long-Tem ObligationsUneamed Revenue
Other Cunent Liabilities
Total Current Liabilities
Noncunent Liabilities:Noncunent Portion of long-Term Obligations
Tot¡l Noncunent Liabilities
Total Liabilities
Deferred Inflows of Resources
Other Deferred Inflows
Total Defened lnflows of Resources
Net Position (Deficit)Net Investment in Câpital Assets
Restricted For:Debt Service
Clean and Drinking Water Projects
Capital ProjectsNonexpendable Purposes
I-oans
Other Purposes
Unreshicted (Deficit)
Total Net Position (Deficit)
Business-Type ActiviliesEnterprise Funds
$
University ofConnecticut &Health Center
StateUniversities
ConnecticutCommunity
Colleges
14,295
I 1 8,135
1,222
EmploymentSecuritv
323,769 g
6s2 .
130,8022,088
199,518
10,ó55221,928
32,598
68,570
187,618
4,077
2,55247,254
4,504
197,787 ï 82,93s $ 776135,027
I 88,585
7,846625
922,010 5t2,362 2t6,s87 332,859
10,649
7352,300,148
3,430
2,331,0s2 1,353,464
197
649,126
649,323
I,42914,661
132,903
35,087
9,075
1,1 75,1 83
I,216
3,253,062 1,865,826 865,9 l0 312.459
5,200
5,200
3,253
3,253
206,726
t7,604
70,599
72,785
59,31ó4,131
24,160
223,75119,420
41,328
r,9932,879
428
44
757
367,714 330,778 46,628 801
460,684 369,231 3 8,035 I 03,054
460,684 369,23r 38,035 I 03,054
828,398 700,009 84,663 103,855
16,902
16,902
1,789,007
288,10513,09 1
3,74219,395
316,524
1,01ó,668
19,931
1 1 5,102
I 06,38025,721 229,004
649,126
467 20
$ 2,429,864 $
The accompanying notes arc an ¡ntegral pan ofthe fnanc¡al statements.
tIJ-c-32
1,152,168 $ 781,247 S 229,004

Business- Activlties GovernmentalActivities 'Funds
CleanWâter
OtherFunds
4,105 $ 42,441 $
7990
Total
InternalServiceFunds
$ ó51,813 $135,027
69,222
529,290
314,318
8,141
10,892
365,532
10,655
221,928
38,743
10,201
ó,ó81
4,226
208
671263,916
7,418
411
44,237
723o:o
8
275,850 95,893 2,355,561 21,987
251,576
12,703
738,099
336,071
75,763
77,08868,63926,988
438
461,671
62,451
83s, r08405,445
4,151,445
5,08457,4-45
1.338.449 248,916 5,921,204 57,445
1.614.299 344.809 8.276.76s 79.432
7,470
7,470
9,837
73,802
203
203
12,873
3,253
\6,126
11,264
10,300
328,51 5
21,735
757180,854
226,630
92,633
1,905
22,343
79
83,639 2t,564 851,t24 24,327
806,684 148,171 1,925,859 2,036
806,684 t48,171 1,925,859 2,036
890,323 169,735 2,776,983 26,363
16,902
16,902
558,906
172,540
4,508
139,912
36,879
4,508
ó98,818
288,10513,578
3,742145,706
895,770
57,445
(4,376)
(6,022) 3,448,779
$ 53,069$____J]]A46 175,277 g 5,499,006 $
III-C-33

Connecticut
Statement of Revenues, Expenses, andChanges in Fund Net PositionProprietary FundsFor The Fiscal Year Ended June 30, 2015
(Expressed in Thousands)
Business-Type Activities
Enterprise Funds
Operating Revenues
Charges for Sales and Services (Net ofallowances & discounts $1S1,094)
Assessments
Federal Grants, Contracts, and Other AidState Grants, Contracts, and Other AidPrivate Gifts and GrantsInterest on LoansOther
Total Operating Revenues
Operating ExpensesSalaries, Wages, and AdministrativeUnemployment CompensationClaims PaidDepreciation and AmortizationOther
Total Operating Expenses
Operating Income (Loss)
Nonoperating Revenue (Expenses)
Interest and Investment IncomeInterest and Fiscal ChargesOther - Net
Total Nonoperating Revenues (Expenses)
Income (Loss) Before Capital Contributions, Grantsn
and Transfers
Capital ContributionsFederal Capitalization GrantsTransfers InTransfers Out
Change in Net PositionTotal Net Position (Deficit) - Beginning (as restated)
Total Net Position (Deficit) - Ending
The øccompanyíng notes øre an ìntegrøl pørt of the ftnancíøl statements.
$ 1,059,810 $ 353,570 $ 96,760
University ofConnecticut &Health Center
176,303
31,93144,942
StateUniversities
ConnecticutCommunity
Colleges
45,64815,333
3,866
99,9659,0682,918
85,221 23,392 4,155
1,399,207 441,809 212,866
1,872,989 685,207 473,995
133,820
142,40460,24424,145
29,191
34,850
2,749,213 769,596 538,036
(751,006) (327,787\ (32s,110\
1,060(5,386)
55,8 16
t,144(lt,642)
2,835
131
1,529
51,490 (7,663) 1,660
(699,s16) (335,450) (323,510)
25,412
1,009,309
1,395
389,381 340,942
334,2042,095,660
61,326l,ogo,g42
17,432763,815
s 2,429,864 $ 1,152,169 $ 791,247
III-C-34
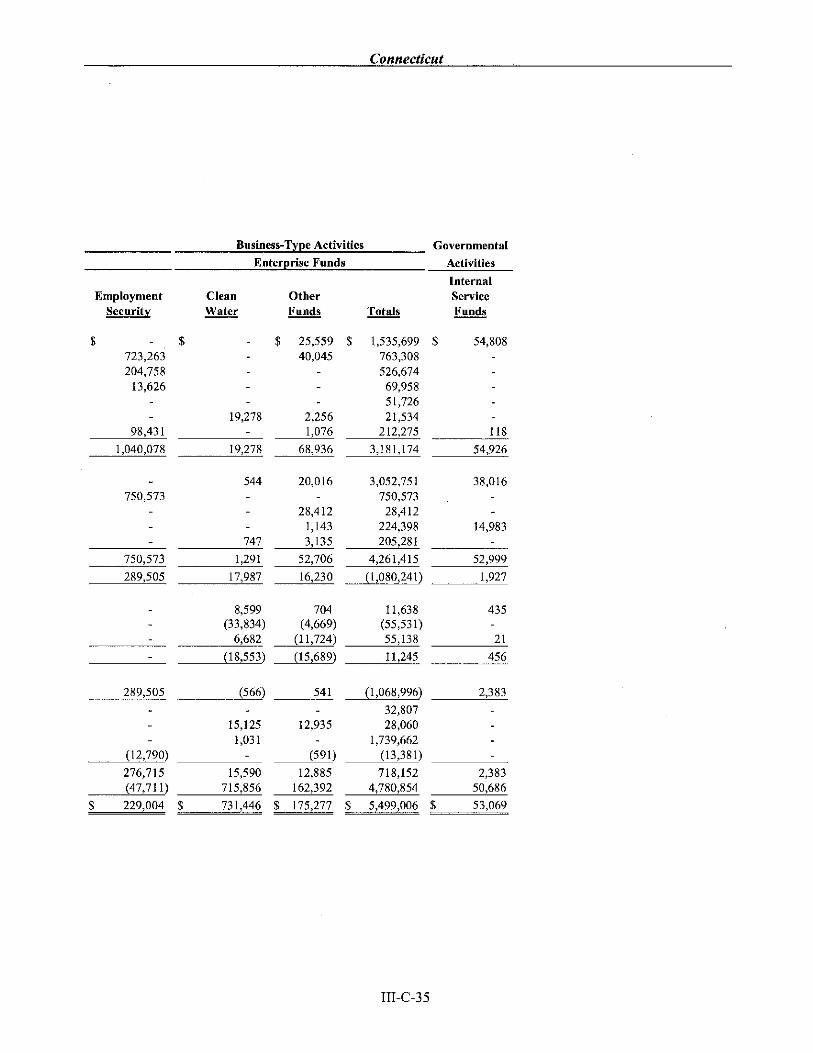
Connectícut
Business-Type ActivitiesEnterprise Funds
Governmental
Activities
EmploymentSecurity
723,263204,758
13,626
CleanWater
OtherFunds
$ 25,5s9 $
40,045
Totals
1,535,699 $763,308526,674
69,95851,72621,534
212,275
InternalServiceFunds
54,808
118
$ $
19,27898,431
19,278l,o4o,o7g
2,2561,076
68,936 3,191,774 54,926
750,573544 20,016
28,4127,143
747 135
3,052,751750,573
28,412224,398205,281
38,016
14,983
750,573
289,505
1,291
17,gg7
52,706 4,261,415
(r,080,241)16,230
8,599 704(33,834) (4,669)
6,692 (1r,724)(1s,689)(1 8,553) 11,245
(566) s4t (1,068,996)
52,999
1,927
I 1,638(55,53 1)
55, I 38
435
21
456
289,505 2,383
(12,790\
15,1251,031
12,935
(5el)12,895
162,392
ï__tra7
32,80728,060
1,739,662(13,38 1)
276,715(47,711)
15,590715,856
718,1524,180,854
2,39350,686
ï_____22ep! s 731,446 $ 5,499,006 $ 53,069
III.C-35
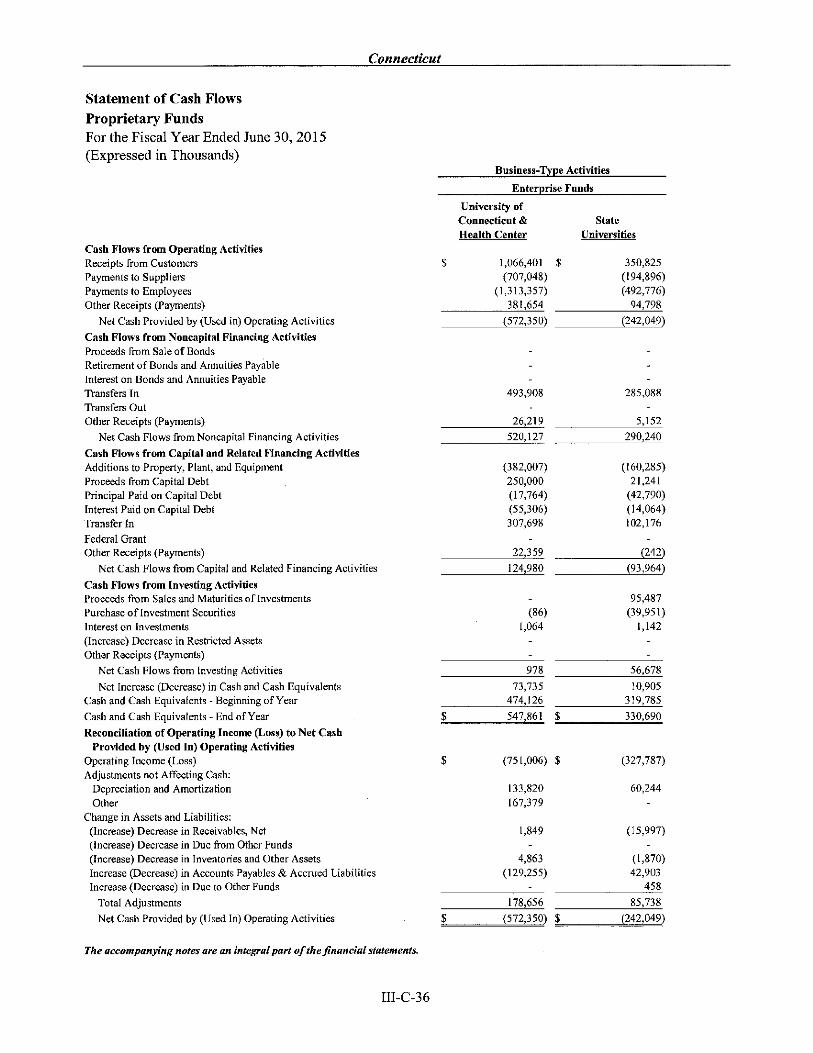
Connecticut
Statement of Cash Flows
Proprietary FundsFor the Fiscal Year Ended June 30, 2015(Expressed in Thousands)
Cash Flows from Operating ActivitiesReceipts from Customers
Payments to SuppliersPayments to EmployeesOther Receipts (Payments)
Net Cash Provided by (Used in) Operating Activities
Cash Flows from Noncapital Financing ActivitiesProceeds from Sale ofBondsRetirement of Bonds and Annuities Payable
Interest on Bonds and Annuities Payable
Transfers InTransfers OutOther Receipts (Payments)
Net Cash Flows from Noncapital Financing Activities
Cash Flows from Capital and Related Financing ActivitiesAdditions to Property, Plant, and Equipment
Proceeds from Capital DebtPrincipal Paid on Capital DebtInterest Paid on Capital DebtTransfer In
Federal GrantOther Receipts (Payments)
Net Cash Flows from Capital and Related Financing Activities
Cash Flows from Investing ActivitiesProceeds from Sales and Maturities of InvestmentsPurchase of Investment SecuritiesInterest on Investments(Increase) Decrease in Restricted Assets
Other Receipts (Payments)
Net Cash Flows from Investing Activities
Net Increase (Decrease) in Cash and Cash Equivalents
Cash and Cash Equivalents - Beginning of Year
Cash and Cash Equivalents - End ofYear
Reconciliation of Operating Income (Loss) to Net CashProvided by (Used In) Operating Activities
Operating Income (Loss)
Adjustments not Affecting Cash:
Depreciation and AmortizationOther
Change in Assets and Liabilities:(Increase) Decrease in Receivables, Net(Increase) Decrease in Due from Other Funds(Increase) Decrease in Inventories and Other Assets
Increase (Decrease) in Accounts Payables & Accrued LiabilitiesIncrease (Decrease) in Due to Other Funds
Total Adjustments
Net Cash Provided by (Used In) Operating Activities
The accompanying notes are øn integral pørt of the linancíal statements.
Business-Type Activities
Enterprise Funds
University ofConnecticut &Health Center
StateUniversities
$ 1,066,401(707,048)
(1,313,357)381,654
350,825(re4,8e6)(492,776)
94.798
$
(s72,3s0) (242,049)
493,908
26,219
285,088
r525
520,127 290,240
(382,007)
2s0,000(17,764)(55,306)
307,698
22,359
(r60,285)21,241
(42,790)(14,064)102,t76
(242)
124,980 (e3,e64)
(86)
I,064
95,487(3e,95 l )
1,142
978 56,678
10,90573,735474,126 319 785
$ s47,861 $ 330,690
$ (7s1,006) $ (327,787)
60,244133,820167,379
1,849 (ts,997)
(1,870)
42,903458
178,656 85,738
4,863(r29,2ss)
III-C-36
$__________€22¿Ð $___________we4Ð
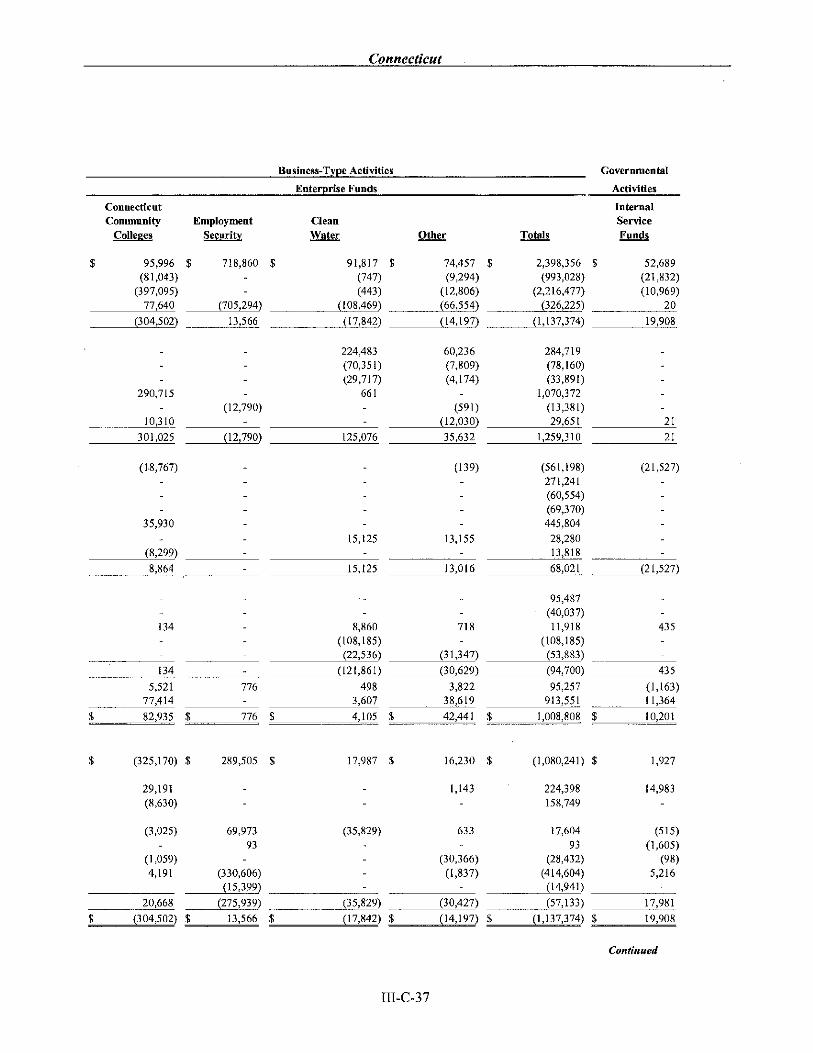
Connectìcut
Activities
Enterprise Funds
Governmental
Activities
ConnecticutCommunity
Colleses
EmploymentSecurify
718,860 $
Totals
2,398,3s6 $
(993,028)(2,216,477)
(326,22s1
91,8t7 $
(747)(443)
008,469)
74,457 $
(9,2e4)(12,806)(66,s54)
CleanWater Other
InternalServiceFunds
$ 9s,996 $(81,043)
(397,09s)77,640
52,689(21,832)(l 0,969)
20(705,294)
(304,s02\ t3,566 (17,842\ (t4,t97) l3 74
284,719(78,160)(33,891)
1,070,372(13,381)
29,651
19,908
290,71s
10,310
(12,790)
224,483(70,3 5l )(29,717)
661
60,236(7,809)(4,174)
(591)(12,030) 21
3 0l ,025 (12,790) 125,076 35,632 , 1,259,310 21
(18,767)
35,930
(8.299)15,125
(r3e)
1 3,1 55
(56 1 ,1 98)271,241(60,554)(69,370)
445,804
28,28013,818
(2t,s27)
8,864 l5 125 13,016 68,021 (2r,s27)
134 8,860
(l 08, r 85)(22,s36)
'718
(3r,347)
95,487(40,037)
11,918
(1 08,1 85)(53,883)
43s
134 (l2l,861) (30,629) (e4,700) 43s
5,52177,414
776 4983,607
3,82238,619
(l,l 63)11,364
95,257
913,551
$ 82,93s $ 776 $ 4,105 $ 42,441 $ 1.008.808 $ 10,201
$ (325,170) $
29,191(8,630)
(3,025)
(r,05e)4,191
289,505 $
69,97393
(330,606)
0 5,399)
t7,987 $
(3s,829)
16,230 $
1,143
633
(1,080,241) $
224,398158,749
1,927
14,983
(515)(1,60s)
(e8)
5,216
(30,3ó6)(1,837)
17,604
93
(28,432)(4r4,604)(r4,94t\
20,668 (275,939) (35,829) (30,427\ (s7,r33) 17,981
(17,842) $ 19,908$ (304,s02) $ r3,s66 $
rfi-c-37
(14,t97) $ (r,137,374) 5
Continued

Statement of Cash FlowsProprietary Funds (Continued)For the Fiscal Year Ended June 30, 2015
(Expressed in Thousands)
Reconciliation of Cash and Cash Equivalents to the Statement
of Net Assets
Cash and Cash Equivalents - Current
Cash and Cash Equivalents - Noncurrent
Cash and Cash Equivalents - Restricted
Noncash Investing, Capital, and Financing Activities:
Proceeds from Refunding Bonds
Amortization of Premiums/Discounts net Loss on Debt Refundings
Unrealized Gain on Investments
Capital Assets Acquired Through Gifts
Loss on Disposal of Capital Assets
Investment Under Corporated Licensing Agreement
Mortgage Proceeds held by Trustee in Construction Escrow
Accruals of Expenses related to Construction in Progress
Fixed Assets included in Accounts Payable
State Financed Plant Facilities
Business-Type Activities
Enterprise Funds
University ofConnecticut &Health Center
State
Universities
$ 323,169 $
1,429
222,663
197,796
132,902
$
$
547 861 $ 330,688
40,297
7,885
401
16,324
(2,332)
1,440
(37,45t)
2,262
5,526
7,395
III-C-38

Fíduciøry Fund Fínancíal Stutements
Investment Trust FundExternal Inv e stm ent Po ol :This fund is used to account for the portion ofthe Short-Term Investment Fund that belongs to participants that are not part ofthe State's financial reporting entity.
Prívøte Purpose Trust FundEscheat Securitíes:This fund is used to account for securities that are held by the State Treaswer for individuals under escheat laws of the State.
Individual fund descriptions and financial statements begin on the following pages
Pension (and Other Employee Benefit) Trust Funds, page 132Agency Funds, page 138
rrl-c-39

Connecticut
Statement of Fiduciary Net Positiontr'iduciary FundsJune 30,2015(Expressed in Thousands)
Private-Pension & Investment Purpose
Other Employee Trust Fund Trust FundBenefit External Escheat
Trust Funds Investment Pool SecuritiesAssets
Current:Cash and Cash Equivalents
Receivables:
Accounts, Net of AllowancesFrom Other Governments
From Other Funds
Interest
Investments (See Note 4)InventoriesSecurities Lending CollateralOther Assets
Noncurrent:
Due From Employers
Total Assets
LiabilitiesAccounts Payable and Accrued LiabilitiesSecurities Lending ObligationDue to Other Funds
Funds Held for Others
Total Liabilities
Net PositionHeld in Trust For:
Employees' Pension Benefits (Note 13)
Other Employee Benefits (Note 15)
Individuals, Organizations,
and Other Governments
Total Net Position
$ 108,375 $
1,860,559
240,962
$ s357,422 $
1,239
4,14178
AgencyFunds Total
465,797
240,962
24,9361,444
1,677
98629,541,256
26,1141,444
5,818
2,06330,546,251
28
I,860,558381,342
9991,004,995
15
28
593 380,734
31,780,194 1,006,009 ïlßé!!s 45,142
33,530,437
tt4 83,576
1,860,559
5,836
698,499
1t4 - s743,641 2,648,470
29,524,409
351,070
1,006,488
$ 30,881,967
593
38,3201,860,559
5,836698 499
1,904,715
29,524,409351,070
1,005,995 593
s 29,875,479 $ 1,005,895 $ 593
The øccompanyíng notes are øn íntegral part of thefinancíal støtements.
III-C-40

Statement of Changes in Fiduciary Net PositionFiduciary FundsFor the Fiseal Year Ended June 30, 2015
(Expressed in Thousands)
AdditionsContributions:
Plan Members
State
Municipalities
Total Contributions
Investment Income
Less: Investment Expense
Net Investment Income
Escheat Securities ReceivedPool's Share TransactionsTransfers InOther
Total Additions
DeductionsAdministrative Expense
Benefit Payments and RefundsEscheat Securities Returned or Sold
Distributions to Pool ParticipantsTransfer Out
Other
Total Deductions
Change in Net Position Held In Trust For:Pension and Other Employee BenefitsIndividuals, Organizations, and Other Governments
Net Position - Beginning (as restated)
Net Position - Ending
Pension & InvestmentOther Employee Trust Fund
Benefit ExternalTrust Funds Investment Pool
$ 613,551 $
2,944,979tt4,28l
Private-Purpose
Trust FundEscheat
Securities Total
$ $ 613,551
2,944,979114,281
3,672,751 3,672,751
909,945(91,8s3)
2,248(s3 1)
912,193(92,384)
818,092 717 8 19,809
83,6914t,169 41,169
83,691
8,31382,084
8,31382,084
4.581 ,240 85,408 4l 169 4,707,817
7834,337,917
8,31375
1,717
41,819
(635)
7834,337,917
41,8191,717
8,313(560)
4,346,988 1,717 4t 184 4,389,889
234,252
29,641,22783,691
922,204(ls)608
234,252
83,67630,564,039
s 29,87s,479 S 1,005,895 $ 593 $ 30,881,967
The accompanyíng notes øre øn integrøl part of the Jínanciøl statements.
III-C-4I

Connecticut
THIS PAGE LEFT INTENTIONALLY BLANK
IIT-C-42

Component Unit Fínancíul Statements
Major Component Unìts:
Connecticut Housíng Fínance Aathorìty:The Connecticut Housing Finance Authority is a public instrumentality and political subdivision ofthe State created for the purpose ofincreasing the housing supply and encouraging and assisting in the purchase, development, and construction ofhousing for low andmoderate income families throughout the State.
C onnecticut Airport Aut h o r ity :The Connecticut Airport Authority, a public instrumentality and political subdivision of the State of Connecticut was established onJuly l, 2011, to operate Bradley Intemational Airport as well as the other State-owned (general aviation) airports.
The Connectícut Lottety Corporatìon:The Connecticut Lottery Corporation, a public instrumentality and political subdivision of the State of Connecticut was created onJuly l, 1996 for the purpose ofgenerating revenues for the State ofConnecticut's General Fund through the operation ofa lottery.
Nonmajor:The nonmajor component units are presented beginning onpage 742
III-C-43

Connecticut
THIS PAGE LEFT INTENTIONALLY BLANK
TII-C-44
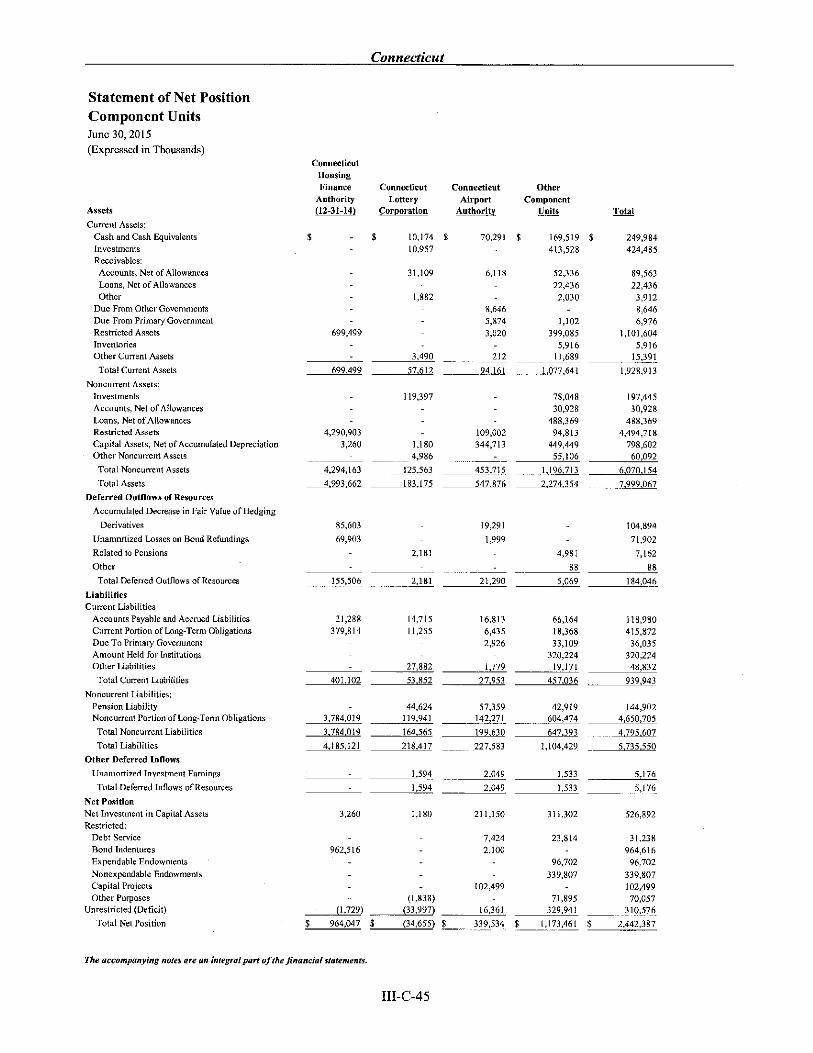
Connectícut
Statement of Net PositionComponent UnitsJune 30,2015(Expressed in Thousands)
Assets
Cunent Assets:
Cash and Cash Equivalents
Investments
Receivables:
Accounts, Net of Allowances
Loans, Net of AllowancesOther
Due From Other Govemments
Due From Primary Govemment
Restricted Assets
InventoriesOther Current Assets
Total Curent Assets
Noncurrent Assets:
lnvestmentsAccounts, Net of Allowances
Loans, Net of AllowancesRestricted Assets
Capital Assets, Net of Accumulated DepreciationOther Noncurent Assets
Total Noncunent Assets
Total Assets
Deferred Outflows of Resources
Accumulated Decrease in Fair Value ofHedging
Derivatives
Unamortized I-osses on Bond Refundings
Related to Pensions
Other
Total Deferred Outfl ows of Resources
LiabilitiesCunent Liabilities:
Accounts Pâyable and Accrued LiabilitiesCurrent Portion of Inng-Tem ObligationsDue To Primary Gov€mentAmount Held for lnstitutionsOther Liabilities
Total Cunent Liabilities
Noncunent Liabilities:Pension LiabilityNoncunent Pofion of Long-Term Obligations
Total Noncurent Liabilities
Total Liabilities
Other Deferred Inflows
Unamortized Investment Eamings
Total Defened Inflows ofResources
Net PositionNet Investment in Capital Assets
Restricted:Debt Service
Bond Indentures
Expendable Endowments
Nonexpendable Endowments
Capital Projects
Other Purposes
Unrestricted (Deficit)
Total Net Position
ConnecticutAirport
Authoritv
$ 10,174 $10,957
70,291 $
3 t,109 ó,118
I,882
699,499
8,646
5,8743,020
699.499 57.612 94.161
ConnecticutHousingFinance
Authorityû2-31-14)
ConnecticutLottery
CorDoration
OtherComponent
Un¡ts Total
249,984424,485
89,563
22,4363,9128,646
6,976
l,l0l,ó045,916
15,391
1.928.91 3
197,44530,928
488,3694,494,718
798,60260,092
6.070.154
7.999.067
$ 169,519 $
413,528
s2,33622,4362,030
1,102399,085
5,916
I I,689
1.077 .641
4,290,9033,260
4.294,163
4.993.662
tt9,397
I,1804,986
125.563
1 83.1 75
109,002344,713
453.715
547.876
78,048
30,928488,369
94,81 3
449,449
55,106
1.196.713
2.274.354
85,603
69,903
2,181 4,981
88
104,894
7l,9027,162
88
19,291
1,999
155,506
21,288379,814
14,715
lt,25s16,813
6,4352,926
184,046
1 1 8,980
415,87236,035
320,224
48,832
939.943
144,9024,650,705
4.795.607
5.735-550
181 2l,290 5,069
401.102 53.852
66,164I 8,3ó8
33,109
320,224
19 71
27.953 457 .036
779
- 44,624
3,784,019 tt9,94l3.784.019 ló4.565
4,185.12i 218.417
57,359 42,919142,271 604,474
199.630 647.393
227,583 1,104.429
1,594 2,049 1,s33
1,594 2,049 1,533
I,t 80 2t1,150 311,302
7,424
2,10023,814
96,702
339,807
5,176
5,17 6
3,260
962,516
- t,,*r*l to2'+99
(1,729) (33,997) 16,361
L__2þ!p!1 $_____€1f¡Ð $ ___!l2tiL
71,895329,941
526,892
3l,238964,616
96,702
339,807
102,499
70,057
310,576
The accompanying notes are an integral part olthe frnøncial stßtements,
III-C-45
$ 1,173,461 g 2,442,387

Connectìcut
Statement of ActivitiesComponent UnitsFor The Fiscal Year Ended June 30, 2015
(Expressed in Thousands)
Expensesg 177,765
7,149,37994,586
405,039
s 1,826,769
The øccompanyíng notes are an íntegrøl pørt of the jìnancíal statements.
Program Revenues
FunctionsÆroqramsConnecticut Housing Finance Authority (12/31 / 14)Connecticut Lottery CorporationConnecticut Airport AuthorityOther Component Units
Total Component Units
Charges forServices
$ 193,068
1,144,031
89,918
339,479
$ 1,766,496
OperatingGrants and
Contributions$-
CapitalGrants and
Contributions$-
13,1 36
72,00138,315
$ 38,315 $ 85,137
General Revenues:
Investment Income
Special ltem: Ch4nge in Net Position
Total General Revenues
and Contributions
Change in Net PositionNet Position - Beginning (as restated)
Net Position - Ending
ITT-C-46

Connecticut
Net (Expense) Revenue and
Changes in Net Position
ConnecticutHousing
FinanceAuthority(12-3t-t4l
$ 15,303 $
ConnecticutLottery
CorDoration
ConnecticutAirport
Authority
OtherComponent
Units$ $ $
(5,348)
44,756
Totals15,303(5,348)
8,468
44,7s68,468
15,303 (5,348) 8,468 44,756 63 t79
34,410 7,185 127 5,2151,259
46,937
1,259
34,410 1851 127 6,474 49,196
49,713
914,334
1,837(36,492)
8,595
330,93951,230
1,122,23rlll,375
2,337,012
s 964,041 $ (34,65s) $ 339,534 s 1,173,461 g 2,442,387
Ifr-c-47

Connectìcut
THIS PAGE LEFT INTENTIONALLY BLANK
III-C-48

Connectìcut
Notes to the Financial StatementsJune 30, 2015
Note 1 Summary of Significant Accounting Policiesa. Basis of PresentationThe accompanying financial statements of the State ofConnecticut have been prepared in conformity with generallyaccepted accounting principles as prescribed inpronouncements of the Govemmental Accounting StandardsBoard, except for the financial statements of the University ofConnecticut Foundation, Incorporated (a component unit).Those statements are prepared according to generally acceptedaccounting principles as prescribed in pronouncements of theFinancial Accounting Standards Board.
b. Reporting EntityFor financial reporting purposes, the State's reporting entityincludes the "primary government" and its "component units."The primary government includes all funds, agencies,departments, bureaus, commissions, and component units thatare considered an integral part of the State's legal entity.Component units are legally separate organizations for whichthe State is financially accountable. Financial accountabilityexists if (1) the State appoints a voting majority of theorganization's goveming board, and (2) there is a potential forthe organization to provide specific financial benefits to, orimpose specific financial burdens on the State. The Statereported as component units the following organizations thatare public instrumentalities and political subdivisions of theState (public authorities).
Connectìcut Housíng Fínance Authoríty (CHFA)CHFA was created for the purpose of increasing the housingsupply and encouraging and assisting in the purchase,development, and construction of housing for low andmoderate-income families and persons throughout the State.The Authority's fiscal year is for the period ending onDecember 31,2014.
Connectícut Aírport Authorìty (CAA)The Connecticut Airport Authority was established in July2011 to develop, improve and operate Bradley InternationalAirport and the state's five general aviation airports(Danielson, Groton-New London, Hartford-Brainard,Waterbury-Oxford, and Windham airports).
Møteríøls, Innovatíon, and Recyclìng Authoríty (MIRA)MIRA is responsible for the planning, design, construction,financing, management, ownership, operations andmaintenance of solid waste disposal, volume reduction,recycling, intermediate processing, resource recovery andrelated support facilities necessary to carry out the State'sSolid Waste Management Plan.
C onnectíc ut Hígher E duc atìo n SupplementøI Loøn Aulh oríty(CHESLA)CHESLA was created to assist students, their parents, andinstitutions of higher education to finance the cost of highereducation through its bond funds. Effective fiscal year 2013,CHESLA was statutorily consolidated into CHEFA, makingCHESLA a subsidiary of CHEFA.
ConnectÍcut Heølth and Educøtíonal Facílítìes Authoríty(cHEFA)CHEFA was created to assist certain health care institutions,institutions of higher education, and qualified for-profit andnot-for-profit institutions in the financing and refinancing ofprojects to be undertaken in relation to programs for theseinstitutions.
Connectìcut Student Loan Foandøtíon (CSLF)CSLF was established as a Connecticut State charterednonprofit corporation established pursuant to State ofConnecticut Statue Chapter 187a for the purpose of improvingeducational opportunity. CSLF is empowered to achieve thisby originating and acquiring student loans and providingappropriate service incident to the administration of programs,which are established to improve educational opportunities.CSLF no longer originates or acquires student loans.
In July 2014, CSLF was statutorily consolidated with CHEFAas a subsidiary and became a quasi-public agency of the State
ofConnecticut.
Capital Regíon Development Authoríty (CR"DA)CRDA was established July 1, 2012 to market the major sports,convention, and exhibition venues in the region. CRDAbecame the successor to the Capital City EconomicDevelopment Authority, which was established in 1998.
Connecticut Innovøtíons, Incorporøted (C I)CI was established to stimulate and promote technologicalinnovation and application of technology within Connecticutand encourage the development of new products, innovations,and inventions or markets in Connecticut by providing financialand technical assistance.
Connectícut Green Bønk (CGB)CGB was established on July 1,2011 through Public Act 1l-80as a quasi-public agency that supersedes Connecticut CleanEnergy Fund. CGB uses public and private funds to financeand support clean energy investment in residential, municipal,small business and larger commercial projects and stimulatedemand for clean energy and the deployment of clean energysources within the state.
Connecticut Lottery Corporøtíon (CLC)The corporation was created in 1996 for the purpose ofgenerating revenues for the State through the operation of alottery.
CHFA, MIRA, CHESLA, CHEFA, CSLF, and CRDA arereported as component units because the State appoints a votingmajority of the organization's goveming board and iscontingently liable for the organization's bonded debt that issecured by a special capital reserve fund, or other contractualagreement.
CI and CGB are reported as component units because the Stateappoints a voting majority of the organization's governingboard and has the ability to access the resources of theorganization.
III-C-49

Connecticut
The Connecticut Lottery Corporation is reported as acomponent unit because the State appoints a voting majority ofthe corporation's governing board and receives a significantamount ofrevenues from the operations ofthe lottery.
The Connecticut Airport Authority is reported as a componentunit because the nature and significance of its relationship withthe State are such that it would be misleading to exclude theauthority from the State's reporting entity.
In addition, the State also includes the following non-governmental nonprofit corporation as a component unit.
Uníversíty of Connectícut Foundatíon, IncorporøtedThe Foundation was created exclusively to solicit, receive, andadminister gifts and financial resources from private sources forthe benefit of all campuses and programs of the University ofConnecticut and Health Center, a major Enterprise fund. TheFoundation is reported as a component unit because the natureand significance of its relationship with the State are such that itwould be misleading to exclude the Foundation from the Sate'sreporting entity.
Component units are reported in separate columns and rows inthe government-wide financial statements (discretepresentation) to emphasize that they are legally separate fromthe primary govemment. Financial statements for the majorcomponent units are included in the accompanying financialstatements after the fund financial statements. Auditedfinancial statements issued separately by each component unitcan be obtained from their respective administrative offices.
c. Government-wide and Fund Financial StatementsGovernment-wíde Fìnønciøl StatementsThe Statement of Net Position and the Statement ofActivities report information on all of the nonfiduciaryactivities of the primary govemment and its componentunits. These statements distinguish between thegovernmental and business-type activities of the primarygovernment by using sgparate columns and rows.Govemmental activities are generally financed through taxesand intergovemmental rev€nues. Business-type activities are
financed in whole or in part by fees charged to externalparties. For the most part, the effect ofinterfund activity has
been removed from these statements.
The Statement of Net Position presents the reporting entity'sassets, deferred outflows of resources, liabilities, deferredinflows of resourcesn and net position. Net position isreported in three components:
l. Net Investment in Capital Assets - This component ofnet position consists of capital assets, net of accumulateddepreciation, reduced by the outstanding balances ofbonds issued to buy, construct, or improve those assets.Deferred outflows of resources and deferred inflows ofresources that are attributable to the purchase,
construction, or improvement of those assets or relateddebt should be included in this component ofnet position.
2. Restricted - This component of net position consists ofrestricted assets reduced by liabilities and deferredinflows ofresources related to those assets.
3. Unrestricted - This component of net position is theremaining balance of net position, after the determinationof the other two components of net position.
The Statement of Activities demonstrates the degree towhich the direct expenses of a given function or segment isoffset by program revenues. Direct expenses are those thatare clearly identifiable with a specific function or segment.Indirect expenses are not allocated to the various functionsor segments. Program revenues include a) fees, fines, andcharges paid by the recipients of goods or services offeredby the functions or segments and b) grants and contributionsthat are restricted to meeting the operational or capital needs
of a particular function or segment. Revenues that are notclassified as program revenues, including all taxes, arereported as general revenues.
Fund Fínancíal StøtementsThe fund financial statements provide information about theState's funds, including its fiduciary funds and blendedcomponent units. Separate statements for each fund category(govemmental, proprietary, and fiduciary) are presented.The emphasis of fund financial statements is on majorgovernmental and enterprise funds, each displayed in a
separate column. All remaining governmental and enterprisefunds are aggregated and reported as nonmajor funds.
In the governmental fund financial statements, fund balance(difference between assets and liabilities) is classified as
nonspendable, restrictedn and unrestricted (committed,assigred, or unassigned). Restricted represents thoseportions of fund balance where constraints on the resourcesare extemally imposed or imposed by law throughconstitutional provisions or enabling legislation. Committedfund balance represents amounts that can only be used forspecific purposes pursuant to constraints by formal action ofthe Legislature, such as appropriation or legislation.Assigned fund balance is constrained by the Legislature'sintent to be used for specific uses, but is neither restrictednor committed.
The State reports the following major governmental funds:
General Fund - This is the State's primary operating fund. Itis used to account for all financial resources which are notrequired to be accounted in other funds and which are spent
for those services normally provided by the State (e.g.,health, social assistance, education, etc.).
Debt Sewìce - This fund is used to account for the resourcesthat are restricted for payment of principal and interest onspecial tax obligation bonds ofthe Transportation fund.
Trønsportøtioz - This fund is used to account for motor fueltaxes, vehicle registration and driver license fees, and otherrevenues that are restricted for the payment of budgetedappropriations of the Transportation and Motor VehiclesDepartments.
III-C-50
Connecticut
Restricted Grønts and Accoants - This fund is used toaccount for resources which are restricted by Federal andother providers to be spent for specific purposes.
Grønt ønd Loøn Progrø¡zs - This fund is used to accountfor resources that are restricted by state legislation for thepurpose of providing grants and/or loans to municipalitiesand organizations located in the State.
The State reports the following major enterprise funds:
Uníversìty of Connectícut & Health Center - This fund isused to account for the operations of the University ofConnecticut, a comprehensive institution of highereducation, which includes the University of ConnectiçutHealth Center and John Dempsey Hospital.
Støte Univers¿'¡¿'¿s - This fund is used to account for theoperations ofthe State University System which consists offour universities: Central, Eastern, Southern, and Western.
Connecticut Communíty Colleges - This fund is used toaccount for the operations of the State community collegessystem, which consists of twelve regional communitycolleges.
Colleges and universities do not have separate corporatepowers and sue and are sued as part of the state with legalrepresentation provided through the state Attorney General'sOffice. Since the colleges and universities are legally part ofthe state their financial operations are reported in the state'sfinancial statements using the fund structure prescribed byGASB.
Employment SecuríE - This fund is used to account forunemployment insurance premiums from employers and thepayment of unemployment benefits to eligible claimants.
Clean ll/uter - This fund is used to account for resourcesused to provide loans to municipalities to hnance wastewater treatment facilities.
In addition, the State reports the following fund types:
Internal Sewice Funds - These funds account for goods andservices provided to other agencies of the State on a cost-reimbursement basis. These goods and services includeprisoner-built office furnishings, information servicessupport, telecommunications, printing, and other services.
Pensíon Trust Funds - These funds account for resourcesheld in the custody of the state for the members andbeneficiaries of the State's pension plans. These plans arediscussed more fully in Notes 10 and I l.
Other Post-Employment BeneJìt (OPEB) Trust Funds-These funds account for resources held in trust for themembers and beneficiaries of the state's other post-employment benefit plans which are described in notes 13
and 14.
Inveshnent Trust Fund - This fund accounts for the extemalportion of the State's Short-Term Investment Fund, aninvestment pool managed by the State Treasurer.
Prívate-Purpose Trast Fund - This fund accounts forescheat securities held in trust for individuals by the StateTreasurer.
Agency Funds - These fi¡nds account for deposits,investments, and other assets held by the State as an agentfor inmates and patients of State institutions, insurancecompanies, municipalities, and private organizations.
d. Measurement Focus and Basis of AccountingGovernment-wide, Propríetary, ønd Fiducíary FundFínancíal StøtementsThe govemment-wide, proprietary, and fiduciary fundfinancial statements are reported using the economìcresources measurement focus and the accrual basis ofaccounting. Revenues are recorded when earned andexpenses are recorded at the time the liabilities are incurred,regardless ofwhen the related cash flows take place. Taxesand casino gaming payments are recognized as revenues inthe period when the underlying exchange transaction hasoccurred. Grants and similar items are recognized asrevenues in the period when all eligibility requirementsimposed by the provider have been met.
Proprietary funds distinguish operating revenues andexpenses from nonoperating items, Operating revenues andexpenses generally result from providing services andproducing and delivering goods in connection with aproprietary fund's principal ongoing operations. Theprincipal operating revenues of the State's enterprise andintemal service funds are charges to customers for sales andservices, assessments, and intergovernmental revenues.Operating expenses for enterprise and internal service fundsinclude salaries, wages, and administrative expenses,unemployment compensation, claims paid, and depreciationexpense, All revenues and expenses not meeting thisdefinition are reported as nonoperating revenues andexpenses.
Governmental Fund Fínøncíal StøtementsGovernmental funds are reported using the current financialresources m€asurem€nt focus and the modified accrual basisof accounting, Under this method, revenues are recognizedwhen measwable and available. The State considers taxesand other revenues to be available if the revenues arecollected within 60 days after year-end. Exceptions to thispolicy are federal grant revenues, which are considered to beavailable if collection is expected within 12 months afteryear-end, and licenses and fees which are recognized as
revenues when the cash is collected. Expenditures arerecorded when the related fund liability is incurred, exceptfor principal and interest on general long-term debt,compensated absences, and claims andjudgments, which arerecognized as expenditures to the extent they have matured.General capital asset acquisitions are reported as
expenditures in governmental funds. Proceeds of general-long term debt and acquisitions under capital leases arereported as other financing sources.
ilI-C-s1
Connecticut
e. Budgeting ProcessBy statute, the Governor must submit the State budget to theGeneral Assembly in February of every other year. Prior toJune 30, the General Assembly enacts the budget through thepassage ofappropriation acts for the next two fiscal years andsets forth revenue estimates for the same period for thefollowing funds: the General Fund, the Transportation Fund,the Mashantucket Pequot Fund, the Workers' CompensationAdministration Fund, the Banking Fund, the ConsumerCounsel and Public Utility Control Fund, the Insurance Fund,the Criminal Injuries Fund, the Soldiers, Sailors, and MarinesFund, and the Regional Market Operations Fund. Under theState Constitution, the Governor has the power to veto anypart of the itemized appropriations bill and to accept theremainder of the bill. However, the General Assembly mayseparately reconsider and repass the disapproved items by a
two-thirds majority vote of both the Senate and the House.
Budgetary control is maintained at the individual appropriationaccount level by agency as established in authorizedappropriation bills and is reported in the Annual Report oftheState Comptroller. A separate document is necessary becausethe level of legal control is more detailed than reflected in theCAFR. Before an agency can utilize funds appropriated for aparticular purpose, such funds must be allotted for the specificpurpose by the Govemor and encumbered by the Compkollerupon request by the agency. Such funds can then be expendedby the Treasurer only upon a warrant, draft or order of theComptroller drawn at the request of the responsible agency.The allotment process maintains expenditure control overspecial revenue, enterprise, and intemal service funds that arenot budgeted as part ofthe annual appropriation act.
The Governor has the power under Connecticut statute tomodify budgetary allotment requests for the administration,operation and maintenance of a budgeted agency. However,the modification cannot exceed 3 percent of the fund or 5percent of the appropriation amount. Modihcations beyondthose limits, but not in excess of 5 percent of the total fundsrequire the approval of the Finance Advisory Committee. TheFinance Advisory Committee is comprised of the Governor,the Lieutenant Governor, the Treasurer, the Comptroller, twosenate members, not of the same political party, and threehouse members, not more than two of the same political party.Additional reductions ofappropriations ofmore than 5 percentof the total appropriated fund can be made only with theapproval of the General Assembly.
All funds, except fiduciary funds, use encumbranceaccounting. Under this method of accounting, purchaseorders, contracts, and other commitments for the expenditrnesofthe fund are recorded in order to reserve that portion oftheapplicable appropriation. All encumbrances lapse at year-endand, generally, all appropriations lapse at year-end except forcertain continuing appropriations (continuing appropriationsare defined as carryforwards of spending authority from onefiscal budget into a subsequent budget). The continuingappropriations include: appropriations continued for a one-month period after year-end which are part of a program thatwas not renewed the succeeding yeari appropriationscontinued the entire succeeding year, as in the case ofhighwayand other capital construction projects; and appropriations
continued for specified amounts for certain special programs.Carryforward appropriations are reported as reservations of thefund balance in the financial statements.
The budget is prepared on a "statutoryo' basis of accountingthat utilizes the accounting standards that were applied in thebudget act and related legislation. Commencing in Fiscal Year2014, appropriations were made to legislatively budgetedfunds to account for expense accruals. The actual expenseaccruals were posted using the same methodology describedabove for the governmental fund financial statements.Revenues were recognized when received except in theGeneral Fund and Transportation Fund. In those two fundscertain taxes and Indian gaming payments are recognizedwithin a statutory accrual period as approved by the StateComptroller. The state's three major tax categories (thepersonal income tax, the sales and use tax, and the corporationtax), among other taxes, are subject to statutory accrual. Acomparison of actual results of operations recorded on thisbasis and the adopted budget is presented in the financialstatements for the General and Transportation funds. Duringthe 2015 fiscal year, the original adopted budget was adjustedby the General Assembly and the Finance AdvisoryCommittee.
Budget Reserve Fund ("Rainy Day Fund")In accordance with Section 4-30a of the Connecticut StateStatues, thé State maintains a Budget Reserve ("Rainy Day")Fund. Per section 4-30a after the accounts for the GeneralFund have been closed for each fiscal year and theComptroller has determined the amount of unappropriatedsurplus, and after any required transfers have been made, thesurplus shall be transferred by the State Treasurer to theBudget Reserve Fund. Moneys shall be expended onlywhen in any fiscal year the Comptroller has determined theamount of a deficit applicable with respect to theimmediately preceding fiscal year, to the extent necessary.
Historically, resources from the Rainy Day Fund have onlybeen expended during recessionary periods to cover overallbudget shortfalls after other budgetary measures have beenexhausted. Under the provisions of Section 4-30a of theState Statues, a deposit of $248.5 million was transferredduring fiscal yeat 2015 based on flrscal year 2014 surplus.During fiscal year 2016 a withdrawal of $ 1 13.2 million willbe made to cover the budgetary shortfall in fiscal year 2015.
After the transfer is made to cover the shortfall in fiscal year2015 the Budget Reserve Fund will have a balance of$406.0million. Effective February 28,2003, the amount on depositcannot exceed 10 percent of the net General Fundappropriations for the current fiscal year.
f. Assets and LiabilitiesCash ønd Cash Equívalents (see Note 3)In addition to petty cash and bank accounts, this accountincludes cash equivalents - short-term, highly liquidinvestments with original maturities of three months or lesswhen purchased. Cash equivalents consist of investments inthe Short-Term Investment Fund which are reported at thefund's share price.
TI-C-52

Connectícut
a
In the Statement of Cash Flows, certain Enterprise fundsexclude from cash and cash equivalents investments in STIFreported as noncurrent or restricted assets,
Investments (see Note 3)Investments include Equity in Combined Investment Fundsand other investments. Equity in Combined Investment Fundsis reported at fair value based on the funds' curront share price.Other investments are reported at fair value, except for thefollowing investments which are reported at cost or amortizedcost:
a
a
Nonparticipating interest-eaming investment contracts.
Money market investments that mature within one year orless at the date oftheir acquisition.
Investments of the External Investment Pool fund (anInvestment Trust fund).
The fair value of other investments is determined based onquoted market prices except for:
The fair value of State bonds held by the Clean Water andDrinking Water funds (Enterprise funds) which isestimated using a comparison of other State bonds.
The fair value ofsecurities not publicly traded held by theConnecticut Innovations, Incorporated, a ComponentUnit. The fair value of these investments is determined byan independent valuation committee of the Corporation,after giving consideration to pertinent information aboutthe companies comprising the investments, including butnot limited to recent sales prices ofthe issuer's securities,sales growth, progress toward business goals, and otheroperating data.
The State invests in derivatives. These investments are heldby the Combined Investment Funds and are reported at fairvalue in each fund's statement of net position.
InventoriesInventories are reported at cost. Cost is determined by thefirst-in first-out (FIFO) method. Inventories in thegovernmental funds consist of expendable supplies held forconsumption whose cost was recorded as an expenditure at thetime the individual inventory items were purchased. Reportedinventories in these funds are offset by a fund balancedesignation (nonexpendable) to indicate that they aÍeunavailable for appropriation.
Cøpítøl Assets ønd DepreciatíonCapital assets include property, plant, equipment, andinfrastructure assets (e.g. roads, bridges, railways, and similaritems), are reported in the applicable govemmental orbusiness-type activities columns in the govemment-widefinancial statements. Capital assets are defined by the State as
assets with an initial individual cost of more than $1,000 and
an estimated useful life in excess of one year, except for theUniversity of Connecticut which uses an initial individual costof more than $5,000. Such assets are recorded at historicalcost or estimated fair market value at the date of donation.
Collections of historical documents, rare books andmanuscripts, gutrs, paintings, and other items are notcapitalized. These collections are held by the State Library forpublic exhibition, education, or research; and are keptprotected, cared for, and preserved indefinitely. The costs ofnormal maintenance and repairs that do not add to the value ofthe asset or materially extend assets lives are also notcapitalized.
Major outlays for capital assets and improvements are
capitalized as projects are constructed. Interest incurred duringthe construction phase of capital assets of business-typeactivities is included as part of the capitalized value of theassets constructed.
Property, plant, and equipment of the primary government aredepreciated using the straight line method over the followingestimated useful lives:'
Assets Years
Buildings
Improvements Other than Buildings
Machinery and Equipment
Infrastructure
Securílíes Lendíng Transactions (see Note 3)Assets, liabilities, income, and expenses arising from securitieslending transactions of the Combined Investment Funds are
allocated ratably to the participant funds based on their equityin the Combined Investment Funds.
Escheøt PropertyEscheat property is private property that has reverted to theState because it has been abandoned or has not been claimedby the rightful owners for a period oftime. State law requiresthat all escheat property receipts be recorded as revenue in theGeneral fund. Escheat revenue is reduced and a fund liabilityis reported to the extent that it is probable that escheat propertywill be refunded to claimants in the future. This liability isestimated based on the State's historical relationship betweenescheat property receipts and amounts paid as refunds, takinginto account current conditions and trends,
Deferred Outflows of ResourcesDeferred outflows ofresources are defined as the consumptionofnet assets in one period that are applicable to future periods.These amounts are reported in the Statement of Net Positionon the government-wide and fund financial statements in aseparate section, after total assets.
Unearned RevenuesIn the government-wide and fund financial statements, thisliability represents resources that have been received, but notyet eamed.
Long-term OhlígatíonsIn the government-wide and proprietary fund financialstatements, long-term debt and other long-term obligations arereported as liabilities in the applicable governmental activities,business-type activities, or proprietary fund statement of netposition. Bond premiums and issuance costs are deferred andamortized over the life of the bonds using the straight line
40
l0-20
5-30
20-28
III-C-53

Connecticat
method. Bonds payable are reported net of the applicablebond premium. Bond issuance costs are reported as anexpense in the year they are incurred. Other significant long-term obligations include the net pension liability, OPEBobligation, compensated absences, workers' compensationclaims, and federal loans. In the fund financial statements,governmental fund types recognize bond premiums and bondissuance costs during the current period. The face amount ofdebt issued is reported as other financing sources. Premiumsreceived on debt issuances are reported as other financingsources. Issuance costs, whether or not withheld from theactual debt proceeds received, are reported as debt serviceexpenditures.
C ap ital Appr e c íatìo n Bo nd sCapital appreciation (deep-discount) bonds issued by the State,unlike most bonds, which pay interest semi-annuallyn do notpay interest until the maturity of the bonds. An investor whopurchases a capital appreciation bond at its discounted priceand holds it until maturity will receive an amount which equalsthe initial price plus an amount which has accrued over the lifeof the bond on a semiannual compounding basis. The netvalue ofthe bonds is accreted (the discount reduced), based onthis semiannual compounding, over the life of the bonds. Thisdeep-discount debt is reported in the govemment-widestatement ofnet position at its net or accreted value rather thanat face value.
Compensated AbsencesThe liability for compensated absences reported in thegovernment-wide and proprietary fund statements consist ofunpaid, accumulated vacation and sick leave balances. Theliability has been calculated using the vesting method, inwhich leave amounts for both employees who currently areeligible to receive termination payments and other employeeswho are expected to become eligible in the future to receivesuch payments upon termination are included.
Vacation and sick policy is as follows: Employees hired on orbefore June 30, 1977, and managers regardless of date hiredcan accumulate up to a maximum of 120 vacation days.Employees hired after that date can accumulate up to a
maximum of 60 days. Upon termination or death, theemployee is entitled to be paid for the full amount of vacationdays owed. No limit is placed on the number of sick days thatan employee can accumulate. However, the employee isentitled to payment for accumulated sick time only uponretirement, or after ten years of service upon death, for anamount equal to one-fourlh ofhis/her accrued sick leave up toa maximum payment equivalent to sixty days.
C. Derivative InstrumentsThe State's derivative instruments consist of interest rate swapagreements, all of which have been determined by the State tobe effective cash flow hedges. Accumulated decreases in thefair value of some of the swaps are reporled as deferredoutflows of resources in the Statement of Net Position. Theseagreements are discussed in more detail in Note No. 18.
h. Deferred Inflows ofResourcesDeferred inflows ofresources are defined as the acquisition ofnet assets in one period that are applicable to future periods.These amounts are reported in the Statement of Net Positionand Balance Sheet in a separate section, after total liabilities.
i. InterfundActivitiesIn the fund financial statements, interfund activities arereported as follows:
Interfund receívøblesþayøbles - The current portion ofinterfund loans outstanding at the end of the fiscal year isreported as due from/to other f,rnds; the noncurrent portion as
advances tolfrom other funds. All other outstanding balancesbetween funds are reported as due from/to other funds. Anyresidual balances outstanding between the governmentalactivities and business-type activities are reported in thegovernment-wide financial statements as "internal balances."
Interfund sewíces províded and used - Sales and purchases ofgoods and services between funds for a price approximatingtheir external exchange value. Interfund services provided andused are reported as revenues in seller funds and expendituresor expenses in purchaser funds. In the statement ofactivities,transactions between the primary government and itsdiscretely presented component units are reported as revenuesand expenses, unless they represent repayments of loans orsimilar activities.
Interfund trans;fers - Flows of assets without equivalent flowsof assets in retum and without a requirement for repayment.In governmental funds, transfers are reported as otherfinancing uses in the funds making transfers and as otherfinancing sources in the funds receiving transfers. Inproprietary funds, transfers are reported after nonoperatingrevenues and expenses.
Interfund reímbursements - Repayments from the fundsresponsible for particular expenditures or expenses to thefunds that initially paid for them. Reimbursements are notreported in the financial statements.
j. Supplemental Nutrition Assistance Program (SNAP)Nutrition assistance distributed to recipients during the year isrecognized as an expenditure and a revenue in thegovemmental fund financial statements.
k. External Investment PoolAssets and liabilities of the Short-Term Investment Fund areallocated ratably to the Extemal Investment Pool Fund basedon its investment in the Short-Term Investment Fund (seeNote 4). Pool income is determined based on distributionsmade to the pool's participants.
l. Use of EstimatesThe preparation of the financial statements in conformity withGAAP requires management to make estimates andassumptions that affect the reported amounts and disclosuresin the financial statements. Actual results could differ fromthose estimates.
ilI-C-54

Connecticut
Note 2 Nonmajor Fund DeficitsThe following funds have deficit fund/net position balances at
June 30, 2015, none of which constitutes a violation ofstatutory provisions (amounts in thousands).
Canital ProiectsState Facilities $ 103,418Transportation $ 718
EnterDriseBradley Parking Garage s 2s,s44
Note 3 Cash Deposits and InvestmentsAccording to GASB Statement No. 40, "Deposit andInvestrnent Risk Disclosures", the State needs to make certaindisclosures about deposit and investment risks that have thepotential to result in losses. Thus, the following deposit andinvestment risks are discussed in this note:
Interest Rate Risk - the risk that changes in interest rates willadversely affect the fair value of an investment.
Credit Risk - the risk that an issuer or other counterparty to aninvestment will not fulfill its obligations.
Concentration of Credit Risk - the risk of loss attributed tothe magnitude of an investment in a single issuer.
Custodial Credit Risk ldeposits) - the risk that, in the eventof a bank failure, the State's deposits may not be recovered.
Foreign Currency Risk - the risk that changes in exchangerates will adversely affect the fair value of an investment ordeposit.
Prímøry GovernmentThe State Treasurer is the chief fiscal officer of Stategovernment and is responsible for the prudent managementand investment of monies of State funds and agencies as wellas monies of pension and other trust funds. The StateTreasurer with the advice of the Investment Advisory Council,whose members include outside investment professionals andpension beneficiaries, establishes investment policies andguidelines. Currently, the State Treasurer manages one Short-Term Investment Fund and twelve Combined InvestmentFunds.
Short-Term Investment Fund (STIF)STIF is a money market investment pool in which the State,municipal entities, and'political subdivisions of the State are
eligible to invest. The State Treasurer is authorized to investmonies of STIF in United States govemment and agencyobligations, certificates of deposit, commercial paper,
corporate bonds, savings accounts, bankers' acceptances,repurchase agreements, and asset-backed securities. STIF'sinvestments are reported at amortized cost (whichapproximates fair value) in the fund's statement of netposition.
For financial reporting purposes, STIF is considered to be amixed investment pool - a pool having external and internalportions. The external portion of STIF (i.e. the portion thatbelongs to participants which are not part of the State'sfrnancial reporting entity) is reported as an investment trust
fund (External Investment Pool fund) in the fiduciary fundfinancial statements. The intemal portion of STIF (i.e., theportion that belongs to participants that are part ofthe State'sfinancial reporting entity) is not reported in the accompanyingfinancial statements. Instead, investments in the internalportion of STIF by participant funds are reported as cashequivalents in the govemment-wide and fund financialstatements.
For disclosure purposes, certificates of deposit held by STIFare reported in this note as bank deposits, not as investments.
As of June 30,2015, STIF had the following investments andmaturities (amounts in thousands):
Short-Term Investment FundInvestmentMaturities(in vearsl
Amortized LessInvestmentTvpe Cost Than I
Federal Agency Securities g 1,4'76,285 g 1,476,285BankCommercial Paper 350,000 350,000US Govemment Guaranteed or Insured 65,295 65,295Govemment Money Market Funds 501,170 501,170Repurchase Agreements 500,000 500,000
Total Investments 12,892,750 g 2,892,750
Interest Rate RiskThe STIF's policy for managing interest rate risk is to limitinvestment to a very short weighted average maturity, not toexceed 90 days, and to comply with Standard and Poor'srequirement that the weighted average maturity not to exceed60 days. As of June 30,2015, the weighted average maturityof the STIF was 37 days. Additionally, STIF is allowed bypolicy to invest in floating-rate securities. However,investment in these secwities having maturities greater thantwo years is limited to no more than 20 percent of the overallportfolio. For purposes of the fund's weighted averagematurity calculation, variable-rate securities are calculatedusing their rate reset date. Because these securities repricefrequently to prevailing market rates, interest rate risk issubstantially reduced. As of June 30, 2015, the amount ofSTIF's investments in variable-rate securities was $568million.
Credít RískThe STIF's policy for managing credit risk is to invest in debtsecurities that fall within the highest short-term or long-termrating categories by nationally recognized rating organizations.As of June 30, 2015, STIF's investments were rated byStandard and Poor's as follows (amounts in thousands):
Slort Tmn lnve¡tment lund
OualityRatings
InvestmentTwe
Fcderal ,{gency Securities
Bank Comruercial Papu
U,S, Govemment Guannfted & Insüed Sscuritlcs
Govemmcnt Money Muket Funds
RepurchaseAgeements
Total Inveslments
AAA AÀ Å
$ $ l¡?ó,285 $
- 350,000
- 65,295
501,170
. 250,000 250,000
$ 501,170 $2,141,$0 $ 250,000
Amodiæd
Cost
$ 1,4?6,285
350,000
65,295
501,1?0
500,000
uüu!
ilI-C-55

Connecticut
Concentratìon of Credìt RískSTIF reduces its exposure to this risk by requiring that notmore than l0 percent of its portfolio be invested in securitiesof any one issuer, except for ovemight or two-business dayrepurchase agreements and U.S. govemment and agencysecurities. As of June 30,2075, STIF's investments in any oneissuer that represents more than 5 percent of total investmentswere as follows (amounts in thousands):
AmortizedInvestment Issuer Cost
Federal Home Loan Bank S 673,629Federal Farm Credit Bank $ 457,890U.S. Bank $ 35O,0OOFreddie Mac $ 151,386Merryl Lynch $ 250,000Fannie Mac $ 193,379Morgan Stanley $ 25O,O0l'Western Asset $ 251, 169RBC Capital Markets $ 250,000
Custodíal Credìt Rísk-Bønk Deposíts-NonnegotìøbleCertìJìcate of Deposíts (amounts in thousands):The STIF follows policy parameters that limit deposits in anyone entity to a maximum of ten percent of assets. Further, thecertificate of deposits must be issued from commercial bankswhose short-term debt is rated at least A-1 by Standard andPoor's and F-l by Fitch and whose long-term debt is rated atleast A- and its issuer rating is at least "C", or backed by a
letter of credit issued by a Federal Home Loan bank. As ofJune 30, 2015, $2,065,000 ofthe bankbalance ofSTIF's
deposits of$2,140,000 was exposed to custodial credit risk as
follows:Uninsured and uncollateralized S 1,202,063
Uninsured and collateral held by trust department ofeither the pledging bank or another bank not in the
name of the State 862,475
Total $ 2,064,s38
Combined Investrnent Funds (CIFS)The CIFS are open-ended, unitized portfolios in which theState pension trust and pennanent funds are eligible toinvest. The State pension trust and permanent funds own theunits of the CIFS. The State Treasurer is also authorized toinvest monies of the CIFS in a broad range of fixed incomeand equity securities, as well as real estate properties,mortgages and private equity. CIFS' investments are
reported at fair value in each fund's statement of netposition.
For financial reporting purposes, the CIFS are considered tobe external investment pools and are not reported in the
accompanying financial statements. Instead, investments inthe CIFS by participant funds are reported as equity in theCIFS in the govemment-wide and fund financial statements.
Primarv Government
Equity in the CIFS
0ther Investments
Total Jnve$ments-Current
Governmental
Activities
$ 1 10,069
2,826
!.__-__!?,!e5
Business-Type Fiduciary
Activities Funds
$ 652 g 29,s4t,2s6
68,570
ï_____q222 q_¡q!441
As of June 30, 2015, the CIFS had the following investments and maturities (amounts in thousands):Combined Investment Funds
Investment Maturiti€s (in Years)fnvestment Tvpe
Cash EquivalcntsAsset Backed SecuritiesGovernmenl SecuriLiesGovernment Agency SecuritiesMortgage Backed SecuritiesCorporate DebtConvertible DebtTotal Debt Investments
Common StockPreferred StockReal Estate Investment Trust
Fair Value
$ 198,784191 ,471
2,746,O47725,993377,930
3,068,33134,542
Less Than I$ 198,784 $
3,902149,878122,431
I0,098803,147
1,644
1-5
t6t,5521,086,902
56,5036t,4s2
998,89613,963
1 5,533617,616
6,19473,195
t,oo5,421
6 - 10 More Than 10
$ $10,424
891 ,65 1
s40,86s233,185260,867
1 8,935
$ 1,289,884 $ 2,379,268 $---l3lJ22 s r,955,927
Business Development CorporationMutual FundLimited Liability CorporatronTrustsLimited Partnerships
Total Investments s 29,755,256
Interest Rate RískCIFS' investment managers are given full discretion to manage their portion of CIFS' assets within their respective guidelines andconstraints. The guidelines and constraints require each manager to maintain a diversified portfolio at all times. In addition, eachcore manager is required to maintain a target duration that is similar to its respective benchmark which is typically the BarclaysAggregate-an intermediate duration index.
Credít RískThe CIFS minimizes exposure to this risk in accordance with a comprehensive investment policy statement, as developed by the
Office of the Treasurer and the State's Investment Advisory Cotrncil, which provides policy guidelines for the CIFS and includes
7,343,O3814,406,676
124,880309,747
80,600820,291
I,t57s83
6,668,284
IIr-c-56

Connectícut
an asset allocation plan. The asset allocation plan's main objective is to maximize investment returirs over the long term at anacceftable level of risk. As of June 30,2015, CIFS' debt investments were rated by Moody's as follows (amounts in thousands):
Combined Investment FundsAsset
Cash Backed GovernmentFair V¡lue Equivâlents Securities Securities
Corpo14teDebt
GovernmentAgency
Securities
MortgageBacked
SecuritiesConvertible
DebtAaaAa
BaaBaBCaaCaCPrime 1
Prime 2Govemrnent fixed not ratedNon Covernmenl fixed nol ratedNot Rated
$ 2,235,451492,20164t,373799,566520,267840,172261,361
12,769940
493,85630,391
202,429187,17062s,O92
$ 7,343,038
s 138,598 $2,886I,486
109
1,269,100 $334,51 5
327,413454,24882,17036,O4340,7753,527
59,812 $132,6173ot,407333,202428,750788,1 s9220,586
9,242940
486,38630,391
7969,347
ts,970
8,429
ï___]!é42.
$ 1007,500
534,650 $ 233,191 S
- 14,683- I 1,067- 11,21I
4,798
l9l a4
$____r9q!1
2,672
45,660
$12_1lr_L
1 1,086187,170
s 2,746,047
191,343
102,980 276,839g 725,993 S 377,930 $ 3,068,331
Foreign Currency RìskThe CIFS manage exposure to this risk by utilizing a strategic hedge ratio of50 percent for the developed market portion oftheIntemational Stock Fund (a Combined Investment Fund). This strategic hedge ratio represents the neutral stance or desired long-term exposure to currency for the ISF. To implement this policy, cruïency specialists actively manage the currency portfolio as anoverlay strategy to the equity investment managers. These specialists may manage the portfolio passively or actively depending onopportunities in the market place. While managers within the fixed income portion of the portfolio are allowed to invest innon-U.S. denominated securities, managers are required to limit that investment to a portion of their respective portfolios. As ofJune 30, 2015, CIFS' foreign deposits and investmentrffi:".i,"?.1*i:lamounts in thousands):
F¡xed lncome Securities Equiti€s
Cash
EquiYalent Govenment
Collaterâl Securities
Corporate
Debt
Asset
Backed
Mortgage
Backed
Common
Stock
Preferred
Stock
Real Estat€
InYestement
Trust FundForeiqn Currencv
Argentine Peso
Australian DollarBrazilian Real
Canadian DollarChilean PesoColombian Peso
Croatian KunaCzech KorunaDanish KroneEgyptian PoundEuro CurrænyHong Kong DollarHungarian ForintIceland KronaIndian Rupee
Indonesian RupiahIsraeli Shekel
Japanese YenMalaysian RinggitMexican Peso
Moroccan DirhamNew Turkish LiraNew Zealand DollarNigerian NairaNorwegian KronePeruvian Nouveau Sol
Philippine Peso
Polish ZlotyPound SterlingRomanian LeuRussian RubleSingapore DollarSouth Af¡ican RandSouth Korean WonSri Lanka Rupee
Swedish KronaSwiss F¡âncThailand BahtUganda ShillingUruguayan Peso
Total
$8t410,838
279,99'r
84,910
2,761
3t,64586
4,158
88,349
6,6621,964,783
633,515
24,3242
3,300
96,09417,565
1,339,030
84,282198,235
62201,272
I 10,084
2,69860,802
I,8ó465,3'15
105,748
1,387,03 I6,293
26,939
9t,253179,454
299,880
78183,098
452,szs
I 14,855
2,ts93,357
q_____!éq811
$
Cash
8l999
2,492
145
42
89,266
I I I,32815,550
1,660
26,266
t,241
t89,222
6,34t
t,6t242,289
58,669
63,042159,361
41,t9996,223
2,698t4,1241,864
3,44465,666
200,83 I6,293
26,610
6,746
t3,020t,43't
4,684
1,688
6,442
4,268
1t,298
329
288,t7 5
128,965
66,76s
I,l0l653
86
4,08486,422
6lss1,727,992
627,95'tr7,983
41,343
t7,t6tt,2't0,735
20,789
29,454
62
t59,45412,932
45,353
61,91440,00r
1,151,938
83,945' 99,362
289,596'18
175,410
453,079
101,004
35,775
29,649
10, t36
t9,265
2,40'1
r3,808
3,982
5,23t
3,t'12
iot
$ $ $ $ $
'14
686
207(1,6 l 0)
1,5't6
4,395
451
1,980
ll929
t,325
ll3
43
223
6,2s't (535)
2
20
404
t78l
1,764 5,805 t5,r'tz
s,96480,084
13,615
2,t593,357
!_____!qJ2:. $_____i22 û_!,1i9lÉq g______4e,423 $___-(tÐ $______1,!9r $__Zqq4q L___øðq 0____q9f92
tiqq8
148
942(554)
ilI-C-57

Connecticut
DefivøtívesAs of June 30,2015, the CIFS held the following derivativeinvestments (amounts in thousands):
Credìt RìskAs of June 30, 2015, other debt investments were rated byStandard and Poor's as follows (amounts in thousands):
0ther Inreslments
I¡h QudityRatings
InvestmentTpr Value .A,{ A Unrated
State Bolds
U.S, 0ovemnrmt and Agency Secunties
Oual'anteed lnvnlment Coltracl¡
}lomyMarketlunds
Total
Derivative Investments
Adjustable Rate SecuritiesAsset Backed SecuritiesMo¡tgage Backed SecuritiesCollateralized Mortgage Obli gations
TBA'slnterest Only SecuritiesOptions
Total
$ 2r,080 s 2r,080 s s
261,1 16 261,1 16
t4?,829 15,952 lll,8i7
Fair Value
$ 505,870
191,498277,288100,623
190,181
740(306)
s 1,26s,894
The CIFS invest in derivative investments for tradingpurposes and to enhance investment retums. The creditexposure resulting from these investments is limited to theirfair value at year end.
The CIFS also invest in foreign currency contracts.Contracts to buy are used to acquire exposure to foreigncurrencies, while contracts to sell are used to hedge theCIFS' investments against currency fluctuations. Lossesmay arise from changes in the value of the foreign cuûencyor failure of the counterparties to perform under thecontracts' terms. As of June 30, 2075, the fair value ofcontracts to buy and contracts to sell was $8.4 billion and$Ç.3 billion, respectively.
Custodiøl Credít Rísk-Bønk DeposítsThe CIFS minimize this risk by maintaining certainrestrictions set forth in the Investment Policy Statement. TheCIFS use a Liquidity Account which is a cash managementpool investing in highly liquid money market securities. AsofJune 30,2015, the CIFS had deposits with a bank balanceof $3 1.0 million which was uninsured and uncollateralized.
Complete hnancial information about the STIF and the CIFScan be obtained Íïom financial statements issued by theOffice of the State Treasurer.
Other InvestmentsAs of June 30, 2015, the State had other investments andmaturities as follows (amounts in thousands):
Otherlwcstmenh
Investnenl Maturities (in yeus)
iair les More
InrerlmentType Value Th¡nl 1.5 ú10 Thanl0
8,30r
$ 418,32ó S 318,148 S lll,877 S 8,101
Connecticut State Universities reported $89 million as U.S.Government Securities, these securities have no credit risktherefore, these securities are not included in the above table.
Custodíøl Credìt Rìsk-Bønk Deposits (amounts inthousands):The State maintains its deposits at qualified hnancialinstitutions located in the state to reduce its exposure to thisrisk. These institutions are required to maintain, segregatedfrom its other assets, eligible collateral in an amount equal to10 percent, 25 percent, 100 percent, or 120 percent of itspublic deposits. The collateral is held in the custody of thetrust department ofeither the pledging bank or another bank inthe name of the pledging bank. As of June 30,2015,5660,444of the bank balance of the Primary Government of 5664,623was exposed to custodial credit risk as follows:Uninsured and uncollateralized $ 55,181
Uninsured and collateral held by trust department ofeither the pledging bank or another bank not in the
name of the State 605,263
Total 5 660,444
Component UnitsThe Connecticut Housing Finance Authority (CHFA) andthe Connecticut Lottery Corporation (CLC) reported thefollowing investments and maturities as of 12-31-14 and6-30-15, respectively (amounts in thousands):
ill{orCmponmtUnih
Inwstmmt ùIrturitirs (in yem$
8,301
InwstmtntTwe
i¡ir
Vdue
ltss
Timl 1.5 ó.10
illore
Thml0
State Bonds
U,S, Govemment and Apncy Securitirs
Guarantrrd Inveslmelt Conlrarts
MoneyMarkulunds
Total Debt Invulmurts
Endowmerl Pool
Corporate Stock
Limitod PaÍnorulip
lotal fnvesrments
s 21,080 $ $ ó,780 s 14,300 $
1i0,209 10t,380 10,929 236,116 1,124
t41,829 1t,735 29,830 4?,930 58,14
8,301 8,301
52?,4re L_.14/!1 !__lö!1 !_18!!q L59l!!il,é1r
2,850
150
Collateralized Mortgage OblrgatroN
fidolityFrlrrds
Gìt\\,lA & l\rtr,l,{ Progrm,Arseh
Mortgage Batked Secunties
MunicrpalBmds
U.S, Cowmlmt Agency Securilirs
Structured Securities
FidelityTarExenptfud
Total Dell Invesunents
AmuigConnacts
Total lnvestments
$ 8ór$ $ $ 8ú3$
6,114 ó,114
f,1t,231 t21 231
878 150 128
42,t64 201 l,l9l 1,5ó7 19205
928 928
690 ó90
J,JJJ ],]]3
676,201 L__1ó48 l__llll l_J!! t__{U!¿
130,154
ü__!e,555l__!¿qq
III-C-58

Connecticut
The CHFA and the CLC own 83.8 percent ard 76.2 percentof the above investments, respectively. GNMA ProgramAssets represent securitized home mortgage loans of CHFAwhich are guaranteed by the Government National MortgageAssociation. Annuity contracts are the only investment heldby the CLC, which are not subject to investment risksdiscussed next.
Interest Røte RískCHFAExposure to declines in fair value is substantially limited toGNMA Program Assets. The Authority's investment policyrequires diversification of its investment portfolio toeliminate the risk of loss resulting from, among other things,an over-concentration of assets in a specific maturity. Thispolicy also requires the Authority to attempt to match itsinvestments with anticipated cash flows requirements and toseek diversification by staggering maturities in such a waythat avoids undue concentration of assets in a specificmaturity sector.
Credit RìskCHFAThe Authority's investments are limited by State statutes toUnited States Government obligations, including its agenciesor instrumentalities, investments guaranteed by the state,investments in the state's STIF, and other obligations whichare legal investments for savings banks in the state. TheFidelity Funds are fully collateralized by obligations issuedby the United States Government or its agencies. MortgageBacked Securities are fully collateralized by the FederalNational Mortgage Association, the Federal Home LoanMortgage Corporation or the Govemment NationalMortgage Association, and Collateralized MortgageObligations are fully collateralized by the United StatesDepartment of Housing and Urban Development mortgagepools.
CHFA's investments were rated as of 12-31-14 as follows(amounts in thousands):
Component Unih
lair QudityRatings
InvestmentType Value CCC D Unrated
Collateralized Mortgage 0bligations
Fidelity Tax Exempt Fund
MunicipalBonds
Structured Securities
Total
and FNMA Program Assets), and investments in the State'sSTIF.
S ec urity Le ndín g Trøn s øcti o n sCertain of the Combined Investment Funds are permitted byState statute to engage in security lending transactions toprovide incremental retums to the frrnds. The funds' Agentis authorized to lend available securities to authorizedbroker-dealers and banks subject to a formal loan agreement.
During the year, the Agent lent certain securities andreceived cash or other collateral as indicated on theSecurities Lending Authorization Agreement. The Agent didnot have the ability to pledge or sell collateral securitiesreceived absent a borrower default. Borrowers were requiredto deliver collateral for each loan equal to at least 102percent of the market value of the domestic loaned securitiesor 105 percent of the market value of foreign loanedsecurities.
According to the Agreement, the Agent has an obligation toindemnify the funds in the event any borrower failed toretum the loaned securities or pay distributions thereon.There were no such failures during the fiscal year thatresulted in a declaration or notice of default of the borrower.During the fiscal year, the funds and the borrowersmaintained the right to terminate all securities lendingtransactions upon notice. The cash collateral received oneach loan was invested in an individual account known as
the State of Connecticut Collateral Investment Trust. At yearend, the funds had no credit exposure to borrowers because
the value of the collateral held and the market value ofsecurities on loan were $1,866.8 million and $1,826.0million, respectively.
Under normal circumstances, the average duration ofcollateral investments is managed so that it will not exceed60 days. At year end, the average duration ofthe collateralinvestments was 23.22 days and an average weightedmaturity of 44.83 days.
Note 4 Receivables-CurrentAs of June 30,2015, current receivables consisted of thefollowing (amounts in thousands):
Primary Government$ 8ó3$ 863$-3,333
42,164
690 690
$
3,333
42,164
Governmental Business-Type
Àctivities ActivitiesComponent
IJnits
Taxes
Accounts
Loans-Cunent Portion
Other Govemments
Interest
Other (l )
Total Receivables
Allowance for
Uncollectibles
Receivables, Net
3,0 14,178
(878,3 1 7)
$ 2,135,861
$$644,856 89,883
3 14,318 22,436
10,892 8,646
5,282 599
2,859 3,313
978,207 124,877
(l 15,566) (320)
$ 862,641 S t24.557
$ t,393,70s
l, I 80,329
$ 47,050 $ 8ó3 $ ó90 $ 45,491434,667
t,296
4,181Concentrøtíon of Credít RískCHFAThe Authority's investment policy requires diversif,rcation ofits investment portfolio to eliminate the risk of loss resultingfrom, among other things, an over-concentration of assets
with a specific issuer. As of December 31., 2014, theAuthority had no investments in any one issuer thatrepresents 5 percent or more of total investments, other thaninvestments guaranteed by the U.S. Government (GNMA
(1) Includes a reconciling amount of $4,180 million fromfund financial statements to government-wide financialstatements.
ilr-c-59

Connecticut
Sales and Use
Income T¡xes
Corporal¡ons
Gasolinc and Spccial Fucl
Various OtheL
Total Taxes Receivable
Allowance for Uncollectibles
Taxcs Rcccivablc, Nct
$ 584,122
433,141
8,823
323,092
l34rJtf,(129,00s)
ï____t220,]11
Note 5 Taxes ReceivableTaxes receivable consisted ofthe following as ofJune 30,2015 (amounts in thousands):
Coyernmental Activities
Gcncral
Fund
Transportation
Fund Totâl
Clean Water fund (business-type activities) loans funds toqualified municipalities for planning, design, andconstruction of water quality projects. These loans arepayable over a 20 year period at an annual interest rate of2percent and are secr¡red by the fulI faith and credit orrevenue pledges of the municipalities, or both. At year end,the noncurrent portion'of loans receivable was $738.1million.
The Connecticut Higher Education Supplemental LoanAuthority (a component unit) makes loans to individualsfrom the proceeds of bonds issued by the Authority. Theloans bear interest rates ranging from 0 percent to 9.2percent. At year end, the noncurrent portion of loansreceivable was $103.0 million.
Note 7 Restricted AssetsRestricted assets are defined as resources that are restrictedby legal or contractual requirements. As ofJune 30,2015,restricted assets were comprised of the following (amountsin thousands):
$ $ 584,122
- 433,141
- 8,823
44,521 44,s27
323,092
44,527 1,393,705
(215) (129,220)
q______4r2 q___t¿4!r
Note 6 Receivables-NoncurrentNoncurrent receivables for the primary government and itscomponent units, as of June 30, 2015, consisted of thefollowing (amounts in thousands):
Primary Government
Governmental
Activities
Accounts
Loans 687,334
Total Receivables 687,334
Allowance for Uncolle< (14,361)
Receivables, Net g 672,973
Business-Type
Activities
Component
Units
30,928
640,935
67 1,863
-$ Totel
Restilcted
Assets
s 668,42ó
s 668.42ó
840,143
840,143
(5,035)
$ 835,108
Cash & Cadr
Iouiv¡lenh
s 668,426
L__qfu4
Loans, Net
lnvestmenh ofAllovances 0lher
(r52,s66)
s 5t9,297
The Grants and Loans fund (governmenlal activities) makesloans through the Department of Economic and CommunityDevelopment to provide financial support to businesses,municipalities, nonprofits, economic develop agencies andother partners for a wide range of activities that create andretain jobs; strengthen the competitiveness of the workforce;promote tourism, the arts and historic preservation; and helpinvestigate and redevelop brownhelds. The department'sinvestments are helping build stronger neighborhoods andcolnmunities and improving the quality of life for stater€sidents. These loans are payable over a ten year periodwith rates ranging from 2 percent to 4 percent.
163,629 $12,93a
2rJ1,44.ol2,o7 t62,567
1,O47
S 99,494la,l6512,734
$ 130,393 ç
Governmentâl Activifios:
Debt Seffice
Total-Govemnental Activities
Busines-Tpe Activities:
UConr/HealthCenteL $ 222,óó35 S $ S 222,663
ClcanValcr 117,238 158,833 336,071
OtherPropdetary 56,017 12,562 68,ó39
Total-BusinmsTypeActivities !__ :!!1,9Q ¡__!!121 !_-___--__-_ q_______j_ L___6n&Conponent Units:
CHT'A
CAA
Other ComponentUnits
Total-Component Unils
Note I Current Liabilitiesa. Accounts Payable and Accrued LiabilitiesAs of June 30,2075, accounts payable and accrued liabilities consisted of the following (amounts in thousands):
sararics and tËl:.T.llt""Vendors Benefits Interest Other Liatrilit¡es
Governrncntal ^,ctivities:Goneral
TratrsportatiorrRestricted 1\ccountsGrâfits ând LoansOther Govern¡nentalInteralal ServiceReconciling an¡ount lrom lundfinancial statcments togovetñment-wide fi nancialstatements
Total-Govehmental AotivitiesBusiness-Type Act¡w¡ties:
IJConn/ÉIealth CenterStatc IJniversitiesOther Propr¡etary
Total-Elusiûess-Type ActiviticsComponent IJnits:
CHF-A(;onnecticut Lottery CorporationCon¡recticut Airyort Authority()ther Component IJhits
Total-Comporìent IJnits
$
l,oo3
t92,795 196,957$ 4é3,218 $ 2rJ9,Ar4
$
$ $
$ 7,378
$ 182,150 $lo,3r89,573
1lJ26,813
85tì
s 539,457 S 666,553 S 3.534,954 $ 99,418 $ 4,840,402
109,914 2,088 |12,022
4y,168 21,787 14,943 493,898
!__!l!@¿ !__trlu t___¡IEtl! r_llqq I__J!4nn
34s,'77923,2s6
2l 1,O5913,17669,34O
1,905
$
Þ , r2?f2t $ ,___ é.1Éå
$ - $ 33,982 $
62
64
s qql,
73,25038,81523,347
2lJ6,72659,31662,4'73
2,336I I,828
135,412 $ r-1,!64 $ 4!,Þ46 S !2!,!
$-2,2241,OO46,446
þ-_-!þp2!
3,2314,147
15,169I,8a2I,2A4
994
$ 6,1 l9737a437A
5a32O
ô 1Sf2t
2l,2aa14,7 | 516,81 366,1lj4
ç
III-C-60
I 9-333 $ 1! o

Connecticut
Note 9 Capital AssetsCapital asset activity for the year was as follows (amounts in thousands):
Begiming hditrgBalance Additioß Retireretrts Bâlânce
Govemntål ActiYities
Capital Assets not being Depreciated:
IándCorohuction in Progress
Total Capital Assets not being Deprccieted
Capilal Assets being Depræiated:
Buldings
Inprovererns Otlrcr thm Buildings
EqupreIúInfâsluctue
Total Other Capilal Assets being Depreciated
læss: Accmulated Depreciation For:
Bufdings
hrprowrents Othu tlm Buldings
Equiprent
lnfashuctue
Total Accurulated Deprechtion
othu CapitalAssets, Net
Govel]rental Activiti€s, Capital Assets, Net
205,46'l
205,467
* Depreciation expeme was chrged to fimctiom as ôllows:
$ 1,686,533
3,465,057
5,1 51,590
4,005,8t4443,034
2,548,252
13,824,648
20,82r,808
$ 23,006
I,130,658
1,t53,664
378,t462t,624
304,468
482,714
I,186,952
g s22
930,875
93t,397
87,3191,632
I 16,516
87,319
I,632
116,516
$ 93 l,397
$ r,709,017
3,664,840
5,3',73,857
4,296,701
463,026
2,',736,2Q4
14,30'7,362
21,F03,293
1,'192,t6t
306,6 l02,6',14,470
9,372,668
t4,145,909'7,65',7,384
!ltri!4r
1,772,065
285,250
2,475,882
8,900,576
t3,433,773
7,388,035
ï_J2,s3e,62!
t07,4t5t? oo?
3ts,l04472,092
9t'7,603
269,349
!.1t?¡'0]_i
CoYelmental Activ¡ties :
I€gislatire
Geneml Govel:lrentRegulation ard Proteclon
Comffiti.rn and DevebpmtHealtrh md Hospitals
Træspo¡tatbn
Hl¡ruServicesEdwatior¡ Lùraries md MuemConectioro
Judicial
Capital assas held by the goremnfs intemal
seruiæ ûrds re charged to the wiow fimtioßbased on the wge of tln asets
Total Depreciation Expeme
5,634
53,264
33,9s9
14,048
r3,884
666,663t,852
42,467
51,891
18,958
14,983
q_____2_tzf91
BegimingBalarce
Endbg
Additioß Retirerents Balance
Bminess-Type Activities
Capital Assets not being Depreci¿ted:
låndCoruhrction in Progrsss
Total Capikl Assets rct being Depreciated
Capital Assets being Depræiatçd:
Buìhings
Irprovemts Otlrcr Than Buildings
EquprernInÊastrehtre
Total Othu Capital Asscts being D€p¡eciated
Iæss: Accmulated Depreciation For:
Buf,dings
Lryrowmts Oths TtEn Blüldings
Equþrent
Total Accu¡ulated Depreciatbû
Olher Capital Assets, Net
Buiness-Type Activities, Capital Assets, Net
5,834,t67 400,255
$ ó7,788
5t0,620
578,408
$ 286
476,775
477,061
$2270,224
2',70,226
22,503
210
56,264
78,97'7
15,556
24
49,3t5
64,89s
$ 284,308
$ 68,072
7t7,t7l'785,243
4;186,947
373,287
995,2t1
6,t55,445
t,919,230
207,087
662,926
2,789,243
3,366,202
$__!!L1,44:
4,502,086
363,146
968,935
t,795,044191,988
644,339
2,63t,371
3,202,796
q__uqr!g1
307,364
10,35 I82,540
t39,742
15,123
67,902
222,767
I1't,488
ï__6s!é4e.
Component UnitsCapital assets of the component units consisted of the following as of June 30,2015 (amounts in thousands)
Land $ 58,225Buildings 724,863Improvements other than Buildings 321,925Machinery and Equipment 534,498Construction in Progress 17,558
Total Capital Assets 1,657 ,069Accumulated Depreciation 858,467
Capital Assets, Net S, 798,602
III-C-61

Note 10 State Retirement SystemsThe State sponsors three major public employee retirementsystems: the State Employees' Retirement System (SERS)-consisting of Tier I (contributory), Tier II (noncontributory)Tier IIA (contributory) and Tier III (contributory), theTeachers' Retirement System (TRS), and the JudicialRetirement System (JRS). The three plans in this note do notissue separate financial statements, nor are they reported as apart of other entities. The financial statements and otherrequired information are presented in Note 12 and in theRequired Supplementary Information (RSI) section of theCAFR.
The State Comptroller's Retirement Division under thedirection of the Connecticut State Employees' RetirementCommission administers SERS and JRS. The sixteenmembers are: the State Treasurer or a designee who serves as anon-voting ex-officio member, six trustees representingemployees are appointed by the bargaining agents inaccordance with the provisions of applicable collectivebargaining agreements, one ooneutral" Chairman, two actuarialtrustees and six management trustees appointed by theGovernor. The Teachers' Retirement Board administersTRS. The fourteen members of the Teachers' RetirementBoard include: the State Tr€asurer, the Secretary ofthe Officeof Policy and Management, the Commissioner of Education ortheir designees, who serve as ex-officio voting members. Sixmembers who are elected by teacher membership and fivepublic members appointed by the Governor.
Specíal Fundíng SítuationThe employer contributions for the Teachers' RetirementSystem (TRS) are funded by the State on behalf of theparticipating municipal employers. Therefore, theseemployers are considered to be in a special funding situationand the State is treated as a non-employer contributing entityas defined by GASB 68. As a result, the State reports aliability, defened outflows of resources and deferred inflowsof resources, and expenses. Additionally, the autonomousComponent Units that benefit from the services provided byemployees of the State are considered, as defined by GASB 68as non-employer contributing entities. As such they report aliability, deferred outflows of resources and deferred inflowsof resources, and expenses as a result of being statutorilyrequired to contribute to SERS.
PIøn Descriptíons ønd Fundíng PolícyMembership of each plan consisted of the following at the dateof the latest actuarial ovaluation:
S[R$ TRS JRS
úß0/2014 óß0/1014 6ß0/2014
Støte Employees' Retìrement SystemPlan DescríptíonSERS is a single-employer defined-benefit pension plancovering substantially all of the State full-time employeeswho are not eligible for another State sponsored retirementplan. Plan benefits, cost-ofJiving allowances, contributionrequirements of plan members and the State, and other planprovisions are described in Sections 5-152 to 5-192 of theGeneral Statutes. The plan provides retirement, disability,and death benefits, and annual cost-oÊliving allowances toplan members and their beneficiaries.
Fundíng PolicyThe contribution requirements of plan members and theState are established and may be amended by the Statelegislature subject to the contractual rights established bycollective bargaining. Tier I Plan B regular and HazardousDuty members are required to contribute 2 percent and 4percent oftheir annual salary, respectively, up to the SocialSecurity Taxable Wage Base plus 5 percent above that level;Tier I Plan C members are required to contribute 5 percentof their annual salary; Tier Il Plan Hazardous Duty membersare required to contribute 4 percent of their annual salary;Tier IIA and Tier III Plans regular and Hazardous Dutymembers are required to contribute 2 percent and 5 percentoftheir annual salary, respectively. Individuals hired on orafter July 1, 2011 otherwise eligible for the AlternativeRetirement Plan (ARP) are eligible to become members ofthe Hybrid Plan in addition to their other existing choices.The Hybrid Plan has defined benefits identical to Tier IIIIIAand Tier III for individuals hired on or after July 1, 201 l, butrequires employee contributions 3 percent higher than thecontribution required from the applicable Tier IIllIA/llIplan. The State is required to contribute at an actuariallydetermined rate. Administrative costs of the plan are fundedby the State.
Teqcherc' Retírement SystemPløn DescríptionTRS is a cost-sharing multiple-employer defined-benefitpension plan covering any teacher, principal, superintendent,or supervisor engaged in service of public schools in theState. Plan benefits, cost-of-living allowances, requiredcontributions of plan members and the State, and other planprovisions are described in Sections 10-183b to l0-183ss ofthe General Statutes. The plan provides retirement,disability, and death benefits, and annual cost-ofJivingallowances to plan members and their beneficiaries.
Fundíng PolícyThe contribution requirements of plan members and theState are established and may be amended by the Statelegislature. Plan members are required to contribute 6percent of their annual salary. Administrative costs of theplan are funded by the State.
Ju dicíøl Retirement SystemPIan DescriptionJRS is a single-employer defined-benefit pension plancovering any appointed judge or compensationcommissioner in the State. Plan benefits, cost-ofJivingallowances, required contributions of plan members and the
Inactive Members or their
Bmeficìaries reæiving benefl ts
Inactive Memben Entithd to but
not yet Receiving Benefits
Active Members
45,803 34,310 250
4
1t1
1,45?
49,916
ll,0l I
51,433
LII-C-62

Connecticut
State, and other plan provisions are described in Sections 5l-49 to 51-51 of the General Statutes. The plan providesretirement, disability, and death benehts, and annual cost-oÊliving allowances to plan members and their beneficiaries.
Fundìng PolícyThe contribution requirements of plan members and theState are established and may be amended by the Statelegislature. Plan members are required to contribute 6percent of their annual salary. The State is required tocontribute at an actuarially determined rate. Administrativecosts ofthe plan are funded by the State.
s[Rs
InvestmentsThe State Treasurer employs several outside consultingfirms as external money and investment managers, to assistthe Chief Investment Ofhcer, as they manage the investmentprograms of the pension plans. Plan assets are managedprimarily through asset allocation decisions with the mainobjective being to maximize investment retums over thelong term at an acceptable level of risk. There is noconcentration of investments in any one organization thatrepresents 5.0 percent or more ofplan net position availablefor benefits. The following is the asset allocation policy as ofJune 30, 2014.
TRB JRS
Asset Class
Large Cap U.S, Equities
Developed Non-U.S, Equities
Emcrging Ma*cts (Non-U.S.)
Real Estate
Private Equity
Altemative Investment
Fixed Income (Core)
High Yield Bonds
Emerging Market Bond
I¡flation Linked Bonds
Cash
Target
Allocation
2t.0%
18.0%
9.0%
lt.0%
8.0%
8,0%
s.0%
4.0%
5.0%
4.0%
Long-Ternr Expected
Real Rate ofReturn
5.8%
6,6%
8.30/o
5.1%
7.6%
4.1%
t.3%
3.9%
3.7%
1.0%
0.4%
Target
Allocation
21.0%
18,0%
9.00/o
7.0%
1.0%
8.0%
7.0%
5.0%
5.0%
3.0%
6.0%
Long-Tenn Expected
Real Rate ofReturn
5.8%
6.6%
8.3%
5.1%
7.6%
4.lo/o
r.3%
3s%
3.70/o
t.0%
0.4%
Target
Allocation
t6.0%
t4.0%
7.0o/o
1.00/o
r0.0%
8.0%
8.0%
t4,0%
8.0%
s.0%
3.00/n
Long-Term Expected
Real Rate ofReturn
5.8%
6.6%
8.3%
. S.lYt
7.60/o
¡ li/I,I /O
t.3%
3s%
3,1%
1.0%
0.4%
The long-term expected rate of return on pension planinvestments was determined using a log-normal distributionanalysis in which best-estimate ranges of expected futurereal rates of retum (expected retums, net of pension planinvestment expense and inflation) are developed for eachmajor asset class. These ranges are combined to produce thelong-term expected rate ofretum by weighting the expectedfuture real rates of return by the target asset allocationpercentage and by adding expected inflation.
Røte of Return: For the year ended June 30, 2014, theannual money-weighted rate of return on pension planinvestments, net of pension plan expense was 15.6, 15.7, and13.7 percent for SERS, TRS, and JRS, respectively. Themoney-weighted rate of return expresses investmentperformance, net of investment expense, adjusted for thechanging amounts actually invested.
Net Pensíon LíøhilítyThe components of the net pension liability at June 30,2014were as follows (amounts in millions):
SERS TRS JRS
ToralPensionliability $ 26,487$ 26,349S 3tFiducrary Nrt Position 10,473 16,208 188
NerPensìonliabiliry $ 16,014$ 10,141$ 164
Ratio of Fiduciary N* Position
toTotalPeruionlrability 39.540/0 61.510/0 53.38%
Deferred Retírement Optìon Progrøm (DROP)Section 10-183v ofthe General Statue authorizes that a TRSmember teacher receiving retirement benefits from thesystem may be reemployed for up to one full school year bya local board ofeducation, the State Board ofEducation or
by a constituent unit ofthe state system ofhigher educationin a position (1) designated by the Commissioner ofEducation as a subject shortage area, or (2) at a schoollocated in a school district identified as a priority schooldistrict. Such reemployment may be extended for anadditional school year, by written request for approval to theTeachers' Retirement Board.
As of June 30, 2015 the balance held for the DROP was notavailable from the Teachers' Retirement Board.
Díscount RøteThe discount rate used to measure the total pension liabilitywas 8.0, 8.5, and 8.0 percent for SERS, TRS, and JRSrespectively. The projection of cash flows used to determinethe SERS, TRS, and JRS discount rate assumed employeecontributions will be made at the current contribution rateand that contributions from the State will be made atactuarially determined rates in future years. Based on thoseassumptions, SERS, TRS, and JRS pension plans' fiduciarynet position was projected to be available to make allprojected future benefit payments of current plan members.Therefore, the long-term expected rate ofreturn on pensionplan investments was applied to all periods of projectedbenefit payments to determine the total pension liability.
Sensítívity of the net pensíon liabílíty to chønges ín thediscount rateThe following presents the net pension liability of the State,calculated using the discount rates of8.0, 8.5 and 8.0 percentfor SERS, TRS, a¡rd JRS, as well as what the State's netpension liabilities would be if it were calculated using a
discount rate that is 1-percentage-point lower or 1-
III-C-63

percentage-point higher than the current rate (amounts inmillions):
l% Current l%Decl'ease in Discount Increase in
Rate Rate Rate
SERS Net Pension Liability $ 19,103 $ 16,014 $ 13,416
TRS Ner Pension Liability S 12,942 $ l0,l4l $ 7,761
JRSNetPensionliabiliry $ 199$ 164$ 134
GASB Statement 68 Employer ReportíngE mp loyer C o ntríb u tì o n sThe following table presents the primary government's andcomponent units' contributions recognized by the pensionplans at the measurement date June 30, 2014 (amounts inthousands):
SERS TRS IRS Tolal
PnrnaryGovemment $ 1,25?,085$ 948,540$ 16,298 S 2,221,923
ComponentUnih I 1,805 I 1,905
TCIdEmployeLConlributions $ 1,268,890$ 948,540$ 16,298 I 2,233,128
Pensíon Líøbilíties, Pensíon Expense, and DeferredOutflows of Resources and Defewed Inflows of ResourcesReløted to PensíonsAs of the reporting date June 30, 2015, the primarygovemment and component units reported net pensionliabilities for the following plans administered by the Stateas follows (amounts in thousands):
Primary Component
Government Units
Proportionate Share ofthe Net Pension Liability
State Employees' Retirement Sy$ern
Net Pension Liability
Teachers' Retircment Sy$em
Judrcial Retirement System
Total Net Pension Liability
$ 15,865,384 $ 148,982
$ 2ó,170,831 !___-14¿q
The primary government's and component units'proportions of the collective net pension liability for theState Employees' Retirement System as of the measurementdate June 30,2014 as follows (amounts in thousands):
Primary Component
Government Units
State Employees' Retirement System
Proportion-June 30,2014 99.07% 0.93%
For the reporting year ended June 30, 2015, the primarygovsrnment and component units' recognized pensionexpense for the following pension plans administered by theState as follows (amounts in thousands):
Primary CornponentGovernment Units
Pehsion Expense
State Employees' Retirement SystemTeachers' Retirelnent SystemJudicial Retirement System
Total $ ___$!r
Deferred Outflows and Inflows of ResourcesAs of the reporting date June 30, 2015, the State reporteddeferred outflows of resources and deferred inflows ofresources related to pensions from the following sowces:
PrimaryGovrrrrrnen{ CornponmtUnih
Ddsred
0utllors of
Rnources
I)drnrd
Inflols ol
RrmuLces
I}drrrd
0ulfloçs of
Rtsources
I)drrrrd
Inflows of
Rt¡rurcrs
Stú Employenr Rdhunmt Sptern
Nu Diffwnce Betwem Prqmtd and
Actual Invesmenl Earnings on
Pension Plan Imstments
lmploycrContributrons Subseqwnl to
MusuremrntDatr
Total
Tuchers' Retirunent Systm
Net Diffmnæ Between Pm¡cted and
Actual Inrestmenl Eamings on
Pemion Plan lu'esnenls
EmployuContnlntrons Subsoquentto
Mmsr¡rernmtDate
Totül
JudicialRuirmentSyltm
Nu Dilluence Between PLqected and
,Acnal lnvestrnent lartrings on
Pssion Ìlan Inwstnenh
lmployer ContributioN Subseqmnt to
Mo¡surmenlDate
Total
$ ió6,ó20$ s 5,r2
10,141,454
163,993
$ 856,ó74
984,1 l0
$ 984,il0 $ 85ó,ó74
li,?ll
$ 17,131 S
$ 1,258,138 $ I 1,815
775,4859,043
Year f,ndins June 30
2016 $20t7
2018
2019
The amount reported as deferred outflows of resourcesrelated to pensions resulting ffom the State contributionssubsequent to the measurement date will be recognized as areduction of the net pension liability reported in thefollowing fiscal year. The amount reported as deferredinflows of resources related to pensions will be recognizedas pension expense as follows (amounts in thousands):
State Employees' Retirement System
Primary Component
Yearf,ndinqJune30 Government Units
2016$ 141,655 $ 1,330
2017 141,655 1,330
2018 141,655 1,330
2019 141,6s7 1,330
$ 566,622 g 5,320
Teachersr Retirement System
Primary
Government
2t4,169
214,169
2t4,169
2t4,167g 2.042.666
III-C-64
$ 8s6,674
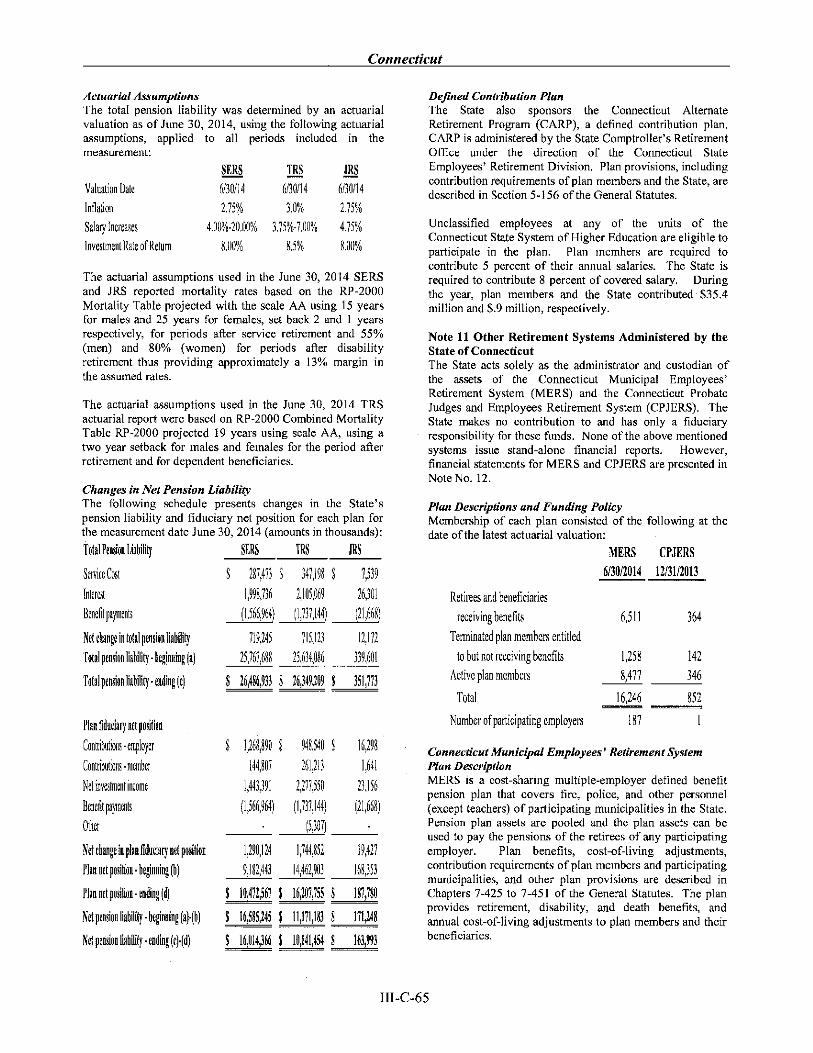
Connecticut
Actuøríøl AssumptionsThe total pension liability was determined by an actuarialvaluation as of June 30, 2014, using the following actuarialassumptions, applied to all periods included in themeasurement:
SIRS TRS JRS
Valuation Date 6ß0114 6130114 613Ï14
Inflation 2.15% 3.0% 2,150/o
Salarylncleases 4.00%-20,00% 3,15%-1.00% 4.15%
InvestmentRateofRetum 8,00% 8,5% 8,00%
The actuarial assumptions used in the June 30, 2014 SERSand JRS reported mortality rates based on the RP-2000Mortality Table projected with the scale AA using 15 yearsfor males and 25 years for females, set back 2 and I yearsrespectively, for periods after service retirement and 55o/o
(men) and 80% (women) for periods after disabilityretirement thus providing approximately a l3o/o margin inthe assumed rates.
The actuarial assumptions used in the June 30, 2014 TRSactuarial report were based on RP-2000 Combined MortalityTable RP-2000 projected 19 years using scale AA, using atwo year setback for males and females for the period afterretirement and for dependent beneficiaries.
Changes in Net Pensíon LíabíIìtyThe following schedule presents changes in the State'spension liability and fiduciary net position for each plan forthe measurement date June 30, 2014 (amounts in thousands):
TotalPensionliùility SIR$ TRS IRS
SeniceCosl
Interest
Benefitpaynents
Nrt chmge in totd pmdon liabilig
Total pmsion lhbilig - beginning þ)
Total pmdon liùilig' uding (r)
Phn fiducirry netposition
Contlibutions - employer
Contribrtions-memkr
Nd iruestmentincome
Benefitpaymenh
0thu
Net chmge in plan liduciary net position
Plm nd podtion.bqinning (b)
Plm net position. ending (d)
Nd pensíon lhbility - bqinning þ)-(b)
Net pension liúility. ending (c).(d)
1,2ó8,890 $
144,807
948,540 S
D ejin ed C o ntrib utio n Pl ønThe State also sponsors the Connecticut AlternateRetirement Program (CARP), a defined contribution plan.CARP is administered by the State Comptroller's RetirementOffice under the direction of the Connecticut StateEmployees' Retirement Division. Plan provisions, includingcontribution requirements of plan members and the State, aredescribed in Section 5-156 ofthe General Statutes.
Unclassified employees at any of the units of theConnecticut State System of Higher Education are eligible toparticipate in the plan. Plan members are required tocontribute 5 percent of their annual salaries. The State isrequired to contribute 8 percent ofcovered salary. Duringthe year, plan members and the State contributed $35.4million and $.9 mìllion, respectively.
Note 1l Other Retirement Systems Administered by theState of ConnecticutThe State acts solely as the administrator and custodian ofthe assets of the Connecticut Municipal Employees'Retirement System (MERS) and the Connecticut ProbateJudges and Employees Retirement System (CPJERS). TheState makes no contribution to and has only a fiduciaryresponsibility for these funds. None of the above mentionedsystems issue stand-alone financial reports. However,financial statements for MERS and CPJERS are presented inNote No. 12.
Pløn Descríptions and Funding PolìcyMembership of each plan consisted of the following at thedate ofthe latest actuarial valuation:
MERS CPJIRS
6ß0nn4 nmnlß$ 287,473 $ 347,198 $ ?,539
1,998,?36 2,105,0ó9 26,301
(1,566,964) (1,737,144) (21,ó68)
119,245 715,121 t2,t12
25,?ó7,688 25,ó34,08ó 339,601
$ lú,496,933 $ 16,349,109 $ 351,?73
Retirees and beneficiaries
receiving bonefits
Tenninated plan members entitled
to but not receiving benefits
Active plan members
Total
Number of participating employers
6,511 364
142
346
1,258
8,477
__t6N. 852
87
1,443,391
261,213
2,2??,550
(1,?3?,144)
____ff!t)
1,744,952
14,462,903
16,2gg
1,641
23,156
(21,ó68)(1,566,964)
1,290,124
9,1 82,443
C onnectíc ut Munícipal Employees' Retírement SystemPlan DescrìptíonMERS is a cost-sharing multiple-employer defined benefitpension plan that covers fire, police, and other personnel(except teachers) of participating municipalities in the State.Pension plan assets are pooled and the plan assets can beused to pay the pensions of the retirees of any participatingemployer. Plan benefits, cost-of-living adjustments,contribution requirements of plan members and participatingmunicipalities, and other plan provisions are described inChapters 7-425 to 7-451 of the General Statutes. The planprovides retirement, disability, and death benefits, andannual cost-of-living adjustments to plan members and theirbeneficiaries.
19,421
ló8,353
!__!!t!ïss l__lül!!
t_lu]tlll $___uul!
!_l!tlui{ t___.l!ltu
III-C-65

Connectícut
Fundìng PolícyPlan members are required to contribute 2.25 percent to 5.0percent of their annual salary. Participating municipalitiesare required to contribute at an actuarial determined rate.The participating municipalities fund administrative costs ofthe plan.
Investment PolícyThe State Treasurer employs several outside consultingfirms as external money and investment managers, to assistthe Chief Investment Officer as they manage the investmentprograms of the pension plans. Plan assets are managedprimarily through asset allocation decisions with the mainobjective being to maximize investment retums over thelong term at an acceptable level of risk. There is noconcentration of investments in any one organization thatrepresents 5.0 percent or more of plan net position availablefor benefits.
MDRS
Target
Asset Cla¡s
Large Cap U.S. Equilies
Developed Non-U.S. Equìties
Emerging Markets (Non-U.S.)
Real Estate
PLivate Equity
Altcmativc Investrnent
Fixcd Incourc (Corc)
High Yield Bonds
Emerging Market Bond
Inflalion Linked Bonds
Cash
The long-term expected rate of return on pension planinvestments was determined using a log-normal distributionanalysis in which best-estimate ranges of expected futurereal rates of retum (expected returns, net of pension planinvestment expense and inflation) are developed for eachmajor asset class. These ranges are combined to produce thelong-term expected rate ofretum by weighting the expectedfuture real rates of return by the target asset allocationpercentage and by adding expected inflation.
Net Pensíon Líabílìty of Partícípøting EmployersThe components of the net pension liability for MERS atJune 30, 2014 were as follows (amounts in millions):
MERSEmployers'Total Pension Liability $ 2,501
Fiduciary Net Position 2,263
Employers'NetPensionLiability q__2iq
Ratio of Fiduciary Net Position
to Total Pension Liability 90/8%
Díscount RøteThe discount rate used to measure the total pension liabilitywas 8 percent for MERS. The projection of cash flows usedto determine the discount rate assumed that plan membercontributions will be made at the current contribution rateand that employer contributions will be made at rates equal
to the difference between actuarially determinedcontribution rates and the member rate. Based on thoseassumptions, the pension plan's fiduciary net position wasprojected to be available to make all projected future benefitpayments of current plan members. The long-term expectedrate of return on pension plan investments was applied to allperiod of projected beneflrt payments to determine the totalpension liability.
Sensítívíty of the net pension líøbílþ to changes ín thedßcount rateThe following presents the net pension liability of MERS,calculated using the discount rate of 8 percent as well aswhat the net pension liability would be if it were calculatedusing a discount rate that is l-percentage-point lower or 1-percentage-point higher than the current rate (amounts inmillions):
lo Current l"/"Decrease in Discount Increase in
Rate Rate Rate
Net Pension Liability $ 544 $ 238 $ (20)
Net dffirence between projected ønd øctuøl ínvesfinentearníngs on pensíon plan ínvestmentsDeferred outflows and inflows related to differencesbetween projected and actual earnings on plan investmentsare netted and amortized over a closed five year period. Thecollective amount of the net difference between projectedand actual investment earnings as of June 30, 2014compared to the plan's expected rate of return of 8 percentwas $107,180,000. The first year amortization of$21,436,000 is recognized as pension expense and theremaining amount is shown as a deferred inflow ofresources. Each employer's proportional share of thesecollective amounts is presented on the schedules ofpensionamounts by employer.
Deferred outflows ønd deferred ínflows of resourcesThe cumulative net amounts reported as deferred outflows ofresources and deferred inflows of resources related topensions will be recognized in future pension expense as
follows (amounts in thousands):Collective
Deferred
Inflows ofResources
Net difference between projected and actual
earnings on plan investments $ 8s,744
Amounts recognized in subsequent fiscal years:
2015 $ 21,436
2016 21,436
20n n,46
2018 21,436
The above amounts do not include the deferredoutflows/inflows of resources for employer contributionsmade subsequent to the measurement date. These amounts
Allocation
Long-Term f,xpccted
Reaì Rate ofReturn
5.8%
6.6%
8.30/o
5.r%
7.6%
4.lTo
1.30/o
39%
3.7%
t.0%
0.4%
16.00/o
14.0v,
7.0%
7.0%
10.0%
8.0%
8.0%
14.0y0
8.0%
5.00/o
3.0%
III-C-66

Connecticut
should be calculated and recorded by each participatingemployer.
Collectíve Pensíon ExpenseCollective pension expense includes certain current periodchanges in the collective net pension liability, projectedearnings on pension plan investments and the amortizationof deferred outflows of resources and deferred inflows ofresources for the current period. The collective pensionexpense for the period ended June 30, 2014 is as follows(amounts in thousands):
Service Co$ $ 59,763
lnterest on the total pension liability 185,379
MemberContributions (18,998)
Prgected eamings on plan investments (150,628)
Expensed portion ofcunent pedod differences
between projected and actual eamings on plan invsstments (21,436)
Other (13)
Collective Pension Expense $ 54,067
Actusríal AssumptíonsThe total pension liability was dctermined by an actuarialvaluation as of June 30, 2014, using the following actuarialassumptions, applied to all periods included in themeasurement date:
Inflation 3.25%
Salary increase 4.25-11.0%, including inflation
Investment rate ofreturn 8.00%, net ofpension plan investment
expense, including infl ation
Mortality rates were based on the RP-2000 CombinedMortality Table for annuitants and non-annuitants (set
forward oire year for males and set back one year forfemales).
Connectícut Probate Judges ønd Employees' RetírementSystemPløn DescrìptíonCPJERS is an agent multi-employer defined benefit pensionplan that covers judges and employees of probate courts.Plan benefits, cost-of-living adjustments, requiredcontributions of plan members and the probate court system,and other plan provisions are described in Chapters 45a-34to 45a-56 ofGeneral Statutes. The plan provides retirement,disability, and death benefits, and annual cost-of-livingadjustments to plan members and their beneficiaries.
Pension plan assets are pooled for investment purposes butseparate accounts are maintained for each individual court sothat each court's share of the pooled assets is legallyavailable to pay the benefits of only its employees. The planis administered by the State Employee's RetirementCommission.
FundingPlan members are required to contribute 1.0 percent to 3.75percent oftheir annual salary. The probate court system isrequired to contribute at an actuarial determined rate.Administrative costs of the plan are funded by the probatecourt system.
Pension LìøbílítyInformation concerning the CPJERS total pension liabilityand significant assumptions used to measure the plans totalpension liability, such as inflation, salary changes, discountrates and mortality are available by contacting the StateComptroller's Retirement Division.
II-C-67

Connecticut
Note L2 Pension Trust Funds Financial StatementsThe financial statements ofthe pension trust funds are prepared using the accrual basis ofaccounting. Plan member contributionsare recognized in the period in which the contributions are due. State contributions are recognized in the period in which thecontributions are appropriated. Benefits and refunds are recognized when due and payable in accordance with the terms ofeachplan. Investment income and related expenses of the Combined Investment Funds are allocated ratably to the pension trust fundsbased on each fund's equity in the Combined Investment Funds. As of June 30, 2015 the Fiduciary Fund financial statements wereas follows (amounts in thousands):
of Nct Poritlon lOOOtsl
ConnectlcutStetc St¡te ùfun¡cipd Probate
Enployees' Teachcrs' Judlclål Employccs' Judgcs' Othcr TotâlAssetsCurenl:
Cash and Cash EquivalentsReceivablcs:
Accounts, Net of AllowancesFrom Other GoveñmentsFrom ()ther FundsInterest
InwestmehtsSecurities Lebding Collaterall.¡oncula-ent:
Dug From EmploycrsTotal
^ssetsLi¡biliticsAcoounts Payable and ltccrued LiabilitiesSecurities Lending ObligationfJue to Other Fu¡rds
Total LiabilitiesNet PosltlonFleld in Trust For Employee
Pension E encfitsTotal Net Assets
11'dditlonsContributions:
Plân MembersStateMunicipâlities'l'otal Contributior¡s
Investment IñcoheLess: Investment ExÞsnsesNet Invesment Income
Trãnsfer InOther
Total AdditionsI)cduct¡onsAdrninistrative ExpenseElenefit Payments and Ref$ds()ther
Total r)cductionsChanges in Net Assets
Net Pos¡tlon lleld ¡n Trust ForEmployee Penslon Be¡eflts:
Beginning ofYear (as restated)Ënd ofYear
$ 4,387 $
9,151
ro,662,2176al,a50
9,6141,444
363a
16,1o9,8039a6,457
3I 89,52313,352
I45
2,2oo,632154,923
289, I 526,559
1,522t30
24,936I,444
23945
29,252,a491,a43,271
4$
6,t59
l9297
8,248 $
I 8,o4o946,45A
1,656996,154
12$ $ 314 $ t2,96s
11,350,546 t7,tt6,207 202,89a 2.6tO.tOt
4
_______2t_il_z
s-6,559
t76,576
- 24lJ,9ó2
-_J-996 ___3)_311_,43!
$4168 1,45()
6a l,a9 t
$-13,352
13,352
$-154,923
154,923
$-t30
130
$ 8,081I ,a43,272
1,673I,453,(,26
10,ó68,655 16,120,053 1a9,546 2,455,17A 89,t4r 1,A36 29,524,409s___{.6t&qq¡ $,_t!.!?q4Þ1 $_____I_q9é36 î__2Atê,118 q______89,!1! q,!!!6 S_ ?9é?1¡!e
of Nêt PÕ.lflñn lOOlI.ì
Stâtc|connecticutMunlclpal ProbãteState
EmÞlovecs' Teachcrs' Judlclal Employccs' Judgcst Other Tot¡l
$ 187,339I,371,649
I,558,98432a,lo7
s
j
I,212,2tO503,807
1,a23,737
235 $ 43 s 434,2342,373,490
I 13,5152,921 ,239
901,307
228,lOO S984,1 rO
t,?91 $t7,'731
16,7-26 S
lr,sn5,33O
235 432,453 26
I 13,5r5t30'24161,5a4
(33,126\ (5O,tì65) (539ì (6,217) (24a\ (2) (9O,997'l294,941 452,942 4,791 55,367 2,2(J5 24
8,313
1,854,213 t,736,O35 24,313 !85,60a244 62,570
a,3131,3?O - 64,1a43,810 67 3,A04,046
?a33,6.4t,469
493,642,30t
t6t -'745
7a3I,657,585 4,925
l ,658,36a I ,A23,737 22,552 132,719 4,925t95,a45 <a7,7O2) r,76t 52,aa9 (1,1 15)
22,552 132,670_49
67
lo,472,alo 16,207,755 la7,7a5 2,4íj2,2a9 90,256 1,769 29,362,664s_-l_9.6_É_qf!s $___I_q.r2_q.o5_1 s__!99é39. $__2_.4¡9,!_28 $_____!9,r4 $__1,!!_q $__29,s21.49e
Note 13 Other Postemployment Benefits (OPEB)The State sponsors two defined benefit OPEB plans: theState Employee OPEB Plan (SEOPEBP) and the RetiredTeacher Healthcare Plan (RTHP). SEOPEBP isadministered by the State Comptroller (Healthcare Policyand Beneflt Division), and RTHP is administered by theTeachers' Retirement Board. None of these plans issuesstand-alone financial statements. However, financialstatements for these plans are presented in Note No. 14.
Støte Employee OPEB PlanPløn DescriptìonSEOPEBP is a single-employer defined benefit OPEB planthat covers retired employees ofthe State who are receivingbenefits from any State-sponsored retirement system, exceptthe Teachers' Retirement System and the MunicipalEmployees' Retirement System. The plan provides
healthcare and life insurance benefits to eligible retirees andtheir spouses. Plan benefits, required contributions of planparticipants and the State, and other plan provisions aredescribed in Sections 5-257 and 5-259 of the GeneralStatutes. As of June 30, 2013 (date of the latest actuarialvaluation), the plan had 67,593 retirees and beneficiariesreceiving benefits.
Pløn FandíngThe contribution requirements of the plan members and theState are established and may be amended by the Statelegislature, or by agreement between the State andemployees unions, upon approval by the State legislature.The cost of providing plan benefits is financedapproximately 100 percent by the.State on a pay-as-you-gobasis through an annual appropriation in the General fund.Administrative costs of the plan are financed by the State.
III-C-68

Retíred Teøcher Healthcøre PlønPløn DescríptíonRTHP is a single-employer defined benefit OPEB plan thatcovers retired teachers and administrators of public schoolsin the State who are receiving benefits from the Teachers'Retirement System. The plan provides healthcare insurancebenefits to eligible retirees and their spouses. Plan benefits,required contributions ofplan participants and the State, andother plan provisions are described in Section l0-183 oftheGeneral Statutes. As of June 30, 2014 (date of the latestactuarial valuation), the plan had 37,055 retirees andbeneficiaries receiving benefits.
Pløn FandingThe contribution requirements of plan members and theState are established and may be amended by the Statelegislature. The cost ofproviding plan benefits is financedon a pay-as-you-go basis as follows: active teachers pay forone third of plan costs through a contribution of 1.25 percentoftheir annual salaries, retired teachers pay for one third ofplan costs through monthly premiums, and the State pays forone third of plan costs through an annual appropriation inthe General Fund. Administrative costs of the plan arefinanced by the State.
AnnuøI OPEB Cost and Net OPEB OblígøtíonThe State's annual OPEB cost and the net OPEB obligationfor each plan for the current fiscal year were as follows(amounts in thousands):
SEOPEBP RTHPAmual Required Contribution $ 1,513,336 S 125,620
Interest on Net OPEB Obligation 399,381 3ó,881
Adjustment to Amual Required Contribution (371,050) (44,326)
Amual OPEB Cost 1,541,667 118,175
Contributions Made 546,284 25,145
Increase in net OPEB Obligation 995,383 93,030
Net OPEB Obligation - Begiming of Year 7,006,676 887,838
NetOPEBObligation-EndofYear$8,002,059$980,868
In addition, other related information for each plan for thepast three fiscal years was as follows (amounts inthousands):
Annual Pcrccntagc of NctF¡scal OPER Annual OPEB OPEBYe¡r Cost Cost Contributcd Obligation
SEOPEBP2015 $ 1,541,667 35.40/o S 8,002,0592014 s 1,560,006 33.07. $ 7,006,67620t3 $ r,316,612 4t.2yo S 5,96t,366
RTHP
Actuarial valuations of an ongoing plan involve estimates ofthe value of reported amounts and assumptions about theprobability of occurrence of events far into the future.Examples include assumptions about future employment,mortality, and the healthcare cost trend. Amountsdetermined regarding the funded status of the plan and theannual required contributions ofthe employer are subject tocontinual revision as actual results are compared with pastexpectations and new estimates are made about the future.The schedule of funding in progress, presented as requiredsupplementary information following the notes to thefinancial statements, present multi-year trend informationabout whether the actuarial value ofplan assets is increasingor decreasing over time relative to the actuarial accruedliability for benefits.
Actuaríal Methods ønd AssumptìonsProjections of benefits for financial reporting purposes arebased on the substantive plan (the plan as understood by theState and the plan members) and include the types ofbenefits provided at the time of each valuation and thehistorical pattern of sharing of benefit costs between theState and plan members to that point. The actuarial methodsand assumptions used include techniques that are designedto reduce the effects of short-term volatility in actuarialaccrued liabílities and the actuarial value of assets,consistent with the long-term perspective ofthe calculations.
Significant methods and assumptions were as follows:
$IOPBBP TTflI
,ArIulrialValuationÐatr
AcrriarI¡lColtftrhod
Anonrzalronlt{etllod
Reimmmg Anof ization Puiod
AsisValuationil{dlod
Åctluial,{ssNptrnns:
IIrrmtmerrtRatoiRelrm
PrqecldSaluylnutales
llmlhrarelnllaliorrRah
úJII3
hojechdlllit Cndit
L*el Perctnt nf Pa¡1 Clos( 3û Ytars
llYrm ¡
l,farltetValueolÄssrll
ú 10.14
BnÍyÄgo
lntlPmentofPa¡Opm
25Yem
ùlarklYalutof Aslsß
5.?flit
i,?5%
?,0t% pded lo 5,00% olu 5 ¡tm
45%(includes 3%irrilamnn$
3 ?5fr1,000r{ lmcludtl
3% inlìatton mre)
5 ?5% Inrtial, 5% llltimatc
Funded Støtus and Fundíng ProgressThe following is funded status information for theSEOPEBP and the RTHP as of June 30,2013 and 2014,respectively, date ofthe latest actuarial valuations (amountsin million):
ÅctuaLial U¡funded UÀALasa
,lccrucd AAL funded Covered Percenlageof
Li¡bility(AÂt) (UAAI) Ratio Pr¡roll CovrredPayloll
(aô) (c) (lhr)/c)
SEOPEBP 0,7% s
0.0% s
Other OPEB PlønThe State acts solely as the administrator and custodian ofthe assets of the Policemen and Firemen Survivors' BenehtFund (PFSBF). The State makes no contribution to and hasonly a fiduciary responsibility for this fund. The fund doesnot issue stand-alone financial statements. However,financial statements for this fund are presented in Note No.14.
Plan DescriptionPFSBF is a cost-sharing multiple-employer deflrned benefitOPEB plan that covers policemen and firemen ofparticipating municipalities in the State. As of June 30,2014 there were 9 municipalities participating in the planwith a total membership of 591 active members. The planprovides survivor benefits upon the death of an active orretired member of the fund to his spouse and dependent
20ts $zot4 g
2013 s
118,175l92,U5l179,620
21.30/0 It3.5yo sts.loÁ s
980,868887,838'720,942
Àctu¡ri¡l
Vahe of
.{$r€ls
(a) (b) (b¿)
551.8%
63.5%RTHP
3,f9.8
3,831.6
s143,8
s0
19,532.4
213t.0
19,616.3
2,$3.0
III-C-69

Connecticut
children. Plan benefits, contribution requirements of planrfiembers and participant municipalities, and other planprovisions are described in Sections 7-323a to 7-323i of theGeneral Statutes.
ContríbutionsPlan members are required to contribute one percent of theirannual salary. Participating municipalities are required tocontribute at an actuarially determined rate. Administrativecosts of the plan are financed by participating municipalities.
Note 14 OPEB Trust Funds tr'inancial StatementsThe financial statements of the OPEB trust funds areprepared using the accrual basis of accounting. Planmember and municipality contributions are recognized in theperiod in which they are due. State contributions arerecognized in the period they are appropriated. Benefits arerecognized when due and payable in accordance with theterms of each plan. Investment income and relatedinvestment expense of the Combined Investment Funds areallocated ratably to the PFSBF trust fund based on the fund'sequity in the Combined Investment Funds.
Slàtement ofFiduciåry Net PosilioÌ (000's)
Statc Rctircd Policcmcn,
Employeerr Teachers' Firemrû, and
OPDB Pl¡n Healthcarc Plan Sunlors'Bcncflls Totrl
Asseh
Casfi and C¡sh Eqüivalcnls
Rcccivables:
Accounls, N€t of Allowafc6
Fron Olher Funds
Int€rest
lnvestments
SecuLities Lrnding Collateral
Total ^ssetsLiabilltles
AccowtsPayable ud Àccned Liabilil $
Secu¡ti€s Lond¡úg 0biigatioil
-(8) 1,6,62
I 1,654
260,310 28,09't 288,407
17,287
þ-,,!lt\ L______%q!2 q________tq!! !____10,J¡1
Note 15 Capital and Operating LeasesStøte øs LessorThe State leases building space, land, and equipment toprivate individuals. The minimum future lease revenues forthe next five years and thereafter are as follows (amounts inthousands):
2016 $ 40,342
2017 39,2532018 32,4832019 31,792
2020 32,096Thereafter 8ó,948
Total 9_26291!
Contingent revenues for the year ended June 30, 2015, were$199 thousand.
Støte øs LesseeObligations under capital and operating leases as ofJune 30,2015, were as follows (amounts in thousands):
Noncancelable Capital
0peratinqLeases Leases
2rß2011
201 I2019
2020
2021.202s
2026-2030
203 1-2036
Total minimum leass payments
Irss: Amount reptesenting intere$ costs
Present value ofminimum lease paynents
$ 95,357 $ 53 $ 95,410
$
$ 145,806
1,121
6,531
5,614
4,700
6,161
6,102
1,215
44,252
8,884
$____Ii!q
92,431
I 8,181
9,308
14,615
ó,969
4,337
$
6,142
26,501 $
15,430
r,738 $ - $ 30,239
t,857 t1,281
Due To Other Funds
TomlLiúilities
Nct Posilion
Held in Trust For Other
Postcmploymcnt Bcnclits
Tot¡l Nct Assets
^ddldorsConlribulionsl
IIo Mcmbcrs
Statc
Municipalitics
Tolal Co¡lribulions
Invcslmett Incomc
L6s: Invcslment Expenses
Nel Investment Income
Othcr
Tot¡l ^ddido¡sDcductions
Âdnrinistrative Expense
Benefil Payne¡ls and Refunds
Transfer 0ut
Other
lot¿l Dcduütions
C¡anges ¡¡Nct Assets
Net Posilion Hcld in Trusl For
Other Postemplolmcnt Berefìts:
Beginnirg ofYear
End ofYear
85,5t7 $
25,t45
523
16,094 1,857 51,689
4,t63 4,163
Strren¡nl ôfChrn0Ps NetPos¡tion {000's)
State tetlred Pollcerne¡,
Employees' Teachen' Flremen, ¡nd
OPEBPhn He¡ìthcãrcPlan Surivor¡'Benefit Totâl
Minimum capital lease payments w€re discounted usinginterest rates changing from 3.66 percent to 6.00 percent.
Rental payments on noncancelable operating leases chargedto expenses during the year ended June 30, 2015,were$92.4million.
s 93,277 g
546,284
639,5ól
7,620
(16e)
6,851
66r,780
582,157
l5ó
156
2,532
I 13,350
I 13,087
8,3t3
166
t,289
862
(8?)
715
2,064
$ l?9,317
511,429
166
751,5t2
8,638
(856)
7,782
17,900
177,194
1,104 696,348
8,3t3
2626
582,183 121,400
19,591 (8,050)
04
960 12,501
104,681
III-C-70

Note 16 Long-Term DebtThe following is a summary of changes in long-term debt of the primary government for the year ended June 30, 2015, (amounts
in thousands):Beginning Ending Amounts due
Governmental Activities Balance Additions Reductions Bâlance within one year
Bonds:General ObligationTransportation
$ 15,281,579 g 2,736,220 s 1,61s,262 S 16,402,s37 S 1,212,6743,771,260 73t,s4s 4t3,265 4,089,540 256,845
19,052,8391,195.127
3,467,765386,856
2,028,527164,81 1
20,492,0771,417,172
1,469,519150,488Plus/(Less) Premiums
Total Bonds
Long-Term Notes
Other L/T Liabilities:'Net Pension Liability (Note 1 l)'Net Pension ObligationNet OPEB ObligationCompensated AbsencesWorkers' CompensationCapital Leases
Claims and JudgmentsLandfill Post Closure CareLiability on Interest Rate SwapsContracts Payable & Other
Total Other LiabilitiesGovernmental Activities Long-Term
Liabilities'?
'In prior years, the General and
20,247,966 3,854,621 2.193,338 2r,909,249 1,620,007
580,775 46t,6t0 522,t10 520,275 167,690
27,773,3832,559,6217,763,060
5 13,333
619,s7837,82046,t5135,7518,700
705
1,659,84332,233
137,770
3,03638,576
8,009
8,982,926499,00465 1,1 84
35,36875,58735, I 85
3,36r705
4,362,297 5,964,8492,559,621
439,97746,s62
106,r645,488
9,1408,57ss,339
26,170,831
42,414103,675
6,06031,149
39,358,102 6,241,764 9,145,715 36,454,151 r83,298
, $__q9$9,911 $_l_qt!z¿grTransportation funds have been used
$ ll 63 $58,883,675$ 1,970,995liabilities.to
' I'he beginning totals are restated by the efl'ect of roll-back procedures pertaining to reporting the net pension
liability following the guidance of GASB No.68 as of the June 30,2Ol4 measurement date.
Business-Type ActivitiesRevenue BondsPlus/(Less) Premiums and Discounts
Total Revenue Bonds
Compensated AbsencesFederal Loans PayableOther
Total Other LiabilitiesBusiness-Type Long-Term Liabilities
26s,696 $
27 731
1,297,229 293,427 123,140 1,467,s16
$ 1,212,681 $84,548
121,598t,s42
g 1,3s6,779 $110,737
I 10,0961,486
1 I 1,582
166,577433,569301,886
59,66660,60660,423
40, I 53
39t,t2tI 1,678
186,090103,054350,631
55,533
t3 719
902,032 180,695 442,952 639,775 69,252
s 2,199,261 s 474,122 $ 566.092 S 2.107.291 $ 180.834
The liability for claims and judgments (Governmental Activities) includes a pollution remediation liability of approximately $34.9million. This liability represents the State's share of the cost of cleaning up certain polluted sites in the state under federal and
state superfund regulations. The liability was estimated using the cash flow technique and could change over time due to changes
in costs ofgoods and services, changes in remediation technology, or changes in laws and regulations governing the remediationeffort. In addition, there are other polluted sites in the state that require remedial action by the State that will result in additionalcleanup costs. The State did not recognize a liability for these costs at year end because it could not be reasonably estimated.
As of June 30,2|l5,long-term debt of component units consisted of the following (amounts in thousands):
Long-Term Brlance Amounhdue
Debt June 30.2015 within vear
BondsPayable $ 4,532,155$ 35ó,199
EscrowDeposits 189,900 47,520
Closureoflandhlls -
AnnuitiesPayable 130,652 11,255
Rate swap liability 183,246
NetPensionliability 148,982
Other 30,624
Total $ 5,2i5,559$ 415,872
III-C-71

Connecticut
Landfill Closure and Postclosure CarePublic Act 13-247 a¡rd section 99 of Public Act 13-184required the Materials Innovation and Recycling Authorityto transfer all legally required reserves and obligationsresulting from the closure ofthe authority's landfills locatedin Hartford, Ellington, Waterbury, Wallingford and Sheltonto the State Department of Energy and EnvironmentalProtection (DEEP). The transfer of legal obligationsresulting from the closure of landfills was addressed by amemorandum of understanding ("MOU') between theAuthority and DEEP. The MOU became effective April 24,2014 at which point in time DEEP began reimbursing theAuthority for all postclosure care and maintenance work atall landfills other than the Hartford landfill and the partiesbegan a transition process to assign vendor contracts for theperformance of landfill postclosure care work to DEEP andto assign federal and state licenses, permits, and orders("Authorizations") related to the landfills to DEEP.
During the year ended June 30,2075, all work associatedwith the closure of the Hartford landfill was completed.DEEP assumed the obligation to reimburse the authority forall postclosure care work for the Hartford landfill upon thelandfill being certified as closed. All landfill expensereimbursements paid by DEEP totaled $112,000 in FY20l5.
GASB Statement No.l8 Accounting þr Municípal SolidI(aste Landfill Closure and Postclosure Care Cosl applies toclosure and postclosure care costs that are paid near or afterthe date a landfill stops accepting waste. The Staterecogni4es landfill expenditures and related General Fundliabilities using the modifìed accrual basis of accountíng.DEEP estimates the State's landfill liability for closure andpostclosure costs based on landfill capacity. Increases ordecreases in such estimates are reported as additions orreductions in this line item of the State's long-termliabilities. The liability for these estimated costs is reducedwhen the costs are actually paid. Actual costs may be higherthan estimated due to inflation or changes in permittedcapaçity, technology or regulation. As of June 30,2013, allfive of the landfills had no capacity available since 100percent oftheir capacity had been used.
Note 17 Long-Term Notes and Bonded Debt
^. Bond Anticipation NotesIn February 2015 the State issued General Obligation 2015series A Bond Anticipation Notes (BANS) to restore fundbalances in its Capital Project Funds that had fallen belowexpectations just prior to the completion of a public debtoffering one month later. All BANS were retired upon the$400 million issuance of General Obligation 2015 series Abonds on March 13, 2015.
b. Economic Recovery NotesIn December 2009, Public Act 09-2 authorized the issuance
$915.8 million of General Obligation Economic RecoveryNotes which were used to fund a major portion of the State'sGeneral Fund deflrcit at that time. In October 2013, a portionof these notes were refunded when the State issued $314.3million of General Obligation Refunding Notes which wereissued in four series as variable-rate remarketed obligations(VRO) that ultimately mature on January 1, 2018. Any
series of these notes may be converted by the State at anytime from the VRO rate, which is determined by theremarketing agent on a daily basis, to another interest ratemode - such as an adjusted SIFMA rate mode.
If the State decides to convert the interest rate mode, eachholder is required to tender their notes for conversion whilethe State has agreed to make available supplementaryinformation describing the notes following the conversion.If any tendered VRO's of a series are not successfullyremarketed they may continue to be owned by theirrespective holders until the VRO Special MandatoryRedemption Date. That series of notes in that case wouldbear interest at a higher stepped-up rate. The liquidityavailable to purchase tendered notes is only provided byremarketing resources and the State's general fund. In theopinion of management, the higher cost precludes thelikelihood of conversion by the State. The original VROinterest rate modes remain in effect at the end of the fiscalyear.
Total Economic Recovery and VRO Notes outstanding atJune 30, 2015 were $520.3 million. The notes mature onvarious dates through 2018 and bear interest rates from 3.0to 5.0 percent. Future amounts needed to pay principal andinterest on these notes outstanding at June 30, 2015 were as
follows (amounts in thousands):Year f,nding
June 30, Principrl Interest Total
2016 $ 16?,690$ 18,570$ 186,260
2017 t15,465 9,360 184,825
201 I I'11 120 3,958 181,078
Total g 520,215 $ 31,888S 552,163
c. Primary Government - Governmental ActivitiesGenerul Oblígøtìon BondsGeneral Obligation bonds are those bonds that are paid outof the revenues of the General Fund and that are supportedby the fulI faith and credit of the State. General Obligationbonds outstanding and bonds authorized but unissued at June30,2015, were as'follows (amounts in thousands):
Iinal 0üginal Authofized
Maturity Inhrest ,Amount But
Purposc ofBonds Datrs Rrtrs Ouhtandine Unhsurd
Capilal lnprovemenls
School Constnclion
Municipal & Other
Gmnls &loam
Housing Asistance
Elimination ofWater
Pollution
Genual 0bligation
Refunding
GAAP Convcnion
Pension 0bligation
Miscellaneous
2016-2035
201ó-2035
r.00.s.75% $
1.00-5.?50%
2,131,821 $ $70,919
4,680,451 5
20t6-2035
2016-203t
0.?13.5.632%
0.25-5.460%
20ró-203r 2.91.5.09%
2,083,597
335,245
832,966
20t,753
214,914
3,384252
351,208
5ó0,430 151,500
2,230,543
86,340 4l,70!
ró,307,5ee L_452!i294,918
$ 16,402,53?
2016-2û38
201()-2021
20t6.2032
2016-2034
1.50-5.50%
1.00.5.00%
4.55.6.21%
3,00-5.125%
ITI-C-72
Arcretion-Varous Capital Appreciation Bonds
Total
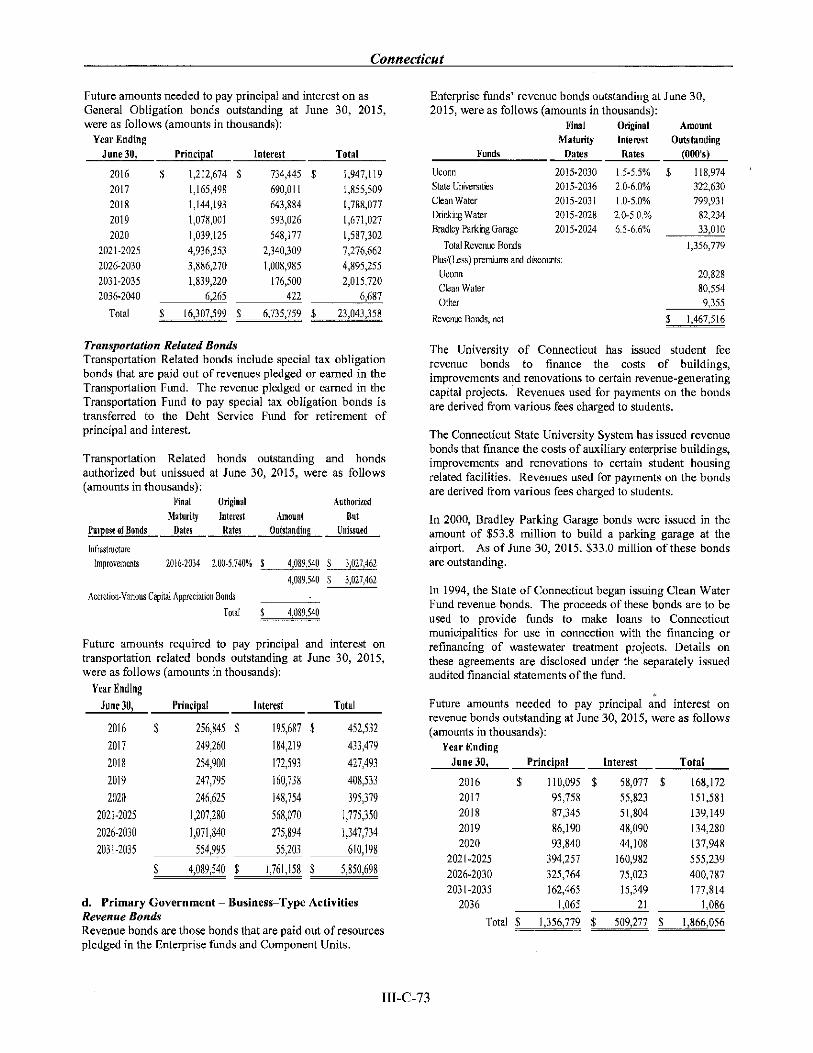
Connecticut
Future amounts needed to pay principal and interest on as
General Obligation bonds outstanding at June 30, 2015,were as follows (amounts in thousands):
Year Ending
June 30, Principal Interest Tot¡l
Enterprise funds' revenue bonds outstanding at June 30,2015, were as follows (amounts in thousands):
Final Original Amount
Maturity Intercst Outstanding
Funds Dates Rates (000's)
Uconn 2015-2030
State Univenities 2015-2036
CleanWater 2015-2031
DnnkingWater 2015-2028
Bradley ParkingGarage 2015-2024
Total Revenue Bonds
Plus(Les$ premiuns and discor¡rts:
Uconn
Clean Water
Other
Revenue Bo¡ds, net
201,6
z017
201 8
20t9
2020
202t-2025
2026-2030
2031-2035
2036-2040
Total
t,212,674 $
1,165,498
1,144,193
1,078,001
I,039,125
4,936,353
3,886,270
1,839,220
6,265
734,445 $
690,01 I
643,884
593,026
548,t77
2,340,309
1,008,985
r 76,500
422
1,947 ,119
I,855,s09
1,788,077
1,671,027
t,s87302
7,276,662
4,895,255
2,015,720
6,687
L5-5,5%
2.0-6.0o/o
1.0-5.0%
2.0-5.0.yo
6.5-6.60/o
$ I 18,974
322,630
799,931
82,234
33,010
1,356,779
$
$ 16,307,599 $ 6,735,759 $ 23,043,358
20,828
80,554
9,355
$ 1,467,516
Tran spo rtøt io n Reløted B o nd sTransportation Related bonds include special tax obligationbonds that are paid out ofrevenues pledged or eamed in theTransportation Fund. The revenue pledged or earned in theTransportation Fund to pay special tax obligation bonds istransferred to the Debt Service Fund for retirement ofprincipal and interest.
Transportation Related bonds outstanding and bondsauthorized but unissued at June 30,2015, were as follows(amounts in thousands):
Final Originrl Authorized
Mrturity lnterest Âmount But
Prrpose of Bonds Dates Rates Outstanding Unissued
lnfrastn¡cture
Improvements 2016-2034 2.00-5.740% $ 4,089,540 S 3,027,462
4,089,540 S 3,027,462
Accretion-Various Capital Appreciation Bonds
Total !____$qÉq
Future amounts required to pay principal and interest ontransportation related bonds outstanding at June 30, 2015,were as follows (amounts in thousands):
Yerr Inding
Prinripal Interest Total
The University of Connecticut has issued student feerevenue bonds to finance the costs of buildings,improvements and renovations to certain revenue-generatingcapital projects. Revenues used for payments on the bondsare derived from various fees charged to students.
The Connecticut State University System has issued revenuebonds that finance the costs of auxiliary enterprise buildings,improvements and renovations to certain student housingrelated facilities. Revenues used for payments on the bondsare derived from various fees charged to students.
In 2000, Bradley Parking Garage bonds were issued in theamount of $53.8 million to build a parking garage at theairport. As of June 30, 2015, $33.0 million of these bondsare outstanding.
In 1994, the State of Connecticut began issuing Clean WaterFund revenue bonds. The proceeds ofthese bonds are to beused to provide funds to make loans to Connecticutmunicipalities for use in connection with the financing orrefinancing of wastewater treatment projects. Details onthese agreements are disclosed under the separately issuedaudited financial statements of the fund.
Future amounts needed to pay principal and interest onrevenue bonds outstanding at June 30, 2015, were as follows(amounts in thousands):
Year Ending
June 30, Principal Interest Total
$ r 10,095
95,758
87,345
86, l 90
93,840
394,257
325,764
t62,465
1,065
$ 58,077 $
55,823
5 1,804
48,090
44,t08
160,982
75,023
t5,349
21
168,172
151,581
139,t49
t34,280
t37,948
555,239
400,787
177,8t4
1,086
June 30,
2016
20t7
201 8
20t9
2020
2021-2025
2026-2030
2031-2035
256,845 $
249,260
254,900
241,795
246,625
1,207,280
1,071,940
554,995
195,687 $
184,219
112,593
I 60,738
148,154
568,070
215,894
55,203
452,532
433,479
427,493
408,533
395,379
1,775,350
1,347,734
610,1 gg
2016
2017
201 I20t9
2020
202t-2025
2026-2030
203t-2035
2036
$ 4,099,540 $ l,76l,15g $ 5,950,699
d. Primary Government - Business-Type ActivitiesRevenue BondsRevenue bonds are those bonds that are paid out ofresourcespledged in the Enterprise funds and Component Units.
$t
trI-c-73
Total $ 1,356,779 s 509,277

Connectìcut
e. Component UnitsComponent Units' revenue bonds outstanding at June 30,2015, were as follows (amounts in thousands):
Final AmountMaturity Interest Outstanding
Component Unit Date Rates (000's)
CT Housing Finance Authority 2016-2055 0.15-5.50% $ 3,801,418
CT Student Loan Foundation 2016-2047 0.00-1.671% 312,100
CT Higher Education
Supplemental Loan Authority
CT Airport Authority
CT Regional
Development Authority
UConn Foundation
CT lnovations lnc.
Total Revenue Bonds
I 54,090
129,415
4,514,308
PluV(Less) premiums and discounts:
per the resolution and $4.6 million per the indenture at12131/14. As of December 31, 2014, the Authority hasentered into interest rate swap agreements for $807.4 millionof its outstanding variable rate bonds. Details on theseagreements are disclosed under the separately issued auditedfinancial statements of the Authority.
Materials, Innovation, and Recycling Authority's revenuebonds are issued to finance the design, development andconstruction of resources recovery and recycling facilitiesand landfills throughout the State. These bonds are paidsolely from the revenues generated from the operations ofthe projects and other receipts, accounts and monies pledgedin the bond indentures.
Connecticut Higher Education Supplemental LoanAuthority's Revenue bonds are issued to provide loans tostudents, their parents, and institutions of higher education toassist in the financing ofthe cost ofhigher education. Theseloans are issued through the Authority's Bond fund.According to the bond resolutions, the Authority internallyaccounts for each bond issue in separate funds, andadditionally, the Bond fund includes individual funds andaccor¡nts as defined by each bond resolution.
CapítøI ResewesEach Authority has established Special Capital Reservefunds that secure all the outstanding bonds of the Authorityat year-end. These funds are usually maintained at anamount equal to next year's bond debt service requirements.The State may be contingently liable to restore anydeficiencies that may exist in the funds in any one year inthe event that the Authority is unable to do so.
The Capital Region Development Authority revenue bondsare issued to provide sufficient funds for carrying out itspurposes. The bonds are not debt ofthe State ofConnecticut.However, the Authority and the State have entered into acontract for financial assistance, pursuant to which the Statewill be obligated to pay principal and interest on the bondsin an amount not to exceed $9.0 million in any calendaryear. The bonds are secured by energy fees from the centralutility plant and by parking fees subject to the TravelersIndemnity Company parking agreement.
Future amounts needed to pay principal and interest onComponent Unit revenue bonds outstanding at June 30,2015, were as follows (amounts in thousands):
Year EndingJune 30, Principal Interest Total
2016-2036 0.40-5.25%
2016-2032 %/l mth libor
CHFA
CSLF
CHESLA
CRDA
Revenue Bonds, net
2016-2034
2016-2029
2016-2020
1.00-7.00%
L90-5.00%
4.90-5.25%
89,015
25,510
760
I 7 ¿.\1
(874)
I,s88
(324)
q__lJ¿llr
Revenue bonds issued by the Component Units do notconstitute a liability or debt ofthe State. The State is onlycontingently liable for those bonds as discussed below.
Following the merger of the operations of the ConnecticutDevelopment Authority, Connecticut Innovations,Incorporated (CII) assumed responsibility for the formerauthority's Special Obligation Industrial revenue bonds.The bonds were issued to finance such projects as theacquisition of land, the construction of buildings, thepurchase and installation of machinery, equipment, andpollution control facilities. These activities are financedunder its Self-Sustaining Bond Program which is describedin the no-commitment debt section of this note. In addition,CII has $2.8 million in General Obligation bondsoutstanding at year-end. These bonds were issued to financethe lease ofan entertainment/sports facility and the purchaseof a hockey team.
Connecticut Housing Finance Authority's revenue bonds areissued to finance the purchase, development andconstruction of housing for low and moderate-incomefamilies and'persons throughout the State. The Authorityhas issued bonds under a bond resolution dated 9/27/72, aspecial needs indenture dated 9125195, and other bondresolutions dated October 2009. As of December 31,2074,bonds outstanding under the bond resolution, the indenture,and other bond resolutions were 53,222.9 million, $60.5million, and $385.4 million respectively. According to thebond resolution, the following assets of the Authority arepledged for the payment of the bond principal and interest(1) the proceeds from the sale of bonds, (2) all mortgagerepayments with respect to long-term mortgage andconstruction loans f,rnanced from the Authority's Generalfund, and (3) all monies and securities of the Authority'sGeneral and Capital Reserve funds. The resolution andindenture Capital Reserve funds are required to bemaintained at an amount at least equal to the amount ofprincipal, sinking fund installments, and interest maturingand becoming due in any succeeding calendar year on alloutstanding bonds. The required reserves are $235.6 million
20162017201 I20192020
2021-20252026-20302031-2O352036-2040204t-204s2046-20sO205 I -205520s6-2060
133,524 S
141,663145,O54
150,844195,9878to,474848, I 82
905,091
647,"784
279,t28226,49229,460
625
10s,994 $10s,7121o3,28299,8s4
l07,57A427,75s"t)) 2) 1
198,362
102,70873,5t4,q ala?
s,984
239,s18247,37s248,336250,698303,565
1,238,229I,171,0031,103,453
7so,492352,642255,585
3s,444625
s
TIT-C-74
$----41! 9q Lls82'6s7- q--q2q2É¡

Connecticut
No-commítment debtUnder the Self-Sustaining Bond program, acquired from itscombination with the Connecticut Development Authority,Connecticut Innovations, Inc., issues revenue bonds tofinance such projects as described previously in theComponent Unit section of this note. These bonds are paidsolely from payments received from participating companies(or from proceeds of the sale of the specific projects in theevent of default) and do not constitute a debt or liability ofthe Authority or the State. Thus, the balances are notincluded in the Authority's financial statements. Totalbonds outstanding for the year ended June 30, 2015 were$491.1million.
The Connecticut Health and Educational Facilities Authorityhas issued Special Obligation bonds for which the principaland interest are payable solely from the revenues of theinstitutions. Starting in 1999, the Authority elected toremove these bonds and related restricted assets from itsfinancial statements, except for restricted assets for whichthe Authority has a fiduciary responsibility. Total SpecialObligation bonds outstanding at June 30, 2015, were58,412.2 million, of which $323.5 million was secured bySpecial Capital Reserve funds.
The Materials, Innovation, and Recycling Authority haveissued several bonds to fund the construction of wasteprocessing facilities by independent contractors/operators.These bonds are payable from a pledge ofrevenues derivedprimarily under lease or loan arrangements between theAuthority and the operators. Letters of credit secure some ofthese bonds. The Authority does not become involved in theconstruction activities or the repayment of the debt (otherthan the portion allocable for Authority purposes). In theevent of a default, neither the authority nor the Stateguarantees payment of the debt, except for the Statecontingent liability discussed below. Thus, the assets andliabilities that relate to these bond issues are not included inthe Authority's financial statements. The amount of these
bonds outstanding at June 30, 2015 was $48.8 million. TheState may be contingently liable for those bonds that aresecured by special capital reserve funds as discussedpreviously in this section.
f,, Debr RefundíngsDuring the fiscal year the State issued General Obligationand Special Tax Obligation bonds of $466.9 million at anaverage coupon interest rate of 4.77 percent to advancerefund $503.9 million of General Obligation and Special Tax
Obligation bonds with an average coupon interest rate of4.83 percent. Although the advance refunding resulted in a$24.7 million accounting loss, the State in effect reduced itsaggregate fund level debt service payments by $63.9 millionover the next 12 years. The present value ofthese savingsrepresents an economic gain (diflerence between the presentvalues ofthe debt service payments ofthe old and the newbonds) of $48.7 million.
The proceeds ofthe refunding bonds were used to purchaseU.S. Govemment securities which were deposited intoirrevocable trust accounts with an escrow agent to providefor all future payments on the refunded bonds. Thus, therefunded bonds were removed from the State's financialstatem€nts as they are considered defeased.
Additional defeasance occurred during the hscal year whenthe State issued General Obligation SIFMA Index bonds andnotes totaling 5242.4 million at an average coupon variableinterest rate of 0.78 percent to advance refund $241.0million of General Obligation bonds and notes with anaverage coupon interest rate of 2.4 percent. The resultingcash flow savings on the variable interest rate SIFMA indexrefunding bonds and notes was $2.2 million.
In prior years, the State placed the proceeds of refundingbonds in irrevocable trust accounts to provide for all futuredebt service payments on defeased bonds. The assets ofthetrust accounts and the liability for defeased bonds are notincluded in the State's financial statements. As of June 30,2015, the outstanding balance of bonds defeased in prioryears was approximately $747.7 million.
Note 18 - Derivative Financial InstrumentsThe fair value balances and notional amounts of the State'sderivative instruments outstanding at June 30, 2015,classified by type, and the changes in fair value of suchderivative instruments for the year then ended are as follows(amounts in thousands; debit (credit)):
Changts in Fah Value ldr Value ¡t Year tnd
Classification ,{mount Clmsification ,Anount Notion¡l
Covernmentaldivitirs
Cash{lorvhedges: Delinrd
Pay-fixdinteresl outf'lorvof
rahstvap Resounr¡
Non cunent
portion ofLT
(5,340) 0bligation $ (1,3ól) $ 55,ó20
III-C-75

Objective and Terms of Hedging Derivative InstrumentsThe following table displays the objective and the terms of the States' governmental activities hedging derivative instrumentsoutstanding at June 30, 2015, along with the credit rating ofthe associated counterparty (amounts in thousands).
Ivpe Obiective
Notional
Àmounts [ffective Mrturity1000's) Date Date
Pay-fixed interest
rate swap
Pay-fixed interest
rate swap
Pay-fixed interest
rate swap
Hedge ofchanges in cash flows ofthe
2005 G0bonds $
Hedge ofchanges in cash flows ofthe
2005 GO bonds
Hedge ofchanges in cash flows ofthe
2005 G0 bonds
15,620
20,000
20,000
412712005
412712005
412712005
61U2016
6l|2017
61112020
. Terms
Pay 3.99% receive CPI plus .65%
Pay 5.07% receive CPI plus 1.73%
Pay 5.2% receive CPI plus 1.79%
Counterparty
Credit Ratinq
A3/A.
A3/A-
A3/A
TolalNotional Amount $-____åeq
The fair values of interest rate swaps were estimated using the zero-coupon method. This method calculates the future netsettlement payment required under the swaps, assuming that the current forward rates implied by the yield curve correctlyanticipate future spot interest rates. These payments are then discounted using the spot rates implied by the current yield curve forhypothetical zero-coupon bonds due on the date each future net settlement on the swaps.
Credít RìskAs ofJune 30, 2015, the State had no credit risk exposure onany of the swaps because the swaps had negative fair value.However, should interest rates change and the fair values ofthe swaps become positive, the State would be exposed tocredit risk in the amount of the swaps' fair value.
Basis RiskThe State's variable-rate bond interest payments are basedon the CPI floating rate. As of June 30, 2015 the Statereceives variable-rate payments from the counterparty basedon the same CPI floating rate.
Termination RiskThe State or the counterparty may terminate any of theswaps if the other party fails to perform under the terms ofthe contract. If any swap is terminated, the associatedvariable-rate bonds would no longer carry synthetic interestrates. Also, if at the time of termination the swap has anegative fair value, the State would be liable to thecounterparty for a payment equal to the swap's fair value.Under the 2005 swap agreements, the State has up to 270days to fund any required termination payment.
Rollover RiskBecause all of the swap agreements terminate when theassociated debt is fully paid, the State is only exposed torollover risk if an early termination occurs. Upon an earlytermination, the State will not realize the synthetic rateoffered by the swaps on the underlying debt issues.
Hedging Derivative Instrument Payments and Hedged DebtAs rates vary, variable-rate bond interest payments and netswap payments will vary. Using rates as of June 30,2015,debt service requirements ofthe State's outstanding
variable-rate bonds and net swap payments are as follows(amounts in thousands):
Fiscal Year Variable-Rate Bonds Interest Rate
lndinsJune30. Princinal Interest SlVAP.Net
2016 $ 15,620 $ 1,732 $
2017 20,000 t,367
2018 ó90
2019 690
2020 20,000 ó91
$___$qq $._-Lllq E_____2t!1 !____-!u]l
Note 1.9 Risk ManagementThe risk financing and insurance program of the State ismanaged by the State Insurance and Risk ManagementBoard. The Board is responsible mainly for determining themethod by which the State shall insure itself against lossesby the purchase of insurance to obtain the broadest coverageat the most reasonable cost, determining whether deductibleprovisions should be included in the insurance contract, andwhenever appropriate determining whether the State shallact as self-insurer. The schedule lists the risks of loss towhich the State is exposed and the ways in which the Statefinances those risks.
Risk Financed by
Risk of l¡ss
Purchase ofCommercialInsurance Insurance
Liability (Torts):
-General (State buildings,parks, or grounds)
-Other
Theft of, damage to, ordestruction ofassets
Business intemrptions
Enors or omissions:
-Professional liability-Medical malpractice
(John Dempsey Hospital)
Injuries to employees
Natural disasters
945
681
350
350
349
Total
18,297
22,054
r,040
1,040
21,040
Self-
xX
XX
X
xX
X
rr-c-76

Connecticut
For the general liability risk, the State is self-insured becauseit has sovereign immunity. This means that the State cannotbe sued for liability without its permission. For otherliability risks, the State purchases commercial insuranceonly ifthe State can be held liable under a particular statute(e.g. per Statute the State can be held liable for injuriessuffered by a person on a defective State highway), or if it isrequired by a contract.
For the risk of theft, of damage to, or destruction of assets(particularly in the automobile fleet), the State insures onlyleased cars and vehicles valued at more than $100 thousand.When purchasing commercial insurance the State may retainsome of the risk by assuming a deductible or self-insuredretention amount in the insurance policy. This amountvaries greatly because the State carries a large number ofinsurance policies covering various risks. The highestdeductible or self-insured retention amount assumed by theState is $25 million, which is carried in a railroad liabilitypolicy.
The State records its risk management activities related tothe medical malpractice risk in the University of Connecticutand Health Center fund, an Enterprise fund. At year-end,liabilities for unpaid claims are recorded in the statement ofnet position (government-wide and proprietary fi¡ndstatements) when it is probable that a loss has occurred andthe amount of the loss can be reasonably estimated. The
liabilities are determined based on the ultimate cost ofsettling the claims, including an amount for claims that have
been incurred but not reported and claim adjustmentexpenses. The liabilities are actuarially determined and theunpaid liability for medical malpractice is reported at itspresent value, using a discount rate of 5 percent. In theGeneral Fund, the liability for unpaid claims is onlyrecorded if the liability is due for payment at year-end.Settlements have not exceeded coverages for each ofthe past
three fiscal years. Changes in the claims liabilities duringthe last two fiscal years were as follows (amounts inthousands):
Governmental Business-T1pe
Activities Activities
lVorkers' Medical
Compensation Malpractice
Balance 6-30-13
Incuned claims
Paid claims
Balance 6-30-14
Incuned claims
Paid claims
Balance 6-30-15
587,652 $
135,624
(103,698)
$ 19,889
2,435
(44e)
6l 9,578
137,770
(r06,164)
21,815
9,884
(5,009)
$ 651,184 $ 26,750
Note 20 Interfund Receivables and PayablesInterfund receivable and payable balances at June 30, 2015, were as follows (amounts in thousands)
ld¡Nrdlttoftd{$)
Rtlttirhd enil& 0tlr
0r¡rr¡l Tnnnorhlim Crufi&lrroun¡ Lrulrorm ftvsmml¡l ll0tnr
$hh Conrunity/ lmplqmnl
lJdnnilir¡ TrrfidrdColhtr,r !11U!! fohl
Inhmd Componmt
$mtugl lijlllu ljdtr
Bdrnrtdltfromfundßì
0unal
Debt$uwe
kllrided tnnb &,{cr,{ur$
0ru1&hanhpmr
0t[uGovermrtnlal
lJConn
$tlh l]nivsritir¡
htffndlcrtctl
Iiduuary
ConponmtlJnitr
Toül
$ .$ $ 44$ 4$ 23r,r?4$ 4J,0i?$ 118ú8$ rúl0r$ ór5$ úril$ 4,1t2$
úl?ó
1ff02 li4/fi l[l8ú r0l,t34
I,t{] l,l9l
$ 84J82$ 1,2úT$ 113ú$ 4$ lj4,0jt$ 199,51[$ 4?,tJ4$ ll8,l35$ t2J$ ó,ill$ i,818$ t,9Jú
t16?
$ ll4,lll
l,lí,i
lJ{l
tI
304;2i1
r1604
4,130
ll,l43
j,836
rloJJ
$ ?lj,lil
2J6i
2[
1,0ú9
rlrû4
4,1J0
l2,J{3
l,l5ú{l[0
Interfund receivables and payables arose because of interfund loans and other interfund balances outstanding at year end.
Iil-C-77

Connectícut
Note 21 Interfund TransfersInterfund transfers for the fiscal year ended June 30, 2015, consisted ofthe following (amounts in thousands):
llmount lranderrd to fund(s)
Deht Rertdded Grmh& 0thrr
Gentrd $enitt Tmrlrport¡tion Crmt¡&,Acrounts lomProgr¡m torrnmtntd UConn
$lfir Communityi
l]nivfldlim T$}rnitllColksot
Ch¡nlVrtu&
Ddnltinsilil$ ü!¡ú[ Totâl
Amount transftrrd from fund(s)
0eneral
Debt Sen'ice
Transporlation
Restnchd 0rants & Acmunts
0mnß & Loan Progams
Other0ovrmmtntal
[mploynent $ecuily
Clmn \Vater & Drinkrng lVatu
liduciary
Total
$ 41,19? $
6,251
$ $ l,l,i4,ó25
. 2,841
. 480,520
- 31,95ó
. l2l,ó95
. 116,152
. 12,?90
'59l8,311 8,113
l_i,ll] $ 2,11fll
ó,1?5
459,020
61,80,l
(9,53ó)
6,50û
?2,ól I S
15,000
r2ó,l¡l
626,8û,i $ 28i,007 $ 28?,19ó $
38t,501 104,314 51,14ó 1,031
1r,95ó
l2i,ó85
i0,l2l 4,000 15,194
12,790
59l
Ltlw uq{ $ 4?,449 $ il1,894 $ 4,0û0 L___!!t !_1,!!!t!! !_lEt!! l____t!e $ l,0lt
Transfers were made to (l) move revenues from the fund that budget or statute requires to collect them to the fund that budget orstatute requires to expend them.and (2) move receipts restricted to debt service from the funds collecting the receipts to the debtservice fund as debt service payments become due.
Note 22 Restatement of Net Position, Fund BalanceClassifications, and Restricted Net PositionRestatement of Net PositionDuring the fiscal year 2015, the State implemented thefollowing new accounting standards issued by theGovernmental Accounting Standards Board (GASB).
GASB Statement 68, Accounting and Financial Reporting
þr Pensíons
GASB Statement 71, Pension Transítion for ContributionsMade Subsequent to the Measurement Date.
GASB Statements 68 and 7l - These Statements createstandards for measuring and recognizing liabilities, assets,
deferred outflows of resources, deferred inflows ofresources, and expenditures for pensions provided toemployees of the primary govemment and its componentunits. It requires the State to record the State's proportionateshare of the net pension liability in the govemment-widefinancial statements and the component unit financialstatements.
Governmental activities beginning net deficit was $17.4billion. Beginning net position of governmental activitieswas reduced by $25.6 billion on the Statement of Activitiesas a result of implementing these Statements. See note 11
for further information on pension reporting.
For fiscal year 2015, Component Unit beginning net positionwas $2.4 billion. As a result of implementing GASBStatements 68 and 71, lhe beginning net position for theComponent Units was reduced $86.6 million on theStatement of Activities resulting in a restated beginning netposition of $2.3 billion. This reduction is reported on the
Combining Statement of Activities - Component Units as
well. The following component units implemented GASB68 and 7l which resulted in a decrease net position toConnecticut Lottery Corporation of $48.0 million,Connecticut Airport Authority of $54.8 million, ConnecticutInnovations, Incorporated of $25.6 million, and ConnecticutGreen Bank of $14.9 million. The final revision made toComponent Units was the addition of the ConnecticutStudent Loan Foundation as a component unit in fiscal year2015. This resulted in an increase to Component Unit netposition of $56.7 million. The Connecticut Housing FinanceAuthority (major Component Unit) did not implementGASB 68 and 7l in fiscal year 2015 because it has a fiscalyear ending December 31.
During fiscal year 2015, the Municipal Employees'Retirement System (MERS) became aware that employercontributions receivable had not been reported in accordanceto GAAP in prior fiscal years. Pripr to fiscal year 2015, areceivable for transition liabilities owed to MERS by certainemployers that joined the State Rate Pool was not reported.
In the Statement of Changes in Fiduciary Net Position NetPosition Held in Trust for Pension Benefits was increased by9226.9 million to reflect the recognition of contributionsreceivable related to the pre-SLGRP transition liabilities.
Special ItemsSpecial items are signihcant transactions within the control ofmanagement that are either unusual in nature or infrequent inocct¡lTence.
Until 2010, the Connecticut Student Loan Foundation (CSLF)administered the Federal Family Education Loan Program
'(FFELP) as the State designated guarantee agency. CSLF's
III-C-78

Connecticut
responsibilities as a guarantee agency included making claimpayments to lenders whose loans it had insured and collectingdefaulted loans from borrowers. CSLF transferred itsguarantor operations to a third party. CSLF had the right to50% of collection retention revenues in excess of operatingcosts on claims paid under the guarantees transferred by CSLFthrough December 2014.
The Budget Act of2013 included a provision that reduced thecompensation that guaranty agencies receive for rehabilitatinga loan from the FFELP beginning July 1,2014.
Funds which CSLF receive under this special item arerestricted and may be used only for the educational purposesas specified and for the benefit of higher educationalinstitutions located in the State and for supporting efforts inthe State for the benefit of Connecticut students and theirfamilies for college access and completion. Any fundsdistributed to CSLF are to be distributed on an annual basiswithin 60 days of the end of each Federal fiscal year by thethird party guarantor. Revenue from this special item as ofJune 30,2015 was $1,259.
Fund Balance - Restricted and AssignedAs of June 30,2015 restricted and assigned fund balances ofnonmajor governmental funds were comprised as follows(amounts in thousands):
Restricted Assigned
Purposes Purposes
CapitalProjects $ 56,339 $
Environmental Programs 50,146
HousingPrograms 199,668
Employment Security Administration 13,121
Banking 14,111
0ther 89 ln 10,594
I 423,162 $ 10,594
Restricted Net PositionAs of June 30, 2015, the government-wide statement of netposition reported $3,039 million of restricted net position, ofwhich $278.0 million was restricted by enabling legislation.
Note 23 Related OrganizationsThe Community Economic Development Fund is a legallyseparate organization that is related to the State because theState appoints a voting majority of the organizationgoverning board. However, the State's accountability forthis organization does not extend beyond making theappointments.
Note 24 New Accounting PronouncementsIn 2015, The State implemented the following statementsissued by the Govemmental Accounting Standards Board("GASB').
Accounting and Financial Reporting for Pensions anømendrnent of GASB Statement No. 27 (Statement No. 68) -This Statement improves accounting and financial reportingby the State for pension reporting. It also improvesinformation provided by state governmental employers
about financial support for pensions that are provided byother entities. As a result of implementing this Statement,presentation and terminology changes were made to the fundfinancial statements and government-wide statements as
necessary in addition to the immediate recognition of certainelements.
Pension Transition for Contributions Made Subsequent tothe Measurernent Date (Statement No. 7l) - This Statementimproves accounting and financial reporting by addressingan issue in Statement No. 68, Accounting ønd FinancialReporting for Pensions, concerning transition provisionsrelated to certain pension contributions made to definedbenefit pension plans prior to implementation of thatStatement by employers and nonemployer contributingentities.
Note 25 Commitments and ContingenciesA. CommitmentsPrímary GovernmentCommitments are defined as "existing arrangements to enterinto future transactions or events, such as long-termcontractual obligations with suppliers for future purchases atspecified prices and sometimes at specified quantities." Asof June 30, 2015, the Departments of Transportation andConstruction Services had contractual commitments ofapproximately $3,689 million for infrastructure and otherconstruction projects. Additionally, other commitmentswere approximately as follows:
School construction and alteration grant program $3,129million.
Clean and drinking water loan programs $652 million.
Various programs and services $3,901 million.
All commitments are expected to be funded by federalgrants, bond proceeds, and other resources.
Component UnítsAs of December 31,2014, the Connecticut Housing FinanceAuthority had mortgage loan commitments of approximately$137.8 million.
B. ContingentLiabilitiesThe State entered into a contractual agreement with H.N.S.Management Company, Inc. and ATE Management andService Company, Inc. to manage and operate the bustransportation system for the State. The State shall pay allexpenses ofthe system including all past, present and futurepension plan liabilities of the personnel employed by thesystem and any other fees as agreed upon. When theagreement is terminated the State shall assume or makearrangements for the assumption of all the existingobligations of the management companies including but notlimited to all past, present and ftrture pension plan liabilitiesand obligations.
As ofJune 30,2075, the State reported an escheat liability of$395.6 million in the General fund. This liability representsan estimate of the amount of escheat property likely to be
Total
rlr-c-79
Connecticut
refunded to claimants in the future. However, there is areasonable possibility that the State could be liable for anadditional amount of escheat refirnds of $324.3 million inthe future.
Grant amounts received or receivable by the State fromfederal agencies are subject to audit and adjustment by theseagencies. Any disallowed claims, including amounts alreadycollected, may constitute a liability of the applicable funds.The amount, if any, of expenditures that may be disallowedby the federal govemment cannot be determined at this time,although the State expects such amounts, if any, to beimmaterial.
C. LitigationThe State, its units and employees are parties to numerouslegal proceedings, many of which normally occur ingovernment operations. Most of these legal proceedings arenot, in the opinion of the Attomey General, likely to have amaterial adverse impact on the State's financial position.
There are, however, several legal proceedings which, ifdecided adversely against the State, may require the State tomake material future expenditures for expanded services orcapital facilities or may impair future revenue sources. It isneither possible to determine the outcome of theseproceedings nor to estimate the possible effects adversedecisions may have on the future expenditures nor revenuesources ofthe State.
D. Lease/Lease Back TransactionOn September 30,2003 the State executed a U.S. Lease-to-Service Contract of Rolling Stock Agreement (Agreement)whereby the state entered into a head lease ofcertain rollingstock consisting ofrail coaches and locomotives to statutorytrusts established for the benefit of three equity investors.Simultaneously, the State executed sublease agreements tolease back the rolling stock in order to allow the State tohave continued use of the property. The terms of the headleases are for periods ranging from 40 years to 67 years,expiring through March 2071, while the subleases haveterms ranging from 18 years to 28 years, expiring throughJanuary 2032.
^I the end of the respective sublease terms,
the State will have the option to purchase the statutorytrusts' interest in the rolling stock for an aggregate fixedprice.
Proceeds from the prepayment ofthe head lease rents werepaid to debt payment undertakers and custodians in amountssufficient, together with investment earning thereon, toprovide for all future obligations of the State under thesublease agreements and the end of lease term purchase
options. Although it is remote that the State will be requiredto make any additional payments under the sublease, theState is and shall remain liable for all of its obligations underthe subleases. The aggregate remaining commitment underthe subleases totaled approximately $39 million at June 30,2015.
The State is obligated to insure and maintain the rollingstock. In addition, ifan equity investor suffers a loss oftaxdeductions or incurs additional taxable income as a result of
certain circumstances, as defined in the Agreement, then theState must indemnify the equity investor for the additionaltax incurred, including interest and penalties thereon. TheState has the right to terminate the sublease early undercertain circumstances and upon payment of a terminationvalue to the equity investors. If the State chooses earlytermination, then the termination value would be paid fromfunds available from the debt payment undertakers and thecustodians, and if such amounts are insufficient, then theState would be required to pay the difference.
Note 26 Subsequent EventsIn preparing these financial statements, the State hasevaluated events and transactions for potential recognition ordisclosure in the footnotes. The effect ofthis evaluation ledthe State to report the following events which took placeafter the State's fiscal year end date through to the date thesefinancial statements were issued.
In August 2015, the State issued $500 million of GeneralObligation bonds. The bonds were issued for housing,economic development as well as for other State purposes.The official offering includes 2015 series E $250.0 millionnontaxable bonds maturing in 2035 bearing interest ratesranging from 4.0 to 5.0 percent and series B $250.0 milliontaxable bonds maturing in 2025 bearing interest ratesranging from 1.0 to 3.33 percent.
In October 2015,Ihe State issued $839.8 million of SpecialTax Obligation Transportation Infrastructure bonds. Theoffering includes $700 million of series A which will maturein 2035 bearing interest rates ranging from 3.0 percent to 5.0percent and $139.8 million of series B refunding bondsmaturing in 2027 bearing interest rates ranging from 2.0 to5.0 percent that will defease other bonds issued at a highercost.
In December 2015, the State issued $650.0 million ofGeneral Obligation bonds. The offering includes $585.0million of series F, for school construction and other Statepurposes, which mature in 2034 bearing interest ratesranging from 2.0 to 5.0 percent, and $65.0 million series Go'Green Bonds", for water pollution control purposes, whichmature in 2035 bearing interest rates ranging from 2.0 to 5.0percent.
In August 2015 and December 2015, the ConnecticutHousing Finance Authority (CHFA) issued HousingMortgage Finance Program bonds consisting of $160.0million of series C and $30.1 million of series E bondsrespectively, to finance home mortgage loans. Additionally,in May 2015 and in November 2015, CHFA privately placed$35.0 million series B and $75.0 million of series D HousingMortgage Finance Program refunding bonds with theFederal Home Loan Bank of Dallas. These events occurredafter CHFA's flrscal year end of December 3I, 2014. InFebruary 2015 CHFA issued $150.0 million series AHousing Mortgage Finance Program bonds, the State addedthis debt to CHFA's financial statements for fiscal yearending December,2014.
III-C-80
RequiredPERSSupplementaryInformcttion
III-C-81

Connecticut
Budgetary Comparison ScheduleRequired Supplemental InformatíonGeneral and Transportation FundsFor the Fiscal Year Ended June 30, 201 5
(Expressed in Thousands)
Revenues
Budgeted:
Taxes, Net of Refunds
Casino Gaming Payments
Licenses, Permits, and Fees
OtherFederal Grants
Refunds of Payments
Operating Transfers InOperating Transfers OutTransfer tolfrom the Resources ofthe General FundTransfer Out - Transportation Strategy Board
Total Revenues
BxpendituresBudgeted:
LegislativeGeneral GovernmentRegulation and ProtectionConservation and DevelopmentHealth and HospitalsTransportationHuman ServicesEducation, Libraries, and MuseumsCorrectionsJudicialNon Functional
Total ExpendituresAppropriations Lapsed
Excess (Deficiency) of Revenues
Over Expenditures
Other Financing Sources (Uses)
Prior Year Appropriations Carried ForwardAppropriations Continued to Fiscal Year 2016Miscellaneous Adjustments
Total Other Financing Sources (Uses)
Net Change in Fund Balance
Budgetary Fund Balances - July 1 (as restated)
Changes in Reserves
Budgetary Fund Balances - June 30
17,458,200 r7,313,700 17,282,038
General Fund
Budget
Variance withFinal Budget
positive(neeative)Orisinal Final Actual
$ 14,914,700 $
278,500
256,200
324,4001,299,600
(72,900)443,100(61,800)
76,400
14,807,500 $
268,000
257,600396,000
1,241,200(64,300)
443,300(6r,800)26,200
14,792,350 $
267,9862s7,444390448
1,241,244(64,281)
420,68t(61,780)
37,946
(1 s,1 50)(14)
(1s6)(5,5s2)
44
19
(22,619)20
11,746
(31,662)
86,6s7689,334299,132219,944
1,803,282
3,050,34ss,092,s461,496,765
601,9304,337,746
17,677,68rt32,105
86,657691,517307,629221,190
r,799,97r
3,131,8375,078,5561,505,891
608,2684,246,771
73,563661,000287,2s2205,81I
I,785,337
3,095,9295,025,390t,476,753
593,3r44,215,340
13,09430,5r720,37715,37914,634
3s,90853,16629,13814,9s431,431
17,678,287 17,419,689 258,598(205,164)205 164
(87,376) (1s9,423) (137,6st) 21 772
85,920 85,920 8s,920(64,964)
3,527
(64,964)
3,527
85,920 89,447 24,483 (64,964)
L___Clto q____{q9¿t_o (113,168) $ (43,192)
171,369
(20,es6)
$ 37,24s
The informøtion øbout budgetary reporting is øn integral pørt ofthß schedule.
III-C-82

Connectìaut
Transportation Fund
Variance withFinal Budget
positive(nesative)0rieinal
$ 958,900 $
377,0005,000
12,100(3,200)
(6,500)
(15,000)
Final
916,700 $
388,400
s,80012,100(3,e00)s3,800(6,s00)
05.000)
Budget
Actual
93t,tt6 $ 14,416
394,9086,946
12,115(3,87 1 )41,r97(6,s00)
6,508r,146
15
29(12,603)
(1 5,000)
l,328,300 l,351,400 1,360,911 9,51 I
7,91676,538
594,037
681 ,587
1,360,078
(20,778\
7,34476,538
6t4,914
682,610
6,52063,869
s92,393
6s9,887
82412,669
22,521
22,723
I,381,40621,468
1,322,669 58,737(21,468\
(8,s38) 38,242 46,780
26,340 26,340 26,340(33,311) (33,3 1 1)
26,340 26,340 (6,971\ (33.3 l 1)
$ 5,562 q______]],qq¿ 31,271
175,115
6,971
s 213,3s7
$ 13,469
III-C-83

Connectícut
Budgetary Comparison ScheduleRequired Supplemental InformationBudgeted Nonmajor Special Revenue FundsFor the Fiscal Year Ended June 30,2015(Expressed in Thousands)
Workersr Compensation
Final
Budget Actual Variance
RevenuesBudgeted:
Fees, Assessments, and Other Income
Total Budgeted Revenues
Expenditures
Budgeted:General GovernmentRegulation and ProtectionConservation and DevelopmentHealth and HospitalsHuman Services
Judicial
Total Budgeted Expenditures
Excess (Deficiency) of Revenues
Over Expenditures
Other Financing Sources (Uses)
Operating Transfers In (Out)Use of Fund Balance ÍÌom Prior Years
Prior Year Appropriations Carried ForwardAppropriations Continued to Fiscal Year 2016
Total Other Financing Sources (Uses)
Net Change in Fund Balances
Budgetary Fund Balances - July 1 (as restated)
Changes in Reserves
Budgetary Fund Balances - June 30
Banking
Final
Budget Actual Variance
s 27,251 S 23,779 S (3,472) $ 28,800 $28,152 $ (648)
27,2s1 23,779 (3,472) 28,800 28,152 (648)
677
24,296568
19,571
109
4,725 22,358 21,272
500
1,086
2,184 2,257 (73)5,946 5,690 256
27,157 22,396 4,761 28,804 27,462 1,342
94 1,383 1,289 (4) 690 694
(5,700) (5,700)
500
- 1,000 1,000
$94
l3(845)
(6,532)
(5,842)
79,354832
13
(845)
(6,532)
q___(!f!_Ðr,383 S____L,2!2 $_______E)11,990
$__!!!21
The ínformatíon about budgetøry reportíng ís an integral part oîth¡s schedule,
ït!;!!
III-C-84

Connectícut
Consumer Counsel & Public Utility Control Insurance
Final
Budset Variance
Final
Budqet Actual Variance
$
Actual
25,600 $ 25,605 $ 5 $ 68,345 s 61,322 $ (7,023)
25.600 25,605 5 68,345 61,322 (7,023)
2,89124,055
2,225
20,948666
3,107
49435,431
31,945475
46432,037
32,0184,t5
30
3,394
Q3)
26,946 23,173 3,773 68,345 64,994 t3"
$----------- (3rtÐ q::CéÐ
(1,346) 2,432 3,778 (3,672) (3,672)
l8 18
1,356(455)
1,356(4ss)
$______GÉ10
901
$ 4,679
901
3,333
6,100(901)
l8 l8
s 8.532
7,716
fi 4,062
III-C.85
Contìnued

Connecticut
Budgetary Comparison ScheduleRequired Supplemental InformationBudgeted Nonmajor Special Revenue Funds (Continued)For the Fiscal Year Ended June 30, 2015
(Expressed in Thousands)
Criminal Iniuries CompensationMashantucket Pequot
and Mohegan Fund
Revenues
Budgeted:
Operating Transfers InFees, Assessments, and Other Income
Total Budgeted Revenues
Expenditures
Budgeted:General Government
Conservation and DevelopmentJudicial
Total Budgeted Expenditures
Excess (Deficiency) of Revenues
Over Expenditures
Other Financing Sources (Uses)
Operating Transfers In (Out)
Prior Year Appropriations Carried Forward
Appropriations Continued to Fiscal Year 2016
Total Other Financing Sources (Uses)
Net Change in Fund Balances
291 61,780 61,240 (540)
67,699 67,699
2,787 2,445 342
2,787 2,445 342 61,699 61,699
OJJ 81 (4se) (540)
FinalBudeet
$
3,355
3,355
$-3,646
3,646
FinalActual Variance Budget Actual Variance
$ 61,780 $ 61,240 $ (540)$
291
568 1,201
Budgetary Fund Balances (Deficit) - July I (as restated)Changes in Reserves
Budgetary Fund Balances (Deficit) - June 30
The inþrmøtion about budgetøry reporting Ís øn íntegral pørt of this schedule.
4s9
$
t2u7,674
s 2,875
s68$ $ 633$ 8l (45e) $ __C1E
III-C-86

Connectícut
Regional Market Soldiersr Sailors' and Marinest
FinalVariance Budget Actual Variance
$-(201)
(20r)
$
FinalBudset
$-1,029
1,029
Actual
$:828
828
$ $
1,214 1,073 141 312 2t7
3t2
95
t2t4 t,073 t4t 3n 2n
(185) (24s) (60) (312) (217)
$ (18s)
95
95
)
312
312 312
(24s) $__fgg [-__G]a552
95
(7,624)(312)
$._l¿g1!)
$ 407
307$
III-C-87
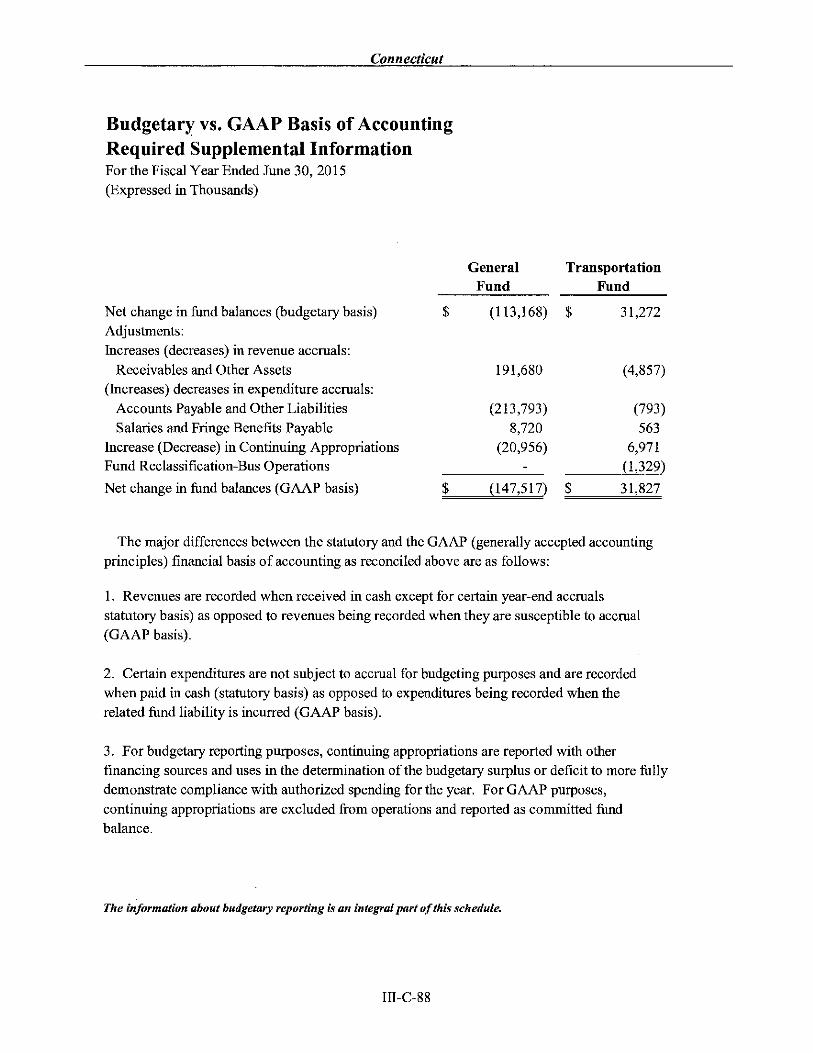
Connecticut
Budgetary vs. GAAP Basis of AccountingRequired Supplemental InformationFor the Fiscal Year Ended June 30, 2015
(Expressed in Thousands)
Net change in fund balances (budgetary basis)
Adjustments:
Increases (decreases) in revenue accruals:
Receivables and Other Assets
(Increases) decreases in expenditure accruals:
Accounts Payable and Other LiabilitiesSalaries and Fringe Benefits Payable
Increase (Decrease) in Continuing AppropriationsFund Reclassification-Bus Operations
Net change in fund balances (GAAP basis)
GeneralFund
TransportationFund
$ (113,168) g 3t,272
191,680 (4,857)
(7e3)
s63
6,971(t,329)
$ (147,517) $ 31,827
The major differences between the statutory and the GAAP (generally accepted accountingprinciples) financial basis of accounting as reconciled above are as follows:
1. Revenues are recorded when received in cash except for certain year-end accruals
statutory basis) as opposed to revenues being recorded when they are susceptible to accrual
(GAAP basis).
2. Certain expenditures are not subject to accrual for budgeting purposes and are recorded
when paid in cash (statutory basis) as opposed to expenditures being recorded when the
related fund liability is incurred (GAAP basis).
3. For budgetary reporting purposes, continuing appropriations are reported with other
financing sources and uses in the determination of the budgetary surplus or deficit to more fullydemonstrate compliance with authorized spending for the year. For GAAP purposes,
continuing appropriations are excluded from operations and reported as committed fundbalance.
The ínþrmatíon øbout budgetary reportíng ís an íntegrøl pøtt of th¡s schedule.
(213,793)8,720
(20,956)
III-C-88

Connecticut
Other Postemployment Benefit PlansRequired Supplementary fnformationSchedules of Funding Progress(Expressed in Millions)
ActuarialValuation
DateRTHP
6/30120086/30t2009 *6/30120106/3012011 *6/30/20t26/30/2013 *6/30/20146/3012015 *
(a)
ActuarialValue ofAssets
(b)
Actuarial AccruedLiabilitv (AAL)
$2,318.8$-
$2,997.8$-
$3,048.3$-
$2,433.0$-
(b-a)
UnfundedAAL
(UAAL)
$2,318.8$-
s2,997.8$-
$3,048.3$-
s2,433.0$-
$-$-$-$-$-$-$-$-
(a/b)
FundedRatio
0.0%0.0%0.0%0.0%0.0%0.0%0.0%0.0%
(c) ((b-a)/c)
UAAL as a
Covered Percentage ofPavroll CoveredPayroll
$3,399.3 68.2%
$- o.o%
$3,646.0 82.2%$- 0.0%
$3,652.5 83.s%
$- 0.0%
$3,831.6 63.s%
$- o.o%
Actuarial valuations for other postemployment benefit plans are required to be disclosed starting with fiscal year 2008.
SEOPEBP6l30l20tt $49.6 s17,9s4.3 $17,904.7 03% 53,902.2 4s8.8%6t30t2012 * $- $- $- 0.0% $- 0.0%6/3012013 $143.8 519,6'76.3 $19,532.5 0.7% $3,s39.7 sst.8%6/30t2014 * $- $- $- 0.0% $- 0.0%6/30t20ts * $- $- $- 0.0% $- 0.0%
*No actuarial valuation was performed.June 30,201I was the first year an actuarial valuation for State Employees Other Postemployment Benefit Plan was performed.
III-C-89

Pension PlansRequired Supplementary InformationSchedule of Employer Contributions(Expressed in Thousands)
SERS
Actuarially determined
employer contribution
Actual employer contributions
Annual contributions deficiency
excess
Covered Payroll
Actual contributions as a percentage
of covered-employee payroll
TRSActuarially determined
employer contribution
Actual employer contributions
Annual contributions defi ciency
excess
Covered Payroll
Actual contributions as a percentage
of covered-employee payroll
JRSActuarially determined
employer contributionActual employer contributions
Annual contributions deficiency
excess
Covered Payroll
Actual contributions as a percentage
of covered-employee payroll
944,077
825,801
$ 45 $ 1,539 $ 29 $ t18,276
$ 3,355,077 $ 3,304,538 $ 3,209,782 $ 3,308,499
37.82% 32.02% 28.86%
2014
$ 1,268,935
1,269,990
2013
$ 1,059,652 $1,059,1 l3
2012
926,372 $926,343
2010
s 897,428
120,527
20tl
$ 948,540
948,540s 787,536 $ 757,246 $
24.96% 24.67%
$__trÉpgts 2,920,661
s 559,224
559,224
581,593
581,593'787 s36
$ $ $ $
$ 3,930,957 $ 4,101,750 $ 3,943,990 S 3,823,754 S 3,616,686
24.13% 19.20% 19.20% 15.2t% 15.2t%
$ 16,298 $
16,299
,2467s7
$
16,209 $ l5,3gg
$ $ $ $ 16,208 $ 1s,399
$ 33,386 $ 31,748 $ 30,308 $ 33,102 $ 31,602
48.82% 50.42% 49.81% 0.00% 0.00%
16,006 $
16,006
15,095 $
15,095
III-C-90

Connecticut
$
2009
753,698 $
699,770
2008
716,944 $
711,555
2007
663,926 $663,931
2006
623,063 $623,063
2005
518,764
518,764
$ 53,928 $ 5,389 s_______lÐ $ $
$ 3,497,400 $ 3,497,400 $ 3,310,400 $ 3,107,900 $ 2,980,100
20.01% 20.3s% 20.06% 20.05% 17.4lo/o
$ 539,303
539,303
$ 518,560 $518,560
412,099 $412,099
396,249 $
396,249
281,366
281,366
$ $ $ $
s 3,529,470 s 3,393,717 s 3,296,792 $ 3,169,992 s 3,035,232
15.28% ts.28% t250% 12.50% 9.27%
$
$ 14,172 $
14,173
13,434 $
13,434
12,375 $ 11,730
11,730
12,236
12,236
$
7512,3
$ (l) $ $ $$
$ 34,000 $ 33,982 $ 33,757 $ 31,803 $ 30,149
41.69% 3953% 36.66% 36.88% 4059%
III-C-91

Connectícut
Other Postemployment Benefït PlansRequired Supplementary InformationSchedule of Employer Contributions(Expressed in Thousands)
RTHPAnnual
RequiredContributions
$116.1
$116.7
$121.3gt77.r
$184.1
$180.4
$187.2
$12s.6
SEOPEBP
FiscalYear2008
2009
20t020tI20r220r320t42015
Percentage
Contributed2r.s%253%10.0%
3.0%
26.9%
rs.0%t3.9%20.0%
AnnualRequired
ContrÍbutions$0.0
$0.0
$0.0
$0.0
sl,354.7sL,271.3
$1,525.4
$1,513.0
Percentage
Contributed0%
0%
0%
0%
40.0%
42.7%
33.7%
36.r%
Actuarial valuations for other postemployment benefit plans are required to be disclosed starting with fiscal year 2008.
June 30,2011 was the first year an actuarial valuation for State Employees Other Postemployment Benefit Plan was performed.
TTI-C-92

Pension PlansRequired Supplementary InformationSchedule of Changes in the Net Pension Liabitityand Plan Net Position
(Expressed in Thousands)
2014SERS
2014TRS
2014JRSTotal Pension Liability
Service Cost
Interest
Benefit payments
Refunds of côntributions
Net change in total pension liabilityTotal pension liâbility - beginning
Total pension liability - ending (a)
Plan net positionContributions - employerContributions - member
Net investment income
Benefit payments
Refunds of contributionsOther Changes
Net change in plan net positionPlan net position - beginning
Plan net position - ending (b)
Ratio of plan net position
to total pension liability
Net pension liability - ending (a) -(b)
Covered-employee payrollNet pension liability as a porcontag€
of covered-employee payroll
$ 281,413
1,998,736(1,563,029)
13.93s)
719,24s25,767,688
$ 26,486,933
347,198 $
2,090,483(1,131,144)
7,53926,301
(21,668)
$
700,53725,648,672
12,172
339,601
g__Jsê4ew s 351.773
$ 1,268,890
144,907
1,443,391(1,563,029)
(3,935)
948,540 $
261,2132,27'7,550
(1,737 ,144)
(s,307)
16,298
7,641
23,156(21,668)
$
1,290,124
9,182,4431,744,952
14,462,90319,427
168,353
$ 10,472,567 $ 16,207,755 $_____!uqq"
3954% 6l.5lo/o 53.38o/n
$ 16,014,366 $ 10,141,454 $ 163,993
$ 3,487,577 $
459.r8%
3,831,624 $
264.68%
33,386
491.20%
III-C-93

[INTENTIONALLY LEFT BLANK]

APPENDIX III-D

[INTENTIONALLY LEFT BLANK]

STATE OF CONNECTICUT
AUDITORS OF PUBLIC ACCOUNTSSTATE CAPITOL
JOHN C. GERAGOSIAN 210 CAPITOL AVENUE ROBERT M. WARDHARTFORD, CONNECTICUT 06106-1559
INDEPENDENT AUDITORS’ REPORTCERTIFICATE OF AUDIT
Report on the Financial StatementsWe have audited the accompanying balance sheet of the General Fund of the State of Connecticut as of June 30, 2011, 2012, 2013, 2014 and 2015 and the related statements of revenues, expenditures, and changes in unappropriated surplus for the years ended on those dates as shown in Appendices III-D-4, III-D-5, III-D-6 and III-D-7.
Managements Responsibility for the Financial StatementsManagement is responsible for the preparation and fair presentation of these financial statements in accordance with accounting principles generally accepted in the United States of America; this includes the design, implementation, and maintenance of internal control relevant to the preparation and fair presentation of financial statements that are free from material misstatement, whether due to fraud or error.
Auditor’s ResponsibilityOur responsibility is to express an opinion on these financial statements based on our audit. We conducted our audit in accordance with auditing standards generally accepted in the United States of America. Those standards require that we plan and perform the audit to obtain reasonable assurance about whether the financial statements are free of material misstatement. An audit involvesperforming procedures to obtain audit evidence about the amounts and disclosures in the financial statements. The procedures selected depend on the auditor’s judgment, including the assessment of the risks of material misstatement of the financial statements, whether due to fraud or error. In making those risk assessments, the auditor considers internal control relevant to the entity’s preparation and fair presentation of the financial statements in order to design audit procedures that are appropriate in the circumstances, but not for the purpose of expressing an opinion on the effectiveness of the entity’s internal control. In making those risk assessments, the auditor considers internal control relevant to the organization’s preparation and fair presentation of the financial statements in order to design audit procedures that are appropriate in the circumstances. An audit also includes evaluating the appropriateness of accounting policies used and the reasonableness of significant accounting estimates made by management, as well as evaluating the overall presentation of the financial statements. We believe that the audit evidence we have obtained is sufficient and appropriate to provide a basis for our audit opinions.
III-D-2

Basis for Adverse Opinion on U.S. Generally Accepted Accounting PrinciplesAs discussed in Note (a) to Appendix III-D-4, the State of Connecticut prepared its financial statements for the fiscal years ended June 30, 2011, 2012 and 2013 on a modified cash basis, which is a comprehensive basis of accounting other than accounting principles generally accepted in the United States of America.
As discussed in Note (a) to Appendix III-D-4, the State of Connecticut prepared its financial statements for the fiscal year ended June 30, 2014 and 2015, using accounting practices that follow the financial reporting provisions of Sections 3-115, 3-115b and Sections 3-114b through 3-114r of the Connecticut General Statutes, which is a basis of accounting other than accounting principles generally accepted in the United States of America. The effects on the financial statements of the variances between this statutory basis of accounting and accounting principles generally accepted in the United States of America, although not reasonably determinable, are presumed to be material.
The financial statements referred to above present only the General Fund and do not purport to, and do not, present fairly the financial position of the State of Connecticut as of June 30, 2011, 2012, 2013, 2014 and 2015, and the results of its operations for the years then ended in conformity with accounting principles generally accepted in the United States of America.
Adverse Opinion on U.S. Generally Accepted Accounting Principles In our opinion, because of the significance of the matters discussed in the Basis for Adverse Opinion on U.S. Generally Accepted Accounting Principles paragraph, the financial statements referred to above do not present fairly, in accordance with accounting principles generally accepted in the United States of America, the financial position of the State of Connecticut, as of June 30, 2011, 2012, 2013, 2014 and 2015.
Opinion on Modified Cash Basis of AccountingIn our opinion, the financial statements referred to above present fairly, in all material respects, the financial position – modified cash basis of the General Fund of the State of Connecticut as of June 30, 2011, 2012 and 2013, and the results of its operations – modified cash basis for the years then ended, in conformity with the basis of accounting described in Note (a) to Appendix III-D-4.
Opinion on Statutory Basis of AccountingIn our opinion, the financial statements referred to above present fairly, in all material respects, the financial position – statutory basis of the General Fund of the State of Connecticut as of June 30, 2014 and 2015, and the results of its operations – statutory basis for the years then ended, in conformity with the basis of accounting described in Note (a) to Appendix III-D-4.
John C. GeragosianAuditor of Public Accounts
Robert M. WardAuditor of Public Accounts
January 29, 2016State CapitolHartford, Connecticut
III-D-3

III-D-4
GENERAL FUND(a)
Balance Sheet As of June 30
(In Thousands)
2011
2012
2013
2014
2015
Assets Cash and Short-Term Investments $ -- $ -- $ -- $ -- $ -- Accrued Taxes Receivable 1,077,249 1,336,954 1,412,940 1,389,703 1,371,458 Accrued Accounts Receivable 28,821 27,839 24,116 108,907 21,852 Federal and Other Grants Receivable and Unexpended Balances
--
--
--
-- --
Investments -- -- -- -- -- Due from Other Funds -- -- -- -- -- Loans Receivable 3,419 3,419 3,419 3,419 3,419
Total Assets $ 1,109,489 $ 1,368,212 $ 1,440,475 $ 1,502,029 $ 1,396,729 Liabilities, Reserves and Surplus Liabilities Deficiency in Cash and Short-Term Investments $ 666,879 $ 1,233,336 $ 925,552 $ 550,180 $ 797,930 Accounts Payable Nonfunctional Change to Accruals
--
--
--
(16,152) 561,217
Deferred Restricted Accounts and Federal and Other Grant Revenue
--
--
--
-- --
Due to Other Funds 469 301 263 367 336 Total Liabilities $ 667,348 $ 1,233,637 $ 925,815 $ 534,395 $ 1,359,483 Reserves Petty Cash Funds $ 814 $ 806 $ 804 $ 815 $ 810 Statutory Surplus Reserves 236,923 -- 398,035 248,480 (31,947) Reserve for GAAP Conversion Bonds -- -- -- 598,500 Reserve for Future Fiscal Years -- -- -- 30,500 Appropriations Continued to Following Year
200,985
130,351
112,402
85,920
64,964
Reserve for Receivables 3,419 3,418 3,419 3,419 3,419 Total Reserves $ 442,141 $ 134,575 $ 514,660 $ 967,634 $ 37,246 Unappropriated Surplus (Deficit) $ 0 $ 0 $ 0 $ 0 $ 0
Total Liabilities, Reserves and Surplus $ 1,109,489 $ 1,368,212 $ 1,440,475 $ 1,502,029 $ 1,396,729
______________ (a) For Fiscal Years 2011-2013, the State of Connecticut’s policy, which was formulated in accordance with State fiscal statutes, is to
prepare the accompanying financial statements on a prescribed basis of accounting that demonstrates compliance with the modified cash basis and budget laws of the State of Connecticut. The modified cash basis of accounting, as used by the State, records expenditures when they are paid and recognizes revenues when received, except for the accrual at June 30 of State collections in July and August of certain taxes levied, Indian gaming payments, and the accounting for restricted grants on an earned basis. Certain accrual dates for various revenues have been extended and may not reflect the same accrual date through the years reflected herein. For Fiscal Years 2014 and 2015, the financial statements are prepared on a statutory basis using accounting practices that follow the financial reporting provisions of Sections 3-115, 3-115b and Sections 3-114b through 3-114r of the Connecticut General Statutes.

III-D-5
GENERAL FUND
Statement of Revenues, Expenditures and Changes in Unappropriated Surplus Fiscal Year Ended June 30
(In Thousands)
2011
2012
2013
2014
2015
Unappropriated Surplus (Deficit), July 1 $ -0- $ -0- $ -0- $ -0- $ -0- Resources from Reserve for Debt Avoidance/ERN
--
--
--
--
--
Total Revenues (per Appendix III-D-6) 17,707,454 18,561,633 19,405,031 17,608,056 17,282,038 Total Expenditures (per Appendix III-D-7) 17,845,124(a) 18,781,634(b) 19,025,667(c) 16,980,044(d) 17,419,689(e) Operating Balance (137,670) (220,001) 379,364 628,012 (137,651) Reserved for Prior Year Appropriations Less Appropriations Carried Forward
(75,276)
70,634
18,671
26,482
20,956
Transferred (Out) or Reserved for: Budget Reserve Fund
-0-
-0-
(177,235)
(248,480)
-0-
Reserve for Debt Retirement/Avoidance or Reserve for Future Fiscal Year (236,923) -0- (220,800) (599,000) (e) -0- Other Adjustments -- 5,850 -0- 2,186 3,527 Reserved from Prior Year 449,869 -0- -0- 190,800 -0- Subtotal $ -0- $ (143,517) $ -0- $ -0- $ (113,168) Transferred from Budget Reserve Fund -- 143,517 -- -- 113,168 Unappropriated Surplus (Deficit), June 30
$ -0-
$ -0-
$ -0-
$ -0-
$ -0-
______________ (a) Total Expenditures includes prior year appropriations less appropriations carried forward to the next fiscal year in the amount of $(75.276) million.
(b) Total Expenditures include prior year appropriations less appropriations carried forward to the next fiscal year in the amount of $70.634 million.
(c) Total Expenditures include prior year appropriations less appropriations carried forward to the next fiscal year in the amount of $18.671 million.
(d) Total Expenditures include prior year appropriations less appropriations carried forward to the next fiscal year in the amount of $26.482 million.
(e) In Fiscal Year 2014 this amount includes GAAP Conversion Bonds totaling $598.5 million.
(f) Total Expenditures include prior year appropriations less appropriations carried forward to the next fiscal year in the amount of $20.956 million.
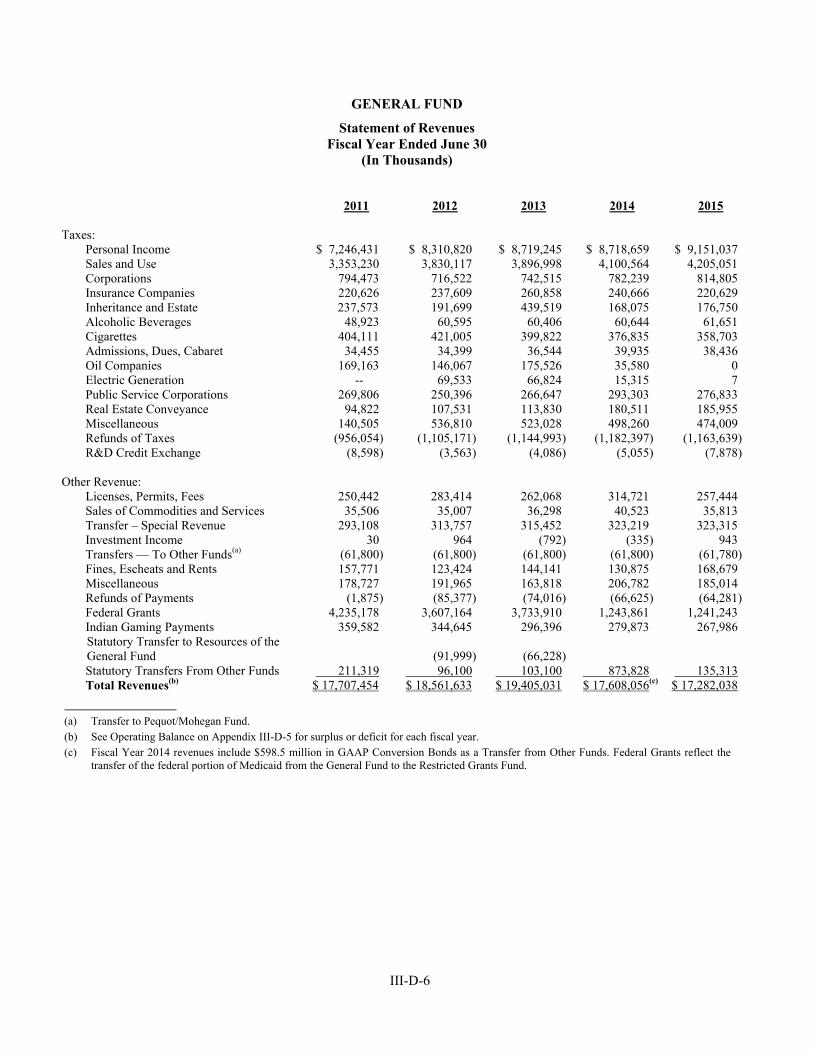
III-D-6
GENERAL FUND
Statement of Revenues Fiscal Year Ended June 30
(In Thousands)
2011
2012
2013
2014
2015
Taxes: Personal Income
$ 7,246,431
$ 8,310,820
$ 8,719,245
$ 8,718,659 $ 9,151,037
Sales and Use 3,353,230 3,830,117 3,896,998 4,100,564 4,205,051 Corporations 794,473 716,522 742,515 782,239 814,805 Insurance Companies 220,626 237,609 260,858 240,666 220,629 Inheritance and Estate 237,573 191,699 439,519 168,075 176,750 Alcoholic Beverages 48,923 60,595 60,406 60,644 61,651 Cigarettes 404,111 421,005 399,822 376,835 358,703 Admissions, Dues, Cabaret 34,455 34,399 36,544 39,935 38,436 Oil Companies 169,163 146,067 175,526 35,580 0 Electric Generation -- 69,533 66,824 15,315 7 Public Service Corporations 269,806 250,396 266,647 293,303 276,833 Real Estate Conveyance 94,822 107,531 113,830 180,511 185,955 Miscellaneous 140,505 536,810 523,028 498,260 474,009 Refunds of Taxes (956,054) (1,105,171) (1,144,993) (1,182,397) (1,163,639) R&D Credit Exchange (8,598) (3,563) (4,086) (5,055) (7,878) Other Revenue: Licenses, Permits, Fees
250,442
283,414
262,068
314,721 257,444
Sales of Commodities and Services 35,506 35,007 36,298 40,523 35,813 Transfer – Special Revenue 293,108 313,757 315,452 323,219 323,315 Investment Income 30 964 (792) (335) 943 Transfers — To Other Funds(a) (61,800) (61,800) (61,800) (61,800) (61,780) Fines, Escheats and Rents 157,771 123,424 144,141 130,875 168,679 Miscellaneous 178,727 191,965 163,818 206,782 185,014 Refunds of Payments (1,875) (85,377) (74,016) (66,625) (64,281) Federal Grants 4,235,178 3,607,164 3,733,910 1,243,861 1,241,243 Indian Gaming Payments 359,582 344,645 296,396 279,873 267,986
Statutory Transfer to Resources of the General Fund
(91,999)
(66,228)
Statutory Transfers From Other Funds 211,319 96,100 103,100 873,828 135,313 Total Revenues(b) $ 17,707,454 $ 18,561,633 $ 19,405,031 $ 17,608,056(c) $ 17,282,038
______________ (a) Transfer to Pequot/Mohegan Fund. (b) See Operating Balance on Appendix III-D-5 for surplus or deficit for each fiscal year. (c) Fiscal Year 2014 revenues include $598.5 million in GAAP Conversion Bonds as a Transfer from Other Funds. Federal Grants reflect the
transfer of the federal portion of Medicaid from the General Fund to the Restricted Grants Fund.

III-D-7
GENERAL FUND
Statement of Expenditures Fiscal Year Ended June 30
(In Thousands)
2011
2012
2013
2014
2015
Legislative $ 66,109 $ 67,344 $ 66,533 $ 70,813 $ 73,563 General Government Executive 9,954 10,741 10,211 12,223 12,701 Financial Administration 381,716 521,013 506,598 513,051 563,830 Legal 84,420 77,485 76,558 80,402 84,469 Total General Government 476,090 609,239 593,367 605,676 661,000 Regulation and Protection of Persons and Property
Public Safety 175,700 177,121 175,772 191,075 193,996 Regulative 86,066 85,777 86,015 86,798 93,256 Total Regulation and Protection 261,766 262,898 261,787 277,873 287,252 Conservation and Development Agriculture 11,356 11,551 11,250 12,024 12,723 Environment 71,353 71,437 66,457 71,365 71,018 Historical Sites, Commerce and Industry 41,210 54,306 55,376 137,532 122,070 Total Conservation and Development 123,919 137,294 133,083 220,921 205,811 Health and Hospitals Public Health 88,226 86,144 98,999 114,086 83,853 Developmental Services 970,070 1,013,182 1,005,732 1,054,597 1,097,586 Mental Health 657,374 693,109 697,220 658,625 603,897 Total Health and Hospitals 1,715,670 1,792,435 1,801,951 1,827,308 1,785,336 Transportation 0 0 0 0 0 Human Services 5,387,535 5,817,369 5,931,567 3,215,827 3,095,928 Education, Libraries and Museums Department of Education 2,708,442 2,769,385 2,880,342 3,039,608 3,277,044 Education of the Blind and Deaf 11,145 0(b) 0(b) 0(b) 0(b) University of Connecticut 232,656 205,586 195,847 329,889 354,433 Higher Education and the Arts 192,626 169,084 158,271 43,580 46,103 Libraries 11,067 10,618 12,294 12,419 12,205 Teachers Retirement 583,978 794,205 805,193 966,983 1,004,973 Community—Technical Colleges 158,282 144,505 141,288 151,973 177,968 State University 162,271 142,045 135,659 151,193 152,665 Total Education, Libraries and Museums
4,060,467
4,235,428
4,328,894
4,695,645 5,025,391
Corrections 1,484,364 1,472,685 1,408,761 1,454,442 1,476,753 Judicial 559,912 545,650 534,512 569,056 593,314 Non-Functional Debt Service 1,629,672 1,809,201 1,799,937 1,646,149 1,691,526 Miscellaneous 2,079,621 2,032,091 2,165,275 2,396,332 2,523,815 Total Non-Functional 3,709,293 3,841,292 3,965,212 4,042,481 4,215,341 Totals 17,845,125 18,781,634 19,025,667 16,980,042 17,419,689
Total Expenditures(a) $17,845,125 $18,781,634 $19,025,667 $16,980,042 $17,419,689
______________ (a) See Operating Balance on Appendix III-D-5 for surplus or deficit for each fiscal year.
(b) These functions were transferred to Human Services.

[INTENTIONALLY LEFT BLANK]

III-E-1
APPENDIX III-E
GENERAL FUND REVENUES AND EXPENDITURES ADOPTED BUDGET AND FINAL FINANCIAL RESULTS FOR FISCAL YEAR 2015
ADOPTED AND ESTIMATED RESULTS FOR FISCAL YEAR 2016 ADOPTED BUDGET FOR FISCAL YEARS 2017
(In Millions)
Revised Adopted Budget
Fiscal Year 2015(d)
Financial Results
Fiscal Year 2015(f)
Adopted Budget
Fiscal Year 2016(h)
Estimated
Budget Fiscal Year
2016(i)
Adopted Budget
Fiscal Year 2017(h)
Revenues Taxes Personal Income Tax $ 9,264.5 $ 9,151.0 $9,834.4 $ 9,570.0 $10,357.2 Sales & Use 4,167.4 4,205.1 4,121.1 4,230.3 4,084.7 Corporation 704.3 814.8 902.2 950.4 910.7 Public Service 295.6 276.8 308.0 287.4 316.5 Inheritance & Estate 173.0 176.8 173.4 217.4 174.7 Insurance Companies 256.2 220.6 243.8 226.5 246.0 Cigarettes 360.9 358.7 361.2 365.9 363.3 Real Estate Conveyance 186.9 186.0 194.7 194.7 200.8 Oil Companies(a) 34.8 -- -- -- -- Alcoholic Beverages 60.7 61.7 61.7 61.7 62.1 Admissions and Dues 38.3 38.4 38.3 38.3 39.6 Health Provider Tax 509.5 454.9 676.9 672.4 683.9 Miscellaneous 95.2(g) 19.1 20.8 19.7 21.3 Total Taxes $16,147.2 $15,963.9 $16,936.5 $16,834.7 $17,460.8 Less Refunds of Taxes (1,105.1) (1,064.0) (1,090.4) (1,090.4) (1,103.1) Less Earned Income Tax (120.7) (99.6 ) (127.4) (127.4) (133.9) Less R&D Credit Exchange (6.8) (7.9) (7.1) (7.1) (7.4) Net Taxes $14,914.6 $14,792.4 $15,711.6 $15,609.8 $16,216.4 Other Revenues Transfers- Special Revenues $ 323.1 $ 323.3 $ 343.4 $ 336.4 $ 369.3 Indian Gaming Payments 278.5 268.0 258.8 261.8 252.4 Licenses, Permits, Fees 256.2 257.4 308.5 312.9 290.8 Sales of Commodities &
Services 43.5
35.8
38.0 39.1 39.1 Rents, Fines & Escheats 118.4 168.7 126.0 126.0 128.0 Investment Income 0.6 0.9 2.5 1.2 5.6 Miscellaneous 161.9 185.0 171.3 176.8 173.4 Less Refunds of Payments (72.9) (64.3) (74.2) (66.2) (75.1) Total Other Revenue $ 1,109.3 $ 1,174.8 $ 1,174.3 $ 1,188.0 $ 1,183.5 Other Sources Federal Grants $ 1,299.6 $ 1,241.2 $ 1,265.2 $ 1,217.0 $ 1,252.7 Transfers to the Resources of
the General Fund -- 38.0
-- -- -- Transfers from Tobacco
Settlement Funds 120.0
97.4
106.6 108.6 104.5 Transfers to the Resources of
STF(a) --
--
-- -- -- Transfers to Other Funds(b) 14.6 (61.8) (95.4) (69.5) (43.4) GAAP Conversion Bond
proceeds -- --
--
-- Total Other Sources $ 1,434.1 $ 1,314.8 $ 1,276.5 $ 1,256.1 $ 1,313.8 Total Budgeted Revenue(c) $17,458.0 $17,282.0 $18,162.4 $18,053.9 $18,713.6

III-E-2
Revised Adopted Budget
Fiscal Year 2015(d)
Financial Results
Fiscal Year 2015(f)
Adopted Budget
Fiscal Year 2016(h)
Estimated
Budget Fiscal Year
2016(i)
Adopted Budget
Fiscal Year 2017(h)
Appropriations/ Expenditures
Legislative $ 86.7 $ 74.5
$ 83.9 $ 76.7 $ 87.1
General Government 680.0 661.9 670.0 662.3 680.5 Regulation & Protection 276.6 287.8 301.0 296.2 302.6 Conservation &
Development 216.3 204.2
211.3 203.8 218.9 Health & Hospitals 1,802.7 1,784.9 1,817.4 1,809.4 1,872.7 Human Services 3,026.9 3,076.6 3,196.2 3,158.6 3,273.8 Education, Libraries &
Museums 5,075.3 5,029.8
5,166.4 5,156.1 5,242.5 Corrections 1,493.1 1,477.1 1,514.8 1,500.4 1,524.2 Judicial 601.9 593.7 625.4 614.3 647.7 Non- Functional Debt Service 1,784.2(e) 1,691.5(e) 1,937.6(e) 1,972.6 2,053.1(e) Miscellaneous 2,546.2 2,516.8 2,838.1 2,800.9 3,013.8 Subtotal $ 17,589.8 $17,398.7 $18,362.1 $18,251.2 $ 18,916.9 Other Reductions and Lapses (132.1) -- (200.6) (190.2) (205.7) Net Appropriations/
Expenditures $ 17,457.7 $17,398.7
$ 18,161.6 $18,061.0 $18,711.2 Surplus (or Deficit) from
Operations 0.3 (116.7)
0.8 (7.1) 2.5 Miscellaneous Adjustments -- 3.5 -- -- Reserve for Future Fiscal
Years -- --
--
-- Reserve for GAAP
Conversions -- --
--
-- Reserve from Reserved Fund
Balance -- --
-- --
-- Balance(c) $ 0.3 $ (113.2) $ 0.8 $ (7.1) $ 2.5
___________
NOTE: Columns may not add due to rounding.
(a) Per subsection 91 of Public Act No. 15-244, beginning in Fiscal Year 2016, all revenue from the oil companies tax will be deposited to the Special Transportation Fund.
(b) Includes transfers to the Mashantucket Pequot Fund for grants to towns. The amounts for Fiscal Years 2015 through 2017 include transfers of $61.8 million in each year to the Mashantucket Pequot Fund for grants to towns. The transfers for Fiscal Year 2015 include: $30.0 million from the Fiscal Year 2013 surplus.
(c) Does not include revenues or expenditures with respect to Restricted Accounts and Federal & Other Grants, which are not included in this Appendix. The amount of such expenditures is generally the same as the amount of grants received. Per Section 4-30a of the Connecticut General Statutes, after the accounts for the General Fund have been closed for each fiscal year and the Comptroller has determined the amount of unappropriated surplus in said fund, after any amounts required by provision of law to be transferred for other purposes have been deducted, the amount of such surplus shall be transferred by the State Treasurer to the Budget Reserve Fund.
(d) Per Public Act No. 14-47 and Public Act No. 14-217 and Public Act No. 15-244. (e) Sections 90 and 91 of Public Act No. 13-184 extend the maturity of the 2009 Economic Recovery Notes from Fiscal Year
2016 to Fiscal Year 2018. (f) Per the Comptroller’s audited financial results for Fiscal Year 2015 as adjusted by the Office of Policy and Management
to exclude expenditures of appropriations carried over from the prior fiscal year and to include expenditures of appropriations carried into the next fiscal year.
III-E-3
(g) The adopted budget for Fiscal Year 2015 included $75 million from a Department of Revenue Services enhanced Tax Collections Initiative.
(h) Per Public Act No. 15-244, as amended by various implementer legislation and as amended by Public Act No. 15-05 of the June Special Session. These amounts do not include updates to revenues and expenditures made at the December 8, 2015 Special Session of the General Assembly which provided for (i) $137.5 million in additional revenue in Fiscal Year 2016 and a reduction of $17.5 million in revenue in Fiscal Year 2017 and (ii) a reduction in appropriated expenditures by $195.8 million in both Fiscal Year 2016 and 2017.
(i) Estimates reflect the January 20, 2016 Office of Policy and Management’s letter to the State Comptroller as of the period ending December 31, 2015 and includes the impact of Public Act No. 15-1 of the December Special Session.
NOTE: The information in Appendix III-E of this Part II contains projections and no assurances can be given that subsequent projections or adjustments will not result in changes in the items of revenue and expenditure and in the final result of the operations of the General Fund. Changes may also occur as the result of legislative action adjusting the budget or taking other actions which impact revenues or expenditures.

[THIS PAGE INTENTIONALLY LEFT BLANK]


ST
AT
E O
F C
ON
NE
CT
ICU
T • G
EN
Er
Al O
bl
IGA
TIO
N bO
Nd
S 2016 SE
rIE
S E A
Nd 2016 S
Er
IES F
- Gr
EE
N bO
Nd
S


