State of Colorado Lean Model: Tools and Methods Role... · Create continuous flow – internally...
87
State of Colorado Lean Program State of Colorado Lean Model: Tools and Methods
Transcript of State of Colorado Lean Model: Tools and Methods Role... · Create continuous flow – internally...

State of Colorado Lean Program
State of Colorado Lean Model:
Tools and Methods

State of Colorado Lean Program
Introduction to Lean
State of Colorado Lean Model

State of Colorado Lean Program
Introduction to Lean
Lean is a systematic approach to continuous improvement, applying principles and tools to identify and eliminate waste. While Lean was popularized in Japan, Taiichi Ohno, the father of the Toyota Production System, claimed he learned all he needed to know from three distinctly American concepts: the Indy 500, Ford’s River Rouge Plant, and supermarket distribution. Toyota consolidated years of thinking into a systematic approach that is relevant not just to factories, but to business processes as well. The president of Toyota’s support for the program was driven by the idea of removing waste as a result of two important beliefs that align to our goal of effective, efficient, and elegant state government:
Waste is disrespectful of humanity because it wastes scarce resources; and
Waste is disrespectful of individuals because it asks them to do work with no value.
While the list of Lean tools is long, there are just five guiding principles:
1. Define value – value can only be defined by the customer;
2. Map value steams – documenting information and material flow that provide the product or service citizens require;
3. Create continuous flow – internally having everything ready as needed for a symphony of service or production;
4. Implement pull – provide a product or service only when it is needed and no earlier; and
5. Strive for perfection – relentlessly chase perfection through error proofing and continuous evaluation and improvement.
Throughout your training you will be introduced to a number of principles, methodologies, and tools. To help organize all the different components of Lean and to assist you in taking the right action at the right time, the State of Colorado has developed its own Lean Model. As you are introduced to each topic, you will also learn how to apply the information within context of this framework.
Before we dive into individual topics, please take time to review the model in greater detail.
Overview
Lean is a systematic approach to continuous improvement that aims to make processes more efficient, effective, and elegant by eliminating waste.
The Lean methodology can be summarized into five key principles but is supported by numerous tools and techniques.
The State of Colorado Lean model will help provide a framework for all Lean tools and methods.
Key Information
Book: Extreme Government Makeover by Ken Miller Book: Lean Thinking: Banish Waste and Create Wealth in Your Corporation by James P. Womack, Daniel T. Jones Article: http://www.lean.org/WhatsLean/Principles.cfm
Additional Resources
1 of 2
State of Colorado Lean Model

State of Colorado Lean Program
Search Terms / Related Topics
5 Principles of Lean Toyota Overview
Waste State of Colorado Lean Model Tools Methodologies Continuous Improvement
1 - Learn Continuously Lean is comprised of a multitude of principles, methodologies, and tools. While you will be armed with the basic tools you need to get
started, you will need to continue to refine and deepen your knowledge. Lean cultures are based on continuous improvement and your development is no exception. Leaders in a Lean organization will be expected to continue their learning through self-guided
materials or additional course work.
9 - Actively Manage Change
Lean is founded on the idea of continuous improvement, so your organization and team will be improving processes frequently. This change will be beneficial, but it can be difficult as it requires adjusting to a new way of doing things. You will need to understand your
stakeholders, develop and execute a communication plan, conduct training, and prepare to manage feedback and resistance.
Operationalize Lean Sponsors, champions, and Lean project leaders work together to operationalize Lean. Operationalizing Lean is not confined to
project completion; it also includes daily management and on-going process evaluation. Sponsors and champions will assist project leaders as they execute projects by guiding the project approach, offering insight, and asking probing questions.
This process is broken into (7) main phases to help compartmentalize the tools and methodologies, but some tools may span across
phases. As you continually advance your Lean knowledge and experience, you will begin to see the ways you might leverage a practice in more than one area.
State of Colorado Lean Model This model will help you understand how Lean components relate and work together to form a continuous improvement cycle.
2 of 2
2 - Identify and Select Projects
3 - Scope and Approve Projects
4 - Envision Customer
Experience
5 - Evaluate Performance
Clarify customer
and strategic needs
Establish performance baseline
Narrow focus to key areas that impact process performance
Topics Value Stream Map Lean Process
Metrics Value Add v. Non-
Value Add 8 Wastes 5 Government
Process Pitfalls
6 -Characterize Issues
Identify and
quantify defects and errors impacting performance
Isolate root causes and prioritize problems
Topics Process Flow
Diagram Check Sheet Histogram /
Pareto Cause & Effect /
Fishbone 5 Whys Spaghetti Chart
7 -Solve Problems
Solve problems as a group
Implement new methods for executing processes
Enhance efficiency through workplace organization and cooperation
Topics 5S Kaizen A3 Workload
Balancing Product Family
Matrix Cellular Flow Kanban
8 - Sustain Gains
Change the process and workplace to retain gains
Establish monitoring of improved processes
Engage all levels in process ownership and improvement
Topics Visual
Management Techniques
Mistake Proofing Lean Daily
Management (QDIP)
Sustainment Checklist
Topics Project Selection
Topics Project Scoping SIPOC
Specify value in the customer’s eyes
Articulate the intended customer experience to guide Lean teams’ efforts
Topics Gaining Customer
Perspective and Feedback
Envision Customer Experience
Identify potential value streams and service areas that could benefit from a Lean approach
Prioritize these opportunities based on criteria
Complete project scoping, clarifying opportunity, targeted outcomes and project boundaries
Gain leadership approval for scope, resources, and schedule
Introduction to Lean (cont’d)

State of Colorado Lean Program
Roles and Responsibilities
A Lean organization requires people to function in several roles. We will focus here on three main roles: sponsors, Lean champions (coaches), and Lean project leaders (LPLs).
Sponsors are business leaders who are responsible for selecting and scoping projects, selecting teams, removing obstacles, and sustaining project results. Sponsors will guide LPLs on projects by understanding progress, addressing risks, and removing obstacles as needed.
Lean champions are individuals who have a mastery of Lean tools and techniques. Champions coach, train, and mentor project leaders and may lead high-value projects themselves.
Lean project leaders will lead Lean project teams in addition to their regular duties. A team of process experts will help the LPL execute each project. LPLs must accurately report project progress and elevate risks to the sponsor.
Overview
In a Lean organization, everyone has a meaningful role.
Sponsors, Lean project leaders, and Lean champions must partner together and share knowledge to realize gains from Lean.
The level of understanding and use of each component in the Lean model will vary by role.
Key Information
eLearning Module: http://www.bmgi.org/course/roles-and-responsibilities (Note: terminology differences may exist)
Additional Resources
Sponsors will need a detailed understanding of the Envision Customer Experience material since they will be leading vision sessions. Sponsors must be skilled in the philosophy discussed in the Operationalize Lean module so they can direct LPLs and ensure sustainment of project improvements. Sponsors will also need to be well versed in the Actively Manage Change module so they can effectively work and communicate with stakeholders and other people in the organization.
Champions will master all components of the Lean model to the extent that they will be able to teach and mentor all roles within a Lean organization.
LPLs will focus their efforts mastering the Operationalize Lean tools and techniques. LPLs will also be involved in Envisioning the Customer Experience and Actively Manage Change but will not be the main owner for these tasks.
Roles as They Relate to the Lean Model Once you understand how your role fits within the Lean
program, work with your colleagues to begin the Lean process.
Embrace continual learning beyond the classroom by reading reference material and visiting the eLearning site.
Engage with champions to test your understanding.
Sponsors should identify key stakeholder groups and prepare for managing change in the organization.
LPLs and sponsors should discuss opportunities, project scoping, and progress.
Where to Begin
1 of 2
State of Colorado Lean Model

State of Colorado Lean Program
Roles and Responsibilities (cont’d)
Search Terms / Related Topics
Evaluate Performance Sponsors Lean Project Leaders
Champions (Coaches) Program Management Office (PMO) State of Colorado Lean Model Organizational Structure
Example
Title Role Responsibilities
Project Sponsor
Business leader who drives Lean results by directing projects and owning their success
Identifies and approves projects that link to business strategy Assists with culture change at the local level through communication and Lean management
principles Manages the people aspects of process changes on an ongoing basis Builds improvement infrastructure for sponsored projects Recognizes and defines projects and value stream visions Selects Lean project leaders and assigns projects to each Selects steering team and project team for each project Allocates team members to projects and removes roadblocks to project success Reviews project activity often with Lean project leaders Reports project activity to executive team Drives the implementation of the team solution Drives realization phase with finance representative assistance
Champion
Coordinates department Lean deployment
Develops and continually improves Lean skills Allocates internal resources Maintains department master plan Spearheads communications and manages change Facilitates deployment of Lean within an agency to support agency strategy, working in concert with
sponsors and executive leaders on strategic project identification Trains and mentors Lean project leaders to competency on the Lean methodology Coaches Lean project leaders through Lean continuous improvement projects Maintains touch with Lean culture within an agency; takes actions to improve acceptance and
acceleration of Lean Develops and implements sustainment plan in collaboration with executive leaders Supports sponsors and executive leaders with strategic project identification and scoping Employs knowledge, tools and skills to create widespread commitment and manage the details of a
change initiative, large or small
Lean Project Leader
Practitioner of Lean methodology who lead Lean activities
Develops and continually improves Lean skills Leads Lean project teams and projects Reports progress and identifies barriers Coordinates project change management activities Identifies potential Lean projects and develops project scope for approval Develops and implements sustainment plans in collaboration with business leaders Parcels and focuses Lean efforts according to an analysis of value add vs. non-value add work in a
process, as revealed through the value stream map
Team Member
Participates on teams
Provides process expertise to Lean teams Actively participates in projects, collecting data, evaluating solutions and tool application Assists sponsor(s) with the implementation and long-term sustainment of the solution Learns and applies basic Lean training such as key principles and Lean methodology Learns and applies basic tools under Lean project leader’s guidance
A Lean Program Management Office (PMO) has been established within the Governor’s Office of State Planning and Budgeting that supports the development and sustainment of the Lean Program across state departments.
The Governor’s Budget and Efficiencies Committee provides guidance, strategic oversight, and makes program-level decisions. Each department will select Lean champions who will direct the roll-out of Lean within their department.
Lean Program Organizational Structure
2 of 2

State of Colorado Lean Program
2 – Identify and Select Projects
State of Colorado Lean Model

State of Colorado Lean Program
Identify and Select Projects
Identifying and selecting the right project can be as important as how well a given project is executed. There are several effective methods of identifying potential projects. Five of the most popular sources include: conducting value stream analyses (VSAs), responding to customer feedback, furthering a strategic or operational plan, analyzing performance metrics, and responding to employee suggestions. As Lean maturity increases, a natural evolution will be to identify projects linked to the organization’s strategic or operational plan.
Once a list of potential projects has been created, they must be evaluated and prioritized. A proven way to reach agreement on priority is to select those projects with the greatest potential impact and which appear to be the easiest to implement (see example on the page after next). These high-potential project(s) can be evaluated against criteria and then sequenced by the readiness of the given area where the project resides. (Note: The State of Colorado Lean Program Management Office (PMO) has defined several project selection criteria for evaluating candidate projects. The list is provided on the page after next.)
This process lends objectivity to the effort of prioritizing projects, limiting the tendency for pet projects to be worked. This process also helps limit the number of projects being worked, ensuring that the requisite management support and resources are available.
Overview
Once projects have been identified, project prioritization may occur as a broader exercise and many projects may be put forward. Sponsors and Lean project leaders should work together to ensure that the potential project ideas are high impact and low difficulty by completing the baseline assessment and identifying the significant issues.
In the case that the project idea does not achieve the intended goal, it should be abandoned. If a project is in fact a “just do it”, then avoid squandering project resources and “just do it!”
When To Use It In the Lifecycle Develop a project suggestion list by considering the five
sources for improvement opportunities.
Prioritize ideas by placing them in a 2x2 matrix: impact vs. ease of implementation.
Clarify the ideas in the high impact / low difficulty quadrant of the chart to ensure common understanding.
Evaluate high impact / low difficulty opportunities on a decision scorecard:
Supports one or more of the Governor’s initiatives High impact to customer value Financial benefit Department or division priority Resources and project leader available Other key priorities
Select the project with the best alignment to the criteria. Sequence these projects and execute in order.
How to Apply It
High impact / low difficulty project ideas should be prioritized from a larger set of opportunities.
Objective criteria should be used in the selection.
Ensure the project also has executive leaders support, available resources, and project leadership.
Key Information
Process Guide: Lean Project Prioritization (available from the State Lean PMO) Tool: Lean Project Prioritization Matrix (available from the State Lean PMO)
Additional Resources
1 of 3
State of Colorado Lean Model
State of Colorado Lean Program
Potential Sources of Project Identification
Identify and Select Projects (cont’d)
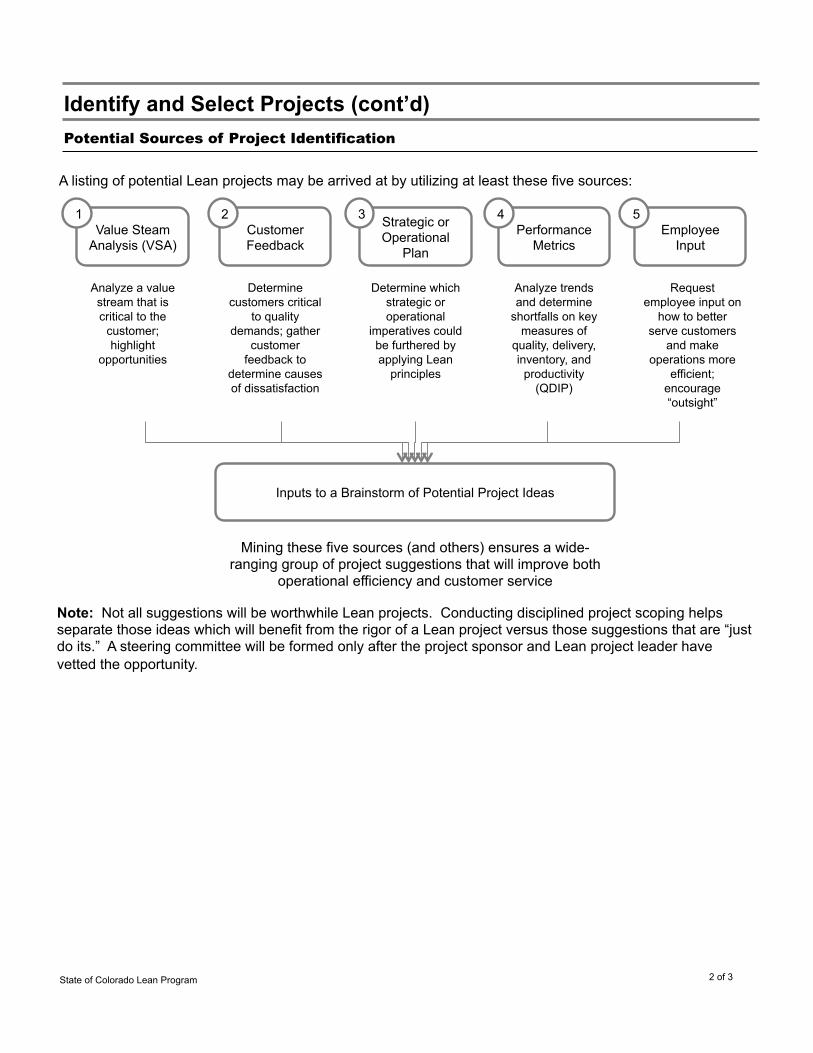
A listing of potential Lean projects may be arrived at by utilizing at least these five sources:
Value Steam Analysis (VSA)
Analyze a value stream that is critical to the
customer; highlight
opportunities
Customer Feedback
Determine customers critical
to quality demands; gather
customer feedback to
determine causes of dissatisfaction
Strategic or Operational
Plan
Determine which strategic or operational
imperatives could be furthered by applying Lean
principles
Performance Metrics
Analyze trends and determine
shortfalls on key measures of
quality, delivery, inventory, and
productivity (QDIP)
Employee Input
Request employee input on
how to better serve customers
and make operations more
efficient; encourage “outsight”
Mining these five sources (and others) ensures a wide-ranging group of project suggestions that will improve both
operational efficiency and customer service
Inputs to a Brainstorm of Potential Project Ideas
Note: Not all suggestions will be worthwhile Lean projects. Conducting disciplined project scoping helps separate those ideas which will benefit from the rigor of a Lean project versus those suggestions that are “just do its.” A steering committee will be formed only after the project sponsor and Lean project leader have vetted the opportunity.
1 2 3 4 5
2 of 3
State of Colorado Lean Program
Example
Search Terms / Related Topics
Evaluate Performance Envision Customer Experience Brainstorming
Project Prioritization Criteria Steering Team Decision Matrix
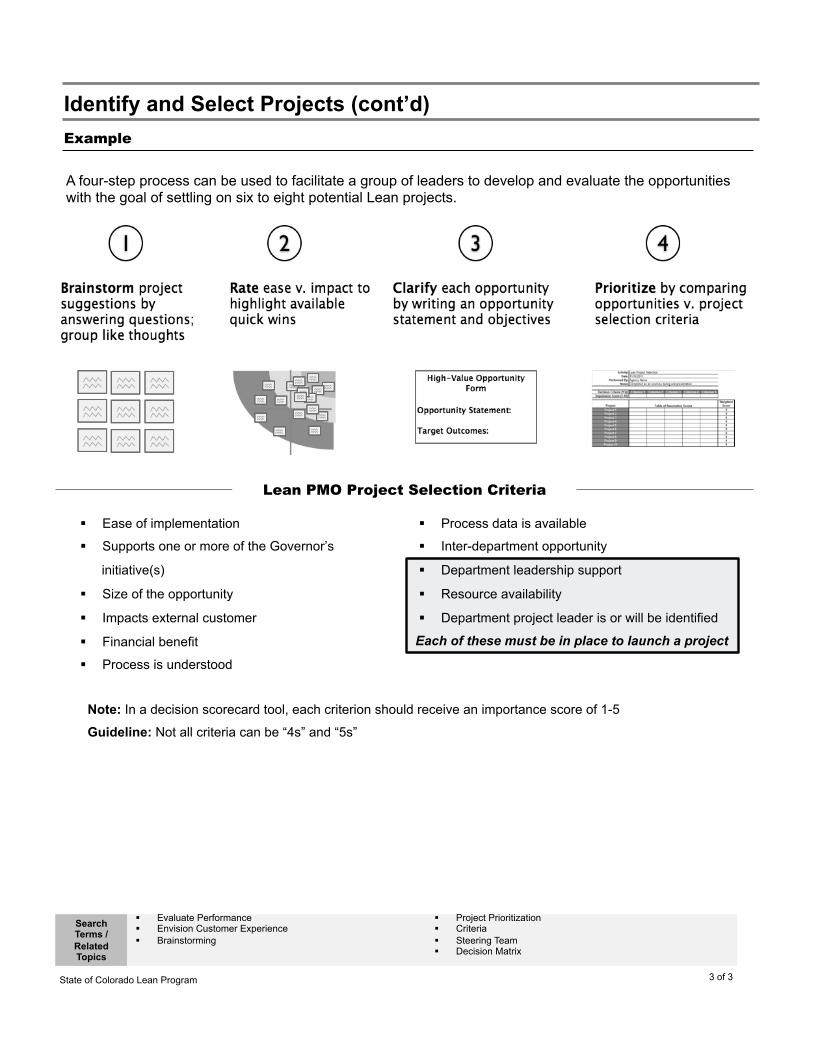
Each of these must be in place to launch a project
Ease of implementation
Supports one or more of the Governor’s
initiative(s)
Size of the opportunity
Impacts external customer
Financial benefit
Process is understood
Process data is available
Inter-department opportunity
Department leadership support
Resource availability
Department project leader is or will be identified
Lean PMO Project Selection Criteria
3 of 3
A four-step process can be used to facilitate a group of leaders to develop and evaluate the opportunities with the goal of settling on six to eight potential Lean projects.
Note: In a decision scorecard tool, each criterion should receive an importance score of 1-5
Guideline: Not all criteria can be “4s” and “5s”
Identify and Select Projects (cont’d)

State of Colorado Lean Program
3 – Scope and Approve Projects
State of Colorado Lean Model

State of Colorado Lean Program
Setting the appropriate boundaries, or scope, of a project is critical for its eventual success. Clearly articulating what is in scope and what is out of scope helps team members maintain their focus and guides their activities. It also allows for transparent progress tracking. Setting the scope of a Lean project is synonymous with completing a scoping document, which defines more than just the scope of the project.
In the ‘Scope and Approve Projects’ module, the scoping document clearly states the problem to be solved, lists goals and metrics to gauge success, identifies team members and other stakeholders, and lays out a high level plan for accomplishing the project.
Another useful tool in setting scope is a SIPOC diagram. SIPOC stands for Supplier-Input-Process-Output-Customer. The individual or team who completes the scoping document should also create this diagram (See SIPOC tool document).
Overview
When To Use It In the Lifecycle
Start by clearly stating the problem the team will address to focus their improvement activities. This problem should be stated as an opportunity.
Draw a simple diagram of the process which encompasses the problem.
Set the boundaries of the process so that the team has enough latitude to cover the most likely causes of the problem, yet can also make an impact and finish in a reasonable amount of time.
Examine customers of the process, outputs, inputs and suppliers (in that order) from the SIPOC to fully understand the scope.
State which parts of the process, organization, etc. are out of scope to improve clarity.
How to Apply It
Scoping helps the team maintain their focus, guide their activities, and track progress.
The scoping document must be approved for the project to start.
Diagramming the process helps delineate what is in scope and what is out of scope.
Key Information
Template: Project Scoping (available from the Lean PMO)
Additional Resources
Scope and Approve Projects
1 of 2
Once a potential Lean project has been identified and selected as a priority, the Scope and Approve Projects module can begin. A scope document can be prepared by the project sponsor and Lean project leader.
Setting the scope, along with the targeted outcomes and metrics to be used, is helpful in clarifying the nature of the project as well as communicating to other stakeholders. This process may require additional investigation using tools in the Characterize Issues module to clarify the opportunities to be tackled by the project.
Based on the scope, a steering committee and the core team members are identified.
Note: For initial projects in a value stream, the vision for the value stream is developed as an early task in the project. In these situations, the scope of the project may be refined as an outcome of the visioning activity.
State of Colorado Lean Model

State of Colorado Lean Program
Example
Search Terms / Related Topics
Characterize Issues Visioning Project Charter
SIPOC Approval Kick-Off
Scope and Approve Projects (cont’d)
2 of 2
PROJECT NAME: Include an Action Verb (What we want to do) + Noun (What do we want to impact or improve?) “Reduce the number of days for new employee onboarding”
DATE SUBMITTED: OPPORTUNITY STATEMENT: (Why is this important to the organization)
• What is occurring, what is happening, what “pain” are we or our customers experiencing? What is wrong or not working?
• When did this problem start? How long has it been going on? • Where does it occur? • How much, or what is the extent or magnitude of the problem?
TARGETED OUTCOMES: (Informed by visioning process and interviews)
• What are the specific outcomes we expect? “Reduce number of days by 50%”
• What metrics will this project impact? STAKEHOLDERS AND RESOURCES: Names and Roles
Executive Sponsor The person who is accountable for the success (results) of the project.
Lean Project Leader: The day-‐to-‐day leader of the effort (solution). Steering Committee: Provides oversight, guidance to project. Participates in vision phase. Core Team Members: Try to keep team to 6 team members. Make sure all process steps
are represented by people who do the work. Extended Team Members: SMEs or stakeholders who provide expertise, data or insight
Champion/Mentor: Lean Expert who will coach and mentor the project leader CUSTOMER GROUPS: (Note key segments here)
Who are the customers of this project? Who will be impacted by the project?
PROJECT METRIC(S): Primary Secondary Consequential (Typical metrics include impact on quality, speed, and cost)
Typically lagging metrics that measure process outcomes and performance to customer requirements.
Input or process metrics (leading) Impacts that may be the result of the project but may not be project metrics.
Measure possible unintended and intended consequences.
SCOPE LIMITATIONS: (Where are the boundaries?)
In Scope Out of Scope Start and End steps in the process. Which divisions are included?
What is not included?
WORKPLAN STEPS: Typical Timeline and Activities Charter Effort When will the project charter be completed and approved?
Typical Steps Include: • Gain approval to scope statement (PMO/Sponsor) • Develop macro-‐map (SIPOC) with Lean project leader • Select team members (Steering, Core, Extended) • Confirm project timeline • Establish metric baseline (via sampling if necessary) Week 0-‐Week 2
Project Kickoff When will the project kick-‐off? Leaders and team members and project roles must be filled. Typical Steps Include: • Hold process vision session • Conduct team training
Scoping Document Guide

State of Colorado Lean Program
A SIPOC is a high level process map that provides context for a Lean process improvement project. SIPOC is an acronym for Supplier-Input-Process-Output-Customer and is useful for defining the scope of a project. The individual or team who completes the scoping document should also create this diagram.
By completing the SIPOC prior to beginning a project, the team prepares for the project by collecting examples of input and output reports, gathering forms used in the process, etc. Most of the initial project work revolves around understanding the current state process. The SIPOC is a key tool to help the team understand and communicate the current state and the bounds of a given process as well as who might be critical to engage as the project develops.
Overview
The SIPOC should be prepared in concert with the scoping document. Diagramming the process will be useful for defining project scopes and identifying customers, suppliers and project stakeholders. It will also aid in selecting the steering group and core team.
The SIPOC will be reviewed in the vision session by the steering team and again by the core team as they prepare for the project.
The SIPOC is also the starting point for a Value Stream Map that will normally be developed to understand the current state process during the Evaluate Performance project stage.
When To Use It In the Lifecycle
The order in which you complete the SIPOC can be remembered using the phrase “Please Come Out In September.” Thus, the order is process, customers, outputs, inputs, and suppliers.
Identify the high level process steps that the team can agree upon (typically four to seven steps). This establishes the boundaries of the process.
Populate the customer, output, input, and supplier components for each input.
Identify output, process, and input metrics that measure the process related to customer expectations and performance requirements.
How to Apply It
SIPOC documents Supplier-Input-Process-Output-Customer flow for a given process or value stream.
A SIPOC is useful in setting the scope of the project and should be completed with the scoping document.
A SIPOC identifies the project scope boundaries and aids in identifying key process stakeholders and participants.
Key Information
Example and Templates: http://www.isixsigma.com/tools-templates/sipoc-copis/sipoc-diagram/ Job Aid: Project Scoping (available from the Lean Program PMO)
Additional Resources
SIPOC
1 of 2
State of Colorado Lean Model

State of Colorado Lean Program
Example
Search Terms / Related Topics
Scoping Process Flow Diagram Suppliers
Inputs Process Outputs Customers Value Stream Mapping
SIPOC (cont’d)
2 of 2

State of Colorado Lean Program
4 - Envision Customer Experience
State of Colorado Lean Model

State of Colorado Lean Program
Envision Customer Experience
Visions have power when they change the decisions, choices, and actions of all of the people in an organization, not just the few top executives. Fundamentally, visions provide a proof of correctness for individual and group choices (i.e., "I know this choice is good because it supports the vision”). Simply, a vision is a way to encapsulate what it means to be part of a specific community: its aspirations, values, roles, and goals.
One of the most important principles of Lean is that value is defined by the customer. Keeping this in mind, each Lean project team should be guided by envisioning the customer experience defined by improved value to the customer. This is accomplished by having the steering committee for each project team create (or affirm) a vision statement for the value stream the team is improving.
The Lean visioning exercise comprises a method for ensuring that: The customer’s perception of value is clarified; There is a common vision of the customer experience along the value stream; and Lean teams’ efforts are aligned with the customer’s experience.
Overview
To execute the Envision Customer Experience module, it is recommended to have a single vision for a value stream and its component processes, which means that a single vision could be useful across several Lean improvement events or projects.
While Lean is first being deployed, the creation of the value stream vision will most likely follow the scoping of a project. The steering committee is responsible for envisioning the customer experience. The scope of the project may be refined as an outcome of the visioning exercise.
Subsequent projects improving a value stream will simply confirm the vision. The vision can evolve over time, but should remain static during the analysis to enable the team to do their work. Communicating the value stream vision should be considered a part of the project.
When To Use It In the Lifecycle
Prepare the steering committee by soliciting perspectives on their vision of the customer experience.
Solicit Outsight: Develop an example of how an idea from one context
was used in a different situation Interview subject matter experts Research emerging trends Mine benchmarking data if applicable
Develop a best practice listing that is relevant for the value stream being considered.
In the visioning session, brainstorm vision elements such as customer experience attributes and performance goals.
Transform elements into a customer experience vision statement.
How to Apply It
A vision statement articulates how employees work together to create customer value via the value stream.
There should be a common vision of the customer experience along the value stream.
A single vision will apply to all Lean improvement events associated with that value stream.
Key Information
Process Guide: “State of Colorado Lean Vision Cookbook” (available from the Lean Program Management Office)
Additional Resources
1 of 2
State of Colorado Lean Model

State of Colorado Lean Program
Process (excerpted from the Lean Vision Cookbook)
Search Terms / Related Topics
Envision Customer Experience Customer Experience Project Scoping
Vision Session Cookbook Brainstorm
Example Value Stream Vision from the Department of Local Affairs Housing Choice Voucher Project
Our vision is to create a Housing Choice Voucher delivery system that is easily accessible and encourages participation of stakeholders. Through our utilization of technology, this system aims to empower employees and contractors to complete essential tasks in a concise and efficient manner. Further, by simplifying and streamlining our processes and our dedication to ongoing knowledge management, we aim to eliminate barriers, redundancy, and waste while maintaining a high standard of quality and accountability.
2 of 2
Envision Customer Experience (cont’d)

State of Colorado Lean Program
Gaining Customer Perspective and Feedback
The first principle of Lean is that the customer defines value. When we seek to improve a value stream, we start by envisioning a new customer experience. Just as we move from the current state to the future state, the vision should build on feedback obtained from existing customers. To identify customer groups, concentrate on those most affected by delays or errors in the process and ask them to describe how the process currently functions. Seek to learn what customers like that should be continued and what they do not like that should be changed. There are several effective methods of gathering input from customers, including customer surveys, interviews and focus groups, as well as comments from customer-facing employees such as customer service representatives.
Even if your process is primarily internally-focused, external customers can provide valuable input for understanding what is truly important. If external customers cannot be engaged, substitute front-line service employees who can supply a perspective on what your customers truly experience and value. Customer input lends credibility to the subsequent vision, and is valuable in crafting the ultimate solution during process improvement initiatives.
Overview
Once a project has been prioritized and scoping begins, customers of the affected value stream are identified. These are typically groups of customers, some internal and some external. For external customers, you may have to reserve some weeks’ time to obtain feedback prior to the vision session. It may require more lead time than for internal customers simply from the logistics of obtaining contact information, approval for the communication, and waiting long enough to receive a reasonable percentage of responses.
When To Use It In the Lifecycle Gain customer feedback through: • Customer Surveys – automated methods such as online
surveys are an inexpensive way to ask questions of customers.
• Key Informant Interviews – Face-to-face meetings are effective for obtaining richer information. Though participants may not respond as candidly as in an anonymous survey, they enable discussions with the customer and the capture of non-verbal communication.
• Focus Groups – More efficient for gaining higher volume of customer input data, focus groups also take advantage of the dynamics of a facilitated group discussion for greater depth.
Input from Customer-Facing Employees – Customer service representatives or others serving customers hear firsthand how customers experience your service. For example, a contracting specialist recounting how a contractor went out of business because of delays in payment can be even more effective feedback than a customer survey.
How to Apply It
Customer input is critical for formulating an inspiring and relevant vision. External customer input is important, relatively easy to obtain, and surprisingly underutilized. Automated and inexpensive methods are available for obtaining customer feedback.
Key Information
Additional Resources
State of Colorado Lean Model
19 of 4
Tools: www.surveymonkey.com; http://try.constantcontact.com/online-surveys/index.jsp
Focus Groups: http://qualitative-researcher.com/focus_groups.php Interviews: - http://qualitative-researcher.com/interviews.php

State of Colorado Lean Program
Example
Gaining Customer Perspective and Feedback (cont’d)
Search Terms / Related Topics
Vision Customer Experience Voice of the Customer, VOC Focus Groups Surveys
This is a reprint from an online survey tool. These services often let you build a survey from template questions using proven, successful question language.
20 of 4
Best Practice: Use a mix of quantitative and qualitative questions. Quantitative questions allow progress tracking over time while qualitative questions provide illustrations.
Best Practice: Start with a decision or goal, then work backward; what information is required, and what questions must be asked to obtain it.
Customer Survey
State of Colorado Lean Program
Gaining Customer Perspective and Feedback (cont’d)
Search Terms / Related Topics
Vision Customer Experience Voice of the Customer (VOC) Focus Groups Surveys
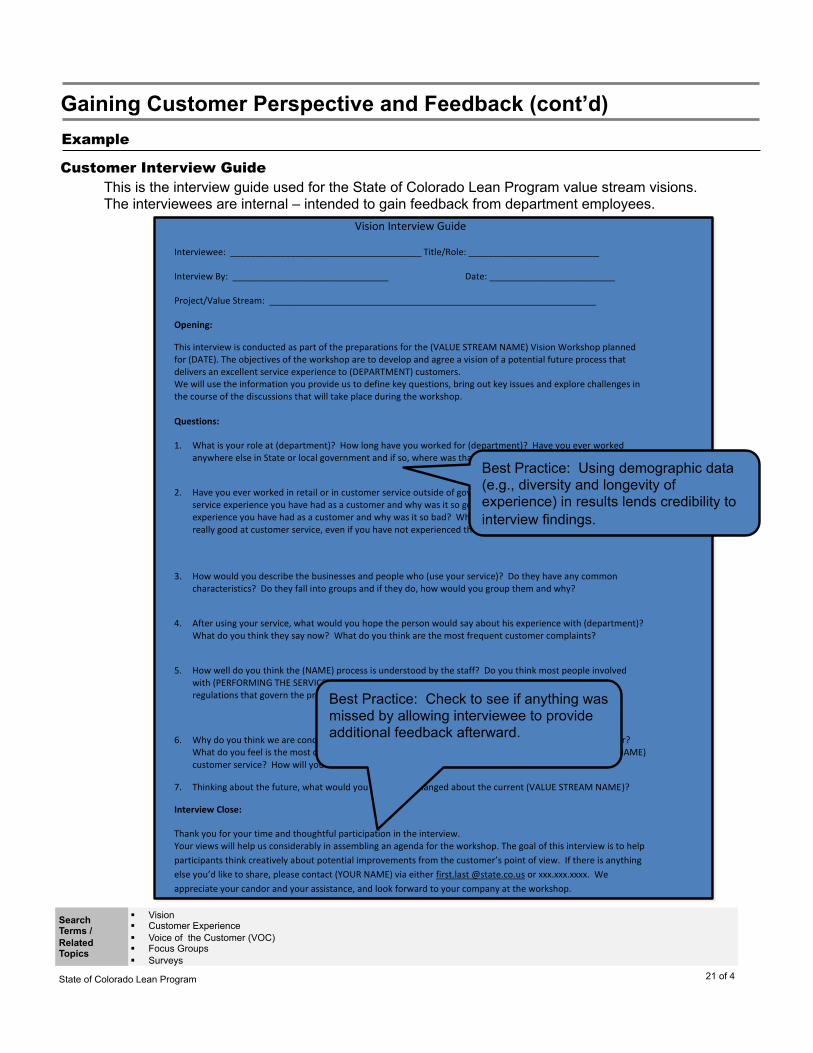
Vision Interview Guide
Interviewee: ______________________________________ Title/Role: __________________________
Interview By: _______________________________ Date: _________________________
Project/Value Stream: _________________________________________________________________
Opening:
This interview is conducted as part of the preparations for the (VALUE STREAM NAME) Vision Workshop planned for (DATE). The objectives of the workshop are to develop and agree a vision of a potential future process that delivers an excellent service experience to (DEPARTMENT) customers. We will use the information you provide us to define key questions, bring out key issues and explore challenges in the course of the discussions that will take place during the workshop. Questions:
1. What is your role at (department)? How long have you worked for (department)? Have you ever worked anywhere else in State or local government and if so, where was that?
2. Have you ever worked in retail or in customer service outside of government? What is the best customer service experience you have had as a customer and why was it so good? What is the worst customer service experience you have had as a customer and why was it so bad? What companies or places do you think are really good at customer service, even if you have not experienced them in person, and why?
3. How would you describe the businesses and people who (use your service)? Do they have any common characteristics? Do they fall into groups and if they do, how would you group them and why?
4. After using your service, what would you hope the person would say about his experience with (department)? What do you think they say now? What do you think are the most frequent customer complaints?
5. How well do you think the (NAME) process is understood by the staff? Do you think most people involved with (PERFORMING THE SERVICE) could describe the process steps and are familiar with the rules and regulations that govern the process?
6. Why do you think we are conducting this workshop and what do you hope to get out of our time together? What do you feel is the most compelling reason for a workshop to develop a vision for (VALUE STREAM NAME) customer service? How will you measure the success of the effort?
7. Thinking about the future, what would you like to see changed about the current (VALUE STREAM NAME)?
Interview Close:
Thank you for your time and thoughtful participation in the interview. Your views will help us considerably in assembling an agenda for the workshop. The goal of this interview is to help participants think creatively about potential improvements from the customer’s point of view. If there is anything else you’d like to share, please contact (YOUR NAME) via either first.last @state.co.us or xxx.xxx.xxxx. We appreciate your candor and your assistance, and look forward to your company at the workshop.
This is the interview guide used for the State of Colorado Lean Program value stream visions. The interviewees are internal – intended to gain feedback from department employees.
21 of 4
Best Practice: Using demographic data (e.g., diversity and longevity of experience) in results lends credibility to interview findings.
Best Practice: Check to see if anything was missed by allowing interviewee to provide additional feedback afterward.
Example
Customer Interview Guide

State of Colorado Lean Program
Focus Groups
Search Terms / Related Topics
Vision Customer Experience Voice of the Customer (VOC) Focus Groups Surveys
22 of 4
Gaining Customer Perspective and Feedback (cont’d)
Defining a focus group A focus group is a small homogeneous group of six to ten “information rich” individuals led through an open discussion by a skilled moderator. The group needs to be large enough to generate rich discussion but not so large that some participants are left out. It takes more than one focus group on any one topic to produce valid results – usually three or four groups. The focus group moderator nurtures disclosure in an open and spontaneous format. The moderator’s goal is to generate a maximum number of different ideas and opinions from as many different people in the time allotted, usually from 45 to 90 minutes. Focus groups are structured around a set of carefully predetermined questions – usually no more than 10 – but the discussion is free-flowing. Questions should be: • short and to the point • focused on one dimension each • unambiguously worded • open-ended or sentence completion types • non-threatening • worded in a way that they cannot be answered with a simple “yes” or “no” answer (use “why” and “how” instead) There are three types of focus group questions: 1. Engagement questions: introduce participants to and make them comfortable with the topic of discussion 2. Exploration questions: get to the meat of the discussion 3. Exit question: check to see if anything was missed in the discussion AN EXAMPLE Questions for a Focus Group on Dental Flossing Engagement questions: 1. What is your favorite toothpaste? 2. What do you notice when you look at other people’s teeth? Exploration Questions: 3. Who in particular has influenced your dental habits? 4. What are the pros and cons of flossing your teeth? 5. When you floss, how do you follow through? When you don’t, why not? 6. How do you feel when told about possible damage caused by not flossing? 7. How do you feel about yourself when you floss regularly? When you don’t? Exit question: 8. Is there anything else you would like to say about why you do or do not floss your teeth on a regular basis? Note: Flossers and non-flossers in separate groups. Excerpted from “Guidelines for Conducting a Focus Group,” 2005 Copyright © Eliot & Associates. Used with Permission.

State of Colorado Lean Program
5 - Evaluate Performance
State of Colorado Lean Model

State of Colorado Lean Program
Value Add v. Non-Value Add Activities
Value in a Lean system can only be defined by the customer and should not be skewed by pre-existing assumptions, technologies, and assets. It often helps to think of value-adding (VA) activities as those that change the product or service, that are executed correctly the first time, and those for which the customer (e.g. taxpayer, citizen) is willing to pay. Non-value add (NVA) activities consume time, funding, and/or space, but do not contribute to creating value. These activities reduce the overall ability to meet customer needs. Some non-value add activities include approvals, rework, and inspection. The aim of a Lean system is to eliminate non-value add activities. Some non-value add activities may be required by the business or by law. A business non-value add (BNVA) activity is any action required to run the business but not seen by the customer such as report development. A regulatory non-value add (RNVA) activity is an activity required by law that does not add value. Consider reducing, rationalizing, or automating these activities.
Overview
The ability to identify value add and non-value add activities is an essential component of executing a Lean project or running a Lean organization. Customer value should be clarified while evaluating performance of the value stream. Through this identification, you and your team will be able to evaluate current state performance and begin selecting processes that require work to eliminate non-value add activities.
When To Use It In the Lifecycle
Select a process to assess and break up the process into individual steps. At each step consider the following:
Does this step transform the product or service in terms of form, fit, or function?
Is this a requirement of our end user?
Is the customer willing to contribute even one cent more for this processing step?
Can we eliminate any non-value add activities, rationalize and automate any business or regulatory non-value add activities, and innovate to link existing value add activities?
How to Apply It
Value can only be defined by the end customer.
Improvement is attained by the elimination of any non-value add activities and by reducing, rationalizing, and automating non-valued add activities that are required for the business or required by law.
Key Information
Video: http://www.youtube.com/watch?v=4WBvqNwGeEs&feature=youtu.be Book: Learning to See: Value Stream Mapping to Add Value and Eliminate Muda by Shook and Rother Book: Extreme Government Makeover by Ken Miller
Additional Resources
1 of 2
State of Colorado Lean Model

State of Colorado Lean Program
Example
Search Terms / Related Topics
Evaluate Performance Waste Value Stream Mapping
5 Principles of Lean
Driver’s License: Value Added vs. Non-Value Added
Analyzing an everyday situation makes clear the power of eliminating non-value added activities
1. Arrive at DMV 2. Complete personal
information form 3. Take written driver’s test 4. Schedule driving exam 5. Depart 6. Return to DMV 7. Take driving exam 8. Receive exam results 9. Take picture 10. Receive permanent
license
1. Set-up account with personal information and picture
2. Take written exam online 3. Schedule driving exam
online 4. Arrive and sign-in via kiosk 5. Take driving exam;
examiner confirms identity 6. Receive permanent license
Historical 4 weeks
Improved 1.5 weeks
Improved 2 days
Legend Italicized Activities = Non-Value Add Bold Activities = Value Add
1. Arrive at DMV 2. Complete personal
information form 3. Wait for testing station 4. Take written driver’s test 5. Schedule driving exam 6. Depart 7. Return to DMV 8. Fill out additional form 9. Take driving exam 10. Receive exam results 11. Take picture 12. Receive temp license 13. Receive permanent
license via mail
DMV #1 DMV #2 DMV #3
2 of 2
Value Add v. Non-Value Add Activities (cont’d)

State of Colorado Lean Program
8 Wastes
Waste can be characterized as any activity that consumes resources but does not create value for the customer. The main goal of Lean is to eliminate waste. Lean projects are a systematic approach to both identifying and eliminating waste in processes. There are eight specific wastes classified in Lean and the first letter of each form the mnemonic “DOWNTIME”:
1) Defects - Any rework, mistakes, and corrections 2) Overproduction - Producing too much or too soon 3) Waiting - Waiting on materials or information 4) Non-utilized talents - Failure to fully utilize time and talents 5) Transportation - Conveyance of the materials and information 6) Inventory - Any more than the minimum to get the job done 7) Motion - Employee motion that does not add value 8) Excessive processing – Unnecessary activities, features, or complexity
Overview
Applying the concept of waste identification and elimination should be a constant activity. In fact, it should become a way of thinking for all members of a Lean organization. This may be challenging at first, as you may not recognize waste in existing processes because “that’s the way we’ve always done it.” Over time, though, all employees will be able to quickly and accurately identify waste within a process. Identifying waste helps evaluate the performance of the current process. For example, once you can identify defects in your process, you can begin to collect data on those defects and understand their impact on performance. Eliminating wasteful activities is the most effective way to improve performance and customer service.
When To Use It In the Lifecycle
Take a “waste walk.” Tour the workplace and follow the process steps, asking yourself and your team (respectfully!) at each step:
Is this step necessary to achieve the process goal?
Does the person completing this step have to wait for something or someone to begin their work?
Do you store any partial or completed products (e.g., applications)?
What errors are typically found? What is the source?
Does any information get entered multiple times?
How to Apply It
Performance is improved by eliminating waste, not by working harder.
Waste can be characterized as any activity that consumes resources but does not create value for the customer.
There are eight types of waste and each type should be eliminated where possible to increase efficiency and overall value of a process.
Key Information
Article: http://www.bizwizwithin.com/2011/04/lean-in-office-8-wastes.html Book: Value Stream Management for the Lean Office by Tapping and Shuker
Additional Resources
1 of 2
State of Colorado Lean Model

State of Colorado Lean Program
Example
Search Terms / Related Topics
Evaluate Performance Muda Value
Defect Five process pitfalls Error
Wastes Definition Examples
Defects Any rework, mistakes, and corrections
Rejection of a purchase order Incorrect data entry on an application
Overproduction Producing too much or too soon Information sent when it is not required Printing documents before they are required Processing items before they are required by the next
person in the process
Waiting Waiting on materials or information Customers waiting to be served by a call center System downtime
Non-utilized talents
Failure to fully utilize time and talents
Limited authority and responsibility Individual assigned to a job that does not utilize their
talents Inadequate ways to implement employee suggestions
Transportation Conveyance of the materials and information
Movement of files and documents from one location to another
Multiple hand-offs
Inventory Any more than the minimum to get the job done
Items and documents waiting to be processed
Motion Employee motion that does not add value
Searching for data and information Movement of people to and from filing, fax, copiers, etc.
Excess processing
Unnecessary activities, features or complexity
Unnecessary checks and approvals Same data required in number of places in an application
form Filing of documents that are not needed
2 of 2
The mnemonic “DOWNTIME” is formed by the first letter of each of the eight wastes. Consider listing the eight wastes down the left hand side of a sheet of paper and recording the wastes you see by category as you take your waste walk.
8 Wastes (cont’d)

State of Colorado Lean Program
Five Government Process Pitfalls
Waste can be characterized as any activity that consumes resources but does not create value for the customer. The main goal of Lean is to improve process flow by eliminating waste. Lean projects are a systematic approach to identifying and eliminating waste in processes. When applying Lean to government, in addition to the traditional “8 Wastes of Lean” we should consider the following five common pitfalls: • Backlog – Work waiting to be processed is called a backlog. This causes a cycle where customers call to find out the status of
their case, forcing workers to handle requests rather than accomplish the work itself. • Batching – This involves grouping items before moving the stack to the next phase of the process, causing a delay as the first
item waits for the last item to be processed prior to advancing. • Bottleneck – A step in the process that cannot keep up with the rest of the steps. Work piles up here. • Forcing One Process to Handle All Types of Work – ‘One size fits all’ is ineffective. Process designs should be customized to
the type of work being performed. • Failure to Error-Proof – Quality cannot be inspected in. Quality must be built into each step of the process, catching errors when
and where they are created - or better still, preventing them altogether.
Overview
Similar to using the lens of eight wastes, identifying and eliminating common process pitfalls should be a constant activity. In fact, it should become a way of thinking for all members of a Lean organization. At first, you may not recognize waste in existing processes because “that’s the way we’ve always done it,” but over time all employees should be able to quickly and accurately identify these pitfalls where they exist in their process.
Identifying waste helps evaluate the current performance of the process. Once you can identify, for example, where batching is affecting your process, you can begin to understand the impact on performance. Eliminating wasteful activities is the most effective source for improvement in performance and customer service.
When To Use It In the Lifecycle Take a tour of the workplace and follow the process, asking yourself and your team (respectfully!): How can we redesign the process to avoid work piling up?
Is this how we would do it if we handled only one? How can we avoid batching or get to a batch size of one? Can we do the entire process in one day so we don’t have to
track and no customers call forcing us to look for their item? Is some of the work holding up other work and should we
handle that work in a separate process?
Is there more we can do to: a) identify mistakes where they originally occur; and b) prevent mistakes before they occur?
How to Apply It
Performance is improved by eliminating waste, not by working harder. Waste can be characterized as any activity that consumes resources but does not create
value for the customer. In government we should focus on the five pitfalls that prevent us from delivering to our
customers in an effective, efficient and elegant way.
Key Information
Book: Extreme Government Makeover by Ken Miller
Additional Resources
1 of 2
State of Colorado Lean Model

State of Colorado Lean Program
Example
Search Terms / Related Topics
Evaluate Performance Value Defect Error
Pitfall Definition Examples
Backlog Work that builds up in front of a process or in a process – sometimes due to increase of demand, a problem with one item, or the absence of someone involved in the process.
Stacks of documents waiting for a machine or operation Inbox of files ‘for review’ File drawers full of incomplete work
Batching Human nature-driven tendency to perform one task on multiple items of work. This may make an individual more efficient, but slows the overall process as the first item waits for all the other items to be processed.
Documents grouped into large packs so they can be inventoried and shipped to another group or department
Grouping permit applications by type and reserving time during the week to work on one stack while another stack builds
Invoicing for user fees once per quarter
Bottleneck A point in a process where capacity is constrained. If resources upstream have greater capacity, or multiple processors feed one processor, as in a review step, a bottleneck results.
One step in the process takes considerably longer than the others and hence customers or documents moving through this step must wait
Multiple processors create files that one supervisor must review/approve
Forcing One Process to Handle All Types of Work
Different tasks may require different ‘pipes’ to process. Government processes are often designed to avoid risk, which may be associated with only one type of item to be processed. Requiring all types, even low-risk items, to be processed this way is a waste of resources.
One type of document takes significantly longer or requires different levels of approval or review
Investigations that may result in dismissal or enforcement action are treated the same until the very end of the process, even though the outcome is known earlier in the process.
Dry cleaner’s permit processed the same as oil or gas well permit despite different permit requirements as well as different familiarity with the permitting process on the part of the applicant
Failure to Error-Proof
Designing processes to immediately acknowledge errors, or to prevent them all together saves time in error correction and improves customer satisfaction. If an application is received incomplete but the applicant isn’t informed until much later, customers are unhappy.
Multiple errors are caught much later in the process at which time correcting the error causes disruption and delay
Reviewing finished reports rather than first reviewing the decisions/conclusions made before the report was written – now, if errors are found, the entire report must be re-written
Financial reports written with columns of figures in a word processing program rather than a spreadsheet program where arithmetic errors can be easily avoided
2 of 2
Five Government Process Pitfalls (cont’d)

State of Colorado Lean Program
Value Stream Map (VSM)
A value stream is a compilation of all actions, both value add and non-value add, that are required to deliver a product or service to the customer. A Value Stream Map (VSM) is a simple diagram that depicts the value stream from the point of view of the product or service. It is not a detailed flow chart of what people do, but a diagram of what happens to the product or service as it flows through the value stream. Typically, a VSM is used to understand the process and identify improvement opportunities. VSMs also help identify and quantify waste, providing a foundation for a Lean future state. Creating a value stream map as a team allows all team members to get a better grasp on the full process, as opposed to focusing only on their particular specialty. VSMs also use a series of symbols to explain how the product or service is processed without using words. A VSM differs from a process map in that it contains data such as cycle time, lead time, inventory, queue time, process yield, and number of personnel—these details will help quantify the magnitude of opportunities.
Overview
Development of current state value stream maps should occur when you are evaluating performance. Creation of value stream maps may also be done as part of a rapid improvement event as the tools helps a team gain a common understanding of the process and opportunities for improvement. Current state value stream maps have also proven helpful to leaders and champions as a means to identify opportunities for projects. Development of a future state value stream map can be done as part of problem solving stage, in which the team clearly depicts the intended future process and its performance if all improvements are implemented.
When To Use It In the Lifecycle
Steps for developing a VSM include:
1. Determine what individual product or service to map
2. Draw the physical flow
3. Add the material flow; depict the movement of all internal and external materials
4. Add the information flow (i.e., applications, communications, scheduling, etc.)
5. Collect real process data and add it to the chart
6. Calculate process lead time and process cycle efficiency
7. Verify the map and overlay improvement opportunities
8. Consider creating a future state VSM to demonstrate improvements and intended future performance
How to Apply It
A value stream map is a compilation of all actions required to bring a product or service to form.
A value stream map is a diagram depicting a value stream from the product’s point of view.
Value stream maps are useful because they help identify and quantify waste, develop end-to-end process understanding, and provide a foundation for a future state process.
Key Information
Book: Value Stream Management for the Lean Office by Tapping and Shuker Book: Learning to See: Value Stream Mapping to Add Value and Eliminate Muda by Shook and Rother Case Study: Lean Thinking in Corrections (available from the Colorado Lean PMO)
Additional Resources
1 of 2
State of Colorado Lean Model

State of Colorado Lean Program
Search Terms / Related Topics
Evaluate Performance SIPOC Value
Process Information Flow Process Flow Material Flow
2 of 2
Example
Select Value Stream Mapping Symbols
Value Stream Mapping employs a set of symbols to communicate information efficiently. If you choose to use these symbols, ensure that you include a key so that those unfamiliar with the symbols are able to read the map.
Mapping the customer’s experience from leaving their home via taxi through check in and security shows the potential areas for waiting and other delay.
Value Stream Map (VSM) (cont’d)
0 min + 40 mins 1 min + 3 mins 1 min + 3 mins 0 mins + 10 mins 0 min + 0.5 mins
Sample VSM Diagram For Getting to Your Plane

State of Colorado Lean Program
Lean Metrics
Typical performance metrics used in business and government today are usually output metrics. These measure the results of processes. In a Lean environment, we must be equally concerned with the process itself if we want to control the results. This calls for a new set of metrics. These represent a core set of measurements that can be used to gauge the performance of any process. Output Metrics:
• Increased process visibility - The extent to which a process or steps in a given process are easily identified, tracked, or researched by the customer.
• Cost savings – Verifiable and validated reduction in existing costs. • Cost avoidance – Validated financial benefit related to avoided spending.
Process Metrics: • Lead time (LT) – Total time (from start to finish, from the customer’s perspective, including waiting time) to develop a
product or deliver a service to a customer. • Cycle time – Time to complete a process or process step, excluding wait time. • Work in process (WIP) – Amount of products or transactions that are being processed or waiting to be processed. • Process cycle efficiency (PCE) – The ratio of value-added process time to total elapsed time, expressed as a
percentage. • First pass yield (FPY) – Percent of occurrences that the document or product passes through the entire process without
needing rework.
Overview
Lean output and process metrics are used throughout the project lifecycle. They are employed to identify poorly-performing processes for an improvement effort, to set a baseline for performance, and for ongoing management of a process.
The State of Colorado Lean Program values performance metrics and departments are expected to provide regular reports for each Lean project. All metrics are subject to validation.
When To Use It In the Lifecycle 1. Lead Time (Little’s Law): LT = WIP / Exit Rate, where exit
rate is the rate at which units complete the process • Reduce LT by lowering WIP or improving throughput
of the process 2. Process Cycle Efficiency: PCE = Value Add Time / LT
• PCE indicates how efficiently the process converts WIP into output
3. First Pass Yield: FPY = Process1 Yield x P2 Yield x P3 Yield • When multiplied together, four individual process
yields of 90% will result in 65.6% First Pass Yield!
How to Apply It
Lean metrics measure both process performance and output performance.
Lead time, cycle time, and WIP affect customer wait times; process cycle efficiency and first pass yield are measures of effectiveness and quality of the process.
Use Lean metrics throughout the project lifecycle to evaluate performance, determine a baseline, and for ongoing management.
Key Information
Article: EPA’s Lean Metrics in Government http://www.epa.gov/lean/government/pdf/Metrics_guide.pdf Book: Value Stream Management for the Lean Office by Tapping and Shuker Book: Learning to See: Value Stream Mapping to Add Value and Eliminate Muda by Shook and Rother
Additional Resources
1 of 2
State of Colorado Lean Model

State of Colorado Lean Program
Example
Search Terms / Related Topics
Evaluate Performance Lean Daily Management Lead Time
Cycle Time Work In Process (WIP) Process Cycle Efficiency First Pass Yield (also called Rolled Throughput Yield or First Time
Through Quality)
Metric Description Example
Lead time (a.k.a. elapsed time)
Total time (from start to finish, from the customer’s perspective, including waiting time) to develop a product or deliver a service to a customer. Typically expressed in days.
Time between when a permit application was submitted (even if incomplete) and when customer receives a permit (e.g., 8 days)
Cycle time Time to complete a process or process step, excluding wait time. (note: Not all cycle time is value-add)
1.5 days processing time
Work in process (WIP)
Amount of products or transactions that are being processed or waiting to be processed.
49 permit applications are in the process
Process cycle efficiency
The ratio of value-added process time to total elapsed time.
0.5 Value Add Day / 8 Total Days = 6.25%
First pass yield Percent of occurrences that the product or document passes through the entire process without needing rework.
30% (Step 1) x 60% (Step 2) x 90% (Step 3) = 16% rolled first pass yield
2 of 2
Lean Metrics (cont’d)
From the Environmental Protection Agency’s Lean Government Metrics Guide

State of Colorado Lean Program
6 - Characterize Issues
State of Colorado Lean Model

State of Colorado Lean Program
5 Whys
The core goal of root cause analysis is discovering why something happened. Simply asking ‘why’ can search out deeper levels of causality. The 5 Whys technique is based on the concept of asking why multiple (typically, at least five) times to search out a root cause and was popularized by Benjamin Franklin in Poor Richard’s Almanack (sic) in the eighteenth century.
This is often used in conjunction with other root cause analysis tools. For example, it can be used in each category, or ‘bone’ of a fishbone diagram (see Cause and Effect / Fishbone Diagram). In fact, since problems rarely have a single root cause, it is important to ask why to identify multiple paths of root causes.
Overview
5 Whys is a useful tool to characterize issues and to identify the root cause of a problem before proposing a solution. Since many problems have more than one root cause, it is important to characterize a problem thoroughly before looking for a solution. If only one category of possible cause is targeted, 5 Whys will only identify one of the root causes. Repeat the 5 Whys process to avoid this pitfall, building a tree of potential reasons that can be confirmed with data.
When To Use It In the Lifecycle
Ask, “Why is this a cause of the original problem?”
Document root cause answers on a whiteboard. If the group feels that there are multiple reasons, then represent this in a tree structure.
Continue to ask why at least five times as a rule of thumb.
Stop when the root cause is apparent or when a cause is controlled by a managerial level more than one level beyond the group’s level.
Check the validity of the analysis by reverse logic. Start at the root cause and state, “Therefore”, then recite the next step above. Each step should logically flow from bottom to top.
How to Apply It
The 5 Whys concept is used to find the root cause of a problem.
5 Whys can be used in conjunction with several other root cause analysis tools such as the fishbone diagram or A3 Practical Problem Solving tool.
5 Whys should be used for more than one category of possible root causes to ensure causes are not missed.
Key Information
Article: http://www.isixsigma.com/tools-templates/cause-effect/determine-root-cause-5-whys/
Additional Resources
1 of 2
State of Colorado Lean Model

State of Colorado Lean Program
Example
Search Terms / Related Topics
Characterize Issues Five Whys Root Cause Analysis
Fishbone Diagram A3
2 of 2
Problem Statement: Losing the war cost us the Kingdom
5th Why? The blacksmith did not have enough nails to attach each shoe properly
4th Why? The horse threw a shoe because it was not attached with enough nails
3rd Why? The rider was lost because his horse threw a shoe
2nd Why? The battle was lost because the rider carrying the intelligence was lost
1st Why? The war was lost because the battle was lost
Therefore
Therefore
Therefore
Therefore
Therefore
Root Cause A shortage of horseshoe nails cost us the kingdom
5 Whys
5 Whys (cont’d)

State of Colorado Lean Program
The ability to effectively improve processes relies on identifying the actual cause of known defects and errors. Isolating the true root cause(s) may be difficult, but the cause and effect, or fishbone, diagram can help structure your approach to finding them. Fishbone diagrams also help ensure that a balanced list of potential causes has been developed during brainstorming. A fishbone diagram is so named because it looks similar to a fish skeleton. The head of the fish is the problem or defect you have identified, which is typically documented in a box on the right of your paper. You can then draw the spine of the fish with an arrow to the head. After you and your team have brainstormed potential causes, try to group or categorize them. The categories become the main bones pointing into the spine. Popular groups or categories include the 4Ps (policies, place, people, procedures) and 4M/6M (method, machine, man, measurement, materials, Mother Nature). Brainstormed causes are documented with a line and an arrow pointing into the related category’s bone, providing a comprehensive overview of potential root causes for further investigation (see the examples on the next page).
Overview
Fishbone diagrams are most useful after you have identified some process issues or defects. A cause and effect brainstorming exercise will help your team better understand what may be causing the issue or defect you would like to eradicate. After you have identified potential causes, identify the top causes you would like to investigate further and confirm with data.
When To Use It In the Lifecycle
Identify the defect or issue to be analyzed.
Select groups or categories, such as 4Ps or 4Ms/6Ms.
Try different brainstorming methods. Brainstorm by category or do a silent brainstorm and discuss with the group after a few minutes.
Write potential causes on sticky notes to allow for easier rearrangement.
Select causes to investigate further but do not make specific action plans to address them until you have verified the causes with data.
How to Apply It
Cause and effect or fishbone diagrams are helpful in driving a team to discover the root causes of a process defect or error.
The fishbone approach encourages balanced brainstorming and can be tailored to any problem.
Verify the root cause, preferably with data, before making any action plans to fix the issue.
Key Information
Article: http://www.leansixsigmasource.com/2009/04/28/fishbone-diagram-root-out-those-causes/ Training Document Template: A3 Practical Problem Solving (available from the Lean PMO)
Additional Resources
Cause and Effect / Fishbone Diagram
1 of 2
State of Colorado Lean Model

State of Colorado Lean Program
Examples
Search Terms / Related Topics
Characterize Issue Root Cause Analysis Cause and Effect Diagram
Ishikawa Diagram Fishbone Diagram Brainstorming A3 Problem Statement
Cause and Effect / Fishbone Diagram (cont’d)
2 of 2
Fishbone Diagram
Fishbone - CDLE WC Causes of Disputes
State of Colorado Lean Program
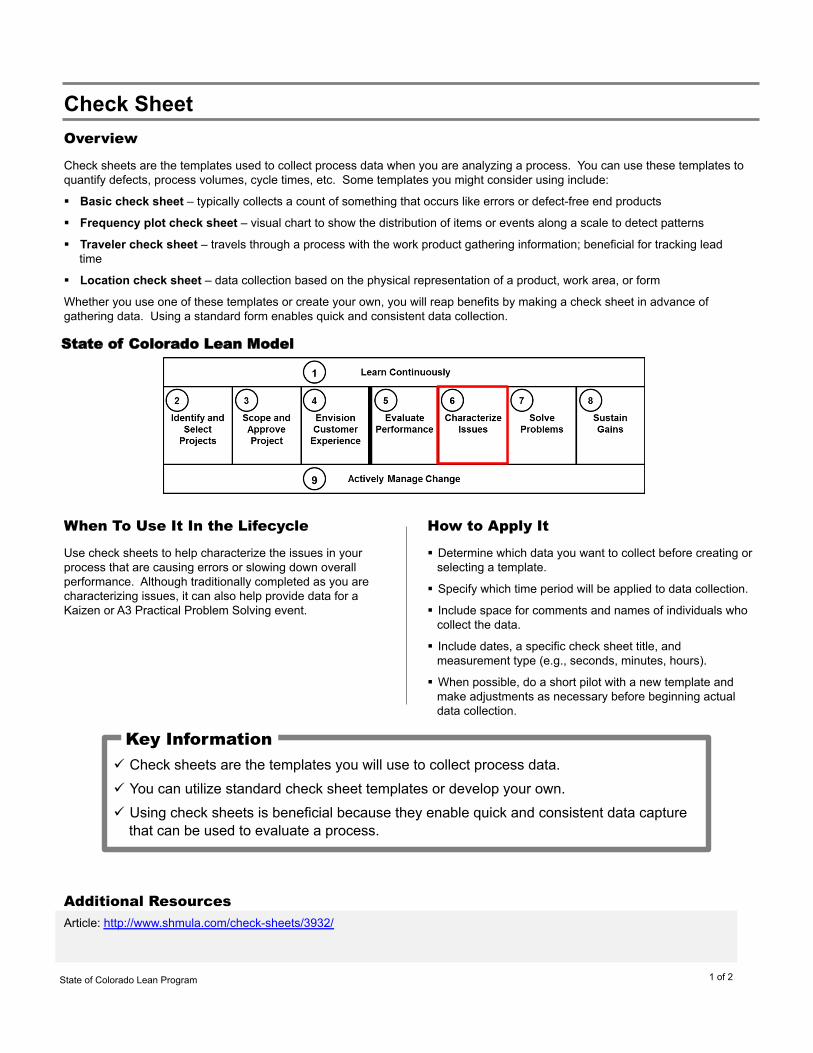
Check sheets are the templates used to collect process data when you are analyzing a process. You can use these templates to quantify defects, process volumes, cycle times, etc. Some templates you might consider using include:
Basic check sheet – typically collects a count of something that occurs like errors or defect-free end products
Frequency plot check sheet – visual chart to show the distribution of items or events along a scale to detect patterns
Traveler check sheet – travels through a process with the work product gathering information; beneficial for tracking lead time
Location check sheet – data collection based on the physical representation of a product, work area, or form
Whether you use one of these templates or create your own, you will reap benefits by making a check sheet in advance of gathering data. Using a standard form enables quick and consistent data collection.
Overview
Use check sheets to help characterize the issues in your process that are causing errors or slowing down overall performance. Although traditionally completed as you are characterizing issues, it can also help provide data for a Kaizen or A3 Practical Problem Solving event.
When To Use It In the Lifecycle
Determine which data you want to collect before creating or selecting a template.
Specify which time period will be applied to data collection.
Include space for comments and names of individuals who collect the data.
Include dates, a specific check sheet title, and measurement type (e.g., seconds, minutes, hours).
When possible, do a short pilot with a new template and make adjustments as necessary before beginning actual data collection.
How to Apply It
Check sheets are the templates you will use to collect process data.
You can utilize standard check sheet templates or develop your own.
Using check sheets is beneficial because they enable quick and consistent data capture that can be used to evaluate a process.
Key Information
Article: http://www.shmula.com/check-sheets/3932/
Additional Resources
Check Sheet
1 of 2
State of Colorado Lean Model

State of Colorado Lean Program
Examples
Search Terms / Related Topics
Characterize Issues Data Collection Pareto
Histogram Evaluate Performance Kaizen
Check Sheet (cont’d)
2 of 2
Week
Defect 1 2 3 4 Total
Incorrect SSN | | | 3
Incorrect Address | 1
Incorrect Work History
| | 2
Incorrect Salary History
|| | ||| || 8
Basic Check Sheet Location Check Sheet
Sample Call Tracking Check Sheet To gather data on the reasons for customer contacts, a team at the Department of Regulatory Agencies developed a check sheet. The team also added columns for call duration (to the nearest 30 seconds) and whether or not the caller’s issue was resolved on the first contact (yes/no).

State of Colorado Lean Program
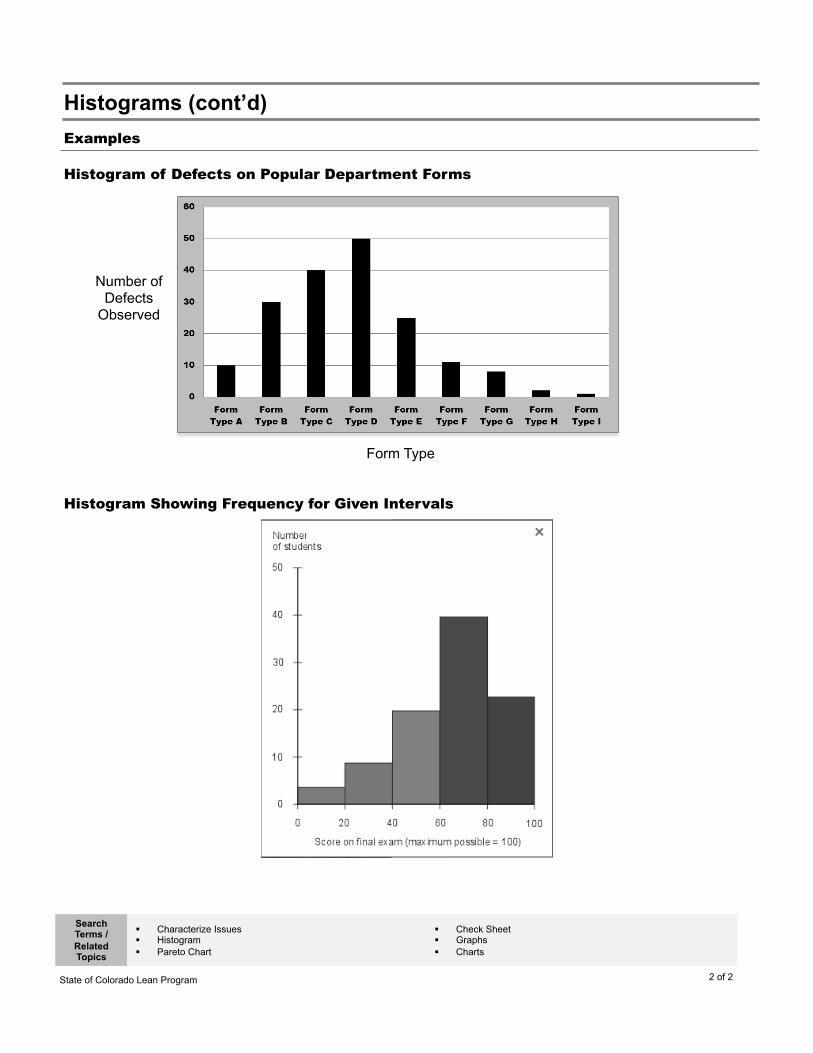
Histograms are bar charts used to summarize process data that has been collected over a period of time and graphically present its frequency distribution. Presenting data in a graphical form, such as with a histogram, has several advantages over simply collecting it in a table or a list. Histograms help:
Display large amounts of data in one place; Reveal variation and comparative relationships; Illustrate the underlying distribution of the data; and Show the relative frequency of occurrence of the various data values.
Overview
Histograms are useful in characterizing issues in your process. When determining, for example, areas on which to focus the team’s improvement effort, this graph can quickly show which types of transactions are performed in which volume or at which step in the process the most defects occur.
Related tools: Data from check sheets may be represented graphically with a histogram. And, a special type of histogram, called a Pareto Chart (see the Pareto Chart tool document), is used to identify the most impactful causes when characterizing issues and solving problems in the Lean way.
When To Use It In the Lifecycle Choose frequency data to be collected. It could be cycle
time, number of forms, occurrences, or something else.
Determine the X axis categories. This could be defect types, form names, etc. In the case of continuous data, this should be expressed as intervals (ex: if you are plotting length of time in the cycle, then you might have an interval of number of days or weeks, such as 1-2 days, 3-4 days, etc).
Arrange the data categories on the x-axis and plot frequency of occurrence on the Y axis (Rule of thumb: you should collect at least 30 data points).
If no pattern emerges, consider varying the dimensions and ranges to see if other insights are available.
How to Apply It
Histograms are bar charts displaying frequency distributions and comparative relationships.
Histograms should be considered as a means to display tabular data and uncover additional insight.
Pareto Charts are special types of histograms that are helpful in subsequent phases of the project.
Key Information
Book: The Memory Jogger™ 2, Tools for Continuous Improvement and Effective Planning, © 2010 by GOAL/QPC
Additional Resources
1 of 2
Histograms
State of Colorado Lean Model
State of Colorado Lean Program
Examples
Search Terms / Related Topics
Characterize Issues Histogram Pareto Chart
Check Sheet Graphs Charts
2 of 2
Histograms (cont’d)
Histogram of Defects on Popular Department Forms
Histogram Showing Frequency for Given Intervals
Form Type
Number of Defects
Observed

State of Colorado Lean Program
Pareto charts are a type of bar chart that are used to help prioritize problems or error types. They are named for Italian mathematician, Vilfredo Pareto, who found that 85% of the country’s wealth was controlled by 15% of the population. In a Pareto chart, the horizontal or X-axis does not represent a continuous scale. Instead, it represents different categories. These categories are often types of defects or errors in a process. The vertical, or Y-axis is used to quantify a count or percent of the categories on the X-axis, enabling the user to capture impact in terms of delays, defects, etc. On Pareto charts, bars are arranged largest to smallest, beginning on the left. Organizing the bars in this way enables quick identification of the top problem areas that should be focused on first to drive the fastest, most impactful improvements. The Pareto Principle states that 80% of the impact can be attributed to 20% of the causes, the implication of which is that problem solving should focus on the ‘critical few’ rather than the ‘trivial many.’ Once you have charted your data, there are two possible outcomes: clear Pareto effect and no Pareto effect. When there is a clear Pareto effect, a few categories will account for approximately 80% of the entire impact or defects observed. Focusing your efforts on these ‘critical few’ categories represents the greatest opportunity to improve performance.
Overview
Pareto charts are best used when observing a process and identifying the frequency defects, delays, and errors. Collecting data and plotting it on a Pareto chart helps bring clarity to issues that make the process slower and less efficient. Pareto charts are powerful and effective because they help identify the ‘critical few’ causes and help you discount the ‘trivial many.’ Once you have identified the causes of the problems in the process, you will be able to move towards developing solutions for those reoccurring, high impact problems.
When To Use It In the Lifecycle When observing a process for improvement opportunities
you should collect, delay, error and/or defect data.
Determine categories and gather data on the number of defects or delays in each category.
Plot your data by category and arrange your highest frequencies from left to right. Add a line to show cumulative percentage and to determine whether or not there is a clear Pareto effect.
Consider plotting the same categories with another variable like time or cost required to fix the defect. Analyzing the results of the two graphs together will help you target the most frequent and highest-impact defects.
How to Apply It
A Pareto chart is a bar graph used to identify and prioritize problems within a process by using the 80 / 20 rule.
Pareto charts can quantify defect frequency and other variables like cost and time to fix a defect.
Key Information
Article: A detailed example of Pareto: http://www.mindtools.com/pages/article/newTED_01.htm Template: A simple Pareto template is available at http://asq.org/learn-about-quality/tools-templates.html
Additional Resources
Pareto Chart
1 of 2
State of Colorado Lean Model
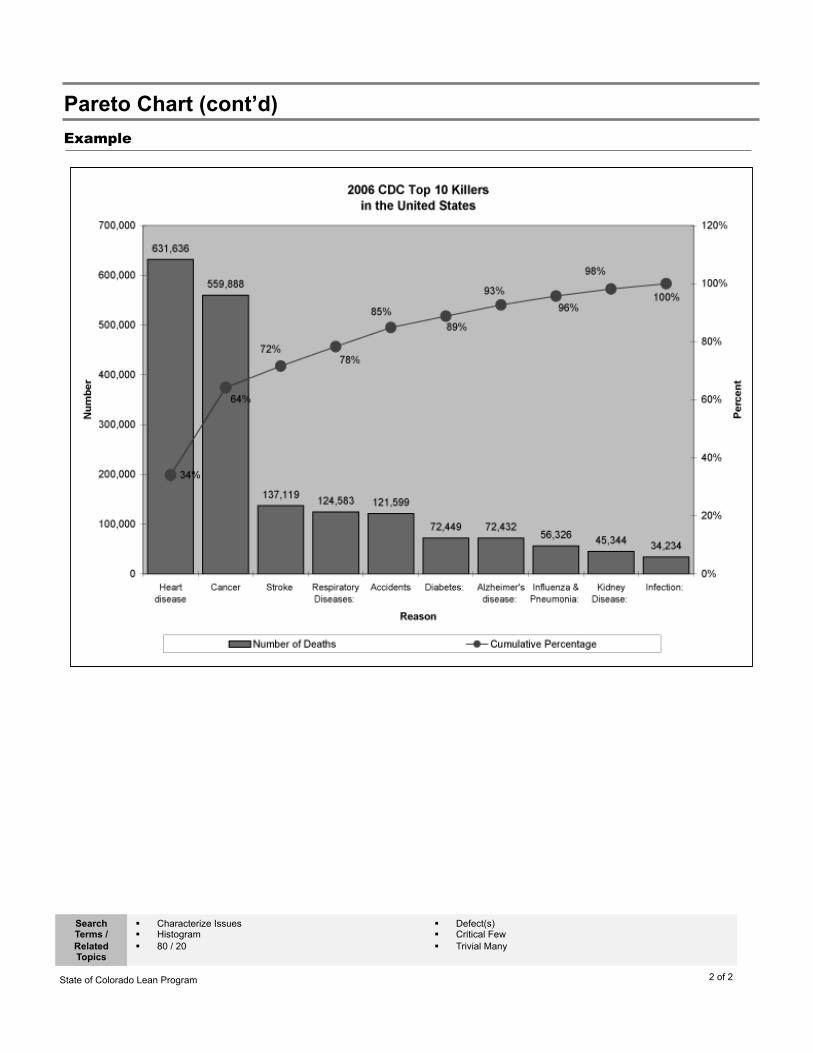
State of Colorado Lean Program
Example
Search Terms / Related Topics
Characterize Issues Histogram 80 / 20
Defect(s) Critical Few Trivial Many
Pareto Chart (cont’d)
2 of 2

State of Colorado Lean Program
Process Flow Diagram
Process flow diagrams illustrate a process by representing the steps with the appropriate shapes or icons, depending on what occurs in that step. The diagram captures the actual flow or sequence of steps that a product, service, or piece of information follows and it is a powerful tool for reaching consensus on the actual steps in a process.
Process flow diagrams are valuable when characterizing issues. These diagrams act as a means of communicating what is actually occurring in a process, provide the basis for the process analysis, and visually highlight areas of inefficiency.
When being used in the context of performance evaluation, the diagram can show areas of complexity, redundancy, or unnecessary loops, handoffs or approval steps, where simplification and standardization may be possible.
When being used in the context of problem solving, process flow diagrams are useful in comparing current state versus future state to identify improvement opportunities and highlighting locations where additional data should be collected.
Overview
Process flow diagrams can be used virtually throughout the lifecycle – scoping, evaluating performance, characterizing issues and solving problems.
A basic flow diagram should be used as the basis for a SIPOC (see the SIPOC tool document) when initially scoping a project. A simple block diagram identifying four or five high-level steps is sufficient.
During a Kaizen event, an A3 session, or other analytical or problem-solving processes, use a process flow diagram to show a greater level of detail than was used to create the SIPOC, including decision points and alternate paths. Doing so often highlights areas of inefficiency.
When To Use It In the Lifecycle Determine the boundaries of the process and observe the
process being performed.
Brainstorm with the group all the steps in the process; include inputs, outputs, decision points, and related material or information flows.
Arrange the steps in order using sticky notes to allow edits.
Check for completeness by following people, requests, and products through the entire process. Make sure feedback loops are closed and key decision points or branches of logic are included.
Finalize the diagram by ensuring all team members agree that the diagram is accurate.
Note: arranging the process flow diagram so that the steps align with roles in the organization results in a “swim lane” diagram, illustrating who does what in the process and highlighting hand-offs.
How to Apply It
Process flow diagrams visually illustrate a process by representing the steps with shapes.
Process flow diagrams can be used to communicate and to analyze a process.
A process flow diagram is used to identify project scope and forms the foundation of a more detailed process analysis during the problem-solving phase, often via A3 or Kaizen.
Key Information
Text: The Memory Jogger™ 2, Tools for Continuous Improvement and Effective Planning, © 2010 by GOAL/QPC Article: http://www.mindtools.com/pages/article/newTMC_97.htm
Additional Resources
1 of 2
State of Colorado Lean Model

State of Colorado Lean Program
Examples
Process Flow Diagram (cont’d)
Search Terms / Related Topics
Flowchart Swim lane Value Stream Map
SIPOC Process Steps
2 of 2
Simple Process Flow Diagram Includes approval and feedback loop
CDLE WC Disputes Swimlane Diagram

State of Colorado Lean Program
A spaghetti chart is a type of process map that shows the physical movement of people, products, or information in a given value stream. They are called spaghetti charts because they start with a floor plan and once all the process lines are drawn, it can look like a plate of cooked spaghetti! These diagrams are helpful because they visualize the travel and hand-offs that occur in a process that may be eating up time. You can utilize the results to reconfigure a workspace and eliminate the wastes observed during the analysis. For best results, complete these diagrams in the workplace, observing the people who execute the process. Do not depend on documentation as the basis for depicting physical movement.
Overview
Spaghetti charts help characterize issues that stem from a physical layout. Once a value stream has been identified for improvement, consider creating a spaghetti chart on portions of the value stream to get another perspective on potential wastes. Solving issues of layout is accomplished in the Solve Problems module and may involve employing the 5S method.
When To Use It In the Lifecycle
Find or create a diagram of the workspace that is roughly drawn to scale.
Work with the people who execute the process to build a thorough understanding of how the product, people, or information moves.
Do not leave out any movement, even if the paper becomes cluttered and difficult to follow (which likely indicates an opportunity for improvement).
Record the amount of time and distance traveled to complete the activity and other process data to establish a baseline.
Address the causes of unnecessary movement using 5S principles and measure the revised time and movement to gauge improvement.
How to Apply It
A spaghetti chart is a type of process map that shows the physical movement of people, products, or information in a given value stream.
You can utilize the results to reconfigure a workspace to eliminate time and waste, potentially employing 5S principles.
Key Information
Example: http://www.six-sigma-material.com/Spaghetti-Diagram.html Example: http://asq.org/learn-about-quality/process-analysis-tools/overview/spaghetti-diagram.html
Additional Resources
Spaghetti Chart
1 of 2
State of Colorado Lean Model

State of Colorado Lean Program
Examples
Search Terms / Related Topics
Characterize Issue Flow Process Map
Floor Plan Layout 5S
Spaghetti Chart (cont’d)
2 of 2
From organization by function…
…to organization by value stream
1 2
3 4 5
2
3
4
5 1
Accounting
Marketing
Information Technology
Customer Service
HR
Where process time and material or information flow are major issues, the spaghetti chart is useful in understanding how to reconfigure the workplace and co-locate process participants. Consider aligning participants from different departments into a single, cellular layout to improve flow and balance workloads.

State of Colorado Lean Program
7 - Solve Problems
State of Colorado Lean Model

State of Colorado Lean Program
5S is a methodology for cultivating and maintaining a clean, organized, and safe workplace. 5S derives its name from five related terms that begin with the letter “S” and is important because a safe, organized workplace sets a foundation for continuous improvement. It is also a simple, systematic way to increase efficiency through employee involvement. The 5Ss are as follows:
Sort – Distinguish needed vs. unneeded items and remove the latter Set in order – Keep needed items in the correct place to allow for easy and immediate retrieval Shine – Keep the work space orderly and clean; clean to inspect for issues Standardize – Create consistent standards for visual management across an organization, using signs, photos and colors to
create a common understanding of what is an acceptable condition Sustain – Be disciplined and develop a habit of maintaining the first four categories; conduct checks to ensure sustainment
The 5S process is not a spring cleaning exercise. Instead, it is a disciplined approach to creating and maintaining order. A common pitfall is to execute the first three categories but to not follow through on the last two. Leadership commitment and employee ownership of the 5S system is critical to sustainment.
Overview
5S is useful when trying to solve efficiency problems and when seeking to sustain Lean gains. It is particularly helpful when addressing a messy workplace, when there are safety concerns, and when people spend a significant amount of time searching for the tools or information required to complete a task.
When To Use It In the Lifecycle Sort involves tagging all items that may not be regularly
used, and storing or disposing of items not regularly used.
Set in order involves arranging items in the work center/ office by frequency of use, placing the most commonly used items within arm’s reach. Borders are drawn around these items to indication their proper location.
Shine is a routine to get rid of dirt and grime. Make a plan for daily, weekly, and monthly cleaning tasks.
Standardize includes setting visual standards such as photos, cleaning schedules, etc. so all colleagues can adhere to a 5S workplace.
Sustain by utilizing an audit approach to track how well the 5Ss are being maintained. Transfer ownership of audit to the employees in the area.
How to Apply It
5S is an approach to cultivate and maintain a clean, organized, and safe workplace.
5S should make it obvious when a required item or tool is missing or out of place.
The fifth S focuses on the discipline and tracking required to maintain a 5S workplace.
Key Information
Book: Organizing the Workplace to Eliminate Waste by Tapping and Fabrizio Tool: 5S Audit Checklist (available from the Lean PMO)
Additional Resources
5S
1 of 2
State of Colorado Lean Model
One of the main purposes for a 5S work place is Safety. Some organizations make Safety a 6th S and call it out specifically for consideration.

State of Colorado Lean Program
Illustration
Search Terms / Related Topics
Solve Problems Organize Clean Sort
Set in Order Shine Standardize Sustain
5S (cont’d)
2 of 2
Notes
5S got its start in production environments but applies equally well to office environments, since this is where services are produced.
During the 5S sort process, those items whose use is unknown are given a red tag, noting where they were found. Employees should determine the right place for these items, but avoid throwing away equipment whose purpose is not known. Save this in an area away from the work place for a period of time before disposal.
Leadership must model the way and communicate the importance of 5S, but sustainment of 5S depends ultimately on ownership by the folks who work in the area where 5S has been implemented.
Clutter makes it difficult to find information customers need
Before 5S A new standard. A place for everything. Everything in its place!
After 5S
These examples below are from Colorado Department of Corrections’ kitchen and maintenance areas where 5S is an integral part of daily activities. Why do suppose it is so important in the Corrections system?
Can you spot the missing item on the right?

State of Colorado Lean Program
In the context of Lean, A3 is a systematic, structured method for solving business problems that can be a practical problem solving (PPS) process, a reporting protocol for projects or strategy deployment, or a method for proposing policy changes, all fitting on one sheet of A3 size paper. A3 refers to the international paper size for tabloid-sized paper; roughly 11”x17”. An A3 PPS: Allows for clear recognition and understanding of the actual situation; Focuses on identification of the true root cause of the problem; Identifies and drives confirmation of the actions that can or will be taken to ensure the problem does not recur; and Encourages speed with a pencil-and-paper approach. A3 is valuable because it: Offers a structured way to involve all levels of the organization in improving quality, cost, and delivery of a service or product; Allows the organization to communicate in a common language; Promotes transparency of issues and approaches, getting past symptoms to the true root cause; and Encourages team-based problem solving.
Overview
A3 should be implemented when you and your team are trying to solve a business problem. A3 practical problem solving may be the right methodology when:
The root cause of a problem is unknown
There is no known solution
Statistical analysis is not required
The problem may be a quality issue within a process
A defect can be defined
Limited capital is required to solve the issue
Some baseline data is available
When To Use It In the Lifecycle How to Apply It
A3 practical problem solving (PPS) is one of the most important Lean tools.
When completing an A3, be sure to select a team from those who “can, care, and know.”
Although not focused on here, an A3 may also refer to a reporting protocol for projects, strategy deployment, or a method for proposing policy changes.
Key Information
The A3 Workbook: Unlock Your Problem-Solving Mind [Paperback] by Matthews Examples: http://www.coe.montana.edu/ie/faculty/sobek/a3/index.htm Training Document and Template: A3 Practical Problem Solving (available from the Lean PMO)
Additional Resources
A3 Practical Problem Solving (PPS)
1 of 3
Sponsor determines that a problem needs PPS.
Project leader is assigned and does an initial evaluation (e.g. first few sections of the A3 form).
Sponsor and/or project leader select a team that “can, cares, knows.”
Schedule PPS session to determine root cause and potential solutions.
Team gets buy-in to test solutions.
Execute potential solutions and measure impact.
Gain buy-in for full implementation (signatures from stakeholders).
Complete implementation, follow-up and lessons learned sections of the A3.
State of Colorado Lean Model

State of Colorado Lean Program
Illustration and Example
2: Title, Problem Statement, Current State, Brief Background, and Target State Title Begin with an action verb Be as specific as possible Ensure the title is unique Problem Statement Clearly state a key issue to be resolved
Current State and Brief Background Visually depict how things work today Highlight the location of key issues State the background of the issue,
as known
Target State List the desired outcomes and clarify the expected change in key metrics
3: Problem Analysis and Root Cause Statement Cause and Effect Investigation Utilize simple problem analysis tools
(e.g. 5 whys, fishbone diagram, cause and effect network, etc.) to show cause and effect relationships
Root Cause Statement Articulate the root cause of the problem
4: Solution Evaluation Solution Options Proposed solutions
(“countermeasures”) should address the root cause(s)
Proposed solutions should be evaluated against success criteria
Potential solutions should be tested via experiment as practicable
5: Implementation Plan and Results
Implementation Plan Develop a high-level plan of the steps needed to implement the solution For complex problems,
only note milestones Track status with
standard Red (R), Yellow (Y), Green (G) notations
Results (Confirmation) Display the results of the implemented changes
6: Follow-up, Lessons Learned, and Signatures Follow-up and Lessons Learned List what actions should be taken in light of learning. Document the learning from the effort, both as it relates to the process and to the results. Signatures List key stakeholders and document their agreement to testing solutions and to the implementation of the longer-term
1: General Information Owner: The person leading the problem solving activity Sponsor: Typically a senior leader responsible for operations in the target area Start: The day the problem solving effort began Today: Date Team: List the names of team members Area / Location: Be as specific as you can here Division & Department: List Division & Department
A3 Practical Problem Solving Example (11x17 paper)
General Information
Problem Description, Background, and Target State
Problem Analysis and Root Cause Statement
Solution Evaluation
Follow-‐up, Lessons Learned andStakeholder Buy-‐in
Implementation Plan and Results Confirmation
2
3
4
5
6
1
A3 Practical Problem Solving (PPS) (cont’d)
2 of 3

State of Colorado Lean Program
Detailed Information
When completing the A3 process, there are specific questions you and your team should ask yourselves to ensure you are problem solving in a holistic manner. The questions, by each section of an A3, include: 1. General Information (No Applicable Questions) 2. Title, Problem Statement, Current State, Brief Background, and Target State
Does the problem statement clearly identify the negative effect of the issue? Could someone not familiar with the area quickly understand the problem? Is the picture of the current condition and issues clear to the audience? Is the problem quantified with baseline metrics? What should be accomplished? What will be improved and by how much? When is the improvement expected?
3. Problem Analysis and Root Cause Statement Is the analysis comprehensive? Does the analysis probe deeply enough to truly agree with the reasoning? Is this the only root cause? Do the problem analysis and root cause close the loop with the problem statement?
4. Solution Evaluation Are the solutions within control of those on the team? Do the solutions clearly link to the root cause of the problem? Are the right resources available to implement the solution and make it stick? How do the solutions compare in terms of return on investment (pay-back)? Have the leaders and people in the work area initialed the form to signify their support of the potential solutions?
5. Implementation Plan and Results Is clear ownership assigned? Can implementation be phased to show the impact of each recommended solution? Does the plan include communications? Is the implementation schedule reasonable? Is the output graphical and compelling to those in the area and beyond? Has the target state been achieved?
6. Follow-up, Lessons Learned, and Signatures What did you learn through this effort? Have you learned what does or does not improve the situation? What would you do differently next time? Is the stakeholder list encompassing of those impacted? Has agreement to the test plan been achieved?
Search Terms / Related Topics
A3 Solve Problems Practical Problem Solving (PPS)
Root Cause Analysis 5 Whys Cause and Effect Diagram
A3 Practical Problem Solving (PPS) (cont’d)
3 of 3

State of Colorado Lean Program
Cellular flow occurs when processes are collocated and balanced, allowing product to flow continuously and customer demands to be easily met. This is achieved by reducing batch size to be very small or to individual products and by linking manual and automated operations into the most efficient combination of resources to maximize value-added content while minimizing waste. The benefits of cellular flow include reduced lead times, lower costs, improved quality, additional stability and flexibility, minimized physical movement, less work in process, and higher productivity. (Cellular flow may also be referred to as continuous flow, one-piece flow, single-piece flow, and make one-move one.) Cellular flow occurs in a “cell” or processing area for a product or product family. The “U” shaped cell is a popular layout for continuous flow because it minimizes walking distance and enables multiple combinations of work tasks. The number of people who work in a single cell can also be changed based on demand. Having the cell in a “U” shape also places the first and last task close to each other so when a person finishes the process, they can easily begin again. The goal of having a continuous flow through the cell is to remove stoppages, waste, and backflow in the process.
Overview
Cellular flow is a Lean method to solve problems of efficiency and quality. After you and your team have identified waste and issues in the process, implement cellular flow to address these issues. Cells can exist for individual products or services, but are often dedicated to product families to allow increased flexibility and space utilization. A rule of thumb is that products that are 80% similar can be run in the same cell, though not necessarily one after the other if processing times vary greatly.
When To Use It In the Lifecycle
Cellular flow typically requires you to rearrange your workspace and reduce batch sizes.
Once you have mapped your process using a spaghetti diagram and / or a process map, try to arrange the same steps into a cell, bringing together the materials, equipment, and personnel required to complete the work and organizing them in a U-shape in order of the flow.
Run a sample product or service, collecting processing times and observing where incomplete products build up.
Work with employees to balance the tasks between themselves, leveling the work to the customer demand rate.
Develop cell measures and drive continuous improvement.
How to Apply It
Cellular flow is a fulfillment method that occurs when batches are small, processes are balanced, and the product flows continuously.
Benefits include: reduced lead times, lower costs, improved quality, additional stability and flexibility, minimized movement, lower inventory, and higher productivity.
Cellular flow is most successful in a well-designed “cell” that reduces the physical distance between each process step by arranging the steps in a “U” shape
Key Information
Video: Live example of one-piece or cellular flow at http://youtu.be/EWjRGOHnD2U Book: Creating Continuous Flow by Mike Rother and Rick Harris
Additional Resources
Cellular Flow
1 of 2
State of Colorado Lean Model

State of Colorado Lean Program
Example
Search Terms / Related Topics
Solve Problems Cell Pull Production
Work Balancing Continuous Flow One-Piece Flow Single-Piece Flow Make One, Move One
2 of 2
Cellular Flow (cont’d)
File
File
File
Cash Box
In
Out
In
Out
In
Out
In
Out
In
Out
In
Out
Supervisor
File
Evaluate Qualifications
Supervisor Approval
Cash Box
Print License
Mail License to Customer
Sort App by Type
App Complete?
Data Entry
Validate License History
In a typical office layout, each person has an individual workstation with the tools required to complete every step in the application process. This approach results in high levels of unfinished inventory and long lead times. Separating the workers by filing cabinets allows all employees quick access to filing. This optimizes the process for filing, instead of processing the application as a whole. Having the cashbox far away requires each employee to get out of their seat and walk to the cash box for every application, wasting movement and time and encouraging batching. Another result of this work set-up is that work will build up waiting for supervisor approvals. The supervisor is not embedded in the process and likely allows several applications to pile up before giving approval. Again, this creates additional, unfinished inventory and delays.
Typical Office Layout
This cell is organized to support a single, end-to-end process with small workstations dedicated to accomplishing each process step. The work, in this processing license applications, moves around the cell in a smooth flow. Movement is reduced as the work flows to the employees. This layout results in less in-process inventory and a greatly reduced cycle time. The supervisor’s approval task is now part of the process. This layout is also flexible in that it is easy to add or remove employees to the process to meet changing customer demands. Work in process is limited since the person completing applications is also the person metering the flow of work into the cell.
Cellular Office Layout
License Application Processing
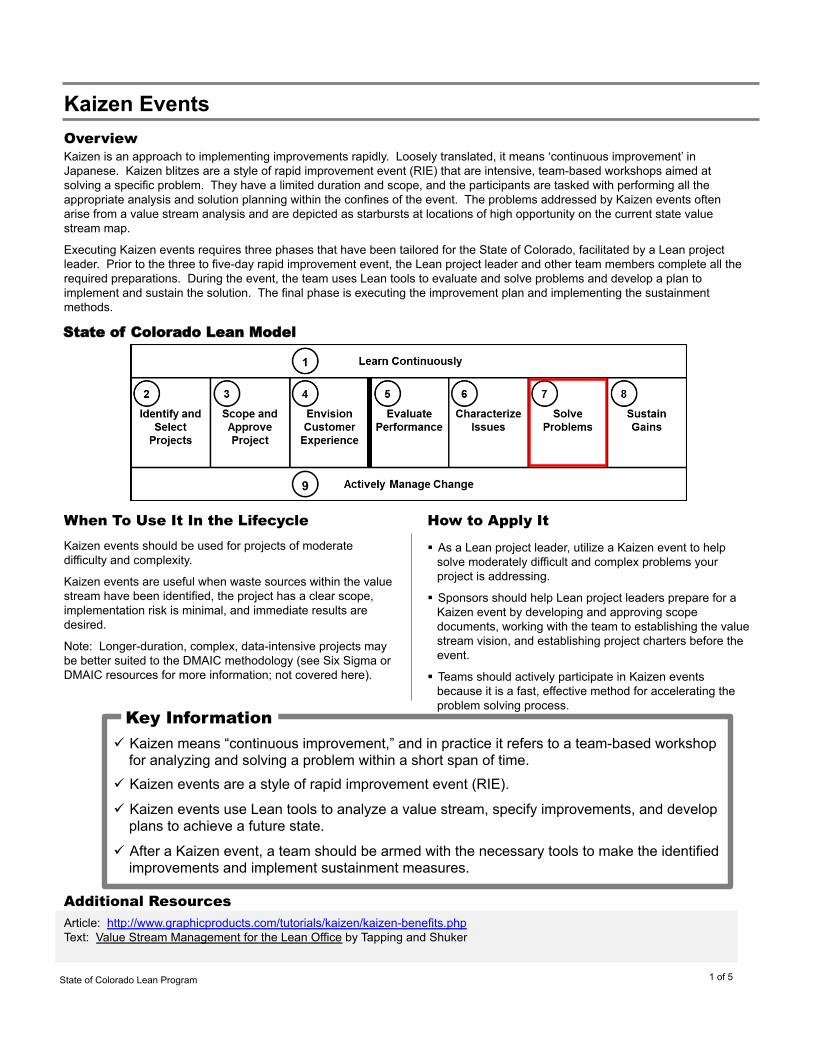
State of Colorado Lean Program
Overview Kaizen is an approach to implementing improvements rapidly. Loosely translated, it means ‘continuous improvement’ in Japanese. Kaizen blitzes are a style of rapid improvement event (RIE) that are intensive, team-based workshops aimed at solving a specific problem. They have a limited duration and scope, and the participants are tasked with performing all the appropriate analysis and solution planning within the confines of the event. The problems addressed by Kaizen events often arise from a value stream analysis and are depicted as starbursts at locations of high opportunity on the current state value stream map.
Executing Kaizen events requires three phases that have been tailored for the State of Colorado, facilitated by a Lean project leader. Prior to the three to five-day rapid improvement event, the Lean project leader and other team members complete all the required preparations. During the event, the team uses Lean tools to evaluate and solve problems and develop a plan to implement and sustain the solution. The final phase is executing the improvement plan and implementing the sustainment methods.
Kaizen events should be used for projects of moderate difficulty and complexity.
Kaizen events are useful when waste sources within the value stream have been identified, the project has a clear scope, implementation risk is minimal, and immediate results are desired.
Note: Longer-duration, complex, data-intensive projects may be better suited to the DMAIC methodology (see Six Sigma or DMAIC resources for more information; not covered here).
When To Use It In the Lifecycle
Kaizen means “continuous improvement,” and in practice it refers to a team-based workshop for analyzing and solving a problem within a short span of time.
Kaizen events are a style of rapid improvement event (RIE).
Kaizen events use Lean tools to analyze a value stream, specify improvements, and develop plans to achieve a future state.
After a Kaizen event, a team should be armed with the necessary tools to make the identified improvements and implement sustainment measures.
Key Information
Article: http://www.graphicproducts.com/tutorials/kaizen/kaizen-benefits.php Text: Value Stream Management for the Lean Office by Tapping and Shuker
Additional Resources
Kaizen Events
As a Lean project leader, utilize a Kaizen event to help solve moderately difficult and complex problems your project is addressing.
Sponsors should help Lean project leaders prepare for a Kaizen event by developing and approving scope documents, working with the team to establishing the value stream vision, and establishing project charters before the event.
Teams should actively participate in Kaizen events because it is a fast, effective method for accelerating the problem solving process.
How to Apply It
1 of 5
State of Colorado Lean Model

State of Colorado Lean Program
The Kaizen process and terminology has been slightly modified for the State of Colorado Lean Program, though the basic concepts are consistent. As you complete your scoping document, align the components to the structure shown here. This structure has been translated into a process shown below to give you a feel for the detailed activities that will occur in each phase.
Illustration
Kaizen Events (cont’d)
Establish Current State Define Future State Make Improvements Develop Sustainment Plan
Kaizen Event (3-5 days)
Execute Improvements and Sustain Gains (3 weeks)
Define the project scope and team(s) Secure resources and define schedule Collect Lean process metrics Conduct visioning Train the team
Complete implementation of changes Execute sustainment actions
Charter Effort and Kick-Off (2-3 weeks)
2.1 2.2 2.3 2.4
Establish Current State and Future State Opportunities
(conduct Lean event)
Execute Improvements
Develop Sustainment Plan
Charter Effort and Kickoff
State of Colorado Lean Program
Kaizen Structure
On the following pages, you will find details explaining the key activities and outcomes for every phase.
2 of 5
Kaizen Phases
1 2 3

State of Colorado Lean Program
Kaizen Events (cont’d)
Review Kaizen event problem statement and targeted outcomes Review high-level process data and information including:
Vision statement SIPOC Baseline process metrics
Identify internal and external customers and document their requirements Go to Gemba (the “work place” in Japanese)
Observe actual process being performed Verify or collect target area data Ask questions to clarify understanding
Develop and finalize current state VSM (See Value Stream Map page) Ensure appropriate process, material and information flows are drawn accurately Complete necessary calculations on the current state map
Kaizen Event: Establish Current State (During event)
2.1
Inputs Project scoping document Process owners and team participants
Output Checklist Current state map (often a VSM or variant)
3 of 5
Develop draft project overview document (see Project Scoping page) Define your Kaizen objective and select a leader Select and confirm participants Representatives should include: people who work directly with the process, people upstream and
downstream from the process, management staff, and other involved parties Train participants on Lean and what to expect as needed Collect basic data and information on the process you are improving; confirm scope with sponsor Gather customer feedback to determine process requirements Develop Kaizen event agenda Complete logistics like reserving a working place near the target area, gathering material, and contacting
IT or other departments from whom you may need support
Charter Effort and Kick-Off (Duration: 2-3 weeks, completed before event)
Inputs Visioning session and customer expectations Initial value stream performance data Problem statement, high level targeted outcomes Project scope
Output Checklist Vision Statement and approved project scope Kaizen objective and deliverables defined Team identified, trained, and available for event Event support lined up
1

State of Colorado Lean Program
Kaizen Events (cont’d)
Review current state map to identify: Process steps where value is being created Steps that are non-value added (NVA) Process constraints Interruption to the flow of products, forms, information and services Waste by type
Record improvement opportunities with star bursts on the current state map Conduct root cause analysis in the event of quality issues Create opportunity ranking list as a team, either recording on flipcharts or using a prioritization matrix
to isolate opportunities that are high-value and relatively easy to implement Validate with data wherever possible; where data is unavailable, use consensus opinion techniques Develop a future state map (often a VSM or variant) that incorporates improvements
Kaizen Event: Define Future State (During event)
2.2
Inputs Current state map (often a VSM or variant)
Output Checklist Value analysis Waste identification Root cause analysis Prioritized improvement opportunities Future state map (often a VSM or variant)
When possible, implement improvements during the event including: Train employees on new standards (standardized work) Run trials and collect samples Perform analysis on collected samples to make sure they meet customer quality and other
requirement and specifications Continue running trials to collect cycle time and other data Review and verify that the collected cycle time and other quality data meet required standards and
specifications Make adjustments as needed to meet required specifications and standards
For those improvements requiring more time, make an improvement plan and prioritize action items Document potential implementation risks and available mitigations Gain leadership buy-in to improvement plans Create a communication plan to broadcast the reasons for the event, benefits of the improvements,
and support required from others in the work area
Kaizen Event: Make Improvements (During event)
2.3
Inputs Value analysis Waste identification Root cause analysis Prioritized improvement opportunities Future state map (often a VSM or variant)
Output Checklist Quick win improvements completed Implementation plan Steering committee consensus Communication plan
4 of 5

State of Colorado Lean Program
Kaizen Events (cont’d)
Determine appropriate Lean daily management tools to measure performance Agree on metrics with program area leadership and staff Develop plan to implement metrics and sustainment activities, including sustainment checklist
Kaizen Event: Develop Sustainment Plan (During event, if possible)
2.4
Inputs Quick win improvements completed Implementation plan
Output Checklist Metrics plan Sustainment checklist
Establish review timeline with steering committee (e.g., meetings each week, each month, etc.) Execute communication plan Complete full-scale implementation of changes Execute action items to sustain gains, including the addition of new daily management techniques Complete project documentation and store information in repository Continue to monitor process results
Execute Improvements & Sustain Gains (Completed 3 weeks to 90 days after event)
3
Inputs Communication plan Implementation plan Metrics plan Sustainment checklist
Output Checklist Improved process with less waste Communications per the plan Project documentation
5 of 5
Search Terms / Related Topics
Solve Problems Continuous Improvement RIE, Rapid Improvement Event
Team Workshop Value Stream Mapping Scoping Document Implementation Plan Lean Daily Management

State of Colorado Lean Program
The Kanban concept refers to a pull fulfillment system that uses the rate of demand to control the rate of fulfillment. For example, in a supermarket using Kanban, when a customer purchases a box of cereal the supermarket alerts the supplier that a restock item is required. Kanban helps this pull fulfillment process by acting as a demand signal that immediately propagates through the supply chain. Kanban can either instruct processes to create products or alert people to move products. The tool of Kanban is Kanban cards, which can be physical or virtual. If physical Kanban cards are used, a particular color may represent the need for more supplies or products. Virtual Kanban cards have been built into system applications as well. Virtual Kanban cards are often automatic e-mails sent to vendors and suppliers when stock levels reach a designated threshold. The simplest form of Kanban is the 2-bin system, where 2 bins of parts or supplies are maintained. When one bin is empty, it triggers a re-order. This is frequently used for items such as small parts, office supplies, and copy paper. Toyota had six rules for successful Kanban: 1) do not send defective products to the subsequent process, 2) the subsequent process comes to withdraw only what is needed, 3) produce only the exact quantity withdrawn by the subsequent process, 4) level the production, 5) Kanban is a means to fine tuning, and 6) stabilize and rationalize the process.
Overview
Kanban is used to improve processes when fulfilling demand for a product or service cannot be accomplished in a continuous flow manner. A Kanban can also be an indicator such as the number of calls, call wait time, customers in line for service, etc. In these situations, determine the acceptable number of customers awaiting service or wait time and when the acceptable limit is exceeded a pull signal is sent to move back office people to customer facing activities to maintain service levels. This is very common in areas such as call centers or licensing operations where demand can fluctuate at certain times requiring “all hands on deck” to provide service.
When To Use It In the Lifecycle
Identify a product or service delivery process, or portion thereof, where the continuous flow model cannot be implemented.
Determine demand rate and variation of the downstream process (work in process) and use this data to calculate the amount of stock required.
Create Kanban cards to use as visual queues to trigger a component of the process.
Train all personnel in the appropriate procedures.
Note: Kanban calculations can be complex. Overestimate the work in process required initially and adjust down as demand patterns are confirmed and confidence is established.
How to Apply It
Kanban is implemented in a pull system where production is triggered by demand.
Kanban supports visual scheduling which helps determine what to produce, when to produce it, and how much to produce.
Kanban cards can be physical or virtual and they either trigger production or the movement of products.
Key Information
Book focused on Kanban: Kanban for the Shop Floor by Productivity Press, 2002 Kanban demonstration: http://youtu.be/ck8Ki9_LzME Article: http://www.leanblog.org/2010/04/how-a-simple-office-kanban-system-works/
Additional Resources
Kanban
1 of 2
State of Colorado Lean Model

State of Colorado Lean Program
Example
Even office supplies like printer cartridges can utilize Kanban. In this example, Kanban cards are placed on top of the printer cartridges. When the printer cartridge is used, the card is given to the supplies manager who orders a new cartridge. Once the new printer cartridge is delivered, it is placed on the shelf along with the Kanban card and the cycle continues.
Kanban Office Supplies
Search
Terms / Related Topics
Solve Problems Sign Pull Production Visual Scheduling Fulfillment Trigger
Color coding Continuous Flow (opposite) Visual Management 5S
Kanban (cont’d)
2 of 2

State of Colorado Lean Program
A product family is a group of products or services that utilize the same or similar process steps and equipment within a value stream. A product family matrix is a list of all products and process steps that allows visual recognition of potential product families. Products or services are listed in each row and the process steps are each given their own column. If a product requires a particular process step, you will mark the appropriate box in the matrix. This allows a quick identification of where processes are, or are not, shared among products or services. Where the majority of processes are common, a product family exists. The recognition of product families may offer the project team the opportunity to organize process cells and teams around similar products. Creating such improvements facilitates flexibility in dealing with volume changes while still organizing the workplace and employees in a way that contributes to success.
Overview
Use a product family matrix after creating a baseline value stream map to identify potential product families to focus on for future state improvements. The matrix will also help you to see intricacies between products or services in a product family. Product families form the basis of for cellular flow and work balancing.
When To Use It In the Lifecycle
Create a table, listing one product or service in each row.
Across the top of the table, list the steps required for each product or service. The process steps should be at a level of detail that helps illuminate differences across products.
Populate the matrix based on which products or services require each process step.
Group the products or services with similar process steps to identify product families.
Consider organizing the workplace and teams of employees around product families (see “Cellular Flow”).
How to Apply It
Product families are groups of products or services that share a majority of process steps within a single value stream.
A product family matrix is the tool that helps identify product families.
Product families are useful because they offer the team an opportunity or organize the workplace and teams in a way that promotes flexibility and productivity.
Key Information
Book: Learning to See: Value Stream Mapping to Add Value and Eliminate Muda by Shook and Rother Template: Find the Product Family Relationship Matrix at http://www.bmgi.org/resources/browse/tools-templates/results/taxonomy%3A13
Additional Resources
Product Family Matrix
1 of 2
State of Colorado Lean Model

State of Colorado Lean Program
Example
Search Terms / Related Topics
Solve Problems Value Stream Value Stream Map
Product Family Grouping Project Scoping
2 of 2
Product Family Matrix (cont’d)
This product family matrix has nine different “products,” in this case license types. Only five, however, share most of their steps. These five products have been shaded and constitute a likely product family. Note that this is not divided along professional lines. The qualifications for an auto dealer are different from a financial planner, but the processing steps they follow are common.
Tasks
License Application Type
Completeness Check
Validate Licensing History in Database File Originals
Evaluate Qualifications
Supervisor Approval Process Cash
Print and Mail License
Financial Planning X X X X X X X Real Estate X X X X X Insurance X X X Nursing X X X X Physicians X X X X X X X Accountants X X X X X X Lawyers X X X Auto Dealers X X X X X X X Mortgage Lenders X X X
Product Family Matrix

State of Colorado Lean Program
Visual management is a Lean strategy that employs the use of visual tools and indicators to engage people in the workplace, coordinate flow, and direct response without requiring meetings. Using visual indicators is helpful because they can:
Communicate performance measures and status; Show whether expected performance is being met; Alert people to abnormal conditions; Implement safety precautions; and Provide immediate feedback to / from team members, supervisors, and managers.
Some visual tools that are frequently used include:
Andon – Shows the status of operations, alerts teams to an abnormality, and signals required actions Takt boards – Displays the output of a process or process step including work being done, target rate, and actual rate Personnel skill and training boards – Tracks team members and progress towards training or desired skill level
Overview
Visual management should be implemented while you and your team are solving problems and searching for ways to sustain gains. Visual management tools should be designed into the workplace and used daily to sustain gains and identify potential problems or defects that could be addressed through another project. Sustaining gains through visual management tools should eventually become embedded across the entire organization and utilized as a critical continuous improvement tool.
When To Use It In the Lifecycle
Evaluate the process you are improving or control and determine the measures of success for that process. Is it rate of completion? Number of defects? Should progress be constantly modeled? Are you focused on safety?
Select a visual tool that would be most helpful to your process and be creative!
After using your visual tools for a while, evaluate whether they are providing the information you need. If not, consider trying different tools.
How to Apply It
Visual management techniques include tools that can display status, highlight defects or problems, and help ensure a safe environment.
A range of tools exist; select the tool that makes the most sense for your process.
Utilize these tools to sustain the gains you have made through improvements and to identify new improvement opportunities.
Key Information
Andon Video with Examples: http://youtu.be/mb4oonN_NTI Book: Visual Systems: Harnessing the Power of a Visual Workplace, by G.D. Galsworth
Additional Resources
Visual Management Techniques
1 of 2
State of Colorado Lean Model

State of Colorado Lean Program
Examples
Search Terms / Related Topics
Sustain Gains Andon Light
Takt Board Process Status Safety
Visual Management Techniques (cont’d)
2 of 2
Andon lights are used in a supermarket to visually manage the flow at checkout. Green indicates that the register is open and customers may proceed. Managers can quickly see the status of all the registers using the lights. The light may even trigger a request for repairs if the red color is displayed, indicating that the register is not functioning properly.
Andon Lights in Supermarket
Photo from rai.com.cy
Agents in call centers with low walls are able to visually signal for support from their supervisor or lead without leaving their desk, allowing them to avoid long customer hold times.
Call Center Layout
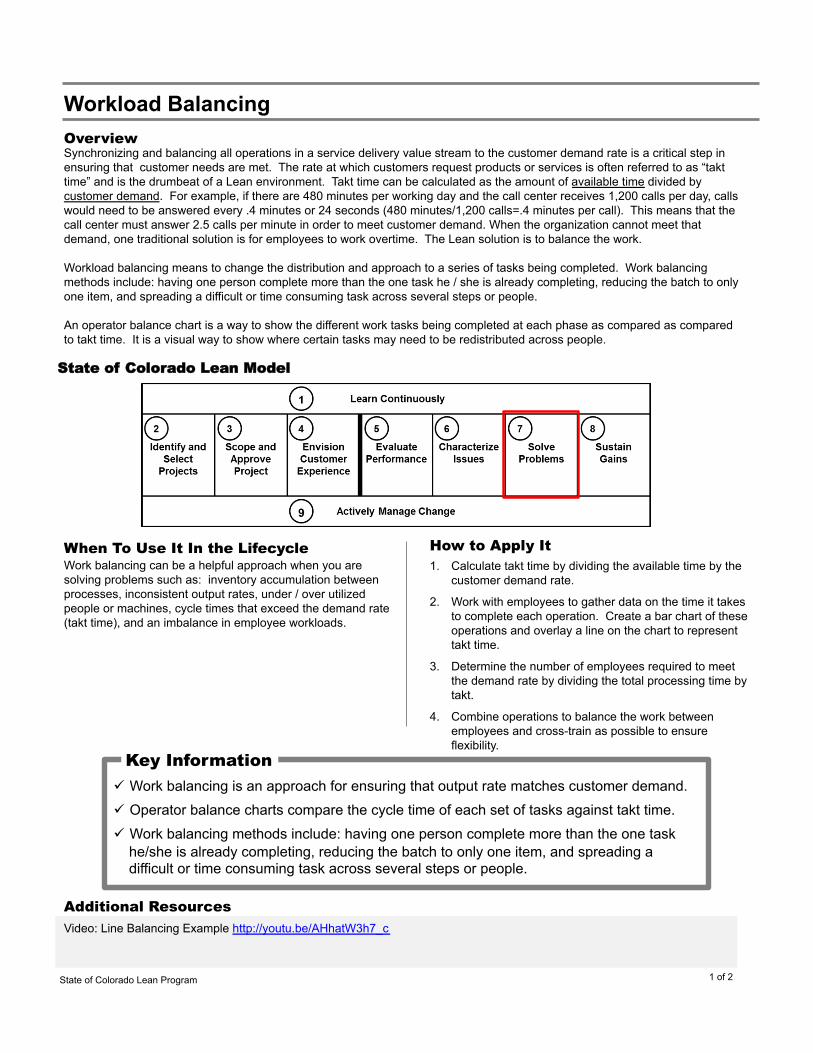
State of Colorado Lean Program
Synchronizing and balancing all operations in a service delivery value stream to the customer demand rate is a critical step in ensuring that customer needs are met. The rate at which customers request products or services is often referred to as “takt time” and is the drumbeat of a Lean environment. Takt time can be calculated as the amount of available time divided by customer demand. For example, if there are 480 minutes per working day and the call center receives 1,200 calls per day, calls would need to be answered every .4 minutes or 24 seconds (480 minutes/1,200 calls=.4 minutes per call). This means that the call center must answer 2.5 calls per minute in order to meet customer demand. When the organization cannot meet that demand, one traditional solution is for employees to work overtime. The Lean solution is to balance the work. Workload balancing means to change the distribution and approach to a series of tasks being completed. Work balancing methods include: having one person complete more than the one task he / she is already completing, reducing the batch to only one item, and spreading a difficult or time consuming task across several steps or people. An operator balance chart is a way to show the different work tasks being completed at each phase as compared as compared to takt time. It is a visual way to show where certain tasks may need to be redistributed across people.
Overview
Work balancing can be a helpful approach when you are solving problems such as: inventory accumulation between processes, inconsistent output rates, under / over utilized people or machines, cycle times that exceed the demand rate (takt time), and an imbalance in employee workloads.
When To Use It In the Lifecycle 1. Calculate takt time by dividing the available time by the
customer demand rate.
2. Work with employees to gather data on the time it takes to complete each operation. Create a bar chart of these operations and overlay a line on the chart to represent takt time.
3. Determine the number of employees required to meet the demand rate by dividing the total processing time by takt.
4. Combine operations to balance the work between employees and cross-train as possible to ensure flexibility.
How to Apply It
Work balancing is an approach for ensuring that output rate matches customer demand.
Operator balance charts compare the cycle time of each set of tasks against takt time.
Work balancing methods include: having one person complete more than the one task he/she is already completing, reducing the batch to only one item, and spreading a difficult or time consuming task across several steps or people.
Key Information
Video: Line Balancing Example http://youtu.be/AHhatW3h7_c
Additional Resources
Workload Balancing
1 of 2
State of Colorado Lean Model

State of Colorado Lean Program
Example
Search Terms / Related Topics
Solve Problems Takt time Cycle time
Product Family Matrix Cellular Flow Operator Balance Chart
2 of 2
Workload Balancing (cont’d)
1. Calculate Takt Time 2. Employees Determine Processing Times
Takt = Available Time
Customer Demand
Employees = Total Processing Time Required Takt
Takt = 24,000 Seconds
400 Applications
Takt = 60 Seconds
3. Determine Number of Employees Required
Employees = 310 Seconds per App. Required 60 seconds
Employees = 5.2 Employees to Required Process Demand
Customers demand 2,000 new applications per week, or 400 per work day. Each day has roughly 400 productive minutes or 24,000 seconds. Dividing these numbers shows we must process one application every 60 seconds. This is takt.
Based on a total of 310 seconds of processing work for each application, and a takt time of 60 seconds, 5.2 employees are needed to operate this process in balance with demand. Note: You will need additional employees to cover vacations, etc, but these people should be put to work on other valuable tasks.
Work with employees to observe the actual work performed and determine a processing time that each application requires. If there is variability, choose a time that can be met 85% of the time.
4. Combine Tasks to Balance the Work
Combine tasks in such a way that each person has work equal to the takt time, and therefore equal to each other. This is not only fair, it ensures that applications will not pile up at any one station. Avoiding these queues improves quality and decreases flow time for each application. This is a recipe for delighting customers! Note: Cross-train employees to the degree possible so that employees can flex between roles. This keeps people fresh and offers flexibility to your operations.
Sort App Types
20
40
60
Sec.
App Complete?
Data Entry
Validate License History
File Original
Evaluate Quals
Supervisor Approval
Process Cash
Print License
Mail to Customer
20
40
60
80
Operator 1 Sort App. Types App Complete? Mail to Customer
Operator 2 Data Entry
Operator 3 Validate License
History File Original
Operator 4 Evaluate Quals Supervisor Approval
Operator 5 Process Cash Print License
License Application Processing

State of Colorado Lean Program
8 - Sustain Gains
State of Colorado Lean Model

State of Colorado Lean Program
The gains that Lean teams make through their project must be maintained and form the foundation for future improvement. The sustainment checklist is a tool that defines specific criteria to gauge sustainment of improvements and movement toward the targeted outcomes and the vision.
Checklist criteria are rated against a simple three-tier scale. For example, ratings could include: 1 - No Evidence Change is Used, 2 - Change is Used Inconsistently, and 3 - Change is Always Used. The checklist often has space for specific notes on when and where lack of compliance is occurring. Of particular value are the noted exceptions and follow up areas that are failing to achieve the desired level of compliance. And, by demonstrating that sustainment is being measured, leadership is able to send a strong message about the importance of achieving and maintaining new methods and behaviors.
Used consistently at 30-day intervals, this checklist is a useful tool in ensuring that projects are meeting their targeted outcomes and that the operation is moving toward the established vision.
Overview
When To Use It In the Lifecycle
Complete the first draft of the sustainment checklist within the first 30 and 60 days of approving the implementation plans.
Consider selecting a mix of sustainment criteria that are observable and specific measures of success for that process (are the new forms being used? is the number of defects decreasing?).
Ensure that there are simple means to consistently capture these measures or observations.
After using your visual tools or reporting for a while, evaluate whether the criteria are providing the information you need. If not, consider trying different measures or criteria to better define how you can continually improve the operation.
How to Apply It
The sustainment checklist contains a short-list of criteria that measure whether the gains of Lean projects are being sustained.
Utilizing this checklist reinforces the importance of sustainment and helps instill a deeper Lean culture of continuous improvement.
Key Information
Article: http://www.systems2win.com/solutions/PreventiveMaintenance.htm Article: http://www.vitalentusa.com/learn/sustain_lessons_learned.php#direction
Additional Resources
Sustainment Checklist
1 of 2
Sustainment checklists are created and deployed in the “sustain gains” portion of the project. The purpose of the checklist is to sustain the improvements that have been completed via Lean projects and cultivate a stronger Lean culture. Typically, the checklist is created about 4 weeks after the rapid improvement event (to allow for operationalizing improvements) and completed by a neutral third party approximately every 30 days. These measures also serve as the baseline for the next cycle of improvement, since they effectively evaluate performance. Employees in the area are encouraged to characterize issues when performance targets are not met.
State of Colorado Lean Model

State of Colorado Lean Program
Example
Search Terms / Related Topics
Sustainment Checklist Integrated Communications Plan
Allies Sustain Gains Process Status Stakeholders Partners
Sustainment Checklist (cont’d)
2 of 2
1. Define when the checklist should be completed (e.g. +30 days and +60 days).
2. Determine which resource will actually complete the review with a simple three-tier scale, for example:
• 1 - No Evidence
• 2 - Used Inconsistently
• 3 - Always Used
3. Include specific notes on when and where lack of compliance is occurring. In particular, note exceptions and follow up areas that are failing to make the “Always Used” level of compliance.
4. Share the results with the team, to reinforce that measurements are still being made and improvements are implemented.
One key tool to sustain change is an actively managed Sustainment Checklist. Actively “Rating” whether the new process is being used helps ensure Lean solutions are fully accepted and institutionalized.
Access Permits Sustainment Checklist
Item Number
Description Rating 1: No evidence 2: Inconsistently 3: Always used
Notes
1 Access management website is functioning, contains customer information, and provides accurate status
2 Pre-app, pre-design, and NTP checklists are in use and used correctly
3 Quarterly access meetings are on the calendar and Access Managers attend in person
4 Measurement scorecard is updated and actions are prescribed based on trends
5 Customer feedback surveys are distributed and customer feedback is compiled and acted upon
6 Outreach to key local agencies and developers is conducted in each region
7 Regular meetings with supporting teams are held to evaluate performance and prescribe actions
Project Name: ___________________
Project Sponsor: _________________
Checklist Completed By: ________________
Date Completed: ______________________
Process Notes
Sustainment Checklist at +60 Days Post Rapid Improvement Event

State of Colorado Lean Program
Once your organization has completed a Lean project, it is imperative that the improved results are sustained and that this new standard becomes the baseline for future improvements. One powerful way to sustain the gains is through Lean daily management. Lean daily management is a standardized, disciplined process for managing, controlling, and improving key measures each day. Measurements are crucial to monitor and sustain quality, and Lean daily management is a helpful tool in driving the right behaviors and countermeasures to advance a culture of continuous improvement. A powerful element of Lean daily management is the way in which the process encourages employee engagement through two-way communication. This helps drive accountability and sustainability of process improvements. Think of Lean daily management as a tool that enables you to cascade department or division goals and objectives to all levels of your organization. Lean daily management measures are typically expressed in categories summarized by the acronym QDIP (pronounced queue-dip), where Q is quality, D is delivery, I is inventory, and P is productivity. One to two measures per category can be selected per work area to give employees visible targets that they can affect and witness the impact of their improvement efforts.
Overview
The purposes of Lean daily management are to sustain the gain made via Lean projects and to cultivate a stronger Lean culture. As such, the measures and practices should be implemented after Lean improvements have been operationalized through projects. These measures also serve as the baseline for the next cycle of improvement, since they effectively evaluate performance and the employees in the area are encouraged to characterize issues when performance targets are not met.
When To Use It In the Lifecycle Identify pertinent key measures (e.g., QDIP) for each area,
ensuring both alignment to strategic measures and relevance to the area where the work is performed.
Make measures visible to the entire team via a performance board. Measure actual performance to stated goals daily.
Hold your team accountable by facilitating regular performance meetings at the work unit level.
Solicit involvement and feedback from team members at all levels, discussing the barriers to meeting goals.
Stay close to the process by viewing it yourself, looking for areas that signal an opportunity for improvement.
How to Apply It
Lean daily management is a method for sustaining improvements that have been made.
Lean daily management should cultivate a deeper Lean culture of continuous improvement and accountability through all levels of the organization.
Measures and visual performance boards that capture quality, delivery, inventory, and productivity (QDIP) are key to successful Lean daily management.
Key Information
Book: Creating a Lean Culture: Tools to Sustain Lean Conversions (Paperback) by Mann Article: http://www.sae.org/manufacturing/lean/column/leanmay02.htm Article: http://www.reliableplant.com/Read/21305/lean-metrics-red-is-good,-green-is-worthless
Additional Resources
Lean Daily Management
1 of 2
State of Colorado Lean Model

State of Colorado Lean Program
Example
Search Terms / Related Topics
Sustain Gains QDIP Key Performance Indicators (KPI)
Process Management Status Reporting Measurement
Lean Daily Management (cont’d)
2 of 2
In this diagram, performance to monthly measures are shown with color coded triangles indicating whether the program area is achieving its goals with regards to production, quality, inventory, and shipping (delivery). Though ordered differently, this is the QDIP concept in action. The boards are placed in the workplace and teams update each day whether or not they have met the customer needs that the targets represent. The bottom of each section of the board has the daily, week-to-date, and month-to-date targets and the actual achievements by the team. What is not shown, but critical to success, is the improvement action log that is maintained by the employees in the program area to highlight the actions they are taking to drive improvements in performance.
Sample QDIP Measurements for Services Value Streams
Quality • Percent returned
applications • First-pass yield greater
than X% • Less than X defects per
day
Delivery • Percent on-time to
customer commitment • Number of customers
served per day
Inventory • Work in process less than
X contracts/applications • Grant value in process
less than $X
Productivity • Less than X minutes of
downtime • Number of overtime
hours required • Labor hours per contract
processed
Performance Board

State of Colorado Lean Program
Mistake proofing, also known as poke-yoke in Japanese, means to make it easy to do something correctly and impossible to do something incorrectly. In Lean, the goal of mistake proofing is to design processes so that mistakes are prevented, or at a minimum, detected immediately after they occur.
Mistake proofing should be implemented in a process when rework or process delays downstream are impacting process efficiency. There are two methods of mistake proofing that can be implemented: the prevention approach or the warning approach. The prevention approach requires changes to the process that will prevent any error from occurring. In contrast, the warning approach includes signals, such as lights or sounds, that bring attention to an error and stop the product from moving to the next process step. Ideally, your organization should strive for a prevention approach, since it avoids rework all together and supports the Lean goal of continuous flow in your process.
Overview
Implement mistake proofing as part of your approach for solving problems or as a component of your efforts to sustain Lean gains. Since the goal of mistake proofing is to stop errors, you will only be able to implement this practice once you have identified defects and found their root cause.
When To Use It In the Lifecycle
For each improvement, determine the means by which something could be done incorrectly. This may be done by testing or by gathering actual failure data.
Work with a team to develop options for how to control the issue, either through design (prevention approach) or through alert of issue (warning approach).
Implement mistake proofing steps, observe future failures, and gather data for on-going improvement.
Note: Analyze options thoroughly, but do not wait for a perfect solution. Instead, get available controls in place as soon as possible and work over time to refine.
How to Apply It
Mistake proofing, or poke-yoke, means to design processes and procedures so that mistakes are prevented, or at a minimum, detected almost immediately after they occur.
Mistake proofing can occur as part of process improvements or sustaining gains.
A prevention approach is preferred and implements controls before errors transpire.
Key Information
Article: http://asq.org/learn-about-quality/process-analysis-tools/overview/mistake-proofing.html
Additional Resources
Mistake Proofing
1 of 2
State of Colorado Lean Model
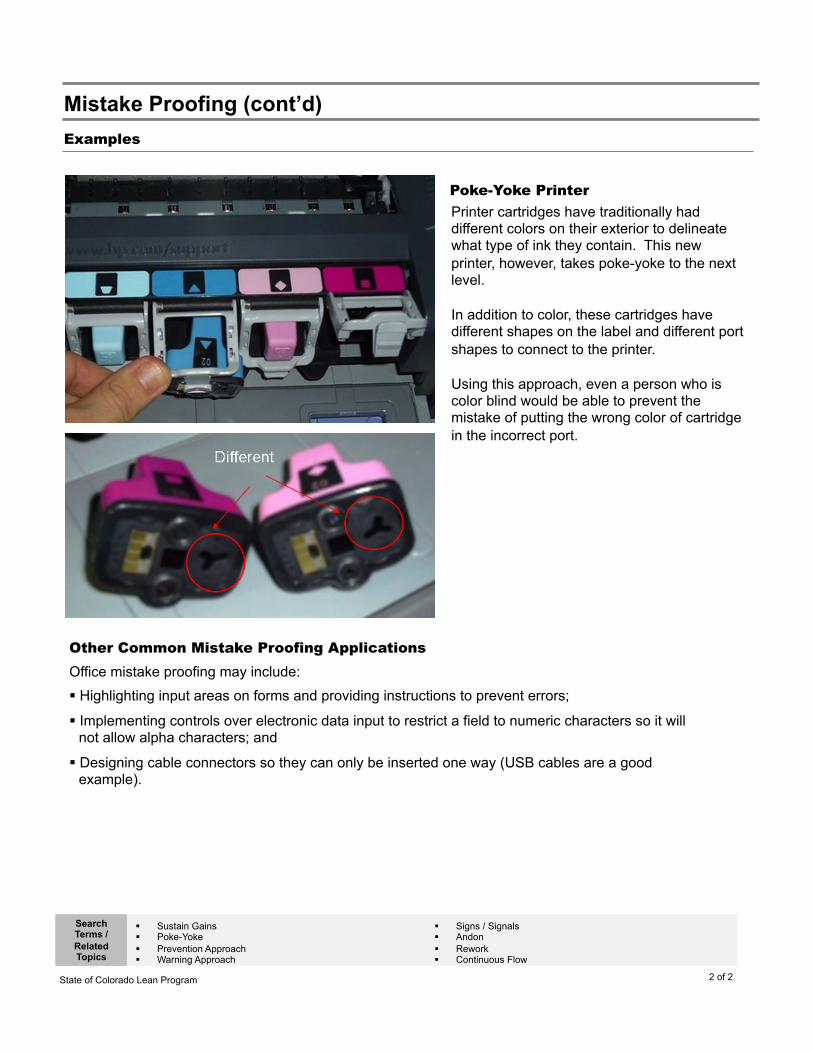
State of Colorado Lean Program
Examples
Search Terms / Related Topics
Sustain Gains Poke-Yoke Prevention Approach Warning Approach
Signs / Signals Andon Rework Continuous Flow
Mistake Proofing (cont’d)
2 of 2
Printer cartridges have traditionally had different colors on their exterior to delineate what type of ink they contain. This new printer, however, takes poke-yoke to the next level. In addition to color, these cartridges have different shapes on the label and different port shapes to connect to the printer. Using this approach, even a person who is color blind would be able to prevent the mistake of putting the wrong color of cartridge in the incorrect port.
Poke-Yoke Printer
Other Common Mistake Proofing Applications
Office mistake proofing may include:
Highlighting input areas on forms and providing instructions to prevent errors;
Implementing controls over electronic data input to restrict a field to numeric characters so it will not allow alpha characters; and
Designing cable connectors so they can only be inserted one way (USB cables are a good example).

State of Colorado Lean Program
Visual management is a Lean strategy that employs the use of visual tools and indicators to engage people in the workplace, coordinate flow, and direct response without requiring meetings. Using visual indicators is helpful because they can:
Communicate performance measures and status; Show whether expected performance is being met; Alert people to abnormal conditions; Implement safety precautions; and Provide immediate feedback to / from team members, supervisors, and managers.
Some visual tools that are frequently used include:
Andon – Shows the status of operations, alerts teams to an abnormality, and signals required actions Takt boards – Displays the output of a process or process step including work being done, target rate, and actual rate Personnel skill and training boards – Tracks team members and progress towards training or desired skill level
Overview
Visual management should be implemented while you and your team are solving problems and searching for ways to sustain gains. Visual management tools should be designed into the workplace and used daily to sustain gains and identify potential problems or defects that could be addressed through another project. Sustaining gains through visual management tools should eventually become embedded across the entire organization and utilized as a critical continuous improvement tool.
When To Use It In the Lifecycle
Evaluate the process you are improving or control and determine the measures of success for that process. Is it rate of completion? Number of defects? Should progress be constantly modeled? Are you focused on safety?
Select a visual tool that would be most helpful to your process and be creative!
After using your visual tools for a while, evaluate whether they are providing the information you need. If not, consider trying different tools.
How to Apply It
Visual management techniques include tools that can display status, highlight defects or problems, and help ensure a safe environment.
A range of tools exist; select the tool that makes the most sense for your process.
Utilize these tools to sustain the gains you have made through improvements and to identify new improvement opportunities.
Key Information
Andon Video with Examples: http://youtu.be/mb4oonN_NTI Book: Visual Systems: Harnessing the Power of a Visual Workplace, by G.D. Galsworth
Additional Resources
Visual Management Techniques
1 of 2
State of Colorado Lean Model

State of Colorado Lean Program
Examples
Search Terms / Related Topics
Sustain Gains Andon Light
Takt Board Process Status Safety
Visual Management Techniques (cont’d)
2 of 2
Andon lights are used in a supermarket to visually manage the flow at checkout. Green indicates that the register is open and customers may proceed. Managers can quickly see the status of all the registers using the lights. The light may even trigger a request for repairs if the red color is displayed, indicating that the register is not functioning properly.
Andon Lights in Supermarket
Photo from rai.com.cy
Agents in call centers with low walls are able to visually signal for support from their supervisor or lead without leaving their desk, allowing them to avoid long customer hold times.
Call Center Layout

State of Colorado Lean Program
9 - Actively Manage Change
State of Colorado Lean Model

State of Colorado Lean Program
One significant but avoidable obstacle to the success of major change projects is failure to create a shared need for the change. Without an understanding of the importance of the change, the “why,” all other details of the change may seem irrelevant.
Clearly defining the drivers, benefits and consequences of not changing will often be enough to fully align the teams and provide the incentive and rationale to act. However, failure to make a sound case for change causes changes to fail. If staff, middle managers, or even customers, don’t see the importance of change, they simply won’t give it the commitment needed for success.
This can be thought of as defining a ‘Burning Platform’ - why does the organization need to leave the platform it has? What will it be like when the organization has changed? Clarifying the need will instill confidence that the organization is serious about the pending changes, which will help stakeholders passionately engage their own teams to fully achieve vision.
Overview
When To Use It In the Lifecycle
Identify and develop the tangible benefits to customers, partners, and the organization that are expected from the project and articulated in the vision.
Map these benefits to stakeholders that need to make a change and those that might ally with you in bringing it about.
Develop and execute the implementation plan together, so they have a stake in the investment and (hopefully), the outcome.
Consider framing the change in terms of customer value and financial opportunity.
How to Apply It
Creating a shared need, “the why”, is necessary before discussing the details of the change or how it will occur.
Understand and constantly communicate the key drivers and benefits of changing, as well as the consequences for not changing.
Making the case for change is an continuous effort throughout the Lean transition.
Key Information
Article: http://www.rickmaurer.com/wp/making-a-case-for-change Article: http://www.evancarmichael.com/Leadership/5162/LEADING-CHANGE--10-steps-to-success.html Case Study: http://www.northhighland.com/results/whitepapers/pdfs/BankingIndustryLeveragesLean.pdf
Additional Resources
Making the Case for Change
1 of 2
It is important to continuously make the case for change throughout the Lean lifecycle, especially since you may encounter new stakeholders as you progress from selecting a project to sustaining new everyday behaviors.
You can begin developing the case for change when you are envisioning the customer experience and evaluating performance.
As you progress through problem identification, solving and sustainment, maintain and update the case, recognizing the impact of your stakeholder management actions and adding newly-impacted stakeholders to the analysis.
State of Colorado Lean Model

State of Colorado Lean Program
Example
Search Terms / Related Topics
Actively Manage Change Secure Buy-In Benefits
Stakeholders Partners Allies Resistors Opposition
Making the Case for Change (cont’d)
2 of 2
One key tool to accelerate change is an actively managed case for change. Actively supporting the business value of the project helps ensure solutions are sustainable and accepted. Here are examples of (4) different approaches to reach the same goal - an audience open to the change and the value it brings.
Approach Details
Actively communicate, Why, then What and How
Knowing why a change is important must precede the “what’ and “how” that are all needed to make a project succeed. Establish the “why” in terms of tangible outcomes and benefits like:
Faster service Less frustration Standardized options for previously ad hoc processes Improved ability to lower wasted time or effort
Link this change to the vision. Link the changes to the organization, the root causes, and the improvements to be made. Those challenging facts will generate the support and resources needed to resolve them.
Open Book Management
Provide access to critical business information to buttress the case for change and engage in frank dialogue on these questions:
What are the challenges facing your department? What are the opportunities? What are budgetary or resource considerations? What do members or customers say? What other measures do you use to make strategic decisions?
Provide necessary training to help people interpret key business data.
Drivers, Benefits and Consequences
(DBC)
Drivers for change – How is this a key contributor to the established vision? (e.g. creating a sustainable cost and delivery structure through user-friendly technologies)
Benefits of change – How will customer experience be more convenient, affordable, positive, etc.?
Consequences of not changing - We will continue to feel disorganized and chaotic and our customers will continue to be frustrated.
Management by Wandering Around
(MBWA)
In their book, The Leadership Challenge, Peters and Waterman detail the value of leaders available for people to pull them aside. “Hey Nancy! Have you heard about our new Lean project that is going to solve some big customer headaches?”
Do not walk the halls with a pre-set agenda but rather share the why, then the what and how, and then listen to understand impacts these changes may create.
This organic feedback and supporting detail prepares the organization.
A Case for Change

State of Colorado Lean Program
A communication plan is used to communicate effectively with project stakeholders and other involved parties. A strong plan will be detailed and actionable, segmented by audience, and linked to your project plan. Successful communications focus on the case for change by providing the reason for the Lean transformation or the specific project. The case for change should energize employees in their ongoing improvement efforts.
For most effective communication, tailor messages to each audience’s needs. When developing your plan, focus on developing key messages (about five or so themes) that are most important for your audience to hear, internalize, and act on. At first, it is especially important that these messages are focused on the “why” rather than the “how”. Once you have identified those key messages, repeat the content over and over again to gain buy-in and adoption.
Some other best practices include:
People prefer to hear vision messages from organization leaders and details from their direct managers People learn differently, so mix delivery modes and styles Relentless repetition is critical to retention Communicate in the context of other changes that are affecting the audiences Utilize existing communication forums where possible to avoid unnecessary disruptions
Overview
Like managing stakeholders, it is important that communications occur throughout the Lean project lifecycle. Ensure that initial communications are focused on the reasons for change. As the project progresses, provide additional detail on the “how”, but ensure that communications are consistent with previous messaging and begin by restating the compelling reasons for the change. Being thoughtful about your communications will not only have a positive impact on stakeholders, but will also have an impact on the team responsible for operationalizing Lean.
When To Use It In the Lifecycle Complete your stakeholder analysis prior to developing a
communication plan.
Identify all audiences you need to reach.
Develop a series of messaging themes that can be tailored to the listener, focusing on the reason for change before the specific actions, especially at the beginning of the project.
Be thorough and develop a detailed plan.
Execute the plan and gauge feedback.
Set a timeline for on-going messaging during the project.
How to Apply It
Develop a communication plan after completing a stakeholder analysis.
A strong plan will be detailed and actionable, segmented by audience, and linked to your project plan.
Repetition and targeted messaging are two important best practices.
Key Information
Article: http://www.voicenet.asia/lunch-box/lunchbox-communication-in-a-lean-enterprise-by-sensei Article: http://www.change-management.com/tutorial-communications.htm
Additional Resources
Communication Plan
1 of 2
State of Colorado Lean Model

State of Colorado Lean Program
Example
Search Terms / Related Topics
Actively Manage Change Buy-In Stakeholder Analysis
Audience and Objective
Message Contents Method Owner Timing
Core team and supervisors – Prepare them to participate
• What is Lean and why do we care (theme) • Project objectives and timeline • My role in the effort and impact on me • What we will do • Next steps
Kickoff meeting (30 – 60 minutes)
Project Sponsor
Feb 17
All DORA employees — Awareness
• What is being done with first Lean event • Why is it important • Update on progress in March
Dora.net
Executive Director
Feb 17
Call center staff impacted by the analysis (3 groups) – Prepare them to contribute
• What is Lean and why do we care (theme) • Importance of call center personnel • Project objectives and timeline • My role in the effort and impact on me • What we will do • Next steps
Stand up meetings (20 minutes)
DORA Supervisors
Week of Feb 20
Division directors – Awareness
• Introduction • Scope overview • Permission to flow down to their staffs
Staff meeting Project Sponsor and Leadership
~ Feb 23
Other call centers – Awareness
• What is Lean and why do we care (theme) • Overview of effort • Contact names and when they can expect
to hear next
Three-page flow down or talking points for supervisors
Supervisors Week of Feb 27
Communication Plan (cont’d)
2 of 2
Example Initial Communications Plan from DORA Call Center Project
Our goal is to deliver world-class service to our DORA customers This is our first Lean effort and sets the stage for continued improvement in how we serve our customers ‒ Will grow to be department-wide ‒ Will engage the people who do the work in identifying and addressing opportunities
Call center people are important ‒ They are the face of DORA to our customers ‒ Critical to our customers’ success ‒ Equip our front line to deliver great service
We are operating in a tough environment: increasing call volume, increasing customer demands, increasing variation ‒ Give our front line the tools to do the job right ‒ Will not result in job loss
Internal and external best practices will be used to drive improvement
Messaging Themes from the Dept of Regulatory Agencies Call Center Project

State of Colorado Lean Program
Resistance to change is natural and is often cited as the single reason that improvement efforts are unsuccessful. Actions to surface and address resistance are a critical component of any change management effort. Because of normal resistance to change, early investments in change management are particularly effective during Lean projects. Piecemeal changes without broad commitment to active, real-time support by sponsors, managers, and the front-line are likely to result in limited benefits.
Resistance management activities occur in three phases1:
Pre-Change – Expect resistance. Produce a Resistance Management Plan to outline strategic next steps.
During Change – Manage resistance. Maintain a Resistance Log to track and monitor progress.
Post-Change – Sustain Adoption. Share adoption results and recommendations to cement new behaviors.
Overview
Resistance management techniques are applied by phase as follows:
During Pre-Change, integrate the Resistance Management Plan activities with the project plan and define transition timeframe and adoption metrics.
In the During Change phase, frequently solicit feedback, identify root cause concerns, coach managers to reconcile individual barriers, reinforce / reward desired behaviors, celebrate interim success, and monitor results and adjust tactics.
During Post-Change, report adoption results and advocate for sustainment recommendations.
How to Apply It
Effective resistance management is a critical element in realizing the benefits of Lean changes.
Expect resistance and do not be surprised by it. Instead, plan for it.
Actively diagnosing and resolving the root cause of resistance is the basis of any effective resistance management effort.
Key Information
Information on ProSci®: http://www.prosci.com/bpr_ph1.htm Roger’s Innovation Curve: http://www.valuebasedmanagement.net/methods_rogers_innovation_adoption_curve.html
Additional Resources
Managing Resistance
1 of 2
When To Use It In the Lifecycle
It is important to manage resistance throughout the Lean lifecycle since it can often determine the success or failure of the project. Resistance management is part of Actively Manage Change and the phases align with the Lean model in this way:
The Pre-Change phase most closely aligns with: identify and select projects, scope and approve projects, and envision customer experience.
The During Change phase most closely aligns with: evaluate performance, characterize issues, and solve problems.
The Post-Change phase most closely aligns with: sustain gains.
State of Colorado Lean Model
1: Adapted from ProSci®

State of Colorado Lean Program
Implementation Phases and Sample Resistance Management Plan
Search Terms / Related Topics
Resistance Secure Buy-In Root Cause
Stakeholders Corrective Action Adoption Feedback Pre-Change, During Change, Post-Change
Managing Resistance (cont’d)
2 of 2
A key tool to track and respond to resistance is a Resistance Management plan, which defines key activities, owners, timeframe and status pre-, during and post-change.
Sample Resistance Management Plan
Resistant Management phases overlay the Lean model as shown below, underscoring the need to actively manage resistance throughout the project’s implementation.
Three Resistance Management Phases
Phase Resistance Management Activities Target Owner Timing
Pre-Change • Review Stakeholder Analysis and Plan • Complete Q&A with 20 stakeholders • Outline structure for Quarterly online survey and results readout • Plan Quarterly Town Hall Meetings • Confirm Sponsor involvement and draft Action Plan • Collaborate with Sponsor and project team on change transition timeline
assumptions
During Change
• Solicit Feedback via 1:1 discussions, Management by Walking Around (MWA), and Q&A Conference Call about the Change
• Track root causes on Resistance Log
• Activate Rewards and Recognition program • Coaching – Communicate/reinforce why the change is happening
Communicate the “what’s in it for me” (WIIFM) by stakeholder group
• Regularly review resistance status of individuals and actions to reconcile • Review systematic root causes and evaluate options to refine the change
with project team and Sponsor
Post- Change
• Present final Adoption results for change transition timeframe • Share long term recommendations - i.e. continued reinforcement, cultural
shift needed, more training, more communication, manager coaching, 1:1 meetings, process changes, sponsor alliances, etc.
• Continue monitoring lagging adopters
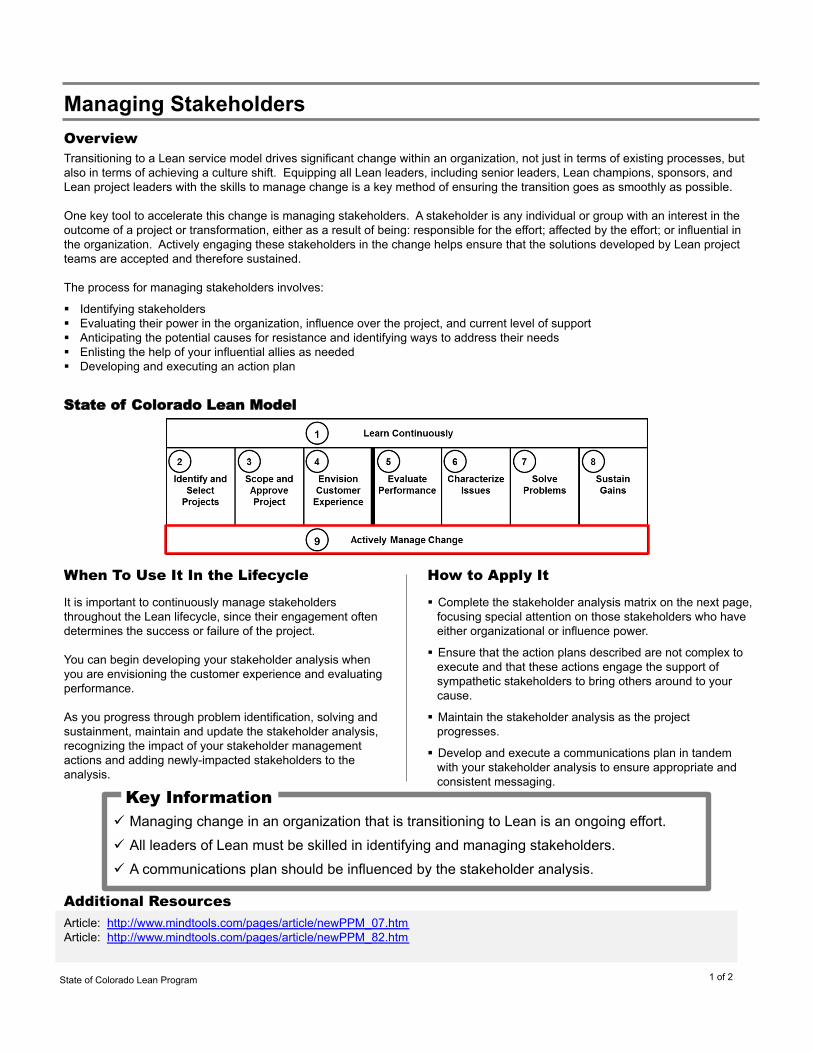
State of Colorado Lean Program
Transitioning to a Lean service model drives significant change within an organization, not just in terms of existing processes, but also in terms of achieving a culture shift. Equipping all Lean leaders, including senior leaders, Lean champions, sponsors, and Lean project leaders with the skills to manage change is a key method of ensuring the transition goes as smoothly as possible. One key tool to accelerate this change is managing stakeholders. A stakeholder is any individual or group with an interest in the outcome of a project or transformation, either as a result of being: responsible for the effort; affected by the effort; or influential in the organization. Actively engaging these stakeholders in the change helps ensure that the solutions developed by Lean project teams are accepted and therefore sustained. The process for managing stakeholders involves:
Identifying stakeholders Evaluating their power in the organization, influence over the project, and current level of support Anticipating the potential causes for resistance and identifying ways to address their needs Enlisting the help of your influential allies as needed Developing and executing an action plan
Overview
It is important to continuously manage stakeholders throughout the Lean lifecycle, since their engagement often determines the success or failure of the project. You can begin developing your stakeholder analysis when you are envisioning the customer experience and evaluating performance. As you progress through problem identification, solving and sustainment, maintain and update the stakeholder analysis, recognizing the impact of your stakeholder management actions and adding newly-impacted stakeholders to the analysis.
When To Use It In the Lifecycle
Complete the stakeholder analysis matrix on the next page, focusing special attention on those stakeholders who have either organizational or influence power.
Ensure that the action plans described are not complex to execute and that these actions engage the support of sympathetic stakeholders to bring others around to your cause.
Maintain the stakeholder analysis as the project progresses.
Develop and execute a communications plan in tandem with your stakeholder analysis to ensure appropriate and consistent messaging.
How to Apply It
Managing change in an organization that is transitioning to Lean is an ongoing effort.
All leaders of Lean must be skilled in identifying and managing stakeholders.
A communications plan should be influenced by the stakeholder analysis.
Key Information
Article: http://www.mindtools.com/pages/article/newPPM_07.htm Article: http://www.mindtools.com/pages/article/newPPM_82.htm
Additional Resources
Managing Stakeholders
1 of 2
State of Colorado Lean Model

State of Colorado Lean Program
Example
Search Terms / Related Topics
Actively Manage Change Buy-In Communications Plan
Stakeholders Partners Allies
Stakeholder
Influence on Lean
Acceptance
Power in the Organization
How will this group potentially react? Commitment Level Approach to
Move to Desired Commitment Barriers? Enablers? Current Desired
1= Low 2= Moderate
3= High
1= Low 2= Moderate
3= High
1= Strongly Opposed
2= Opposed 3= Neutral
4= Supports
5= Strongly Supports
Managing Stakeholders (cont’d)
2 of 2
Stakeholder Analysis and Plan Template
Note: Intentionally left blank. Stakeholder Analysis can be very sensitive and is not for distribution beyond the Lean project leader and sponsor.
How to Prepare a Stakeholder Analysis 1. Identify Stakeholders. 2. Understand their influence over the project and power in the organization and enter codes described above. 3. Determine their current level of support, using the codes above. 4. Determine the desired level of support. This is the level you need for a successful project. Pay special attention to those
who have high power and/or influence. 5. Identify the approach to move them to the desired level of support, including:
• Recognize the nature of their resistance. • Determine What’s In It for Them (WIIFMs) • Enlist the help of influential allies
6. Develop an action plan. 7. Monitor changes as the project develops.