STATE OF CALIFORNIA DEPARTMENT OF TRANSPORTATION TECHNICAL...
61
STATE OF CALIFORNIA DEPARTMENT OF TRANSPORTATION TECHNICAL REPORT DOCUMENTATION PAGE TR0003 (REV. 10/98) 1. REPORT NUMBER CA03-0523 2. GOVERNMENT ASSOCIATION NUMBER 3. RECIPIENT’S CATALOG NUMBER 5. REPORT DATE November 13, 2003 4. TITLE AND SUBTITLE State Route 60 Automated Truck Facility 6. PERFORMING ORGANIZATION CODE 7. AUTHOR(S) Sarakki Associates Inc. 8. PERFORMING ORGANIZATION REPORT NO. 10. WORK UNIT NUMBER 193 9. PERFORMING ORGANIZATION NAME AND ADDRESS Sarakki Associates Inc. 2152 Dupont Drive, Suite 218 Irvine, CA 92612 11. CONTRACT OR GRANT NUMBER 65A0159 13. TYPE OF REPORT AND PERIOD COVERED Final Report March 6, 2003 to December,31, 2003 12. SPONSORING AGENCY AND ADDRESS California Department of Transportation Division of Research and Innovation, MS-83 1227 O Street Sacramento, CA 95819 14. SPONSORING AGENCY CODE 15. SUPPLEMENTAL NOTES 16. ABSTRACT A research was conducted to evaluate a dedicated automated truck lane along a case study route 60 (Pomona Freeway) to accommodate higher truck volume using AHS technologies and to estimate the associated costs of such technologies. A cost analysis was performed for the automated truck lanes, for both directions of a 37.8 miles segment of SR-60 to carry the year 2020 projected truck volumes. It was established that the estimated costs for the automated truck lanes is $1.37 billion and because of the higher pipe line capacity of the automated truck traffic lane, only one lane is required in each direction to carry the year 2020 traffic. It was also found that the benefit to-cost ratio of the automated truck lane is 3.09 for carrying the year 2020-truck volumes. This is primarily because of the low initial capital cost of automated truck lanes ($1.37 billion). 17. KEY WORDS Automated Truck Lane Technical Research 18. DISTRIBUTION STATEMENT No restrictions. This document is available to the public through the National Technical Information Service, Springfield, VA 22161 19. SECURITY CLASSIFICATION (of this report) Unclassified 20. NUMBER OF PAGES 56 21. PRICE Reproduction of completed page authorized
Transcript of STATE OF CALIFORNIA DEPARTMENT OF TRANSPORTATION TECHNICAL...
STATE OF CALIFORNIA DEPARTMENT OF TRANSPORTATION TECHNICAL REPORT DOCUMENTATION PAGE TR0003 (REV. 10/98) 1. REPORT NUMBER
CA03-0523
2. GOVERNMENT ASSOCIATION NUMBER
3. RECIPIENT’S CATALOG NUMBER 5. REPORT DATE
November 13, 2003
4. TITLE AND SUBTITLE
State Route 60 Automated Truck Facility
6. PERFORMING ORGANIZATION CODE
7. AUTHOR(S)
Sarakki Associates Inc.
8. PERFORMING ORGANIZATION REPORT NO. 10. WORK UNIT NUMBER
193
9. PERFORMING ORGANIZATION NAME AND ADDRESS
Sarakki Associates Inc. 2152 Dupont Drive, Suite 218 Irvine, CA 92612
11. CONTRACT OR GRANT NUMBER
65A0159
13. TYPE OF REPORT AND PERIOD COVERED Final Report March 6, 2003 to December,31, 2003
12. SPONSORING AGENCY AND ADDRESS
California Department of Transportation Division of Research and Innovation, MS-83 1227 O Street Sacramento, CA 95819
14. SPONSORING AGENCY CODE
15. SUPPLEMENTAL NOTES
16. ABSTRACT
A research was conducted to evaluate a dedicated automated truck lane along a case study route 60 (Pomona Freeway) to accommodate higher truck volume using AHS technologies and to estimate the associated costs of such technologies. A cost analysis was performed for the automated truck lanes, for both directions of a 37.8 miles segment of SR-60 to carry the year 2020 projected truck volumes. It was established that the estimated costs for the automated truck lanes is $1.37 billion and because of the higher pipe line capacity of the automated truck traffic lane, only one lane is required in each direction to carry the year 2020 traffic. It was also found that the benefit to-cost ratio of the automated truck lane is 3.09 for carrying the year 2020-truck volumes. This is primarily because of the low initial capital cost of automated truck lanes ($1.37 billion).
17. KEY WORDS
Automated Truck Lane Technical Research
18. DISTRIBUTION STATEMENT No restrictions. This document is available to the public through the National Technical Information Service, Springfield, VA 22161
19. SECURITY CLASSIFICATION (of this report)
Unclassified
20. NUMBER OF PAGES
56
21. PRICE
Reproduction of completed page authorized
Division of Research & Innovation Report CA03-0523 December 2008
State Route 60 Automated Truck Facility Final Report
State Route 60 Automated Truck Facility
Final Report
Report No. CA03-0523
December 2008
Prepared By:
Sarakki Associates Inc. 2152 Dupont Drive, Suite 218
Irvine, CA 92612 (November 2003)
Prepared For:
California Department of Transportation Division of Research and Innovation, MS-83
1227 O Street Sacramento, CA 95814

DISCLAIMER STATEMENT
This document is disseminated in the interest of information exchange. The contents of this report reflect the views of the authors who are responsible for the facts and accuracy of the data presented herein. The contents do not necessarily reflect the official views or policies of the State of California or the Federal Highway Administration. This publication does not constitute a standard, specification or regulation. This report does not constitute an endorsement by the Department of any product described herein. For individuals with sensory disabilities, this document is available in Braille, large print, audiocassette, or compact disk. To obtain a copy of this document in one of these alternate formats, please contact: the Division of Research and Innovation, MS-83, California Department of Transportation, P.O. Box 942873, Sacramento, CA 94273-0001.
Automated Truck Lane Technical Research Route 60 Case Study
(Contract No. 65A0159)
Submitted by:
California Department of Transportation
Division of Innovation and Research Caltrans District 7
120 South Spring Street Los Angeles, CA
Sarakki Associates Inc.
2152 Dupont Drive, Suite 218 Irvine, CA 92612
November 13, 2003
DISCLAIMER STATEMENT
This document is disseminated in the interest of information exchange. The contents of this report reflect the views of the authors who are responsible for the facts and accuracy of the data presented herein. The contents do not necessarily reflect the official views or policies of the State of California or the Federal Highway Administration. This publication does not constitute a standard, specification or regulation. This report does not constitute an endorsement by the Department of any product described herein.
SR 60 Automated Truck Facility Study – Draft Report
Table of Contents
Executive Summary 1 1 Introduction and project background 3
1.1 The challenge 3 1.2 Potential solution 4 1.3 Project background and objectives 6
2 Concept of operations
2.1 Definition 8 2.2 Automated truck facility – operational concept 8 2.3 Typical automated roadway check-in/check-out procedure 16 2.4 Advantages of various types of check-in/check-out concepts 28 2.5 Flow interruption and incident management 30
3 Estimated cost of improvements 33
3.1 Methodology 33 3.2 Unit cost assumptions 40 3.3 Summary of costs 41
4 Evaluation of automated truck lane 43 4.1 Introduction 43 4.2 Roadway costs 43 4.3 Operation and maintenance (O&M) costs 43 4.4 Net present worth of costs 44 4.5 Net present worth of benefits 44 4.6 Additional benefits 44 Conclusions 48 References 49 Appendix A – Detail Cost Estimate Appendix B – Draft Report Review Comments
SR 60 Automated Truck Facility Study – Draft Report
List of Figures 1.1 Highway speed trend Los Angeles county 3
1.2 Lane mile supply and travel demand 4
1.3 Project location map 7
2.1a Existing SR 60 roadway cross section 9
2.1b Proposed SR 60 roadway cross section 9
2.2a Typical segment of an automated truck lane 11
2.2b Typical cross section of automated truck lane 11
2.3 Typical modification for truck automation 13
2.4 Automated truck communication scenario 15
2.5 Typical check-in scenario 1 – grade separation – auto lane above arterial 18
2.6 Typical check-in scenario 2 – grade separation – auto lane below arterial 19
2.7 Typical check-in scenario 3 – mainline check-in with hook ramp 20
2.8 Typical check-in scenario 3 – mainline check-in with hook and loop ramp 21
2.9 Typical check-out scenario 1 – grade separation – auto lane above arterial 23
2.10 Typical check-out scenario 2 – grade separation – auto lane below arterial 24
2.11 Typical check-out scenario 3 – main line check-out 25
2.12 Automated trucks typical merge scenario 26
2.13 Emergency vehicle access options 31
3.1 Plotting of ROW and additional automated lane 34
3.2 Typical cross section of SR 60 with proposed automated lanes 35
SR 60 Automated Truck Facility Study
1
EXECUTIVE SUMMARY Los Angeles County has witnessed tremendous traffic growth in the last decade. The rapid rise in demand for vehicle travel miles compared to the infrastructure supply in lane miles, has dramatically decreased the average speeds and increased the average travel times for both auto and truck traffic. As a case study, State Route 60 (Pomona Freeway) experiences severe congestion due to high percentage (7-19%) of trucks and rolling terrain. According to Los Angeles County Metropolitan Transportation’s (MTA) 2002 long range transportation plan, existing average speeds on Pomona freeway is less than 20 miles per hour at selected segments and is expected to get much worse by the year 2025. In recent years, Automated Highway Systems (AHS), a field within Intelligent Transportation Systems, utilizing advances in computer and communication technologies to dramatically improve traffic capacity, has been considered as a solution to many of the modern day congestion problems. AHS has the potential to increase traffic capacity by several folds depending on the vehicle size, spacing and speed of travel. AHS accomplishes this task by automating all of the driving functions when the vehicle is on the automated freeway. This enables closer longitudinal and lateral vehicle platoon spacing and thus dramatically increasing capacity. It has been estimated that AHS will increase automobile traffic capacity by several folds and truck traffic capacity by at least 100% depending on the number of trucks in the platoon, truck speed and inter and intra-truck platoon spacing. The objective of this study is two fold. One, is to research and evaluate a dedicated automated truck lane along a case study route, the Pomona Freeway (from I-710 to I-15) to accommodate the year 2025 traffic using AHS technologies. Please note that this is a top level preliminary report and is prepared based on the set of assumptions provided by either PATH or the original Request for Proposal (RFP). Views expressed in this report are for technology evaluation purposes only and not a recommendation for its application. Two, is to identify and estimate the associated costs for such a technology as applied to SR 60 facility. This study utilizes the truck automation technologies demonstrated by University of California, Berkeley, as part of their Partners for Advanced Transit and Highways (PATH) program and the Southern California Association of Government, SCAG report for a conventional truck lane facility on State Route 60.
SR 60 Automated Truck Facility Study
2
Based on the analysis, this study provides initial ideas about automated truck facility along SR-60 in terms of costs, safety and improved speeds. The study also addresses the initial capital costs for an automated truck facility to carry the year 2020 truck traffic. Chapter 1 provides introduction and project background in additional detail. Chapter 2 provides the concept of operation of an automated truck facility including automated check-in, automated check-out and access to incident site during automation failure. Chapter 3 provides the estimated cost of construction for an automated facility. Chapter 4 provides an evaluation of the automated truck facility in terms of costs and benefits.
Introduction
SR 60 Automated Truck Facility Study
3
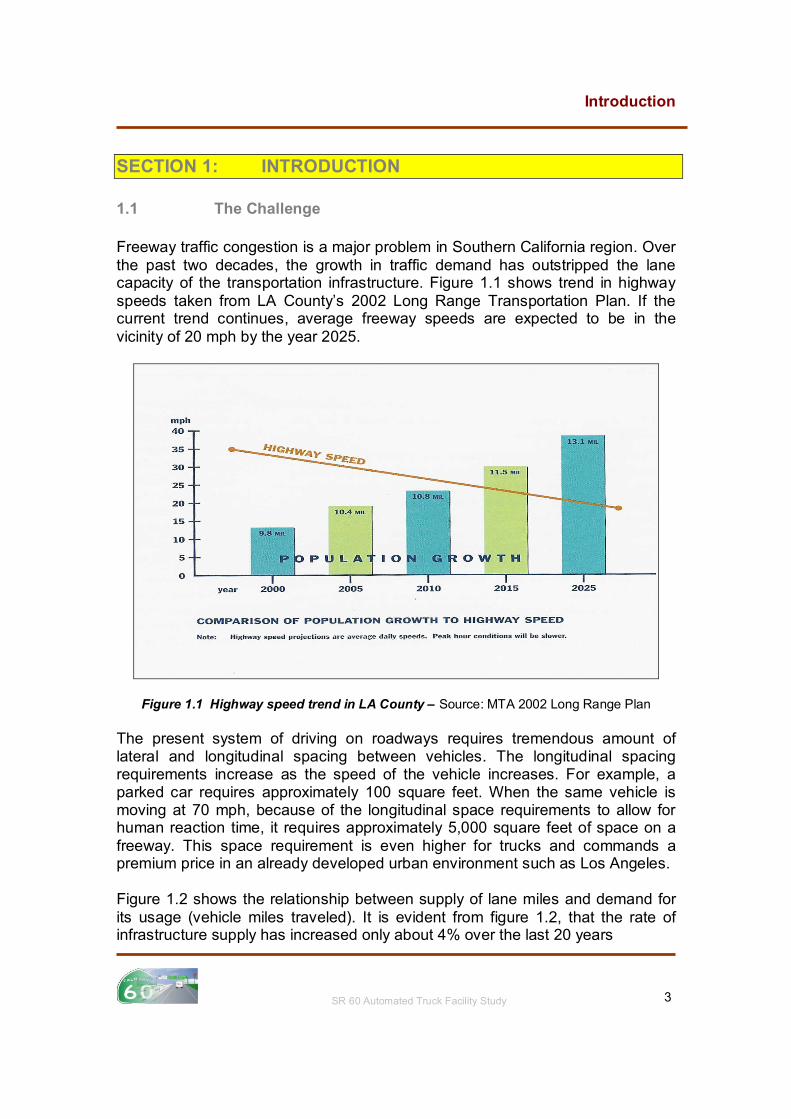
SECTION 1: INTRODUCTION 1.1 The Challenge Freeway traffic congestion is a major problem in Southern California region. Over the past two decades, the growth in traffic demand has outstripped the lane capacity of the transportation infrastructure. Figure 1.1 shows trend in highway speeds taken from LA County’s 2002 Long Range Transportation Plan. If the current trend continues, average freeway speeds are expected to be in the vicinity of 20 mph by the year 2025.
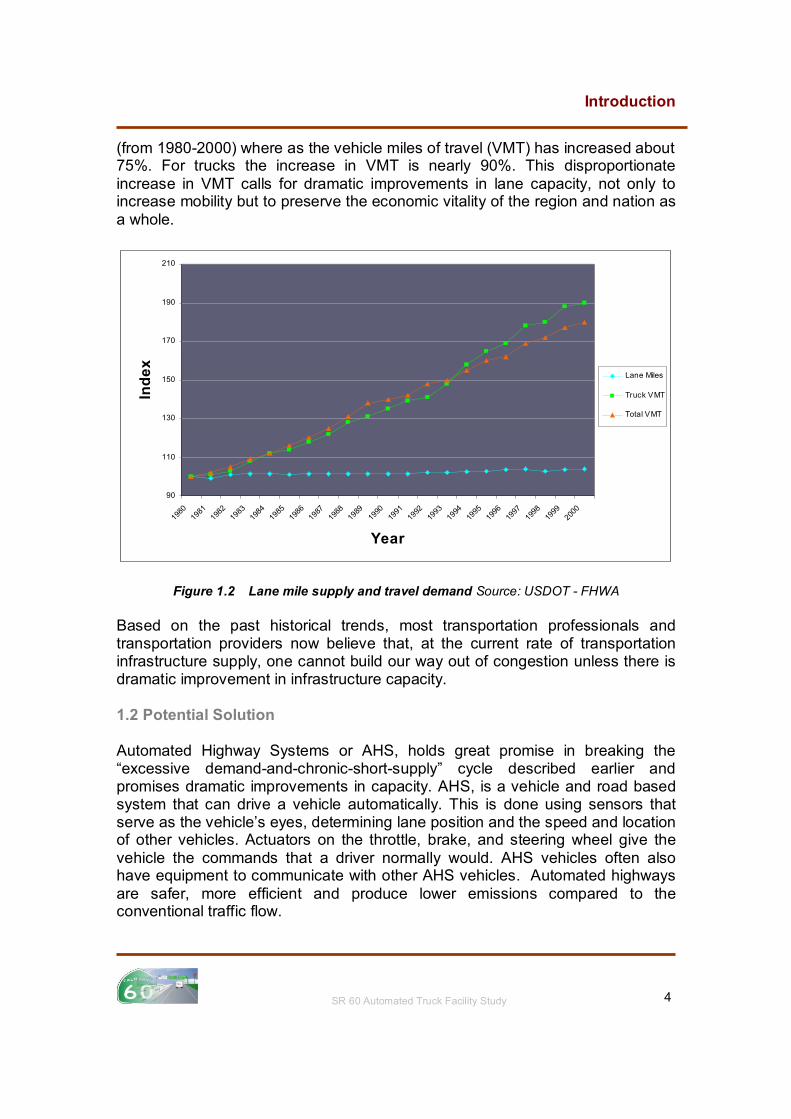
Figure 1.1 Highway speed trend in LA County – Source: MTA 2002 Long Range Plan The present system of driving on roadways requires tremendous amount of lateral and longitudinal spacing between vehicles. The longitudinal spacing requirements increase as the speed of the vehicle increases. For example, a parked car requires approximately 100 square feet. When the same vehicle is moving at 70 mph, because of the longitudinal space requirements to allow for human reaction time, it requires approximately 5,000 square feet of space on a freeway. This space requirement is even higher for trucks and commands a premium price in an already developed urban environment such as Los Angeles. Figure 1.2 shows the relationship between supply of lane miles and demand for its usage (vehicle miles traveled). It is evident from figure 1.2, that the rate of infrastructure supply has increased only about 4% over the last 20 years
Introduction
SR 60 Automated Truck Facility Study
4
(from 1980-2000) where as the vehicle miles of travel (VMT) has increased about 75%. For trucks the increase in VMT is nearly 90%. This disproportionate increase in VMT calls for dramatic improvements in lane capacity, not only to increase mobility but to preserve the economic vitality of the region and nation as a whole.
90
110
130
150
170
190
210
1980
1981
1982
1983
1984
1985
1986
1987
1988
1989
1990
1991
1992
1993
1994
1995
1996
1997
1998
1999
2000
Year
Ind
ex
Lane Miles
Truck VMT
Total VMT
Figure 1.2 Lane mile supply and travel demand Source: USDOT - FHWA Based on the past historical trends, most transportation professionals and transportation providers now believe that, at the current rate of transportation infrastructure supply, one cannot build our way out of congestion unless there is dramatic improvement in infrastructure capacity. 1.2 Potential Solution Automated Highway Systems or AHS, holds great promise in breaking the “excessive demand-and-chronic-short-supply” cycle described earlier and promises dramatic improvements in capacity. AHS, is a vehicle and road based system that can drive a vehicle automatically. This is done using sensors that serve as the vehicle’s eyes, determining lane position and the speed and location of other vehicles. Actuators on the throttle, brake, and steering wheel give the vehicle the commands that a driver normally would. AHS vehicles often also have equipment to communicate with other AHS vehicles. Automated highways are safer, more efficient and produce lower emissions compared to the conventional traffic flow.
Introduction
SR 60 Automated Truck Facility Study
5
AHS enables the transportation professionals and providers to think “outside-the-box” and instead focus on taking advantages of technological breakthroughs in computer and communication systems to meet the mobility needs of today and tomorrow. It has been touted that automated lanes will provide more capacity because of the close platoon spacing and vehicle headways within a given platoon. The close platoon and vehicle spacing enables higher lane capacity and thus more traffic volumes can be accommodated compared to the traditional freeway operations. Other advantages of automated highway systems include but not limited to the following.
Optimum utilization of existing highway capacity Increased capacity over a conventional lane Increased safety due to high performance vehicle control Reduced aerodynamic drag due to close vehicle spacing and thus
greater fuel economy Reduced exhaust emissions Substantial decrease in construction costs Reduced congestion and improved travel time Less right of way requirements compared to conventional lanes Increased mobility Precise vehicle tracking, lateral and longitudinal control Substantially decreased driver fatigue and frustration
This “paradigm shift” from building more conventional lanes to accommodate future traffic to increasing the capacity using the new automated technologies will better serve the current and future mobility needs of the greater Metropolitan region in the state. In addition, this type of approach and thinking is essential to meet or exceed the growing demand for transportation infrastructure, which is increasingly becoming difficult to build due to environmental, social-economic, institutional and other issues.
1.2.1 The University of California, Berkeley – The AHS Leader The University of California, Berkeley’s Partners for Advanced Transit and Highways (PATH), has been a leader in the development of automated technologies in the United States and in the world. It has successfully developed and demonstrated advanced vehicle and safety systems both for automobile and truck traffic. PATH is a collaboration between the California Department of Transportation (Caltrans), other public and private academic institutions, and private industry. PATH has developed and successfully demonstrated proven truck automation technologies and vehicle systems in the past.

Concept of Operations
SR 60 Automated Truck Facility Study
8
SECTION 2: CONCEPT OF OPERATIONS/ASSUMPTIONS 2.1 Definition Concept of operations, at a top level identifies how the SR-60 dedicated truck lane system would operate under a typical automated scenario. The concept of operations also identifies typical check-in and check-out procedures of a truck equipped with proper equipment and scenarios of incident management in the event of automation failure. 2.2 Automated Truck Facility – Operational Concept The following paragraphs provide basic assumptions and operational parameters associated with safe operation of an automated truck facility along State Route 60. These assumptions and parameters were derived directly from the scope of work proposed by our team and also from information provided by PATH in the stakeholder meeting on May 12, 2003 at PATH Richmond Field Station.
2.2.1 Basic Assumptions:
The following are the basic assumptions made in developing the concept of operations for the SR-60 automated truck facility. The assumptions are divided into two categories: Assumptions regarding the automated truck lane and assumptions regarding the automated vehicle.
2.2.1.1 Automated Truck Lane (Intelligent Vehicle Infrastructure)
Existing ramp configurations at major interchanges are retained
with minor modifications Similar to SCAG study, truck entry and exit ramps are assumed to
be at the same 11 interchanges along SR-60. These interchanges with SR-60 are: Atlantic Blvd, Paramount Blvd, Rosemead Blvd, Hacienda Blvd, Fullerton Road, Fairway Drive, Reservoir Street, Archibald Avenue, Grove Avenue, Milliken Avenue and Etiwanda Avenue.
Existing ramp capacities for the mixed flow is adequate and no upgrades are identified at this time
Caltrans Highway Design Manual is used as a standard for geometric design where applicable.
The proposed automated lane has the cross section shown in figure 2.1b
The year 2020 truck traffic can be accommodated by one dedicated truck lane in each direction along SR-60
The automated vehicle technology as perceived by PATH is operationally feasible with respect to all issues of automation and automation failure.

Concept of Operations
SR 60 Automated Truck Facility Study
9
R/WR/W
VARIES
SHOULDER
VARIES
SLOPE
SLOPE
VARIES
SHOULDER
WESTBOUND
SHOULDER
All Dimensions in Feet
VARIES
EASTBOUND
SHOULDER
SLOPE
SLOPE
Figure 2.1a Existing SR-60 Roadway Cross Section
VARIES
SHOULDER
VARIES
SHOULDER TRUCKS
SHOULDER
WESTBOUND
SHOULDER
All Dimensions in Feet
EASTBOUND
SHOULDER
TRUCKS SHOULDER
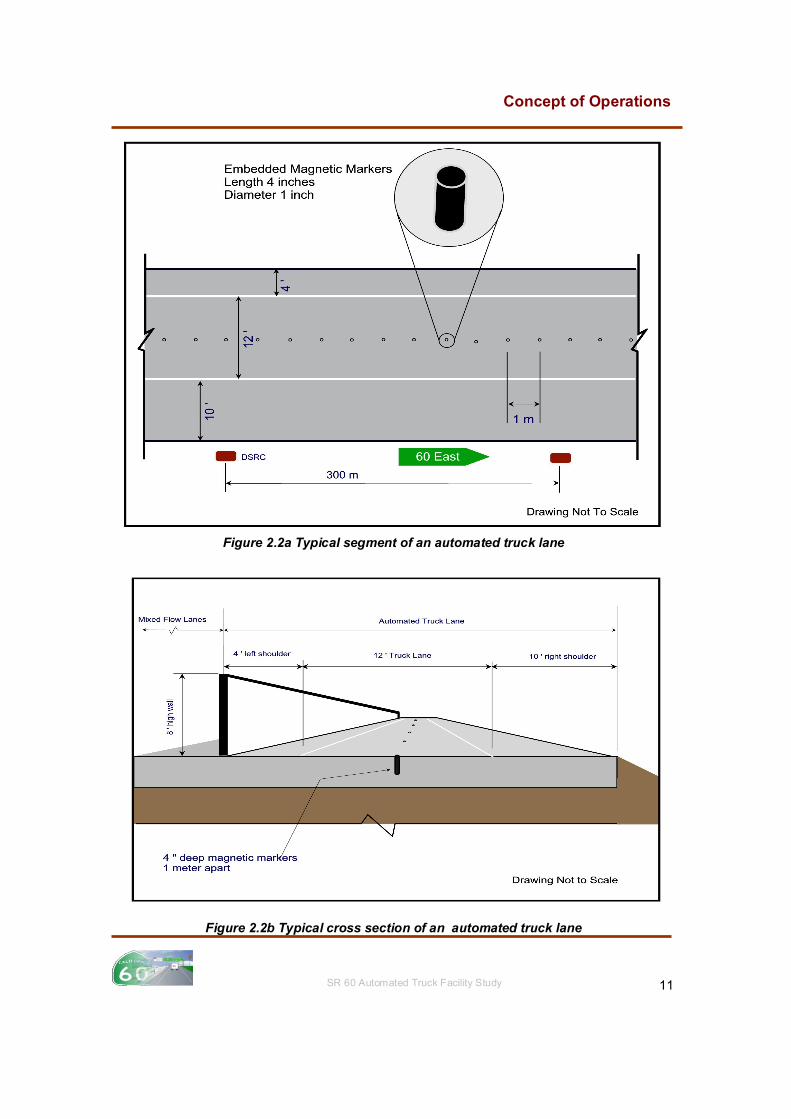
Figure 2.1b Proposed SR-60 Roadway Cross Section The lane width is assumed to be 12 feet with 10 feet right shoulder
and 4 feet left shoulder The automated truck facility has a lane capacity (pipeline capacity)
of 1850 trucks per hour per lane
Concept of Operations
SR 60 Automated Truck Facility Study
10
The automated truck facility will be separated from the mixed flow lanes using physical barrier separation
Roadway reference marking (permanent magnetic markers –Figure 2.2a and 2.2b) will keep the vehicle’s lateral position with reference to the installed magnets. It is assumed that a GPS system will serve as the backup for redundancy.
A check-in site is located at each on-ramp location on the main line to ensure that a vehicle is properly equipped with the necessary equipment for the automated trip and has intended exit
A check-in site will also include provisions for trucks that failed the safe check-in to return to safely return to the mixed flow lanes
A check-out site is located at designated off-ramps (eight along the SR-60 corridor) to verify that the driver has regained the control of the vehicle
A rolling check-in is assumed which minimizes the need for long storage requirements during check-in procedures. However, as a conservative measure, storage requirements for three trucks based on expected peak hour truck traffic (SCAG report) is assumed at each check-in location.
A storage requirement for two trucks failed at check-out is assumed at check-out off-ramps as per the guidelines provided by California Department of Transportation (Caltrans) in the PATH report
Roadside to vehicle communication is via next generation of dedicated short-range communications (DSRC) in the range of 5.9 GHz.
The DSRC devices are embedded in to the pavement at every 300 meters on the roadway and at each on and off-ramp locations
All trucks using SR 60 shall be required to use the automated truck lane.
Operating speeds are assumed to be 55 mph.
Concept of Operations
SR 60 Automated Truck Facility Study
11
Figure 2.2a Typical segment of an automated truck lane
Figure 2.2b Typical cross section of an automated truck lane
Concept of Operations
SR 60 Automated Truck Facility Study
12
2.2.1.2 Automated Truck
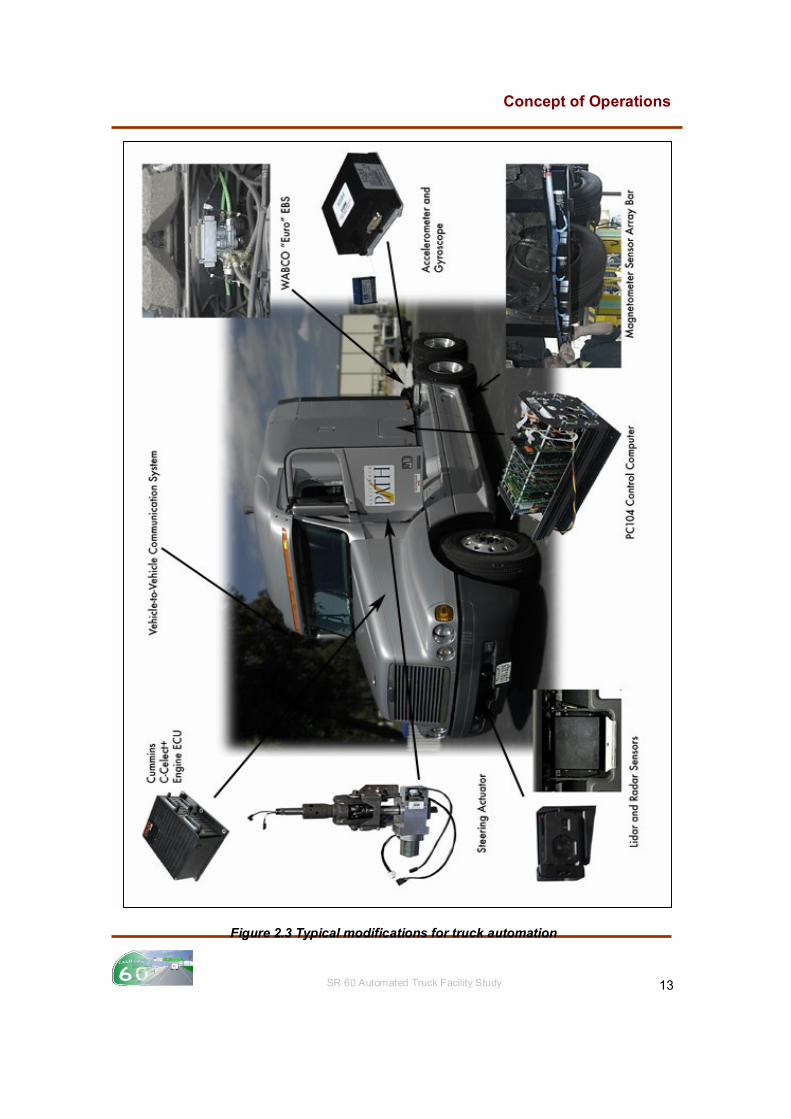
Figure 2.3 shows the typical modifications needed (according to PATH) for an automated truck. Information is collected from the engine controller and commands are issued to it from a control computer using a data bus.
Steering Actuator The steering actuator allows for seamless transition from manual mode steering to automating steering operation and back using simple modifications. Steering actuator is a small DC servo motor installed in the steering column, so that it can turn the steering wheel in response to commands from the control computer. Radar for Distance Control Two different kinds of radars can be installed on the trucks. An Eaton-Vorad EVT-300 radar, which is a 24 GHz millimeter-wave radar used for the factory-installed forward collision warning and adaptive cruise control systems on the truck. In addition, a Denso infrared laser radar (lidar), originally developed for automotive applications, to provide an independent measurement of the distance to the leading truck can be installed. The Eaton-Vorad provides better information about the speed difference between the trucks, while the Denso provides better distance measurements over a wider range of angles, so both can be combined to get more accurate measurements.
Accelerometer and Gyroscope The accelerometer provides measurements of the accelerations of the truck and the gyroscope provides yaw rate (angular rotations in the plane of the road surface) measurements, so that the control performance of the truck can be improved, especially when changing lanes.
Magnetometer Sensor Array Bar The array measures the vehicle’s lateral position in relation to the permanent magnetic markers embedded in the pavement at every 4 feet or 1.2 meters. By alternating polarity (magnetic markers up or down), they also can measure the longitudinal distance. There are five magnetometers mounted to each of two bars installed under each truck, one under the front bumper and the other slightly in front
Concept of Operations
SR 60 Automated Truck Facility Study
13
Figure 2.3 Typical modifications for truck automation
Concept of Operations
SR 60 Automated Truck Facility Study
14
of the tandem rear axles. These magnetometers measure the magnetic fields of the permanent magnets that are installed just below the road surface, providing very accurate measurements of the lateral position and yaw angle of the truck relative to the magnets at the lane center. On-board Control Computer The On-board computer is a Pentium based system. All of the vehicle control functions are performed by a single Pentium computer running the QNX real-time operating system, and control software developed by PATH, installed in a compact PC-104 standard computer enclosure. Electronic Braking System (EBS) Electronic Braking System allows for shorter braking distance without tire skid. The trucks are equipped with a WABCO-Meritor European-style electronic braking system (Euro-EBS), which makes it possible for the control computer to send the braking commands directly to the pneumatic brake valves. 2.2.1.3 Vehicle to Vehicle and Vehicle to Roadside Communication System
Vehicle-to-Vehicle and Vehicle-to-Roadside Communications are
provided by an IEEE 802.11b standard wireless local area network (LAN) system (also known as Wi-Fi), using a wireless token ring protocol developed by PATH. The communication setup is shown in the figure 2.4
Automated truck will have the same physical characteristics as non
automated vehicle in terms of steering, braking, acceleration and turning.
Length of the truck = 20 meters Platoon size = 3 trucks Intra platoon spacing between trucks = 8 meters Operating speed = 55 mph Inter platoon spacing per demand

Concept of Operations
SR 60 Automated Truck Facility Study
15
Figure 2.4 Automated truck communications system using DSRC(dedicated short range communication) and GPS
Concept of Operations
SR 60 Automated Truck Facility Study
16
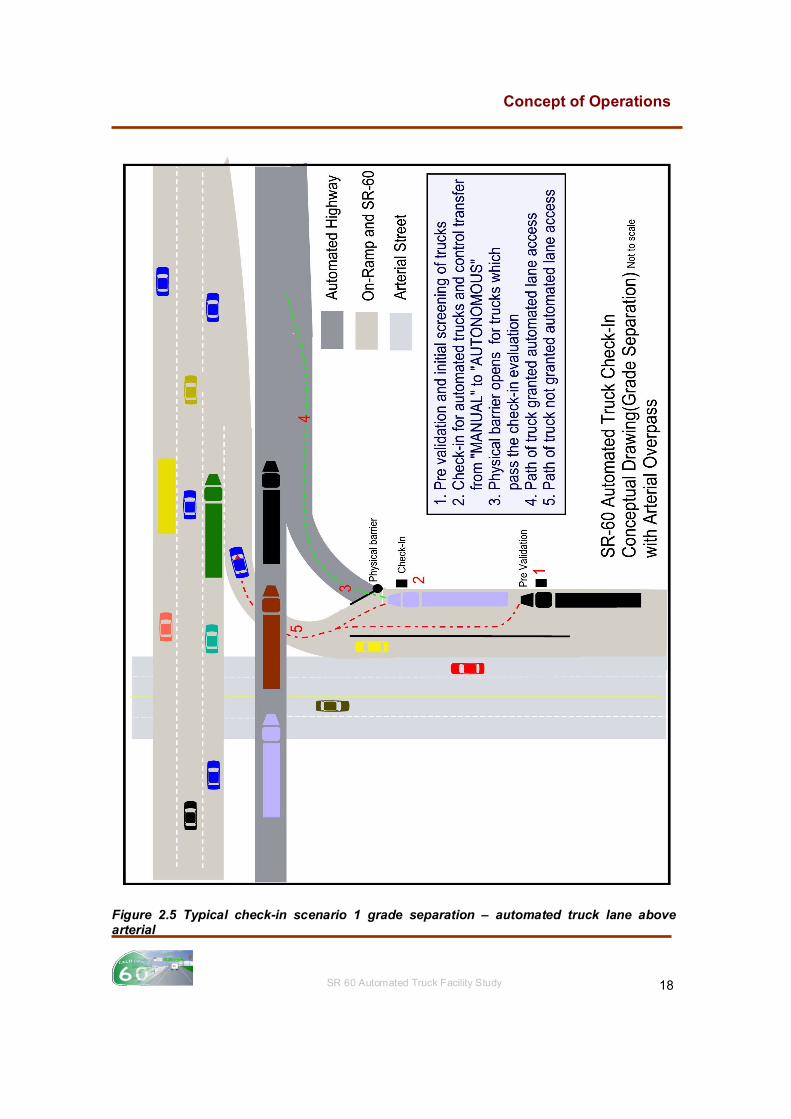
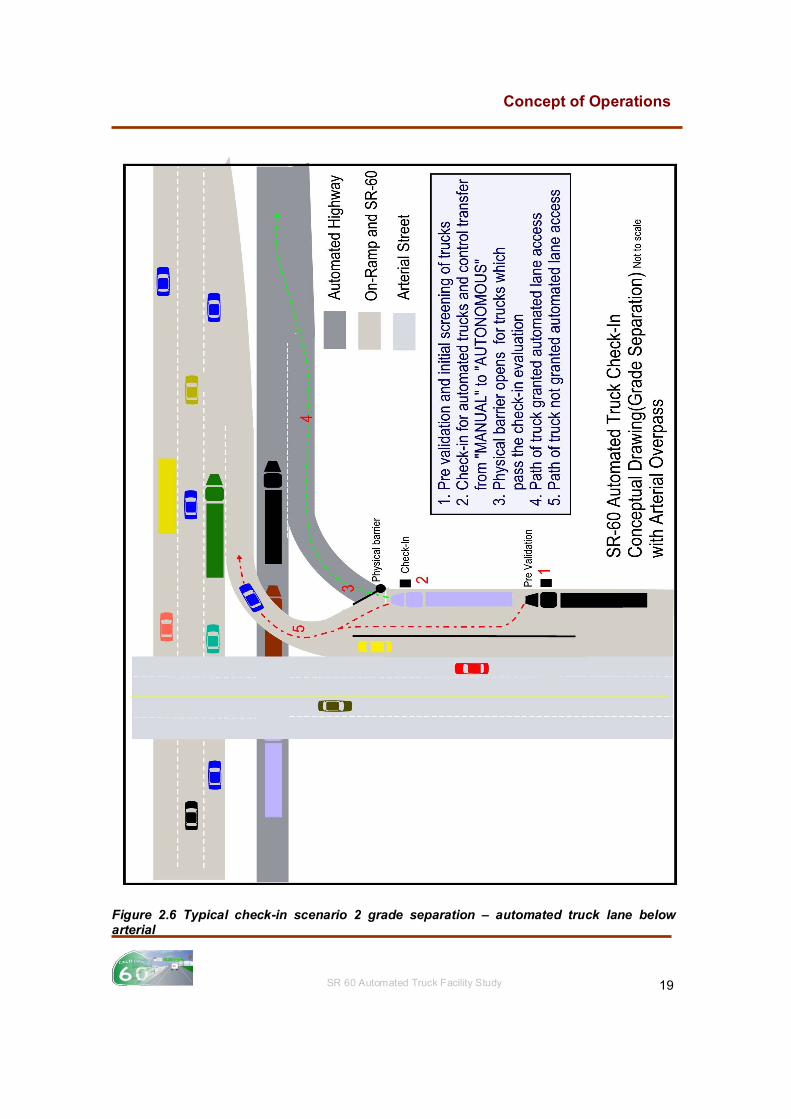
2.3 Typical Automated Roadway Check-In/Check-Out Procedures Figures 2.5 through 2.11 depict the conceptual sketches showing the check-in and check-out procedures at typical on and off ramps for the SR-60 automated truck lanes. These sketches are conceptual and are not to scale. However, typical scaled drawings were prepared for the purpose of right-of-way and construction cost estimates. The team is proposing grade separation at all check-in and check-out locations for safe and efficient entry, merging and exit of heavy vehicles in and out of automated lanes. The following paragraphs provide additional details for each of the alternative concepts.
2.3.1 Sequence of automated Check-In procedures
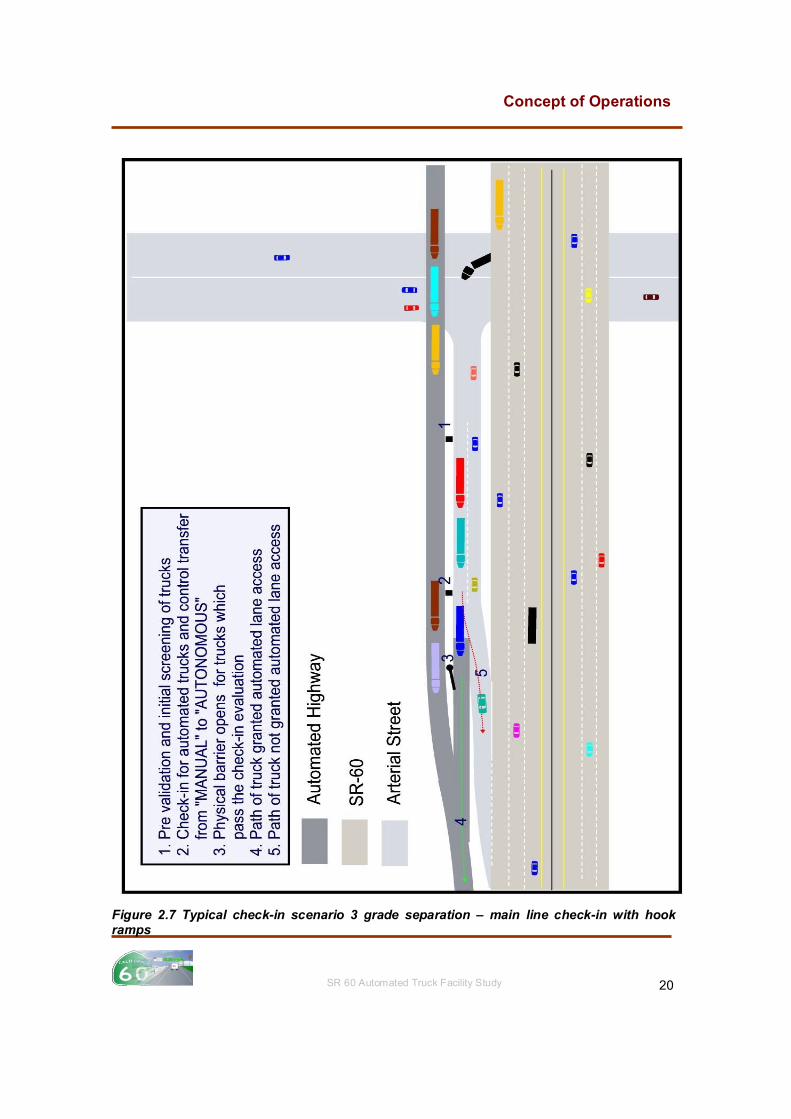
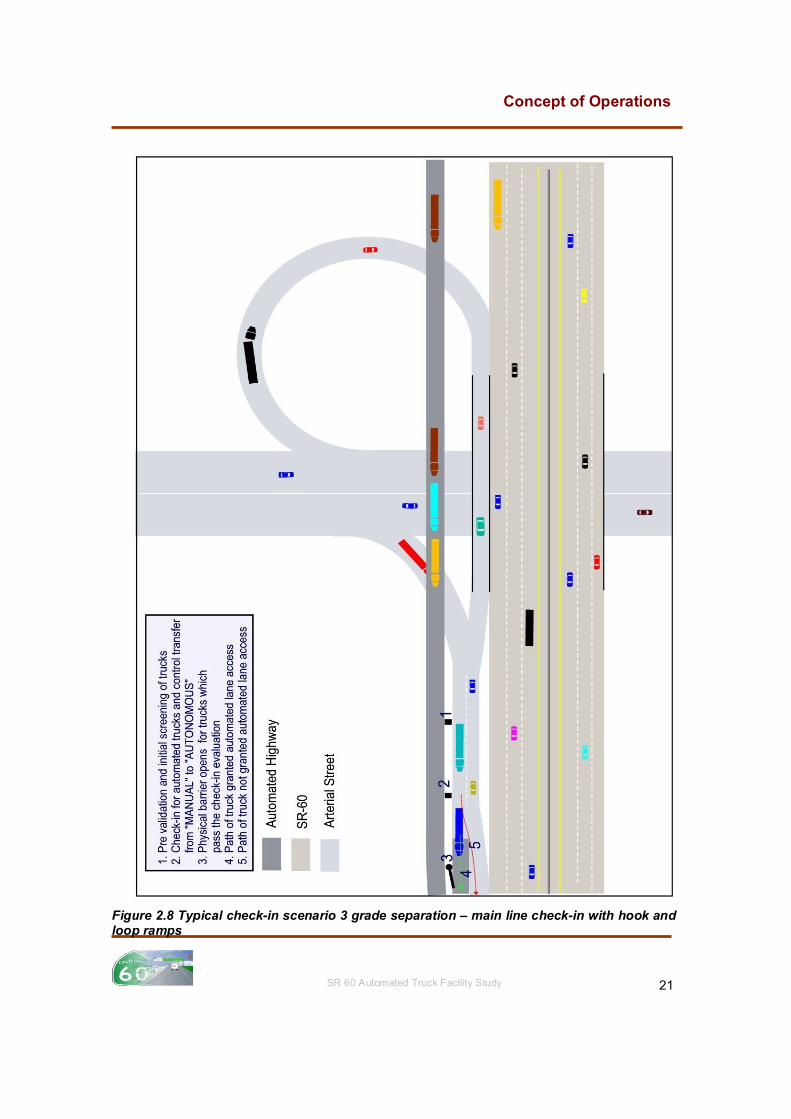
Step 1. Pre-Validation: Pre-validation and screening is performed at this location to ensure that the automated truck is properly equipped in terms of brakes, controls and on-board automated equipment Step 2. Check-in: A wireless communication device just before the on ramp will make sure that the truck is in complete compliance with the requirements for the trip. The truck passes the check-in procedures and is ready for entering the automated lanes. Control is transferred from manual mode to autonomous mode. Step 3. Barrier Gate: For those trucks that pass the check in procedures, barrier (3) is lifted and the truck enters the automated lane’s merge ramp. Trucks that fail check-in procedures will safely merge with the mixed flow lanes (5) Step 4. Merging: Merging is accomplished through a series of adaptive cruise control moves. Since each merging truck is in communication with the platoon of trucks on the automated main line, merging speeds and gaps are automatically accomplished with on-board control and communication equipment. The vehicle will safely merge with the platoon and inter and intra-platoon spacing is maintained. Step 5. Mainline Cruising and Platoon Flow: Once the automated vehicles merges with the mainline platoon, it is expected to travel at speeds of up to 65 miles per hour and can be reduced to 45 miles per hour under certain conditions as identified in the PATH truck automation research papers. The longitudinal and lateral positions will be maintained by the magnetic markers permanently embedded in the pavement. The main lane capacity is very much dependent on the longitudinal spacing (headways) of
Concept of Operations
SR 60 Automated Truck Facility Study
17
the vehicles. If the vehicles are closely spaced the capacity is maximized. A typical mainline merging scenario is depicted in figure 2.12 Table 2.1(page 26) Displays capacity estimates for platoon size for a given operating speed as identified by PATH. Table 2.2 provides increase in theoretical capacity of an automated truck lane compared to the traditional/manual truck lanes. Table 2.3 shows lane capacity comparisons between automated truck lanes adjusted (reduced capacity) for lateral movement during merging, and the manual lanes.
Concept of Operations
SR 60 Automated Truck Facility Study
18
Figure 2.5 Typical check-in scenario 1 grade separation – automated truck lane above arterial
Concept of Operations
SR 60 Automated Truck Facility Study
19
Figure 2.6 Typical check-in scenario 2 grade separation – automated truck lane below arterial
Concept of Operations
SR 60 Automated Truck Facility Study
20
Figure 2.7 Typical check-in scenario 3 grade separation – main line check-in with hook ramps
Concept of Operations
SR 60 Automated Truck Facility Study
21
Figure 2.8 Typical check-in scenario 3 grade separation – main line check-in with hook and loop ramps
Concept of Operations
SR 60 Automated Truck Facility Study
22
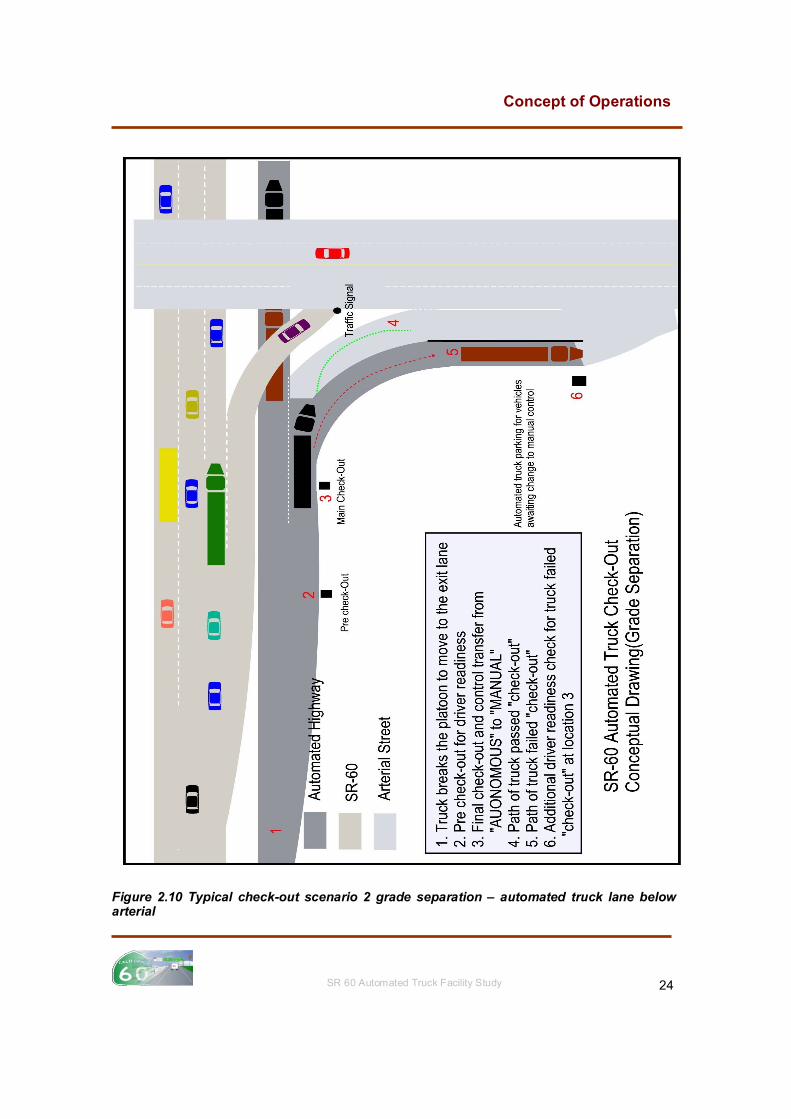
2.3.2 Sequence of automated Check-Out procedures.
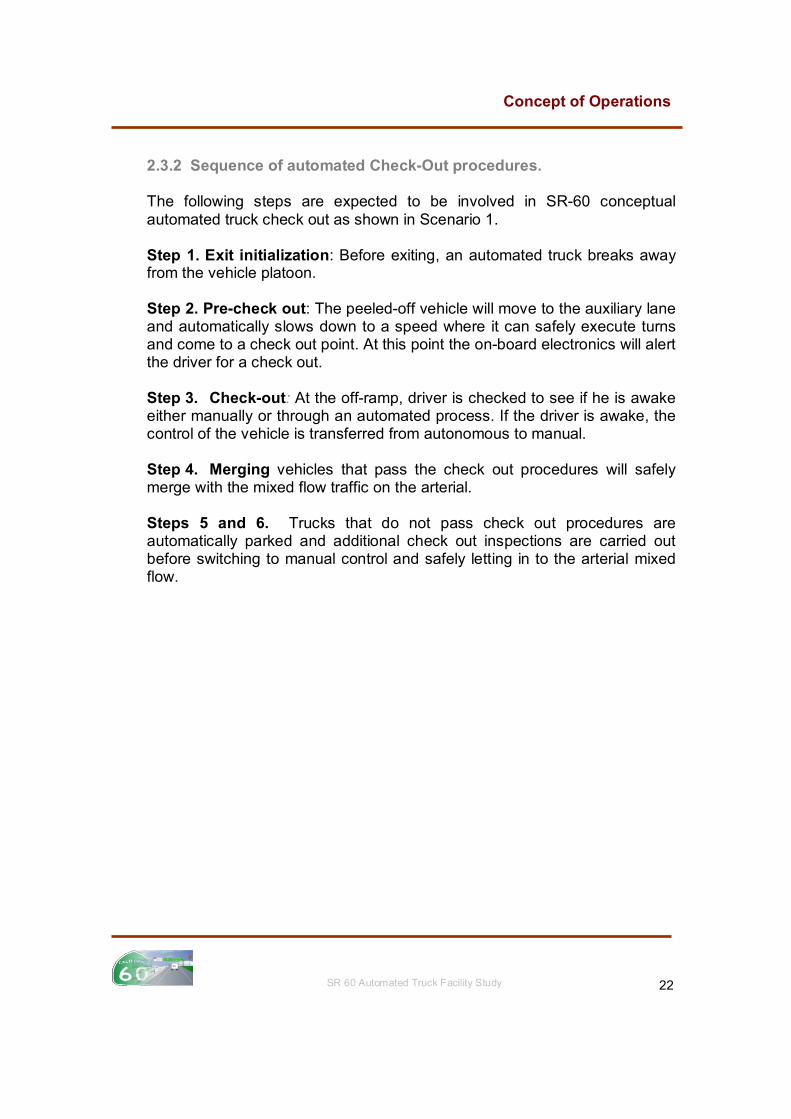
The following steps are expected to be involved in SR-60 conceptual automated truck check out as shown in Scenario 1. Step 1. Exit initialization: Before exiting, an automated truck breaks away from the vehicle platoon. Step 2. Pre-check out: The peeled-off vehicle will move to the auxiliary lane and automatically slows down to a speed where it can safely execute turns and come to a check out point. At this point the on-board electronics will alert the driver for a check out.
Step 3. Check-out: At the off-ramp, driver is checked to see if he is awake either manually or through an automated process. If the driver is awake, the control of the vehicle is transferred from autonomous to manual.
Step 4. Merging vehicles that pass the check out procedures will safely merge with the mixed flow traffic on the arterial. Steps 5 and 6. Trucks that do not pass check out procedures are automatically parked and additional check out inspections are carried out before switching to manual control and safely letting in to the arterial mixed flow.
Concept of Operations
SR 60 Automated Truck Facility Study
23
Figure 2.9 Typical Check-out Scenario 1. Grade Separation – Automated Truck Lane Above Arterial
Concept of Operations
SR 60 Automated Truck Facility Study
24
Figure 2.10 Typical check-out scenario 2 grade separation – automated truck lane below arterial

Concept of Operations
SR 60 Automated Truck Facility Study
25
Figure 2.11 Typical check-out scenario 3 main-line check-out with grade separation – automated truck lane below arterial
Concept of Operations
SR 60 Automated Truck Facility Study
26
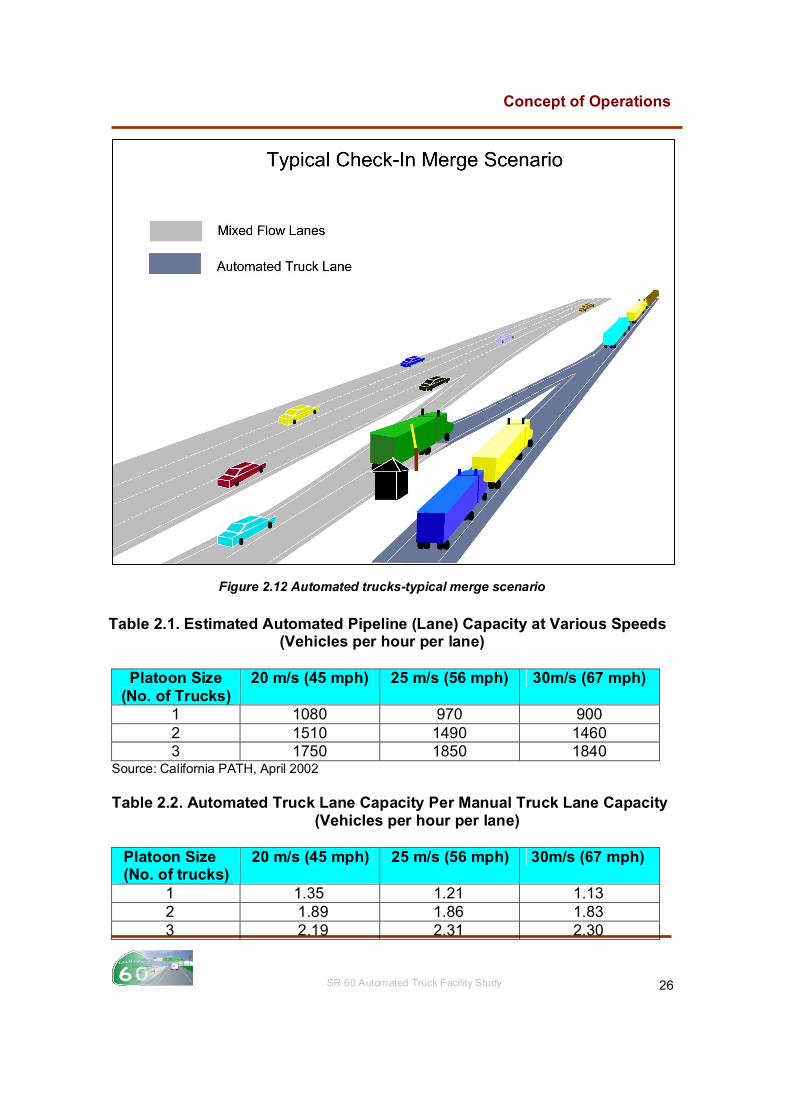
Figure 2.12 Automated trucks-typical merge scenario
Table 2.1. Estimated Automated Pipeline (Lane) Capacity at Various Speeds
(Vehicles per hour per lane)
Platoon Size (No. of Trucks)
20 m/s (45 mph) 25 m/s (56 mph) 30m/s (67 mph)
1 1080 970 900 2 1510 1490 1460 3 1750 1850 1840
Source: California PATH, April 2002 Table 2.2. Automated Truck Lane Capacity Per Manual Truck Lane Capacity
(Vehicles per hour per lane)
Platoon Size (No. of trucks)
20 m/s (45 mph) 25 m/s (56 mph) 30m/s (67 mph)
1 1.35 1.21 1.13 2 1.89 1.86 1.83 3 2.19 2.31 2.30
Concept of Operations
SR 60 Automated Truck Facility Study
27
Source: California PATH, April 2002
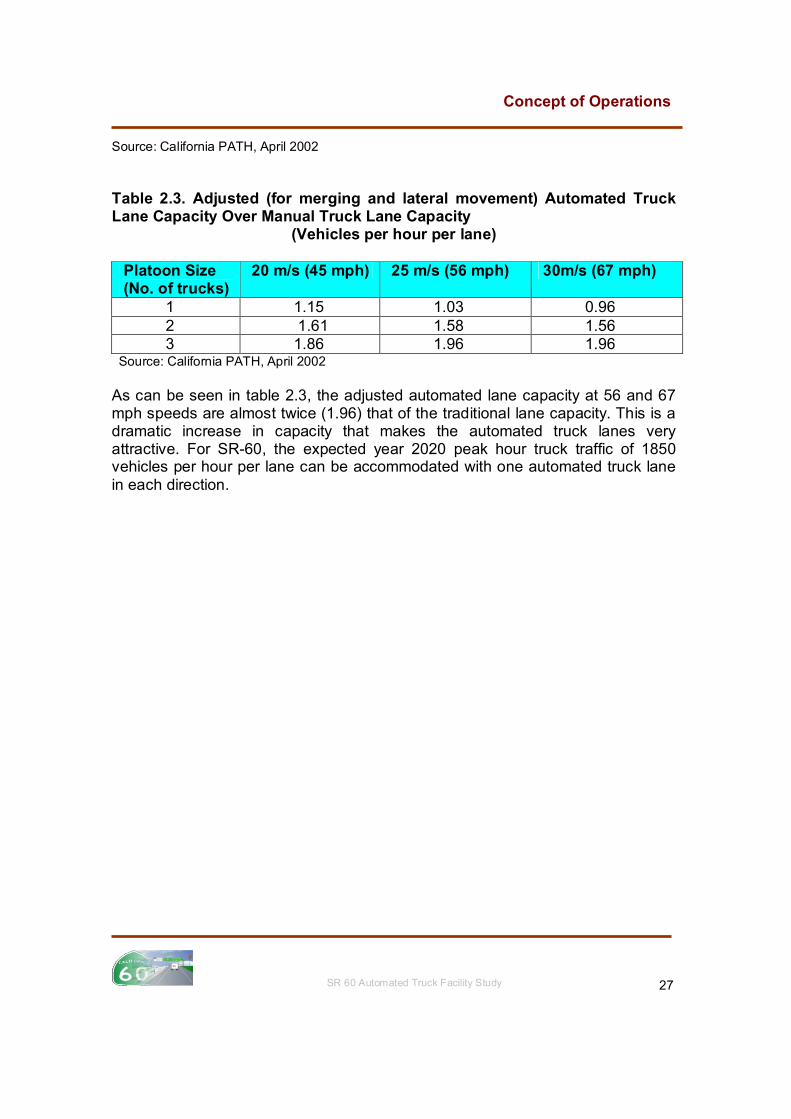
Table 2.3. Adjusted (for merging and lateral movement) Automated Truck Lane Capacity Over Manual Truck Lane Capacity
(Vehicles per hour per lane)
Platoon Size (No. of trucks)
20 m/s (45 mph) 25 m/s (56 mph) 30m/s (67 mph)
1 1.15 1.03 0.96 2 1.61 1.58 1.56 3 1.86 1.96 1.96
Source: California PATH, April 2002
As can be seen in table 2.3, the adjusted automated lane capacity at 56 and 67 mph speeds are almost twice (1.96) that of the traditional lane capacity. This is a dramatic increase in capacity that makes the automated truck lanes very attractive. For SR-60, the expected year 2020 peak hour truck traffic of 1850 vehicles per hour per lane can be accommodated with one automated truck lane in each direction.

Concept of Operations
SR 60 Automated Truck Facility Study
28
2.4 Advantages of various types of check-in and check-out operational concepts
Type of Check-in Advantages Disadvantages
Automated Truck Lane Above Arterial
Easier storage length
accommodations at entry since storage is at surface street level
Higher construction
costs Noise concerns Uphill acceleration
before merging No direct left turn
from arterial to SR-60 automated lanes
Automated Truck Lane Below Arterial
Easier acceleration and merging
Lower construction costs
Lower Noise Easier storage length
accommodation
No direct left turn from arterial to SR-60 automated lanes
Main-Line Check-in
Surface Street Traffic
conflicts minimized Both loop and hook
ramps use the same check-in (check-in costs are minimized)
Operationally more efficient
Both Northbound and Southbound trucks from the arterial can turn in to the same check-in.
Higher construction costs due to additional width of elevated structures

Concept of Operations
SR 60 Automated Truck Facility Study
29
Type of Check-out Advantages Disadvantages Automated Truck Lane Above Arterial
Easier storage
length accommodations
Longer deceleration lane required
Operational improvements are needed to accommodate truck turns
Automated Truck Lane Below Arterial
Easier storage Shorter exit ramps
because of lower grade
Elevated structure
required to accommodate easy merge with surface street past the loop ramps
Main Lane Check-Out
No traffic conflict at
exits

Concept of Operations
SR 60 Automated Truck Facility Study
30
2.5 Flow Interruption And Incident Management The automated truck facility will be built with many redundant systems such that if there is a failure in one mission critical operation, a backup system will smoothly takeover the operation and will be seamless to the user (driver) of the system. Many of the automated functions are controlled and managed by both the roadway infrastructure and on-board equipment. This includes automatic local position control, lane changing, obstruction on the roadway and flow control. This redundant system approach will reduce the probability of incidents on the automated freeway. In addition, the infrastructure senses, sends command to other individual vehicles in the system, perform optimized flow control and take the necessary programmed action based on type of incidents on the automated freeway. In spite of automating all of the system functions within the automated freeway, it is conceivable that an incident could occur due to external factors that are outside the automated freeway system concept. For this reason, it is imperative to plan for incident management in the event of an incident. In such cases an incident need to be identified, verified and removed from the automated freeway system before the resumption of platoon flow. The following paragraphs provide options to clear an incident should it happen on the SR-60 automated highway facility. Incidents on the automated highway system can happen for variety of reasons. Most of the incidents can be grouped under the following categories. Incidents due to human error – hard braking and other driver errors Incidents due to mechanical error – Tire blow out or engine failure etc., Incidents due to failure in communication technologies such as DSRC and
other roadside instrumentation External/Foreign objects on the automated roadway facility Lost load Lost air Other In any of the above cases, the automated highway system is either partially blocked or fully blocked. One of the primary requirements in removing the incident is access to the incident site for the first responders. Figure 2.13 shows a conceptual incident site where traffic is fully blocked. It is assumed that automation is suspended at this segment of the freeway and depending on the expected time of clearance, automation in upstream segments is suspended and vehicles are switched to manual mode. The following are three ways that an emergency vehicle can enter the automated freeway facility and reach the incident site for incident removal.
Concept of Operations
SR 60 Automated Truck Facility Study
31
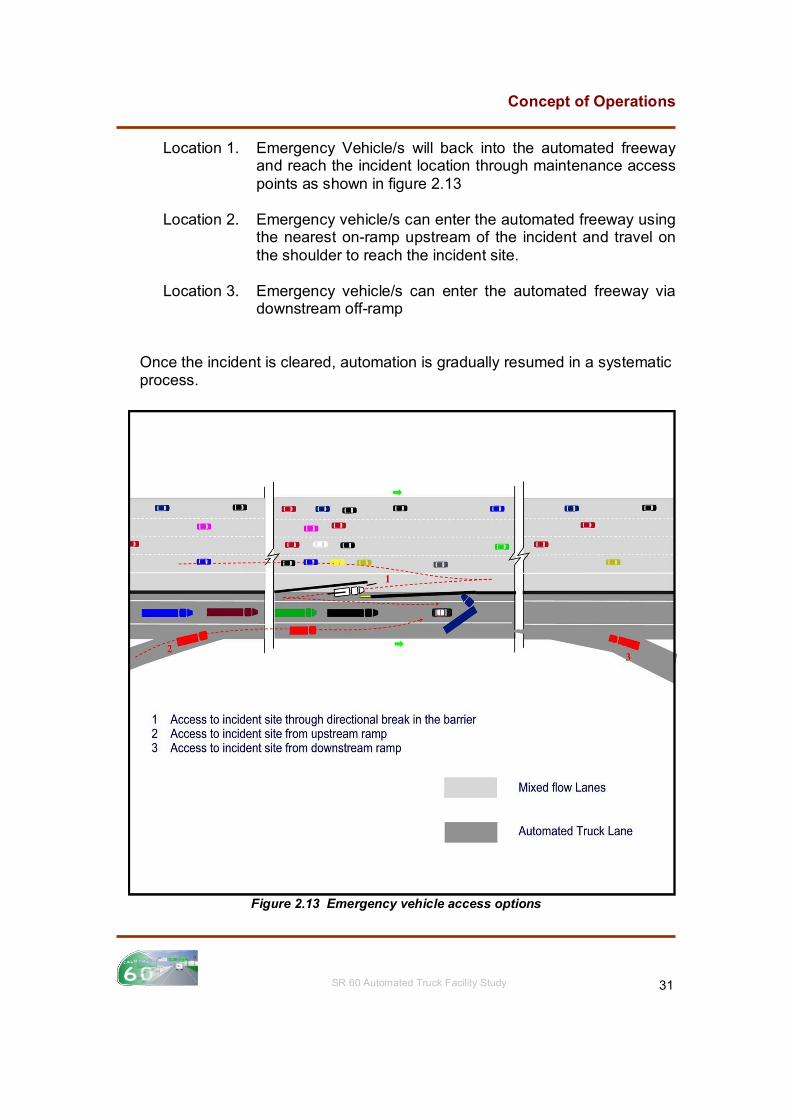
Location 1. Emergency Vehicle/s will back into the automated freeway and reach the incident location through maintenance access points as shown in figure 2.13
Location 2. Emergency vehicle/s can enter the automated freeway using
the nearest on-ramp upstream of the incident and travel on the shoulder to reach the incident site.
Location 3. Emergency vehicle/s can enter the automated freeway via
downstream off-ramp Once the incident is cleared, automation is gradually resumed in a systematic process.
Figure 2.13 Emergency vehicle access options
Concept of Operations
SR 60 Automated Truck Facility Study
32
In Summary As part of the SR-60 Automated Truck Lane Technical Study, three operational concepts were evaluated. These operational concepts include: 1. Check-in and Check out procedures for automated truck lane over the surface
street arterial. 2 Check-in and Check-out procedures for automated truck lanes under the
surface street arterial. 3. Main line Check in and check out procedures. Option 3, Main-line check-in and check-out is preferable based on the operational efficiency, its ability to minimize conflicts between automated and surface street traffic. However, all the three options are workable with some turn restrictions needed for options 1 and 2. All of the three options have been analyzed and translated to typical scale drawings. For the purpose of cost estimation, mainline check-in option has been assumed.
Estimated Cost of Improvements
SR 60 Automated Truck Facility Study
33
SECTION 3. ESTIMATED COST OF IMPROVEMENTS The following paragraphs provide details about the methodology followed by SAI team in order to arrive at the total cost of automated truck facility. The basic approach for estimating costs for the SR-60 Automated Truck Facility Case Study consists of breaking down the total project costs in to the following cost elements.
1. Right-of-Way (ROW) Costs 2. Infrastructure Construction Costs (earthwork, pavement and
structures) 3. Roadway Instrumentation and Communication Costs 4. Design Costs 5. Operation and Maintenance Costs 6. Other Miscellaneous Costs (environmental, signing and striping etc.,)
The above cost elements are individually estimated for the entire length of the project and then added to get the cumulative total cost of the project
3.1 Methodology The following paragraphs provide methodologies used to arrive at the estimated costs for the individual cost elements.
3.1.1 Right-Of-Way (ROW) Costs
The SR-60 study segment traverses two Caltrans District jurisdictional boundaries. In order to arrive at the ROW costs, both Caltrans District 8 (Riverside and San Bernardino Counties) and Caltrans District 7 (Los Angles and Ventura Counties) permits and right of way divisions were contacted to obtain the necessary information. Since SR-60 is a relatively old freeway, as-built plans were not available for the entire length of the project and in places where available, it was not clear that the as-built plans represented the most recent field conditions. As a result, the permits divisions of both the districts suggested the use of aerial photographs for transferring the right-of-way limits on to the aerials.
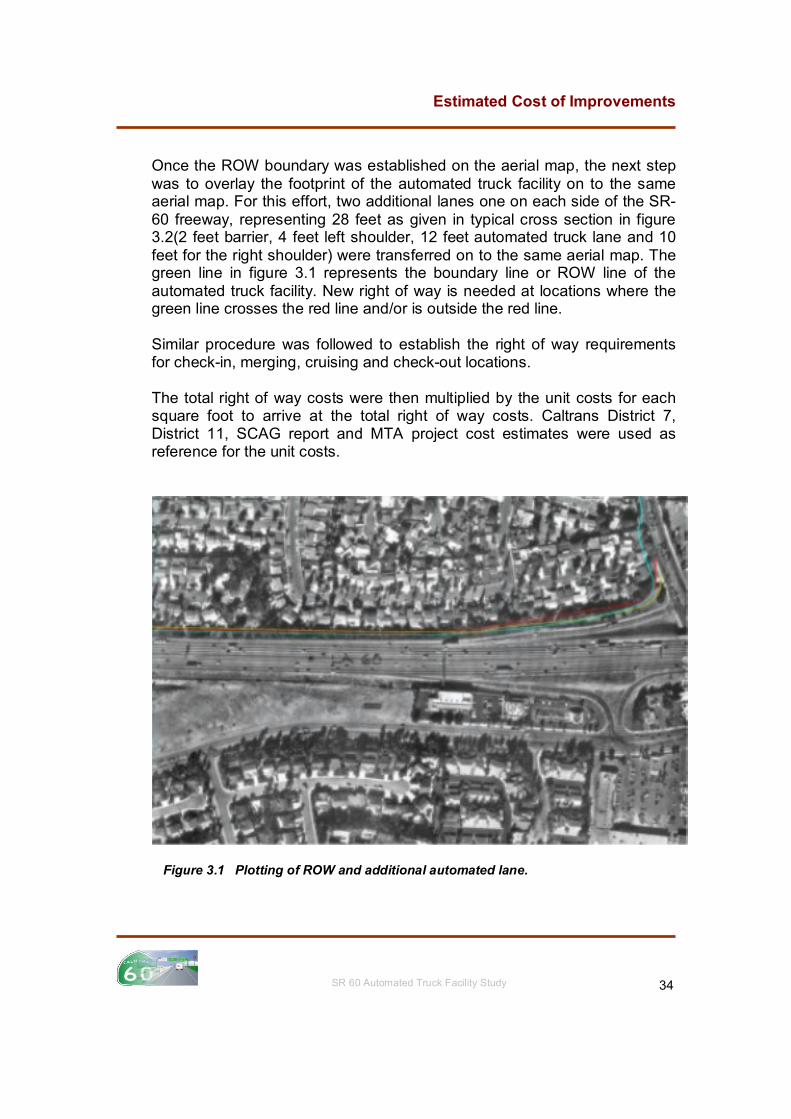
Right of way maps with different scales (1” = 50, 60 and 100’) and aerial photographs with a scale of 1”= 200 feet were collected from both the districts. The red line in figure 3.1 represents the right of way line established based on the data collected from the two districts. The same procedure was used to establish the limits of right of way on the aerials for the entire 37.8 miles of SR-60 from I-710 to I-15.
Estimated Cost of Improvements
SR 60 Automated Truck Facility Study
34
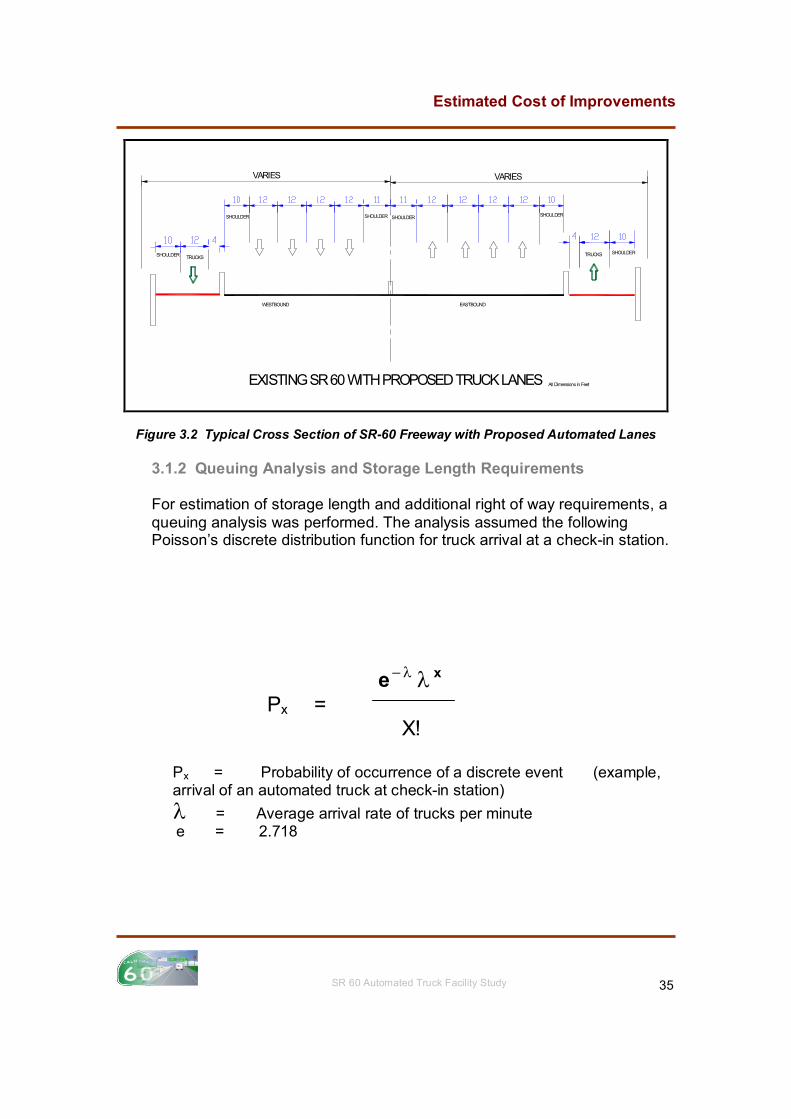
Once the ROW boundary was established on the aerial map, the next step was to overlay the footprint of the automated truck facility on to the same aerial map. For this effort, two additional lanes one on each side of the SR-60 freeway, representing 28 feet as given in typical cross section in figure 3.2(2 feet barrier, 4 feet left shoulder, 12 feet automated truck lane and 10 feet for the right shoulder) were transferred on to the same aerial map. The green line in figure 3.1 represents the boundary line or ROW line of the automated truck facility. New right of way is needed at locations where the green line crosses the red line and/or is outside the red line. Similar procedure was followed to establish the right of way requirements for check-in, merging, cruising and check-out locations. The total right of way costs were then multiplied by the unit costs for each square foot to arrive at the total right of way costs. Caltrans District 7, District 11, SCAG report and MTA project cost estimates were used as reference for the unit costs.
Figure 3.1 Plotting of ROW and additional automated lane.
Estimated Cost of Improvements
SR 60 Automated Truck Facility Study
35
EXISTING SR 60 WITH PROPOSED TRUCK LANES
VARIES
SHOULDER
VARIES
SHOULDER TRUCKS
SHOULDER
WESTBOUND
SHOULDER
All Dimensions in Feet
EASTBOUND
SHOULDER
TRUCKS SHOULDER
Figure 3.2 Typical Cross Section of SR-60 Freeway with Proposed Automated Lanes
3.1.2 Queuing Analysis and Storage Length Requirements
For estimation of storage length and additional right of way requirements, a queuing analysis was performed. The analysis assumed the following Poisson’s discrete distribution function for truck arrival at a check-in station. e
x
Px = X!
Px = Probability of occurrence of a discrete event (example, arrival of an automated truck at check-in station)
= Average arrival rate of trucks per minute e = 2.718

Estimated Cost of Improvements
SR 60 Automated Truck Facility Study
36
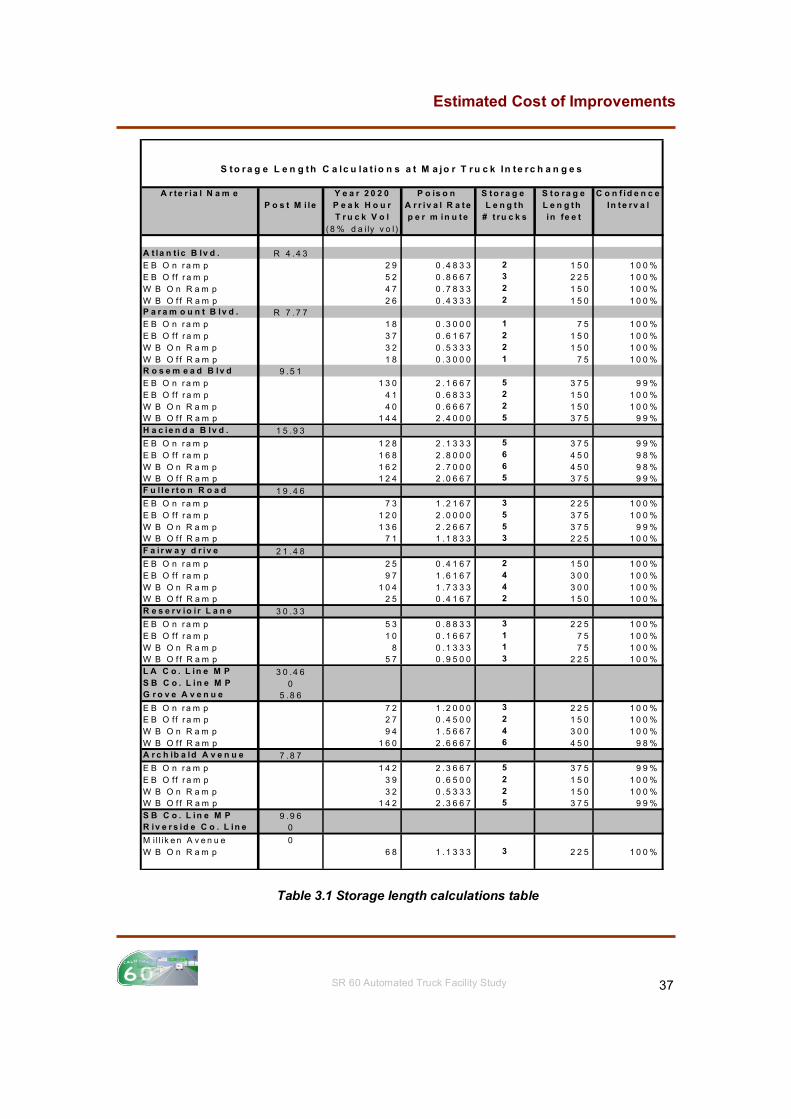
Storage lengths were designed for the worst case scenario. The peak hour truck traffic volumes for the year 2020 were taken from the SCAG report and average arrival rates per minute were computed dividing the peak hour traffic volume by 60 minutes. An average rolling check-in (similar to Pre-PassTM) time of 10 seconds was assumed since the technology will allow for quick check of all the systems and provide green signals to the automated truck. Table 3.1 gives the storage length requirements, which will accommodate trucks up to 100% of the time during the peak hour. A 95% confidence interval or greater is required as per Highway Capacity Manual. Based on the calculations shown in the table, the maximum number of trucks in any given minute is 6. This represents worst peak arrival rate based on year 2020 truck volumes. Assuming a truck length of 75 feet (65’ truck length and 10’ headway), total storage length required for 6 trucks is 450 feet. This requirement is only at two interchanges (Hacienda Blvd and Grove Avenue). Since the check-in occurs at the main-line, it is likely that, there will not be any spill-over effect from the automated lanes since there will be sufficient storage length provided at each check in and check out locations. The off-ramp storage requirement is assumed to be two trucks lengths as per the guidelines provided by PATH. Table 3.1 provides detailed storage length calculations at each of the eleven designated on and off ramps.
Estimated Cost of Improvements
SR 60 Automated Truck Facility Study
37
A r te r ia l N a m e Y e a r 2 0 2 0 P o is o n S t o r a g e S t o ra g e C o n f id e n c eP o s t M i le P e a k H o u r A r r iv a l R a t e L e n g t h L e n g t h In t e rv a l
T r u c k V o l p e r m in u t e # t ru c k s in fe e t
( 8 % d a i ly v o l )
A t la n t ic B lv d . R 4 .4 3E B O n r a m p 2 9 0 .4 8 3 3 2 1 5 0 1 0 0 %E B O ff r a m p 5 2 0 .8 6 6 7 3 2 2 5 1 0 0 %W B O n R a m p 4 7 0 .7 8 3 3 2 1 5 0 1 0 0 %W B O f f R a m p 2 6 0 .4 3 3 3 2 1 5 0 1 0 0 %P a r a m o u n t B lv d . R 7 .7 7E B O n r a m p 1 8 0 .3 0 0 0 1 7 5 1 0 0 %E B O ff r a m p 3 7 0 .6 1 6 7 2 1 5 0 1 0 0 %W B O n R a m p 3 2 0 .5 3 3 3 2 1 5 0 1 0 0 %W B O f f R a m p 1 8 0 .3 0 0 0 1 7 5 1 0 0 %R o s e m e a d B lv d 9 .5 1E B O n r a m p 1 3 0 2 .1 6 6 7 5 3 7 5 9 9 %E B O ff r a m p 4 1 0 .6 8 3 3 2 1 5 0 1 0 0 %W B O n R a m p 4 0 0 .6 6 6 7 2 1 5 0 1 0 0 %W B O f f R a m p 1 4 4 2 .4 0 0 0 5 3 7 5 9 9 %H a c ie n d a B lv d . 1 5 .9 3
E B O n r a m p 1 2 8 2 .1 3 3 3 5 3 7 5 9 9 %E B O ff r a m p 1 6 8 2 .8 0 0 0 6 4 5 0 9 8 %W B O n R a m p 1 6 2 2 .7 0 0 0 6 4 5 0 9 8 %W B O f f R a m p 1 2 4 2 .0 6 6 7 5 3 7 5 9 9 %F u l le r t o n R o a d 1 9 .4 6
E B O n r a m p 7 3 1 .2 1 6 7 3 2 2 5 1 0 0 %E B O ff r a m p 1 2 0 2 .0 0 0 0 5 3 7 5 1 0 0 %W B O n R a m p 1 3 6 2 .2 6 6 7 5 3 7 5 9 9 %W B O f f R a m p 7 1 1 .1 8 3 3 3 2 2 5 1 0 0 %F a i r w a y d r iv e 2 1 .4 8
E B O n r a m p 2 5 0 .4 1 6 7 2 1 5 0 1 0 0 %E B O ff r a m p 9 7 1 .6 1 6 7 4 3 0 0 1 0 0 %W B O n R a m p 1 0 4 1 .7 3 3 3 4 3 0 0 1 0 0 %W B O f f R a m p 2 5 0 .4 1 6 7 2 1 5 0 1 0 0 %R e s e rv io i r L a n e 3 0 .3 3
E B O n r a m p 5 3 0 .8 8 3 3 3 2 2 5 1 0 0 %E B O ff r a m p 1 0 0 .1 6 6 7 1 7 5 1 0 0 %W B O n R a m p 8 0 .1 3 3 3 1 7 5 1 0 0 %W B O f f R a m p 5 7 0 .9 5 0 0 3 2 2 5 1 0 0 %L A C o . L in e M P 3 0 .4 6S B C o . L in e M P 0G r o v e A v e n u e 5 .8 6
E B O n r a m p 7 2 1 .2 0 0 0 3 2 2 5 1 0 0 %E B O ff r a m p 2 7 0 .4 5 0 0 2 1 5 0 1 0 0 %W B O n R a m p 9 4 1 .5 6 6 7 4 3 0 0 1 0 0 %W B O f f R a m p 1 6 0 2 .6 6 6 7 6 4 5 0 9 8 %A r c h ib a ld A v e n u e 7 .8 7
E B O n r a m p 1 4 2 2 .3 6 6 7 5 3 7 5 9 9 %E B O ff r a m p 3 9 0 .6 5 0 0 2 1 5 0 1 0 0 %W B O n R a m p 3 2 0 .5 3 3 3 2 1 5 0 1 0 0 %W B O f f R a m p 1 4 2 2 .3 6 6 7 5 3 7 5 9 9 %
S B C o . L in e M P 9 .9 6R iv e r s id e C o . L in e 0
M i l l ik e n A v e n u e 0W B O n R a m p 6 8 1 .1 3 3 3 3 2 2 5 1 0 0 %
S to r a g e L e n g th C a lc u la t io n s a t M a jo r T r u c k In te r c h a n g e s
Table 3.1 Storage length calculations table
Estimated Cost of Improvements
SR 60 Automated Truck Facility Study
38
3.1.3 Infrastructure Construction Costs Infrastructure costs include all physical roadway construction costs to accommodate one automated truck lane in each direction along SR-60. The physical roadway costs include but not limited to the following: Pavement costs for 28 feet wide standard dedicated truck lane (12 travel
lane, 10 right shoulder, 4 feet left shoulder and 2 feet barrier) Structural costs at grade separated interchanges and at other locations
where clearance is required Earthwork for cut and fill sections at 1:2 slope ratio where applicable Facilities and electronics at check-in and check-out locations Roadway electronics and communication infrastructure for automation Lighting, signing and striping The unit prices for estimation of pavement and structural costs were taken from SCAG report, and Caltrans Districts 7, 12 and MTA published costs. Roadway electronics and communication costs (including facilities costs at check-in and check-out locations) were derived from the guidelines provided in the request for proposal (RFP) and using best engineering estimates. Caltrans provided the following guidelines for the roadway electronics and instrumentation in the RFP: a. Cost of magnetic reference markers = $5,000 per mile b. Vehicle to vehicle and vehicle to roadside DSRC communication system @ every 300 meters = $5,000 c. Engineers Estimate of On-board electronic equipment (if mass produced) = $5,000 assuming 30,000 truck users and 100% equipped. Costs for estimation of earthwork were based on cut and fill sections (actual site observations) and scaled maps and engineers estimates. Costs for lighting and signing and striping are included in the conservative 30% contingency. The following are the additional assumptions made to arrive at estimated roadway infrastructure costs.
1. Automated truck lane in each direction is assumed to be on the outside of the existing SR-60 mixed flow lanes
Estimated Cost of Improvements
SR 60 Automated Truck Facility Study
39
2. One automated truck lane in each direction is sufficient to carry year 2020 traffic.
3. Rolling check-in is assumed for the automated truck check-in.
4. A main line check-in site is located at each designated on-ramp to
ensure that a vehicle is properly equipped with the necessary equipment for the automated trip and has an intended exit
5. A check-in site will also include provisions for trucks that failed the
safe check-in to return to safely return to the mixed flow lanes
6. A check-out site is located at designated off-ramps (11 along the SR-60 project corridor) to verify that the driver has regained the control of the vehicle
7. A rolling check-in is assumed which minimizes the need for long
storage requirements during check-in procedures. However, as a conservative measure, storage requirements for three trucks based on expected peak hour truck traffic (SCAG report) is assumed at each check-in location.
8. A storage requirement for two trucks is assumed at check-out off-
ramps. 9. Roadside to vehicle communication is via next generation of
dedicated short-range communications (DSRC) in the range of 5.9 GHz.
10. The DSRC devices are embedded in to the pavement at every 300
meters on the roadway and at each on and off-ramp locations
11. Peak hour volumes are assumed to be 8% of year 2020 truck traffic
12. Trucks are expected to arrive at check-in site according to the Poison distribution function
13. A rolling check-in for each truck is assumed with 10 second
duration for each check-in
14. All other cost not identified in the detailed estimate are assumed to be included in the conservative contingent cost of 30%.
Estimated Cost of Improvements
SR 60 Automated Truck Facility Study
40
3.1.4 Design costs It is general practice in the field of transportation engineering, that design costs are estimated as a percentage of the project costs at the feasibility study level. The percentage varies depending on the size and complexity of the project. Since automated truck facility is a complex project with many unresolved design issues, a design cost of 12 percent is assumed to be appropriate.
3.1.5 Operation and Maintenance Costs As in the case of design costs, operation and maintenance cost will be assumed as a percentage of total construction costs. 3.1.6 Miscellaneous/Contingent Costs These costs are included as a contingency item. Since there are many design, implementation and environmental issues that can be identified only during the design and construction phases of the project, it is imperative that a cost cushion or contingency be provided, as a safety factor.
3.2 Unit Cost Assumptions The following table provides unit costs for the estimation of total project costs for the SR-60 automated truck study. These costs were taken for the most part from SCAG report. For the purpose of Automated Truck Study, a lane mile is considered as 28 feet wide automated roadway which is one mile long. The 28 feet width includes travel lane of 12 feet, 4 feet left shoulder and 10 feet right shoulder as shown in the cross section in figure 3.2
Item Description Unit of Measurement
Cost in ‘000 (2000 base year)
Shift/Realign Existing Ramp Ramp 3,490 New Ramp (at grade) Ramp 2,990 Add lane under OC (no structure impacts) Lane Mile 2,585 Add lane under OC (new structure) Lane Mile 6,368 Add lane under OC (modify structure use tie backs) Lane Mile 2,950 Add lane over UC Lane Mile 16,682 Add lane at grade Lane Mile 2,585 Add lane (in fill section) Lane Mile 13,260 Add Lane (in cut section) Lane Mile 14,616 Add structure over OC Lane mile 32,030 Remove and Replace Noise Barrier Mile 2,415
Evaluation
SR 60 Automated Truck Facility Study
41
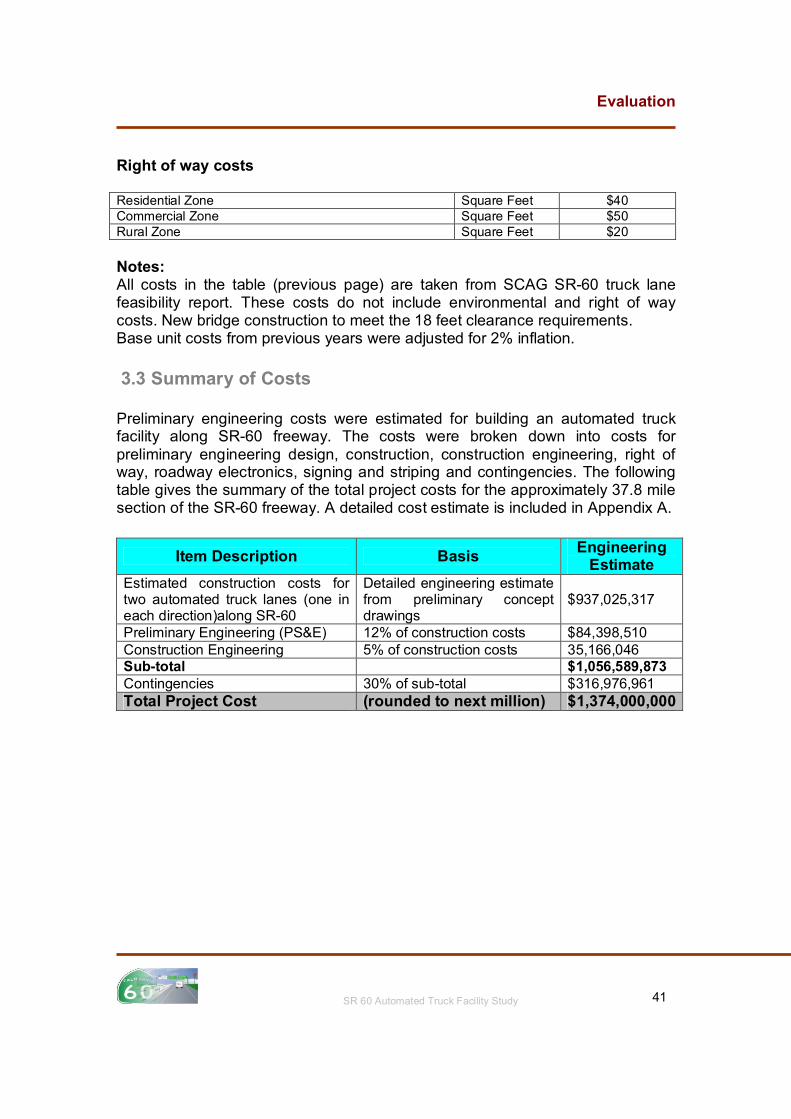
Right of way costs Residential Zone Square Feet $40 Commercial Zone Square Feet $50 Rural Zone Square Feet $20 Notes: All costs in the table (previous page) are taken from SCAG SR-60 truck lane feasibility report. These costs do not include environmental and right of way costs. New bridge construction to meet the 18 feet clearance requirements. Base unit costs from previous years were adjusted for 2% inflation.
3.3 Summary of Costs Preliminary engineering costs were estimated for building an automated truck facility along SR-60 freeway. The costs were broken down into costs for preliminary engineering design, construction, construction engineering, right of way, roadway electronics, signing and striping and contingencies. The following table gives the summary of the total project costs for the approximately 37.8 mile section of the SR-60 freeway. A detailed cost estimate is included in Appendix A.
Item Description Basis Engineering
Estimate Estimated construction costs for two automated truck lanes (one in each direction)along SR-60
Detailed engineering estimate from preliminary concept drawings
$937,025,317
Preliminary Engineering (PS&E) 12% of construction costs $84,398,510 Construction Engineering 5% of construction costs 35,166,046 Sub-total $1,056,589,873 Contingencies 30% of sub-total $316,976,961 Total Project Cost (rounded to next million) $1,374,000,000
Evaluation
SR 60 Automated Truck Facility Study
42
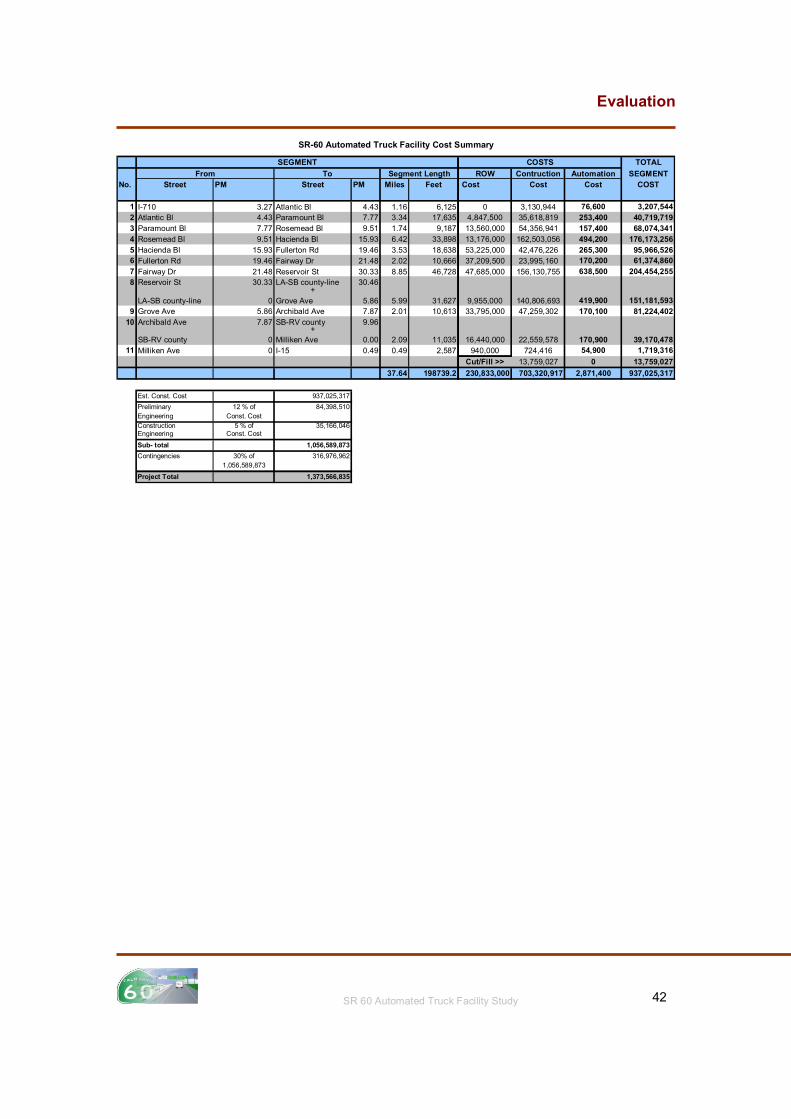
TOTAL
ROW Contruction SEGMENTNo. Street PM Street PM Miles Feet Cost Cost Cost COST
1 I-710 3.27 Atlantic Bl 4.43 1.16 6,125 0 3,130,944 76,600 3,207,5442 Atlantic Bl 4.43 Paramount Bl 7.77 3.34 17,635 4,847,500 35,618,819 253,400 40,719,7193 Paramount Bl 7.77 Rosemead Bl 9.51 1.74 9,187 13,560,000 54,356,941 157,400 68,074,3414 Rosemead Bl 9.51 Hacienda Bl 15.93 6.42 33,898 13,176,000 162,503,056 494,200 176,173,2565 Hacienda Bl 15.93 Fullerton Rd 19.46 3.53 18,638 53,225,000 42,476,226 265,300 95,966,5266 Fullerton Rd 19.46 Fairway Dr 21.48 2.02 10,666 37,209,500 23,995,160 170,200 61,374,8607 Fairway Dr 21.48 Reservoir St 30.33 8.85 46,728 47,685,000 156,130,755 638,500 204,454,2558 Reservoir St 30.33 LA-SB county-line 30.46
+LA-SB county-line 0 Grove Ave 5.86 5.99 31,627 9,955,000 140,806,693 419,900 151,181,593
9 Grove Ave 5.86 Archibald Ave 7.87 2.01 10,613 33,795,000 47,259,302 170,100 81,224,40210 Archibald Ave 7.87 SB-RV county 9.96
+SB-RV county 0 Milliken Ave 0.00 2.09 11,035 16,440,000 22,559,578 170,900 39,170,478
11 Milliken Ave 0 I-15 0.49 0.49 2,587 940,000 724,416 54,900 1,719,316
Cut/Fill >> 13,759,027 0 13,759,027
37.64 198739.2 230,833,000 703,320,917 2,871,400 937,025,317
Est. Const. Cost 937,025,317
Preliminary 12 % of 84,398,510Engineering Const. Cost
Construction 5 % of 35,166,046Engineering Const. Cost
Sub- total 1,056,589,873
Contingencies 30% of 316,976,9621,056,589,873
Project Total 1,373,566,835
SR-60 Automated Truck Facility Cost Summary
SEGMENT COSTS
From To Segment Length Automation
Evaluation
SR 60 Automated Truck Facility Study
43
SECTION 4. EVALUATION OF AUTOMATED TRUCK LANE
4.1 Introduction The objective of this chapter is to perform cost evaluation of the automated truck lanes for the 37.8 mile segment of the SR-60 freeway. The costs will be evaluated under the following:
Roadway costs
Operation and Maintenance/Life Cycle Costs
Net Present Worth of Costs (C) Net present worth of benefits (B)
4.2 Roadway Costs: These are physical roadway construction costs. For the automated truck lanes this cost includes roadway instrumentation in addition to construction costs. Based on the cost estimation carried out in the previous chapter, the total physical roadway and instrumentation cost of automated facility is $1.373 Billion. 4.3 Operation and Maintenance (O and M) Costs Operation and maintenance costs are estimated as a percentage of the total project cost. For conventional truck lane this cost is estimated at 3% of construction costs over a 20 year period. The same figure is assumed for automated truck facility for two reasons. One, the cost of roadway electronics and instrumentation makes the operation and maintenance costs higher. Two, because of the precise lateral position and tracking of the vehicle, the pavement rehabilitation costs are less. This larger cost has the effect of nullifying increased costs due to roadway electronics.
4.4 Net Present Worth of Costs The following conditions are assumed in the calculation of the net present worth of costs.
Intangible costs were not included Present average interest rate of 6% is assumed to calculate the present
value 20 year project life or life cycles
Evaluation
SR 60 Automated Truck Facility Study
44
Present worth is calculated using the following formula. Net present worth of costs = P + A [(1+i)n – 1]
[i(1+i)n] Where P = Present worth n = Number of years/expected life A = Annual O & M costs i = Discount rate
4.5 Net Present Worth of Benefits Roadway is assumed to have sufficient capacity to carry the year 2020 traffic. In order to estimate the net present worth of benefits, only tangible benefits are estimated . Tangible benefits include the following:
1. Reduced delay compared to the existing SR-60 facility 2. Higher speeds compared to the existing SR-60 facility 3. Reduced emission costs – carbon monoxide, oxides of nitrogen and
Hydro Carbons. The above benefits are estimated based on the difference between average peak hour speeds of 20 miles per hour (year 2025, MTA 2001 Long Range Plan for Los Angeles) and the proposed dedicated truck lane speeds of 55 miles per hour. This change in speed will reduce the current travel time for the 37.8 mile project study segment by 71 minutes per truck during the peak period. There will be additional delay savings due to reduced number of incidents on the automated facility. 4.6 Additional Benefits Automated facility has the following benefits
Reduced number of incidents Reduced pavement rehabilitation costs due to precise lateral position
and vehicle tracking Improved fuel efficiency due to reduced aerodynamic drag on the
platoon. Because of lack of sufficient data and to arrive at a conservative cost benefit calculation, the above benefits are not included in the calculation of net present worth of benefits. The following formula is used for the calculation of net present worth of benefits.
Evaluation
SR 60 Automated Truck Facility Study
45
Net present worth of Benefits = A [(1+i)n – 1] [i(1+i)n]
Where A = Accrued annual benefits n = Number of years/expected life i = Discount rate For the calculation of benefits due to reduction of delay and emissions the following standards unit costs are used. The unit costs for delay are based Caltrans FETSIM program (adjusted for trucks) and unit costs for emissions are taken from US Department of Transportation (Bureau of Transportation Statistics) publications. A reference list is given on page 50 Truck traffic volumes for the peak period (3 hours in the AM and 4 hours in the PM) were taken from SCAG’s “SR-60 Truck Lane Feasibility Study” Final Report dated February 2001. Unit cost of vehicle delay = $ 0.36/minute Unit cost of a vehicle stop = $ 0.12/stop Cost of one ton of Hydrocarbons = $ 4455/ton Cost of one ton of Oxides of Nitrogen = $10,439/ton Cost of one ton of Carbon Monoxide = $ 15.21/ton Using the above factors, a benefit cost analysis was carried out using a software program developed for Los Angeles County Metropolitan Transportation Authority in April of 2003 by Sarakki Associates Inc. Based on the B/C analysis using the software, the following table gives the summary evaluation of the SR-60 project alternatives.
Evaluation
SR 60 Automated Truck Facility Study
46
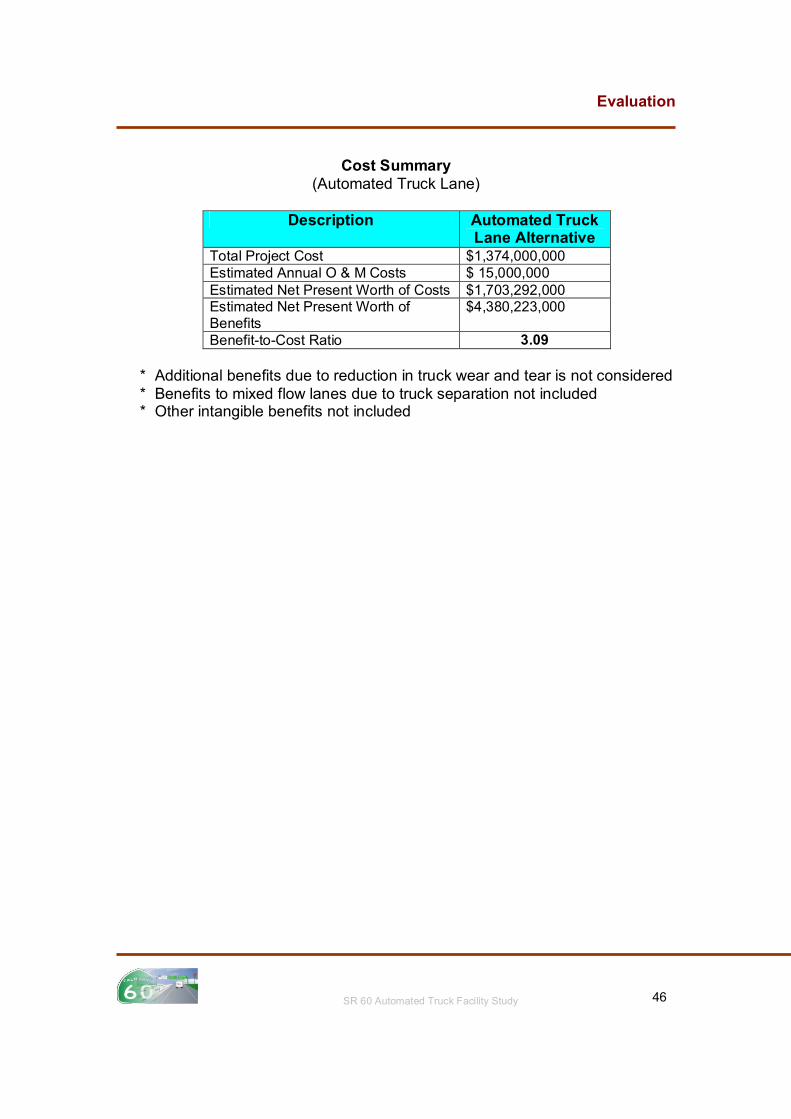
Cost Summary
(Automated Truck Lane)
Description Automated Truck Lane Alternative
Total Project Cost $1,374,000,000 Estimated Annual O & M Costs $ 15,000,000 Estimated Net Present Worth of Costs $1,703,292,000 Estimated Net Present Worth of Benefits
$4,380,223,000
Benefit-to-Cost Ratio 3.09
* Additional benefits due to reduction in truck wear and tear is not considered * Benefits to mixed flow lanes due to truck separation not included * Other intangible benefits not included
Evaluation
SR 60 Automated Truck Facility Study
47
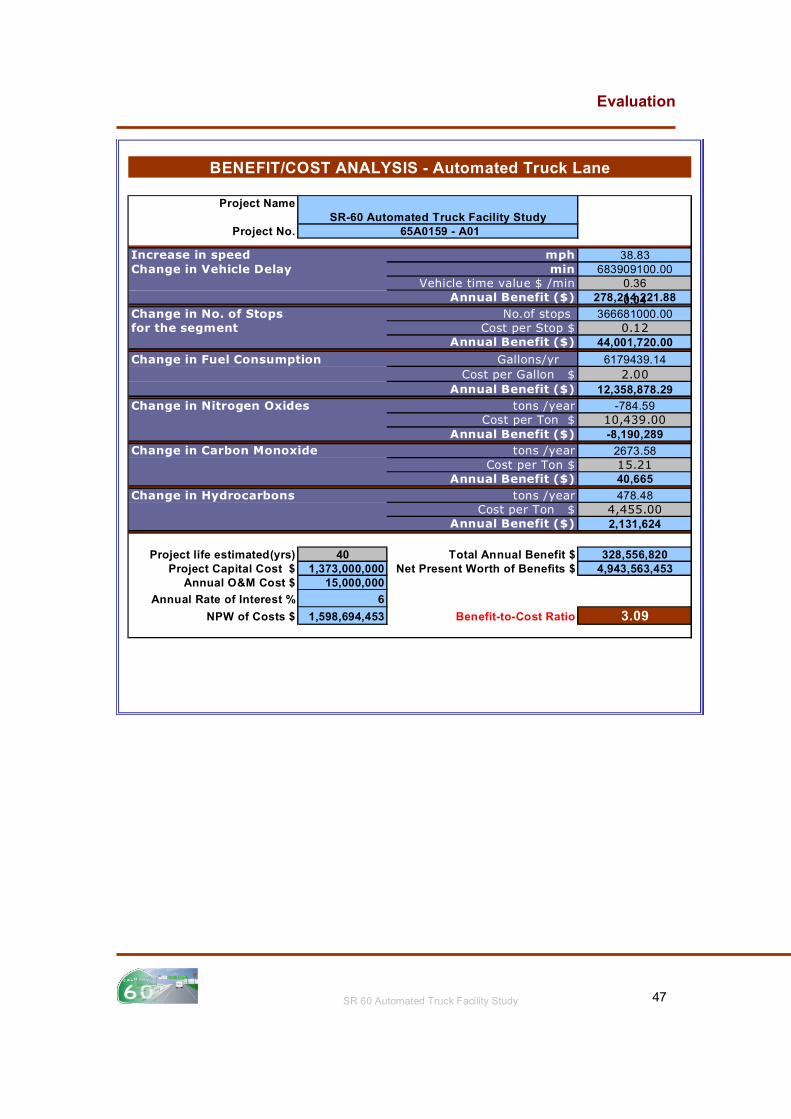
Project Name
Project No.
Increase in speed mph 38.83Change in Vehicle Delay min 683909100.00
0.36278,214,221.880.04
Change in No. of Stops 366681000.00for the segment 0.12
44,001,720.00
Change in Fuel Consumption Gallons/yr 6179439.142.00
12,358,878.29
Change in Nitrogen Oxides tons /year -784.5910,439.00-8,190,289
Change in Carbon Monoxide tons /year 2673.5815.2140,665
Change in Hydrocarbons tons /year 478.484,455.002,131,624
Project life estimated(yrs) 40 328,556,820 Project Capital Cost $ 1,373,000,000 4,943,563,453
Annual O&M Cost $ 15,000,000
Annual Rate of Interest % 6 3.09NPW of Costs $ 1,598,694,453 3.09
SR-60 Automated Truck Facility Study 65A0159 - A01
BENEFIT/COST ANALYSIS - Automated Truck Lane
Annual Benefit ($)
No.of stops
Vehicle time value $ /minAnnual Benefit ($)
Annual Benefit ($)
Cost per Stop $
Cost per Gallon $
Cost per Ton $
Cost per Ton $
Cost per Ton $
Annual Benefit ($)
Annual Benefit ($)
Annual Benefit ($)
Total Annual Benefit $
Benefit-to-Cost Ratio
Net Present Worth of Benefits $
Conclusions
SR 60 Automated Truck Facility Study
48
Conclusions
A cost analysis was performed for the automated truck lanes, for the SR-60 case segment to carry the year 2020 projected truck volumes. . Based on the scaled concept drawings, estimated costs for the automated truck lanes is $1.37 billion. Because of the higher pipe line capacity of the automated truck traffic lane, only one lane is required in each direction to carry the year 2020 traffic. The benefit-to-cost ratio of the automated truck lane is 3.09 for carrying the year 2020 truck volumes. This is primarily because of the low initial capital cost of automated truck lanes ($1.37 billion).
References
SR 60 Automated Truck Facility Study
49
References
1. SR-60 Truck Lane Feasibility Study, Final Report, February 2001.
Southern California Association of Governments 2. University of California, Berkeley. Program for Advanced Transit and
Highways 3. The Freight Story, November 2002. USDOT FHWA. 4. 2001 Long range Transportation Plan for Los Angeles County. Los
Angeles Metropolitan Transportation Authority. 5. SR 60 Aerial photographs. Caltrans District 7 and District 8 7. SR 60 ROW maps. Caltrans District 7 and District 8 8. Mobile5 Vehicle Emission Model. Environmental Protection Agency EPA 9. Estimation and Evaluation of Full Marginal Costs of Highway
Transportation. Volume 4 Number 1. Bureau of Transportation Statistics, USDOT.
SR 60 Automated Truck Facility Study
50
Detailed Cost Estimate
Cost Estimate
SR 60 Automated Truck Facility Study
51
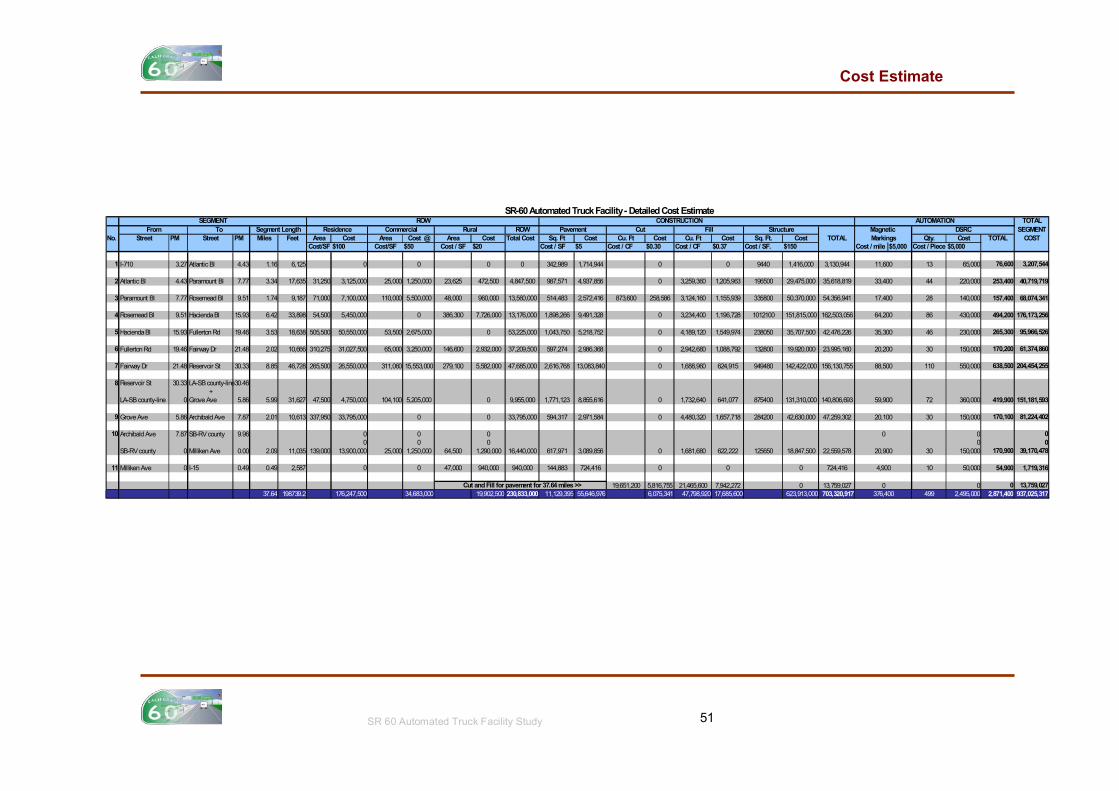
TOTALROW SEGMENT
No. Street PM Street PM Miles Feet Area Cost Area Cost @ Area Cost Total Cost Sq. Ft Cost Cu. Ft Cost Cu. Ft Cost Sq. Ft. Cost TOTAL Qty. Cost TOTAL COSTCost/SF $100 Cost/SF $50 Cost / SF $20 Cost / SF $5 Cost / CF $0.30 Cost / CF $0.37 Cost / SF. $150 Cost / mile $5,000 Cost / Piece $5,000
1 I-710 3.27 Atlantic Bl 4.43 1.16 6,125 0 0 0 0 342,989 1,714,944 0 0 9440 1,416,000 3,130,944 13 65,000 76,600 3,207,544
2 Atlantic Bl 4.43 Paramount Bl 7.77 3.34 17,635 31,250 3,125,000 25,000 1,250,000 23,625 472,500 4,847,500 987,571 4,937,856 0 3,259,360 1,205,963 196500 29,475,000 35,618,819 44 220,000 253,400 40,719,719
3 Paramount Bl 7.77 Rosemead Bl 9.51 1.74 9,187 71,000 7,100,000 110,000 5,500,000 48,000 960,000 13,560,000 514,483 2,572,416 873,600 258,586 3,124,160 1,155,939 335800 50,370,000 54,356,941 28 140,000 157,400 68,074,341
4 Rosemead Bl 9.51 Hacienda Bl 15.93 6.42 33,898 54,500 5,450,000 0 386,300 7,726,000 13,176,000 1,898,266 9,491,328 0 3,234,400 1,196,728 1012100 151,815,000 162,503,056 86 430,000 494,200 176,173,256
5 Hacienda Bl 15.93 Fullerton Rd 19.46 3.53 18,638 505,500 50,550,000 53,500 2,675,000 0 53,225,000 1,043,750 5,218,752 0 4,189,120 1,549,974 238050 35,707,500 42,476,226 46 230,000 265,300 95,966,526
6 Fullerton Rd 19.46 Fairway Dr 21.48 2.02 10,666 310,275 31,027,500 65,000 3,250,000 146,600 2,932,000 37,209,500 597,274 2,986,368 0 2,942,680 1,088,792 132800 19,920,000 23,995,160 30 150,000 170,200 61,374,860
7 Fairway Dr 21.48 Reservoir St 30.33 8.85 46,728 265,500 26,550,000 311,060 15,553,000 279,100 5,582,000 47,685,000 2,616,768 13,083,840 0 1,688,960 624,915 949480 142,422,000 156,130,755 110 550,000 638,500 204,454,255
8 Reservoir St 30.33 LA-SB county-line30.46+
LA-SB county-line 0 Grove Ave 5.86 5.99 31,627 47,500 4,750,000 104,100 5,205,000 0 9,955,000 1,771,123 8,855,616 0 1,732,640 641,077 875400 131,310,000 140,806,693 72 360,000 419,900 151,181,593
9 Grove Ave 5.86 Archibald Ave 7.87 2.01 10,613 337,950 33,795,000 0 0 33,795,000 594,317 2,971,584 0 4,480,320 1,657,718 284200 42,630,000 47,259,302 30 150,000 170,100 81,224,402
10 Archibald Ave 7.87 SB-RV county 9.96 0 0 0 0 00 0 0 0 0
SB-RV county 0 Milliken Ave 0.00 2.09 11,035 139,000 13,900,000 25,000 1,250,000 64,500 1,290,000 16,440,000 617,971 3,089,856 0 1,681,680 622,222 125650 18,847,500 22,559,578 30 150,000 170,900 39,170,478
11 Milliken Ave 0 I-15 0.49 0.49 2,587 0 0 47,000 940,000 940,000 144,883 724,416 0 0 0 724,416 10 50,000 54,900 1,719,316
Cut and Fill for pavement for 37.64 miles >> 19,651,200 5,816,755 21,465,600 7,942,272 0 13,759,027 0 0 13,759,02737.64 198739.2 176,247,500 34,683,000 19,902,500 230,833,000 11,129,395 55,646,976 6,075,341 47,798,920 17,685,600 623,913,000 703,320,917 499 2,495,000 2,871,400 937,025,317
0376,400
AUTOMATION
20,100
0
20,900
4,900
88,500
59,900
64,200
35,300
20,200
33,400
17,400
DSRCMagnetic Markings
11,600
Pavement Cut Fill Structure
SR-60 Automated Truck Facility - Detailed Cost Estimate
From To Segment LengthROWSEGMENT
Residence Commercial RuralCONSTRUCTION
SR 60 Automated Truck Facility Study
52
No Pg Section Reviewer Client Comment SAI Response 1
1
1
Steven W. Sowers
A prior study concludes that truck bans would not significantly reduce freeway congestion. Trucks are not a large percentage of the total vehicle volume. It is somewhat misleading to say nineteen percent trucks is causing severe congestion. That is not the normal truck volume. It is probably a localized peak count. Better to give a range of values, say 7%-19% during truck peak hours. Trucks peak different than automobile and total traffic peak. I believe if all trucks were removed congestion would remain. Lets not sell this idea as a traffic congestion solution
This comment has been incorporated in the final document.
2
1
1
Steven W. Sowers
Fourth paragraph – simplify the language. Drop “two times less.” Say one third. Restate the benefit cost ratio with specifics
This comment has been incorporated in the final document.
3
3
1
Steven W. Sowers
Page 3 – the graph is somewhat deceptive because the x axis is compressed. Show how population growth and VMT are historically related. Highway speed?: Where did this linear estimate come from? Our HIComp report studies give the real picture. Its probably worst than this illustration. It should be stated that Los Angeles County is not the only county this corridor is located in.
Good comment and well taken. The objective of the graphs is to show that the average speeds are falling over time because of increased demand. Increased demand is a function of population growth. We will be very happy to incorporate the graphics from HIComp report. It is noted that a small project segment falls within Riverside County.
4
3
1
Steven W. Sowers
I disagree that there is a “tremendous amount of lateral and longitudinal spacing between vehicles.” The headways are there for a margin of safety. Lane width is set in federal and state standards. The argument for both dimensions is not adjusted in the proposed design, so what’s the point? Why not aggressively reduce lane width to 10 feet and place turn outs every 2,000 feet for broken down vehicles. It could be said that a three vehicle platoon wastes a “tremendous amount of longitudinal spacing between platoons.”
Good point. The lateral and longitudinal (intra and inter-platoon) spacing was provided as guidelines in the SOW. SAI study conforms to theses guidelines. Any changes to the guidelines will constitute a different analysis and end result which is outside the scope of work.
5
9
2
Steven W. Sowers
Page 9 Build to FHWA standards then restripe to two lanes. One 10’ lane for automated trucks, one 12’ lane for conventional trucks. Drop the entry and exit devices. Post “Truckway” or “Trucks Only.”
The assumptions made are in accordance with the guidelines provided in the SOW.
6
10
2
Steven W. Sowers
Two truck storage seems too small. Rethink the check-in, check out.
The two truck storage is for the trucks which fail the check-out procedures. The other trucks do not need to stop at the check out. Guidelines provided in SOW
SR 60 Automated Truck Facility Study
53
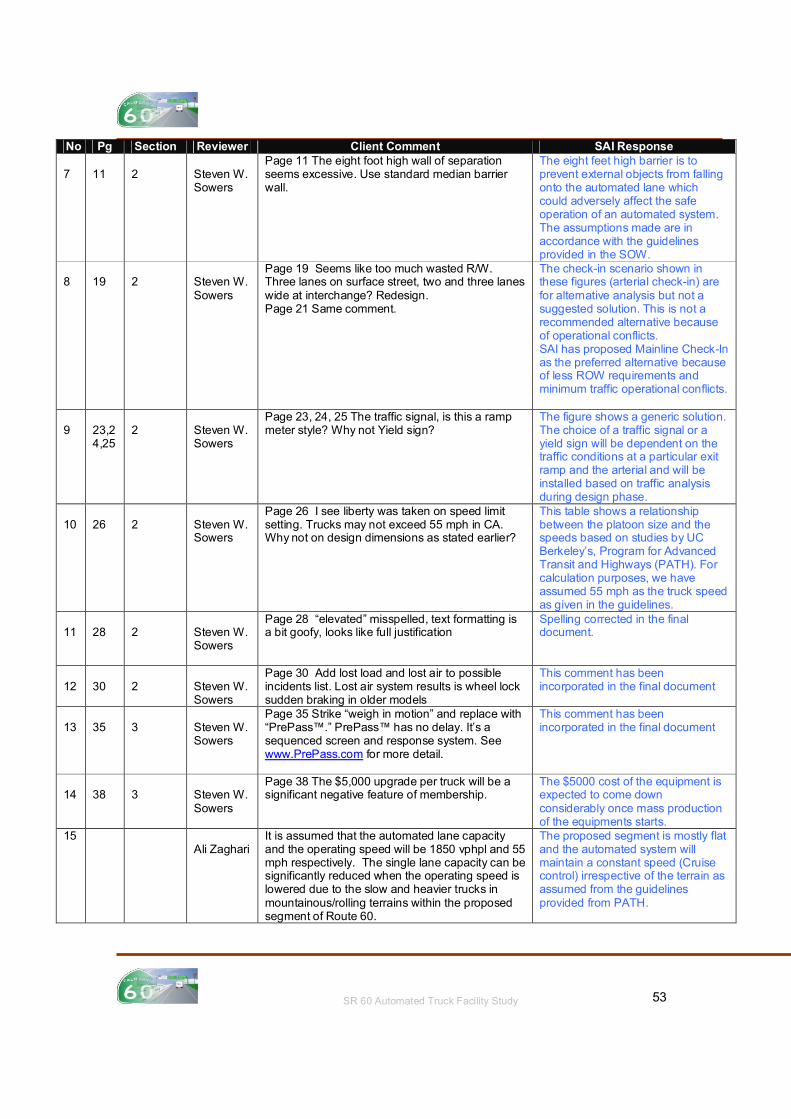
No Pg Section Reviewer Client Comment SAI Response 7
11
2
Steven W. Sowers
Page 11 The eight foot high wall of separation seems excessive. Use standard median barrier wall.
The eight feet high barrier is to prevent external objects from falling onto the automated lane which could adversely affect the safe operation of an automated system. The assumptions made are in accordance with the guidelines provided in the SOW.
8
19
2
Steven W. Sowers
Page 19 Seems like too much wasted R/W. Three lanes on surface street, two and three lanes wide at interchange? Redesign. Page 21 Same comment.
The check-in scenario shown in these figures (arterial check-in) are for alternative analysis but not a suggested solution. This is not a recommended alternative because of operational conflicts. SAI has proposed Mainline Check-In as the preferred alternative because of less ROW requirements and minimum traffic operational conflicts.
9
23,24,25
2
Steven W. Sowers
Page 23, 24, 25 The traffic signal, is this a ramp meter style? Why not Yield sign?
The figure shows a generic solution. The choice of a traffic signal or a yield sign will be dependent on the traffic conditions at a particular exit ramp and the arterial and will be installed based on traffic analysis during design phase.
10
26
2
Steven W. Sowers
Page 26 I see liberty was taken on speed limit setting. Trucks may not exceed 55 mph in CA. Why not on design dimensions as stated earlier?
This table shows a relationship between the platoon size and the speeds based on studies by UC Berkeley’s, Program for Advanced Transit and Highways (PATH). For calculation purposes, we have assumed 55 mph as the truck speed as given in the guidelines.
11
28
2
Steven W. Sowers
Page 28 “elevated” misspelled, text formatting is a bit goofy, looks like full justification
Spelling corrected in the final document.
12
30
2
Steven W. Sowers
Page 30 Add lost load and lost air to possible incidents list. Lost air system results is wheel lock sudden braking in older models
This comment has been incorporated in the final document
13
35
3
Steven W. Sowers
Page 35 Strike “weigh in motion” and replace with “PrePass™.” PrePass™ has no delay. It’s a sequenced screen and response system. See www.PrePass.com for more detail.
This comment has been incorporated in the final document
14
38
3
Steven W. Sowers
Page 38 The $5,000 upgrade per truck will be a significant negative feature of membership.
The $5000 cost of the equipment is expected to come down considerably once mass production of the equipments starts.
15
Ali Zaghari
It is assumed that the automated lane capacity and the operating speed will be 1850 vphpl and 55 mph respectively. The single lane capacity can be significantly reduced when the operating speed is lowered due to the slow and heavier trucks in mountainous/rolling terrains within the proposed segment of Route 60.
The proposed segment is mostly flat and the automated system will maintain a constant speed (Cruise control) irrespective of the terrain as assumed from the guidelines provided from PATH.
SR 60 Automated Truck Facility Study
54
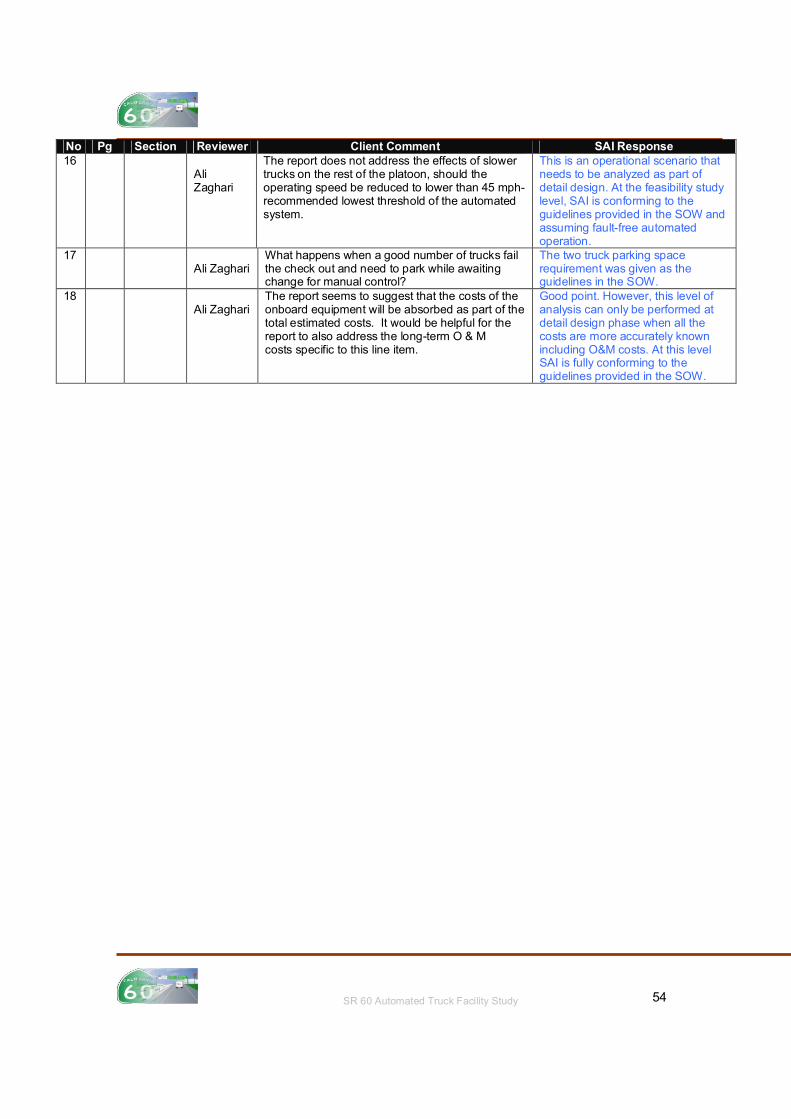
No Pg Section Reviewer Client Comment SAI Response 16
Ali Zaghari
The report does not address the effects of slower trucks on the rest of the platoon, should the operating speed be reduced to lower than 45 mph-recommended lowest threshold of the automated system.
This is an operational scenario that needs to be analyzed as part of detail design. At the feasibility study level, SAI is conforming to the guidelines provided in the SOW and assuming fault-free automated operation.
17 Ali Zaghari
What happens when a good number of trucks fail the check out and need to park while awaiting change for manual control?
The two truck parking space requirement was given as the guidelines in the SOW.
18 Ali Zaghari
The report seems to suggest that the costs of the onboard equipment will be absorbed as part of the total estimated costs. It would be helpful for the report to also address the long-term O & M costs specific to this line item.
Good point. However, this level of analysis can only be performed at detail design phase when all the costs are more accurately known including O&M costs. At this level SAI is fully conforming to the guidelines provided in the SOW.

![LRFD - dot.ca.gov fileLRFD MTD 1-29 • DECEMBER 2014 Attachment 3 [Sample Structure Type Selection Memo and Report] STATE OF CALIFORNIA DEPARTMENT OF TRANSPORTATION](https://static.fdocuments.net/doc/165x107/5cb15edb88c99342708b493c/lrfd-dotca-mtd-1-29-december-2014-attachment-3-sample-structure-type-selection.jpg)