
STATE OF CALIFORNIA· DEPARTMENT OF TRANSPORTATION ... · Data for analyzing pipeline incidents...
161
STATE OF CALIFORNIA· DEPARTMENT OF TRANSPORTATION ADA Notice TECHNICAL REPORT DOCUMENTATION PAGE For individuals with senso disabilities, this document is available in alternate rmats. For inrmation call (916) 654-6410 or TDD (916) 654-3880 or write TR0003 (REV 10/98) Records and Forms Management, 1120 N Street, MS-89, Sacramento, CA 95814. 1. REPORT NUMBER CA19-3106 2. GOVERNMENT ASSOCIATION NUMBER 3. RECIPIENT'S CATALOG NUMBER 4. TITLE D SUBTITLE Encasement Research: Effective Utility Encasement Criteria and Methods 5. REPORT DATE 07/08/2019 6. PERFORMING ORGANIZATION CODE 7. AUTHOR Shailesh Chandra and Hung Nguyen 8. PERFORMING ORGANIZATION REPORT NO. 9. PERFORMING ORGANIZATION NAME AND ADDRESS Califoia State University, Lo Beach Research Foundation Long Beach, CA 90840 10. WORK UNIT NUMBER 11. CONTRACT OR GRANT NUMBER 65A0664 12. SPONSORING AGENCY AND ADDRESS Califoia Deparent of Transportation Division of Research, Iovation, and System Inrmation 1727 30th Street, MS-83, Sacramento, CA 95816 13. TYPE OF REPORT AND PERIOD COVERED Final Report 14. SPONSORING AGENCY CODE 15. SUPPLEMENTARY NOTES 16.ABSTRACT Underound natural gas pipeline leak es at roadway crossi s result in jeopardizg safety, incur huge costs for repair, disrupt traffic operations and create environmental hazard situations. In 2018, there were 632 pipeline incidents in the United States with reported costs in economic damages of almost $900 million. These costs were more an previous three years of cumulative costs of damages resulti from pipeline incidents in the country. While talities were limited to those from gas pipeline leakages, injuries were the hiest from all previous five years of pipeline incident data reported in the nation. Significant number of incidenʦ in 2018 resulted om excavation damages (namely, operator/conactor excavation damage, previous damage due to excavation or third-par excavation damage) and other outside rce damage to pipelines. Thus, one of the primary cus of this research was to identify engineering practices at have been adopted across various states of the nation to protect gas pipelines from incidents that lead to leakages. Specific focus is on evaluati pipeline protection with encasement, from excavation related damages. The research approach consisted of obtaini inrmation related to encasement by identifying reliable sources through web searches and gathering details on practices r casing pipelines at roadway crossi s. Data r analyzing pipeline incidents were obtained primarily from the Pipeline and Hazardous Materials Saty Administra tion HMSA) - which is a United States Department of Transportation agency. The data resource from the PHMSA r the years from 2010 to 2018 was mainly used to compile inform@ion on excavation damages. 17. KEYWORDS Effective utili encasement criteria and methods, Underground natal gas pipeline leakages, Underground utilities dig-in accidents 18. DISTRIBUTION STATEMENT No Resictions 19. SECURITY CLASSIFICATION (of this port) Unclassified 20. NUMBER OF PAGES 161 21. COST OF REPORT CHARGED Reproduction of completed page authorized.
Transcript of STATE OF CALIFORNIA· DEPARTMENT OF TRANSPORTATION ... · Data for analyzing pipeline incidents...
STATE OF CALIFORNIA· DEPARTMENT OF TRANSPORTATION ADA Notice
TECHNICAL REPORT DOCUMENTATION PAGE For individuals with sensory disabilities, this document is available in alternate formats. For information call (916) 654-6410 or TDD (916) 654-3880 or write TR0003 (REV 10/98) Records and Forms Management, 1120 N Street, MS-89, Sacramento, CA 95814.
1. REPORT NUMBER
CA19-3106
2. GOVERNMENT ASSOCIATION NUMBER 3. RECIPIENT'S CATALOG NUMBER
4. TITLE AND SUBTITLE
Encasement Research: Effective Utility Encasement Criteria and Methods
5. REPORT DATE
07/08/2019 6. PERFORMING ORGANIZATION CODE
7. AUTHOR
Shailesh Chandra and Hung Nguyen
8. PERFORMING ORGANIZATION REPORT NO.
9. PERFORMING ORGANIZATION NAME AND ADDRESS
California State University, Long Beach Research Foundation
Long Beach, CA 90840
10. WORK UNIT NUMBER
11. CONTRACT OR GRANT NUMBER
65A0664
12. SPONSORING AGENCY AND ADDRESS
California Department of Transportation
Division of Research, Innovation, and System Information
1727 30th Street, MS-83, Sacramento, CA 95816
13. TYPE OF REPORT AND PERIOD COVERED
Final Report
14. SPONSORING AGENCY CODE
15. SUPPLEMENTARY NOTES
16.ABSTRACT
Underground natural gas pipeline leakages at roadway crossings result in jeopardizing safety, incur huge costs for repair, disrupt traffic
operations and create environmental hazard situations. In 2018, there were 632 pipeline incidents in the United States with reported costs in
economic damages of almost $900 million. These costs were more than previous three years of cumulative costs of damages resulting from
pipeline incidents in the country. While fatalities were limited to those from gas pipeline leakages, injuries were the highest from all previous
five years of pipeline incident data reported in the nation. Significant number of incidents in 2018 resulted from excavation damages (namely,
operator/contractor excavation damage, previous damage due to excavation or third-party excavation damage) and other outside force damage
to pipelines. Thus, one of the primary focus of this research was to identify engineering practices that have been adopted across various states
of the nation to protect gas pipelines from incidents that lead to leakages. Specific focus is on evaluating pipeline protection with encasement,
from excavation related damages. The research approach consisted of obtaining information related to encasement by identifying reliable
sources through web searches and gathering details on practices for casing pipelines at roadway crossings.
Data for analyzing pipeline incidents were obtained primarily from the Pipeline and Hazardous Materials Safety Administration (PHMSA) -
which is a United States Department of Transportation agency. The data resource from the PHMSA for the years from 2010 to 2018 was
mainly used to compile information on excavation damages.
17. KEYWORDS
Effective utility encasement criteria and methods, Underground natural
gas pipeline leakages, Underground utilities dig-in accidents
18. DISTRIBUTION STATEMENT
No Restrictions
19. SECURITY CLASSIFICATION (of this report)
Unclassified
20. NUMBER OF PAGES
161
21. COST OF REPORT CHARGED
Reproduction of completed page authorized.
DISCLAIMER STATEMENT
This document is disseminated in the interest of information exchange. The contents of this report reflect the views of the authors who are responsible for the facts and accuracy of the data presented herein. The contents do not necessarily reflect the official views or policies of the State of California or the Federal Highway Administration. This publication does not constitute a standard, specification or regulation. This report does not constitute an endorsement by the Department of any product described herein.
For individuals with sensory disabilities, this document is available in alternate formats. For information, call (916) 654-8899, TTY 711, or write to California Department of Transportation, Division of Research, Innovation and System Information, MS-83, P.O. Box 942873, Sacramento, CA 94273-0001.
Contract No.: 65A0664
Task No. 3106
Encasement Research: Effective Utility Encasement Criteria and Methods
Prepared for
California Department of Transportation
Caltrans Project Manager: Akber Ali, Transportation Engineer (Civil)
Prepared by:
Shailesh Chandra and Hung Nguyen
California State University, Long Beach
July 8, 2019
1

This page is left blank intentionally
2
DISCLAIMER
The contents of this report reflect the views of the authors who are responsible for the facts and the accuracy of the information presented herein. This document is disseminated under the sponsorship of the California Department of Transportation (Caltrans). Caltrans assumes no liability for the contents or use thereof.
ACKNOWLEDGMENTS
The authors would like to recognize that the support of this research was provided by a contract from Caltrans to California State University, Long Beach.
The following individuals provided valuable insights and feedbacks on various aspects of this research.
Akber Ali Division of Research, Innovation and System Information, Caltrans
Balwinder Tarlok Division of Research, Innovation and System Information, Caltrans
Carmen Shantz Office of Project Support, Division of Design, Caltrans Dwarakeswar Penubolu Chief, Encroachment Permits, Caltrans Gordon Brown Office of Project Support, Division of Design, Caltrans Leona Burk Division of Design Research Coordinator, Landscape
Architecture Standards and Procedures, Caltrans Linda Fong Office of Project Support, Division of Design, Caltrans Ranjeet Bagha Office of Project Support, Division of Design, Caltrans
3

This page is left blank intentionally
4
TABLE OF CONTENTS List of Figures ............................................................................................................................ 9 List of Tables ............................................................................................................................11 EXECUTIVE SUMMARY ..........................................................................................................13 1. INTRODUCTION ...............................................................................................................16 2. PIPELINE EXCAVATION ACCIDENTS VIS-À-VIS ENCASEMENT NEEDS......................16
Compilation of Incidents due to Excavation Accidents or Excavation Damage ......................16 Incident Summary from Excavation Damages .......................................................................19
Fatalities and injuries .........................................................................................................25 Incident Cost Analysis........................................................................................................27 Liquid Release ...................................................................................................................31 Depth of Cover in Excavation-related Incidents..................................................................32
Encasement Information........................................................................................................35 Casings – Pros and Cons ..................................................................................................35
Pros................................................................................................................................35 Cons...............................................................................................................................35 Cased Installations - Remarks........................................................................................36
Uncased Pipelines – Pros and Cons..................................................................................37 Pros................................................................................................................................37 Cons:..............................................................................................................................37 Uncased Installations - Remarks ....................................................................................38
Alternatives to Casing............................................................................................................38 3. CURRENT ENCASEMENT STANDARDS FOR PIPELINE SAFETY .................................40
Utility and Organizational Standards......................................................................................40 Code of Federal Regulations (CFR) ......................................................................................40 American Association of State Highway and Transportation Officials (AASHTO) ..................40 Regulations/guidelines from Key States ................................................................................41
Alabama ............................................................................................................................41 California............................................................................................................................42 Iowa ...................................................................................................................................43 Missouri .............................................................................................................................44 Texas.................................................................................................................................44 Virginia...............................................................................................................................45
4. PIPELINE LEAKAGES AND GAS MIGRATION IN SOIL MEDIA .......................................45
5
Cover Requirements..............................................................................................................46 Historical Pipeline Leakages..................................................................................................46 Pipeline Leakages and Depth of Cover..................................................................................51 Gas Migration in Soil Media...................................................................................................58 Cased/Uncased Pipeline Leakages in California ...................................................................65
5. TRENCHLESS TECHNOLOGIES FOR UNDERGROUND PIPELINE REPLACEMENT....78 Background ...........................................................................................................................78 Pipe Replacement Trenchless Techniques............................................................................78 Cost Components for Trenchless Techniques .......................................................................85
Cost Estimate of Installing a Pipe with and without Encasement........................................85 6. ENCASEMENT REQUIREMENTS FOR SUBSURFACE UTILITY INSTALLATIONS ........88
Encasement Dimensions.......................................................................................................88 Findings from Key States – Alabama, California, Iowa, Massachusetts, New Hampshire, Oregon and Texas. ............................................................................................................88 Summary of State Dot Encasement Policy at Crossings ....................................................91
State Specific Encasement for High Priority Utilities ..............................................................98 Encasement Requirement for Key States ............................................................................101 Encasement for Longitudinal Installations............................................................................104 Utility Steel Encasement Pipe Standards for Key States .....................................................106 Encasement Material and Design for High Priority Utility Product Type ...............................114 Encasement Installation Methods ........................................................................................117 Encasement alternatives, Underground Storage Tank and Leakage Monitoring..................119
Underground Storage Tank..............................................................................................121 Relief Valve......................................................................................................................122
Other findings...............................................................................................................122 Interstitial Monitoring........................................................................................................123
Automatic tank gauging system (ATG ..........................................................................123 Vapor monitoring ..........................................................................................................124 Groundwater monitoring ...............................................................................................125 Statistical inventory reconciliation (SIR)........................................................................126 Manual tank gauging ....................................................................................................126 Continuous in-tank leak detection (CITLD) ...................................................................126
7. CONCLUDING REMARKS ..............................................................................................127 REFERENCES .......................................................................................................................129 APPENDIX..............................................................................................................................133
6
Incident Summaries.............................................................................................................133 Class Location Definitions ...................................................................................................150 Data Compilation – Pipeline Incidents per Mile....................................................................151 Spatial Location and Counts of Historical Pipeline Incidents................................................154
7

This page is left blank intentionally
8
List of Figures
Figure 1: Distribution of incidents for depth of cover for Gas Transmission pipelines in California
.................................................................................................................................................32
Figure 2: Distribution of incidents for depth of cover for Gas Transmission pipelines from all the
states ........................................................................................................................................32
Figure 3: Distribution of incidents for depth of cover for Gas Distribution pipelines in California 33
Figure 4: Distribution of incidents for depth of cover for Gas Distribution pipelines from all the
states ........................................................................................................................................33
Figure 5: Distribution of incidents for depth of cover for Hazardous Liquid pipelines in California
.................................................................................................................................................34
Figure 6: Distribution of incidents for depth of cover for Hazardous Liquid excavation incidents
from all the states......................................................................................................................34
Figure 7: Crossing failure ..........................................................................................................37
Figure 8: Alternative methods of protecting a pipeline (Image Source: AASHTO, 2005) ...........39
Figure 9: Cumulative variation in number of underground/under soil gas transmission pipeline
leaks with respect to their installation year in all the states (Source: PHMSA, 2018).................47
Figure 10: Cumulative variation in number of underground/under soil gas distribution pipeline
leaks with respect to their installation year in all the states (Data Source: PHMSA, 2018) ........47
Figure 11: Frequency of underground gas transmission pipeline leakages versus depth of cover
for year 2010 to mid-2018 in all the states.................................................................................51
Figure 12: Frequency of underground gas transmission pipeline leakages versus depth of cover
for year 2010 to mid-2018 in California .....................................................................................52
Figure 13: Frequency of underground gas distribution pipeline leakages versus depth of cover for
year 2010 to mid-2018 in all the states......................................................................................52
Figure 14: Frequency of underground gas distribution pipeline leakages versus depth of cover for
year 2010 to mid-2018 in California...........................................................................................53
Figure 15: Year 2010 to 2018 percentage distribution of depth of cover versus leakage causes for
Gas Transmission pipelines from all the states. ........................................................................54
Figure 16: Year 2010 to 2018 percentage distribution of depth of cover versus leakage causes for
Gas Distribution pipelines from all the states.............................................................................55
Figure 17: Year 2010 to 2018 percentage distribution of depth of cover versus leakage causes for
Gas Transmission pipelines in California...................................................................................56
9

Figure 18: Year 2010 to 2018 percentage distribution of depth of cover versus leakage causes for
Gas Distribution pipelines in California. .....................................................................................57
Figure 19: Set-up for estimating natural gas migration due to point of leakage (Source: Okamoto
and Gomi (2011) .......................................................................................................................59
Figure 20: Migration profile of (a) methane and (b) propane through soil profile covered by asphalt
cover (Source: Okamoto and Gomi, 2011) ................................................................................59
Figure 21: Path of natural gas leakage propagation as it travels through the soils (Source: Texas
Gas Association, 2018) .............................................................................................................60
Figure 22: a) Vertical cross-section, and b) plan view schematics of the methane injection and
monitoring network....................................................................................................................62
Figure 23: (a) Precipitation events at the site, and (b) Volumetric soil water content measured at
the site ......................................................................................................................................63
Figure 24: Soil gas profiles during the second (a) 25% (8 Oct. 2017) and (b) 100% (23 Oct. 2017)
methane injection periods. Circles represent sampling points ...................................................64
Figure 25: Contour plots of efflux snapshots taken (a) prior to the start of methane injection (30
Apr. 2014), (b) during 25% methane injection (8 Oct. 2014), (c) during 100% methane injection
(11 Sept. 2014), and (d) during 100% methane injection following a per period of precipitation and
declining efflux (15 Jan. 2015). .................................................................................................65
Figure 26: Spatial distribution of gas transmission pipeline leaks across California (Soil
Information Data Source: California Soil Resource Lab, 2018)..................................................67
Figure 27: Spatial distribution of gas distribution pipeline leaks across California......................68
Figure 28: Trenchless techniques (ISTT, 2018).........................................................................79
Figure 29: Pipe eating (Source: Tracto-Technik, 2018) .............................................................82
Figure 30: Pipe bursting (Source: TT Technologies, 2018) .......................................................82
Figure 31: Pipe pulling (Source: Terra, Trenchless Technologies, 2018)...................................83
Figure 32: Examples of protection of existing utility lines under a highway (Source: AASHTO
2005) ......................................................................................................................................120
Figure 33: Secondary containment with interstitial monitoring .................................................123
Figure 34: Automatic tank gauging system..............................................................................124
Figure 35: Vapor monitoring....................................................................................................125
Figure 36: Groundwater monitoring.........................................................................................125
10
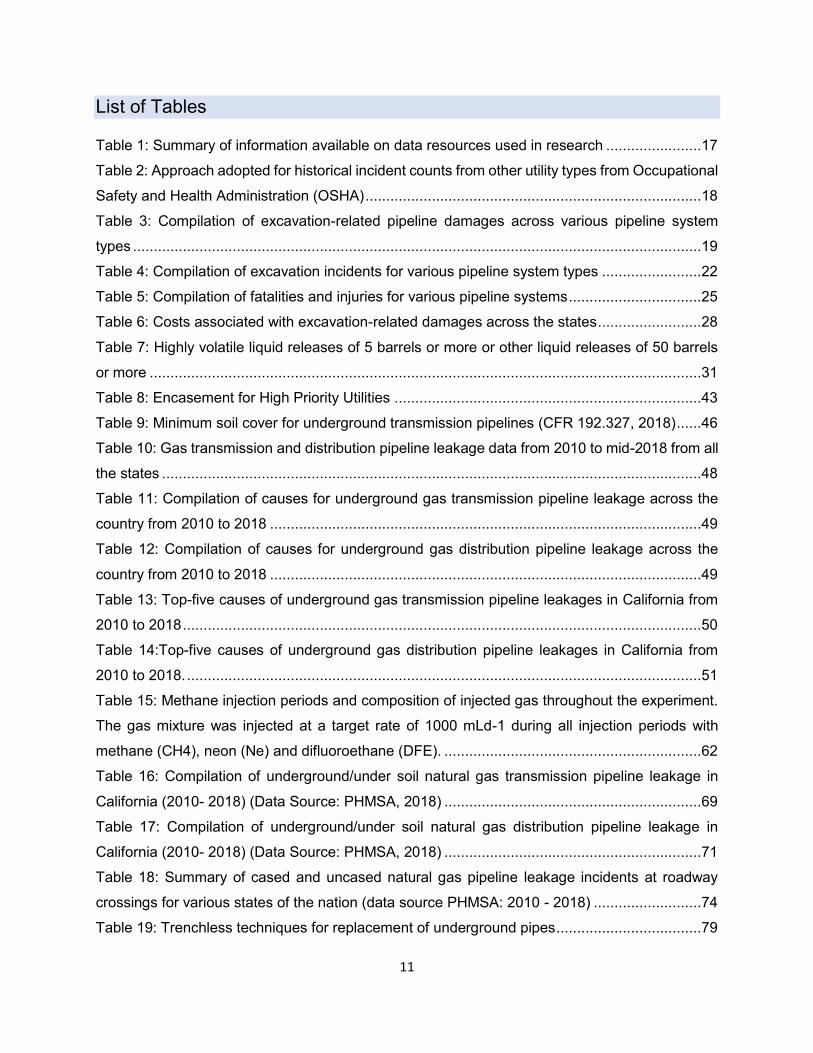
List of Tables
Table 1: Summary of information available on data resources used in research .......................17
Table 2: Approach adopted for historical incident counts from other utility types from Occupational
Safety and Health Administration (OSHA).................................................................................18
Table 3: Compilation of excavation-related pipeline damages across various pipeline system
types .........................................................................................................................................19
Table 4: Compilation of excavation incidents for various pipeline system types ........................22
Table 5: Compilation of fatalities and injuries for various pipeline systems................................25
Table 6: Costs associated with excavation-related damages across the states.........................28
Table 7: Highly volatile liquid releases of 5 barrels or more or other liquid releases of 50 barrels
or more .....................................................................................................................................31
Table 8: Encasement for High Priority Utilities ..........................................................................43
Table 9: Minimum soil cover for underground transmission pipelines (CFR 192.327, 2018)......46
Table 10: Gas transmission and distribution pipeline leakage data from 2010 to mid-2018 from all
the states ..................................................................................................................................48
Table 11: Compilation of causes for underground gas transmission pipeline leakage across the
country from 2010 to 2018 ........................................................................................................49
Table 12: Compilation of causes for underground gas distribution pipeline leakage across the
country from 2010 to 2018 ........................................................................................................49
Table 13: Top-five causes of underground gas transmission pipeline leakages in California from
2010 to 2018.............................................................................................................................50
Table 14:Top-five causes of underground gas distribution pipeline leakages in California from
2010 to 2018.............................................................................................................................51
Table 15: Methane injection periods and composition of injected gas throughout the experiment.
The gas mixture was injected at a target rate of 1000 mLd-1 during all injection periods with
methane (CH4), neon (Ne) and difluoroethane (DFE). ..............................................................62
Table 16: Compilation of underground/under soil natural gas transmission pipeline leakage in
California (2010- 2018) (Data Source: PHMSA, 2018) ..............................................................69
Table 17: Compilation of underground/under soil natural gas distribution pipeline leakage in
California (2010- 2018) (Data Source: PHMSA, 2018) ..............................................................71
Table 18: Summary of cased and uncased natural gas pipeline leakage incidents at roadway
crossings for various states of the nation (data source PHMSA: 2010 - 2018) ..........................74
Table 19: Trenchless techniques for replacement of underground pipes...................................79
11
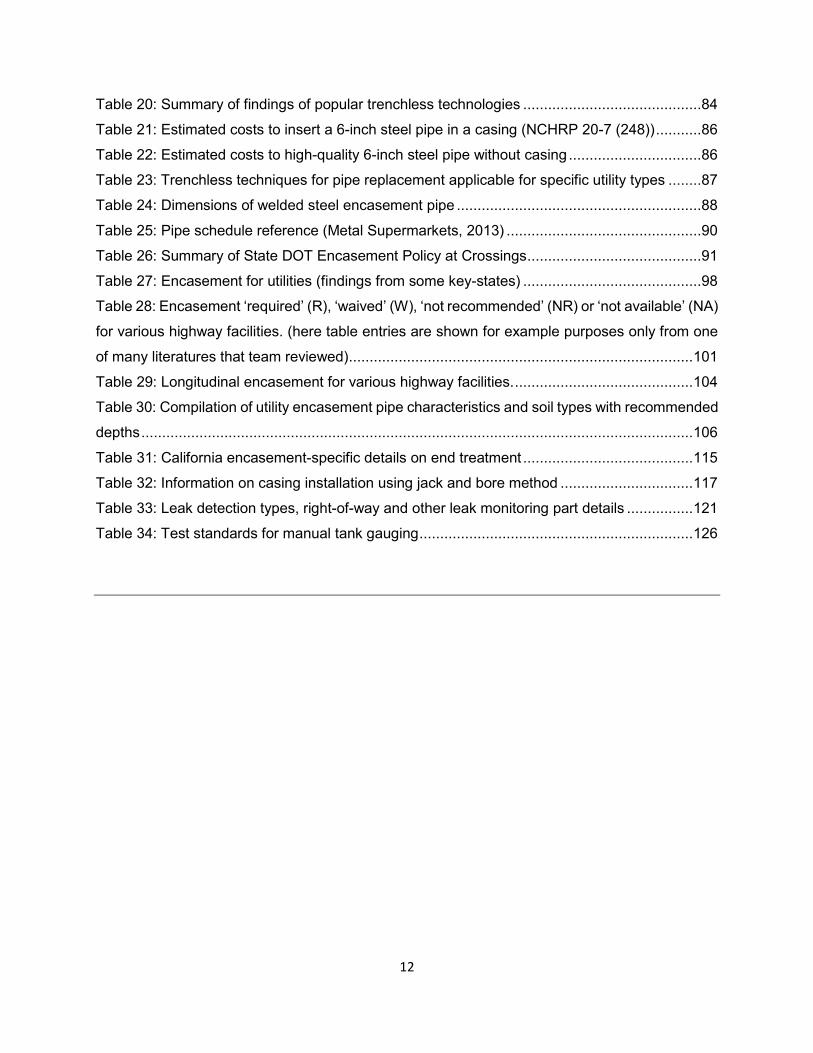
Table 20: Summary of findings of popular trenchless technologies ...........................................84
Table 21: Estimated costs to insert a 6-inch steel pipe in a casing (NCHRP 20-7 (248))...........86
Table 22: Estimated costs to high-quality 6-inch steel pipe without casing................................86
Table 23: Trenchless techniques for pipe replacement applicable for specific utility types ........87
Table 24: Dimensions of welded steel encasement pipe ...........................................................88
Table 25: Pipe schedule reference (Metal Supermarkets, 2013) ...............................................90
Table 26: Summary of State DOT Encasement Policy at Crossings..........................................91
Table 27: Encasement for utilities (findings from some key-states) ...........................................98
Table 28: Encasement ‘required’ (R), ‘waived’ (W), ‘not recommended’ (NR) or ‘not available’ (NA)
for various highway facilities. (here table entries are shown for example purposes only from one
of many literatures that team reviewed)...................................................................................101
Table 29: Longitudinal encasement for various highway facilities............................................104
Table 30: Compilation of utility encasement pipe characteristics and soil types with recommended
depths.....................................................................................................................................106
Table 31: California encasement-specific details on end treatment .........................................115
Table 32: Information on casing installation using jack and bore method ................................117
Table 33: Leak detection types, right-of-way and other leak monitoring part details ................121
Table 34: Test standards for manual tank gauging..................................................................126
12
EXECUTIVE SUMMARY
Underground natural gas pipeline leakages at roadway crossings result in jeopardizing safety, incur huge costs for repair, disrupt traffic operations and create environmental hazard situations. In 2018, there were 632 pipeline incidents in the United States with reported costs in economic damages of almost $900 million. These costs were more than previous three years of cumulative costs of damages resulting from pipeline incidents in the country. While fatalities were limited to those from gas pipeline leakages, injuries were the highest from all previous five years of pipeline incident data reported in the nation. Significant number of incidents in 2018 resulted from excavation damages (namely, operator/contractor excavation damage, previous damage due to excavation or third-party excavation damage) and other outside force damage to pipelines. Thus, one of the primary focus of this research was to identify engineering practices that have been adopted across various states of the nation to protect gas pipelines from incidents that lead to leakages. Specific focus is on evaluating pipeline protection with encasement, from excavation related damages. The research approach consisted of obtaining information related to encasement by identifying reliable sources through web searches and gathering details on practices for casing pipelines at roadway crossings.
Data for analyzing pipeline incidents were obtained primarily from the Pipeline and Hazardous Materials Safety Administration (PHMSA) – which is a United States Department of Transportation agency. The data resource from the PHMSA for the years from 2010 to 2018 was mainly used to compile information on excavation damages.
Data analysis showed that Texas had the largest length of gas transmission pipelines. Louisiana ranked second and California ranked fourth in terms of total miles of gas transmission lines. California had the largest total miles of gas distribution network, followed by Texas. Texas also had the highest total miles of pipeline for hazardous liquid, followed by Louisiana. California ranked sixth in terms of total miles of hazardous liquid pipelines.
Pipeline incident analysis showed that Hawaii had the highest total number of excavation-related incidents per mile for gas transmission lines, followed by Wisconsin. California ranked ninth in terms of excavation-related incidents per mile. Incorrect Operation (which is partly associated with excavation damage) were the highest in New Jersey for incidents per mile, and California was the second highest in such incidents. For gas distribution, excavation-related incidents per mile was the highest for Hawaii, followed by Louisiana. California ranked fifth in incident per mile in this category. For hazardous liquid, Hawaii again ranked the highest for incidents per mile due to excavation-related damages, followed by Delaware. California ranked sixth for these incidents per mile for hazardous liquid. For incidents per mile due to incorrect operations, Maryland ranked the highest - only marginally ahead of New Jersey. California ranked eleventh in terms of incidents per mile due to incorrect operations under the hazardous liquid category.
13
Additional analysis showed that for majority of excavation-related incidents that occurred in California, the affected pipelines were buried at depths of cover in the range 20 inches to 37 inches. Most other states studied in this research for underground pipeline incidents showed similar range of depths of cover for the number of excavation-related incidents. One of the reasons identified for a high frequency of excavation incidents at these depths of cover was that most of the pipelines were required to be buried at least 30 to 36 inches depth of cover.
When noting any protection that were provided to the incident affected pipelines, analysis of data from 2010 to 2018 showed that none of the pipelines involved in excavation accidents were cased for either the gas transmission or hazardous liquid lines. Both the gas transmission and hazardous liquid pipelines are identified as high pressure pipelines. For pipelines that reported leaks and were cased, corrosion damage or damage that was incurred during installation were noted to be the primary cause. There was only one incident reported to a cased gas distribution pipeline in 2016 under a public street pavement in Kansas due to excavation damage.
Research findings also show that encasement (or casing) can serve to protect pipelines from excavation damages. However, there are pros and cons associated with casing. Advantages of casing include protecting the pipeline from surrounding adverse soil conditions during construction or pipeline installations – particularly against damage from rocky subsurface soil. Leaking gases or fluids can be dissipated and collected using casings at the end points of the casing such as drainage way, venting points, or right-of-way line. However, issues with casing arise when the leakage of gas to the surface occurs. It is problematic to detect the leakage of the pipe underneath the roadway inside the casing if the soil surrounding the pipeline is a clay-textured soil. Other disadvantages of casing arise when the pipeline outside the casing deflects and settles if fill inside bore pits at the casing ends is not sufficiently compacted during installation – thus the pipeline comes in contact to the casing pipe. In addition, highway widening becomes difficult at locations if there are horizontal and vertical bends in the pipeline which run through casings. However, research suggests that the pros of casing the pipeline against external/accidental damage outweighs the cons. This is because data analysis on incidents showed that damages to uncased pipes have resulted in high number of fatalities and injuries, which might have been prevented with encasement.
Alternatives to casings can be provided if the carrier pipe has the same level of protection as a casing would provide - such as installation of single box-culvert-like structure around utility lines. There are established standards for protecting pipelines. ASME/ANSI B31.8 Gas Transmission and Distribution Piping Systems and the ASME/ANSI B31.4 Pipeline Transmission Systems for Liquid Hydrocarbons and Other Liquids provide directions and relevant standards to protecting underground pipes. Code of Federal Regulations (CFR) that provide minimum Federal safety standards for the transportation by pipeline are 49 CFR Part 192, Transportation of Natural and Other Gas by Pipeline, and 49 CFR Part 195, Transportation of Liquids by Pipeline.
14
Trenchless technologies are used to replace gas transmission/distribution pipes that show signs of leakage. Commonly used technologies consist of pipe eating, pipe bursting, and pipe pulling. Pipe bursting is considered to be more applicable across a wide variety of utility types that carry petroleum or hazardous liquids. Basic cost difference associated with installation of a 300-ft long 6-inch cased pipe is higher than a similar sized uncased pipe installation by approximately $39,000.
Pipeline encasement for states such as California, Alabama, Arkansas, Connecticut, Maryland, Virginia and Wyoming require all high-pressure utility pipes to be encased at crossings- however, these states permit uncased crossings of such pipes if the carrier pipe is buried beyond a minimum depth of cover and is of material and design type that supports highway plus any superimposed load. Typical encasement material in consists of steel, reinforced concrete pipe and high-density polyethylene (HDPE). Jack and bore is commonly used installation method for encasement throughout the nation.
Leakages for underground storage tank (UST) which are in the right-of-way can also cause disruption to traffic. Common leak detection techniques for UST consist of interstitial monitoring, automatic tank gauging system, vapor monitoring, groundwater monitoring, statistical inventory reconciliation, manual tank gauging, and continuous in-tank leak detection. UST operators are entrusted with monitoring any leakages from these tanks by conducting a periodic inspection.
In an effort to avoid accidents during construction, several key states such as Alaska, Utah and Virginia use procedures to identify and resolve utility conflicts with highways. A recent pilot exercise was carried out for the identification of utility conflicts and solutions under the SHRP 2 R15B Products at the Maryland State Highway Administration. One of the tools used in the pilot program was the use of a utility conflict matrix (UCM) which enables users to organize, track, and manage the conflicts. UCM provides a much accurate and complete information about utilities that might be in conflict with the project.
In summary, in order to avoid utility conflicts and relocations, Federal Highway Administration (FHWA) encourages implementation of strategies at various stages of the development of highway projects. Strategies at the planning stage consist of forming Utility Coordinating Councils, One-Call Notification, detailed utility information using Subsurface Utility Engineering (SUE), utility agreements, electronic document delivery, cost sharing, joint project agreements, context sensitive design, locating utilities next to ROW line, joint trenching/utility corridors, utility tunnels, use of subways for dry lines, and removal of abandoned lines. These strategies need to be studied in-depth for their implementation in various states across the country to understand if they resulted in any reduction in frequency of excavation-related damages to underground utility pipelines.
15
1. INTRODUCTION Encasing utilities dates to 1800s when first cast iron pipes were used in history and protected against corrosion using cement-line. In 1928, coating compounds were in use to coat pipe and protect it from corrosion (Pipeline Knowledge & Development, 2011). For improved durability, in 1942, prestressed concrete cylinder pipe was first manufactured with a thin steel ring encased in concrete for storm sewer lines and water mains. Concrete cylinders are still manufactured today for these purposes.
Early pipeline systems were installed with waterworks in Philadelphia in 1802 (Lygo, 2018). The installations were built with brick and mortar. In 1821, William Hart—known as the “father of natural gas”— piped the gas through hollow logs to nearby houses in the northeastern United States (Wylie, 2018). Around the same time, the wooden pipe or log pipe were installed in the United States - from Philadelphia to Portland, Oregon. Clay pipes became popular in the 1900s, however, these pipes were very heavy and were mainly installed in cities which had local supply of clay. The first accident that was recorded with gas pipeline was in March 1860, when a "gasometer" exploded during a fire at New Orleans, Louisiana (Daily Herald, 1860). The incident resulted in two fatalities leading to death of two men.
2. PIPELINE EXCAVATION ACCIDENTS VIS-À-VIS ENCASEMENT NEEDS Compilation of Incidents due to Excavation Accidents or Excavation Damage Data collection involved online searches, reports and other documentations from reliable public agency websites. Data for pipeline incidents that have occurred across various states of the country have been analyzed using information from the Pipeline and Hazardous Materials Safety Administration (Data and Statistics - PHMSA, 2018). Although, the team referred to other online content (published and unpublished) for collecting information on excavation-related incidents, none seemed to meet the quality of information provided by the PHMSA. Excavation damages were attributed to four sub-causes that were identified in the PHMSA incident data logs as follows:
(i) Excavation damage, with the following incident cause subtypes: (a) operator /contractor excavation damage (b) previous damage due to excavation (c) third party excavation damage
(ii) Incorrect operation, with the following incident cause subtypes: (a) damage by operator or operator’s contractor (b) other incorrect operation
Table 1 presents information on data collected and their sources that have been used to compile incidents due to excavation accidents. Table 2 outlines the standard approach that was adopted to compile information for underground excavation incidents with communication and cable lines, waterlines, underground power lines and sanitary sewer lines. None of the incidents (fatal or non-fatal) that have occurred in the past could be attributed to damage to a pipeline due to excavation for the underground communication
16
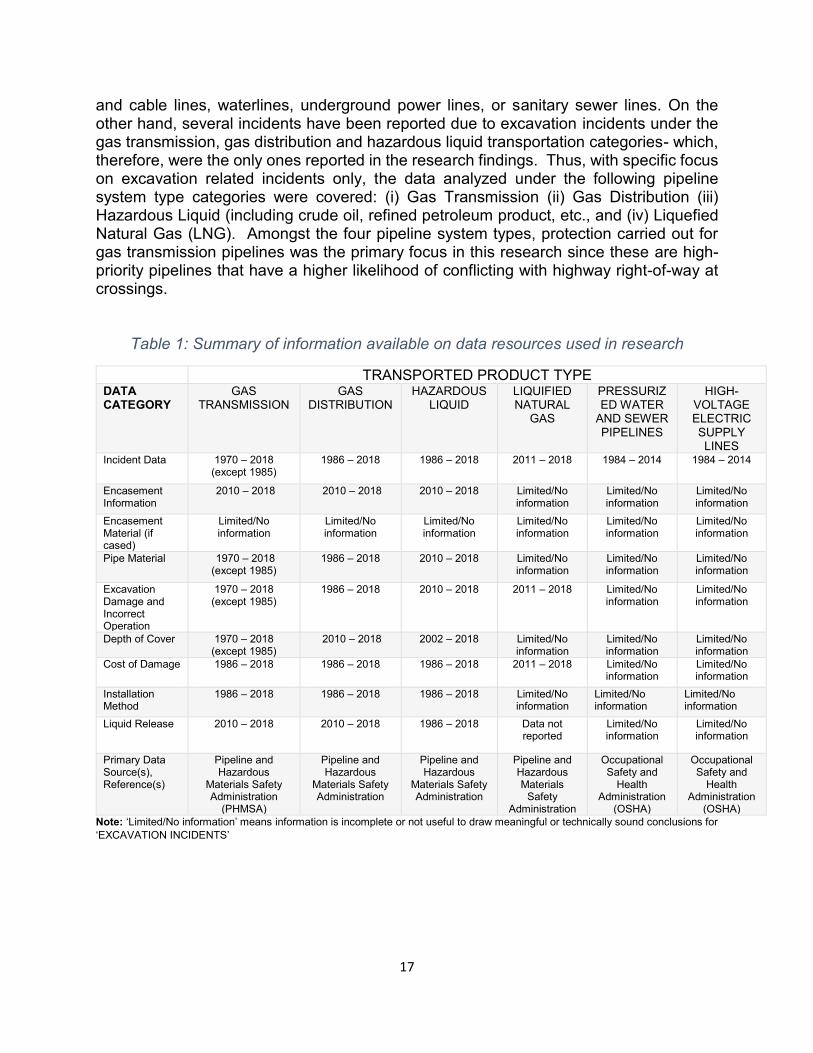
and cable lines, waterlines, underground power lines, or sanitary sewer lines. On the other hand, several incidents have been reported due to excavation incidents under the gas transmission, gas distribution and hazardous liquid transportation categories- which, therefore, were the only ones reported in the research findings. Thus, with specific focus on excavation related incidents only, the data analyzed under the following pipeline system type categories were covered: (i) Gas Transmission (ii) Gas Distribution (iii) Hazardous Liquid (including crude oil, refined petroleum product, etc., and (iv) Liquefied Natural Gas (LNG). Amongst the four pipeline system types, protection carried out for gas transmission pipelines was the primary focus in this research since these are high-priority pipelines that have a higher likelihood of conflicting with highway right-of-way at crossings.
Table 1: Summary of information available on data resources used in research
TRANSPORTED PRODUCT TYPE DATA CATEGORY
GAS TRANSMISSION
GAS DISTRIBUTION
HAZARDOUS LIQUID
LIQUIFIED NATURAL
GAS
PRESSURIZ ED WATER
AND SEWER PIPELINES
HIGH-VOLTAGE ELECTRIC SUPPLY LINES
Incident Data 1970 – 2018 (except 1985)
1986 – 2018 1986 – 2018 2011 – 2018 1984 – 2014 1984 – 2014
Encasement Information
2010 – 2018 2010 – 2018 2010 – 2018 Limited/No information
Limited/No information
Limited/No information
Encasement Material (if cased)
Limited/No information
Limited/No information
Limited/No information
Limited/No information
Limited/No information
Limited/No information
Pipe Material 1970 – 2018 (except 1985)
1986 – 2018 2010 – 2018 Limited/No information
Limited/No information
Limited/No information
Excavation Damage and Incorrect Operation
1970 – 2018 (except 1985)
1986 – 2018 2010 – 2018 2011 – 2018 Limited/No information
Limited/No information
Depth of Cover 1970 – 2018 (except 1985)
2010 – 2018 2002 – 2018 Limited/No information
Limited/No information
Limited/No information
Cost of Damage 1986 – 2018 1986 – 2018 1986 – 2018 2011 – 2018 Limited/No information
Limited/No information
Installation Method
1986 – 2018 1986 – 2018 1986 – 2018 Limited/No information
Limited/No information
Limited/No information
Liquid Release 2010 – 2018 2010 – 2018 1986 – 2018 Data not reported
Limited/No information
Limited/No information
Primary Data Source(s), Reference(s)
Pipeline and Hazardous
Materials Safety Administration
(PHMSA)
Pipeline and Hazardous
Materials Safety Administration
Pipeline and Hazardous
Materials Safety Administration
Pipeline and Hazardous Materials
Safety Administration
Occupational Safety and
Health Administration
(OSHA)
Occupational Safety and
Health Administration
(OSHA) Note: ‘Limited/No information’ means information is incomplete or not useful to draw meaningful or technically sound conclusions for ‘EXCAVATION INCIDENTS’
17
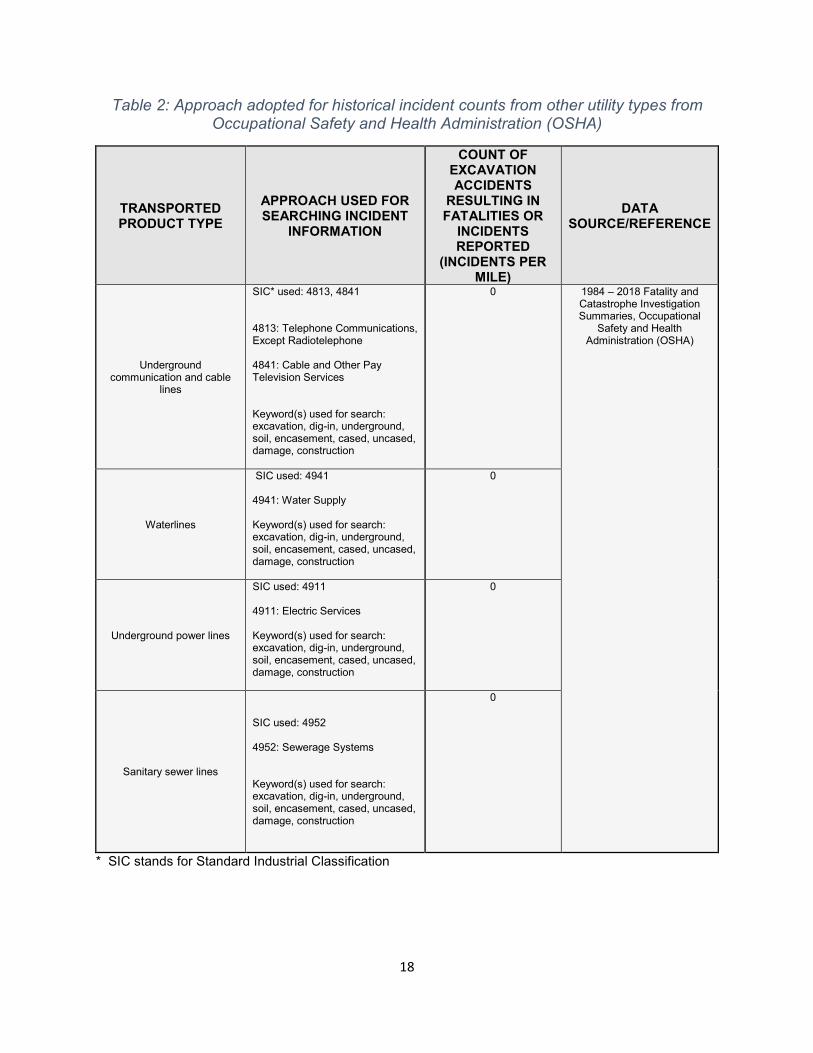
Table 2: Approach adopted for historical incident counts from other utility types from Occupational Safety and Health Administration (OSHA)
TRANSPORTED PRODUCT TYPE
APPROACH USED FOR SEARCHING INCIDENT
INFORMATION
COUNT OF EXCAVATION ACCIDENTS
RESULTING IN FATALITIES OR
INCIDENTS REPORTED
(INCIDENTS PER MILE)
DATA SOURCE/REFERENCE
Underground communication and cable
lines
SIC* used: 4813, 4841
4813: Telephone Communications, Except Radiotelephone
4841: Cable and Other Pay Television Services
Keyword(s) used for search: excavation, dig-in, underground, soil, encasement, cased, uncased, damage, construction
0 1984 – 2018 Fatality and Catastrophe Investigation Summaries, Occupational
Safety and Health Administration (OSHA)
Waterlines
SIC used: 4941
4941: Water Supply
Keyword(s) used for search: excavation, dig-in, underground, soil, encasement, cased, uncased, damage, construction
0
Underground power lines
SIC used: 4911
4911: Electric Services
Keyword(s) used for search: excavation, dig-in, underground, soil, encasement, cased, uncased, damage, construction
0
Sanitary sewer lines
SIC used: 4952
4952: Sewerage Systems
Keyword(s) used for search: excavation, dig-in, underground, soil, encasement, cased, uncased, damage, construction
0
* SIC stands for Standard Industrial Classification
18
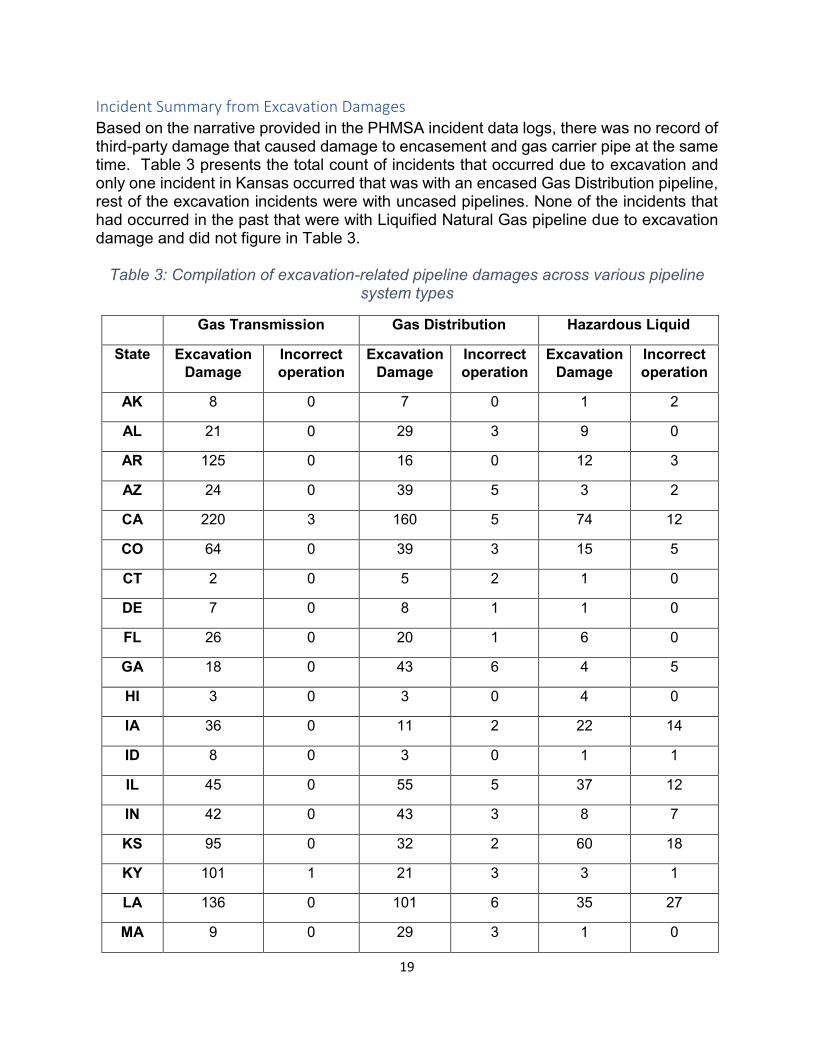
Incident Summary from Excavation Damages Based on the narrative provided in the PHMSA incident data logs, there was no record of third-party damage that caused damage to encasement and gas carrier pipe at the same time. Table 3 presents the total count of incidents that occurred due to excavation and only one incident in Kansas occurred that was with an encased Gas Distribution pipeline, rest of the excavation incidents were with uncased pipelines. None of the incidents that had occurred in the past that were with Liquified Natural Gas pipeline due to excavation damage and did not figure in Table 3.
Table 3: Compilation of excavation-related pipeline damages across various pipeline system types
Gas Transmission Gas Distribution Hazardous Liquid
State Excavation Damage
Incorrect operation
Excavation Damage
Incorrect operation
Excavation Damage
Incorrect operation
AK 8 0 7 0 1 2
AL 21 0 29 3 9 0
AR 125 0 16 0 12 3
AZ 24 0 39 5 3 2
CA 220 3 160 5 74 12
CO 64 0 39 3 15 5
CT 2 0 5 2 1 0
DE 7 0 8 1 1 0
FL 26 0 20 1 6 0
GA 18 0 43 6 4 5
HI 3 0 3 0 4 0
IA 36 0 11 2 22 14
ID 8 0 3 0 1 1
IL 45 0 55 5 37 12
IN 42 0 43 3 8 7
KS 95 0 32 2 60 18
KY 101 1 21 3 3 1
LA 136 0 101 6 35 27
MA 9 0 29 3 1 0
19

MD 4 0 24 5 4 4
ME 4 0 2 0 0 0
MI 28 1 68 8 7 2
MN 36 0 25 4 17 7
MO 15 0 44 2 19 6
MS 55 0 12 0 9 0
MT 29 0 10 0 11 3
NC 36 0 24 2 3 3
ND 13 0 3 0 15 4
NE 65 0 11 4 15 4
NH 5 0 2 0 0 0
NJ 13 1 27 4 6 6
NM 45 0 24 0 29 6
NV 14 0 21 1 1 1
NY 31 0 51 5 8 4
OH 101 0 52 3 22 7
OK 311 0 31 3 100 27
OR 7 0 9 1 4 0
PA 71 0 73 8 21 8
RI 7 0 5 0 0 0
SC 93 0 9 0 4 4
SD 2 0 9 0 4 1
TN 20 0 28 2 12 1
TX 606 0 282 6 268 100
UT 22 0 12 1 4 2
VA 10 0 30 5 9 1
VT 2 0 0 0 0 0
WA 12 0 20 1 6 1
WI 276 0 24 1 6 3
20
WV 84 0 11 0 1 0
WY 14 0 6 1 21 5
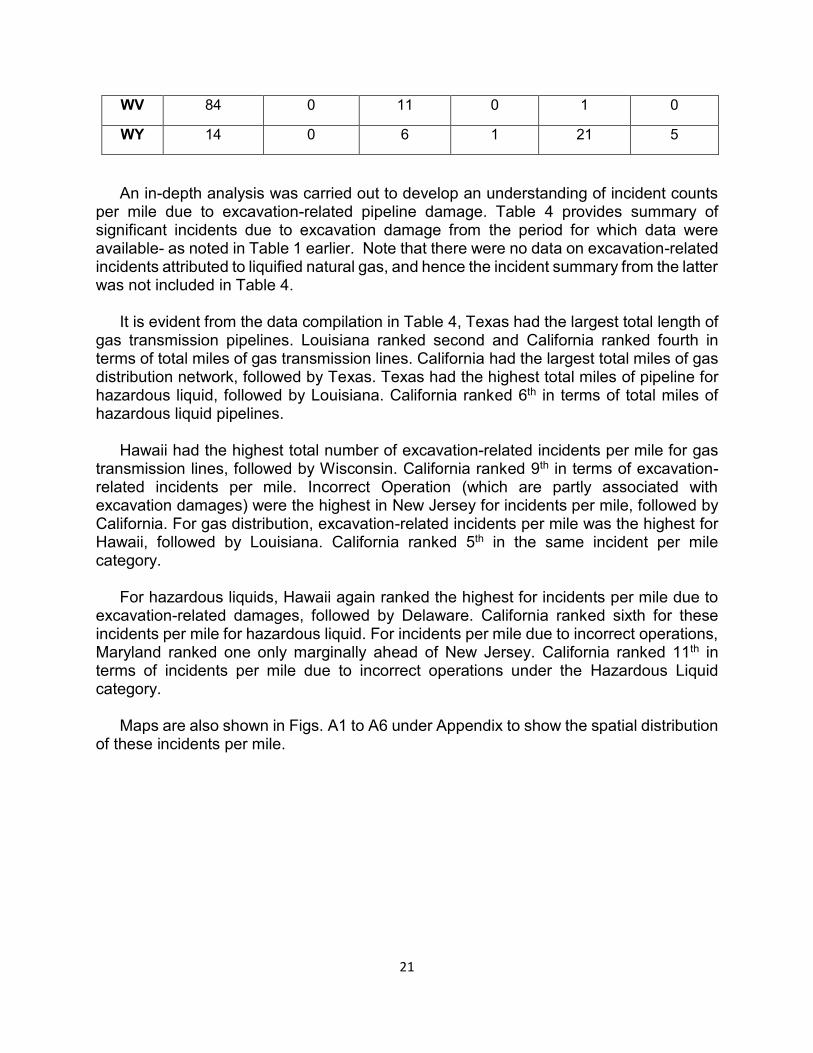
An in-depth analysis was carried out to develop an understanding of incident counts per mile due to excavation-related pipeline damage. Table 4 provides summary of significant incidents due to excavation damage from the period for which data were available- as noted in Table 1 earlier. Note that there were no data on excavation-related incidents attributed to liquified natural gas, and hence the incident summary from the latter was not included in Table 4.
It is evident from the data compilation in Table 4, Texas had the largest total length of gas transmission pipelines. Louisiana ranked second and California ranked fourth in terms of total miles of gas transmission lines. California had the largest total miles of gas distribution network, followed by Texas. Texas had the highest total miles of pipeline for hazardous liquid, followed by Louisiana. California ranked 6th in terms of total miles of hazardous liquid pipelines.
Hawaii had the highest total number of excavation-related incidents per mile for gas transmission lines, followed by Wisconsin. California ranked 9th in terms of excavation-related incidents per mile. Incorrect Operation (which are partly associated with excavation damages) were the highest in New Jersey for incidents per mile, followed by California. For gas distribution, excavation-related incidents per mile was the highest for
5th Hawaii, followed by Louisiana. California ranked in the same incident per mile category.
For hazardous liquids, Hawaii again ranked the highest for incidents per mile due to excavation-related damages, followed by Delaware. California ranked sixth for these incidents per mile for hazardous liquid. For incidents per mile due to incorrect operations, Maryland ranked one only marginally ahead of New Jersey. California ranked 11th in terms of incidents per mile due to incorrect operations under the Hazardous Liquid category.
Maps are also shown in Figs. A1 to A6 under Appendix to show the spatial distribution of these incidents per mile.
21
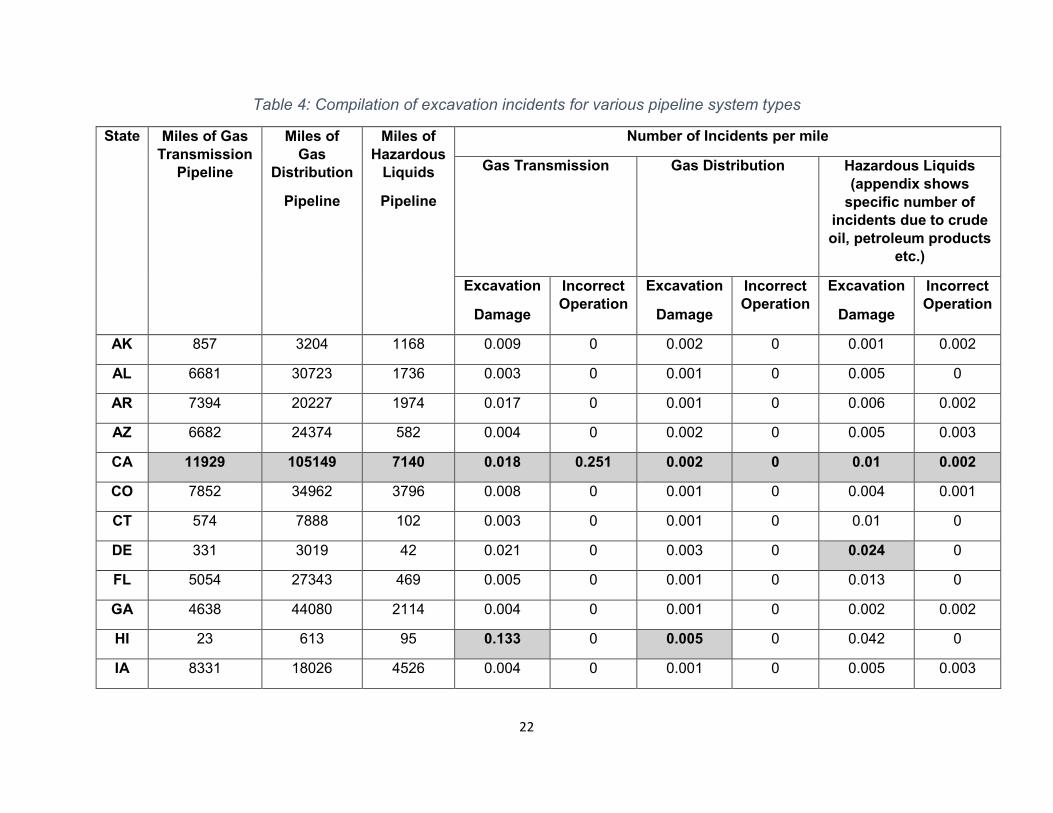
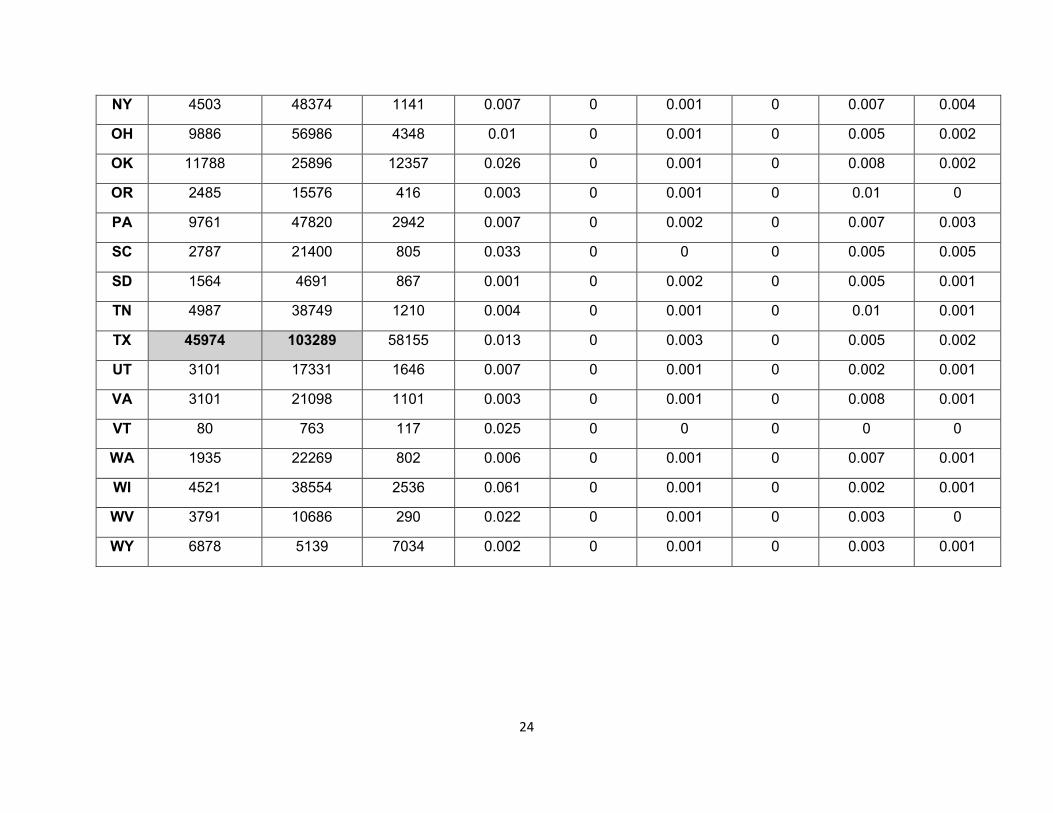
Table 4: Compilation of excavation incidents for various pipeline system types
State Miles of Gas Transmission
Pipeline
Miles of Gas
Distribution
Pipeline
Miles of Hazardous
Liquids
Pipeline
Number of Incidents per mile
Gas Transmission Gas Distribution Hazardous Liquids (appendix shows
specific number of incidents due to crude oil, petroleum products
etc.)
Excavation
Damage
Incorrect Operation
Excavation
Damage
Incorrect Operation
Excavation
Damage
Incorrect Operation
AK 857 3204 1168 0.009 0 0.002 0 0.001 0.002
AL 6681 30723 1736 0.003 0 0.001 0 0.005 0
AR 7394 20227 1974 0.017 0 0.001 0 0.006 0.002
AZ 6682 24374 582 0.004 0 0.002 0 0.005 0.003
CA 11929 105149 7140 0.018 0.251 0.002 0 0.01 0.002
CO 7852 34962 3796 0.008 0 0.001 0 0.004 0.001
CT 574 7888 102 0.003 0 0.001 0 0.01 0
DE 331 3019 42 0.021 0 0.003 0 0.024 0
FL 5054 27343 469 0.005 0 0.001 0 0.013 0
GA 4638 44080 2114 0.004 0 0.001 0 0.002 0.002
HI 23 613 95 0.133 0 0.005 0 0.042 0
IA 8331 18026 4526 0.004 0 0.001 0 0.005 0.003
22

ID 1506 8227 717 0.005 0 0 0 0.001 0.001
IL 9386 61453 7974 0.005 0 0.001 0 0.005 0.002
IN 5459 40519 3914 0.008 0 0.001 0 0.002 0.002
KS 13933 22218 11370 0.007 0 0.001 0 0.005 0.002
KY 6855 18088 920 0.015 0.146 0.001 0 0.003 0.001
LA 24459 26649 12454 0.006 0 0.004 0 0.003 0.002
MA 1072 21398 66 0.008 0 0.001 0 0.015 0
MD 978 14669 343 0.004 0 0.002 0 0.012 0.012
ME 476 992 269 0.008 0 0.002 0 0 0
MI 8750 57441 3413 0.003 0.114 0.001 0 0.002 0.001
MN 5505 31051 4954 0.007 0 0.001 0 0.003 0.001
MO 4598 27357 5014 0.003 0 0.002 0 0.004 0.001
MS 10433 16576 3694 0.005 0 0.001 0 0.002 0
MT 3888 6995 3443 0.007 0 0.001 0 0.003 0.001
NC 4138 29823 1129 0.009 0 0.001 0 0.003 0.003
ND 2434 3348 3985 0.005 0 0.001 0 0.004 0.001
NE 5861 12729 2817 0.011 0 0.001 0 0.005 0.001
NH 251 1915 71 0.02 0 0.001 0 0 0
NJ 1515 34203 625 0.009 0.66 0.001 0 0.01 0.01
NM 6494 13693 6485 0.007 0 0.002 0 0.004 0.001
NV 1974 9911 240 0.007 0 0.002 0 0.004 0.004
23
NY 4503 48374 1141 0.007 0 0.001 0 0.007 0.004
OH 9886 56986 4348 0.01 0 0.001 0 0.005 0.002
OK 11788 25896 12357 0.026 0 0.001 0 0.008 0.002
OR 2485 15576 416 0.003 0 0.001 0 0.01 0
PA 9761 47820 2942 0.007 0 0.002 0 0.007 0.003
SC 2787 21400 805 0.033 0 0 0 0.005 0.005
SD 1564 4691 867 0.001 0 0.002 0 0.005 0.001
TN 4987 38749 1210 0.004 0 0.001 0 0.01 0.001
TX 45974 103289 58155 0.013 0 0.003 0 0.005 0.002
UT 3101 17331 1646 0.007 0 0.001 0 0.002 0.001
VA 3101 21098 1101 0.003 0 0.001 0 0.008 0.001
VT 80 763 117 0.025 0 0 0 0 0
WA 1935 22269 802 0.006 0 0.001 0 0.007 0.001
WI 4521 38554 2536 0.061 0 0.001 0 0.002 0.001
WV 3791 10686 290 0.022 0 0.001 0 0.003 0
WY 6878 5139 7034 0.002 0 0.001 0 0.003 0.001
24
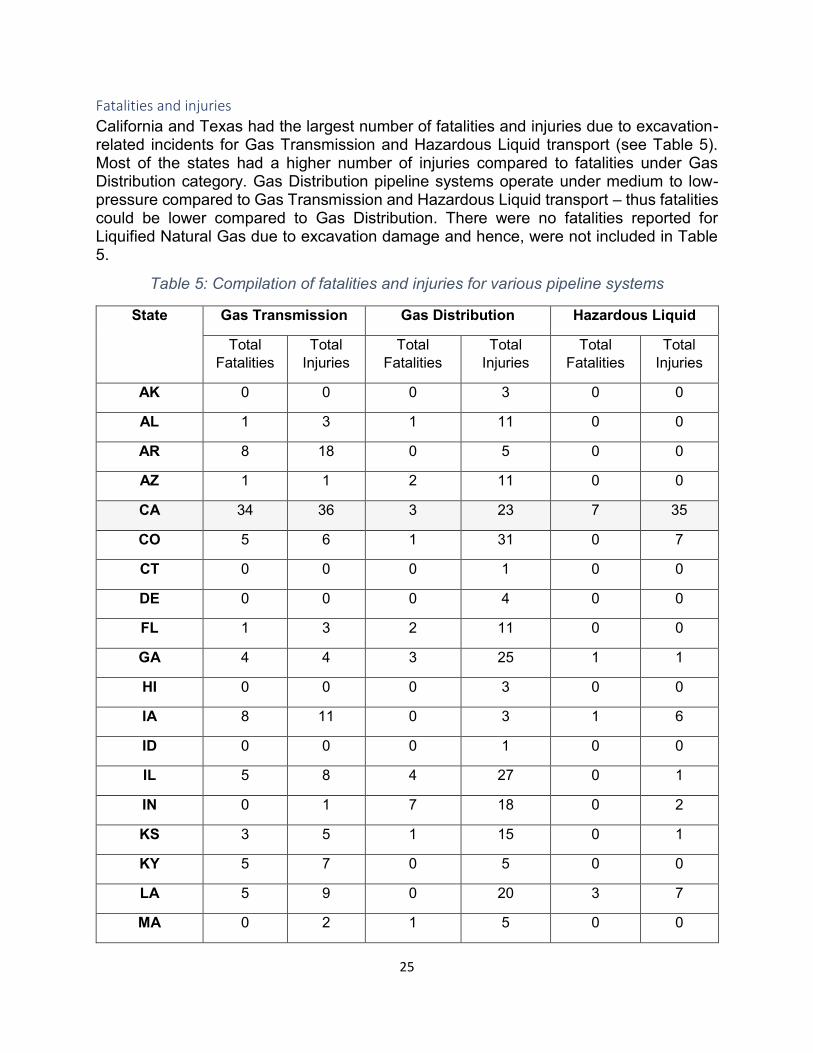
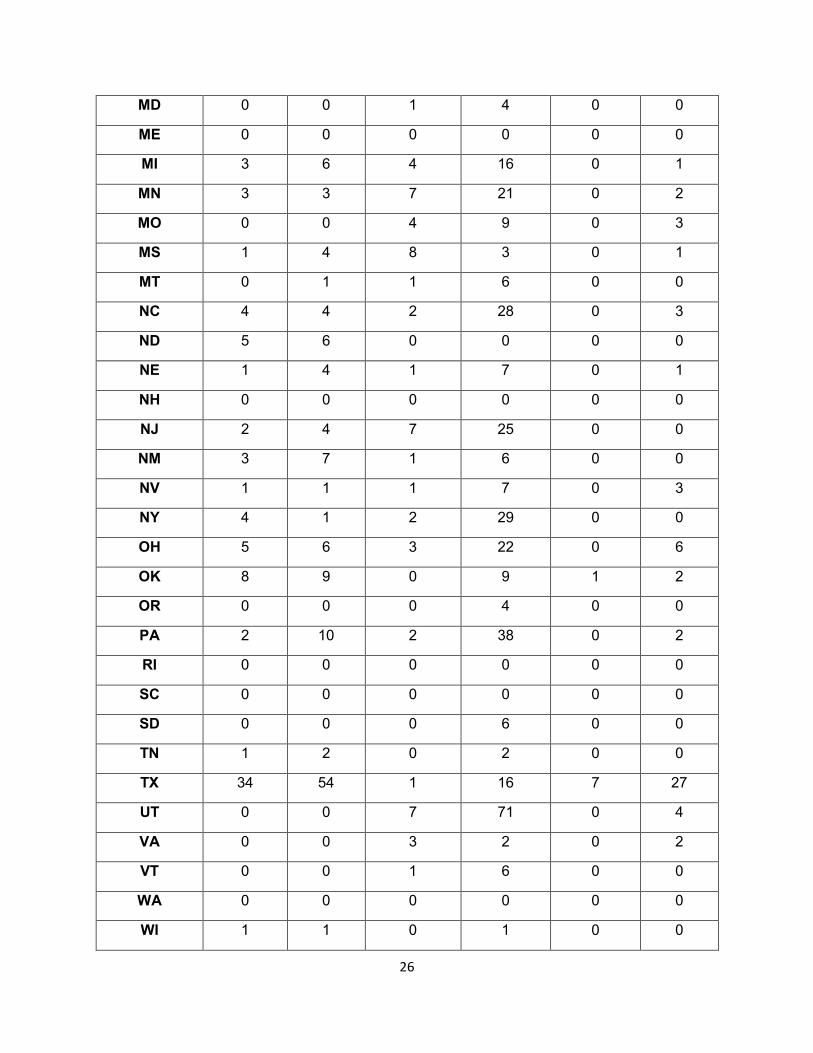
Fatalities and injuries
California and Texas had the largest number of fatalities and injuries due to excavation-related incidents for Gas Transmission and Hazardous Liquid transport (see Table 5). Most of the states had a higher number of injuries compared to fatalities under Gas Distribution category. Gas Distribution pipeline systems operate under medium to low-pressure compared to Gas Transmission and Hazardous Liquid transport – thus fatalities could be lower compared to Gas Distribution. There were no fatalities reported for Liquified Natural Gas due to excavation damage and hence, were not included in Table 5.
Table 5: Compilation of fatalities and injuries for various pipeline systems
State Gas Transmission Gas Distribution Hazardous Liquid
Total Fatalities
Total Injuries
Total Fatalities
Total Injuries
Total Fatalities
Total Injuries
AK 0 0 0 3 0 0
AL 1 3 1 11 0 0
AR 8 18 0 5 0 0
AZ 1 1 2 11 0 0
CA 34 36 3 23 7 35
CO 5 6 1 31 0 7
CT 0 0 0 1 0 0
DE 0 0 0 4 0 0
FL 1 3 2 11 0 0
GA 4 4 3 25 1 1
HI 0 0 0 3 0 0
IA 8 11 0 3 1 6
ID 0 0 0 1 0 0
IL 5 8 4 27 0 1
IN 0 1 7 18 0 2
KS 3 5 1 15 0 1
KY 5 7 0 5 0 0
LA 5 9 0 20 3 7
MA 0 2 1 5 0 0
25
MD 0 0 1 4 0 0
ME 0 0 0 0 0 0
MI 3 6 4 16 0 1
MN 3 3 7 21 0 2
MO 0 0 4 9 0 3
MS 1 4 8 3 0 1
MT 0 1 1 6 0 0
NC 4 4 2 28 0 3
ND 5 6 0 0 0 0
NE 1 4 1 7 0 1
NH 0 0 0 0 0 0
NJ 2 4 7 25 0 0
NM 3 7 1 6 0 0
NV 1 1 1 7 0 3
NY 4 1 2 29 0 0
OH 5 6 3 22 0 6
OK 8 9 0 9 1 2
OR 0 0 0 4 0 0
PA 2 10 2 38 0 2
RI 0 0 0 0 0 0
SC 0 0 0 0 0 0
SD 0 0 0 6 0 0
TN 1 2 0 2 0 0
TX 34 54 1 16 7 27
UT 0 0 7 71 0 4
VA 0 0 3 2 0 2
VT 0 0 1 6 0 0
WA 0 0 0 0 0 0
WI 1 1 0 1 0 0
26
WV 2 3 7 20 0 0
WY 0 3 0 0 0 3
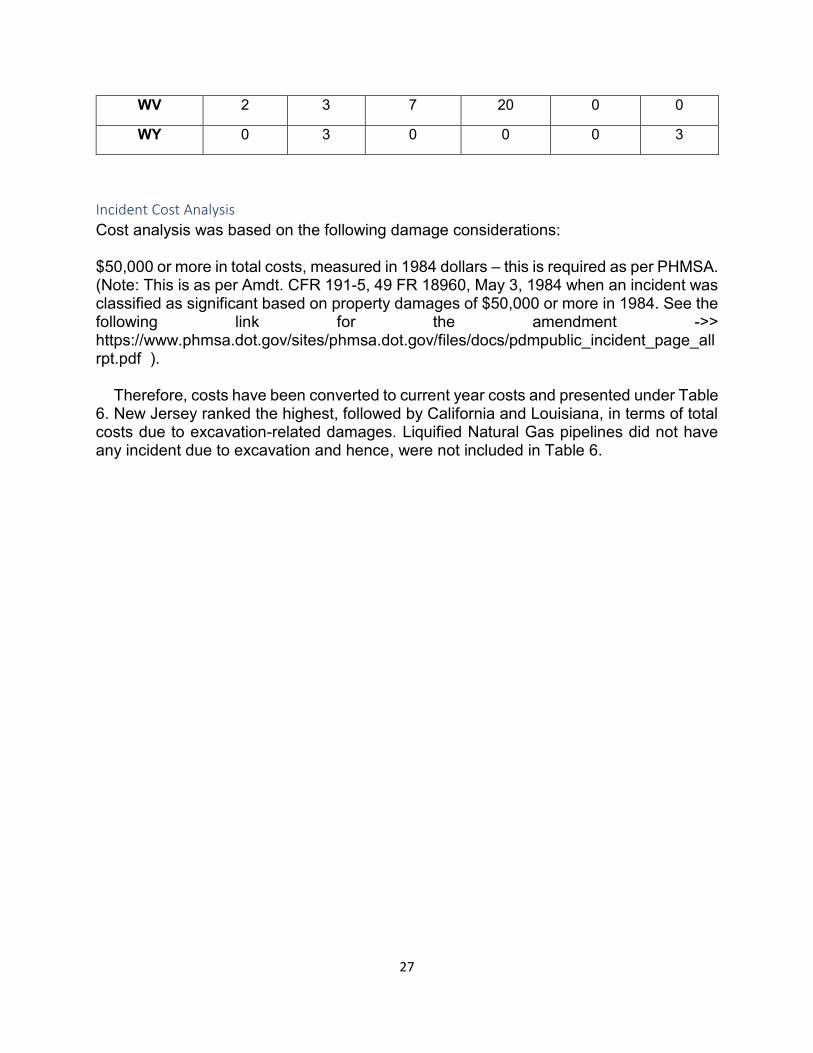
Incident Cost Analysis
Cost analysis was based on the following damage considerations:
$50,000 or more in total costs, measured in 1984 dollars – this is required as per PHMSA. (Note: This is as per Amdt. CFR 191-5, 49 FR 18960, May 3, 1984 when an incident was classified as significant based on property damages of $50,000 or more in 1984. See the following link for the amendment ->> https://www.phmsa.dot.gov/sites/phmsa.dot.gov/files/docs/pdmpublic_incident_page_all rpt.pdf ).
Therefore, costs have been converted to current year costs and presented under Table 6. New Jersey ranked the highest, followed by California and Louisiana, in terms of total costs due to excavation-related damages. Liquified Natural Gas pipelines did not have any incident due to excavation and hence, were not included in Table 6.
27
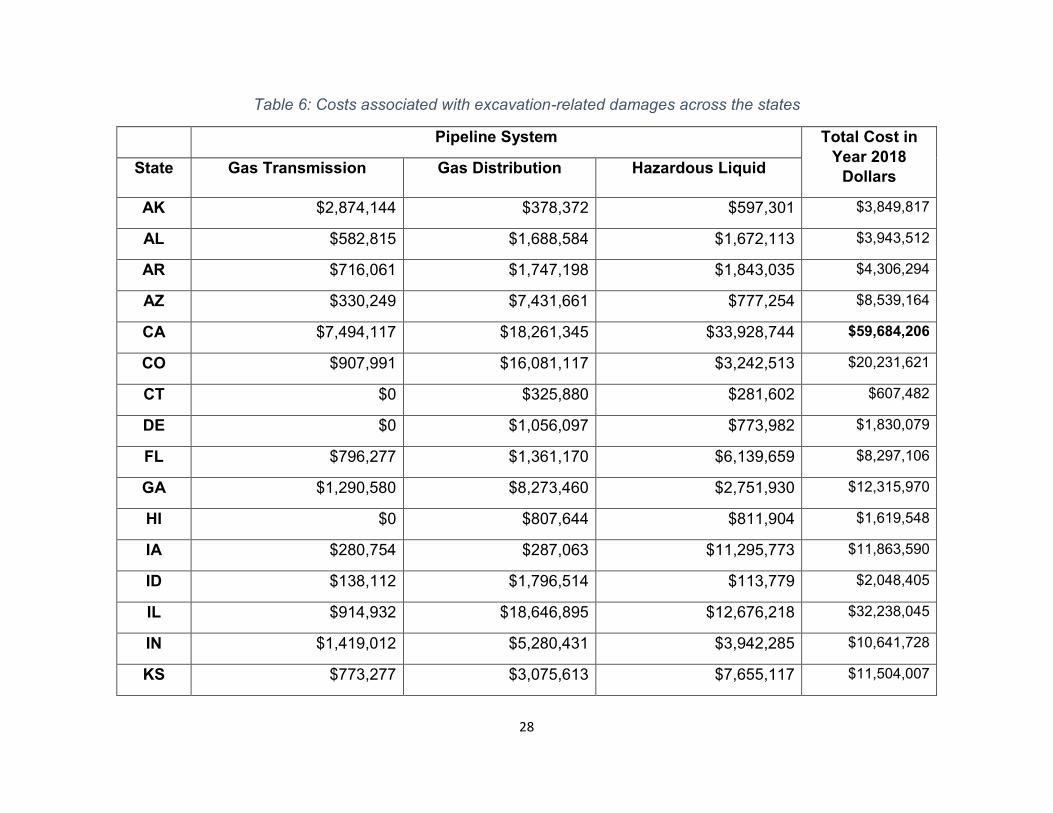
Table 6: Costs associated with excavation-related damages across the states
Pipeline System Total Cost in Year 2018
Dollars State Gas Transmission Gas Distribution Hazardous Liquid
AK $2,874,144 $378,372 $597,301 $3,849,817
AL $582,815 $1,688,584 $1,672,113 $3,943,512
AR $716,061 $1,747,198 $1,843,035 $4,306,294
AZ $330,249 $7,431,661 $777,254 $8,539,164
CA $7,494,117 $18,261,345 $33,928,744 $59,684,206
CO $907,991 $16,081,117 $3,242,513 $20,231,621
CT $0 $325,880 $281,602 $607,482
DE $0 $1,056,097 $773,982 $1,830,079
FL $796,277 $1,361,170 $6,139,659 $8,297,106
GA $1,290,580 $8,273,460 $2,751,930 $12,315,970
HI $0 $807,644 $811,904 $1,619,548
IA $280,754 $287,063 $11,295,773 $11,863,590
ID $138,112 $1,796,514 $113,779 $2,048,405
IL $914,932 $18,646,895 $12,676,218 $32,238,045
IN $1,419,012 $5,280,431 $3,942,285 $10,641,728
KS $773,277 $3,075,613 $7,655,117 $11,504,007
28
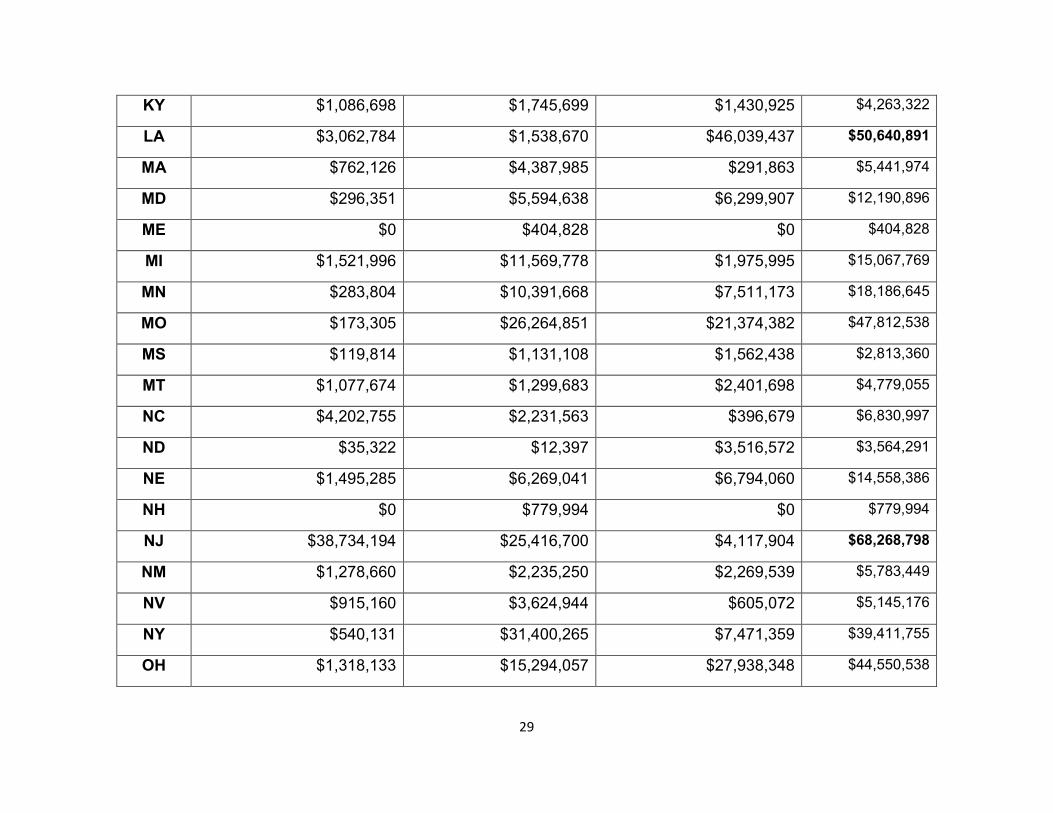
KY $1,086,698 $1,745,699 $1,430,925 $4,263,322
LA $3,062,784 $1,538,670 $46,039,437 $50,640,891
MA $762,126 $4,387,985 $291,863 $5,441,974
MD $296,351 $5,594,638 $6,299,907 $12,190,896
ME $0 $404,828 $0 $404,828
MI $1,521,996 $11,569,778 $1,975,995 $15,067,769
MN $283,804 $10,391,668 $7,511,173 $18,186,645
MO $173,305 $26,264,851 $21,374,382 $47,812,538
MS $119,814 $1,131,108 $1,562,438 $2,813,360
MT $1,077,674 $1,299,683 $2,401,698 $4,779,055
NC $4,202,755 $2,231,563 $396,679 $6,830,997
ND $35,322 $12,397 $3,516,572 $3,564,291
NE $1,495,285 $6,269,041 $6,794,060 $14,558,386
NH $0 $779,994 $0 $779,994
NJ $38,734,194 $25,416,700 $4,117,904 $68,268,798
NM $1,278,660 $2,235,250 $2,269,539 $5,783,449
NV $915,160 $3,624,944 $605,072 $5,145,176
NY $540,131 $31,400,265 $7,471,359 $39,411,755
OH $1,318,133 $15,294,057 $27,938,348 $44,550,538
29
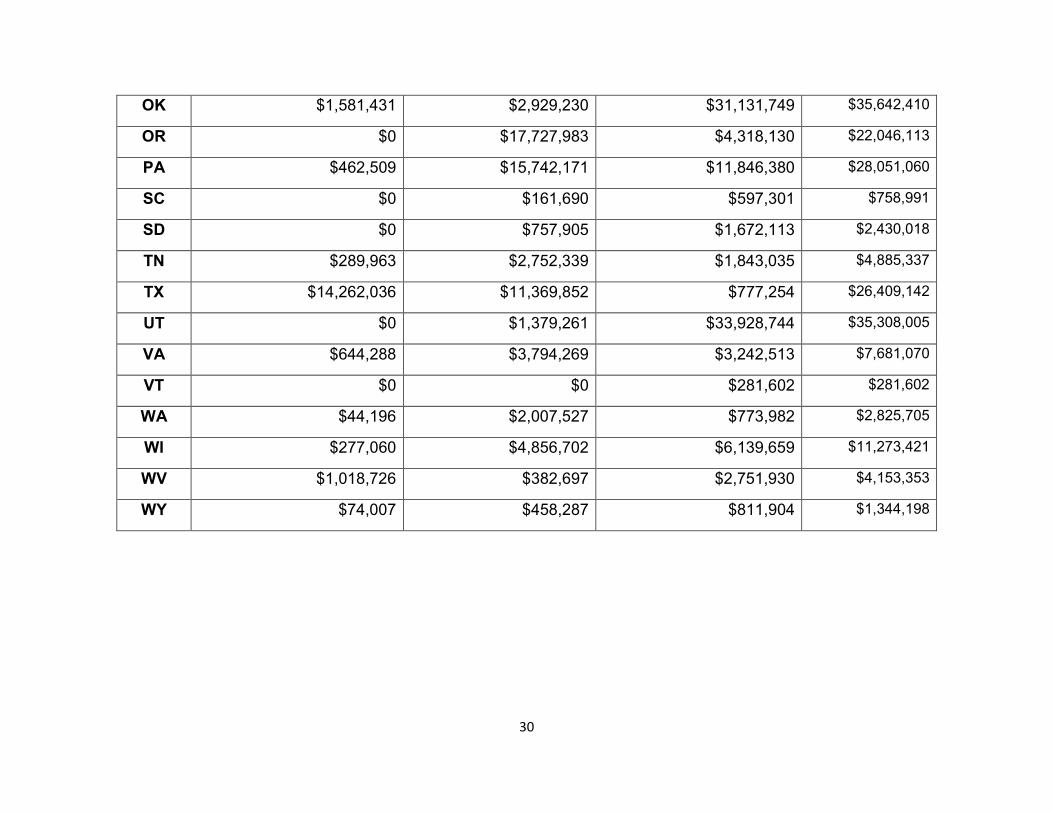
OK $1,581,431 $2,929,230 $31,131,749 $35,642,410
OR $0 $17,727,983 $4,318,130 $22,046,113
PA $462,509 $15,742,171 $11,846,380 $28,051,060
SC $0 $161,690 $597,301 $758,991
SD $0 $757,905 $1,672,113 $2,430,018
TN $289,963 $2,752,339 $1,843,035 $4,885,337
TX $14,262,036 $11,369,852 $777,254 $26,409,142
UT $0 $1,379,261 $33,928,744 $35,308,005
VA $644,288 $3,794,269 $3,242,513 $7,681,070
VT $0 $0 $281,602 $281,602
WA $44,196 $2,007,527 $773,982 $2,825,705
WI $277,060 $4,856,702 $6,139,659 $11,273,421
WV $1,018,726 $382,697 $2,751,930 $4,153,353
WY $74,007 $458,287 $811,904 $1,344,198
30
Liquid Release
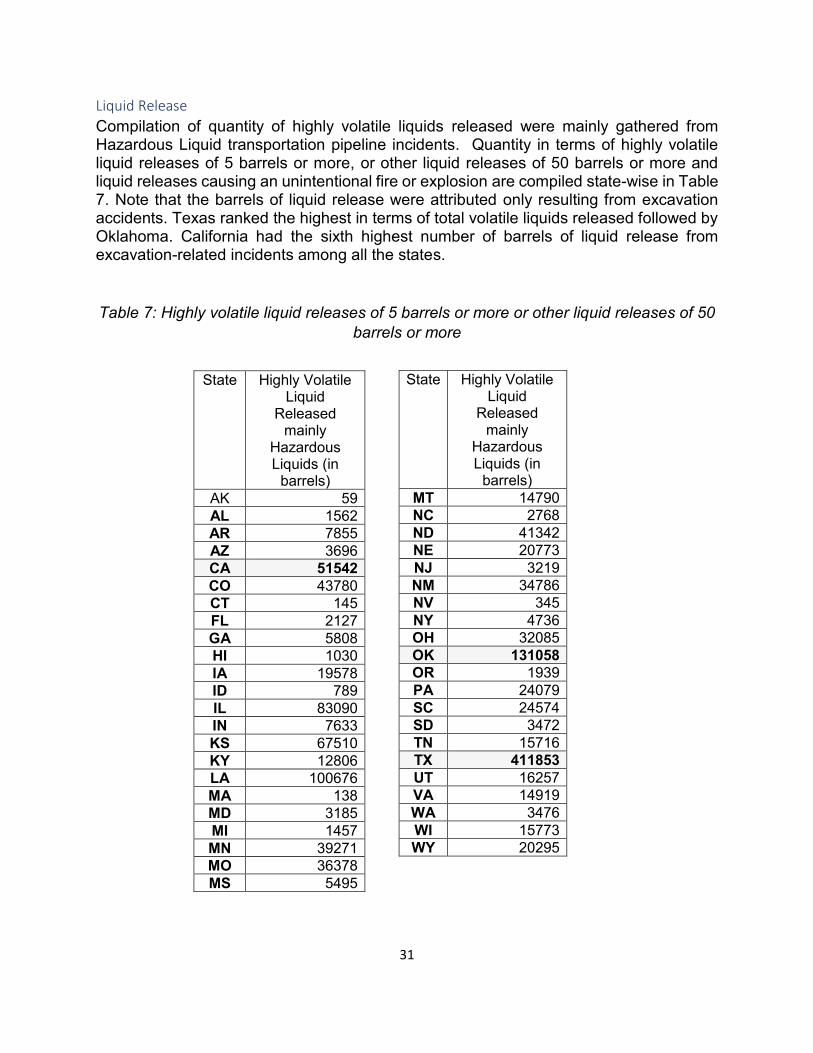
Compilation of quantity of highly volatile liquids released were mainly gathered from Hazardous Liquid transportation pipeline incidents. Quantity in terms of highly volatile liquid releases of 5 barrels or more, or other liquid releases of 50 barrels or more and liquid releases causing an unintentional fire or explosion are compiled state-wise in Table 7. Note that the barrels of liquid release were attributed only resulting from excavation accidents. Texas ranked the highest in terms of total volatile liquids released followed by Oklahoma. California had the sixth highest number of barrels of liquid release from excavation-related incidents among all the states.
Table 7: Highly volatile liquid releases of 5 barrels or more or other liquid releases of 50 barrels or more
State Highly Volatile Liquid
Released mainly
Hazardous Liquids (in
barrels) AK 59 AL 1562 AR 7855 AZ 3696 CA 51542 CO 43780 CT 145 FL 2127 GA 5808 HI 1030 IA 19578 ID 789 IL 83090 IN 7633 KS 67510 KY 12806 LA 100676 MA 138 MD 3185 MI 1457 MN 39271 MO 36378 MS 5495
State Highly Volatile Liquid
Released mainly
Hazardous Liquids (in
barrels) MT 14790 NC 2768 ND 41342 NE 20773 NJ 3219 NM 34786 NV 345 NY 4736 OH 32085 OK 131058 OR 1939 PA 24079 SC 24574 SD 3472 TN 15716 TX 411853 UT 16257 VA 14919 WA 3476 WI 15773 WY 20295
31
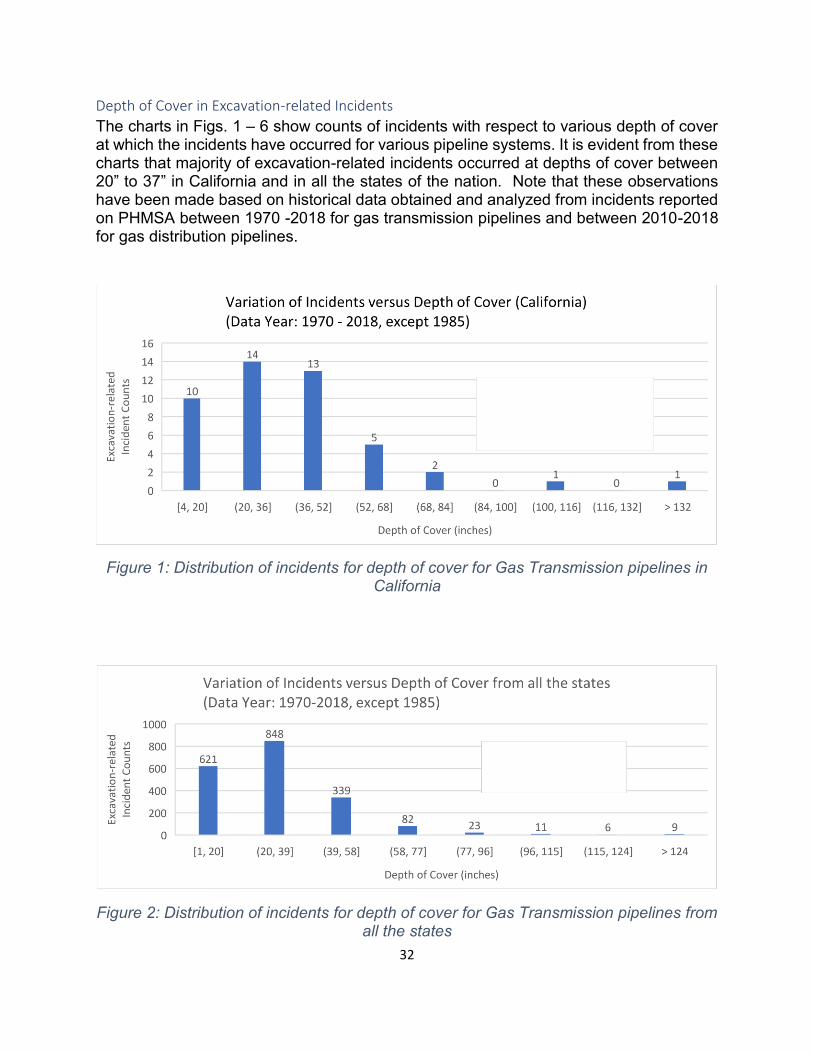
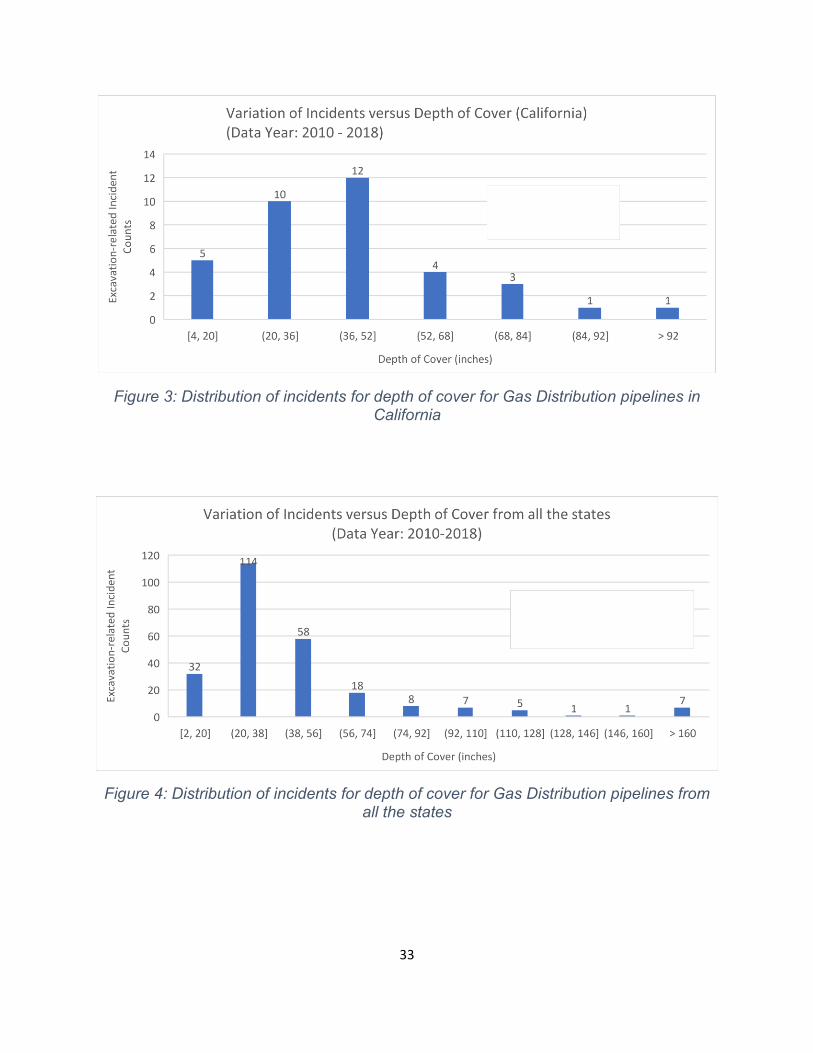
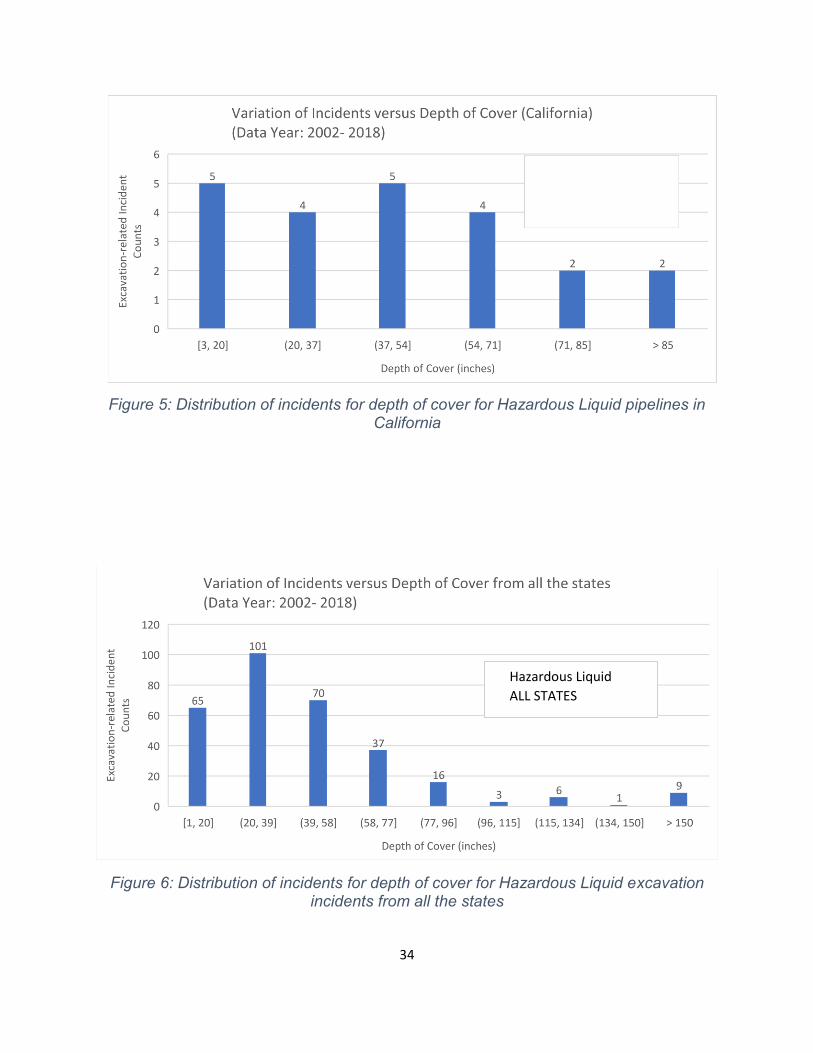
Depth of Cover in Excavation-related Incidents
The charts in Figs. 1 – 6 show counts of incidents with respect to various depth of cover at which the incidents have occurred for various pipeline systems. It is evident from these charts that majority of excavation-related incidents occurred at depths of cover between 20” to 37” in California and in all the states of the nation. Note that these observations have been made based on historical data obtained and analyzed from incidents reported on PHMSA between 1970 -2018 for gas transmission pipelines and between 2010-2018 for gas distribution pipelines.
Gas Transmission -
CALIFORNIA
Figure 1: Distribution of incidents for depth of cover for Gas Transmission pipelines in California
Gas Transmission
ALL STATES
Figure 2: Distribution of incidents for depth of cover for Gas Transmission pipelines from all the states
32
Gas Distribution
CALIFORNIA
Figure 3: Distribution of incidents for depth of cover for Gas Distribution pipelines in California
Gas Distribution
ALL STATES
Figure 4: Distribution of incidents for depth of cover for Gas Distribution pipelines from all the states
33
Hazardous Liquid
CALIFORNIA
Figure 5: Distribution of incidents for depth of cover for Hazardous Liquid pipelines in California
Hazardous Liquid
ALL STATES
Figure 6: Distribution of incidents for depth of cover for Hazardous Liquid excavation incidents from all the states
34
Encasement Information Analysis of underground pipeline incident data from 2010 to 2018 showed that almost none of the pipelines involved in excavation accidents were ‘cased’ for Gas Transmission or Hazardous Liquid – which are high pressure pipelines. Pipelines that were noted as cased and involved in leakages were due to corrosion damage or damage that was incurred during installation. There was only one incident reported to a cased Gas Distribution pipeline in 2016 under a public street pavement in Kansas due to excavation damage. The pipeline was struck due to lack of information of the location of the gas carrying pipe. The pipeline material was steel, was 4” in diameter and the depth of cover was 144”. The pipeline was struck during directional drilling to install a fiber optics line. No information was provided on the encasement material.
Casings – Pros and Cons
There are number of pros and cons associated with casing a pipeline at the crossings which are
Pros
The advantages for the encasement of pipeline crossings include the following:
1. Casings are used to protect the pipeline from external damage – especially during any construction or maintenance activities.
2. Casings protect the pipeline from surrounding adverse soil conditions during construction – particularly against damage from rocky subsurface soil.
3. Insertion, replacement, removal, or maintenance of carrier pipe can be easily carried out -especially where trenching needs to be avoided.
4. Leaking gases or fluids can be dissipated and collected using casings at the end points of the casing such as drainage way, venting points, or right-of-way line.
Cons
There are several cons which have been identified in literature on the use of casing for carrier pipe. These are divided into two categories for classification purposes, i.e. cons due to – (A) Construction-related activity and (B) Material related (NCHRP Project Report 20-7):
Construction-related:
1. Often insulators stack together at the end of a casing.
2. The pipeline outside the casing can deflect and settle if fill inside bore pits at the casing ends is not sufficiently compacted during installation – thus the pipeline comes in contact to the casing pipe.
35
3. Highway widening becomes difficult at locations if there are horizontal and vertical bends in the pipeline which run through casings.
4. Visually inspecting a carrier within the casing is impossible, and hence, any damage to carrier pipe goes undetected.
Material-related:
1. Defects in the casing cross section can sometimes cause the carrier to bind inside the casing.
2. Sometimes water enters a casing through defective end seals, casing joints, or external vents– this increases the corrosion potential of the pipeline, and finally
Cased Installations - Remarks
The pros of casing the pipeline against external/accidental damage outweighs the cons. This is because damages to uncased pipes have resulted in high number of fatalities and injuries. Leakages in cased carrier pipes, whether due to wrong construction practices or material defects, have often been detected and fixed causing minimal fatalities or injuries or traffic closures.
In addition, adopting best practices in construction methodologies and choice of high-quality casing material can often eliminate most cons – particularly those that are constructed-related as follows:
1. Crossing failure: This can result due to improper installation and inspection procedures or insufficient clearance between pipe and casing (see Fig. 7)
2. Excessive force is often applied to drive the carrier through its casing. This could cause damage to the carrier pipe or casing insulators or both. Or, result in irregular casing line or grade and displacement at casing joints.
3. During construction or after construction, lack of separation between a carrier and casing can result in metal-to-metal contact between the carrier and casing. This can cause short circuit in the cathodic protection system and drains protective current from the remaining pipeline resulting in an increase in the corrosion potential at the point of contact between carrier and casing.
36
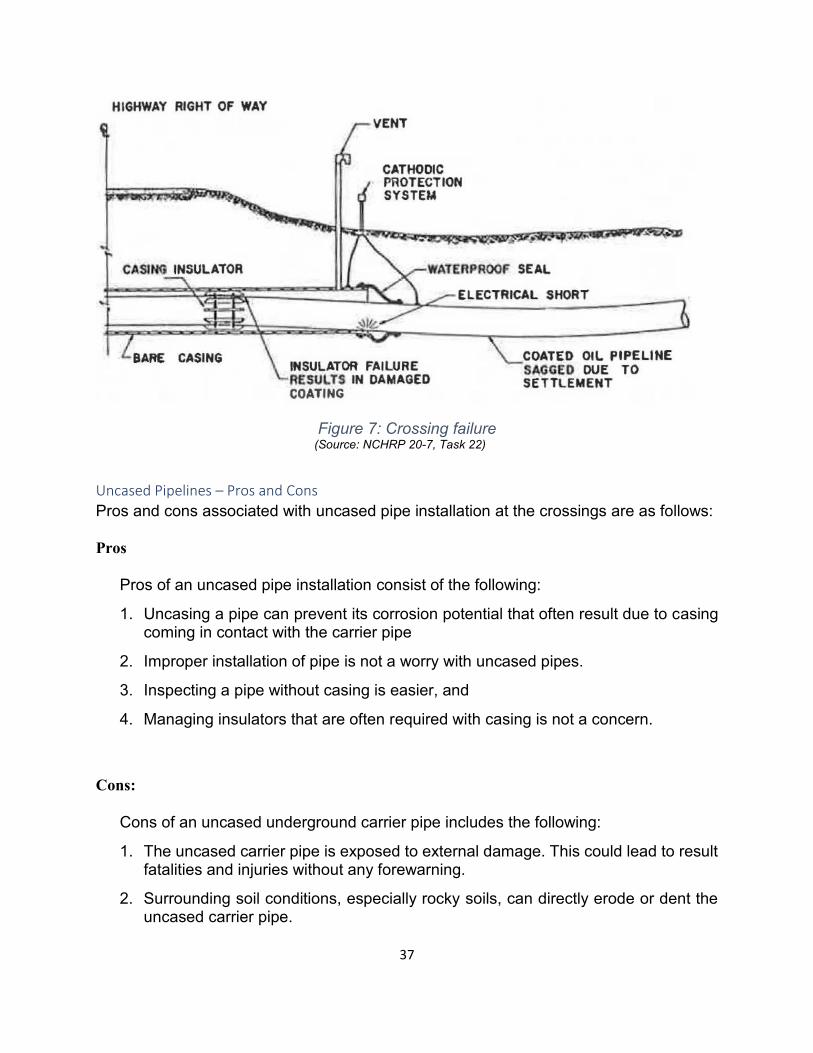
Figure 7: Crossing failure (Source: NCHRP 20-7, Task 22)
Uncased Pipelines – Pros and Cons
Pros and cons associated with uncased pipe installation at the crossings are as follows:
Pros
Pros of an uncased pipe installation consist of the following:
1. Uncasing a pipe can prevent its corrosion potential that often result due to casing coming in contact with the carrier pipe
2. Improper installation of pipe is not a worry with uncased pipes.
3. Inspecting a pipe without casing is easier, and
4. Managing insulators that are often required with casing is not a concern.
Cons:
Cons of an uncased underground carrier pipe includes the following:
1. The uncased carrier pipe is exposed to external damage. This could lead to result fatalities and injuries without any forewarning.
2. Surrounding soil conditions, especially rocky soils, can directly erode or dent the uncased carrier pipe.
37
3. Detection of the leakage point under a pavement surface from an uncased carrier pipe can be problematic, especially if the surrounding soil is clay, and
4. Replacement of uncased pipe is often difficult, and sometimes it is cost effective to completely abandon the leaking pipe and install a new one.
Uncased Installations - Remarks
Uncased pipelines are vulnerable to accidental damage during construction activities. Despite the pros, uncased pipelines can also be damaged during their installations. With uncased pipes, the damage can often go undetected until any leakage occurs at later times. This could require increased frequency of inspection and maintenance for the uncased pipeline. However, choice of high-quality standard carrier pipe material can prevent damages that could occur to uncased pipes during their installation.
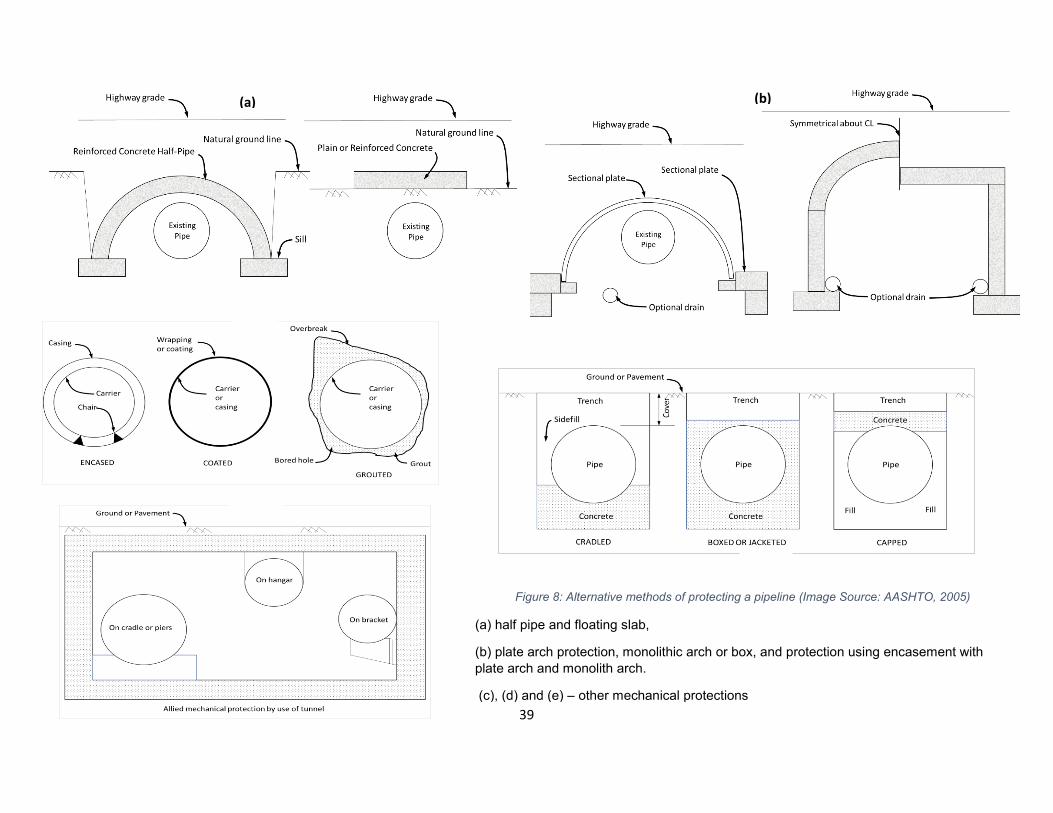
Alternatives to Casing There are alternatives to casing a pipeline which often ensure the same level of protection to the carrier pipe and eliminates most of the cons listed above. For example, a single box-culvert-like structure can be used (see Fig. 8). In specific, protection to the carrier can be ensured using encasement with half pipe and floating slab, plate arch protection, monolithic arch or box, and protection using encasement with plate arch and monolith arch or other types of mechanical protection for underground utility crossings as shown in Fig. 8.
38
39
(a) (b)
(c)
(d)
(e)
Figure 8: Alternative methods of protecting a pipeline (Image Source: AASHTO, 2005)
(a) half pipe and floating slab,
(b) plate arch protection, monolithic arch or box, and protection using encasement with plate arch and monolith arch.
(c), (d) and (e) – other mechanical protections
3. CURRENT ENCASEMENT STANDARDS FOR PIPELINE SAFETY The following references have been used to document findings of this section:
I. References to existing standards on gas transmissions provided by the standard developing organizations such as the American Society of Mechanical Engineers (ASME) and the American National Standards Institute (ANSI).
II. Federal encasement requirements and guidelines, and III. Regulations/guidelines with respect to encasement requirements in six key
states covering California, Missouri, Alabama, Iowa, Virginia and Texas.
Utility and Organizational Standards Based literature reviews from publicly available reports, open access manuals and publications, it was noted that most utility companies operating in California did not post online guidelines that are being followed for encasement requirements.
ASME/ANSI B31.8-2018 Gas Transmission and Distribution Piping Systems and the ASME/ANSI B31.4 Pipeline Transmission Systems for Liquid Hydrocarbons and Other Liquids provide directions and relevant standards to protecting pipes. ASME/ANSI B31.8-2018 sets forth engineering requirements deemed necessary for the safe design and construction of pressure piping and includes provisions for protecting pipelines from external and internal corrosion. ASME B31.4 prescribes requirements for the design, materials, construction, assembly, inspection, testing, operation, and maintenance of liquid pipeline systems.
Code of Federal Regulations (CFR) The minimum Federal safety standards for transportation by pipeline are 49 CFR Part 192, Transportation of Natural and Other Gas by Pipeline, and 49 CFR Part 195, Transportation of Liquids by Pipeline. Neither of these regulations require that casings be used. However, Section 195.256, Crossing of railroads and highways, of the liquid regulations requires such crossings be installed to adequately withstand the dynamic forces exerted by anticipated traffic loads. Section 192.103 of the gas regulations requires that all pipelines be designed with sufficient wall thickness or must be installed with adequate protection to withstand anticipated external pressures and loads. Section 192.323, Casing, sets forth the requirements for casings if they are used on a gas transmission line or main under a railroad or highway (Office of Pipeline Safety Operations, 2018; 49 CFR 192.323).
American Association of State Highway and Transportation Officials (AASHTO) AASHTO 2005 “A Guide for Accommodating Utilities within Highway Right-of-Way” states that the need for casing of pressurized carrier pipes and carriers of materials that are flammable, corrosive, expansive, energized, or unstable should be determined by the transportation agency. Further casings should be considered for the following conditions:
40
1. Crossings of freeways, expressways, and other controlled access highways and at other locations where it is necessary to avoid trenched construction.
2. As protection for carrier pipe from external loads or shock either during or after construction of the highway.
▪ “Jacked or bored installations of coated carrier pipes should be encased. Exceptions may be made where assurance can be provided against damage to the protective coating.”
▪ “On uncased construction the carrier shall conform to the material and design requirements of utility industry and governmental codes and standards. In addition, the carrier pipe should be designed to support the load of the highway plus superimposed loads thereon when the pipe is operated under all ranges of pressure from maximum internal to zero pressure. Such installations should employ a higher factor of safety in the design, construction, and testing than would normally be required for cased construction.”
▪ “Uncased crossing of welded steel pipelines which carry flammable, corrosive, expansive, energized, or unstable materials, particularly if carried at high pressure or potential, maybe permitted, provided additional protective measures are taken in lieu of encasement. Such measures would employ a higher factor of safety in the location, design, construction, and testing of the uncased-carrier pipe, including such features as increased depth of cover, thicker wall pipe, radiograph testing of welds, hydrostatic testing, coating and wrapping, and cathodic protection.”
Regulations/guidelines from Key States
Alabama ALDOT Utilities Manual (ALDOT, 2018) and a report by Lindly et al. (2015) highlights that the encasements are required on interstates and on all roadways “unless otherwise exempted” or “unless a utility obtains approvals to forego encasement,” which require a variance request. Steel lines greater than 2 inches must be encased. Exceptions to policy on encasement include:
i. Higher factor of safety in design, construction, and testing ii. Welded steel pipe iii. Thicker walled pipe iv. Radiographic testing of welds v. Hydrostatic testing vi. Coating and wrapping vii. Protective concrete slabs under ditch lines viii. Cathodic protection, and ix. P.E. certification that design, construction, and testing provide safety at least equal
to a cased crossing.
41
California Guidance on encasement is provided in Chapter 600 Utilities Permits, Encroachment Permits Manual, which states that the utility facilities must comply with the following encasement and protection requirements:
1. Types of facilities requiring encasement or protection:
a. High priority utilities (mentioned in Table 8) are required to be encased on both conventional and access-controlled highway right-of-way, when installed either longitudinal or transverse to highway.
- An exception to this policy may be allowed for the installation of Uncased High-Pressure Natural Gas Pipelines when in compliance with the TR-0158 Special Provisions.
- Service laterals are exempt from encasement requirement.
b. Additionally, pressurized liquid carrier facilities are required to be encased on both conventional and access-controlled highway right-of-way when installed either longitudinal or transverse to highway.
- Service laterals are exempt from encasement requirement.
c. Additionally, for all transverse crossings, placement of multiple pipes or ducts, regardless of diameters are required to be encased on both conventional and access-controlled highway right-of-way.
d. Consider encasement of carriers that are exempt from encasement, when these possibilities exist: o When under embankments of 10 feet or more. o Appreciable settlement of supporting ground. o When detrimental subsidence of the ground under a fill is anticipated. In such
cases, a sleeve 6 inches larger than the outside diameter of the pipe is recommended.
o Damage to protective pipe coatings during jacking. o A corrosion protective coating and/or cathodic protection may be required due to
corrosive environments or when California Public Utilities Commission (CPUC) requires cathodic protection. (Corrosive environments can deteriorate steel and cement mortar. Check cathodic protection requirements with headquarters Structures Design, Electrical, Mechanical, Water and Waste Water Branch.)
o Cracking of mortar coating during jacking or boring operations. o Corrosion of field-coated joints. o Existing electrical and communication lines under an embankment of 10 feet or
more.
The information on encasement requirements outlined above for High Priority Utilities have been summarized in Table 8.
42
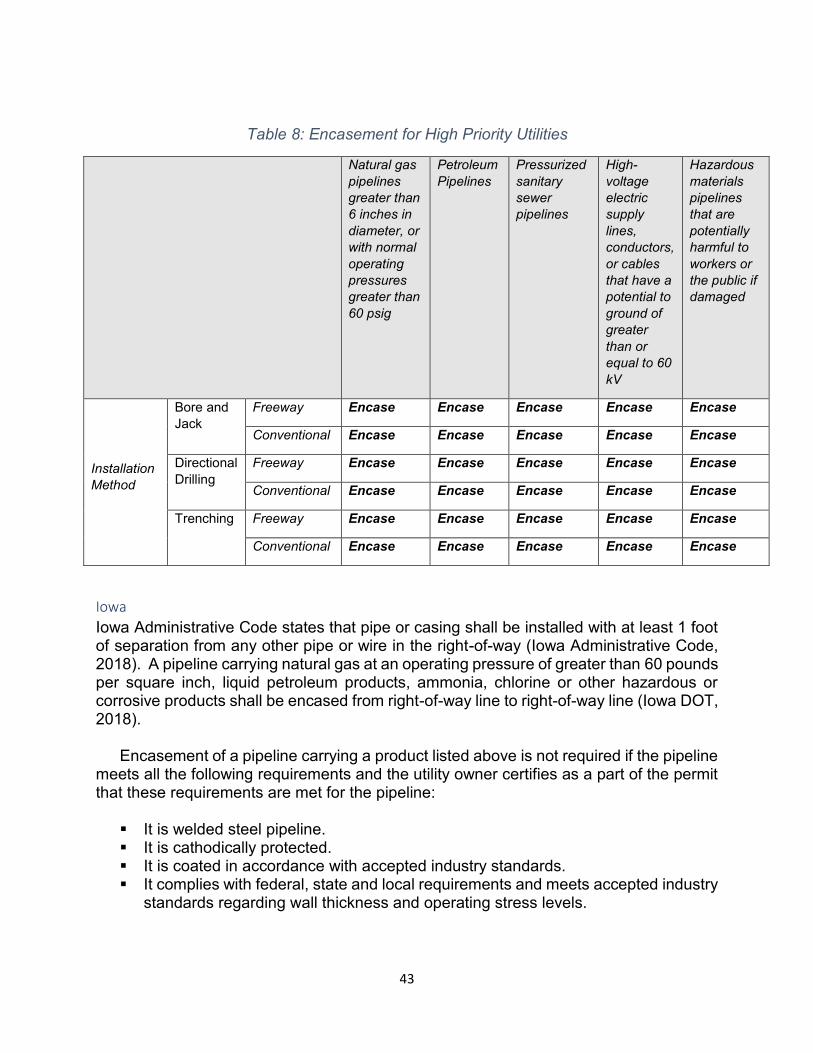
Table 8: Encasement for High Priority Utilities
Natural gas pipelines greater than 6 inches in diameter, or with normal operating pressures greater than 60 psig
Petroleum Pipelines
Pressurized sanitary sewer pipelines
High-voltage electric supply lines, conductors, or cables that have a potential to ground of greater than or equal to 60 kV
Hazardous materials pipelines that are potentially harmful to workers or the public if damaged
Installation Method
Bore and Jack
Freeway Encase Encase Encase Encase Encase
Conventional Encase Encase Encase Encase Encase
Directional Drilling
Freeway Encase Encase Encase Encase Encase
Conventional Encase Encase Encase Encase Encase
Trenching Freeway Encase Encase Encase Encase Encase
Conventional Encase Encase Encase Encase Encase
Iowa
Iowa Administrative Code states that pipe or casing shall be installed with at least 1 foot of separation from any other pipe or wire in the right-of-way (Iowa Administrative Code, 2018). A pipeline carrying natural gas at an operating pressure of greater than 60 pounds per square inch, liquid petroleum products, ammonia, chlorine or other hazardous or corrosive products shall be encased from right-of-way line to right-of-way line (Iowa DOT, 2018).
Encasement of a pipeline carrying a product listed above is not required if the pipeline meets all the following requirements and the utility owner certifies as a part of the permit that these requirements are met for the pipeline:
▪ It is welded steel pipeline. ▪ It is cathodically protected. ▪ It is coated in accordance with accepted industry standards. ▪ It complies with federal, state and local requirements and meets accepted industry
standards regarding wall thickness and operating stress levels.
43
Missouri Engineering Policy Guide states that for Major Routes (Interstate System or Other Freeways, With Controlled and Normal Access Right of Way), underground utility crossings will be continuously encased under through roadways, the median, ramps and shoulder areas with the casing extending to the toe of the fill slopes or to the ditch line [6]. Encasement will be required under high type outer roadways. However, exceptions may be made for encasement for the following:
i) Natural gas distribution pipe (nominal 6-inch diameter maximum) of polyethylene (PE) plastic, traceable, installed by a horizontal bore method at a minimum depth of 72 in. under ditches and roadways, constructed in accordance with and meeting applicable material requirements.
ii) Non-fiber communication or electric cables installed in ducts
iii) Welded steel pipelines carrying gaseous or liquid petroleum products -provided they are cathodically protected against corrosion, triple-coated in accordance with accepted pipeline construction standards, and meet applicable material requirements
iv) Gas service connections of steel or copper, protected and constructed in accordance with and meeting applicable material requirements
v) Water service connections and crossings of copper 2-inch inside diameter or less, and meeting applicable material requirements.
Texas Texas Administrative Code (TAC) under SUBCHAPTER C. UTILITY ACCOMMODATION states the following on encasement (Texas Administrative Code, 2018):
A. Underground utility facilities crossing the highway shall be encased in the interest of safety, protection of the utility, protection of the highway, and for access to the utility facility. Casing shall consist of a pipe or other separate structure around and outside the carrier line. The utility must demonstrate that the casing will be adequate for the expected loads and stresses.
B. Casing pipe shall be steel, concrete, or plastic pipe as approved by the district, except that if horizontal directional drilling is used to place the casing, high-density polyethylene (HDPE) pipe must be used in place of plastic pipe.
C. Encasement may be of metallic or non-metallic material. Encasement material shall be designed to support the load of the highway and superimposed loads thereon, including that of construction machinery. The strength of the encasement material shall equal or exceed structural requirements for drainage culverts and it shall be composed of material of satisfactory durability for conditions to which it may be subjected. The length of any encasement under the roadway shall be provided from top of backslope to top of backslope for cut sections, five feet beyond
44
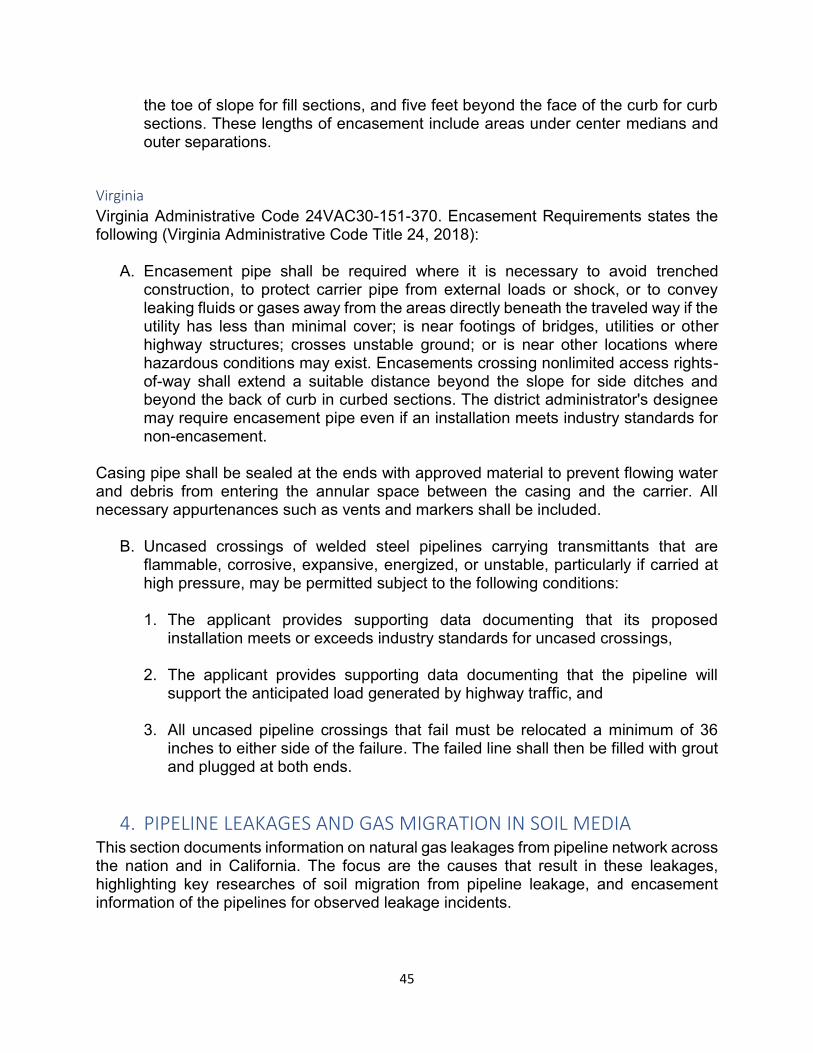
the toe of slope for fill sections, and five feet beyond the face of the curb for curb sections. These lengths of encasement include areas under center medians and outer separations.
Virginia
Virginia Administrative Code 24VAC30-151-370. Encasement Requirements states the following (Virginia Administrative Code Title 24, 2018):
A. Encasement pipe shall be required where it is necessary to avoid trenched construction, to protect carrier pipe from external loads or shock, or to convey leaking fluids or gases away from the areas directly beneath the traveled way if the utility has less than minimal cover; is near footings of bridges, utilities or other highway structures; crosses unstable ground; or is near other locations where hazardous conditions may exist. Encasements crossing nonlimited access rights-of-way shall extend a suitable distance beyond the slope for side ditches and beyond the back of curb in curbed sections. The district administrator's designee may require encasement pipe even if an installation meets industry standards for non-encasement.
Casing pipe shall be sealed at the ends with approved material to prevent flowing water and debris from entering the annular space between the casing and the carrier. All necessary appurtenances such as vents and markers shall be included.
B. Uncased crossings of welded steel pipelines carrying transmittants that are flammable, corrosive, expansive, energized, or unstable, particularly if carried at high pressure, may be permitted subject to the following conditions:
1. The applicant provides supporting data documenting that its proposed installation meets or exceeds industry standards for uncased crossings,
2. The applicant provides supporting data documenting that the pipeline will support the anticipated load generated by highway traffic, and
3. All uncased pipeline crossings that fail must be relocated a minimum of 36 inches to either side of the failure. The failed line shall then be filled with grout and plugged at both ends.
4. PIPELINE LEAKAGES AND GAS MIGRATION IN SOIL MEDIA This section documents information on natural gas leakages from pipeline network across the nation and in California. The focus are the causes that result in these leakages, highlighting key researches of soil migration from pipeline leakage, and encasement information of the pipelines for observed leakage incidents.
45
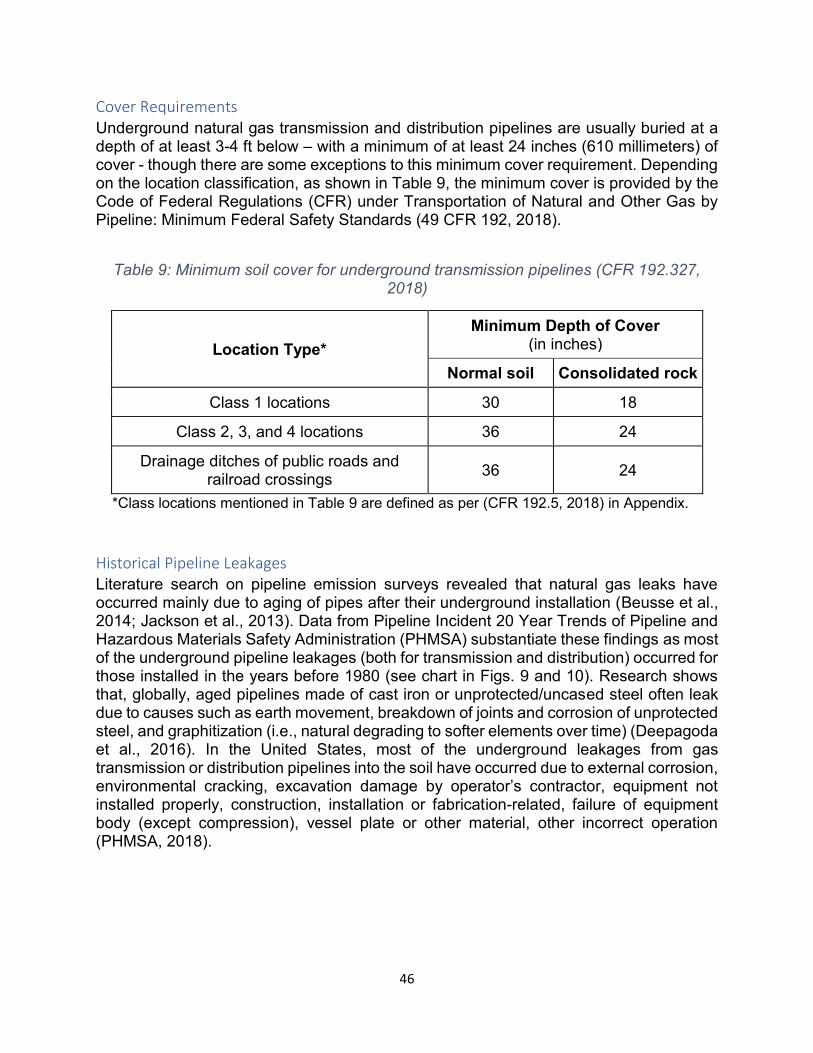
Cover Requirements Underground natural gas transmission and distribution pipelines are usually buried at a depth of at least 3-4 ft below – with a minimum of at least 24 inches (610 millimeters) of cover - though there are some exceptions to this minimum cover requirement. Depending on the location classification, as shown in Table 9, the minimum cover is provided by the Code of Federal Regulations (CFR) under Transportation of Natural and Other Gas by Pipeline: Minimum Federal Safety Standards (49 CFR 192, 2018).
Table 9: Minimum soil cover for underground transmission pipelines (CFR 192.327, 2018)
Location Type* Minimum Depth of Cover
(in inches)
Normal soil Consolidated rock
Class 1 locations 30 18
Class 2, 3, and 4 locations 36 24
Drainage ditches of public roads and railroad crossings 36 24
*Class locations mentioned in Table 9 are defined as per (CFR 192.5, 2018) in Appendix.
Historical Pipeline Leakages Literature search on pipeline emission surveys revealed that natural gas leaks have occurred mainly due to aging of pipes after their underground installation (Beusse et al., 2014; Jackson et al., 2013). Data from Pipeline Incident 20 Year Trends of Pipeline and Hazardous Materials Safety Administration (PHMSA) substantiate these findings as most of the underground pipeline leakages (both for transmission and distribution) occurred for those installed in the years before 1980 (see chart in Figs. 9 and 10). Research shows that, globally, aged pipelines made of cast iron or unprotected/uncased steel often leak due to causes such as earth movement, breakdown of joints and corrosion of unprotected steel, and graphitization (i.e., natural degrading to softer elements over time) (Deepagoda et al., 2016). In the United States, most of the underground leakages from gas transmission or distribution pipelines into the soil have occurred due to external corrosion, environmental cracking, excavation damage by operator’s contractor, equipment not installed properly, construction, installation or fabrication-related, failure of equipment body (except compression), vessel plate or other material, other incorrect operation (PHMSA, 2018).
46
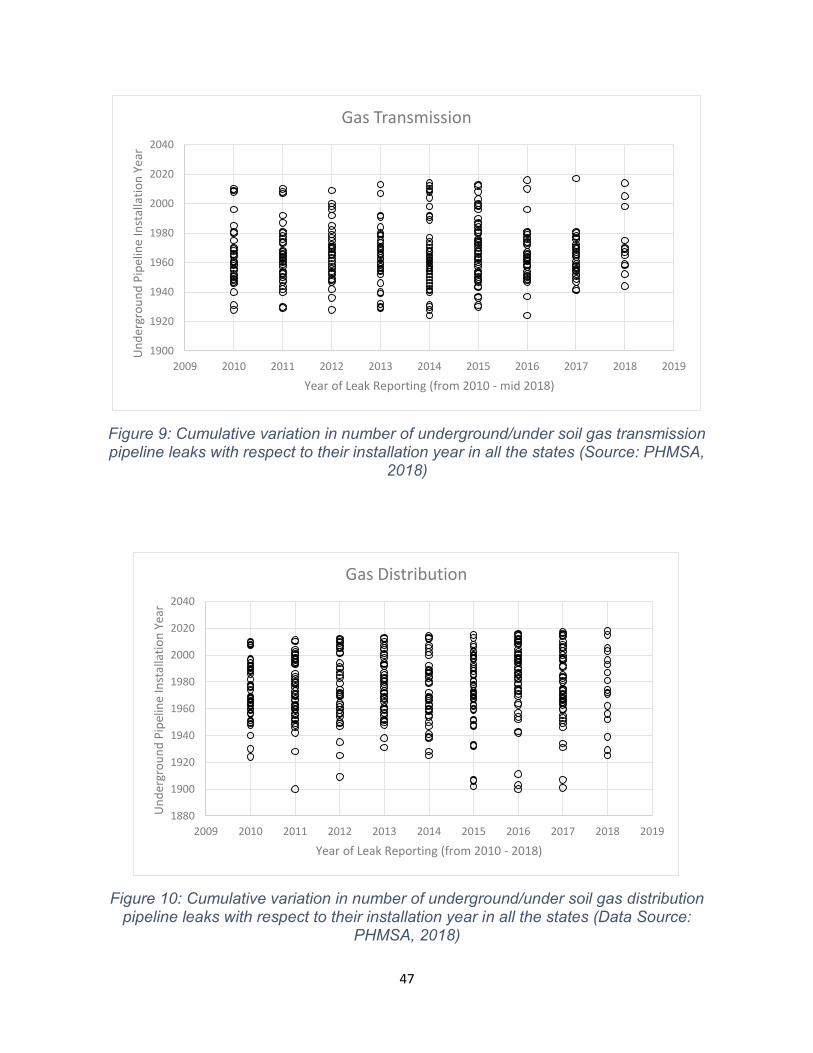
1900
1920
1940
1960
1980
2000
2020
2040
2009 2010 2011 2012 2013 2014 2015 2016 2017 2018 2019
Un
der
gro
un
d P
ipel
ine
Inst
alla
tio
n Y
ear
Year of Leak Reporting (from 2010 - mid 2018)
Gas Transmission
Figure 9: Cumulative variation in number of underground/under soil gas transmission pipeline leaks with respect to their installation year in all the states (Source: PHMSA,
2018)
1880
1900
1920
1940
1960
1980
2000
2020
2040
2009 2010 2011 2012 2013 2014 2015 2016 2017 2018 2019
Un
der
gro
un
d P
ipel
ine
Inst
alla
tio
n Y
ear
Year of Leak Reporting (from 2010 - 2018)
Gas Distribution
Figure 10: Cumulative variation in number of underground/under soil gas distribution pipeline leaks with respect to their installation year in all the states (Data Source:
PHMSA, 2018)
47
The data in Table 10 shows cumulative counts of gas transmission and distribution leakages for all the states from 2010 to 2018.
Table 10: Gas transmission and distribution pipeline leakage data from 2010 to mid-2018 from all the states
Year Frequency of Pipeline Leakages for Gas
Transmission
Frequency of Pipeline Leakages for Gas
Distribution
2010 50 58
2011 58 67
2012 49 50
2013 51 66
2014 59 56
2015 69 59
2016 40 73
2017 36 62
2018 14 28
Total 426 519
Analysis of top-ten causes for underground pipeline leakages across the country from 2010 to mid-2018 showed that the leaks have been mainly attributed due to excavation damage by third party, construction-, installation-, or fabrication-related, and from corrosions of the pipelines (whether external or internal). This is shown in the Tables 11 and 12 based on data derived from the PHMSA.
48
Table 11: Compilation of causes for underground gas transmission pipeline leakage across the country from 2010 to 2018
Top-ten Reasons for Pipeline Leakage in Gas Transmission Lines
Number of Leakages Recorded
Excavation damage by third party 89
Construction-, installation-, or fabrication-related 64
External corrosion 51
Internal corrosion 43
Original manufacturing-related (not girth weld or other welds formed in the field)
24
Environmental cracking-related 18
Excavation damage by operator's contractor (second party) 18
Previous damage due to excavation activity 14
Threaded connection/coupling failure 14
Non-threaded connection failure 12
Table 12: Compilation of causes for underground gas distribution pipeline leakage across the country from 2010 to 2018
Top-ten Reasons for Pipeline Leakage in Gas Distribution Lines
Number of Leakages Recorded
Excavation damage by third party 219
Other outside force damage 35
Other incorrect operation 22
Electrical arcing from other equipment or facility 17
Excavation damage by operator's contractor (second party) 15
External corrosion 15
Body of pipe 11
49

Previous damage due to excavation activity 11
Damage by car, truck, or other motorized vehicle/equipment not engaged in excavation
10
Excavation Damage by Operator (First Party) 9
Within California, there have been a total of 47 gas transmission pipeline leaks recorded from 2010 to mid-2018 (with top-five leakage causes shown in Table 13). Similarly, there were 70 gas distribution pipeline leakages, out of which top-five causes have been shown in Table 14. The various causes of these underground pipeline leakages in California include excavation damage by third party, construction-, installation- or fabrication-related, environmental cracking-related, external corrosion, among others.
Table 13: Top-five causes of underground gas transmission pipeline leakages in California from 2010 to 2018
Cause of Leakage in California for Gas Transmission Lines Number of Leakages
Recorded from 2010 - 2018
Excavation damage by third party 25
External corrosion 4
Other incorrect operation 3
Construction-, installation-, or fabrication-related 2
Environmental cracking-related 2
50

Table 14:Top-five causes of underground gas distribution pipeline leakages in California from 2010 to 2018.
Cause of Leakage in California for Gas Distribution Lines Number of Leakages
Recorded from 2010 - 2018
Excavation damage by third party 30
Other outside force damage 9
Electrical arcing from other equipment or facility 6
Excavation damage by operator (first party) 5
Body of pipe 3
Pipeline Leakages and Depth of Cover Data analyses from 2010 to 2018 of underground pipeline leakages (for gas transmission and distribution) across the country shows that most of the leakages occurred for pipelines with depth of cover varying between 30 to 60 inches (see chart in Fig. 11). In California, the depth of cover between 4 in. to 108 in. have been noted to be problematic, with the highest number of leakages (both for gas transmission and distribution pipelines) mainly occurring at depths of cover in the range of 30 to 60 inches. This is similar to what has been found for underground pipes in other states of the nation (see charts in Figs. 11 to 13).
Figure 11: Frequency of underground gas transmission pipeline leakages versus depth of cover for year 2010 to mid-2018 in all the states
51
Figure 12: Frequency of underground gas transmission pipeline leakages versus depth of cover for year 2010 to mid-2018 in California
Figure 13: Frequency of underground gas distribution pipeline leakages versus depth of cover for year 2010 to mid-2018 in all the states
52
Figure 14: Frequency of underground gas distribution pipeline leakages versus depth of cover for year 2010 to mid-2018 in California
The chart in Fig. 15 and Fig. 16 shows the respective percentage distribution of underground gas transmission and distribution pipeline leakage causes with respect to the depth of cover. The data used has been used for pipeline incidents that occurred between 2010 to 2018. The distribution has been divided with respect to the following depth of cover (in inches) categories: 1-30, 31 – 60, 61 – 90, 91 – 120, 121 – 150, 151 – 180, 181 – 210, 211 – 240, 241 – 270 and greater than 270 inches. The two charts show the percentage of leakages has been highest for the range of 31 to 60 inches of depth of cover. Within California, depth of cover less than 60 inches has the highest probability of showing leakage due to excavation (see Fig. 17 and 18).
53
0%
10%
20%
30%
40%
50%
60%
70%
80%
90%
100%
Perc
enta
ge
Depth of cover distribution with respect to key leakage cause 1-30 31 - 60 61 - 90 91 - 120 121 - 150
151 - 180 181 - 210 211 - 240 241 - 270 > 270
Gas Transmission Pipelines (cumulative of all the states)
Note: Depth of cover range are in inches
Figure 15: Year 2010 to 2018 percentage distribution of depth of cover versus leakage causes for Gas Transmission pipelines from all the states.
54
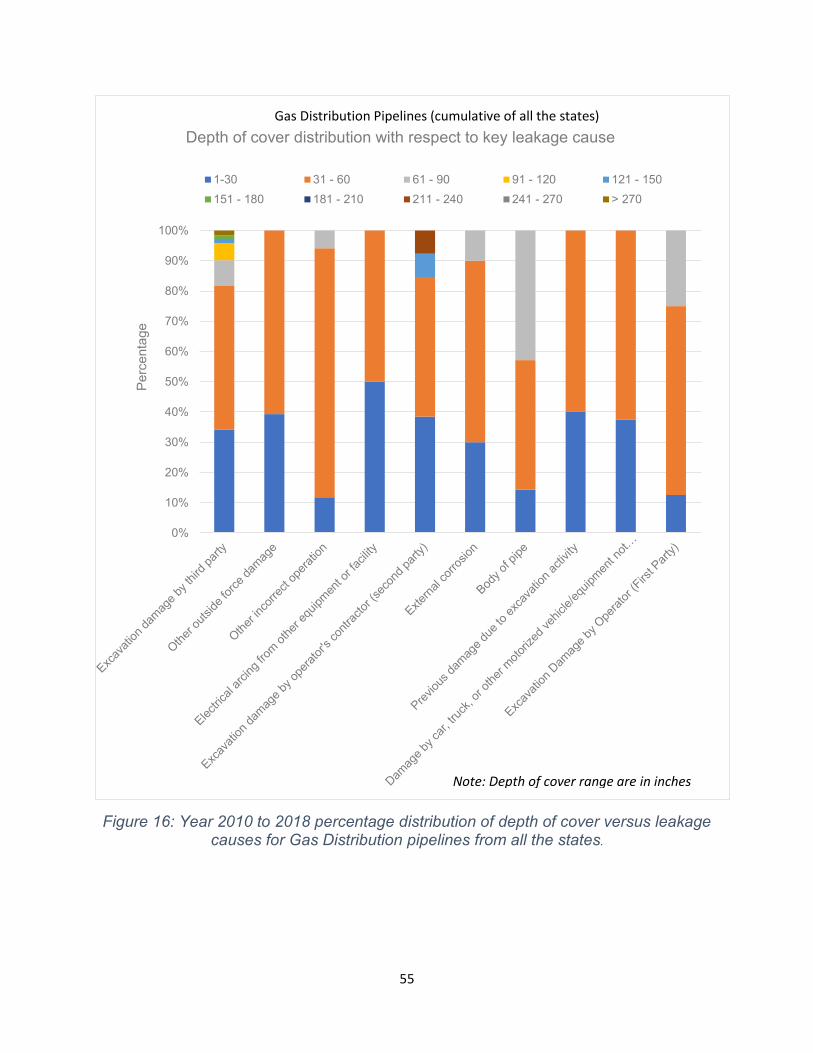
Perc
enta
ge
Gas Distribution Pipelines (cumulative of all the states)
Depth of cover distribution with respect to key leakage cause
1-30 31 - 60 61 - 90 91 - 120 121 - 150 151 - 180 181 - 210 211 - 240 241 - 270 > 270
100%
90%
80%
70%
60%
50%
40%
30%
20%
10%
0%
Note: Depth of cover range are in inches
Figure 16: Year 2010 to 2018 percentage distribution of depth of cover versus leakage causes for Gas Distribution pipelines from all the states.
55

Perc
enta
ge
Gas Transmission Pipelines (California)
Depth of cover distribution with respect to key leakage cause
1-31 31 - 60 61 - 90 211 - 240 241 - 270 > 270
100%
90%
80%
70%
60%
50%
40%
30%
20%
10%
0%
Note: Depth of cover range are in inches
Figure 17: Year 2010 to 2018 percentage distribution of depth of cover versus leakage causes for Gas Transmission pipelines in California.
56
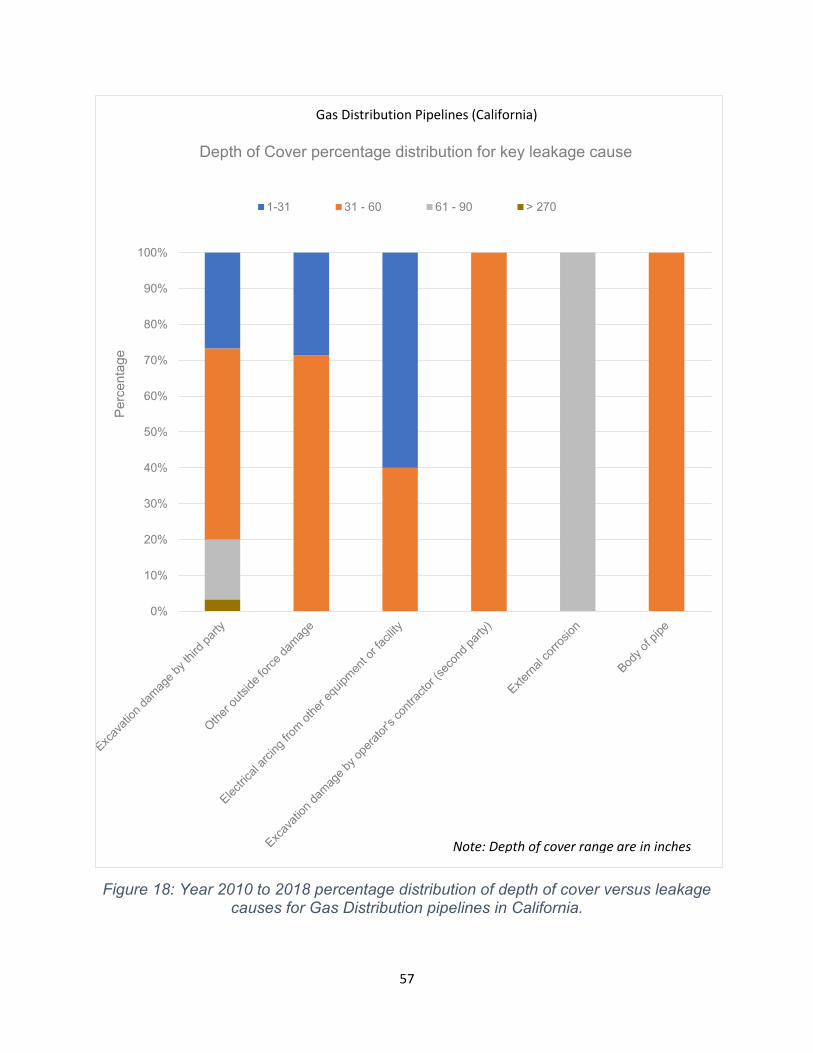
Perc
enta
ge
Gas Distribution Pipelines (California)
Depth of Cover percentage distribution for key leakage cause
1-31 31 - 60 61 - 90 > 270
100%
90%
80%
70%
60%
50%
40%
30%
20%
10%
0%
Note: Depth of cover range are in inches
Figure 18: Year 2010 to 2018 percentage distribution of depth of cover versus leakage causes for Gas Distribution pipelines in California.
57
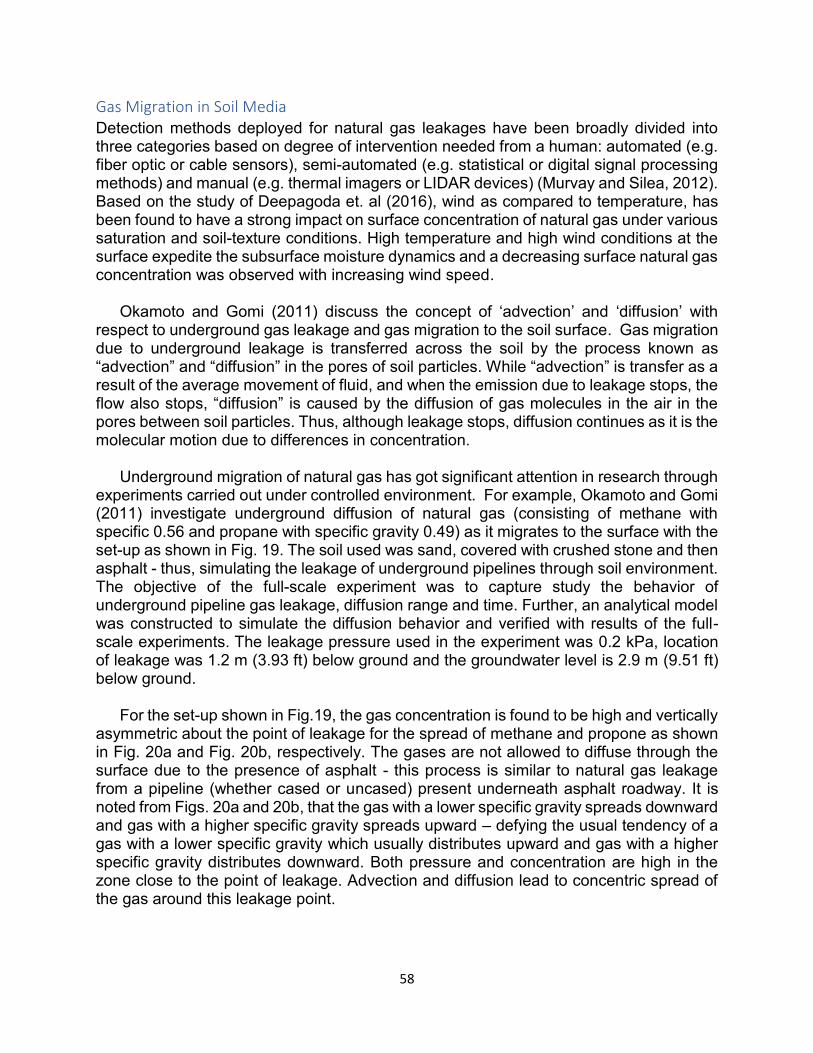
Gas Migration in Soil Media Detection methods deployed for natural gas leakages have been broadly divided into three categories based on degree of intervention needed from a human: automated (e.g. fiber optic or cable sensors), semi-automated (e.g. statistical or digital signal processing methods) and manual (e.g. thermal imagers or LIDAR devices) (Murvay and Silea, 2012). Based on the study of Deepagoda et. al (2016), wind as compared to temperature, has been found to have a strong impact on surface concentration of natural gas under various saturation and soil-texture conditions. High temperature and high wind conditions at the surface expedite the subsurface moisture dynamics and a decreasing surface natural gas concentration was observed with increasing wind speed.
Okamoto and Gomi (2011) discuss the concept of ‘advection’ and ‘diffusion’ with respect to underground gas leakage and gas migration to the soil surface. Gas migration due to underground leakage is transferred across the soil by the process known as “advection” and “diffusion” in the pores of soil particles. While “advection” is transfer as a result of the average movement of fluid, and when the emission due to leakage stops, the flow also stops, “diffusion” is caused by the diffusion of gas molecules in the air in the pores between soil particles. Thus, although leakage stops, diffusion continues as it is the molecular motion due to differences in concentration.
Underground migration of natural gas has got significant attention in research through experiments carried out under controlled environment. For example, Okamoto and Gomi (2011) investigate underground diffusion of natural gas (consisting of methane with specific 0.56 and propane with specific gravity 0.49) as it migrates to the surface with the set-up as shown in Fig. 19. The soil used was sand, covered with crushed stone and then asphalt - thus, simulating the leakage of underground pipelines through soil environment. The objective of the full-scale experiment was to capture study the behavior of underground pipeline gas leakage, diffusion range and time. Further, an analytical model was constructed to simulate the diffusion behavior and verified with results of the full-scale experiments. The leakage pressure used in the experiment was 0.2 kPa, location of leakage was 1.2 m (3.93 ft) below ground and the groundwater level is 2.9 m (9.51 ft) below ground.
For the set-up shown in Fig.19, the gas concentration is found to be high and vertically asymmetric about the point of leakage for the spread of methane and propone as shown in Fig. 20a and Fig. 20b, respectively. The gases are not allowed to diffuse through the surface due to the presence of asphalt - this process is similar to natural gas leakage from a pipeline (whether cased or uncased) present underneath asphalt roadway. It is noted from Figs. 20a and 20b, that the gas with a lower specific gravity spreads downward and gas with a higher specific gravity spreads upward – defying the usual tendency of a gas with a lower specific gravity which usually distributes upward and gas with a higher specific gravity distributes downward. Both pressure and concentration are high in the zone close to the point of leakage. Advection and diffusion lead to concentric spread of the gas around this leakage point.
58
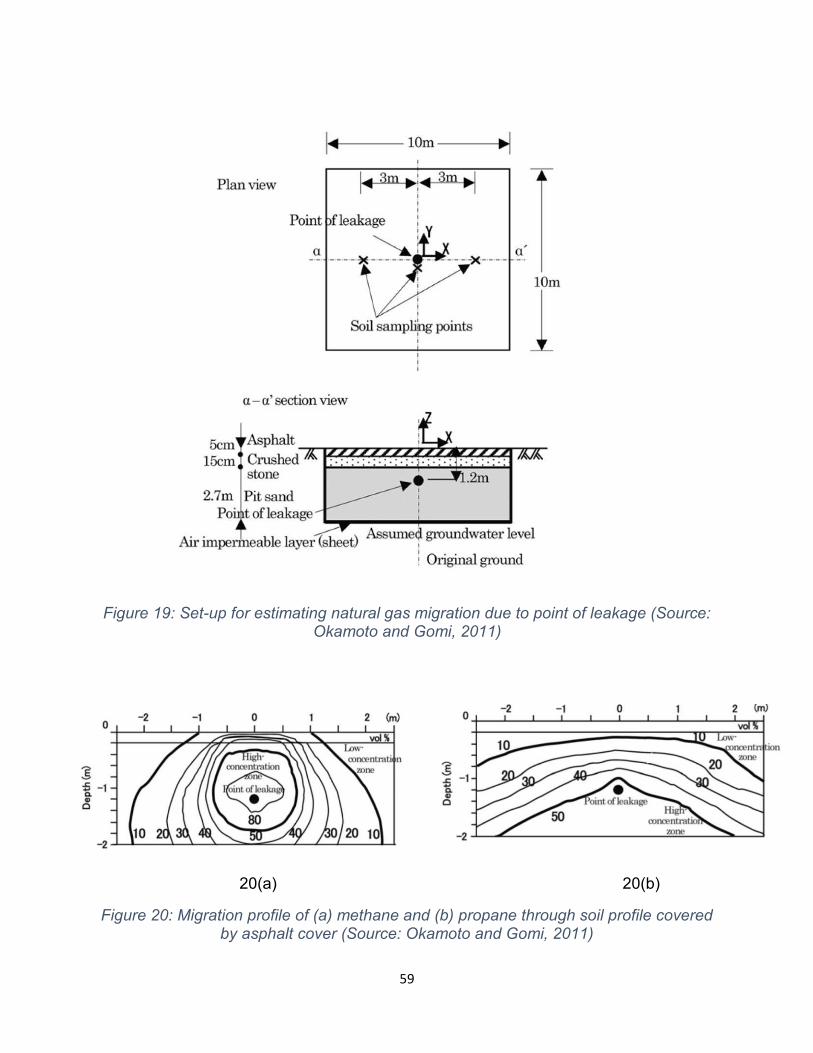
Figure 19: Set-up for estimating natural gas migration due to point of leakage (Source: Okamoto and Gomi, 2011)
20(a) 20(b)
Figure 20: Migration profile of (a) methane and (b) propane through soil profile covered by asphalt cover (Source: Okamoto and Gomi, 2011)
59

In practice, backfilling of trenches during pipeline installation is carried out by compacting with soil materials that create a low-permeability zone around the pipeline. If the excavated area for laying the pipe has rocky formations, a high-permeability around the pipe is maintained by filling the trench with broken rocks. The differences in filling-up the trench with variable soil types often affects the migration of natural gas after a leakage has occurred in the buried pipeline. Research shows that the extent and magnitude of leak into the surrounding soil type depends on the pressure with which the liquid in carried through the pipeline – which typically varies between high-pressure (∼3500–9600 kPa) to low-pressure (1.5–2000 kPa) conditions (Deepagoda et al., 2016). Leak detections with high-pressure pipelines are often easier and can be fixed, when compared to pipelines that operate at low-pressures.
Factors such as the depth of the pipeline, soil properties, soil moisture and gas composition greatly influence the gas migration within the soil. The spread of the leakage surrounding the pipeline has been noted to vary broadly in the range of 6.5 – 33 ft in length (Okamoto and Gomi, 2011; Yan et al., 2015). Transport and migration of natural gas (predominantly consisting of methane) in soil depends on soil heterogeneity, moisture, temperature, and pressure gradients (Poulsen et al., 2003). Migration of natural gas in clay soil texture type is somewhat irregular in shape and varies with respect to migration in normal soil environment (such as sand) in the form of an inverted cone as the sketch in Fig. 21 shows. The variability in migration is due to low-permeability of clay as compared to that of a homogenous soil system of sand which has a high permeability (Ho and Webb, 2006).
Figure 21: Path of natural gas leakage propagation as it travels through the soils (Source: Texas Gas Association, 2018)
60
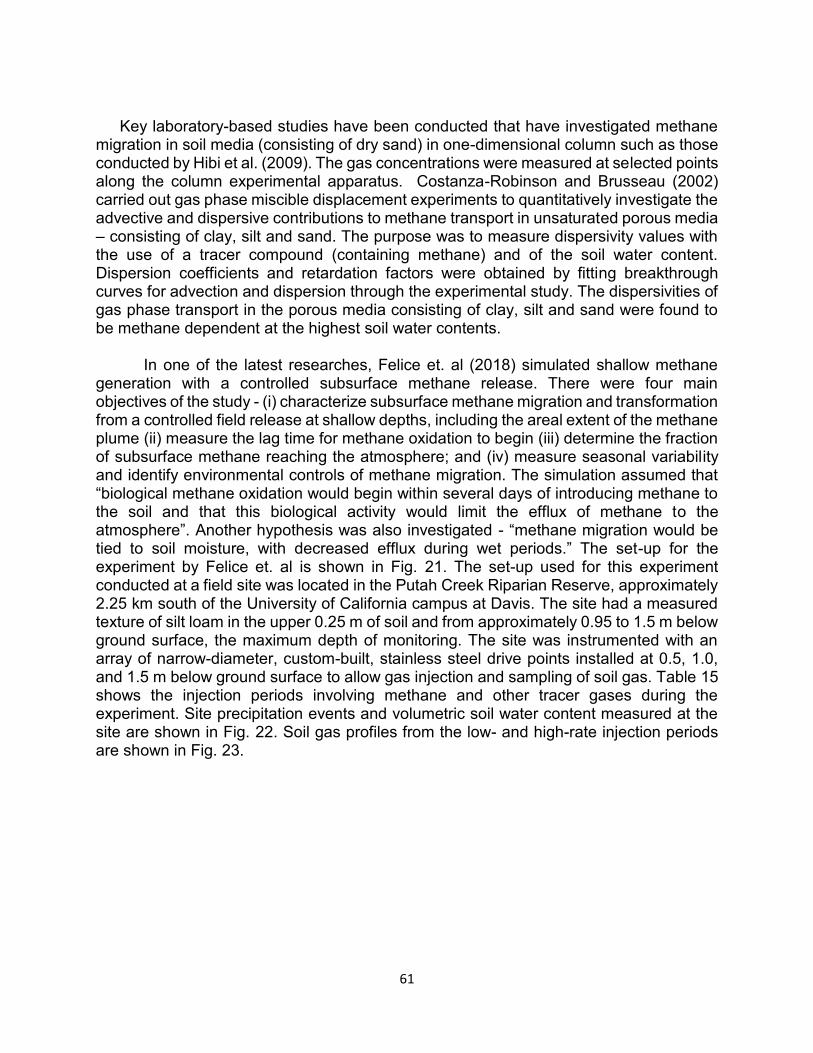
Key laboratory-based studies have been conducted that have investigated methane migration in soil media (consisting of dry sand) in one-dimensional column such as those conducted by Hibi et al. (2009). The gas concentrations were measured at selected points along the column experimental apparatus. Costanza-Robinson and Brusseau (2002) carried out gas phase miscible displacement experiments to quantitatively investigate the advective and dispersive contributions to methane transport in unsaturated porous media – consisting of clay, silt and sand. The purpose was to measure dispersivity values with the use of a tracer compound (containing methane) and of the soil water content. Dispersion coefficients and retardation factors were obtained by fitting breakthrough curves for advection and dispersion through the experimental study. The dispersivities of gas phase transport in the porous media consisting of clay, silt and sand were found to be methane dependent at the highest soil water contents.
In one of the latest researches, Felice et. al (2018) simulated shallow methane generation with a controlled subsurface methane release. There were four main objectives of the study - (i) characterize subsurface methane migration and transformation from a controlled field release at shallow depths, including the areal extent of the methane plume (ii) measure the lag time for methane oxidation to begin (iii) determine the fraction of subsurface methane reaching the atmosphere; and (iv) measure seasonal variability and identify environmental controls of methane migration. The simulation assumed that “biological methane oxidation would begin within several days of introducing methane to the soil and that this biological activity would limit the efflux of methane to the atmosphere”. Another hypothesis was also investigated - “methane migration would be tied to soil moisture, with decreased efflux during wet periods.” The set-up for the experiment by Felice et. al is shown in Fig. 21. The set-up used for this experiment conducted at a field site was located in the Putah Creek Riparian Reserve, approximately 2.25 km south of the University of California campus at Davis. The site had a measured texture of silt loam in the upper 0.25 m of soil and from approximately 0.95 to 1.5 m below ground surface, the maximum depth of monitoring. The site was instrumented with an array of narrow-diameter, custom-built, stainless steel drive points installed at 0.5, 1.0, and 1.5 m below ground surface to allow gas injection and sampling of soil gas. Table 15 shows the injection periods involving methane and other tracer gases during the experiment. Site precipitation events and volumetric soil water content measured at the site are shown in Fig. 22. Soil gas profiles from the low- and high-rate injection periods are shown in Fig. 23.
61
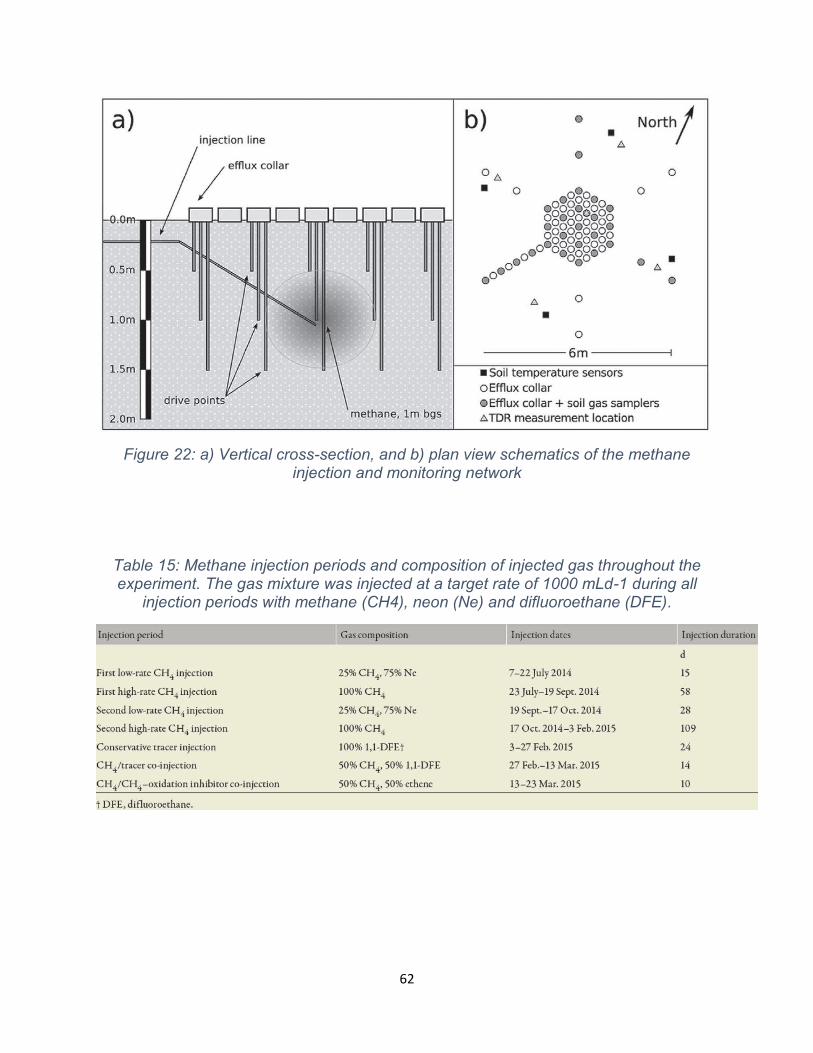
Figure 22: a) Vertical cross-section, and b) plan view schematics of the methane injection and monitoring network
Table 15: Methane injection periods and composition of injected gas throughout the experiment. The gas mixture was injected at a target rate of 1000 mLd-1 during all
injection periods with methane (CH4), neon (Ne) and difluoroethane (DFE).
62
(b) (a)
Figure 23: (a) Precipitation events at the site, and (b) Volumetric soil water content measured at the site
63
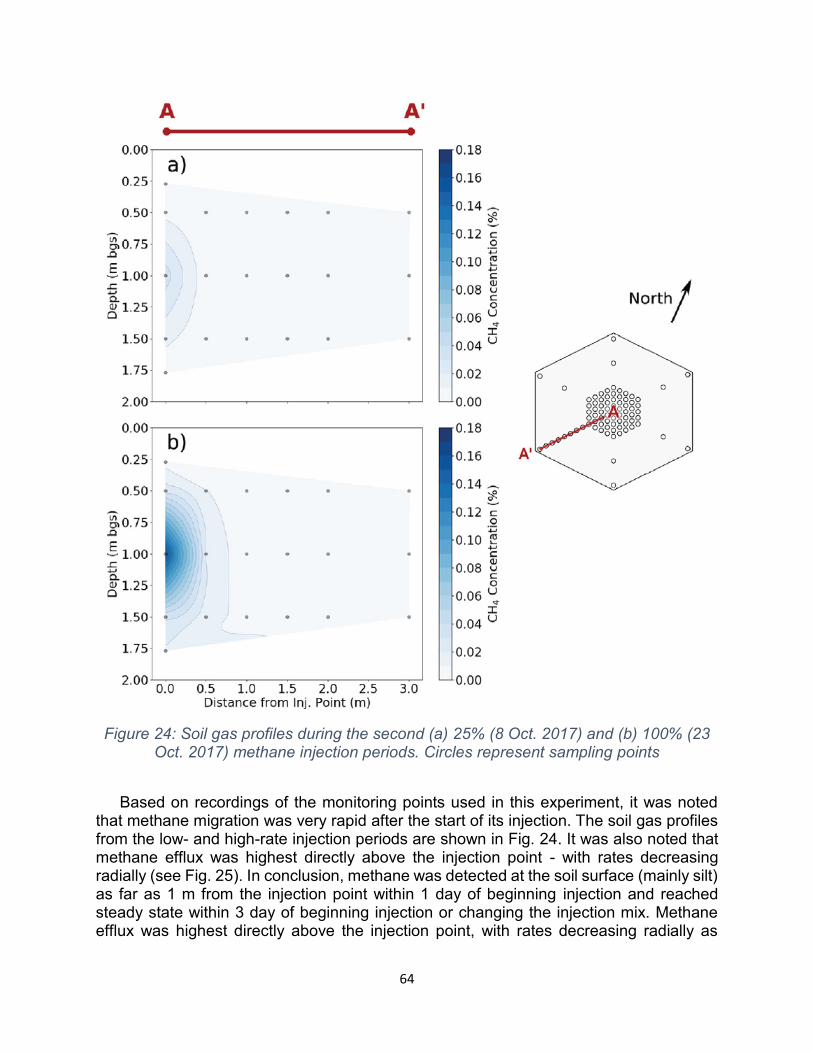
Figure 24: Soil gas profiles during the second (a) 25% (8 Oct. 2017) and (b) 100% (23 Oct. 2017) methane injection periods. Circles represent sampling points
Based on recordings of the monitoring points used in this experiment, it was noted that methane migration was very rapid after the start of its injection. The soil gas profiles from the low- and high-rate injection periods are shown in Fig. 24. It was also noted that methane efflux was highest directly above the injection point - with rates decreasing radially (see Fig. 25). In conclusion, methane was detected at the soil surface (mainly silt) as far as 1 m from the injection point within 1 day of beginning injection and reached steady state within 3 day of beginning injection or changing the injection mix. Methane efflux was highest directly above the injection point, with rates decreasing radially as
64
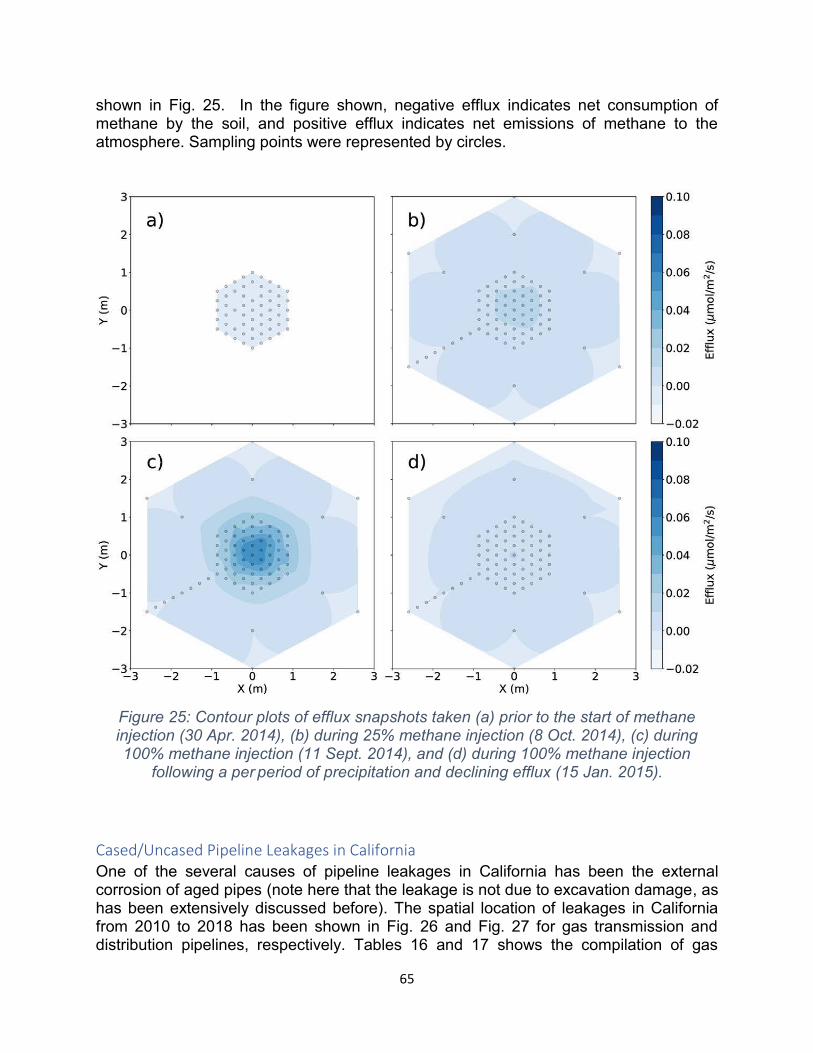
shown in Fig. 25. In the figure shown, negative efflux indicates net consumption of methane by the soil, and positive efflux indicates net emissions of methane to the atmosphere. Sampling points were represented by circles.
Figure 25: Contour plots of efflux snapshots taken (a) prior to the start of methane injection (30 Apr. 2014), (b) during 25% methane injection (8 Oct. 2014), (c) during 100% methane injection (11 Sept. 2014), and (d) during 100% methane injection
following a per period of precipitation and declining efflux (15 Jan. 2015).
Cased/Uncased Pipeline Leakages in California One of the several causes of pipeline leakages in California has been the external corrosion of aged pipes (note here that the leakage is not due to excavation damage, as has been extensively discussed before). The spatial location of leakages in California from 2010 to 2018 has been shown in Fig. 26 and Fig. 27 for gas transmission and distribution pipelines, respectively. Tables 16 and 17 shows the compilation of gas
65
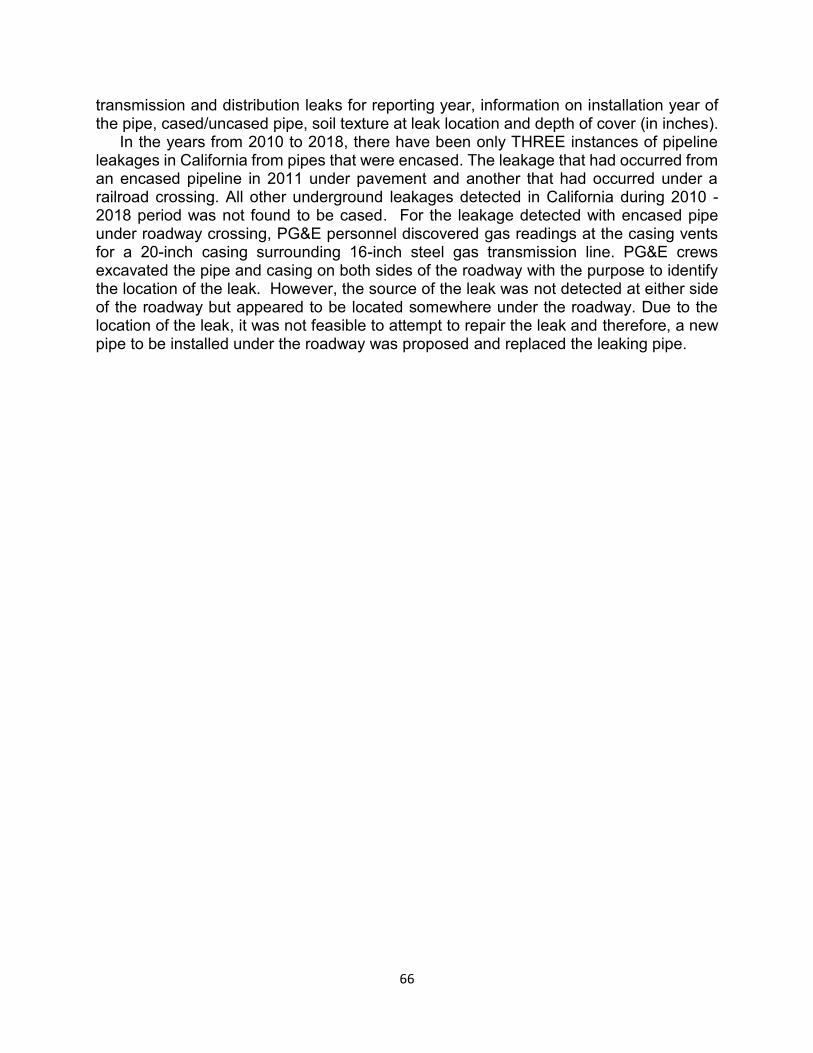
transmission and distribution leaks for reporting year, information on installation year of the pipe, cased/uncased pipe, soil texture at leak location and depth of cover (in inches).
In the years from 2010 to 2018, there have been only THREE instances of pipeline leakages in California from pipes that were encased. The leakage that had occurred from an encased pipeline in 2011 under pavement and another that had occurred under a railroad crossing. All other underground leakages detected in California during 2010 -2018 period was not found to be cased. For the leakage detected with encased pipe under roadway crossing, PG&E personnel discovered gas readings at the casing vents for a 20-inch casing surrounding 16-inch steel gas transmission line. PG&E crews excavated the pipe and casing on both sides of the roadway with the purpose to identify the location of the leak. However, the source of the leak was not detected at either side of the roadway but appeared to be located somewhere under the roadway. Due to the location of the leak, it was not feasible to attempt to repair the leak and therefore, a new pipe to be installed under the roadway was proposed and replaced the leaking pipe.
66
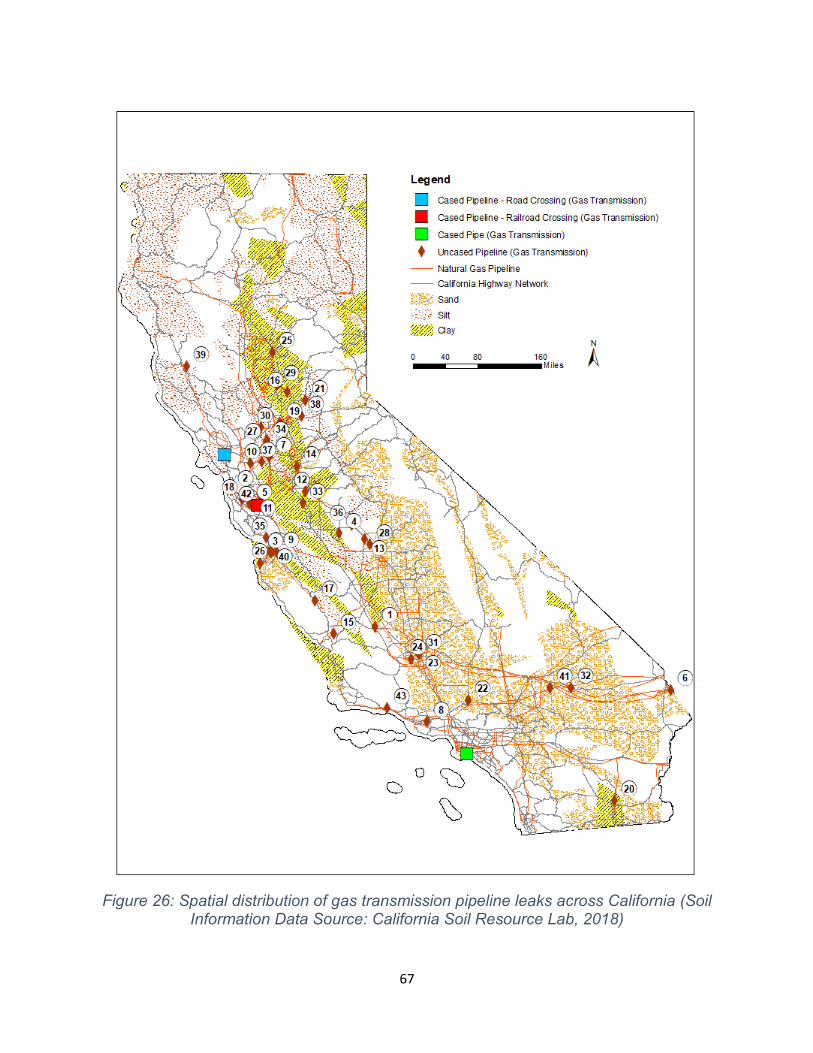
Figure 26: Spatial distribution of gas transmission pipeline leaks across California (Soil
Information Data Source: California Soil Resource Lab, 2018)
67
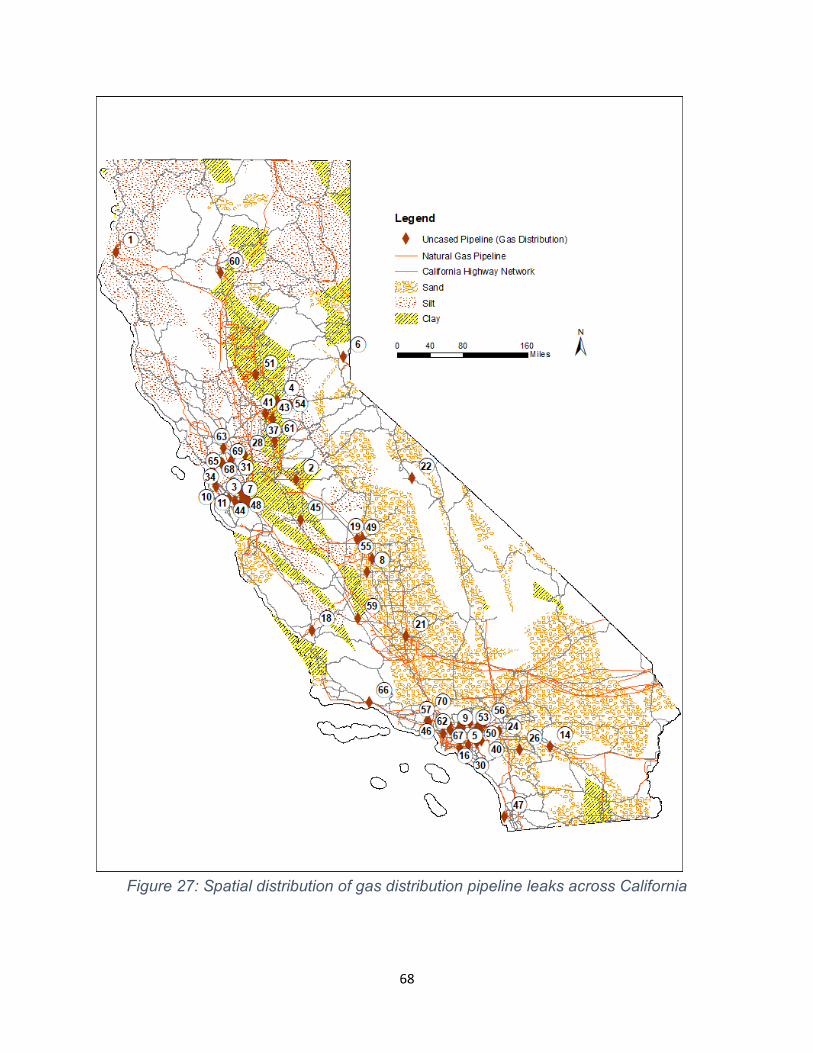
Figure 27: Spatial distribution of gas distribution pipeline leaks across California
68
Table 16: Compilation of underground/under soil natural gas transmission pipeline leakage in California (2010- 2018) (Data Source: PHMSA, 2018)
Leak Detection
No.
Leakage Reporting
Year
Pipeline Installation
Year Cased/Uncased
Predominant Soil Texture
at Leak Location
Depth of Cover (in.)
1 2011
(External Corrosion)
1961 Cased
(Roadway Crossing, Under
Pavement)
Silt 240
2 2014
(External Corrosion)
1944 Cased
(Railroad Crossing)
Silt, Clay 66
3 2010 1966 Cased Sand 12
1 2010 1931 Uncased Clay NA
2 2010 1956 Uncased Silt, Clay NA
3 2010 1952 Uncased Clay 29
4 2010 1985 Uncased Sand NA
5 2011 1980 Uncased Clay NA
6 2011 1957 Uncased Sand NA
7 2011 1942 Uncased Clay 39
8 2011 1944 Uncased Sand 18
9 2011 1930 Uncased Silt, Clay 20
10 2012 NA Uncased Silt 72
11 2012 1936 Uncased Silt, Clay NA
12 2012 1947 Uncased Clay NA
13 2012 1965 Uncased Sand 10
14 2012 1985 Uncased Clay 54
15 2013 1932 Uncased Silt, Clay 32
16 2013 1955 Uncased Clay 56
69
17
18
19
20
21
22
23
24
25
26
27
28
29
30
31
32
33
34
35
36
37
38
39
40
41
42
43
2013 1957 Uncased Silt, Clay 18
2014 2014 Uncased Silt, Clay 138
2014 1991 Uncased Clay, Sand 60
2014 1948 Uncased Clay 40
2014 1962 Uncased Clay, Sand 30
2014 2004 Uncased Sand 55
2014 1954 Uncased Sand 54
2014 1955 Uncased Sand 48
2014 1928 Uncased Clay 84
2015 1959 Uncased Sand 30
2015 1937 Uncased Silt, Clay 4
2015 1962 Uncased Sand 45
2015 1943 Uncased Clay 52
2015 1949 Uncased Silt, Clay 39
2015 1954 Uncased Sand 36
2016 1950 Uncased Sand 36
2016 1972 Uncased Silt 42
2016 1937 Uncased Clay 48
2016 NA Uncased Silt 22
2016 1962 Uncased Clay 36
2017 1952 Uncased Silt, Clay 35
2017 2017 Uncased Clay NA
2017 1972 Uncased Silt 48
2017 1966 Uncased Silt 30
2017 1957 Uncased Sand 40
2017 NA Uncased Silt, Clay 24
2018 1965 Uncased Sand 102
70
Table 17: Compilation of underground/under soil natural gas distribution pipeline leakage in California (2010- 2018) (Data Source: PHMSA, 2018)
Leak Detection
No.
Leakage Reporting
Year
Pipeline Installation
Year Cased/Uncased
Predominant Soil Texture
at Leak Location
Depth of Cover (in.)
1 2010 NA Uncased Silt 30
2 2010 NA Uncased Clay, Sand 12
3 2010 1967 Uncased Silt 6
4 2010 NA Uncased Clay NA
5 2011 1959 Uncased Sand 48
6 2011 1996 Uncased Clay, Sand 36
7 2011 1973 Uncased Silt NA
8 2011 1966 Uncased Sand 12
9 2012 1979 Uncased Sand NA
10 2012 2011 Uncased Silt NA
11 2012 NA Uncased Silt NA
12 2012 2012 Uncased Silt NA
13 2012 1959 Uncased Sand 42
14 2012 1979 Uncased Sand 34
15 2012 2002 Uncased Sand 37
16 2012 1979 Uncased Sand NA
17 2013 1987 Uncased Silt 18
18 2013 1952 Uncased Clay 21
19 2013 1950 Uncased Sand 87
20 2013 NA Uncased Silt 75
21 2013 1938 Uncased Sand 4
22 2013 NA Uncased Sand 30
23 2013 2001 Uncased Clay 31
71
24
25
26
27
28
29
30
31
32
33
34
35
36
37
38
39
40
41
42
43
44
45
46
47
48
49
50
2013 1960 Uncased Sand 40
2013 1967 Uncased Sand 32
2014 1947 Uncased Sand 19
2014 1959 Uncased Sand 45
2014 2005 Uncased Silt 36
2014 1986 Uncased Silt 28
2014 1966 Uncased Sand 40
2014 1954 Uncased Silt 35
2014 1966 Uncased Silt 66
2014 1988 Uncased Silt 63
2014 1989 Uncased Silt 66
2015 NA Uncased Silt 48
2015 1947 Uncased Sand 36
2015 2008 Uncased Clay 42
2015 1948 Uncased Sand 48
2015 2006 Uncased Sand 64
2015 1980 Uncased Sand 80
2015 NA Uncased Clay 32
2016 1954 Uncased Silt NA
2016 2008 Uncased Clay 48
2016 NA Uncased Silt 84
2016 1989 Uncased Clay NA
2016 1982 Uncased Sand 45
2016 1942 Uncased Sand 36
2016 NA Uncased Silt 36
2016 2016 Uncased Sand 348
2016 1975 Uncased Sand 44
72
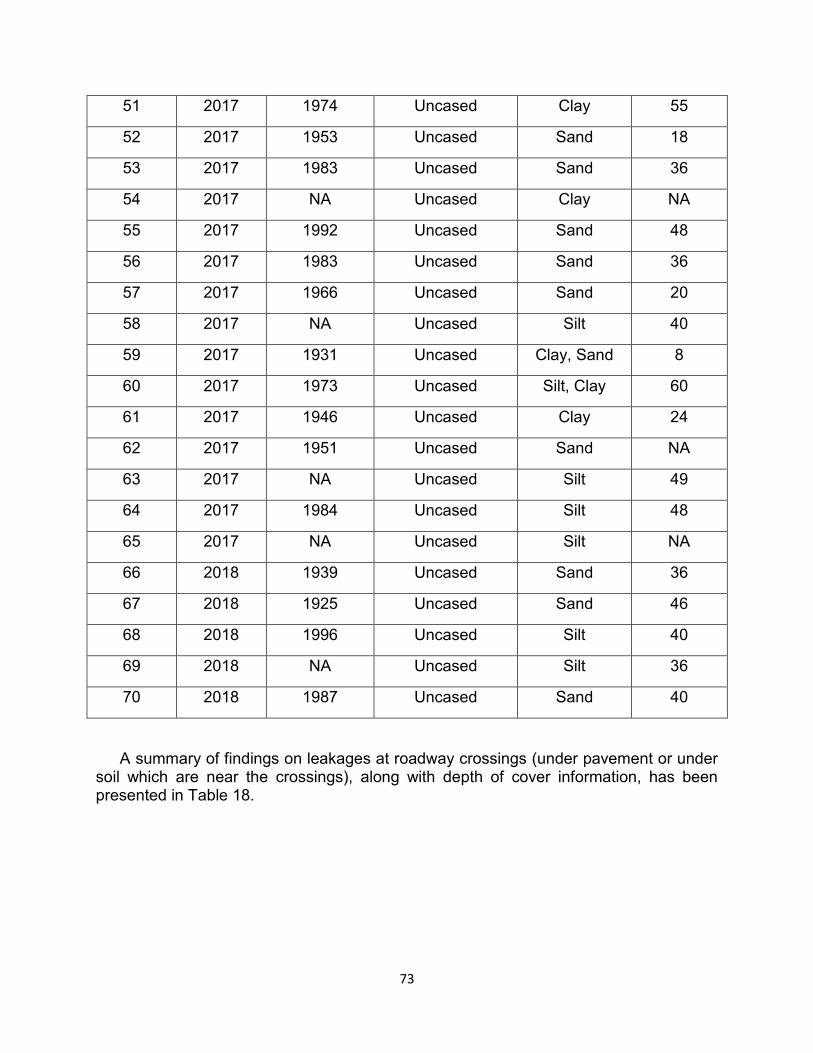
51 2017 1974 Uncased Clay 55
52 2017 1953 Uncased Sand 18
53 2017 1983 Uncased Sand 36
54 2017 NA Uncased Clay NA
55 2017 1992 Uncased Sand 48
56 2017 1983 Uncased Sand 36
57 2017 1966 Uncased Sand 20
58 2017 NA Uncased Silt 40
59 2017 1931 Uncased Clay, Sand 8
60 2017 1973 Uncased Silt, Clay 60
61 2017 1946 Uncased Clay 24
62 2017 1951 Uncased Sand NA
63 2017 NA Uncased Silt 49
64 2017 1984 Uncased Silt 48
65 2017 NA Uncased Silt NA
66 2018 1939 Uncased Sand 36
67 2018 1925 Uncased Sand 46
68 2018 1996 Uncased Silt 40
69 2018 NA Uncased Silt 36
70 2018 1987 Uncased Sand 40
A summary of findings on leakages at roadway crossings (under pavement or under soil which are near the crossings), along with depth of cover information, has been presented in Table 18.
73
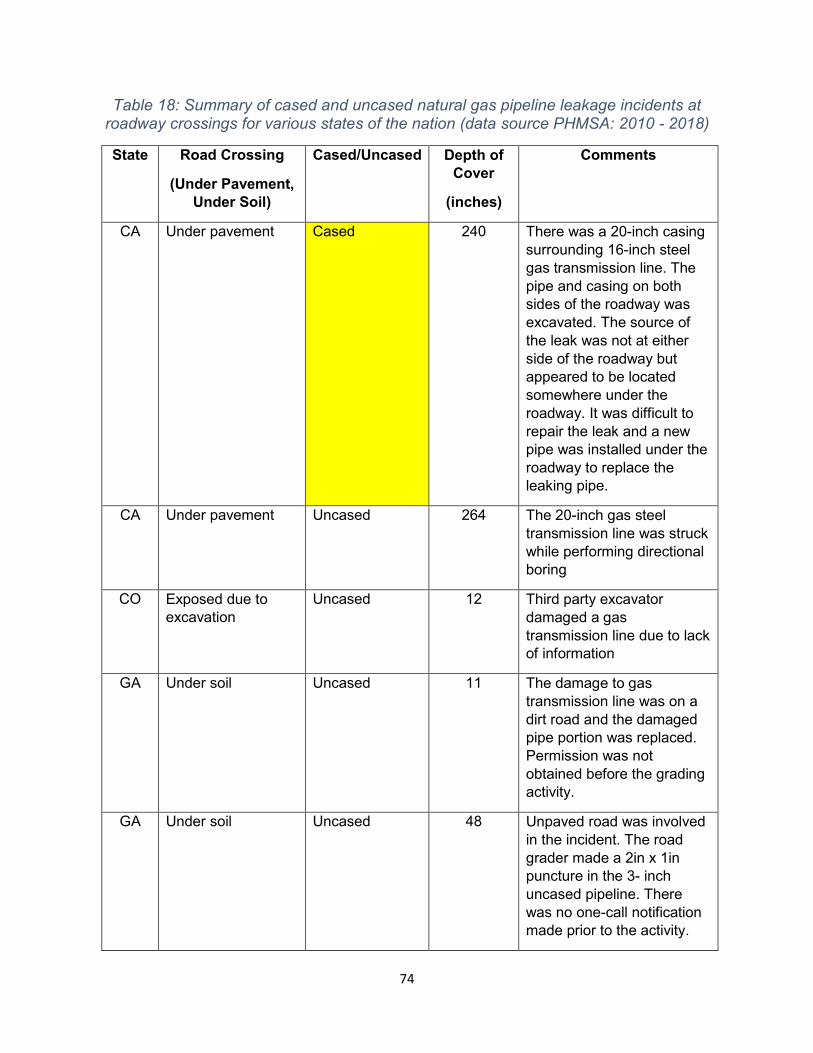
Table 18: Summary of cased and uncased natural gas pipeline leakage incidents at roadway crossings for various states of the nation (data source PHMSA: 2010 - 2018)
State Road Crossing
(Under Pavement, Under Soil)
Cased/Uncased Depth of Cover
(inches)
Comments
CA Under pavement Cased 240 There was a 20-inch casing surrounding 16-inch steel gas transmission line. The pipe and casing on both sides of the roadway was excavated. The source of the leak was not at either side of the roadway but appeared to be located somewhere under the roadway. It was difficult to repair the leak and a new pipe was installed under the roadway to replace the leaking pipe.
CA Under pavement Uncased 264 The 20-inch gas steel transmission line was struck while performing directional boring
CO Exposed due to excavation
Uncased 12 Third party excavator damaged a gas transmission line due to lack of information
GA Under soil Uncased 11 The damage to gas transmission line was on a dirt road and the damaged pipe portion was replaced. Permission was not obtained before the grading activity.
GA Under soil Uncased 48 Unpaved road was involved in the incident. The road grader made a 2in x 1in puncture in the 3- inch uncased pipeline. There was no one-call notification made prior to the activity.
74
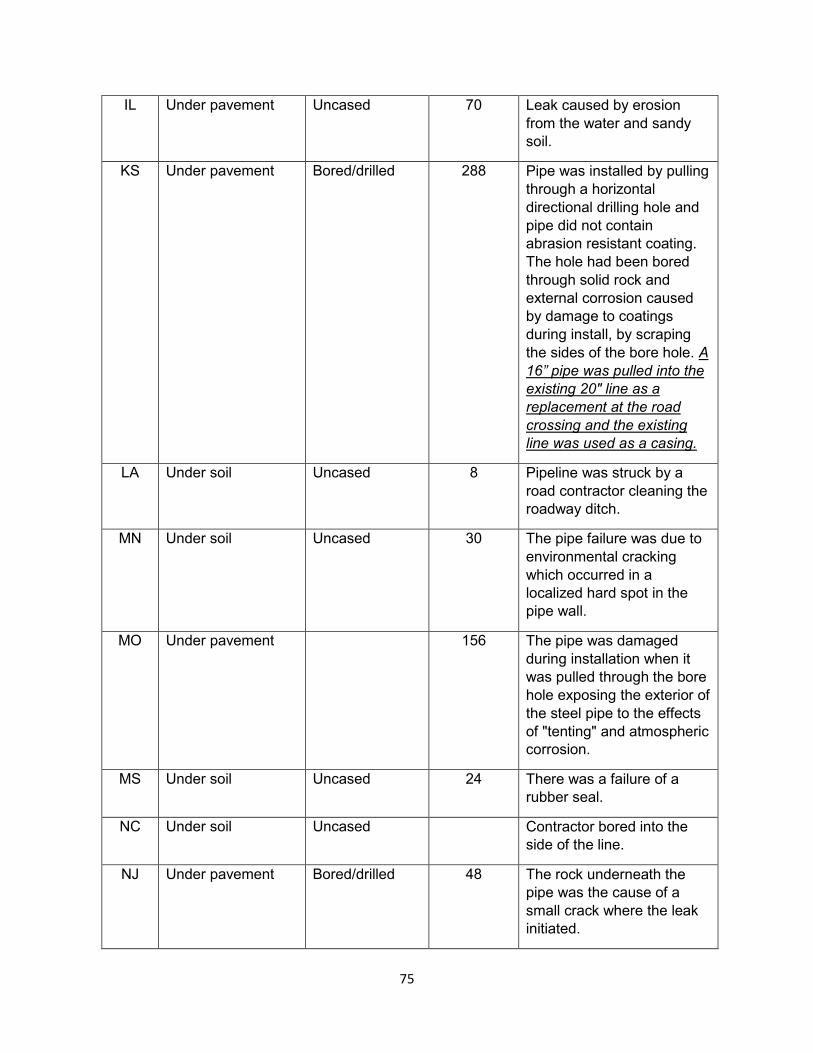
IL Under pavement Uncased 70 Leak caused by erosion from the water and sandy soil.
KS Under pavement Bored/drilled 288 Pipe was installed by pulling through a horizontal directional drilling hole and pipe did not contain abrasion resistant coating. The hole had been bored through solid rock and external corrosion caused by damage to coatings during install, by scraping the sides of the bore hole. A 16” pipe was pulled into the existing 20" line as a replacement at the road crossing and the existing line was used as a casing.
LA Under soil Uncased 8 Pipeline was struck by a road contractor cleaning the roadway ditch.
MN Under soil Uncased 30 The pipe failure was due to environmental cracking which occurred in a localized hard spot in the pipe wall.
MO Under pavement 156 The pipe was damaged during installation when it was pulled through the bore hole exposing the exterior of the steel pipe to the effects of "tenting" and atmospheric corrosion.
MS Under soil Uncased 24 There was a failure of a rubber seal.
NC Under soil Uncased Contractor bored into the side of the line.
NJ Under pavement Bored/drilled 48 The rock underneath the pipe was the cause of a small crack where the leak initiated.
75
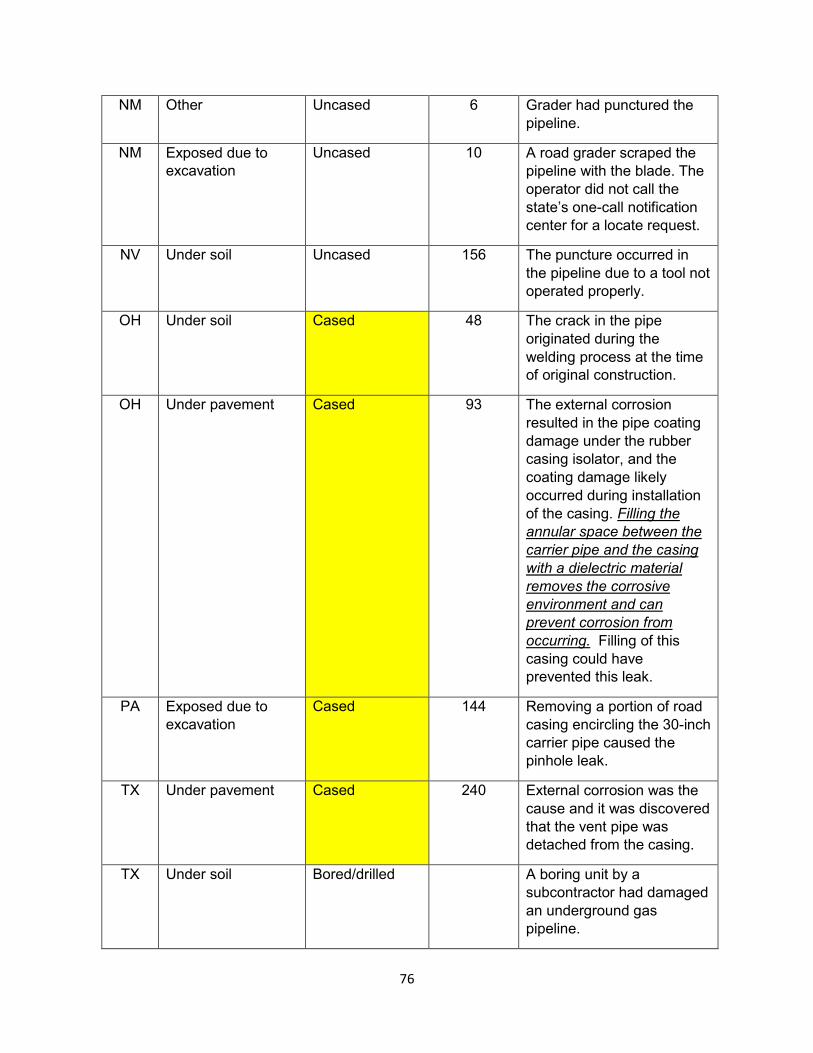
NM Other Uncased 6 Grader had punctured the pipeline.
NM Exposed due to excavation
Uncased 10 A road grader scraped the pipeline with the blade. The operator did not call the state’s one-call notification center for a locate request.
NV Under soil Uncased 156 The puncture occurred in the pipeline due to a tool not operated properly.
OH Under soil Cased 48 The crack in the pipe originated during the welding process at the time of original construction.
OH Under pavement Cased 93 The external corrosion resulted in the pipe coating damage under the rubber casing isolator, and the coating damage likely occurred during installation of the casing. Filling the annular space between the carrier pipe and the casing with a dielectric material removes the corrosive environment and can prevent corrosion from occurring. Filling of this casing could have prevented this leak.
PA Exposed due to excavation
Cased 144 Removing a portion of road casing encircling the 30-inch carrier pipe caused the pinhole leak.
TX Under pavement Cased 240 External corrosion was the cause and it was discovered that the vent pipe was detached from the casing.
TX Under soil Bored/drilled A boring unit by a subcontractor had damaged an underground gas pipeline.
76
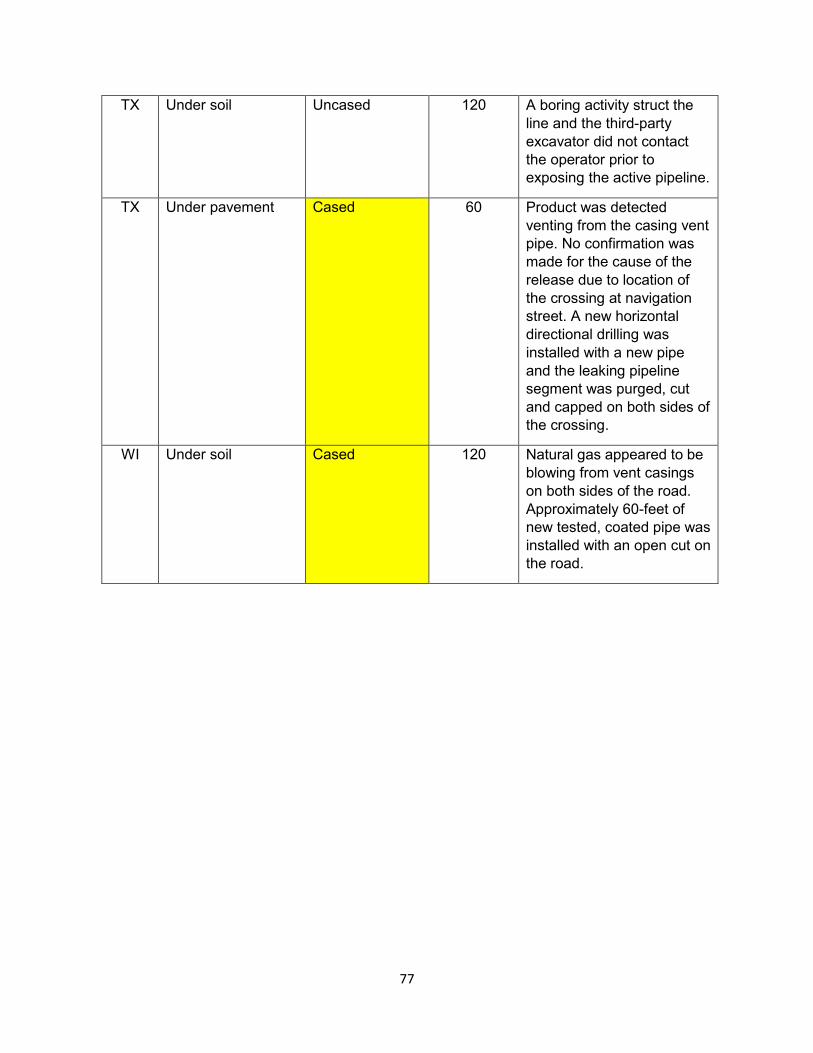
TX Under soil Uncased 120 A boring activity struct the line and the third-party excavator did not contact the operator prior to exposing the active pipeline.
TX Under pavement Cased 60 Product was detected venting from the casing vent pipe. No confirmation was made for the cause of the release due to location of the crossing at navigation street. A new horizontal directional drilling was installed with a new pipe and the leaking pipeline segment was purged, cut and capped on both sides of the crossing.
WI Under soil Cased 120 Natural gas appeared to be blowing from vent casings on both sides of the road. Approximately 60-feet of new tested, coated pipe was installed with an open cut on the road.
77
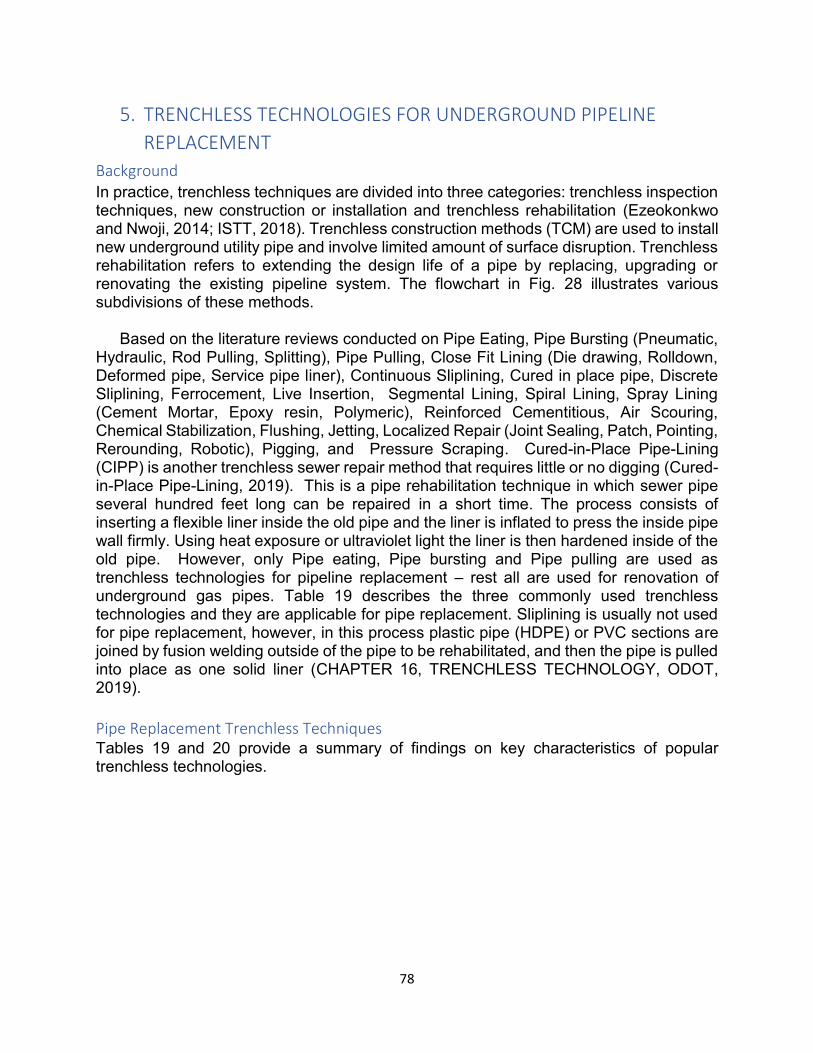
5. TRENCHLESS TECHNOLOGIES FOR UNDERGROUND PIPELINE
REPLACEMENT
Background In practice, trenchless techniques are divided into three categories: trenchless inspection techniques, new construction or installation and trenchless rehabilitation (Ezeokonkwo and Nwoji, 2014; ISTT, 2018). Trenchless construction methods (TCM) are used to install new underground utility pipe and involve limited amount of surface disruption. Trenchless rehabilitation refers to extending the design life of a pipe by replacing, upgrading or renovating the existing pipeline system. The flowchart in Fig. 28 illustrates various subdivisions of these methods.
Based on the literature reviews conducted on Pipe Eating, Pipe Bursting (Pneumatic, Hydraulic, Rod Pulling, Splitting), Pipe Pulling, Close Fit Lining (Die drawing, Rolldown, Deformed pipe, Service pipe liner), Continuous Sliplining, Cured in place pipe, Discrete Sliplining, Ferrocement, Live Insertion, Segmental Lining, Spiral Lining, Spray Lining (Cement Mortar, Epoxy resin, Polymeric), Reinforced Cementitious, Air Scouring, Chemical Stabilization, Flushing, Jetting, Localized Repair (Joint Sealing, Patch, Pointing, Rerounding, Robotic), Pigging, and Pressure Scraping. Cured-in-Place Pipe-Lining (CIPP) is another trenchless sewer repair method that requires little or no digging (Cured-in-Place Pipe-Lining, 2019). This is a pipe rehabilitation technique in which sewer pipe several hundred feet long can be repaired in a short time. The process consists of inserting a flexible liner inside the old pipe and the liner is inflated to press the inside pipe wall firmly. Using heat exposure or ultraviolet light the liner is then hardened inside of the old pipe. However, only Pipe eating, Pipe bursting and Pipe pulling are used as trenchless technologies for pipeline replacement – rest all are used for renovation of underground gas pipes. Table 19 describes the three commonly used trenchless technologies and they are applicable for pipe replacement. Sliplining is usually not used for pipe replacement, however, in this process plastic pipe (HDPE) or PVC sections are joined by fusion welding outside of the pipe to be rehabilitated, and then the pipe is pulled into place as one solid liner (CHAPTER 16, TRENCHLESS TECHNOLOGY, ODOT, 2019).
Pipe Replacement Trenchless Techniques Tables 19 and 20 provide a summary of findings on key characteristics of popular trenchless technologies.
78
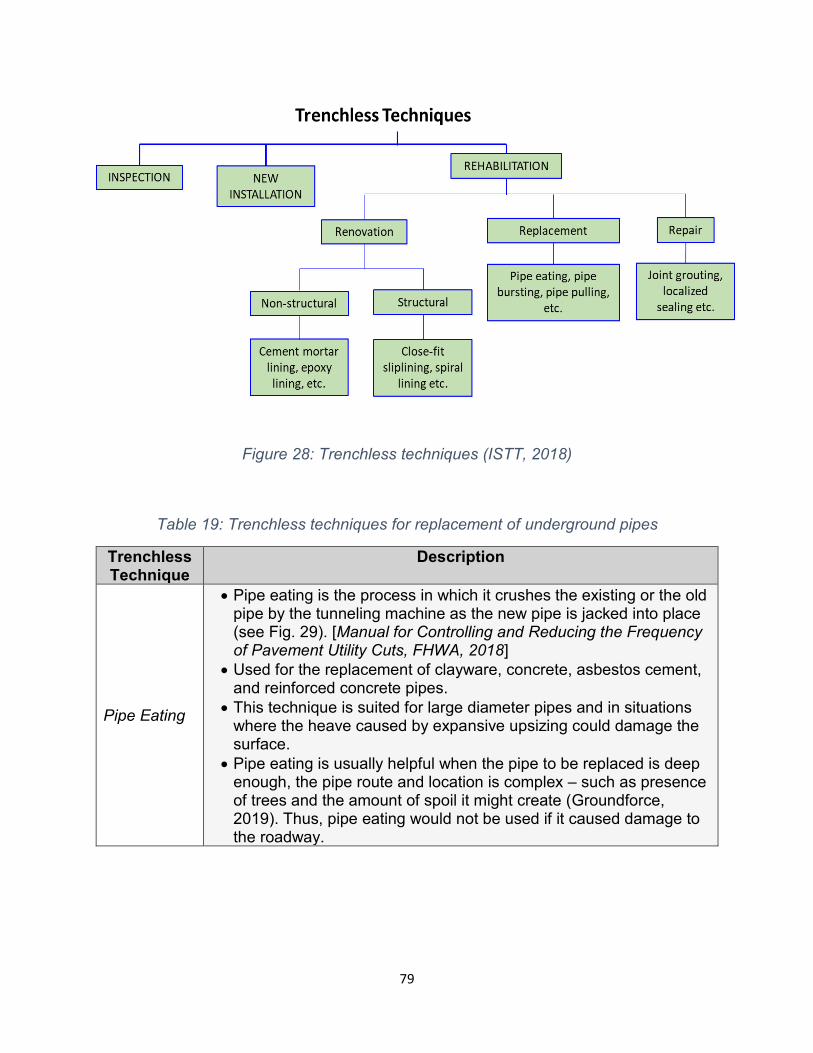
Figure 28: Trenchless techniques (ISTT, 2018)
Table 19: Trenchless techniques for replacement of underground pipes
Trenchless Technique
Description
Pipe Eating
• Pipe eating is the process in which it crushes the existing or the old pipe by the tunneling machine as the new pipe is jacked into place (see Fig. 29). [Manual for Controlling and Reducing the Frequency of Pavement Utility Cuts, FHWA, 2018]
• Used for the replacement of clayware, concrete, asbestos cement, and reinforced concrete pipes.
• This technique is suited for large diameter pipes and in situations where the heave caused by expansive upsizing could damage the surface.
• Pipe eating is usually helpful when the pipe to be replaced is deep enough, the pipe route and location is complex – such as presence of trees and the amount of spoil it might create (Groundforce, 2019). Thus, pipe eating would not be used if it caused damage to the roadway.
79
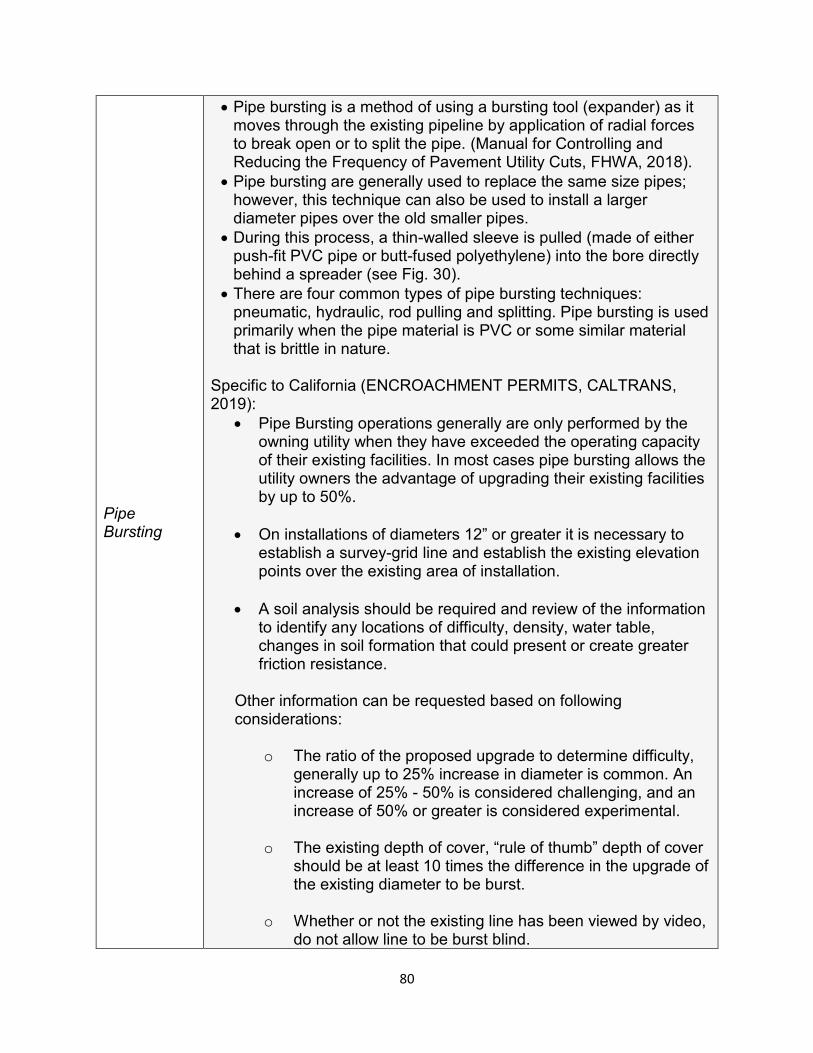
• Pipe bursting is a method of using a bursting tool (expander) as it moves through the existing pipeline by application of radial forces to break open or to split the pipe. (Manual for Controlling and Reducing the Frequency of Pavement Utility Cuts, FHWA, 2018).
• Pipe bursting are generally used to replace the same size pipes; however, this technique can also be used to install a larger diameter pipes over the old smaller pipes.
• During this process, a thin-walled sleeve is pulled (made of either push-fit PVC pipe or butt-fused polyethylene) into the bore directly behind a spreader (see Fig. 30).
• There are four common types of pipe bursting techniques: pneumatic, hydraulic, rod pulling and splitting. Pipe bursting is used primarily when the pipe material is PVC or some similar material that is brittle in nature.
Specific to California (ENCROACHMENT PERMITS, CALTRANS, 2019):
Pipe Bursting
• Pipe Bursting operations generally are only performed by the owning utility when they have exceeded the operating capacity of their existing facilities. In most cases pipe bursting allows the utility owners the advantage of upgrading their existing facilities by up to 50%.
• On installations of diameters 12” or greater it is necessary to establish a survey-grid line and establish the existing elevation points over the existing area of installation.
• A soil analysis should be required and review of the information to identify any locations of difficulty, density, water table, changes in soil formation that could present or create greater friction resistance.
Other information can be requested based on following considerations:
o The ratio of the proposed upgrade to determine difficulty, generally up to 25% increase in diameter is common. An increase of 25% - 50% is considered challenging, and an increase of 50% or greater is considered experimental.
o The existing depth of cover, “rule of thumb” depth of cover should be at least 10 times the difference in the upgrade of the existing diameter to be burst.
o Whether or not the existing line has been viewed by video, do not allow line to be burst blind.
80
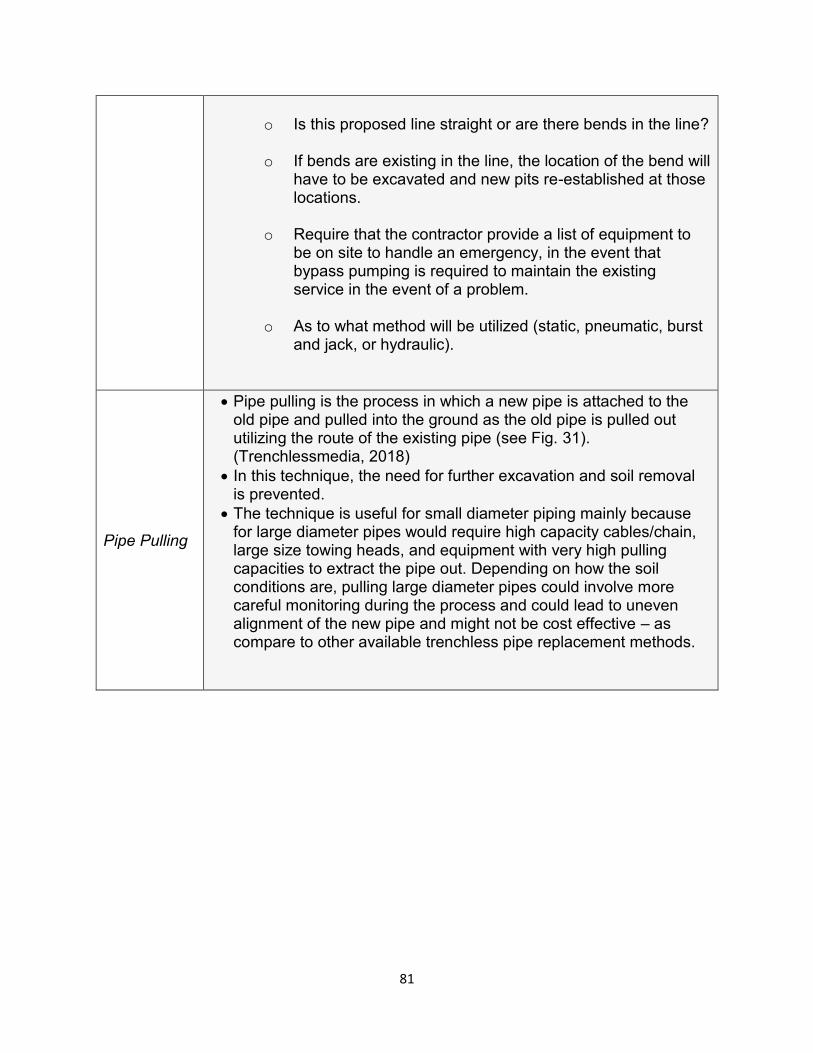
o Is this proposed line straight or are there bends in the line?
o If bends are existing in the line, the location of the bend will have to be excavated and new pits re-established at those locations.
o Require that the contractor provide a list of equipment to be on site to handle an emergency, in the event that bypass pumping is required to maintain the existing service in the event of a problem.
o As to what method will be utilized (static, pneumatic, burst and jack, or hydraulic).
Pipe Pulling
• Pipe pulling is the process in which a new pipe is attached to the old pipe and pulled into the ground as the old pipe is pulled out utilizing the route of the existing pipe (see Fig. 31). (Trenchlessmedia, 2018)
• In this technique, the need for further excavation and soil removal is prevented.
• The technique is useful for small diameter piping mainly because for large diameter pipes would require high capacity cables/chain, large size towing heads, and equipment with very high pulling capacities to extract the pipe out. Depending on how the soil conditions are, pulling large diameter pipes could involve more careful monitoring during the process and could lead to uneven alignment of the new pipe and might not be cost effective – as compare to other available trenchless pipe replacement methods.
81
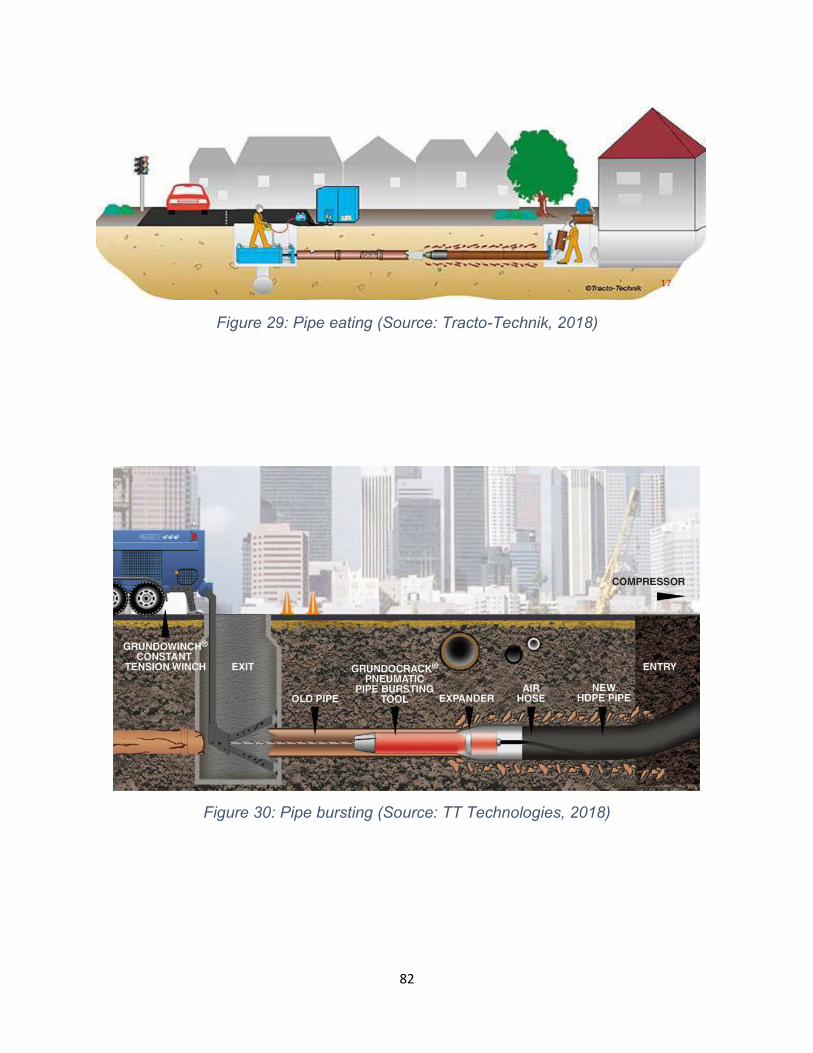
Figure 29: Pipe eating (Source: Tracto-Technik, 2018)
Figure 30: Pipe bursting (Source: TT Technologies, 2018)
82
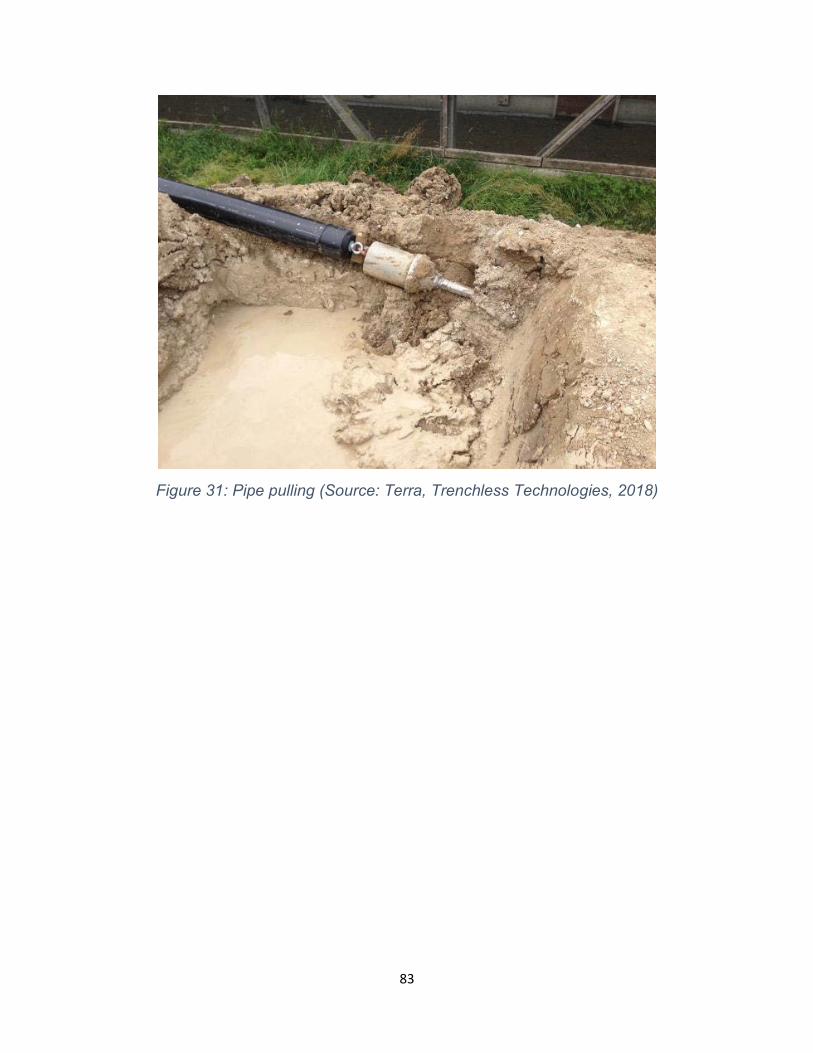
Figure 31: Pipe pulling (Source: Terra, Trenchless Technologies, 2018)
83
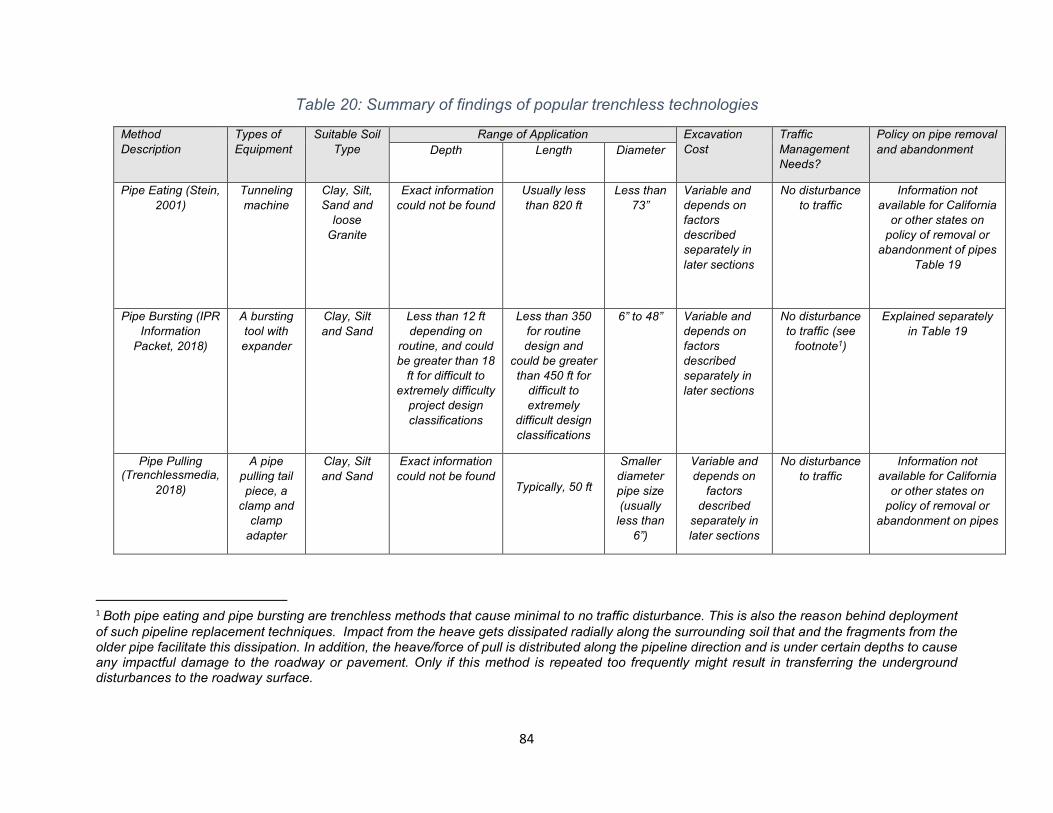
Table 20: Summary of findings of popular trenchless technologies
Method Description
Types of Equipment
Suitable Soil Type
Range of Application Excavation Cost
Traffic Management Needs?
Policy on pipe removal and abandonment Depth Length Diameter
Pipe Eating (Stein, 2001)
Tunneling machine
Clay, Silt, Sand and
loose Granite
Exact information could not be found
Usually less than 820 ft
Less than 73”
Variable and depends on factors described separately in later sections
No disturbance to traffic
Information not available for California
or other states on policy of removal or
abandonment of pipes Table 19
Pipe Bursting (IPR A bursting Clay, Silt Less than 12 ft Less than 350 6” to 48” Variable and No disturbance Explained separately Information tool with and Sand depending on for routine depends on to traffic (see in Table 19
Packet, 2018) expander routine, and could be greater than 18
ft for difficult to extremely difficulty
project design classifications
design and could be greater than 450 ft for
difficult to extremely
difficult design classifications
factors described separately in later sections
footnote1)
Pipe Pulling A pipe Clay, Silt Exact information Smaller Variable and No disturbance Information not (Trenchlessmedia, pulling tail and Sand could not be found diameter depends on to traffic available for California
2018) piece, a clamp and
clamp adapter
Typically, 50 ft pipe size (usually
less than 6”)
factors described
separately in later sections
or other states on policy of removal or
abandonment on pipes
1 Both pipe eating and pipe bursting are trenchless methods that cause minimal to no traffic disturbance. This is also the reason behind deployment of such pipeline replacement techniques. Impact from the heave gets dissipated radially along the surrounding soil that and the fragments from the older pipe facilitate this dissipation. In addition, the heave/force of pull is distributed along the pipeline direction and is under certain depths to cause any impactful damage to the roadway or pavement. Only if this method is repeated too frequently might result in transferring the underground disturbances to the roadway surface.
84
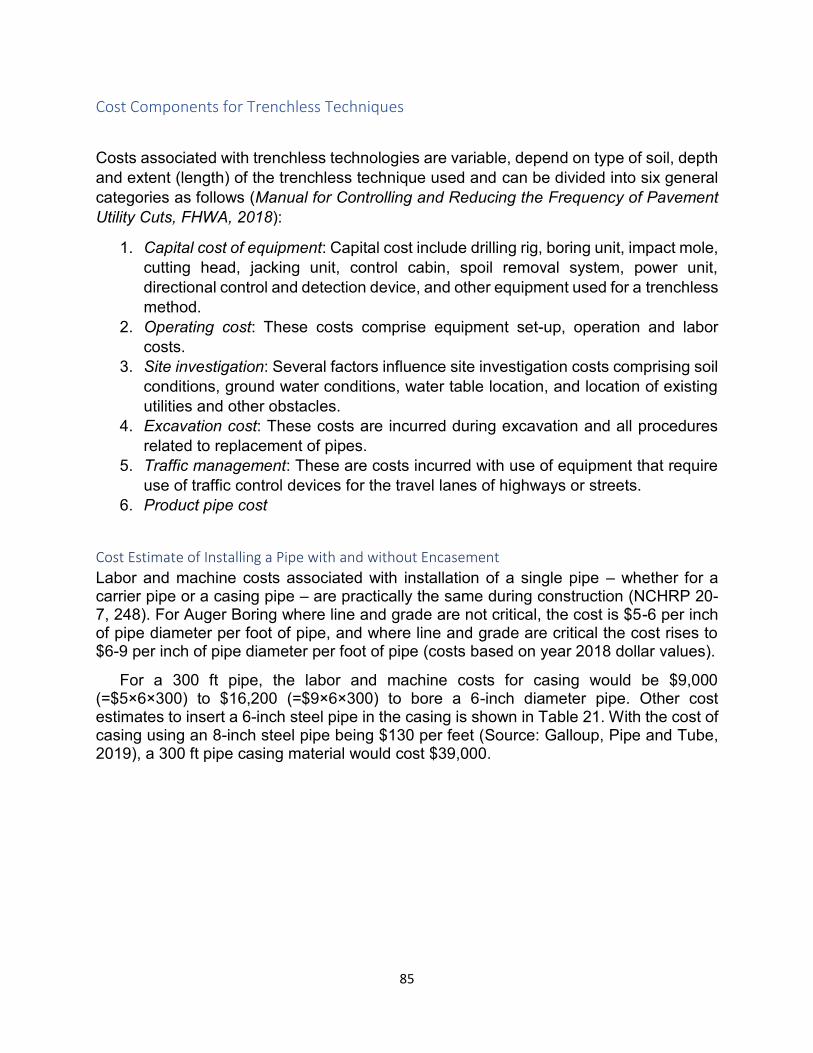
Cost Components for Trenchless Techniques
Costs associated with trenchless technologies are variable, depend on type of soil, depth and extent (length) of the trenchless technique used and can be divided into six general categories as follows (Manual for Controlling and Reducing the Frequency of Pavement Utility Cuts, FHWA, 2018):
1. Capital cost of equipment: Capital cost include drilling rig, boring unit, impact mole, cutting head, jacking unit, control cabin, spoil removal system, power unit, directional control and detection device, and other equipment used for a trenchless method.
2. Operating cost: These costs comprise equipment set-up, operation and labor costs.
3. Site investigation: Several factors influence site investigation costs comprising soil conditions, ground water conditions, water table location, and location of existing utilities and other obstacles.
4. Excavation cost: These costs are incurred during excavation and all procedures related to replacement of pipes.
5. Traffic management: These are costs incurred with use of equipment that require use of traffic control devices for the travel lanes of highways or streets.
6. Product pipe cost
Cost Estimate of Installing a Pipe with and without Encasement
Labor and machine costs associated with installation of a single pipe – whether for a carrier pipe or a casing pipe – are practically the same during construction (NCHRP 20-7, 248). For Auger Boring where line and grade are not critical, the cost is $5-6 per inch of pipe diameter per foot of pipe, and where line and grade are critical the cost rises to $6-9 per inch of pipe diameter per foot of pipe (costs based on year 2018 dollar values).
For a 300 ft pipe, the labor and machine costs for casing would be $9,000 (=$5×6×300) to $16,200 (=$9×6×300) to bore a 6-inch diameter pipe. Other cost estimates to insert a 6-inch steel pipe in the casing is shown in Table 21. With the cost of casing using an 8-inch steel pipe being $130 per feet (Source: Galloup, Pipe and Tube, 2019), a 300 ft pipe casing material would cost $39,000.
85
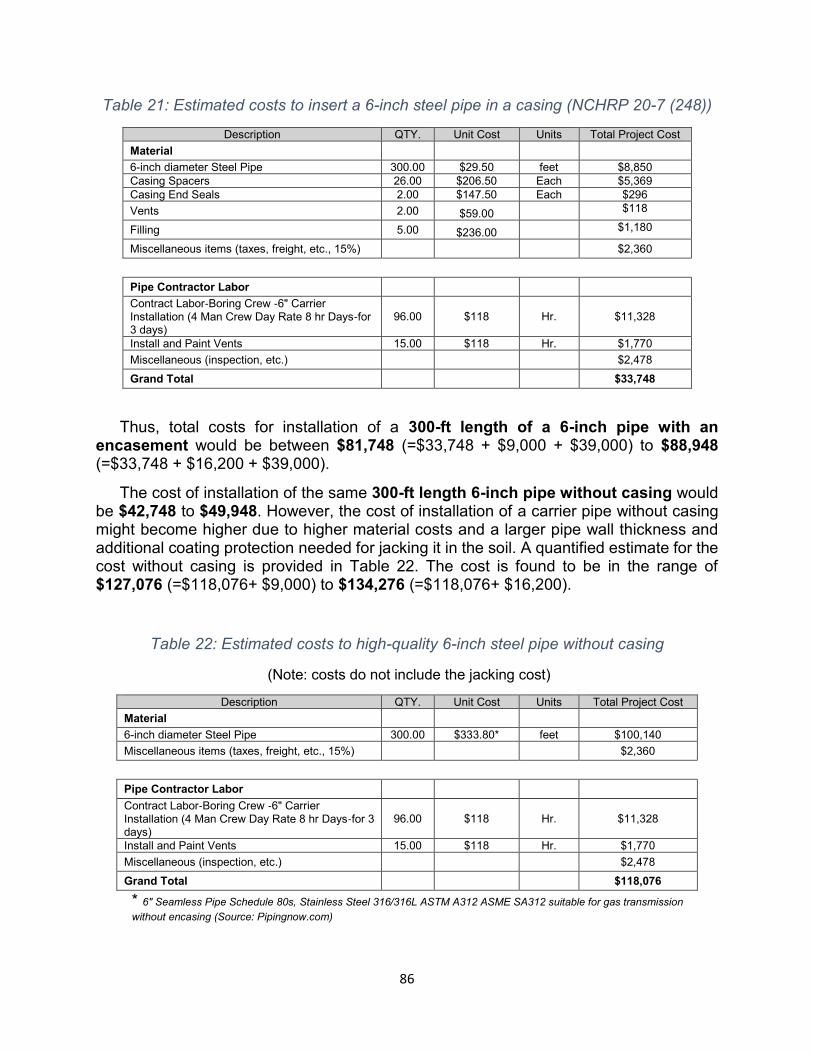
Table 21: Estimated costs to insert a 6-inch steel pipe in a casing (NCHRP 20-7 (248))
Description QTY. Unit Cost Units Total Project Cost Material 6-inch diameter Steel Pipe 300.00 $29.50 feet $8,850 Casing Spacers 26.00 $206.50 Each $5,369 Casing End Seals 2.00 $147.50 Each $296 Vents 2.00 $59.00 $118
Filling 5.00 $236.00 $1,180
Miscellaneous items (taxes, freight, etc., 15%) $2,360
Pipe Contractor Labor Contract Labor‐Boring Crew ‐6" Carrier Installation (4 Man Crew Day Rate 8 hr Days‐for 3 days)
96.00 $118 Hr. $11,328
Install and Paint Vents 15.00 $118 Hr. $1,770 Miscellaneous (inspection, etc.) $2,478 Grand Total $33,748
Thus, total costs for installation of a 300-ft length of a 6-inch pipe with an encasement would be between $81,748 (=$33,748 + $9,000 + $39,000) to $88,948 (=$33,748 + $16,200 + $39,000).
The cost of installation of the same 300-ft length 6-inch pipe without casing would be $42,748 to $49,948. However, the cost of installation of a carrier pipe without casing might become higher due to higher material costs and a larger pipe wall thickness and additional coating protection needed for jacking it in the soil. A quantified estimate for the cost without casing is provided in Table 22. The cost is found to be in the range of $127,076 (=$118,076+ $9,000) to $134,276 (=$118,076+ $16,200).
Table 22: Estimated costs to high-quality 6-inch steel pipe without casing
(Note: costs do not include the jacking cost)
Description QTY. Unit Cost Units Total Project Cost Material 6-inch diameter Steel Pipe 300.00 $333.80* feet $100,140 Miscellaneous items (taxes, freight, etc., 15%) $2,360
Pipe Contractor Labor Contract Labor‐Boring Crew ‐6" Carrier Installation (4 Man Crew Day Rate 8 hr Days‐for 3 days)
96.00 $118 Hr. $11,328
Install and Paint Vents 15.00 $118 Hr. $1,770 Miscellaneous (inspection, etc.) $2,478 Grand Total $118,076
* 6" Seamless Pipe Schedule 80s, Stainless Steel 316/316L ASTM A312 ASME SA312 suitable for gas transmission without encasing (Source: Pipingnow.com)
86
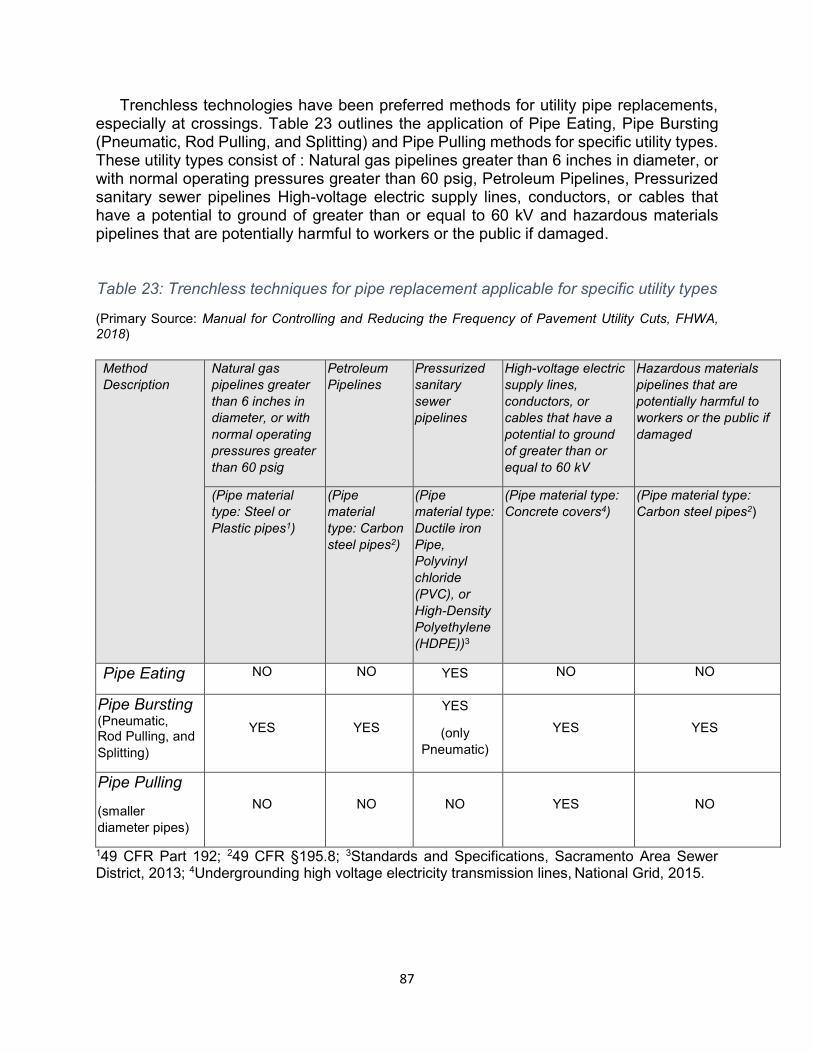
Trenchless technologies have been preferred methods for utility pipe replacements, especially at crossings. Table 23 outlines the application of Pipe Eating, Pipe Bursting (Pneumatic, Rod Pulling, and Splitting) and Pipe Pulling methods for specific utility types. These utility types consist of : Natural gas pipelines greater than 6 inches in diameter, or with normal operating pressures greater than 60 psig, Petroleum Pipelines, Pressurized sanitary sewer pipelines High-voltage electric supply lines, conductors, or cables that have a potential to ground of greater than or equal to 60 kV and hazardous materials pipelines that are potentially harmful to workers or the public if damaged.
Table 23: Trenchless techniques for pipe replacement applicable for specific utility types
(Primary Source: Manual for Controlling and Reducing the Frequency of Pavement Utility Cuts, FHWA, 2018)
Method Description
Natural gas pipelines greater than 6 inches in diameter, or with normal operating pressures greater than 60 psig
Petroleum Pipelines
Pressurized sanitary sewer pipelines
High-voltage electric supply lines, conductors, or cables that have a potential to ground of greater than or equal to 60 kV
Hazardous materials pipelines that are potentially harmful to workers or the public if damaged
(Pipe material type: Steel or Plastic pipes1)
(Pipe material type: Carbon steel pipes2)
(Pipe material type: Ductile iron Pipe, Polyvinyl chloride (PVC), or High-Density Polyethylene (HDPE))3
(Pipe material type: Concrete covers4)
(Pipe material type: Carbon steel pipes2)
Pipe Eating NO NO YES NO NO
Pipe Bursting (Pneumatic, Rod Pulling, and Splitting)
YES YES YES
(only Pneumatic)
YES YES
Pipe Pulling
(smaller diameter pipes)
NO NO NO YES NO
149 CFR Part 192; 249 CFR §195.8; 3Standards and Specifications, Sacramento Area Sewer District, 2013; 4Undergrounding high voltage electricity transmission lines, National Grid, 2015.
87
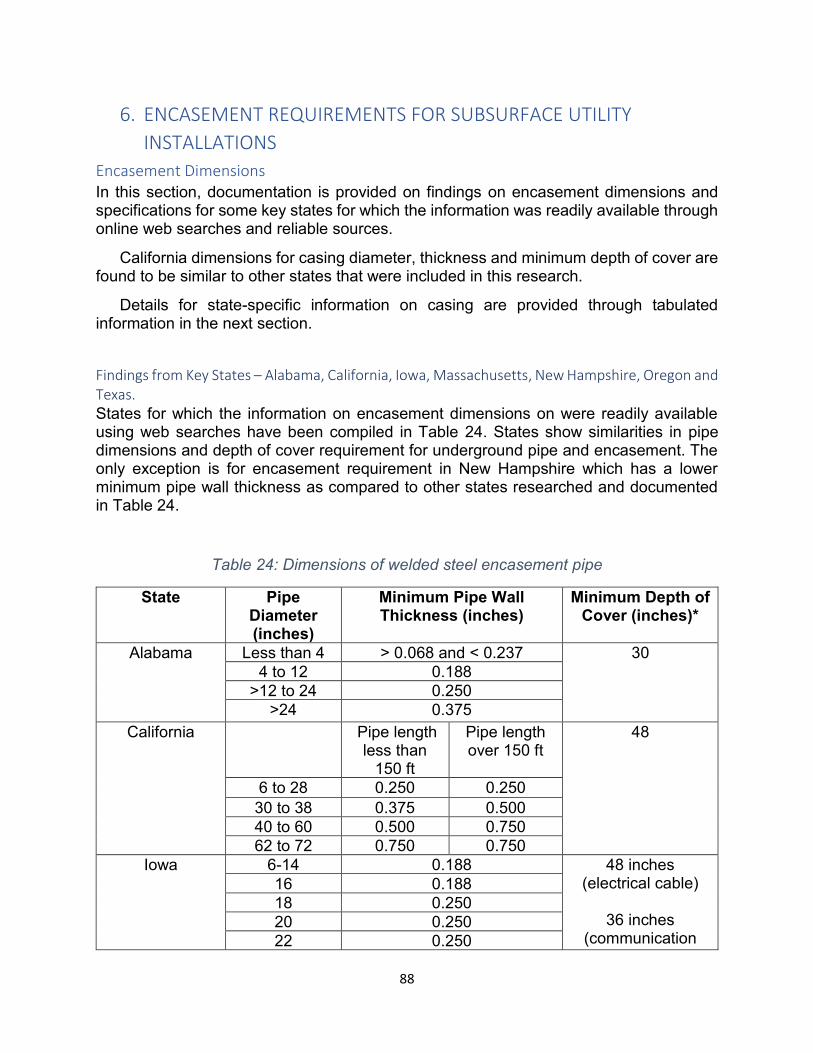
6. ENCASEMENT REQUIREMENTS FOR SUBSURFACE UTILITY
INSTALLATIONS
Encasement Dimensions In this section, documentation is provided on findings on encasement dimensions and specifications for some key states for which the information was readily available through online web searches and reliable sources.
California dimensions for casing diameter, thickness and minimum depth of cover are found to be similar to other states that were included in this research.
Details for state-specific information on casing are provided through tabulated information in the next section.
Findings from Key States – Alabama, California, Iowa, Massachusetts, New Hampshire, Oregon and Texas. States for which the information on encasement dimensions on were readily available using web searches have been compiled in Table 24. States show similarities in pipe dimensions and depth of cover requirement for underground pipe and encasement. The only exception is for encasement requirement in New Hampshire which has a lower minimum pipe wall thickness as compared to other states researched and documented in Table 24.
Table 24: Dimensions of welded steel encasement pipe
State Pipe Diameter (inches)
Minimum Pipe Wall Thickness (inches)
Minimum Depth of Cover (inches)*
Alabama Less than 4 > 0.068 and < 0.237 30 4 to 12 0.188
>12 to 24 0.250 >24 0.375
California Pipe length less than
150 ft
Pipe length over 150 ft
48
6 to 28 0.250 0.250 30 to 38 0.375 0.500 40 to 60 0.500 0.750 62 to 72 0.750 0.750
Iowa 6-14 0.188 48 inches (electrical cable)
36 inches (communication
16 0.188 18 0.250 20 0.250 22 0.250
88
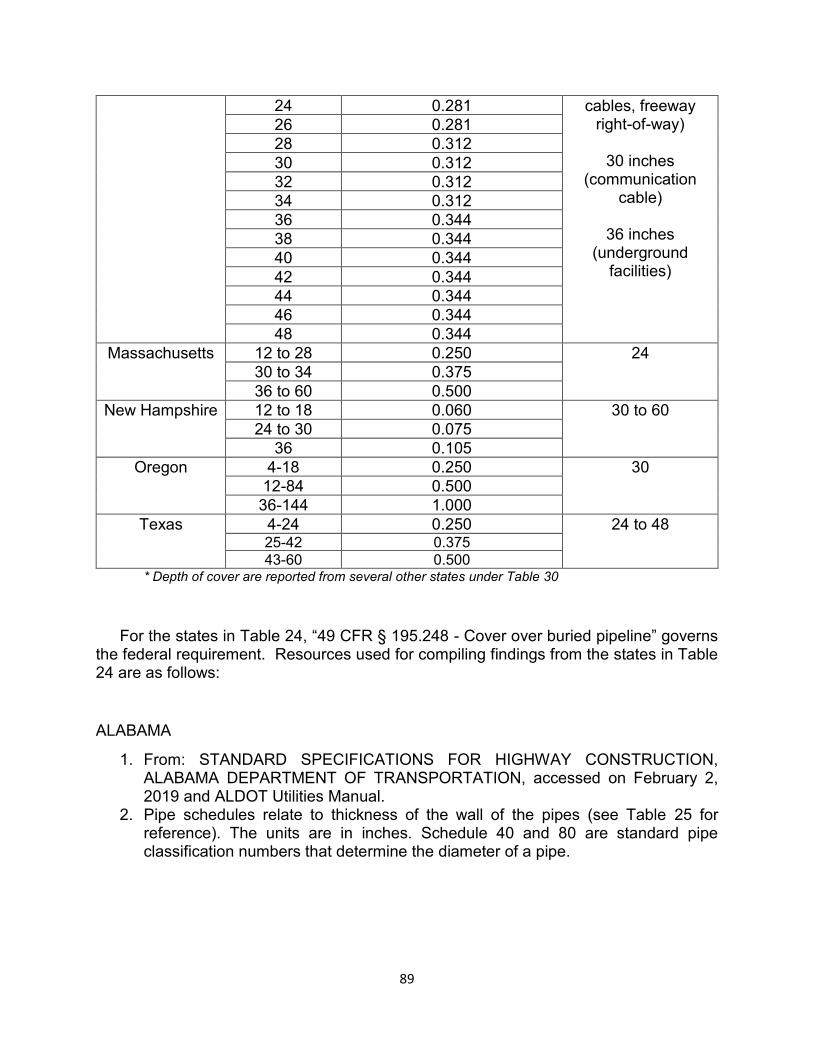
24 0.281 cables, freeway right-of-way)
30 inches (communication
cable)
36 inches (underground
facilities)
26 0.281 28 0.312 30 0.312 32 0.312 34 0.312 36 0.344 38 0.344 40 0.344 42 0.344 44 0.344 46 0.344 48 0.344
Massachusetts 12 to 28 0.250 24 30 to 34 0.375 36 to 60 0.500
New Hampshire 12 to 18 0.060 30 to 60 24 to 30 0.075
36 0.105 Oregon 4-18 0.250 30
12-84 0.500 36-144 1.000
Texas 4-24 0.250 24 to 48 25-42 0.375 43-60 0.500
* Depth of cover are reported from several other states under Table 30
For the states in Table 24, “49 CFR § 195.248 - Cover over buried pipeline” governs the federal requirement. Resources used for compiling findings from the states in Table 24 are as follows:
ALABAMA
1. From: STANDARD SPECIFICATIONS FOR HIGHWAY CONSTRUCTION, ALABAMA DEPARTMENT OF TRANSPORTATION, accessed on February 2, 2019 and ALDOT Utilities Manual.
2. Pipe schedules relate to thickness of the wall of the pipes (see Table 25 for reference). The units are in inches. Schedule 40 and 80 are standard pipe classification numbers that determine the diameter of a pipe.
89
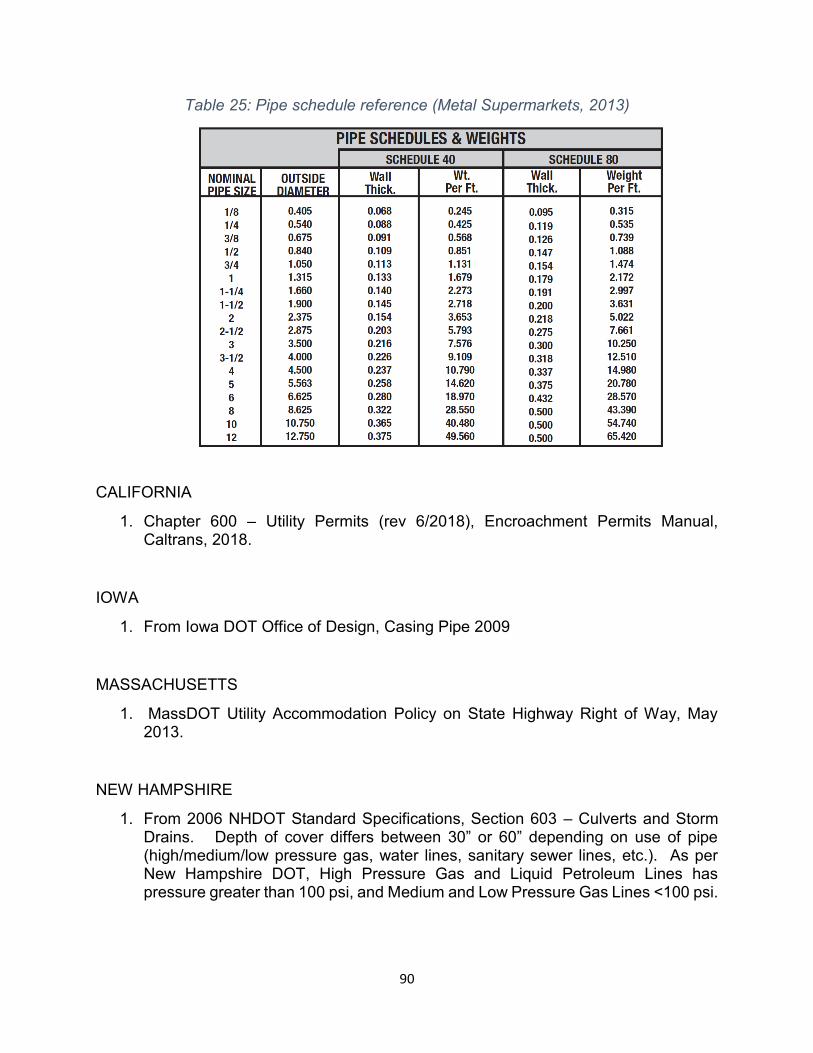
Table 25: Pipe schedule reference (Metal Supermarkets, 2013)
CALIFORNIA
1. Chapter 600 – Utility Permits (rev 6/2018), Encroachment Permits Manual, Caltrans, 2018.
IOWA
1. From Iowa DOT Office of Design, Casing Pipe 2009
MASSACHUSETTS
1. MassDOT Utility Accommodation Policy on State Highway Right of Way, May 2013.
NEW HAMPSHIRE
1. From 2006 NHDOT Standard Specifications, Section 603 – Culverts and Storm Drains. Depth of cover differs between 30” or 60” depending on use of pipe (high/medium/low pressure gas, water lines, sanitary sewer lines, etc.). As per New Hampshire DOT, High Pressure Gas and Liquid Petroleum Lines has pressure greater than 100 psi, and Medium and Low Pressure Gas Lines <100 psi.
90
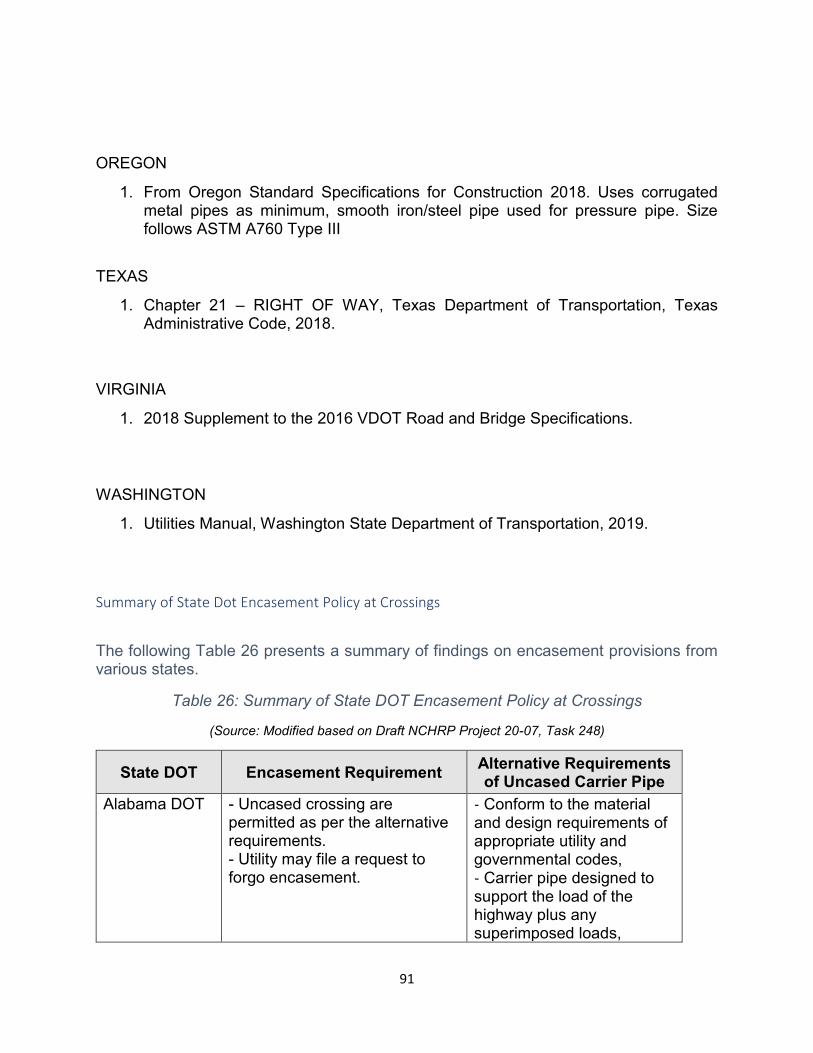
OREGON
1. From Oregon Standard Specifications for Construction 2018. Uses corrugated metal pipes as minimum, smooth iron/steel pipe used for pressure pipe. Size follows ASTM A760 Type III
TEXAS
1. Chapter 21 – RIGHT OF WAY, Texas Department of Transportation, Texas Administrative Code, 2018.
VIRGINIA
1. 2018 Supplement to the 2016 VDOT Road and Bridge Specifications.
WASHINGTON
1. Utilities Manual, Washington State Department of Transportation, 2019.
Summary of State Dot Encasement Policy at Crossings
The following Table 26 presents a summary of findings on encasement provisions from various states.
Table 26: Summary of State DOT Encasement Policy at Crossings
(Source: Modified based on Draft NCHRP Project 20-07, Task 248)
State DOT Encasement Requirement Alternative Requirements of Uncased Carrier Pipe
Alabama DOT - Uncased crossing are permitted as per the alternative requirements. - Utility may file a request to forgo encasement.
‐ Conform to the material and design requirements of appropriate utility and governmental codes, ‐ Carrier pipe designed to support the load of the highway plus any superimposed loads,
91
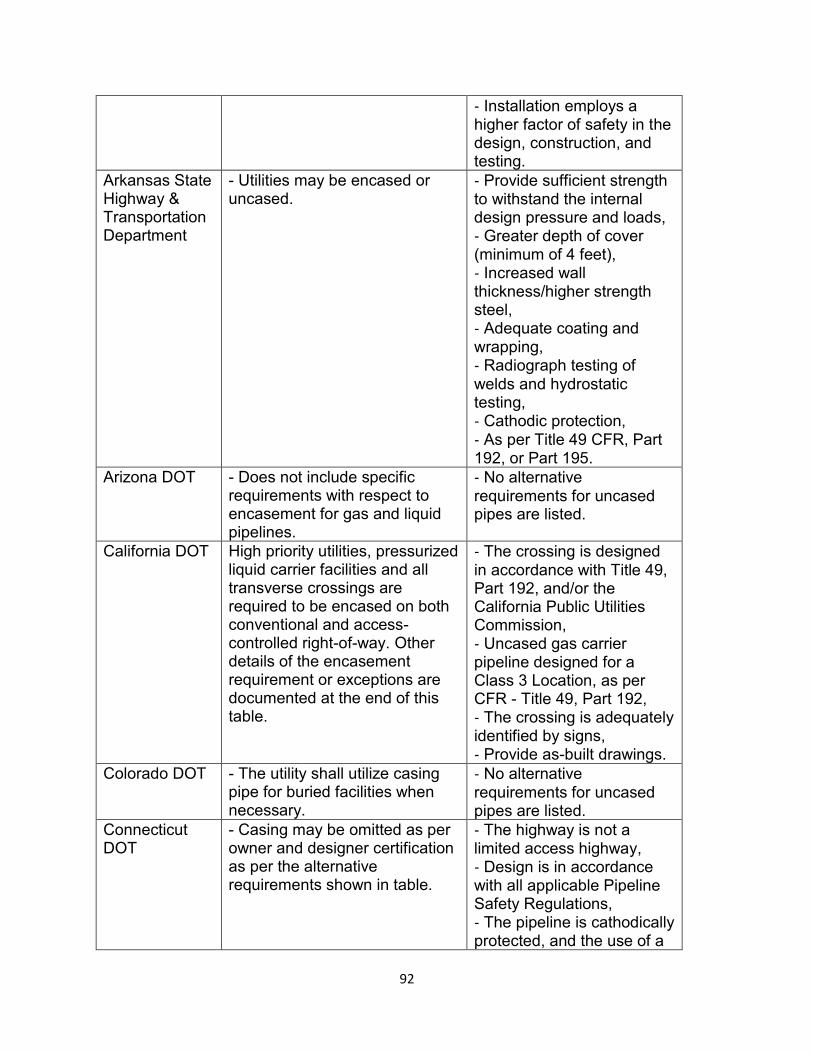
‐ Installation employs a higher factor of safety in the design, construction, and testing.
Arkansas State - Utilities may be encased or ‐ Provide sufficient strength Highway & uncased. to withstand the internal Transportation design pressure and loads, Department ‐ Greater depth of cover
(minimum of 4 feet), ‐ Increased wall thickness/higher strength steel, ‐ Adequate coating and wrapping, ‐ Radiograph testing of welds and hydrostatic testing, ‐ Cathodic protection, ‐ As per Title 49 CFR, Part 192, or Part 195.
Arizona DOT - Does not include specific requirements with respect to encasement for gas and liquid pipelines.
‐ No alternative requirements for uncased pipes are listed.
California DOT High priority utilities, pressurized liquid carrier facilities and all transverse crossings are required to be encased on both conventional and access-controlled right-of-way. Other details of the encasement requirement or exceptions are documented at the end of this table.
‐ The crossing is designed in accordance with Title 49, Part 192, and/or the California Public Utilities Commission, ‐ Uncased gas carrier pipeline designed for a Class 3 Location, as per CFR - Title 49, Part 192, ‐ The crossing is adequately identified by signs, ‐ Provide as-built drawings.
Colorado DOT - The utility shall utilize casing pipe for buried facilities when necessary.
‐ No alternative requirements for uncased pipes are listed.
Connecticut DOT
- Casing may be omitted as per owner and designer certification as per the alternative requirements shown in table.
‐ The highway is not a limited access highway, ‐ Design is in accordance with all applicable Pipeline Safety Regulations, ‐ The pipeline is cathodically protected, and the use of a
92
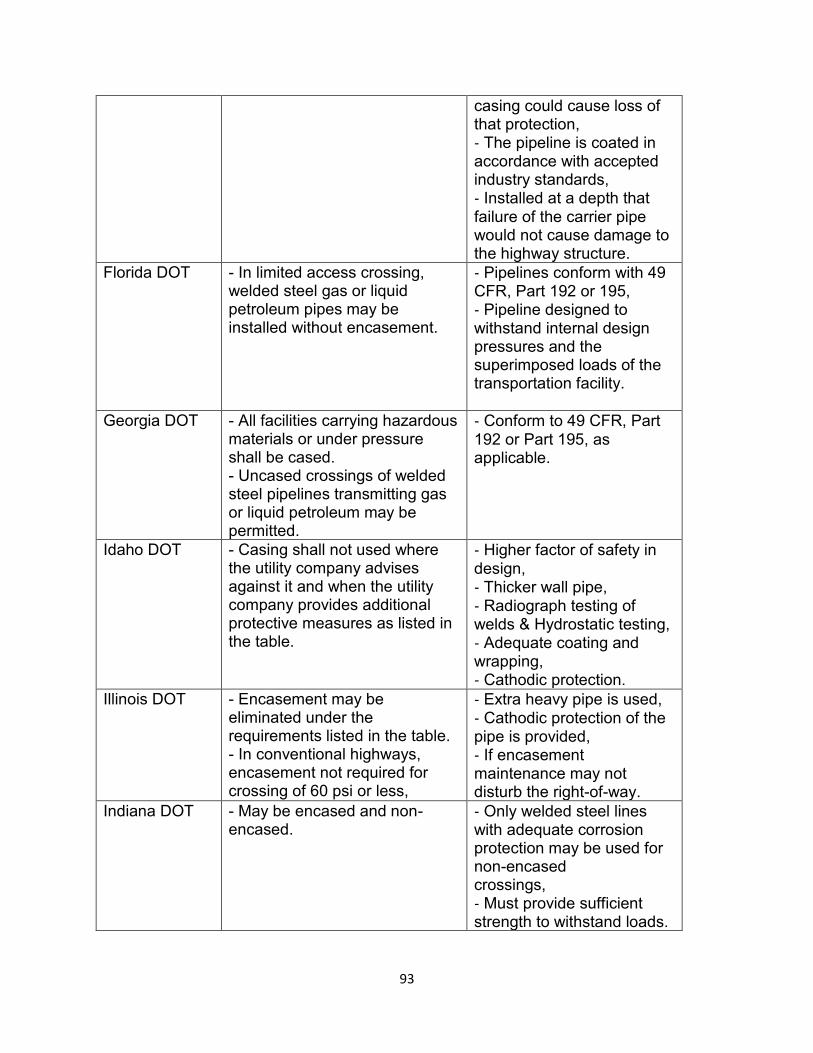
casing could cause loss of that protection, ‐ The pipeline is coated in accordance with accepted industry standards, ‐ Installed at a depth that failure of the carrier pipe would not cause damage to the highway structure.
Florida DOT - In limited access crossing, welded steel gas or liquid petroleum pipes may be installed without encasement.
‐ Pipelines conform with 49 CFR, Part 192 or 195, ‐ Pipeline designed to withstand internal design pressures and the superimposed loads of the transportation facility.
Georgia DOT - All facilities carrying hazardous materials or under pressure shall be cased. - Uncased crossings of welded steel pipelines transmitting gas or liquid petroleum may be permitted.
‐ Conform to 49 CFR, Part 192 or Part 195, as applicable.
Idaho DOT - Casing shall not used where the utility company advises against it and when the utility company provides additional protective measures as listed in the table.
‐ Higher factor of safety in design, ‐ Thicker wall pipe, ‐ Radiograph testing of welds & Hydrostatic testing, ‐ Adequate coating and wrapping, ‐ Cathodic protection.
Illinois DOT - Encasement may be eliminated under the requirements listed in the table. - In conventional highways, encasement not required for crossing of 60 psi or less,
‐ Extra heavy pipe is used, ‐ Cathodic protection of the pipe is provided, ‐ If encasement maintenance may not disturb the right-of-way.
Indiana DOT - May be encased and non-encased.
‐ Only welded steel lines with adequate corrosion protection may be used for non-encased crossings, ‐ Must provide sufficient strength to withstand loads.
93
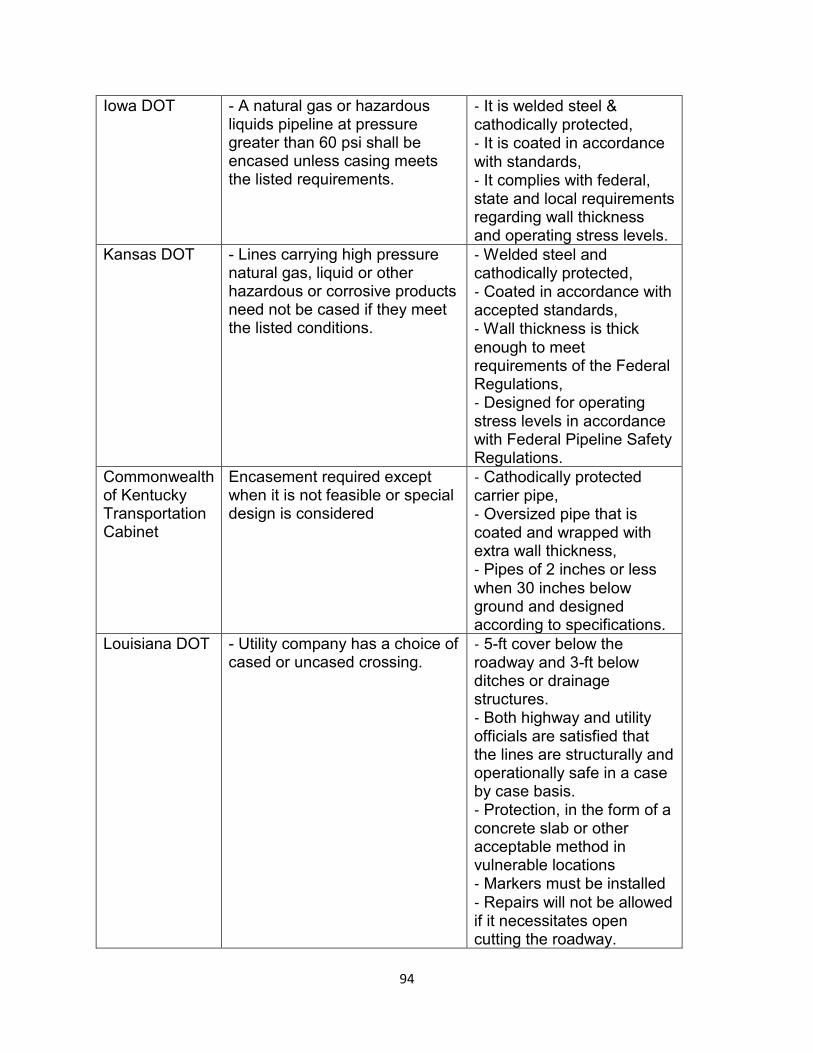
Iowa DOT - A natural gas or hazardous liquids pipeline at pressure greater than 60 psi shall be encased unless casing meets the listed requirements.
‐ It is welded steel & cathodically protected, ‐ It is coated in accordance with standards, ‐ It complies with federal, state and local requirements regarding wall thickness and operating stress levels.
Kansas DOT - Lines carrying high pressure natural gas, liquid or other hazardous or corrosive products need not be cased if they meet the listed conditions.
‐ Welded steel and cathodically protected, ‐ Coated in accordance with accepted standards, ‐ Wall thickness is thick enough to meet requirements of the Federal Regulations, ‐ Designed for operating stress levels in accordance with Federal Pipeline Safety Regulations.
Commonwealth of Kentucky Transportation Cabinet
Encasement required except when it is not feasible or special design is considered
‐ Cathodically protected carrier pipe, ‐ Oversized pipe that is coated and wrapped with extra wall thickness, ‐ Pipes of 2 inches or less when 30 inches below ground and designed according to specifications.
Louisiana DOT - Utility company has a choice of cased or uncased crossing.
‐ 5-ft cover below the roadway and 3-ft below ditches or drainage structures. ‐ Both highway and utility officials are satisfied that the lines are structurally and operationally safe in a case by case basis. ‐ Protection, in the form of a concrete slab or other acceptable method in vulnerable locations ‐ Markers must be installed ‐ Repairs will not be allowed if it necessitates open cutting the roadway.
94
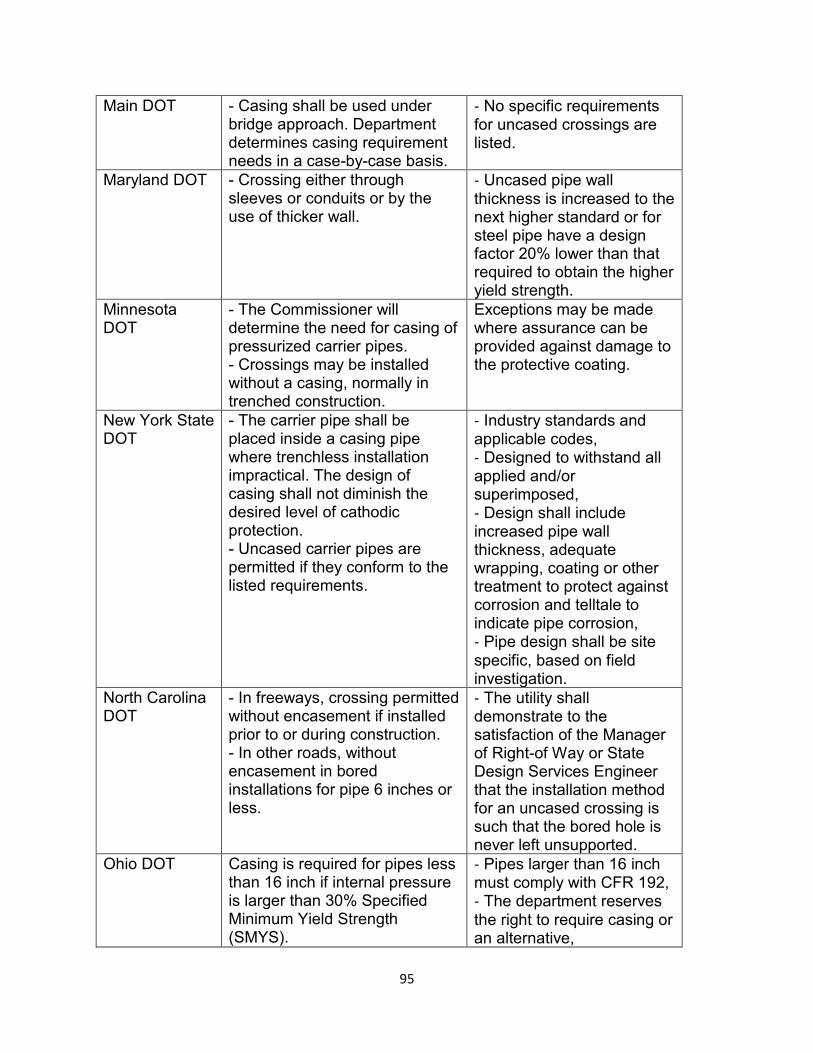
Main DOT - Casing shall be used under bridge approach. Department determines casing requirement needs in a case-by-case basis.
‐ No specific requirements for uncased crossings are listed.
Maryland DOT - Crossing either through sleeves or conduits or by the use of thicker wall.
‐ Uncased pipe wall thickness is increased to the next higher standard or for steel pipe have a design factor 20% lower than that required to obtain the higher yield strength.
Minnesota - The Commissioner will Exceptions may be made DOT determine the need for casing of
pressurized carrier pipes. - Crossings may be installed without a casing, normally in trenched construction.
where assurance can be provided against damage to the protective coating.
New York State DOT
- The carrier pipe shall be placed inside a casing pipe where trenchless installation impractical. The design of casing shall not diminish the desired level of cathodic protection. - Uncased carrier pipes are permitted if they conform to the listed requirements.
‐ Industry standards and applicable codes, ‐ Designed to withstand all applied and/or superimposed, ‐ Design shall include increased pipe wall thickness, adequate wrapping, coating or other treatment to protect against corrosion and telltale to indicate pipe corrosion, ‐ Pipe design shall be site specific, based on field investigation.
North Carolina DOT
- In freeways, crossing permitted without encasement if installed prior to or during construction. - In other roads, without encasement in bored installations for pipe 6 inches or less.
‐ The utility shall demonstrate to the satisfaction of the Manager of Right-of Way or State Design Services Engineer that the installation method for an uncased crossing is such that the bored hole is never left unsupported.
Ohio DOT Casing is required for pipes less than 16 inch if internal pressure is larger than 30% Specified Minimum Yield Strength (SMYS).
‐ Pipes larger than 16 inch must comply with CFR 192, ‐ The department reserves the right to require casing or an alternative,
95
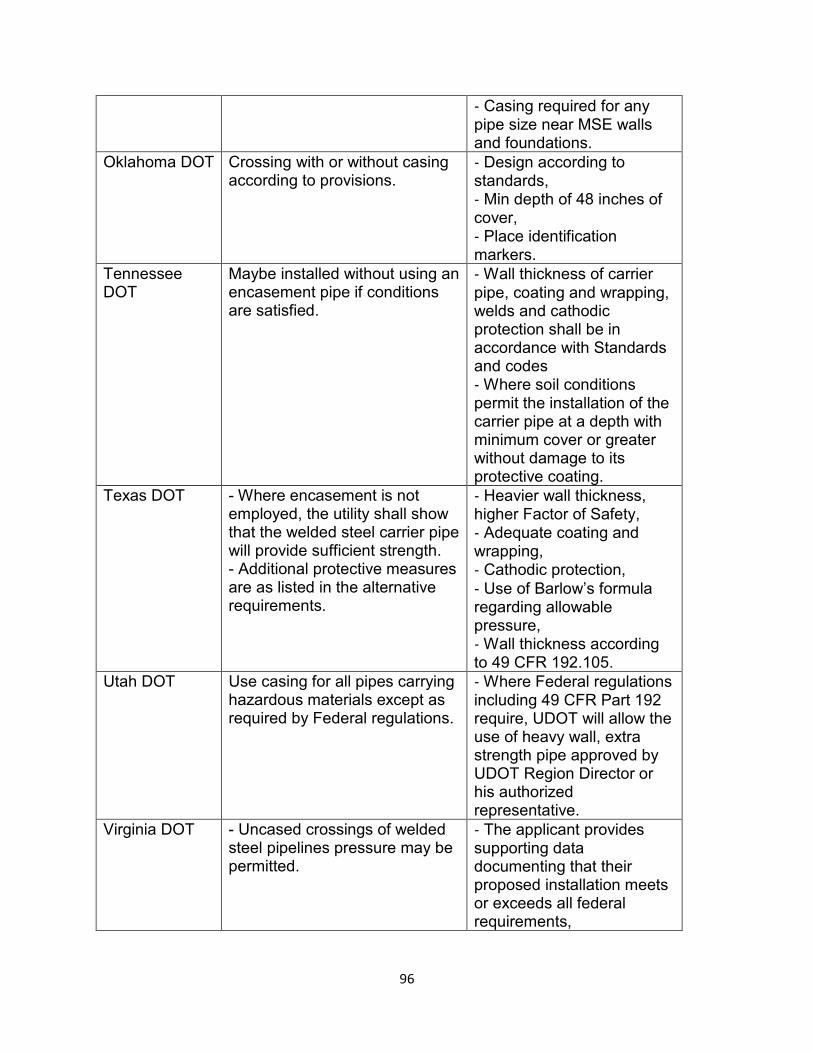
‐ Casing required for any pipe size near MSE walls and foundations.
Oklahoma DOT Crossing with or without casing according to provisions.
‐ Design according to standards, ‐ Min depth of 48 inches of cover, ‐ Place identification markers.
Tennessee Maybe installed without using an ‐ Wall thickness of carrier DOT encasement pipe if conditions
are satisfied. pipe, coating and wrapping, welds and cathodic protection shall be in accordance with Standards and codes ‐ Where soil conditions permit the installation of the carrier pipe at a depth with minimum cover or greater without damage to its protective coating.
Texas DOT - Where encasement is not employed, the utility shall show that the welded steel carrier pipe will provide sufficient strength. - Additional protective measures are as listed in the alternative requirements.
‐ Heavier wall thickness, higher Factor of Safety, ‐ Adequate coating and wrapping, ‐ Cathodic protection, ‐ Use of Barlow’s formula regarding allowable pressure, ‐ Wall thickness according to 49 CFR 192.105.
Utah DOT Use casing for all pipes carrying hazardous materials except as required by Federal regulations.
‐ Where Federal regulations including 49 CFR Part 192 require, UDOT will allow the use of heavy wall, extra strength pipe approved by UDOT Region Director or his authorized representative.
Virginia DOT - Uncased crossings of welded steel pipelines pressure may be permitted.
‐ The applicant provides supporting data documenting that their proposed installation meets or exceeds all federal requirements,
96
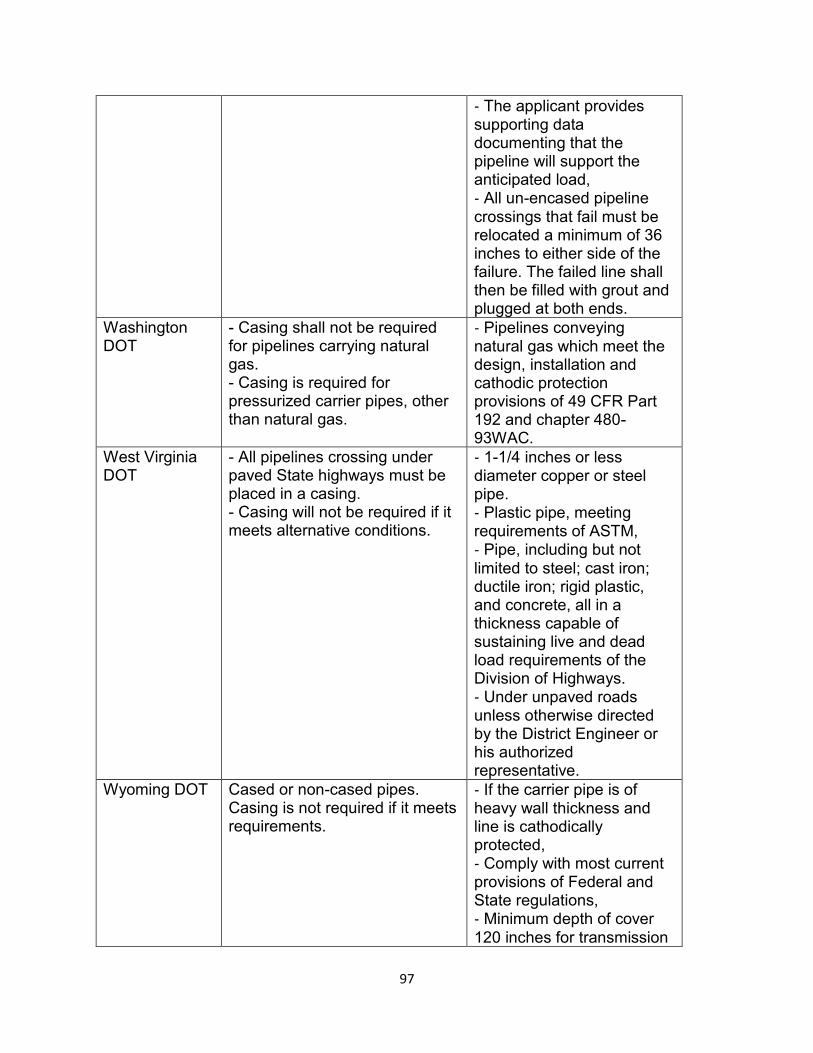
‐ The applicant provides supporting data documenting that the pipeline will support the anticipated load, ‐ All un-encased pipeline crossings that fail must be relocated a minimum of 36 inches to either side of the failure. The failed line shall then be filled with grout and plugged at both ends.
Washington DOT
- Casing shall not be required for pipelines carrying natural gas. - Casing is required for pressurized carrier pipes, other than natural gas.
‐ Pipelines conveying natural gas which meet the design, installation and cathodic protection provisions of 49 CFR Part 192 and chapter 480-93WAC.
West Virginia DOT
- All pipelines crossing under paved State highways must be placed in a casing. - Casing will not be required if it meets alternative conditions.
‐ 1-1/4 inches or less diameter copper or steel pipe. ‐ Plastic pipe, meeting requirements of ASTM, ‐ Pipe, including but not limited to steel; cast iron; ductile iron; rigid plastic, and concrete, all in a thickness capable of sustaining live and dead load requirements of the Division of Highways. ‐ Under unpaved roads unless otherwise directed by the District Engineer or his authorized representative.
Wyoming DOT Cased or non-cased pipes. Casing is not required if it meets requirements.
‐ If the carrier pipe is of heavy wall thickness and line is cathodically protected, ‐ Comply with most current provisions of Federal and State regulations, ‐ Minimum depth of cover 120 inches for transmission
97
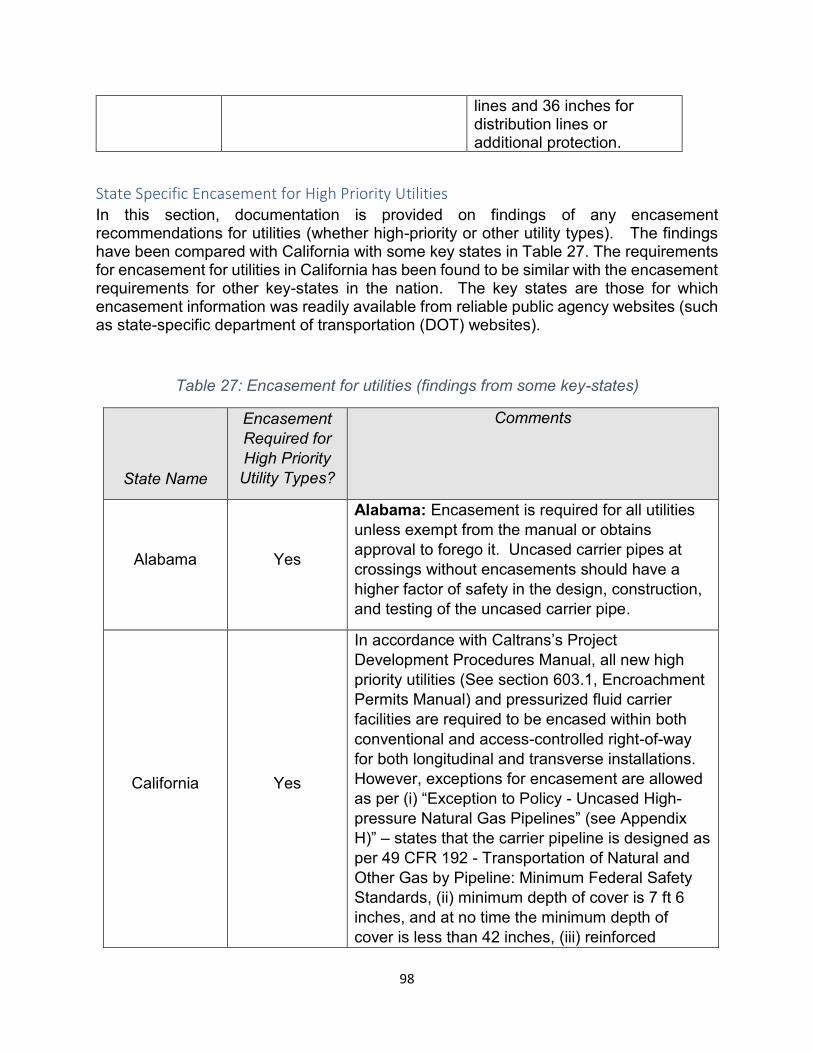
lines and 36 inches for distribution lines or additional protection.
State Specific Encasement for High Priority Utilities In this section, documentation is provided on findings of any encasement recommendations for utilities (whether high-priority or other utility types). The findings have been compared with California with some key states in Table 27. The requirements for encasement for utilities in California has been found to be similar with the encasement requirements for other key-states in the nation. The key states are those for which encasement information was readily available from reliable public agency websites (such as state-specific department of transportation (DOT) websites).
Table 27: Encasement for utilities (findings from some key-states)
State Name
Encasement Required for High Priority
Utility Types?
Comments
Alabama Yes
Alabama: Encasement is required for all utilities unless exempt from the manual or obtains approval to forego it. Uncased carrier pipes at crossings without encasements should have a higher factor of safety in the design, construction, and testing of the uncased carrier pipe.
California Yes
In accordance with Caltrans’s Project Development Procedures Manual, all new high priority utilities (See section 603.1, Encroachment Permits Manual) and pressurized fluid carrier facilities are required to be encased within both conventional and access-controlled right-of-way for both longitudinal and transverse installations. However, exceptions for encasement are allowed as per (i) “Exception to Policy - Uncased High-pressure Natural Gas Pipelines” (see Appendix H)” – states that the carrier pipeline is designed as per 49 CFR 192 - Transportation of Natural and Other Gas by Pipeline: Minimum Federal Safety Standards, (ii) minimum depth of cover is 7 ft 6 inches, and at no time the minimum depth of cover is less than 42 inches, (iii) reinforced
98
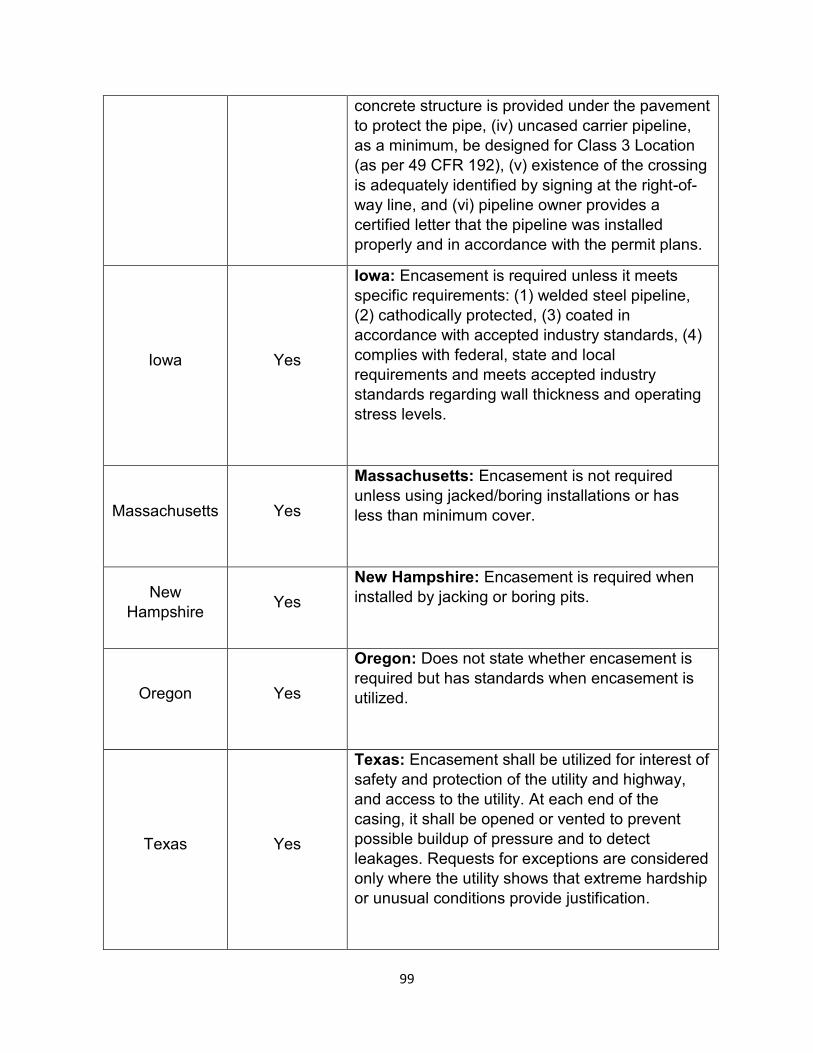
concrete structure is provided under the pavement to protect the pipe, (iv) uncased carrier pipeline, as a minimum, be designed for Class 3 Location (as per 49 CFR 192), (v) existence of the crossing is adequately identified by signing at the right-of-way line, and (vi) pipeline owner provides a certified letter that the pipeline was installed properly and in accordance with the permit plans.
Iowa Yes
Iowa: Encasement is required unless it meets specific requirements: (1) welded steel pipeline, (2) cathodically protected, (3) coated in accordance with accepted industry standards, (4) complies with federal, state and local requirements and meets accepted industry standards regarding wall thickness and operating stress levels.
Massachusetts Yes
Massachusetts: Encasement is not required unless using jacked/boring installations or has less than minimum cover.
New Hampshire Yes
New Hampshire: Encasement is required when installed by jacking or boring pits.
Oregon Yes
Oregon: Does not state whether encasement is required but has standards when encasement is utilized.
Texas Yes
Texas: Encasement shall be utilized for interest of safety and protection of the utility and highway, and access to the utility. At each end of the casing, it shall be opened or vented to prevent possible buildup of pressure and to detect leakages. Requests for exceptions are considered only where the utility shows that extreme hardship or unusual conditions provide justification.
99
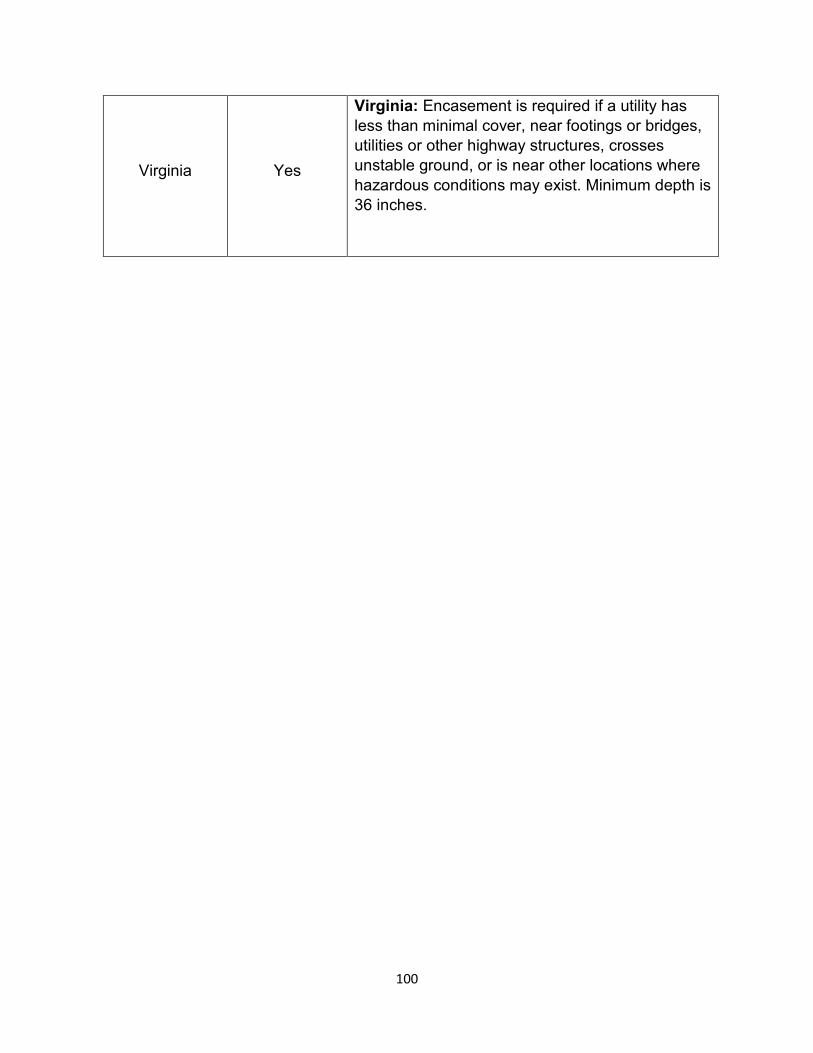
Virginia: Encasement is required if a utility has less than minimal cover, near footings or bridges, utilities or other highway structures, crosses
Virginia Yes unstable ground, or is near other locations where hazardous conditions may exist. Minimum depth is 36 inches.
100

Encasement Requirement for Key States In this section, documentation is provided on findings on highway facilities that might not require encasement or encasement requirement could be waived for any utility types – under freeways, conventional roads or other facilities such as ramps, tunnels etc. The findings have been compared with California with some key states in Table 28. Key states are those for which the findings were readily available from reliable public agency websites (such as state-specific DOTs) and identified using web searches. When compared to policies in other key states, California has more rigorous encasement requirement under freeways and conventional roads. For other facilities such as ramps and tunnels, encasement is required with access control for California. However, there was not many key states that have a defined policy on encasement for ramps and tunnels.
Table 28: Encasement ‘required’ (R), ‘waived’ (W), ‘not recommended’ (NR) or ‘not available’ (NA) for various highway facilities. (here table entries are shown for example
purposes only from one of many literatures that team reviewed)
State Freeway/ Expressway
Conventional
Other facilities with/without access control (such as ramps, tunnels, park-n-ride etc.)
Additional Information
Alabama R NA W
Installations at bridges and tunnels are rare and will be handled on an individual basis as a special case.
California R R R (with access control)
In accordance with Caltrans’s Project Development Procedures Manual, all new high priority utilities (See section 603.1, Encroachment Permits Manual) and pressurized fluid carrier facilities are required to be encased within both conventional and access-controlled right-of-way for both longitudinal and transverse installations.
101
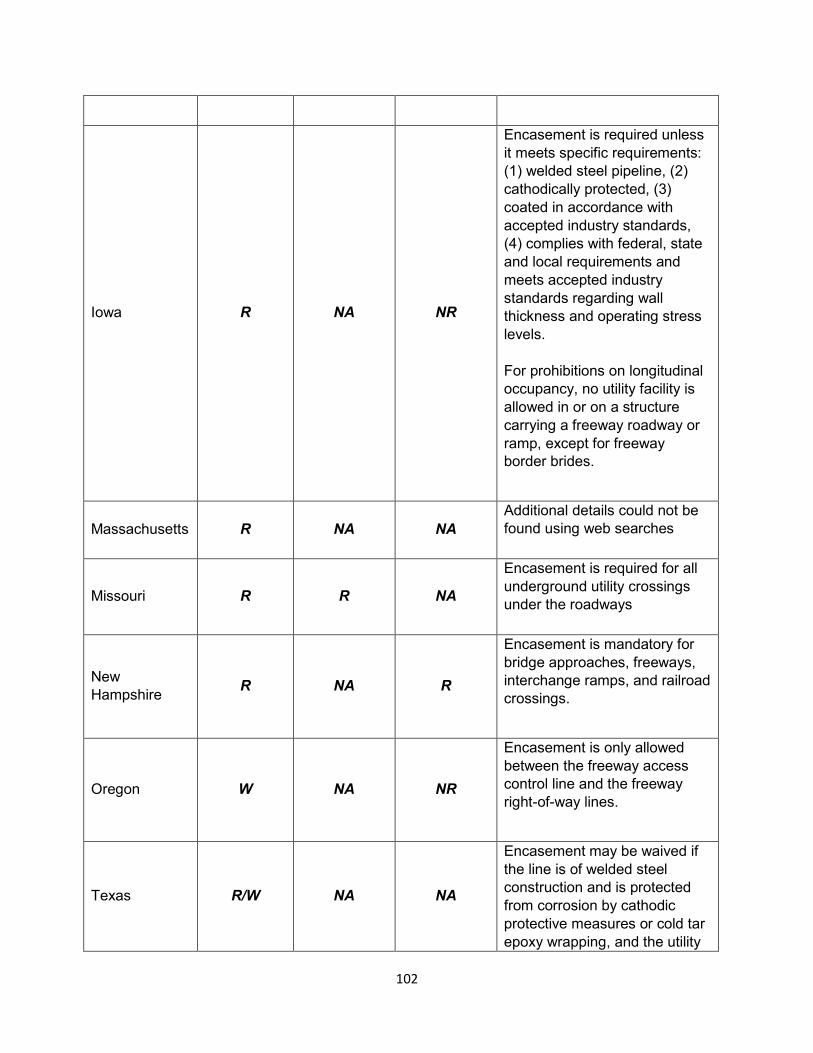
Iowa R NA NR
Encasement is required unless it meets specific requirements: (1) welded steel pipeline, (2) cathodically protected, (3) coated in accordance with accepted industry standards, (4) complies with federal, state and local requirements and meets accepted industry standards regarding wall thickness and operating stress levels.
For prohibitions on longitudinal occupancy, no utility facility is allowed in or on a structure carrying a freeway roadway or ramp, except for freeway border brides.
Massachusetts R NA NA Additional details could not be found using web searches
Missouri R R NA
Encasement is required for all underground utility crossings under the roadways
New Hampshire R NA R
Encasement is mandatory for bridge approaches, freeways, interchange ramps, and railroad crossings.
Oregon W NA NR
Encasement is only allowed between the freeway access control line and the freeway right-of-way lines.
Texas R/W NA NA
Encasement may be waived if the line is of welded steel construction and is protected from corrosion by cathodic protective measures or cold tar epoxy wrapping, and the utility
102

signs a written agreement that the pavement will not be cut for pipeline repairs at any time in the future.
Virginia R NA NA
Encasement is required if a utility has less than minimal cover, near footings or bridges, utilities or other highway structures, crosses unstable ground, or is near other locations where hazardous conditions may exist. Minimum depth is 36 inches.
103
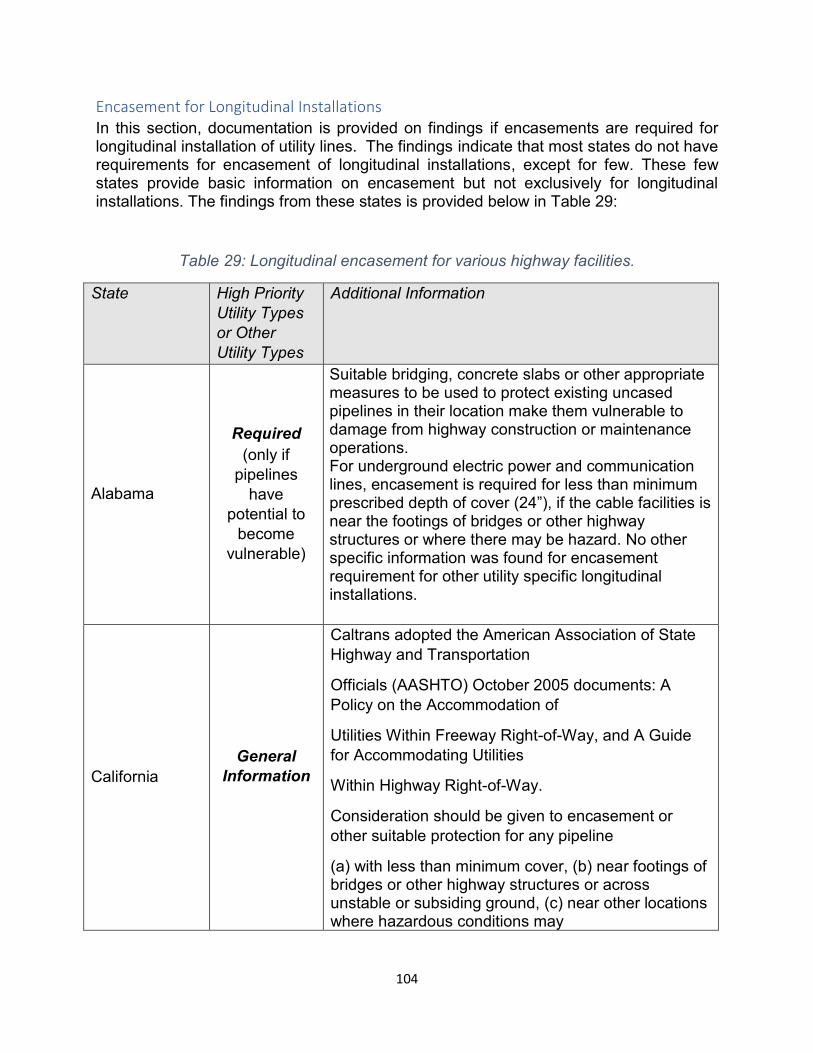
Encasement for Longitudinal Installations In this section, documentation is provided on findings if encasements are required for longitudinal installation of utility lines. The findings indicate that most states do not have requirements for encasement of longitudinal installations, except for few. These few states provide basic information on encasement but not exclusively for longitudinal installations. The findings from these states is provided below in Table 29:
Table 29: Longitudinal encasement for various highway facilities.
State High Priority Utility Types or Other Utility Types
Additional Information
Alabama
Required (only if
pipelines have
potential to become
vulnerable)
Suitable bridging, concrete slabs or other appropriate measures to be used to protect existing uncased pipelines in their location make them vulnerable to damage from highway construction or maintenance operations. For underground electric power and communication lines, encasement is required for less than minimum prescribed depth of cover (24”), if the cable facilities is near the footings of bridges or other highway structures or where there may be hazard. No other specific information was found for encasement requirement for other utility specific longitudinal installations.
California General
Information
Caltrans adopted the American Association of State Highway and Transportation
Officials (AASHTO) October 2005 documents: A Policy on the Accommodation of
Utilities Within Freeway Right-of-Way, and A Guide for Accommodating Utilities
Within Highway Right-of-Way.
Consideration should be given to encasement or other suitable protection for any pipeline
(a) with less than minimum cover, (b) near footings of bridges or other highway structures or across unstable or subsiding ground, (c) near other locations where hazardous conditions may
104
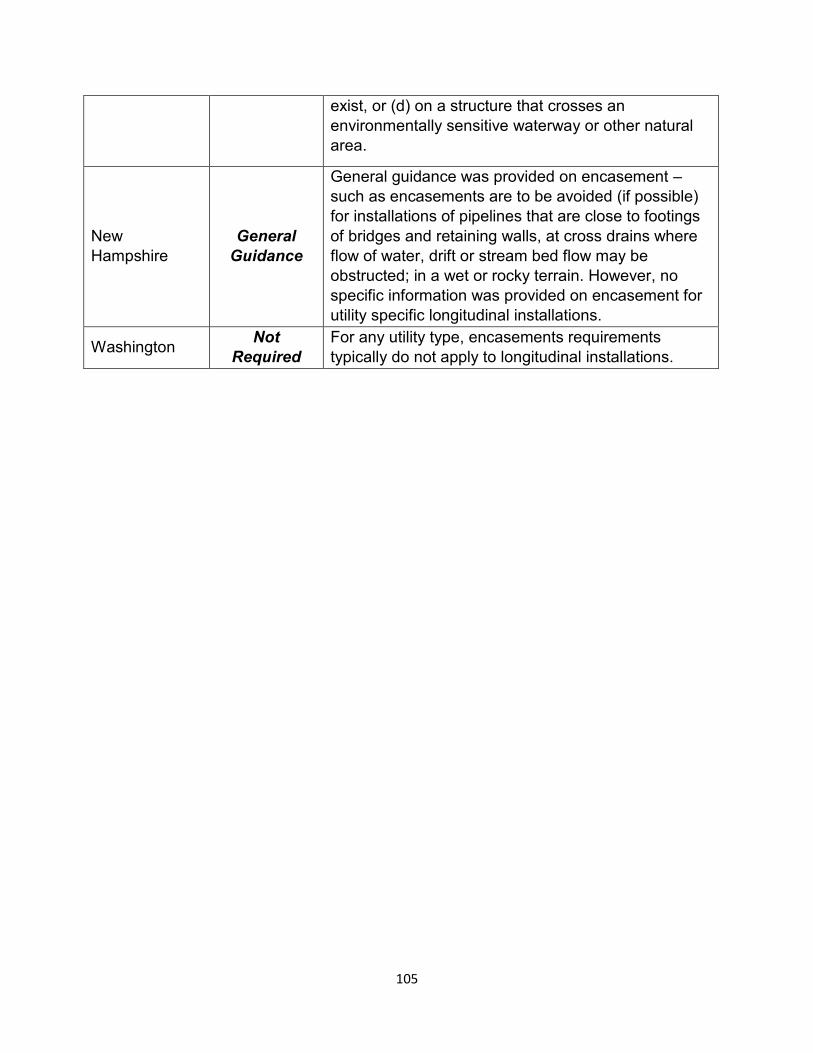
exist, or (d) on a structure that crosses an environmentally sensitive waterway or other natural area.
New Hampshire
General Guidance
General guidance was provided on encasement – such as encasements are to be avoided (if possible) for installations of pipelines that are close to footings of bridges and retaining walls, at cross drains where flow of water, drift or stream bed flow may be obstructed; in a wet or rocky terrain. However, no specific information was provided on encasement for utility specific longitudinal installations.
Washington Not Required
For any utility type, encasements requirements typically do not apply to longitudinal installations.
105
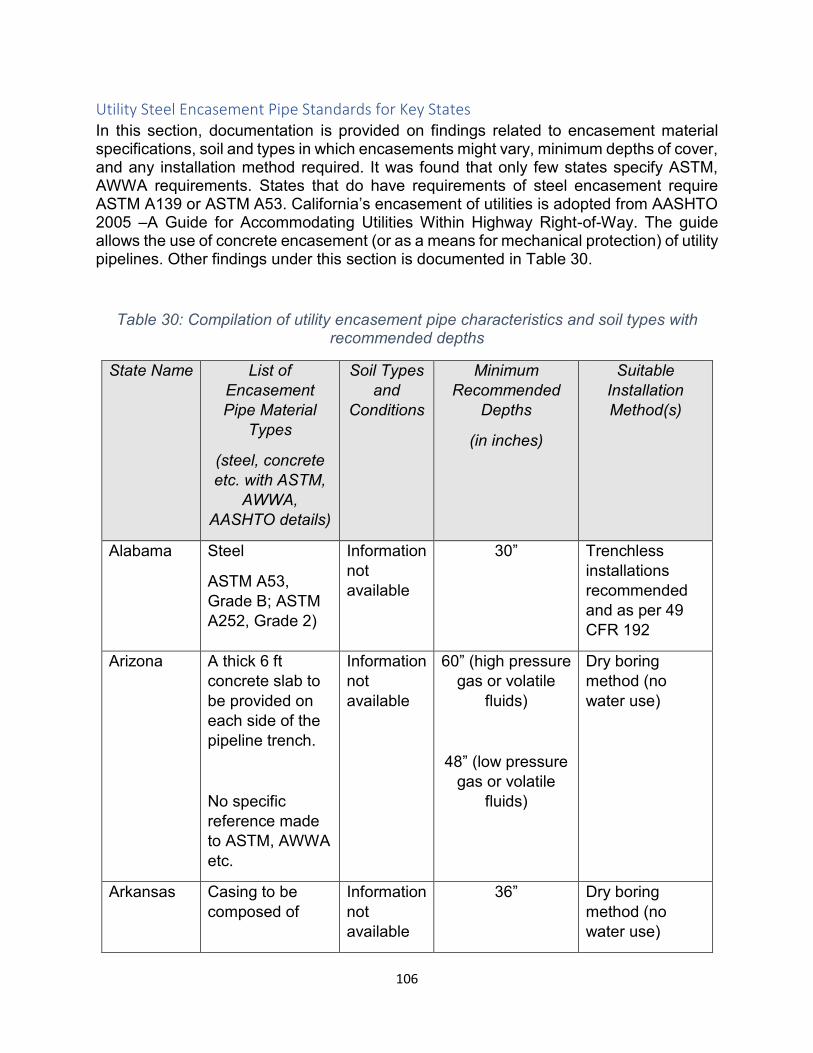
Utility Steel Encasement Pipe Standards for Key States In this section, documentation is provided on findings related to encasement material specifications, soil and types in which encasements might vary, minimum depths of cover, and any installation method required. It was found that only few states specify ASTM, AWWA requirements. States that do have requirements of steel encasement require ASTM A139 or ASTM A53. California’s encasement of utilities is adopted from AASHTO 2005 –A Guide for Accommodating Utilities Within Highway Right-of-Way. The guide allows the use of concrete encasement (or as a means for mechanical protection) of utility pipelines. Other findings under this section is documented in Table 30.
Table 30: Compilation of utility encasement pipe characteristics and soil types with recommended depths
State Name List of Encasement Pipe Material
Types
(steel, concrete etc. with ASTM,
AWWA, AASHTO details)
Soil Types and
Conditions
Minimum Recommended
Depths
(in inches)
Suitable Installation Method(s)
Alabama Steel Information 30” Trenchless
ASTM A53, Grade B; ASTM A252, Grade 2)
not available
installations recommended and as per 49 CFR 192
Arizona A thick 6 ft concrete slab to be provided on each side of the pipeline trench.
No specific reference made to ASTM, AWWA etc.
Information not available
60” (high pressure gas or volatile
fluids)
48” (low pressure gas or volatile
fluids)
Dry boring method (no water use)
Arkansas Casing to be composed of
Information not available
36” Dry boring method (no water use)
106
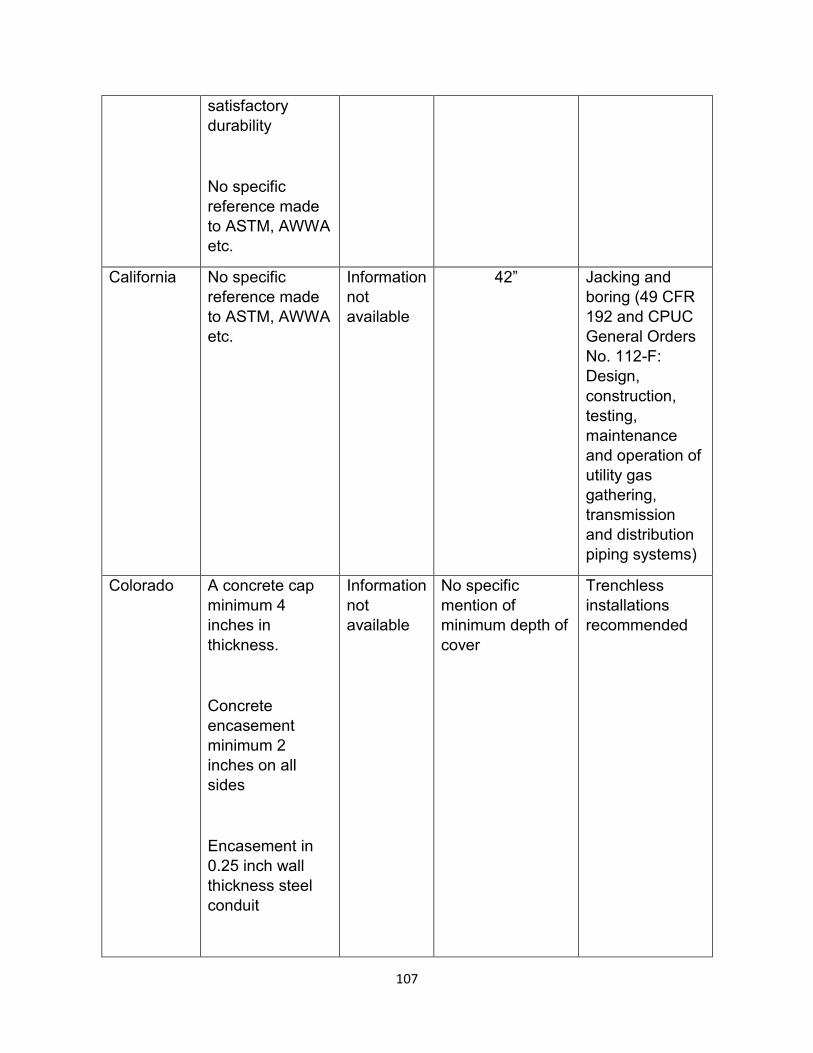
satisfactory durability
No specific reference made to ASTM, AWWA etc.
California No specific reference made to ASTM, AWWA etc.
Information not available
42” Jacking and boring (49 CFR 192 and CPUC General Orders No. 112-F: Design, construction, testing, maintenance and operation of utility gas gathering, transmission and distribution piping systems)
Colorado A concrete cap minimum 4 inches in thickness.
Information not available
No specific mention of minimum depth of cover
Trenchless installations recommended
Concrete encasement minimum 2 inches on all sides
Encasement in 0.25 inch wall thickness steel conduit
107
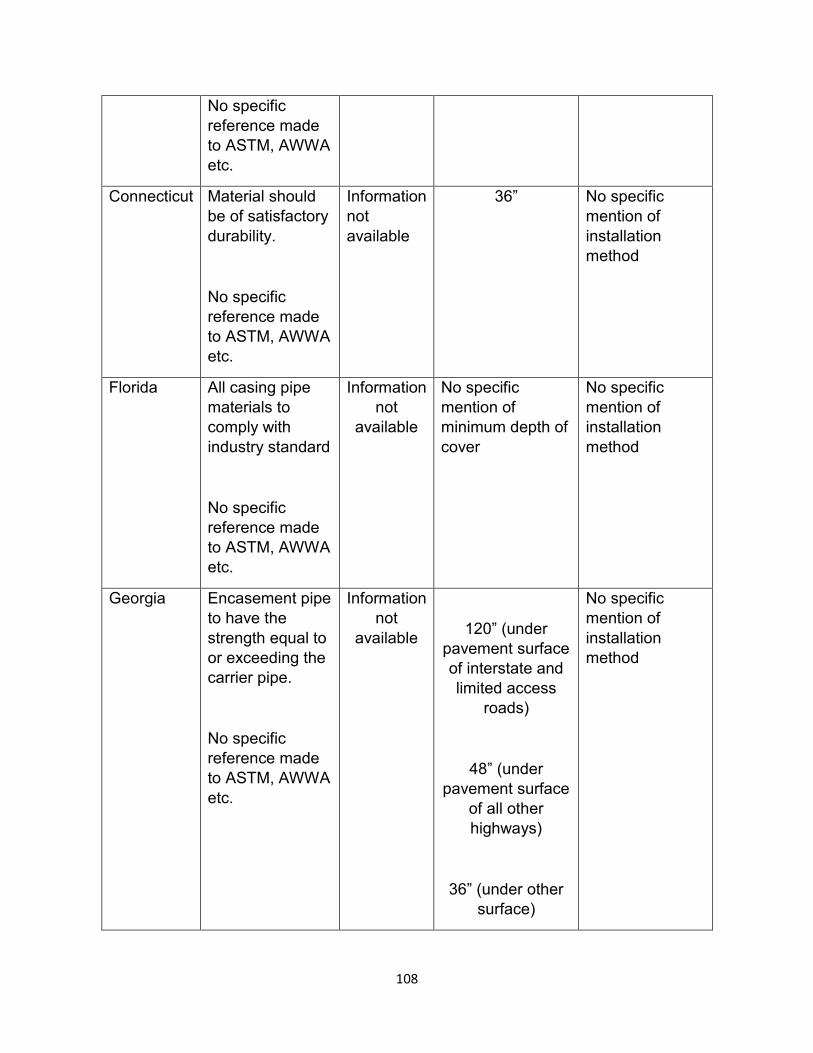
No specific reference made to ASTM, AWWA etc.
Connecticut Material should be of satisfactory durability.
No specific reference made to ASTM, AWWA etc.
Information not available
36” No specific mention of installation method
Florida All casing pipe materials to comply with industry standard
Information not
available
No specific mention of minimum depth of cover
No specific mention of installation method
No specific reference made to ASTM, AWWA etc.
Georgia Encasement pipe to have the strength equal to or exceeding the carrier pipe.
No specific reference made to ASTM, AWWA etc.
Information not
available 120” (under pavement surface of interstate and limited access
roads)
48” (under pavement surface
of all other highways)
No specific mention of installation method
36” (under other surface)
108

Idaho Material should be of satisfactory durability.
No specific reference made to ASTM, AWWA etc.
Information not
available
60” (for interstate)
48 (other locations within 20 ft of edge of
roadway)
36 (other highways and
roads)
Jacking and boring
Illinois No specific reference made to ASTM, AWWA etc.
Information not
available
30 “ Jacking and boring
Indiana
Material should be of satisfactory durability.
No specific reference made to ASTM, AWWA etc.
Information not
available
29.5” (59 inches for high pressure
gas and liquid petroleum lines,
encased)
No specific mention of installation method
109
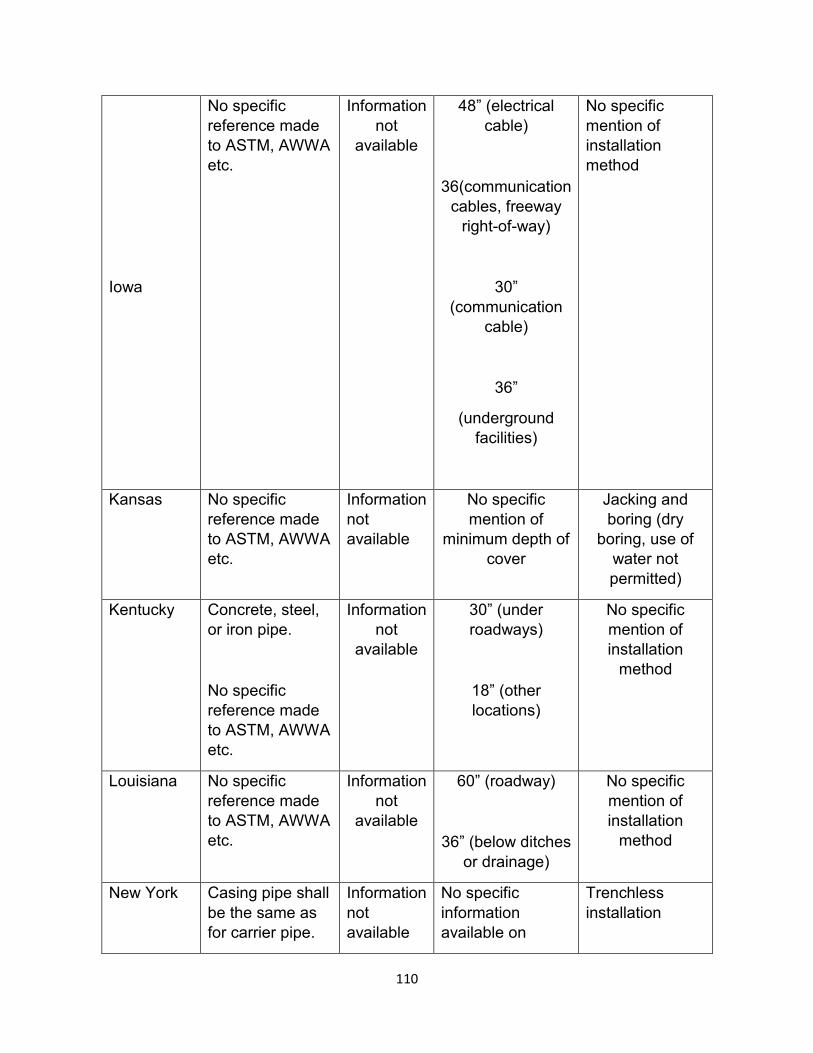
No specific reference made to ASTM, AWWA etc.
Information not
available
48” (electrical cable)
36(communication cables, freeway
right-of-way)
No specific mention of installation method
Iowa 30” (communication
cable)
36”
(underground facilities)
Kansas No specific reference made to ASTM, AWWA etc.
Information not available
No specific mention of
minimum depth of cover
Jacking and boring (dry
boring, use of water not permitted)
Kentucky Concrete, steel, or iron pipe.
No specific reference made to ASTM, AWWA etc.
Information not
available
30” (under roadways)
18” (other locations)
No specific mention of installation
method
Louisiana No specific reference made to ASTM, AWWA etc.
Information not
available
60” (roadway)
36” (below ditches or drainage)
No specific mention of installation
method
New York Casing pipe shall be the same as for carrier pipe.
Information not available
No specific information available on
Trenchless installation
110
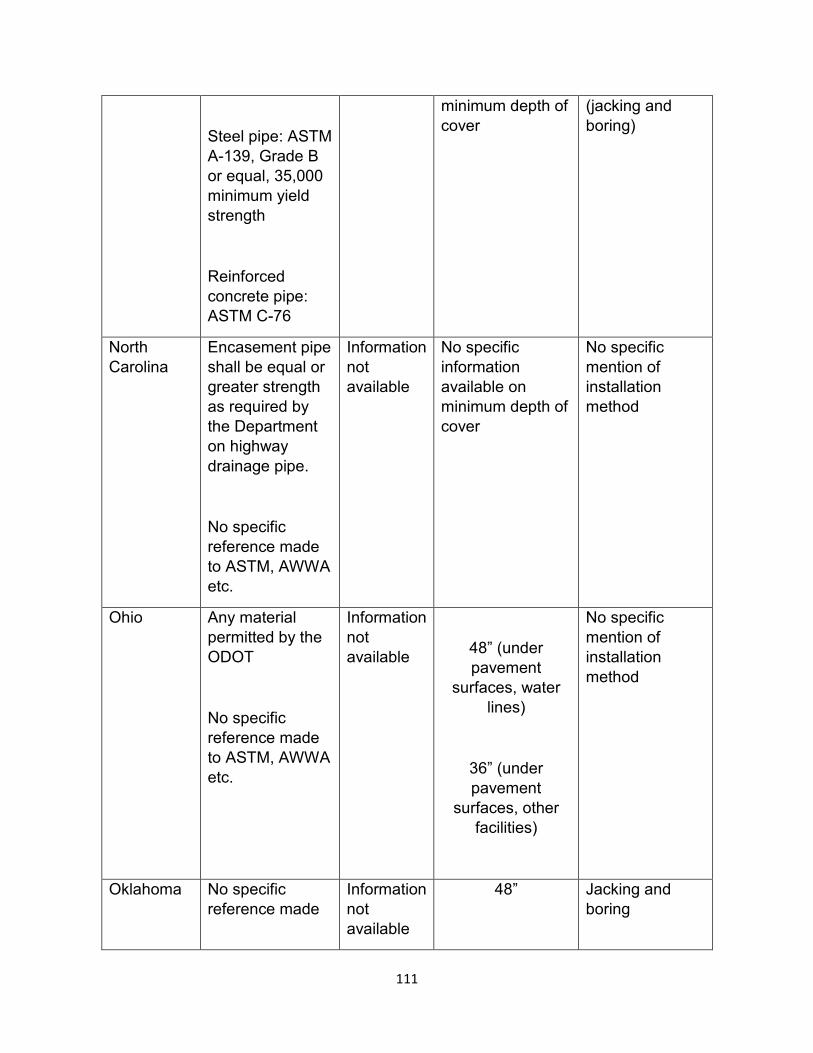
Steel pipe: ASTM A-139, Grade B or equal, 35,000 minimum yield strength
minimum depth of cover
(jacking and boring)
Reinforced concrete pipe: ASTM C-76
North Encasement pipe Information No specific No specific Carolina shall be equal or
greater strength as required by the Department on highway drainage pipe.
not available
information available on minimum depth of cover
mention of installation method
No specific reference made to ASTM, AWWA etc.
Ohio Any material permitted by the ODOT
No specific reference made to ASTM, AWWA etc.
Information not available 48” (under
pavement surfaces, water
lines)
36” (under pavement
surfaces, other facilities)
No specific mention of installation method
Oklahoma No specific reference made
Information not available
48” Jacking and boring
111
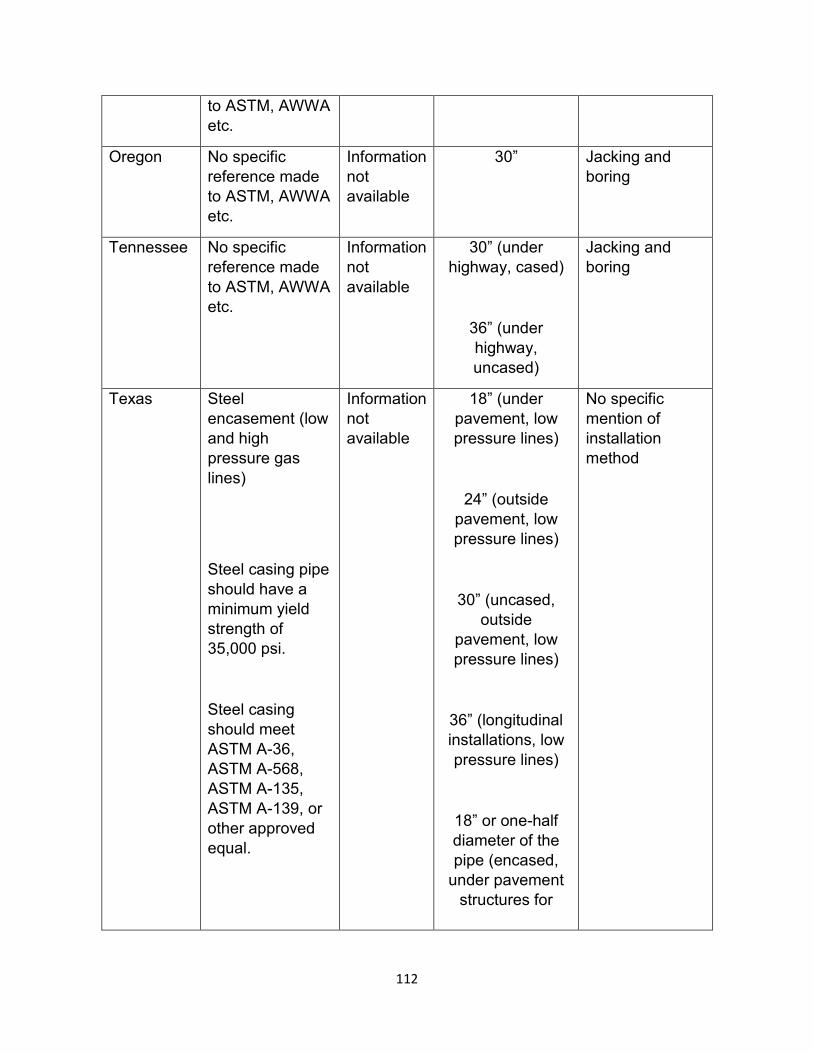
to ASTM, AWWA etc.
Oregon No specific reference made to ASTM, AWWA etc.
Information not available
30” Jacking and boring
Tennessee No specific reference made to ASTM, AWWA etc.
Information not available
30” (under highway, cased)
36” (under highway, uncased)
Jacking and boring
Texas Steel encasement (low and high pressure gas lines)
Steel casing pipe should have a minimum yield strength of 35,000 psi.
Information not available
18” (under pavement, low pressure lines)
24” (outside pavement, low pressure lines)
30” (uncased, outside
pavement, low pressure lines)
No specific mention of installation method
Steel casing should meet ASTM A-36, ASTM A-568, ASTM A-135, ASTM A-139, or other approved equal.
36” (longitudinal installations, low pressure lines)
18” or one-half diameter of the pipe (encased,
under pavement structures for
112
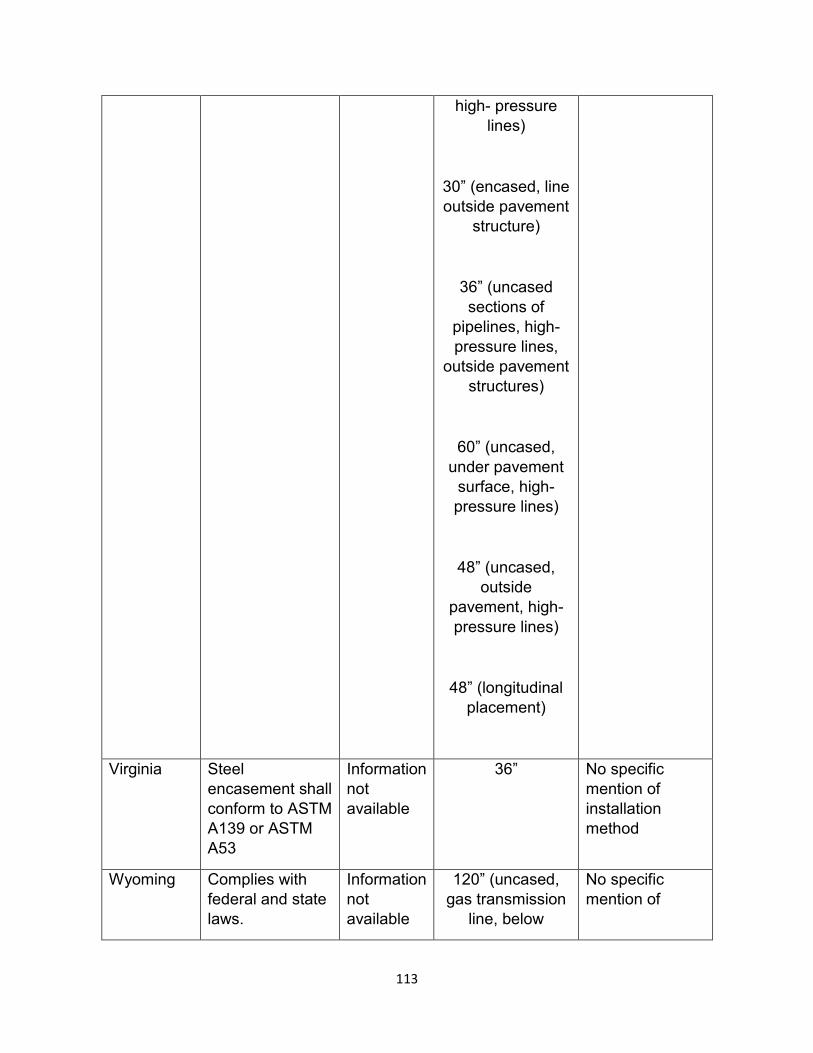
high- pressure lines)
30” (encased, line outside pavement
structure)
36” (uncased sections of
pipelines, high-pressure lines,
outside pavement structures)
60” (uncased, under pavement
surface, high-pressure lines)
48” (uncased, outside
pavement, high-pressure lines)
48” (longitudinal placement)
Virginia Steel encasement shall conform to ASTM A139 or ASTM A53
Information not available
36” No specific mention of installation method
Wyoming Complies with federal and state laws.
Information not available
120” (uncased, gas transmission
line, below
No specific mention of
113
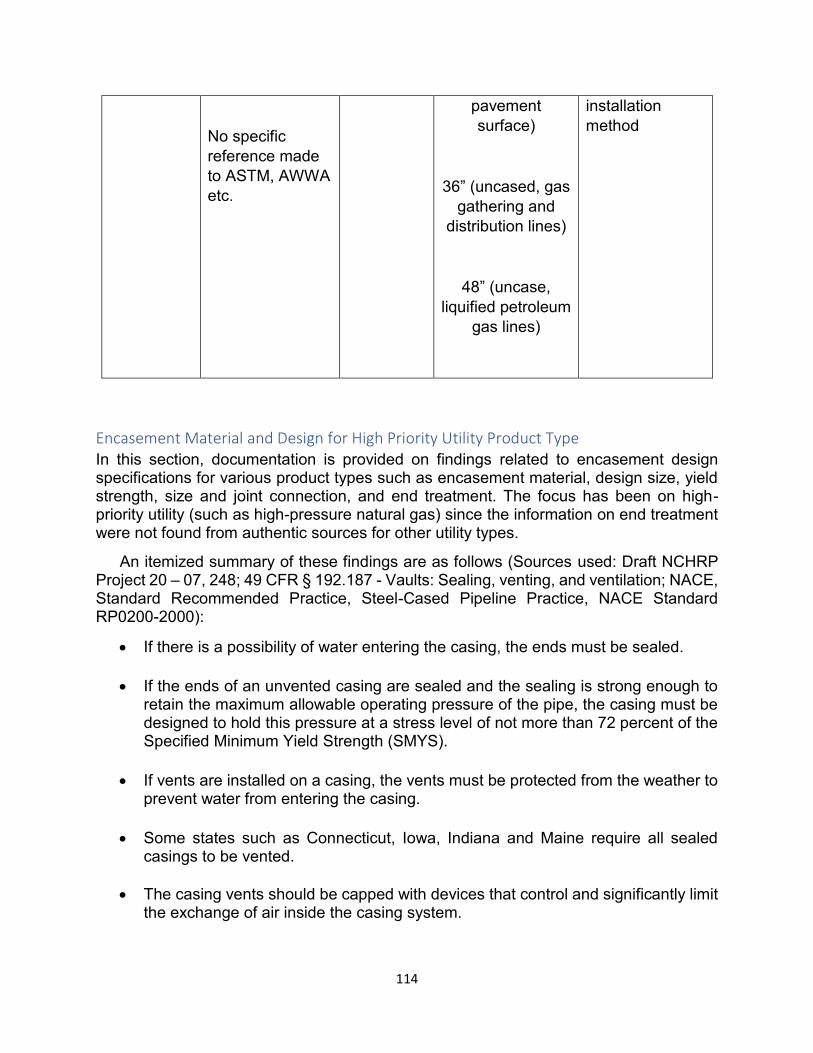
No specific reference made to ASTM, AWWA etc.
pavement surface)
36” (uncased, gas gathering and
distribution lines)
48” (uncase, liquified petroleum
gas lines)
installation method
Encasement Material and Design for High Priority Utility Product Type In this section, documentation is provided on findings related to encasement design specifications for various product types such as encasement material, design size, yield strength, size and joint connection, and end treatment. The focus has been on high-priority utility (such as high-pressure natural gas) since the information on end treatment were not found from authentic sources for other utility types.
An itemized summary of these findings are as follows (Sources used: Draft NCHRP Project 20 – 07, 248; 49 CFR § 192.187 - Vaults: Sealing, venting, and ventilation; NACE, Standard Recommended Practice, Steel-Cased Pipeline Practice, NACE Standard RP0200-2000):
• If there is a possibility of water entering the casing, the ends must be sealed.
• If the ends of an unvented casing are sealed and the sealing is strong enough to retain the maximum allowable operating pressure of the pipe, the casing must be designed to hold this pressure at a stress level of not more than 72 percent of the Specified Minimum Yield Strength (SMYS).
• If vents are installed on a casing, the vents must be protected from the weather to prevent water from entering the casing.
• Some states such as Connecticut, Iowa, Indiana and Maine require all sealed casings to be vented.
• The casing vents should be capped with devices that control and significantly limit the exchange of air inside the casing system.
114
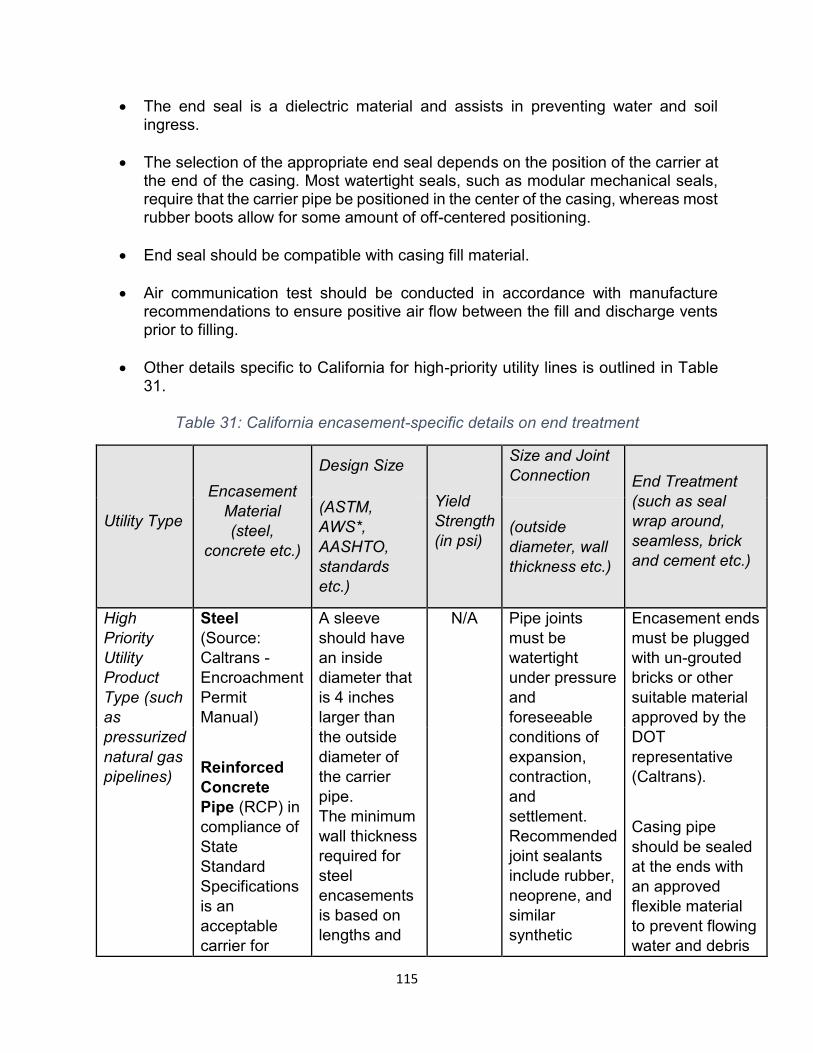
• The end seal is a dielectric material and assists in preventing water and soil ingress.
• The selection of the appropriate end seal depends on the position of the carrier at the end of the casing. Most watertight seals, such as modular mechanical seals, require that the carrier pipe be positioned in the center of the casing, whereas most rubber boots allow for some amount of off-centered positioning.
• End seal should be compatible with casing fill material.
• Air communication test should be conducted in accordance with manufacture recommendations to ensure positive air flow between the fill and discharge vents prior to filling.
• Other details specific to California for high-priority utility lines is outlined in Table 31.
Table 31: California encasement-specific details on end treatment
Encasement Material
Design Size
Yield
Size and Joint Connection End Treatment
(such as seal (ASTM, Utility Type (steel, AWS*, Strength (outside wrap around,
concrete etc.) AASHTO, (in psi) diameter, wall seamless, brick standards thickness etc.) and cement etc.) etc.)
High Steel A sleeve N/A Pipe joints Encasement ends Priority Utility Product Type (such as pressurized natural gas pipelines)
(Source: Caltrans -Encroachment Permit Manual)
Reinforced Concrete Pipe (RCP) in compliance of State Standard Specifications is an acceptable carrier for
should have an inside diameter that is 4 inches larger than the outside diameter of the carrier pipe. The minimum wall thickness required for steel encasements is based on lengths and
must be watertight under pressure and foreseeable conditions of expansion, contraction, and settlement. Recommended joint sealants include rubber, neoprene, and similar synthetic
must be plugged with un-grouted bricks or other suitable material approved by the DOT representative (Caltrans).
Casing pipe should be sealed at the ends with an approved flexible material to prevent flowing water and debris
115
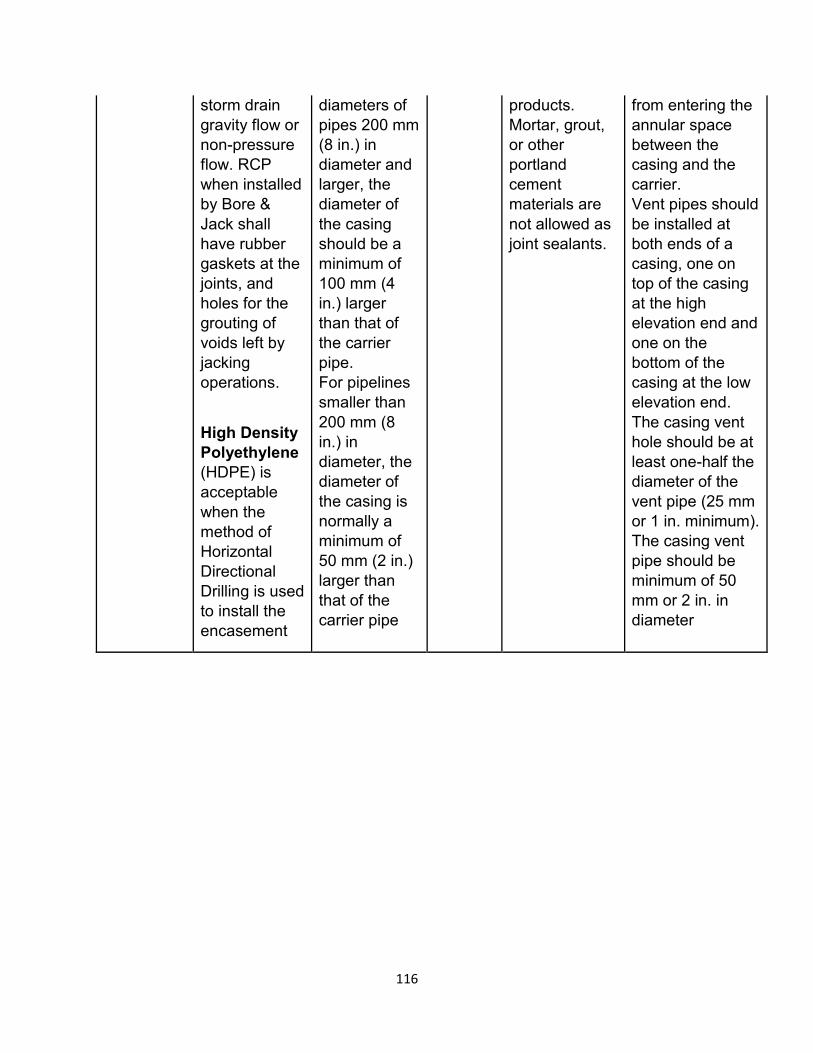
storm drain gravity flow or non-pressure flow. RCP when installed by Bore & Jack shall have rubber gaskets at the joints, and holes for the grouting of voids left by jacking operations.
High Density Polyethylene (HDPE) is acceptable when the method of Horizontal Directional Drilling is used to install the encasement
diameters of pipes 200 mm (8 in.) in diameter and larger, the diameter of the casing should be a minimum of 100 mm (4 in.) larger than that of the carrier pipe. For pipelines smaller than 200 mm (8 in.) in diameter, the diameter of the casing is normally a minimum of 50 mm (2 in.) larger than that of the carrier pipe
products. Mortar, grout, or other portland cement materials are not allowed as joint sealants.
from entering the annular space between the casing and the carrier. Vent pipes should be installed at both ends of a casing, one on top of the casing at the high elevation end and one on the bottom of the casing at the low elevation end. The casing vent hole should be at least one-half the diameter of the vent pipe (25 mm or 1 in. minimum). The casing vent pipe should be minimum of 50 mm or 2 in. in diameter
116
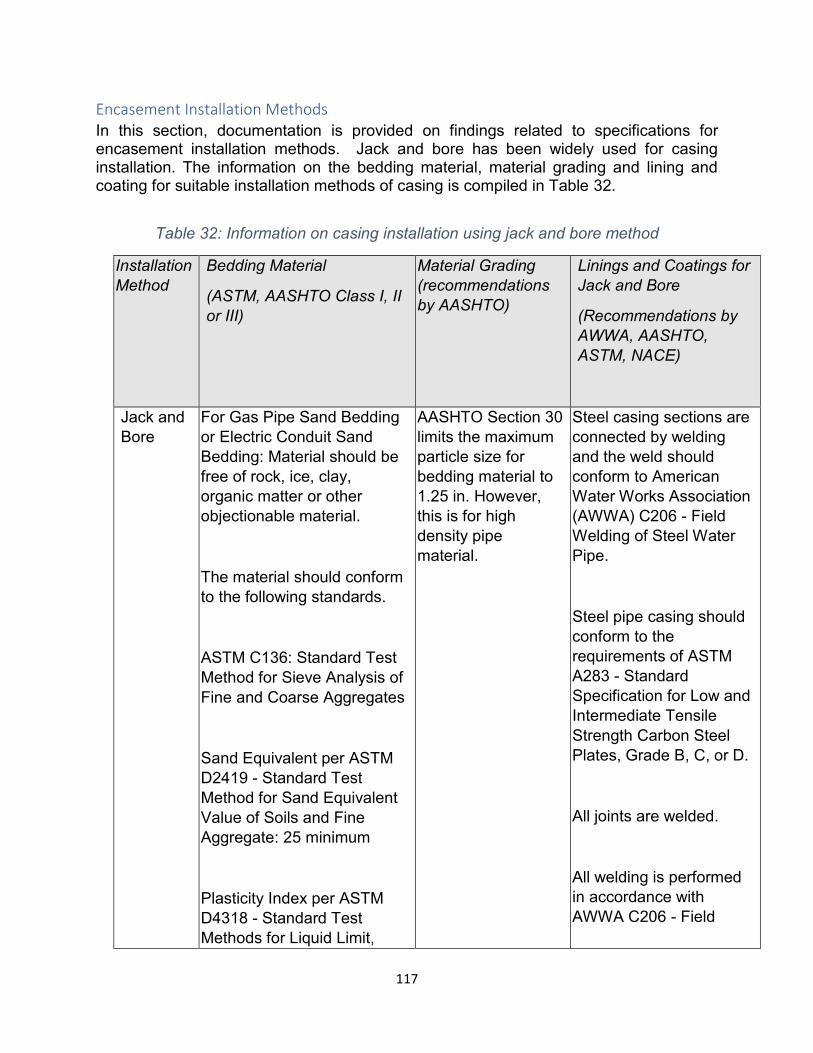
Encasement Installation Methods In this section, documentation is provided on findings related to specifications for encasement installation methods. Jack and bore has been widely used for casing installation. The information on the bedding material, material grading and lining and coating for suitable installation methods of casing is compiled in Table 32.
Table 32: Information on casing installation using jack and bore method
Installation Method
Bedding Material
(ASTM, AASHTO Class I, II or III)
Material Grading (recommendations by AASHTO)
Linings and Coatings for Jack and Bore
(Recommendations by AWWA, AASHTO, ASTM, NACE)
Jack and Bore
For Gas Pipe Sand Bedding or Electric Conduit Sand Bedding: Material should be free of rock, ice, clay, organic matter or other objectionable material.
The material should conform to the following standards.
ASTM C136: Standard Test Method for Sieve Analysis of Fine and Coarse Aggregates
Sand Equivalent per ASTM D2419 - Standard Test Method for Sand Equivalent Value of Soils and Fine Aggregate: 25 minimum
Plasticity Index per ASTM D4318 - Standard Test Methods for Liquid Limit,
AASHTO Section 30 limits the maximum particle size for bedding material to 1.25 in. However, this is for high density pipe material.
Steel casing sections are connected by welding and the weld should conform to American Water Works Association (AWWA) C206 - Field Welding of Steel Water Pipe.
Steel pipe casing should conform to the requirements of ASTM A283 - Standard Specification for Low and Intermediate Tensile Strength Carbon Steel Plates, Grade B, C, or D.
All joints are welded.
All welding is performed in accordance with AWWA C206 - Field
117
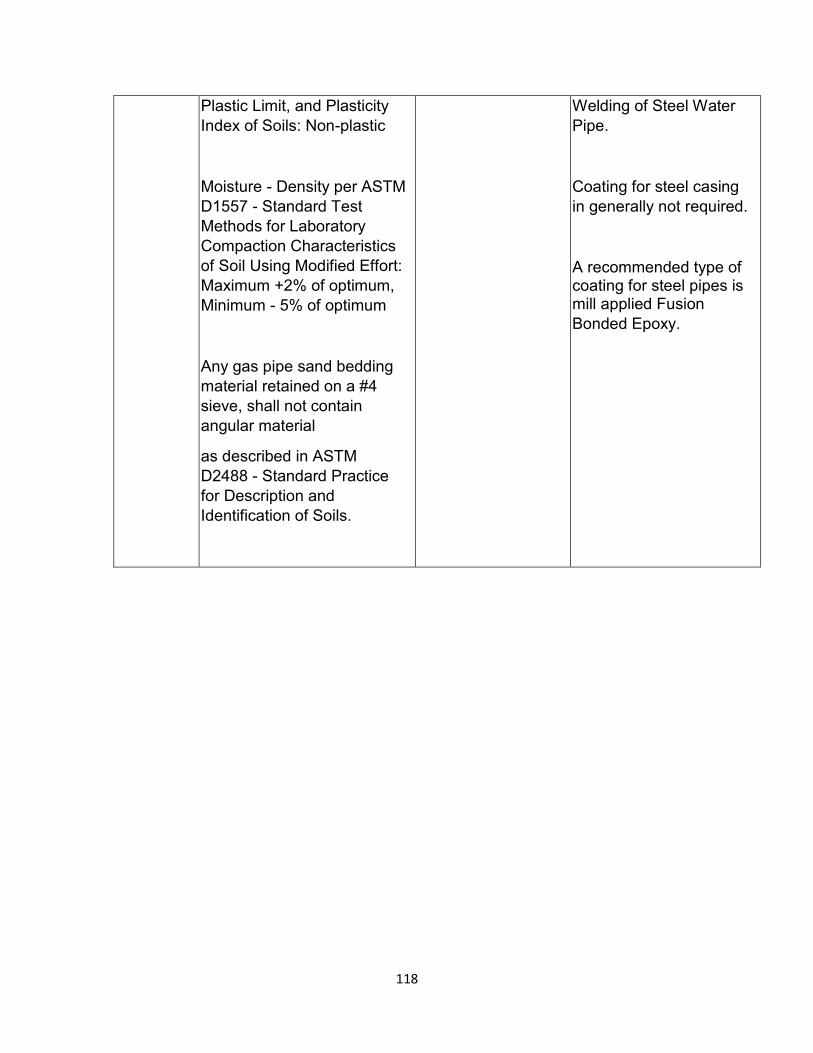
Plastic Limit, and Plasticity Welding of Steel Water Index of Soils: Non-plastic Pipe.
Moisture - Density per ASTM Coating for steel casing D1557 - Standard Test in generally not required. Methods for Laboratory Compaction Characteristics of Soil Using Modified Effort: A recommended type of Maximum +2% of optimum, coating for steel pipes is Minimum - 5% of optimum mill applied Fusion
Bonded Epoxy.
Any gas pipe sand bedding material retained on a #4 sieve, shall not contain angular material
as described in ASTM D2488 - Standard Practice for Description and Identification of Soils.
118
Encasement alternatives, Underground Storage Tank and Leakage Monitoring In this section, documentation is provided on findings related to alternatives to encasement and other related research questions which are as follows:
1. Are there alternatives to encasement that provide the same level or better protection from dig-in accidents?
There are three possible ways in which protection against dig-in/excavation accidents can be provided:
a. Subsurface Utility Engineering (SUE), Quality Level (QL) –D: QL-D can be provided as a forewarning in case a pipeline is encountered during excavation. This information should be provided as the alternative through some sort of sign in case pipeline information wasn’t obtained beforehand. However, this QL –D info should lead to a higher QL for accurate information regarding existing utility design.
b. Concrete Slabs: The guidance is provided in AASHTO 2005 - A Guide for Accommodating Utilities Within Highway Right-of-Way. Designs for concrete slabs depend on location/project. but there are also places that manufacture the slabs as well (often referred to as utility and pipe protection slabs, see Fig. 1).
119
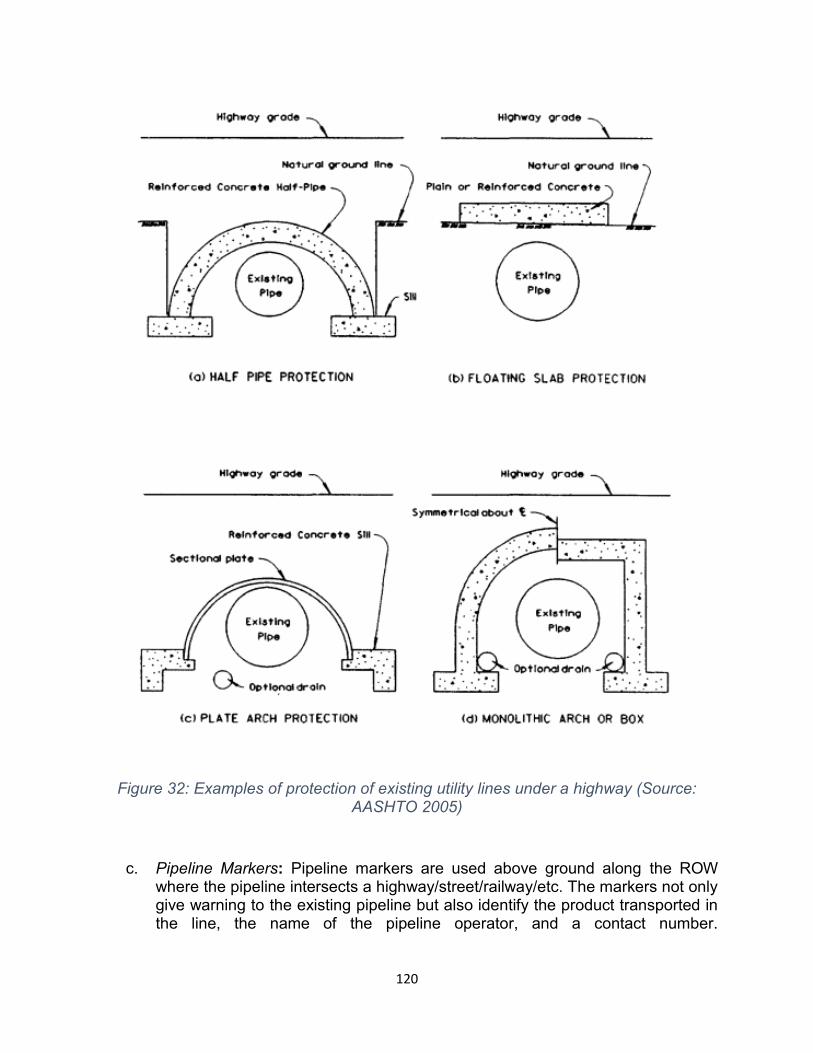
Figure 32: Examples of protection of existing utility lines under a highway (Source: AASHTO 2005)
c. Pipeline Markers: Pipeline markers are used above ground along the ROW where the pipeline intersects a highway/street/railway/etc. The markers not only give warning to the existing pipeline but also identify the product transported in the line, the name of the pipeline operator, and a contact number.
120
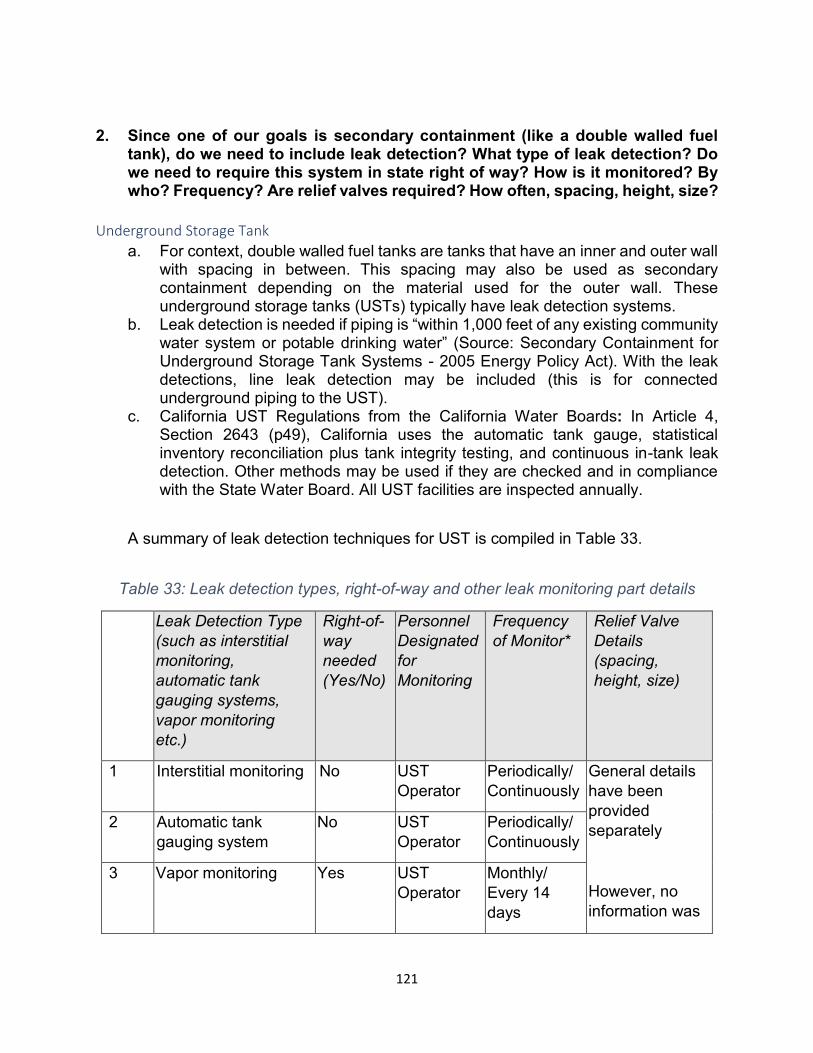
2. Since one of our goals is secondary containment (like a double walled fuel tank), do we need to include leak detection? What type of leak detection? Do we need to require this system in state right of way? How is it monitored? By who? Frequency? Are relief valves required? How often, spacing, height, size?
Underground Storage Tank
a. For context, double walled fuel tanks are tanks that have an inner and outer wall with spacing in between. This spacing may also be used as secondary containment depending on the material used for the outer wall. These underground storage tanks (USTs) typically have leak detection systems.
b. Leak detection is needed if piping is “within 1,000 feet of any existing community water system or potable drinking water” (Source: Secondary Containment for Underground Storage Tank Systems - 2005 Energy Policy Act). With the leak detections, line leak detection may be included (this is for connected underground piping to the UST).
c. California UST Regulations from the California Water Boards: In Article 4, Section 2643 (p49), California uses the automatic tank gauge, statistical inventory reconciliation plus tank integrity testing, and continuous in-tank leak detection. Other methods may be used if they are checked and in compliance with the State Water Board. All UST facilities are inspected annually.
A summary of leak detection techniques for UST is compiled in Table 33.
Table 33: Leak detection types, right-of-way and other leak monitoring part details
Leak Detection Type Right-of- Personnel Frequency Relief Valve (such as interstitial way Designated of Monitor* Details monitoring, needed for (spacing, automatic tank (Yes/No) Monitoring height, size) gauging systems, vapor monitoring etc.)
1 Interstitial monitoring No UST Periodically/ General details Operator Continuously have been
provided separately
However, no information was
2 Automatic tank gauging system
No UST Operator
Periodically/ Continuously
3 Vapor monitoring Yes UST Operator
Monthly/ Every 14 days
121
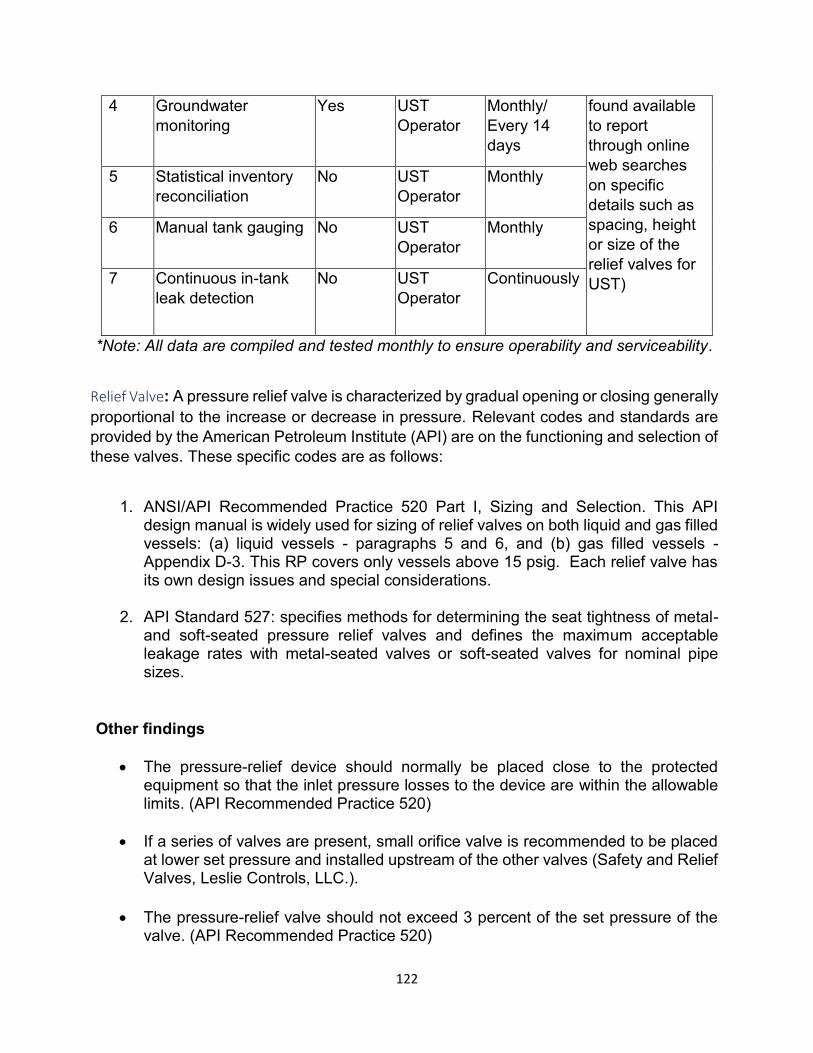
4 Groundwater monitoring
Yes UST Operator
Monthly/ Every 14 days
found available to report through online web searches on specific details such as spacing, height or size of the relief valves for UST)
5 Statistical inventory reconciliation
No UST Operator
Monthly
6 Manual tank gauging No UST Operator
Monthly
7 Continuous in-tank leak detection
No UST Operator
Continuously
*Note: All data are compiled and tested monthly to ensure operability and serviceability.
Relief Valve: A pressure relief valve is characterized by gradual opening or closing generally proportional to the increase or decrease in pressure. Relevant codes and standards are provided by the American Petroleum Institute (API) are on the functioning and selection of these valves. These specific codes are as follows:
1. ANSI/API Recommended Practice 520 Part I, Sizing and Selection. This API design manual is widely used for sizing of relief valves on both liquid and gas filled vessels: (a) liquid vessels - paragraphs 5 and 6, and (b) gas filled vessels -Appendix D-3. This RP covers only vessels above 15 psig. Each relief valve has its own design issues and special considerations.
2. API Standard 527: specifies methods for determining the seat tightness of metal-and soft-seated pressure relief valves and defines the maximum acceptable leakage rates with metal-seated valves or soft-seated valves for nominal pipe sizes.
Other findings
• The pressure-relief device should normally be placed close to the protected equipment so that the inlet pressure losses to the device are within the allowable limits. (API Recommended Practice 520)
• If a series of valves are present, small orifice valve is recommended to be placed at lower set pressure and installed upstream of the other valves (Safety and Relief Valves, Leslie Controls, LLC.).
• The pressure-relief valve should not exceed 3 percent of the set pressure of the valve. (API Recommended Practice 520)
122
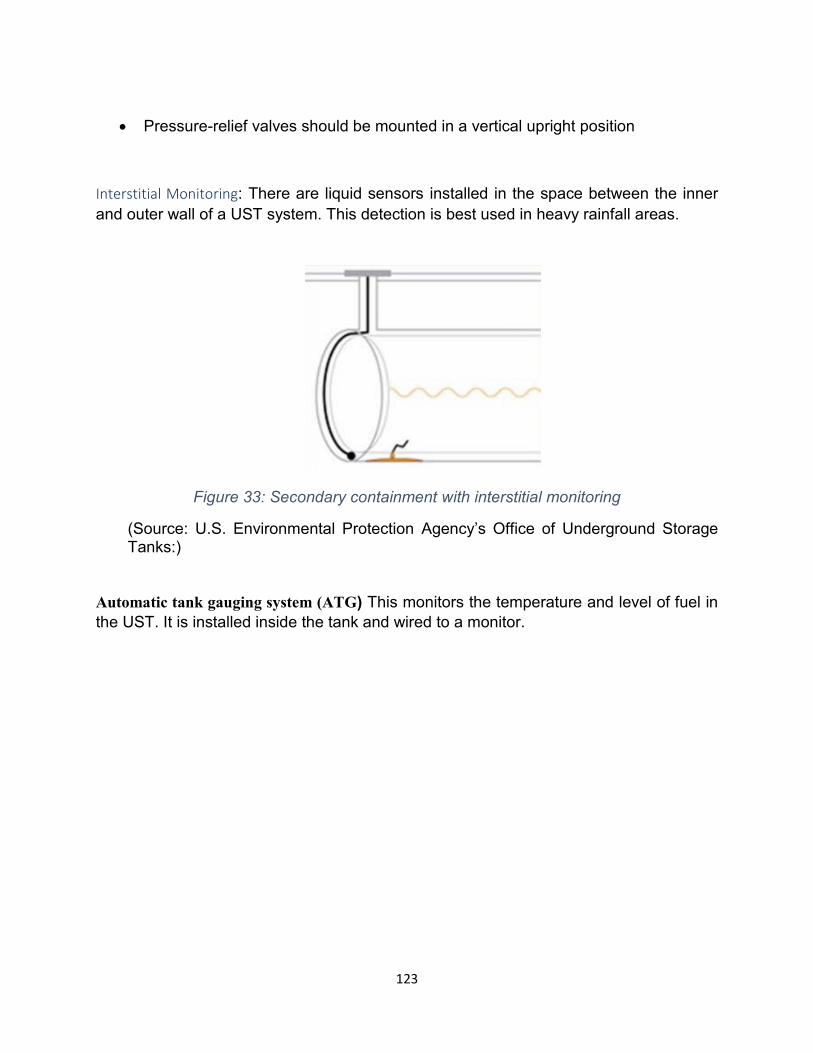
• Pressure-relief valves should be mounted in a vertical upright position
Interstitial Monitoring: There are liquid sensors installed in the space between the inner and outer wall of a UST system. This detection is best used in heavy rainfall areas.
Figure 33: Secondary containment with interstitial monitoring
(Source: U.S. Environmental Protection Agency’s Office of Underground Storage Tanks:)
Automatic tank gauging system (ATG) This monitors the temperature and level of fuel in the UST. It is installed inside the tank and wired to a monitor.
123
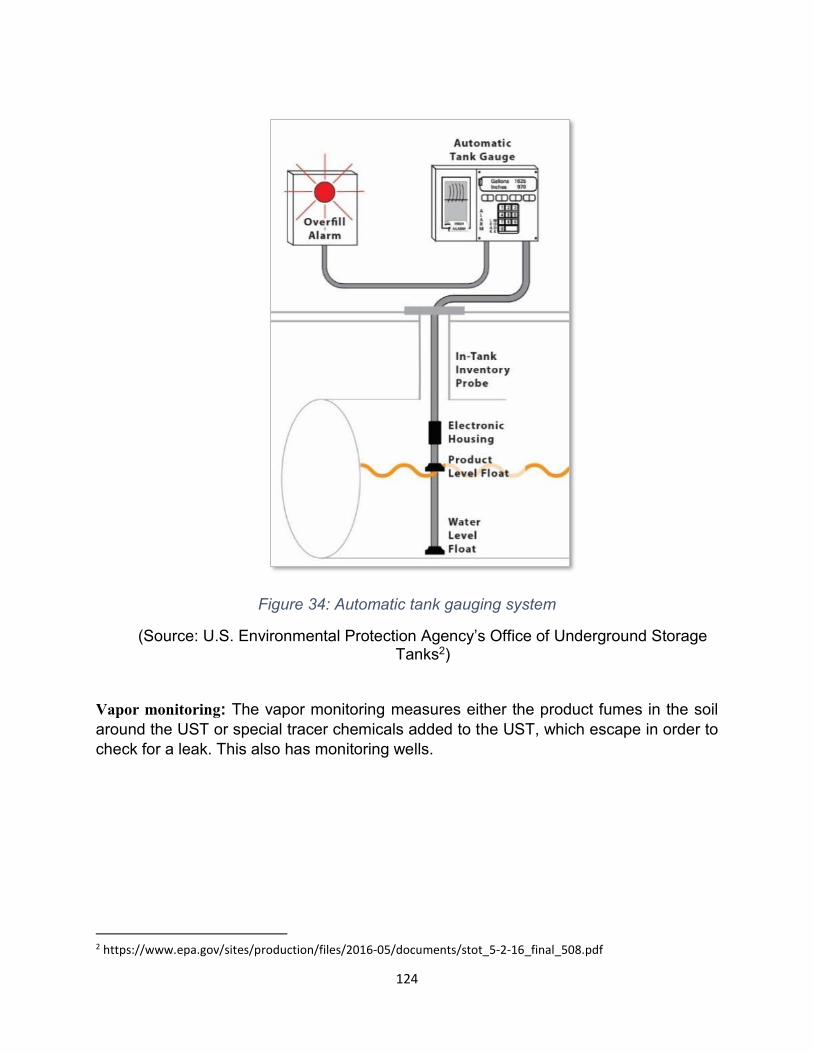
Figure 34: Automatic tank gauging system
(Source: U.S. Environmental Protection Agency’s Office of Underground Storage Tanks2)
Vapor monitoring: The vapor monitoring measures either the product fumes in the soil around the UST or special tracer chemicals added to the UST, which escape in order to check for a leak. This also has monitoring wells.
2 https://www.epa.gov/sites/production/files/2016-05/documents/stot_5-2-16_final_508.pdf
124
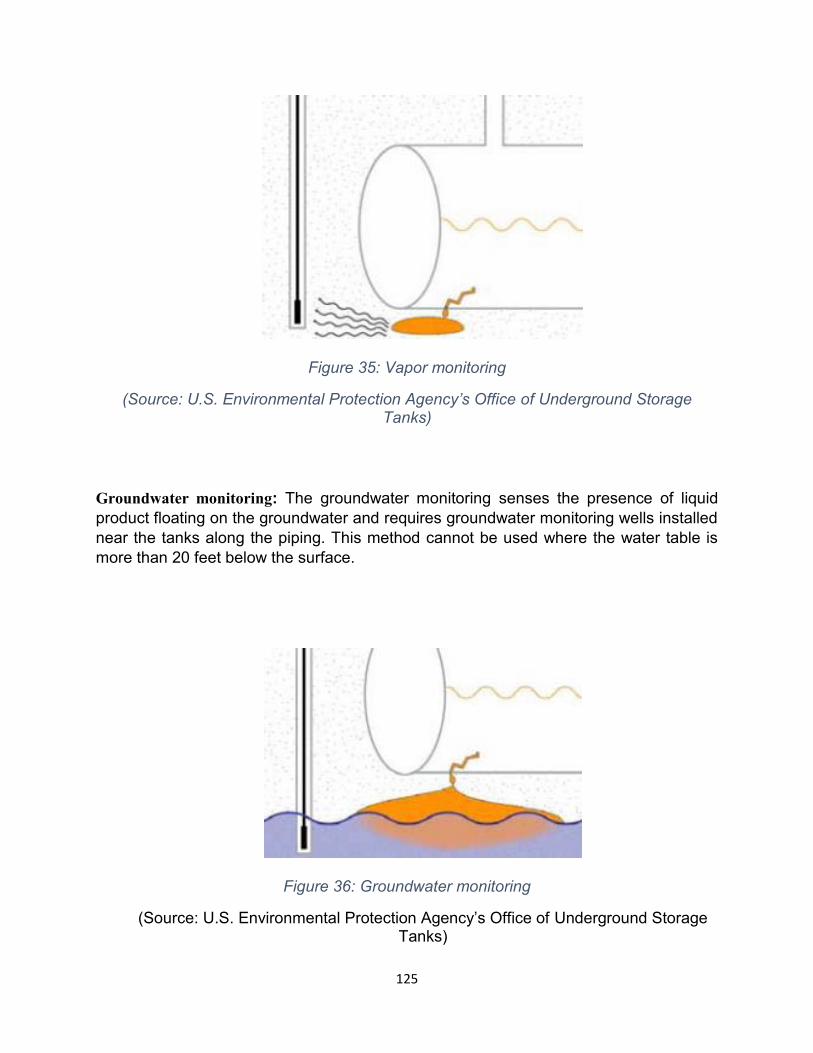
Figure 35: Vapor monitoring
(Source: U.S. Environmental Protection Agency’s Office of Underground Storage Tanks)
Groundwater monitoring: The groundwater monitoring senses the presence of liquid product floating on the groundwater and requires groundwater monitoring wells installed near the tanks along the piping. This method cannot be used where the water table is more than 20 feet below the surface.
Figure 36: Groundwater monitoring
(Source: U.S. Environmental Protection Agency’s Office of Underground Storage Tanks)
125
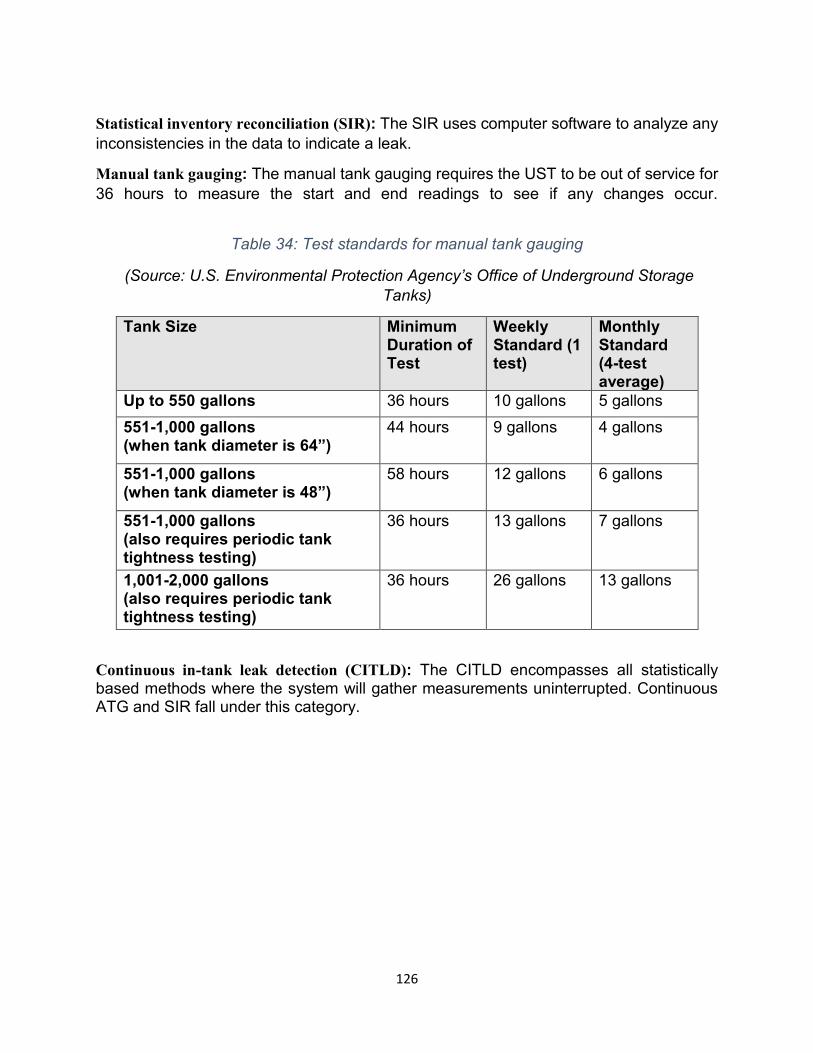
Statistical inventory reconciliation (SIR): The SIR uses computer software to analyze any inconsistencies in the data to indicate a leak.
Manual tank gauging: The manual tank gauging requires the UST to be out of service for 36 hours to measure the start and end readings to see if any changes occur.
Table 34: Test standards for manual tank gauging
(Source: U.S. Environmental Protection Agency’s Office of Underground Storage Tanks)
Tank Size Minimum Duration of Test
Weekly Standard (1 test)
Monthly Standard (4-test average)
Up to 550 gallons 36 hours 10 gallons 5 gallons 551-1,000 gallons (when tank diameter is 64”)
44 hours 9 gallons 4 gallons
551-1,000 gallons (when tank diameter is 48”)
58 hours 12 gallons 6 gallons
551-1,000 gallons (also requires periodic tank tightness testing)
36 hours 13 gallons 7 gallons
1,001-2,000 gallons (also requires periodic tank tightness testing)
36 hours 26 gallons 13 gallons
Continuous in-tank leak detection (CITLD): The CITLD encompasses all statistically based methods where the system will gather measurements uninterrupted. Continuous ATG and SIR fall under this category.
126
7. CONCLUDING REMARKS Casing is normally provided for pipes at crossings (roadway, railroad, or water) to avert any accidents due to excavation damages and to support surface loads due to traffic. An analysis of a ‘cased’ versus an ‘uncased’ gas transmission pipeline leakage from 2010 to 2018 across the United States showed that majority of the leaks were due to excavation damage to pipes that were uncased, and these damages were done outside the highway right of way. In some situations, leakages resulted from the damage to the pipe that was done originally during their installation process and was not noticed before encasing. Excavation accidents with pipes also occurred due to lack of information of an existing pipeline or not using one-call request before the excavation activity. Based on the observation from the available data, having an encased pipeline would have prevented damage to pipelines or reduced severity of the incidents during excavation accidents.
Several studies show that the path taken by the natural gas to migrate to the soil surface after leakage is complex – especially, if the soil has a high clay texture content. In California, several pipeline leakages have been noted in the past from regions where clay is a predominant soil type. External corrosion has also been widely reported to be the cause of these pipeline leakages in California – often during installation of the pipe. Current technologies exist that can detect underground leakages, however, detection of source of these leakages through a ruptured point on a pipe is often difficult and involves digging, removal of the encasement and sometimes even complete abandoning of the leaking pipe. This is usually done to expedite the replacement of the pipe, restore gas transportation, and save costs. There was an leakage incident reported in Texas by an operator in which a leaking pipe was completely abandoned due to difficulty in accessing buried pipe underneath a pavement.
Trenchless technologies such as pipe bursting has been one of the preferred methods for utility pipe replacements at roadway crossings. Trenchless technologies, in general, are commonly used for replacing natural gas pipelines greater than 6 inches in diameter, pipelines with operating pressures greater than 60 psig, petroleum pipelines, pressurized sanitary sewer pipelines, high-voltage electric supply lines, conductors, or cables that have a potential to ground of greater than or equal to 60 kV and hazardous materials pipelines that are potentially harmful to workers or the public if damaged.
With the goal to avoid accidents with utility lines during excavation or construction activities in the highway right-of-way, many states such as Alaska, Utah and Virginia use procedures right in the beginning of any construction activity to identify and resolve utility conflicts. A recent pilot exercise was carried out for the dentification of utility conflicts and solutions under the SHRP 2 R15B Products at the Maryland State Highway Administration (SHRP 2 R15B, 2015). This was being achieved by using a much accurate and complete information about utilities that might conflict with the alignment of the project. One of the most popular tools explored under the pilot program was the use of a utility conflict matrix (UTM) which enables users to organize, track, and manage the conflicts.
127

Federal Highway Administration (FHWA) encourages implementation of strategies at various stages of the development of a highway project to avoid utility relocations (Avoiding Utility Relocations, FHWA 2019). These consist of the following:
I. Planning Strategies (such as forming Utility Coordinating Councils, One-Call Notification, detailed utility information using Subsurface Utility Engineering (SUE), utility agreements, electronic document delivery, cost sharing, joint project agreements, context sensitive design, locate next to ROW line, joint trenching / utility corridors, utility tunnels, use of subways for dry lines, and removal of abandoned lines)
II. Design Strategies and Alternatives (SUE - Quality of Level B) III. Geometric and Alignment Changes - Geometric and alignment changes for
roadway can be done at the planning stage or very early in the design stage IV. Drainage Changes as per the geometry of the roadway V. Structural Changes, and VI. Slopes / Retaining Walls / Barriers
Future research could investigate the success of one or more of the above listed strategies adopted by various State DOTs across the nation. Particularly, identifying those strategies that are cost effective, accepted as state-of-the-practice by utility operators and could eventually reduce accidents associated with pipelines in the state highway right-of-way in California.
128
REFERENCES
1. ALDOT Utilities Manual, Alabama Department of Transportation, accessed on June 12, 2018. https://www.dot.state.al.us/rwweb/util/ALDOTDesignUtman.pdf
2. Avoiding Utility Relocations, FHWA, accessed on March 30, 2019. https://www.fhwa.dot.gov/utilities/utilityrelo/5.cfm
3. Beusse, R., Good, K., Hauck, E. and Jones, R., 2014. Improvements Needed in EPA Efforts to Address Methane Emissions from Natural Gas Distribution Pipelines (No. 14-P-0324).
4. California Soil Resource Lab at UC Davis and the USDA Natural Resources Conservation Service, accessed on July 1, 2018. https://casoilresource.lawr.ucdavis.edu/ca-soil-properties/
5. CFR 192.5, accessed on July 31, 2018. https://www.gpo.gov/fdsys/pkg/CFR-2011-title49-vol3/pdf/CFR-2011-title49-vol3-part192.pdf
6. Chapter 4 Reducing Pavement Cuts by Integrating Technology, Manual for Controlling and Reducing the Frequency of Pavement Utility Cuts, FHWA, accessed on December 5, 2018. https://www.fhwa.dot.gov/utilities/utilitycuts/man04.cfm
7. CHAPTER 16, TRENCHLESS TECHNOLOGY, ODOT, https://www.oregon.gov/ODOT/GeoEnvironmental/Docs_Hydraulics_Manual/Hyd raulics-16.pdf
8. Chapter 600 Utilities Permits, Encroachment Permits Manual, Caltrans, accessed on June 15, 2018. http://www.dot.ca.gov/trafficops/ep/docs/Chapter_6.pdf
9. Costanza‐Robinson, M.S. and Brusseau, M.L., 2002. Gas phase advection and dispersion in unsaturated porous media. Water Resources Research, 38(4), pp.7-1.
10.Cured-in-Place Pipe-Lining (CIPP), City of Portland, accessed on May 19, 2019. https://www.portlandoregon.gov/bes/article/467513
11.Data and Statistics, Pipeline and Hazardous Materials Safety Administration, USDOT, accessed on December 2, 2018. https://www.phmsa.dot.gov/data-and-statistics/pipeline/data-and-statistics-overview
12.Deepagoda, T.C., Smits, K.M. and Oldenburg, C.M., 2016. Effect of subsurface soil moisture variability and atmospheric conditions on methane gas migration in shallow subsurface. International Journal of Greenhouse Gas Control, 55, pp.105-117.
13.Encasement of Pipelines Through Highway Roadbeds, Synopsis of Final Report for NCHRP Project 20-7, Task 22, 1983.
14.Encasement Requirements, Chapter 151. Land Use Permit Regulations, Virginia Administrative Code Title 24, accessed on June 1, 2018. https://law.lis.virginia.gov/admincode/title24/agency30/chapter151/section370/
15. Ezeokonkwo, J.C. and Nwoji, C.U., 2014. Review of Trenchless Technologies’ Successes and their Dependence on Precise Geotechnical Investigation. Nigerian Journal of Technology, 33(3), pp.275-292.
129
16.Felice, M., de Sieyes, N., Peng, J., Schmidt, R., Buelow, M., Jourabchi, P., Scow, K. and Mackay, D., 2018. Methane transport during a controlled release in the vadose zone. Vadose Zone Journal, 17(1).
17. “Gas Explosion,” Daily Herald, (Cleveland, Ohio), March 15, 1860, Gale NewsVault Nineteenth Century U.S. Newspapers [Wikipedia, 2019]
18.Galloup, Pipe and Tube, accessed on March 6, 2019. https://shop.galloup.com/buy/product/D-8-SCH-40-A106-BLK-SMLS-PIPE-SRL/2997412?ID=/Black-Seamless-Pipe/dept-30T
19.GUIDELINES AND SPECIFICATIONS FOR TRENCHLESS TECHNOLOGY PROJECTS, ENCROACHMENT PERMITS, CALTRANS, accessed on March 6, 2019.
20.Hibi, Y., Fujinawa, K., Nishizaki, S., Okamura, K. and Tasaki, M., 2009. Multi-component migration in the gas phase of soil: comparison between results of experiments and simulation by dusty gas model. Soils and Foundations, 49(4), pp.569-581.
21.History of Gas and Oil Pipelines, Pipeline Knowledge & Development, 2011, accessed on November 2, 2018. http://pipelineknowledge.com/files/images/presentations/history_of_gas_and_oil_ pipelines.pdf
22.Ho, C.K. and Webb, S.W. eds., 2006. Gas transport in porous media (Vol. 20). Springer Science & Business Media.
23. Interpretation Response #PI-75-036, Office of Pipeline Safety Operations, Federal Highway Administration. Accessed on June 14, 2018. https://www.phmsa.dot.gov/regulations/title49/interp/PI-75-036
24. Iowa Administrative Code, Utilities and Transportation Divisions, accessed on June 2, 2018. https://www.legis.iowa.gov/docs/iac/chapter/06-06-2018.199.42.pdf
25. IPR INFORMATION PACKET, accessed on December 12, 2018. http://teamipr.com/wp-content/uploads/2019/01/IPR-Information-Packet_-Updated-Dec-2018.pdf
26.Jackson, R.B., Down, A., Phillips, N.G., Ackley, R.C., Cook, C.W., Plata, D.L. and Zhao, K., 2014. Natural gas pipeline leaks across Washington, DC. Environmental science & technology, 48(3), pp. 2051-2058.
27.Lateral Thinking for Innovative Sewer Replacement using Pipe Eating Technique, Groundforce, accessed on March 6, 2019. https://www.vpgroundforce.com/gb/media-hub/articles/news/lateral-thinking-for-innovative-sewer-replacement/
28.Lindly, J. K., Graettinger, A., Johnson, P., Sherer, M. M., & Johnson, M. K. (2015). Natural Gas Encasement for Highway Crossings (No. UTCA Report Number 12401). University Transportation Center for Alabama.
29.Lindly, J. (2013). Highway Crossing Pipeline Encasement in Alabama, Department of Civil, Construction and Environmental Engineering, 2013 AASHTO Subcommittee on Right of Way, Utilities & Outdoor Advertising Controls Conference.
30.Lygo, N. (2018). A Brief History of Pipe Materials, Envirosight, accessed on November 3, 2018. http://blog.envirosight.com/a-brief-history-of-pipe-materials
130
31.Metal Supermarkets, accessed on February 2, 2019. https://www.metalsupermarkets.com/what-do-pipe-schedules-mean/
32.Murvay, P.S. and Silea, I., 2012. A survey on gas leak detection and localization techniques. Journal of Loss Prevention in the Process Industries, 25(6), pp.966-973.
33.Okamoto, H. and Gomi, Y., 2011. Empirical research on diffusion behavior of leaked gas in the ground. Journal of Loss Prevention in the Process Industries, 24(5), pp.531-540.
34.Pipeline Incident 20 Year Trends, Pipeline and Hazardous Materials Safety Administration, accessed on August 1, 2018. https://www.phmsa.dot.gov/data-and-statistics/pipeline/pipeline-incident-20-year-trends
35.Policy for Accommodating Utilities on the County and City Non-Primary Federal-Aid Road System, Office of Local Systems, Iowa Department of Transportation, accessed on June 2, 2018. https://iowadot.gov/local_systems/publications/lpa_utility_policy.pdf
36.Poulsen, T.G., Christophersen, M., Moldrup, P. and Kjeldsen, P., 2003. Relating landfill gas emissions to atmospheric pressure using numerical modelling and state-space analysis. Waste management & research, 21(4), pp.356-366.
37.Quiroga, C., Kraus, E., Le, J., Scott, P., Anspach, J., Swafford, T. and Meis, P., 2015. Identification of Utility Conflicts and Solutions: Pilot Implementation of the SHRP 2 R15B Products at the Maryland State Highway Administration (No. SHRP 2 Renewal Project R15C).
38.Secondary Containment for Underground Storage Tank Systems - 2005 Energy Policy Act.
39.Stein, D., 2001. Rehabilitation and Maintenance of Drains and Sewers. Faculty of civil Engineering. Germany, 804.
40.SUBCHAPTER C. UTILITY ACCOMMODATION, Texas Administrative Code, accessed on June 2, 2018. http://txrules.elaws.us/rule/title43_chapter21_subchapterc
41.Texas Gas Association, accessed on July 2, 2018. http://www.texasgas.com/wp-content/uploads/2015/04/Microsoft-PowerPoint-LEAK-SURVEY-PRESENTATION-Compatibility-Mode.pdf
42.The International Society for Trenchless Technology (ISTT), accessed on November 2018. http://www.istt.com/inc/data/downloads/guidelines.pdf
43.Title 49 – Transportation, CFR 192.327 Cover, https://www.gpo.gov/fdsys/pkg/CFR-2011-title49-vol3/xml/CFR-2011-title49-vol3-part192.xml#seqnum192.317
44.Trenchlessmedia – Trenchless Solutions through Education, accessed on December 13, 2018.
45.Yan, Y., Dong, X. and Li, J., 2015. Experimental study of methane diffusion in soil for an underground gas pipe leak. Journal of Natural Gas Science and Engineering, 27, pp.82-89.
46.Wylie, R. (2018). A Brief History of Natural Gas, Eniday, accessed on November 3, 2018. https://www.eniday.com/en/education_en/history-natural-gas/
47.1984 – 2018 Fatality and Catastrophe Investigation Summaries, Occupational Safety and Health Administration (OSHA), United States Department of Labor,
131
accessed on January 12, 2019. https://www.osha.gov/pls/imis/accidentsearch.html
48.49 CFR 192.323 – CASING, US Government Publishing Office, accessed on June 14, 2018. https://www.gpo.gov/fdsys/pkg/CFR-2010-title49-vol3/pdf/CFR-2010-title49-vol3-sec192-323.pdf
49.643.3 Policy, Standards and Regulations, Engineering Policy Guide, MODOT, accessed on June 1, 2018. http://epg.modot.mo.gov/index.php?title=643.3_Policy,_Standards_and_Regulati ons
50.49 CFR 192, accessed on August 10, 2018. https://www.gpo.gov/fdsys/granule/CFR-2011-title49-vol3/CFR-2011-title49-vol3-part192
51.49 CFR 192 - TRANSPORTATION OF NATURAL AND OTHER GAS BY PIPELINE: MINIMUM FEDERAL SAFETY STANDARDS
52.195.248 Cover over buried pipeline, PART 195—TRANSPORTATION OF HAZARDOUS LIQUIDS BY PIPELINE, accessed on August 1, 2018. https://www.ecfr.gov/cgi-bin/retrieveECFR?gp=&SID=bffe780fc3de7c676c368b253e1102c1&mc=true&n= pt49.3.195&r=PART&ty=HTML#se49.3.195_1248
132
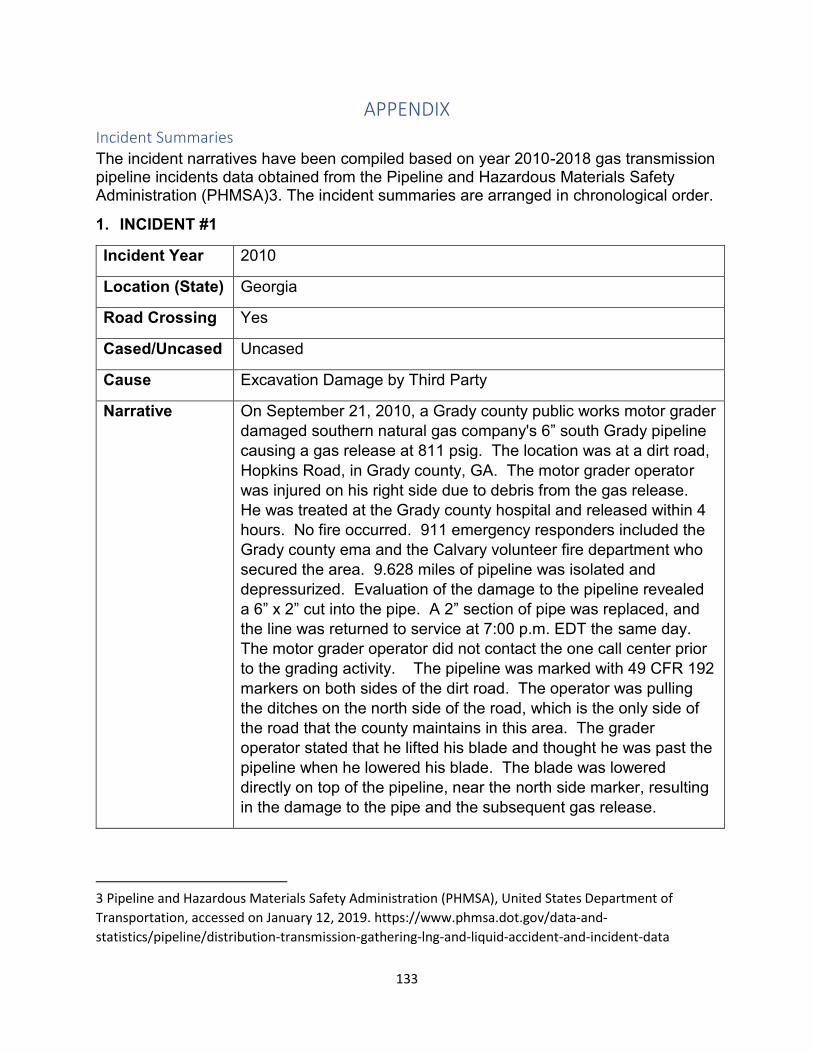
APPENDIX
Incident Summaries The incident narratives have been compiled based on year 2010-2018 gas transmission pipeline incidents data obtained from the Pipeline and Hazardous Materials Safety Administration (PHMSA)3. The incident summaries are arranged in chronological order.
1. INCIDENT #1
Incident Year 2010
Location (State) Georgia
Road Crossing Yes
Cased/Uncased Uncased
Cause Excavation Damage by Third Party
Narrative On September 21, 2010, a Grady county public works motor grader damaged southern natural gas company's 6” south Grady pipeline causing a gas release at 811 psig. The location was at a dirt road, Hopkins Road, in Grady county, GA. The motor grader operator was injured on his right side due to debris from the gas release. He was treated at the Grady county hospital and released within 4 hours. No fire occurred. 911 emergency responders included the Grady county ema and the Calvary volunteer fire department who secured the area. 9.628 miles of pipeline was isolated and depressurized. Evaluation of the damage to the pipeline revealed a 6” x 2” cut into the pipe. A 2” section of pipe was replaced, and the line was returned to service at 7:00 p.m. EDT the same day. The motor grader operator did not contact the one call center prior to the grading activity. The pipeline was marked with 49 CFR 192 markers on both sides of the dirt road. The operator was pulling the ditches on the north side of the road, which is the only side of the road that the county maintains in this area. The grader operator stated that he lifted his blade and thought he was past the pipeline when he lowered his blade. The blade was lowered directly on top of the pipeline, near the north side marker, resulting in the damage to the pipe and the subsequent gas release.
3 Pipeline and Hazardous Materials Safety Administration (PHMSA), United States Department of
Transportation, accessed on January 12, 2019. https://www.phmsa.dot.gov/data-and-
statistics/pipeline/distribution-transmission-gathering-lng-and-liquid-accident-and-incident-data
133
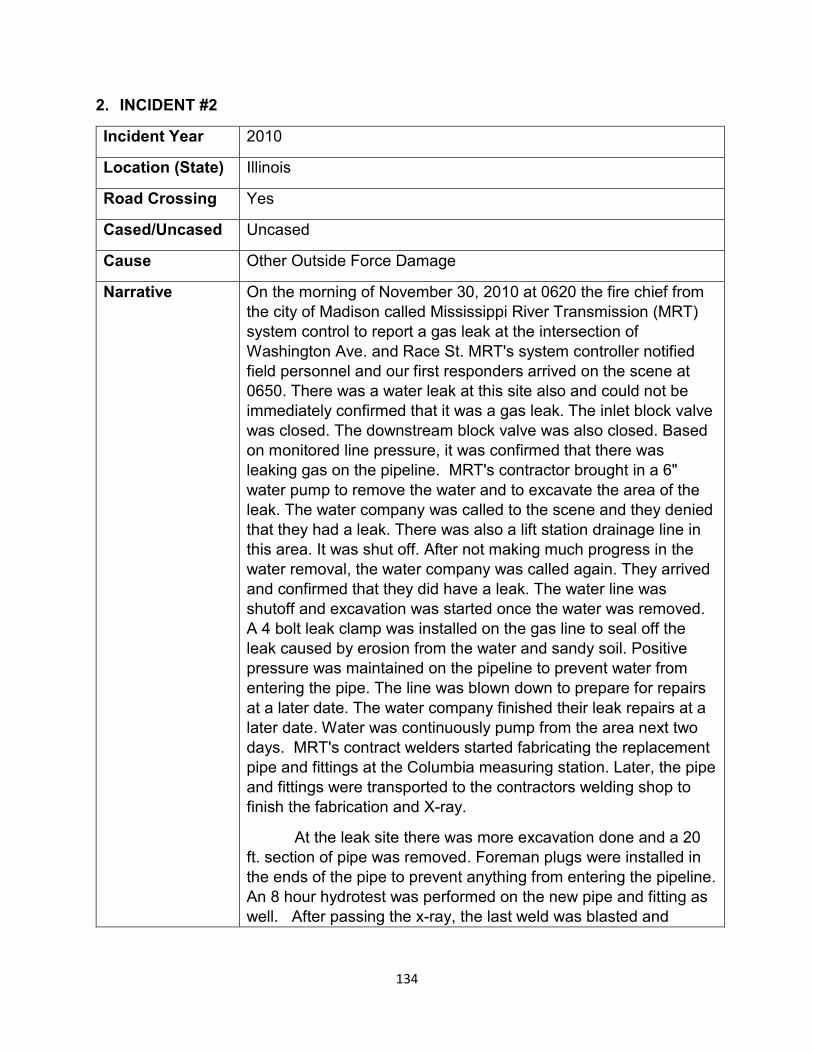
2. INCIDENT #2
Incident Year 2010
Location (State) Illinois
Road Crossing Yes
Cased/Uncased Uncased
Cause Other Outside Force Damage
Narrative On the morning of November 30, 2010 at 0620 the fire chief from the city of Madison called Mississippi River Transmission (MRT) system control to report a gas leak at the intersection of Washington Ave. and Race St. MRT's system controller notified field personnel and our first responders arrived on the scene at 0650. There was a water leak at this site also and could not be immediately confirmed that it was a gas leak. The inlet block valve was closed. The downstream block valve was also closed. Based on monitored line pressure, it was confirmed that there was leaking gas on the pipeline. MRT's contractor brought in a 6" water pump to remove the water and to excavate the area of the leak. The water company was called to the scene and they denied that they had a leak. There was also a lift station drainage line in this area. It was shut off. After not making much progress in the water removal, the water company was called again. They arrived and confirmed that they did have a leak. The water line was shutoff and excavation was started once the water was removed. A 4 bolt leak clamp was installed on the gas line to seal off the leak caused by erosion from the water and sandy soil. Positive pressure was maintained on the pipeline to prevent water from entering the pipe. The line was blown down to prepare for repairs at a later date. The water company finished their leak repairs at a later date. Water was continuously pump from the area next two days. MRT's contract welders started fabricating the replacement pipe and fittings at the Columbia measuring station. Later, the pipe and fittings were transported to the contractors welding shop to finish the fabrication and X-ray.
At the leak site there was more excavation done and a 20 ft. section of pipe was removed. Foreman plugs were installed in the ends of the pipe to prevent anything from entering the pipeline. An 8 hour hydrotest was performed on the new pipe and fitting as well. After passing the x-ray, the last weld was blasted and
134
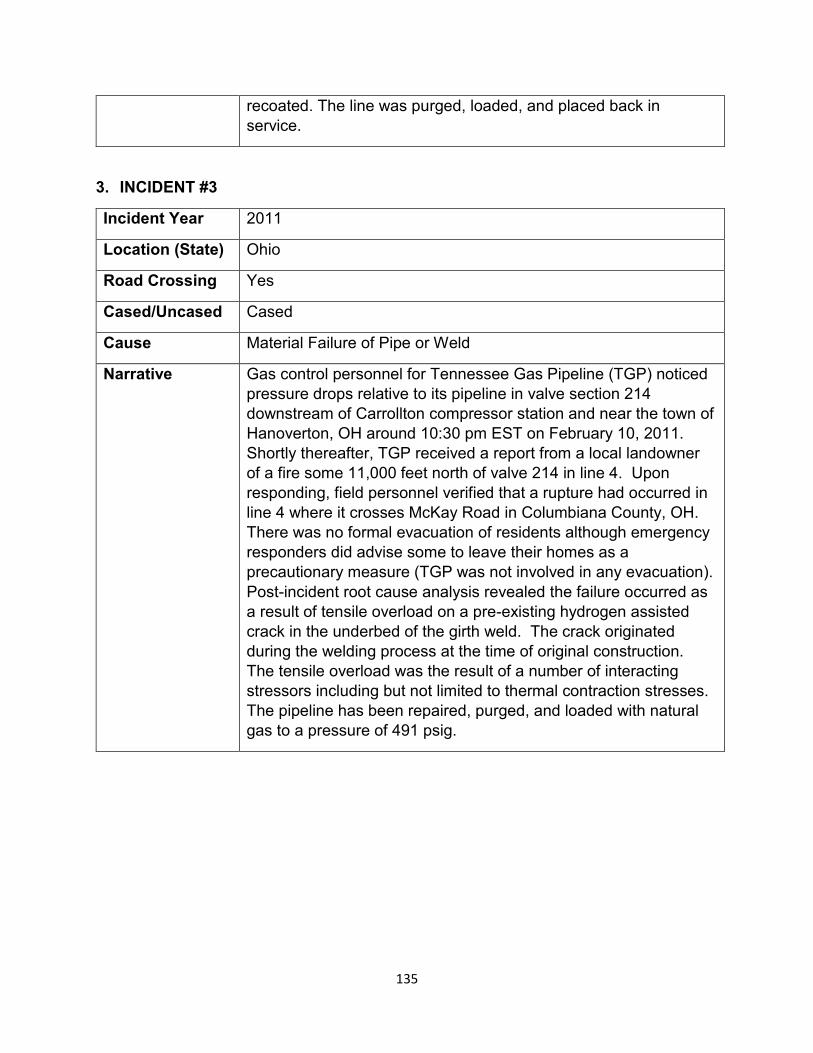
recoated. The line was purged, loaded, and placed back in service.
3. INCIDENT #3
Incident Year 2011
Location (State) Ohio
Road Crossing Yes
Cased/Uncased Cased
Cause Material Failure of Pipe or Weld
Narrative Gas control personnel for Tennessee Gas Pipeline (TGP) noticed pressure drops relative to its pipeline in valve section 214 downstream of Carrollton compressor station and near the town of Hanoverton, OH around 10:30 pm EST on February 10, 2011. Shortly thereafter, TGP received a report from a local landowner of a fire some 11,000 feet north of valve 214 in line 4. Upon responding, field personnel verified that a rupture had occurred in line 4 where it crosses McKay Road in Columbiana County, OH. There was no formal evacuation of residents although emergency responders did advise some to leave their homes as a precautionary measure (TGP was not involved in any evacuation). Post-incident root cause analysis revealed the failure occurred as a result of tensile overload on a pre-existing hydrogen assisted crack in the underbed of the girth weld. The crack originated during the welding process at the time of original construction. The tensile overload was the result of a number of interacting stressors including but not limited to thermal contraction stresses. The pipeline has been repaired, purged, and loaded with natural gas to a pressure of 491 psig.
135
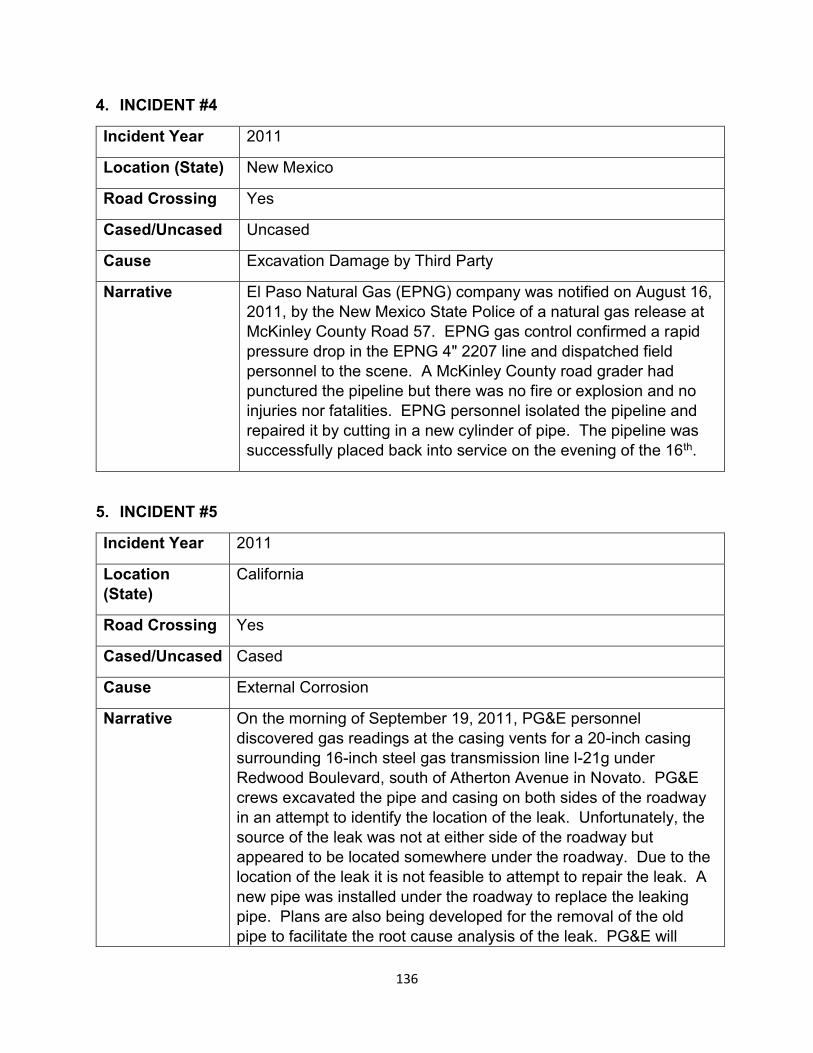
4. INCIDENT #4
Incident Year 2011
Location (State) New Mexico
Road Crossing Yes
Cased/Uncased Uncased
Cause Excavation Damage by Third Party
Narrative El Paso Natural Gas (EPNG) company was notified on August 16, 2011, by the New Mexico State Police of a natural gas release at McKinley County Road 57. EPNG gas control confirmed a rapid pressure drop in the EPNG 4" 2207 line and dispatched field personnel to the scene. A McKinley County road grader had punctured the pipeline but there was no fire or explosion and no injuries nor fatalities. EPNG personnel isolated the pipeline and repaired it by cutting in a new cylinder of pipe. The pipeline was successfully placed back into service on the evening of the 16th .
5. INCIDENT #5
Incident Year 2011
Location (State)
California
Road Crossing Yes
Cased/Uncased Cased
Cause External Corrosion
Narrative On the morning of September 19, 2011, PG&E personnel discovered gas readings at the casing vents for a 20-inch casing surrounding 16-inch steel gas transmission line l-21g under Redwood Boulevard, south of Atherton Avenue in Novato. PG&E crews excavated the pipe and casing on both sides of the roadway in an attempt to identify the location of the leak. Unfortunately, the source of the leak was not at either side of the roadway but appeared to be located somewhere under the roadway. Due to the location of the leak it is not feasible to attempt to repair the leak. A new pipe was installed under the roadway to replace the leaking pipe. Plans are also being developed for the removal of the old pipe to facilitate the root cause analysis of the leak. PG&E will
136
provide the results of the root cause analysis to the CPUC upon completion of the analysis. There were no injuries or fatalities as a result of this incident. Damages are expected to exceed $50,000 following further evaluation on September 20, 2011, after which the DOT was notified. This incident initially became reportable when San Francisco major media tv Channel 5 was observed on scene at 1845 hours.
6. INCIDENT #6
Incident Year 2011
Location (State)
Texas
Road Crossing Yes
Cased/Uncased Cased
Cause External Corrosion
Narrative At 8:00 pm on December 13, 2011, Center Point Energy called the control center notifying them of a gas odor at Hwy 3 and Brookglen drive in Houston, TX. The control center called the operations on call person to respond. Local operations personnel discovered an LEL around a 10-foot area of the intersection of Highway 3 and Brookglen drive. Emergency response procedures were initiated and at the request of the TPC plant, a controlled shutdown was coordinated which allowed them to get another supplier online before the pipeline was shut down and isolated. A portable flare was brought out to flare down the pipeline. The pipeline was purged and inerted with nitrogen. Excavation of the release site was started on December 15, 2011 and the damaged section of pipe was identified in the afternoon located approximately 20 feet inside the casing under Brookglen drive. It was decided to repair the pipeline by excavating both ends of the casing and replacing the entire pipe section inside it. The installation of the certified replacement pipe was completed on December 18, 2011 and the pipeline was returned to service on December 20, 2011. No further remediation or repairs were necessary. Analysis of the damaged area of the pipe determined the cause to be external corrosion due to being shorted to the casing. During excavation it was discovered that the
137
vent pipe was detached from the casing. New casing vents were installed on both sides of the casing.
7. INCIDENT #7
Incident Year 2012
Location (State) Missouri
Road Crossing Yes
Cased/Uncased Unknown
Cause External Corrosion
Narrative Field installed shrink sleeve was damaged and unbonded during installation when the pipe was pulled through the bore hole exposing the exterior of the steel pipe to the effects of "tenting" and atmospheric corrosion.
8. INCIDENT #8
Incident Year 2012
Location (State) New Jersey
Road Crossing Yes
Cased/Uncased Bored/Drilled (uncased)
Cause Previous Mechanical Damage Not Related to Excavation
Narrative Operator employees and third-party contractors were on site of an anomaly investigation dig, operator employees were removing soil around the pipeline when operator employees smelled an odor coming from the anomaly pie. The pipeline was taken out of service and an investigation was initiated. The results of the leak investigation showed a dent on the pipe due to a rock underneath the pipe. The rock underneath the pipe was the cause of a small crack where the leak initiated. The pipe anomaly segment was cutout and replaced with new pipe.
138
9. INCIDENT #9
Incident Year 2013
Location (State) Texas
Road Crossing Yes
Cased/Uncased Bored/Drilled (information on whether there was a casing, or no casing for the impacted pipeline was not provided in the narrative. However, the incident occurred due to a boring activity to the underground gas pipeline at the crossing)
Cause Excavation Damage by Third Party
Narrative At approximately 11:38 on Wednesday March 13, 2013, Texas Gas Service received an emergency call of a hit line. The call was received from W. Military Hwy, McAllen. A Texas Gas Service first responder arrived at 12:26 and noticed that there were fire department personnel on site and that Military Hwy was closed to traffic. He also noticed damage to the roadway. Further investigation revealed that a boring unit operated by Hernandez Utilities, subcontractor for Mastec, had damaged an underground gas pipeline. Due to the proximity of another pipeline in the area, Texas Gas Service was uncertain if the damaged gas pipeline was a 10" transmission line operated by Texas gas service. To determine if the damaged pipeline was Texas Gas Service's personnel isolated the damaged portion of the 10" transmission line via operating 2 manual valves and monitored the gas pressure within the isolated section. It was then determined that the damaged pipeline was the Texas Gas Service pipeline. The leakage was controlled by isolating the segment. Skillets were installed to the valve site for additional safety to prevent any possible leak through with the shutdown completed. The roadway was then reopened.
139
10.INCIDENT #10
Incident Year 2013
Location (State) Wisconsin
Road Crossing Yes
Cased/Uncased Cased
Cause Material Failure of Pipe or Weld
Narrative On April 23, 2013, at approximately 04:27 Northern Natural Gas Company's Omaha operations communications center received a call reporting that there appeared to be blowing natural gas 1/2 mile south of county road on Steele Valley Road. It was indicated that emergency responders were on-site and that they had blocked off a section of the road. Further, that there were no residences in the immediate area. A representative from Midwest Natural Gas called to confirm that natural gas appeared to be blowing from vent casings on both sides of the road. The location is approximately four miles west of the town of Mondovi, Wisconsin. Northern Company Employees were dispatched to the site and a gas management plan was developed to reduce pressure on the pipeline to approximately 520-550 psig from a typical 795 psig. Pressure was reduced by pinching block valves and letting customer usage pull the pressure down on the line then closely monitoring. Emergency stopple and bypass piping was brought on-site tested and placed in-service. Michels Construction, a contractor, assisted with excavation activities on both side of the road. Upon completion of excavation a crack in a piping girth weld was found on the underside (six o'clock position) which went entirely through the pipe, the crack was approximately 4 ½ inches long and one sixteenth of an inch wide. The Steele County Road department was contacted and agreed that Northern could open cut the road for installing new tested pipe. Northern would be responsible for restoration of the road and hard surfacing. Approximately 60-feet of new tested, coated pipe was installed. There were no injuries, no fire, no evacuations and no loss of service to customers. The pipe with the cracked girth weld was sent to an outside metallurgical laboratory for
140
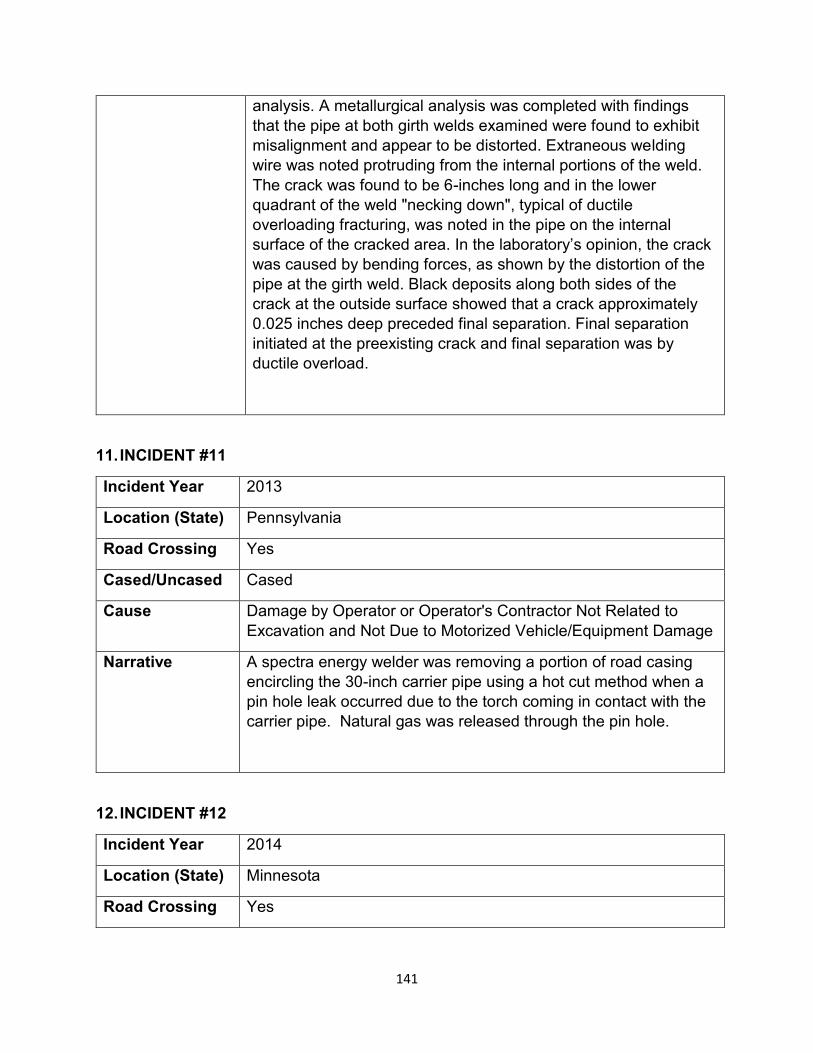
analysis. A metallurgical analysis was completed with findings that the pipe at both girth welds examined were found to exhibit misalignment and appear to be distorted. Extraneous welding wire was noted protruding from the internal portions of the weld. The crack was found to be 6-inches long and in the lower quadrant of the weld "necking down", typical of ductile overloading fracturing, was noted in the pipe on the internal surface of the cracked area. In the laboratory’s opinion, the crack was caused by bending forces, as shown by the distortion of the pipe at the girth weld. Black deposits along both sides of the crack at the outside surface showed that a crack approximately 0.025 inches deep preceded final separation. Final separation initiated at the preexisting crack and final separation was by ductile overload.
11.INCIDENT #11
Incident Year 2013
Location (State) Pennsylvania
Road Crossing Yes
Cased/Uncased Cased
Cause Damage by Operator or Operator's Contractor Not Related to Excavation and Not Due to Motorized Vehicle/Equipment Damage
Narrative A spectra energy welder was removing a portion of road casing encircling the 30-inch carrier pipe using a hot cut method when a pin hole leak occurred due to the torch coming in contact with the carrier pipe. Natural gas was released through the pin hole.
12.INCIDENT #12
Incident Year 2014
Location (State) Minnesota
Road Crossing Yes
141
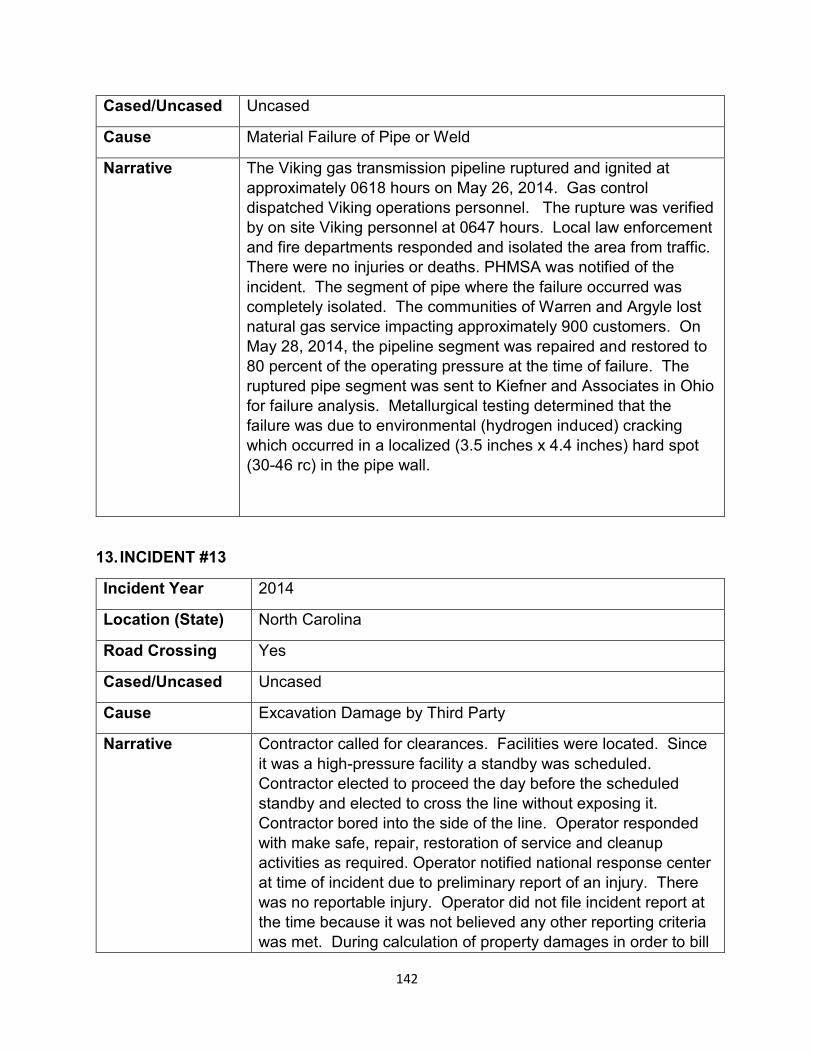
Cased/Uncased Uncased
Cause Material Failure of Pipe or Weld
Narrative The Viking gas transmission pipeline ruptured and ignited at approximately 0618 hours on May 26, 2014. Gas control dispatched Viking operations personnel. The rupture was verified by on site Viking personnel at 0647 hours. Local law enforcement and fire departments responded and isolated the area from traffic. There were no injuries or deaths. PHMSA was notified of the incident. The segment of pipe where the failure occurred was completely isolated. The communities of Warren and Argyle lost natural gas service impacting approximately 900 customers. On May 28, 2014, the pipeline segment was repaired and restored to 80 percent of the operating pressure at the time of failure. The ruptured pipe segment was sent to Kiefner and Associates in Ohio for failure analysis. Metallurgical testing determined that the failure was due to environmental (hydrogen induced) cracking which occurred in a localized (3.5 inches x 4.4 inches) hard spot (30-46 rc) in the pipe wall.
13.INCIDENT #13
Incident Year 2014
Location (State) North Carolina
Road Crossing Yes
Cased/Uncased Uncased
Cause Excavation Damage by Third Party
Narrative Contractor called for clearances. Facilities were located. Since it was a high-pressure facility a standby was scheduled. Contractor elected to proceed the day before the scheduled standby and elected to cross the line without exposing it. Contractor bored into the side of the line. Operator responded with make safe, repair, restoration of service and cleanup activities as required. Operator notified national response center at time of incident due to preliminary report of an injury. There was no reportable injury. Operator did not file incident report at the time because it was not believed any other reporting criteria was met. During calculation of property damages in order to bill
142
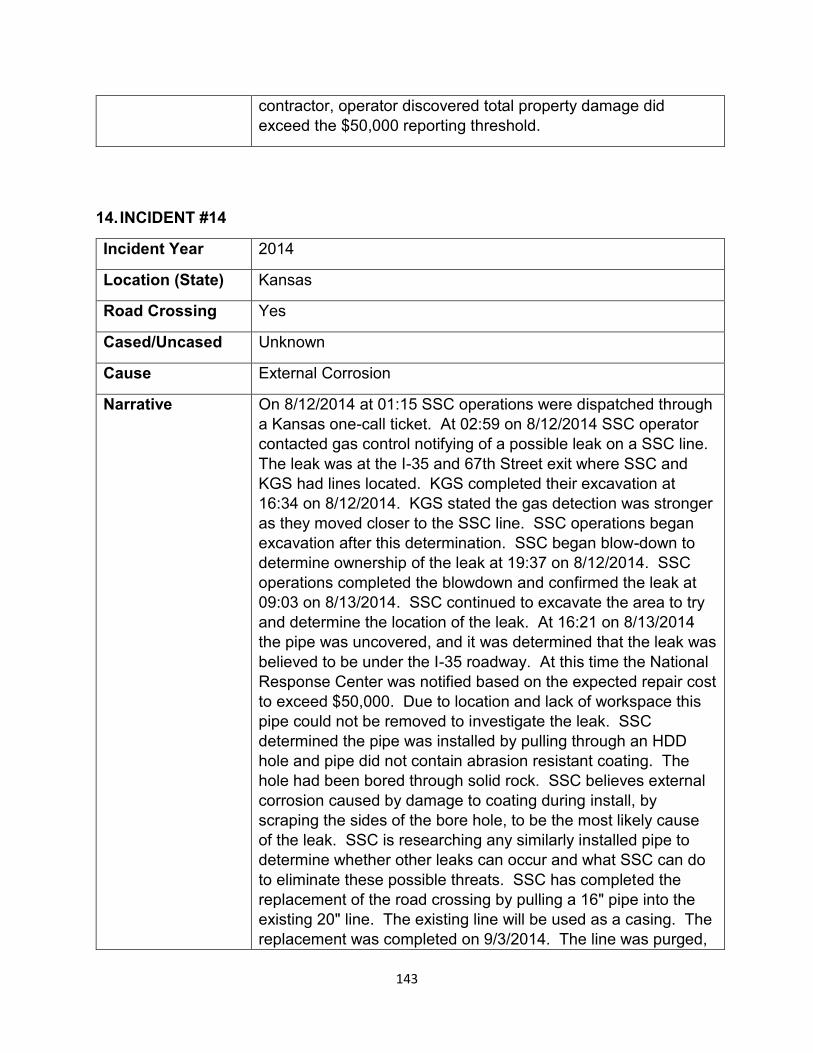
contractor, operator discovered total property damage did exceed the $50,000 reporting threshold.
14.INCIDENT #14
Incident Year 2014
Location (State) Kansas
Road Crossing Yes
Cased/Uncased Unknown
Cause External Corrosion
Narrative On 8/12/2014 at 01:15 SSC operations were dispatched through a Kansas one-call ticket. At 02:59 on 8/12/2014 SSC operator contacted gas control notifying of a possible leak on a SSC line. The leak was at the I-35 and 67th Street exit where SSC and KGS had lines located. KGS completed their excavation at 16:34 on 8/12/2014. KGS stated the gas detection was stronger as they moved closer to the SSC line. SSC operations began excavation after this determination. SSC began blow-down to determine ownership of the leak at 19:37 on 8/12/2014. SSC operations completed the blowdown and confirmed the leak at 09:03 on 8/13/2014. SSC continued to excavate the area to try and determine the location of the leak. At 16:21 on 8/13/2014 the pipe was uncovered, and it was determined that the leak was believed to be under the I-35 roadway. At this time the National Response Center was notified based on the expected repair cost to exceed $50,000. Due to location and lack of workspace this pipe could not be removed to investigate the leak. SSC determined the pipe was installed by pulling through an HDD hole and pipe did not contain abrasion resistant coating. The hole had been bored through solid rock. SSC believes external corrosion caused by damage to coating during install, by scraping the sides of the bore hole, to be the most likely cause of the leak. SSC is researching any similarly installed pipe to determine whether other leaks can occur and what SSC can do to eliminate these possible threats. SSC has completed the replacement of the road crossing by pulling a 16" pipe into the existing 20" line. The existing line will be used as a casing. The replacement was completed on 9/3/2014. The line was purged,
143
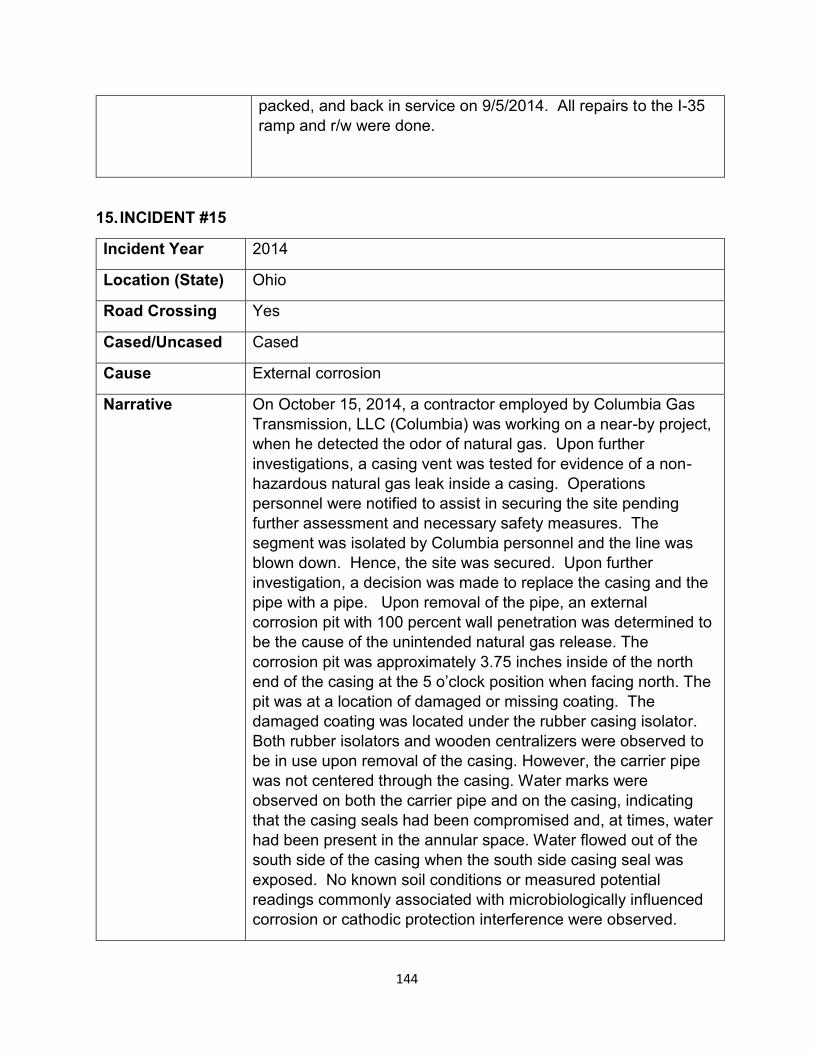
packed, and back in service on 9/5/2014. All repairs to the I-35 ramp and r/w were done.
15.INCIDENT #15
Incident Year 2014
Location (State) Ohio
Road Crossing Yes
Cased/Uncased Cased
Cause External corrosion
Narrative On October 15, 2014, a contractor employed by Columbia Gas Transmission, LLC (Columbia) was working on a near-by project, when he detected the odor of natural gas. Upon further investigations, a casing vent was tested for evidence of a non-hazardous natural gas leak inside a casing. Operations personnel were notified to assist in securing the site pending further assessment and necessary safety measures. The segment was isolated by Columbia personnel and the line was blown down. Hence, the site was secured. Upon further investigation, a decision was made to replace the casing and the pipe with a pipe. Upon removal of the pipe, an external corrosion pit with 100 percent wall penetration was determined to be the cause of the unintended natural gas release. The corrosion pit was approximately 3.75 inches inside of the north end of the casing at the 5 o’clock position when facing north. The pit was at a location of damaged or missing coating. The damaged coating was located under the rubber casing isolator. Both rubber isolators and wooden centralizers were observed to be in use upon removal of the casing. However, the carrier pipe was not centered through the casing. Water marks were observed on both the carrier pipe and on the casing, indicating that the casing seals had been compromised and, at times, water had been present in the annular space. Water flowed out of the south side of the casing when the south side casing seal was exposed. No known soil conditions or measured potential readings commonly associated with microbiologically influenced corrosion or cathodic protection interference were observed.
144
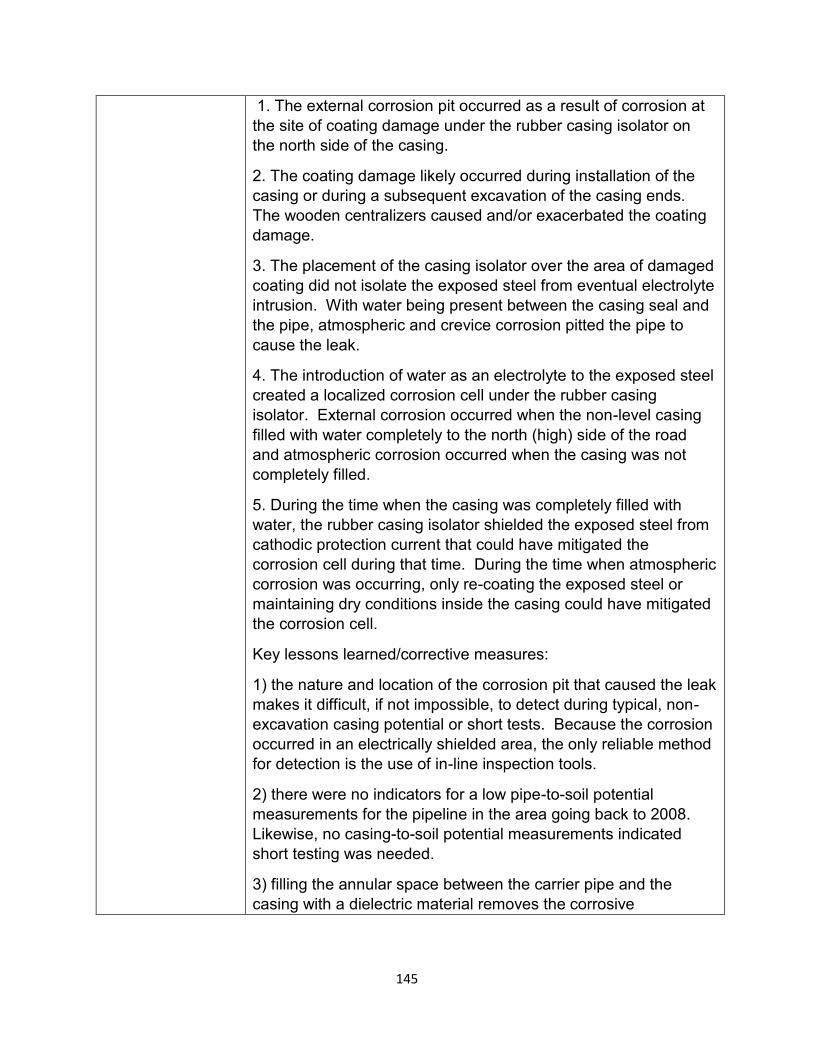
1. The external corrosion pit occurred as a result of corrosion at the site of coating damage under the rubber casing isolator on the north side of the casing.
2. The coating damage likely occurred during installation of the casing or during a subsequent excavation of the casing ends. The wooden centralizers caused and/or exacerbated the coating damage.
3. The placement of the casing isolator over the area of damaged coating did not isolate the exposed steel from eventual electrolyte intrusion. With water being present between the casing seal and the pipe, atmospheric and crevice corrosion pitted the pipe to cause the leak.
4. The introduction of water as an electrolyte to the exposed steel created a localized corrosion cell under the rubber casing isolator. External corrosion occurred when the non-level casing filled with water completely to the north (high) side of the road and atmospheric corrosion occurred when the casing was not completely filled.
5. During the time when the casing was completely filled with water, the rubber casing isolator shielded the exposed steel from cathodic protection current that could have mitigated the corrosion cell during that time. During the time when atmospheric corrosion was occurring, only re-coating the exposed steel or maintaining dry conditions inside the casing could have mitigated the corrosion cell.
Key lessons learned/corrective measures:
1) the nature and location of the corrosion pit that caused the leak makes it difficult, if not impossible, to detect during typical, non-excavation casing potential or short tests. Because the corrosion occurred in an electrically shielded area, the only reliable method for detection is the use of in-line inspection tools.
2) there were no indicators for a low pipe-to-soil potential measurements for the pipeline in the area going back to 2008. Likewise, no casing-to-soil potential measurements indicated short testing was needed.
3) filling the annular space between the carrier pipe and the casing with a dielectric material removes the corrosive
145
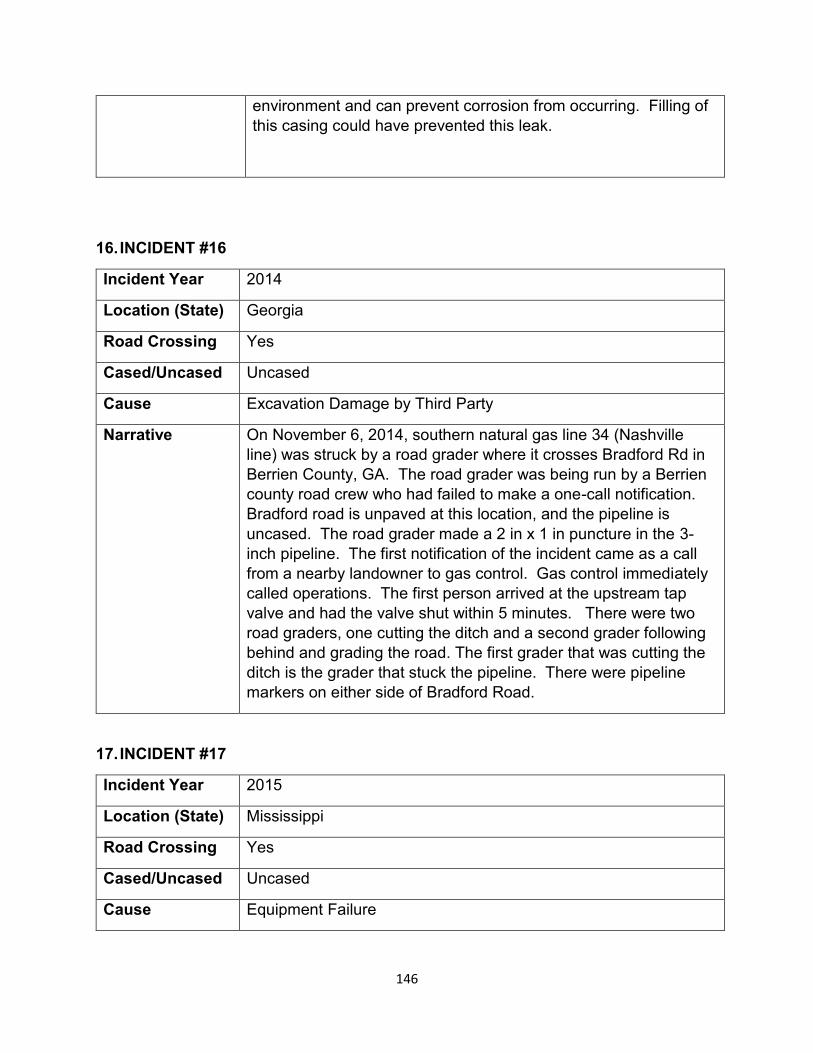
environment and can prevent corrosion from occurring. Filling of this casing could have prevented this leak.
16.INCIDENT #16
Incident Year 2014
Location (State) Georgia
Road Crossing Yes
Cased/Uncased Uncased
Cause Excavation Damage by Third Party
Narrative On November 6, 2014, southern natural gas line 34 (Nashville line) was struck by a road grader where it crosses Bradford Rd in Berrien County, GA. The road grader was being run by a Berrien county road crew who had failed to make a one-call notification. Bradford road is unpaved at this location, and the pipeline is uncased. The road grader made a 2 in x 1 in puncture in the 3-inch pipeline. The first notification of the incident came as a call from a nearby landowner to gas control. Gas control immediately called operations. The first person arrived at the upstream tap valve and had the valve shut within 5 minutes. There were two road graders, one cutting the ditch and a second grader following behind and grading the road. The first grader that was cutting the ditch is the grader that stuck the pipeline. There were pipeline markers on either side of Bradford Road.
17.INCIDENT #17
Incident Year 2015
Location (State) Mississippi
Road Crossing Yes
Cased/Uncased Uncased
Cause Equipment Failure
146
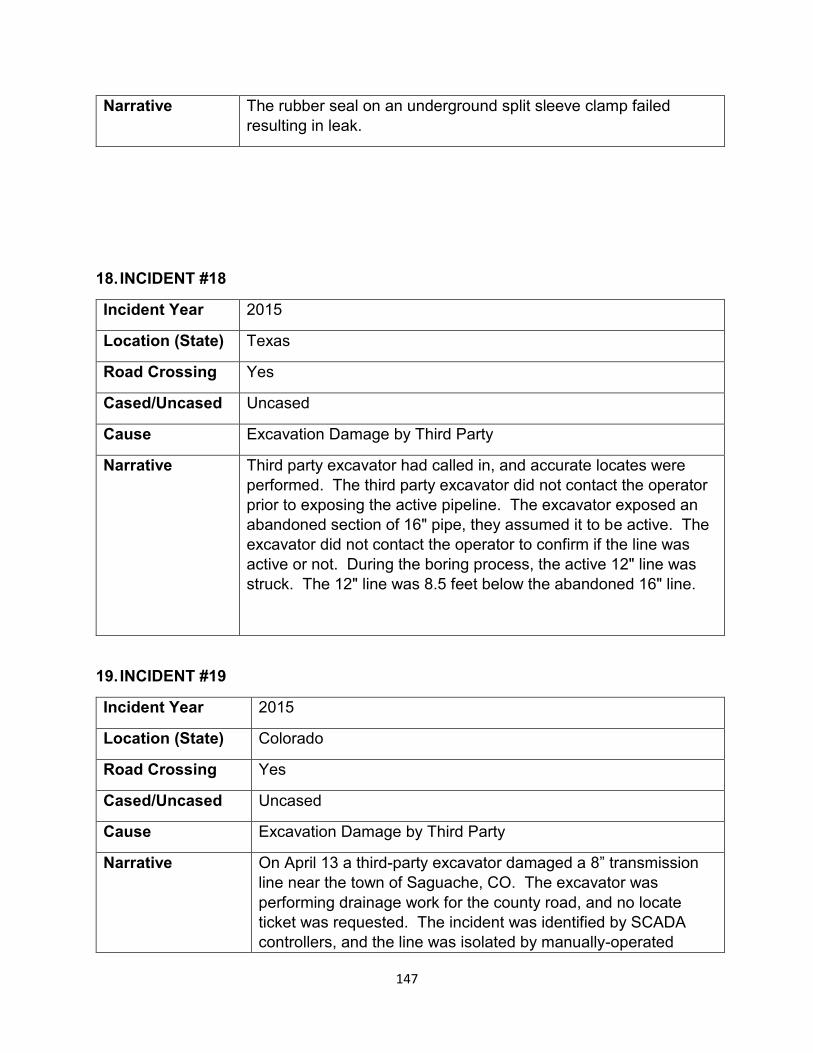
Narrative The rubber seal on an underground split sleeve clamp failed resulting in leak.
18.INCIDENT #18
Incident Year 2015
Location (State) Texas
Road Crossing Yes
Cased/Uncased Uncased
Cause Excavation Damage by Third Party
Narrative Third party excavator had called in, and accurate locates were performed. The third party excavator did not contact the operator prior to exposing the active pipeline. The excavator exposed an abandoned section of 16" pipe, they assumed it to be active. The excavator did not contact the operator to confirm if the line was active or not. During the boring process, the active 12" line was struck. The 12" line was 8.5 feet below the abandoned 16" line.
19.INCIDENT #19
Incident Year 2015
Location (State) Colorado
Road Crossing Yes
Cased/Uncased Uncased
Cause Excavation Damage by Third Party
Narrative On April 13 a third-party excavator damaged a 8” transmission line near the town of Saguache, CO. The excavator was performing drainage work for the county road, and no locate ticket was requested. The incident was identified by SCADA controllers, and the line was isolated by manually-operated
147
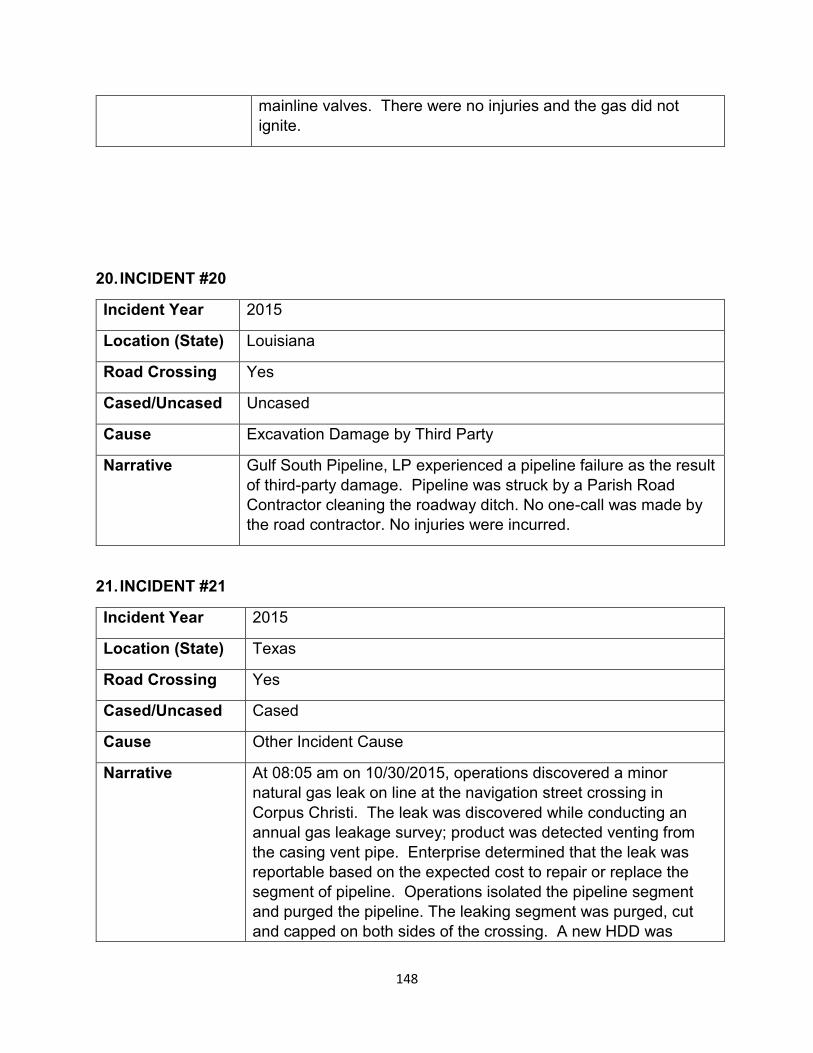
mainline valves. There were no injuries and the gas did not ignite.
20.INCIDENT #20
Incident Year 2015
Location (State) Louisiana
Road Crossing Yes
Cased/Uncased Uncased
Cause Excavation Damage by Third Party
Narrative Gulf South Pipeline, LP experienced a pipeline failure as the result of third-party damage. Pipeline was struck by a Parish Road Contractor cleaning the roadway ditch. No one-call was made by the road contractor. No injuries were incurred.
21.INCIDENT #21
Incident Year 2015
Location (State) Texas
Road Crossing Yes
Cased/Uncased Cased
Cause Other Incident Cause
Narrative At 08:05 am on 10/30/2015, operations discovered a minor natural gas leak on line at the navigation street crossing in Corpus Christi. The leak was discovered while conducting an annual gas leakage survey; product was detected venting from the casing vent pipe. Enterprise determined that the leak was reportable based on the expected cost to repair or replace the segment of pipeline. Operations isolated the pipeline segment and purged the pipeline. The leaking segment was purged, cut and capped on both sides of the crossing. A new HDD was
148
installed, and the pipeline was returned to service. The old segment could not be exposed to confirm the cause of the release due to location of the crossing at navigation street.
22.INCIDENT #22
Incident Year 2015
Location (State) Nevada
Road Crossing Yes
Cased/Uncased Uncased
Cause Other Outside Force Damage
Narrative On November 21, 2015, the 8-inch Carson lateral was punctured on the south side of Mica Drive at US-395 during an in-line inspection (ILI) tool run. The puncture occurred at a drop section containing 45-degree elbows installed in 1987 as part of a relocation for the construction of Mica Drive. An investigation on the cause of the incident has been completed and it was determined that during the ILI of the Carson lateral, the leading eye of the MFL tool struck the inside of the 45-degree elbow and caused a puncture in the pipeline. Company employees and contractors were stationed at the segment isolation valves as part of the ILI procedure allowing for a rapid response and shutdown of the pipeline as part of the isolation plan. Public and private property damage includes six vehicles and a landscape retaining wall as a result of the blowing dirt and rocks. The magnetic flux leakage ILI tool was also damaged.
23.INCIDENT #23
Incident Year 2016
Location (State) New Mexico
Road Crossing Yes
Cased/Uncased Uncased
Cause Excavation Damage by Third Party
149
Narrative A road grader scraped the pipeline with the blade and gouged a hole approximately 6" x 9". Grader operator did not call the NM one-call notification center for a locate request.
24.INCIDENT #24
Incident Year 2018
Location (State)
California
Road Crossing Yes
Cased/Uncased Uncased
Cause Excavation Damage by Third Party
Narrative On March 7, 2018 at approximately 10:43 am, a third-party subcontractor struck a 20-inch gas steel transmission line while performing directional boring. This resulted in an escape of gas. Crews responded and were able to control the gas through closing valves at nearby regulator stations. There were no injuries that resulted from this incident. Investigation revealed that prior to the incident, the third-party subcontractor had a USA ticket. The line had been properly marked by an SDG&E contractor. At the time of the incident, the third-party subcontractor did not have a valid USA ticket for the excavation activities performed. In addition, the third-party subcontractor failed to request a stand-by from d SDG&E which is required when excavating near high pressure gas facilities. This incident was reported to DOT and CPUC due to estimated damage amount exceeding $50,000.
Class Location Definitions
1. A Class 1 location is: (i) An offshore area; or (ii) Any class location unit that has 10 or fewer buildings intended for human occupancy.
2. A Class 2 location is any class location unit that has more than 10 but fewer than 46 buildings intended for human occupancy.
3. A Class 3 location is: (i) Any class location unit that has 46 or more buildings intended for human occupancy; or (ii) An area where the pipeline lies within 100 yards (91
150

meters) of either a building or a small, well-defined outside area (such as a playground, recreation area, outdoor theater, or other place of public assembly) that is occupied by 20 or more persons on at least 5 days a week for 10 weeks in any 12-month period. (The days and weeks need not be consecutive.)
4. A Class 4 location is any class location unit where buildings with four or more stories above ground are prevalent.
Data Compilation – Pipeline Incidents per Mile
Table A1: Incident per mile for various Hazardous Liquid types
State Hazardous Liquid Type
Crude Oil Petroleum Products
Highly Volatile Liquids
Liquid CO2 Biofuel
AK 0.002 0.001 0.000 0.000 0.000
AL 0.001 0.008 0.000 0.000 0.000
AR 0.003 0.008 0.000 0.000 0.000
AZ 0.001 0.004 0.000 0.000 0.000
CA 0.044 0.039 0.000 0.000 0.000
CO 0.001 0.009 0.000 0.000 0.000
CT 0.000 0.001 0.000 0.000 0.000
DE 0.000 0.000 0.000 0.000 0.000
FL 0.001 0.004 0.000 0.000 0.000
GA 0.000 0.007 0.000 0.000 0.000
HI 0.000 0.002 0.000 0.000 0.000
IA 0.001 0.014 0.000 0.000 0.000
ID 0.000 0.002 0.000 0.000 0.000
IL 0.009 0.023 0.000 0.000 0.000
IN 0.002 0.012 0.000 0.000 0.000
KS 0.015 0.028 0.000 0.000 0.000
151
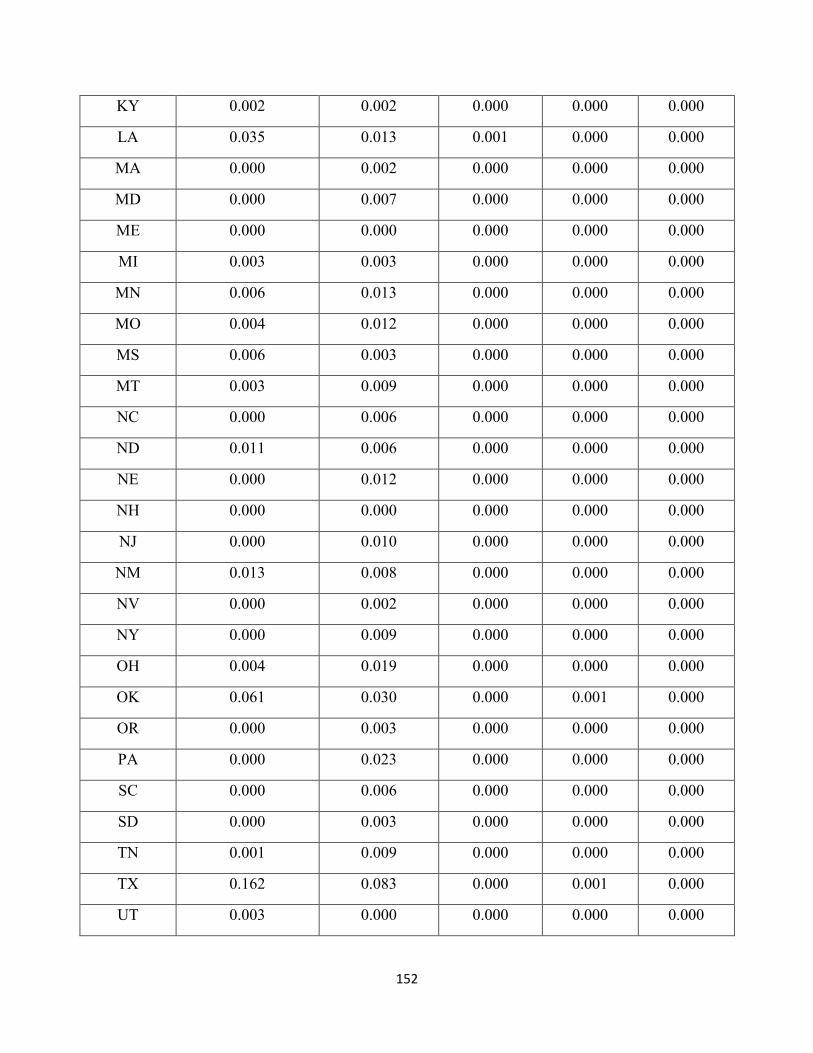
KY 0.002 0.002 0.000 0.000 0.000
LA 0.035 0.013 0.001 0.000 0.000
MA 0.000 0.002 0.000 0.000 0.000
MD 0.000 0.007 0.000 0.000 0.000
ME 0.000 0.000 0.000 0.000 0.000
MI 0.003 0.003 0.000 0.000 0.000
MN 0.006 0.013 0.000 0.000 0.000
MO 0.004 0.012 0.000 0.000 0.000
MS 0.006 0.003 0.000 0.000 0.000
MT 0.003 0.009 0.000 0.000 0.000
NC 0.000 0.006 0.000 0.000 0.000
ND 0.011 0.006 0.000 0.000 0.000
NE 0.000 0.012 0.000 0.000 0.000
NH 0.000 0.000 0.000 0.000 0.000
NJ 0.000 0.010 0.000 0.000 0.000
NM 0.013 0.008 0.000 0.000 0.000
NV 0.000 0.002 0.000 0.000 0.000
NY 0.000 0.009 0.000 0.000 0.000
OH 0.004 0.019 0.000 0.000 0.000
OK 0.061 0.030 0.000 0.001 0.000
OR 0.000 0.003 0.000 0.000 0.000
PA 0.000 0.023 0.000 0.000 0.000
SC 0.000 0.006 0.000 0.000 0.000
SD 0.000 0.003 0.000 0.000 0.000
TN 0.001 0.009 0.000 0.000 0.000
TX 0.162 0.083 0.000 0.001 0.000
UT 0.003 0.000 0.000 0.000 0.000
152
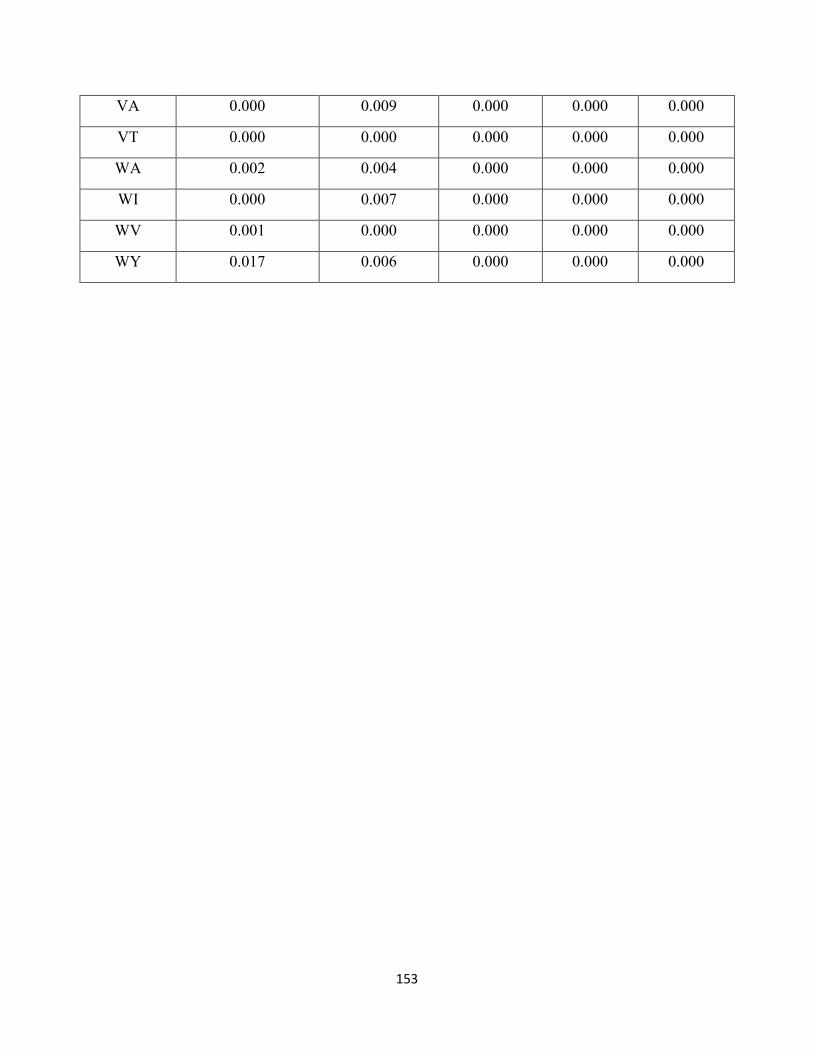
VA 0.000 0.009 0.000 0.000 0.000
VT 0.000 0.000 0.000 0.000 0.000
WA 0.002 0.004 0.000 0.000 0.000
WI 0.000 0.007 0.000 0.000 0.000
WV 0.001 0.000 0.000 0.000 0.000
WY 0.017 0.006 0.000 0.000 0.000
153
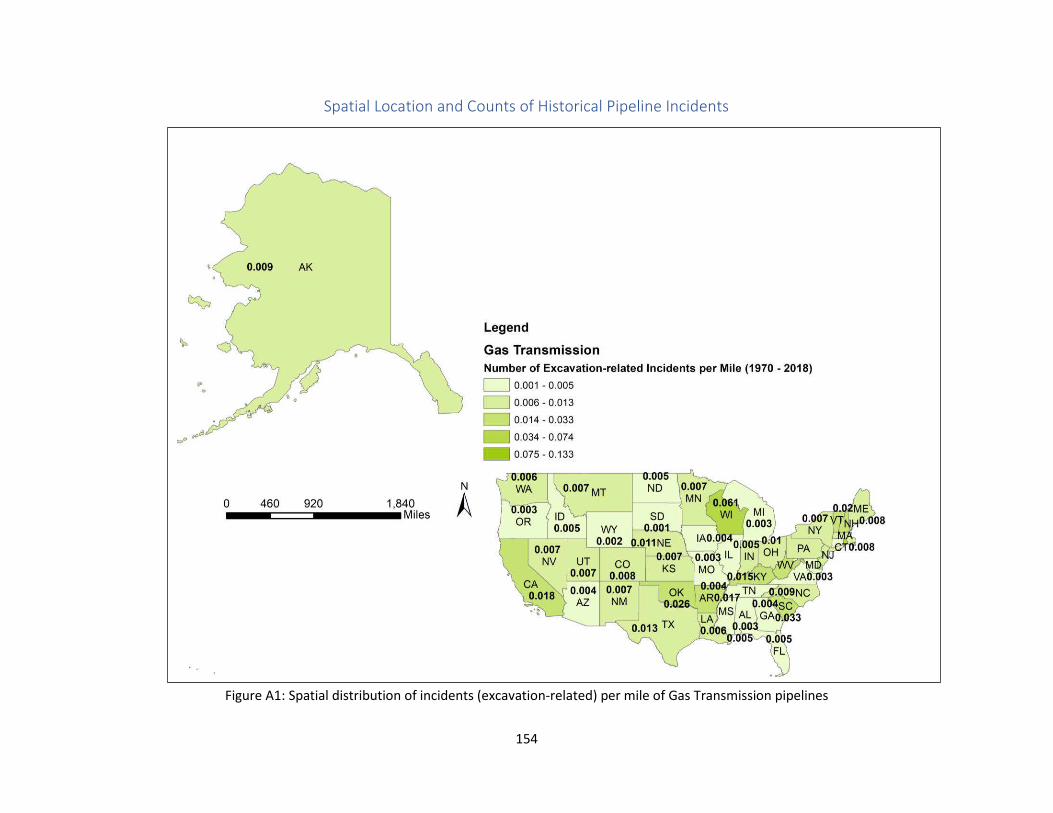
Spatial Location and Counts of Historical Pipeline Incidents
Figure A1: Spatial distribution of incidents (excavation-related) per mile of Gas Transmission pipelines
154
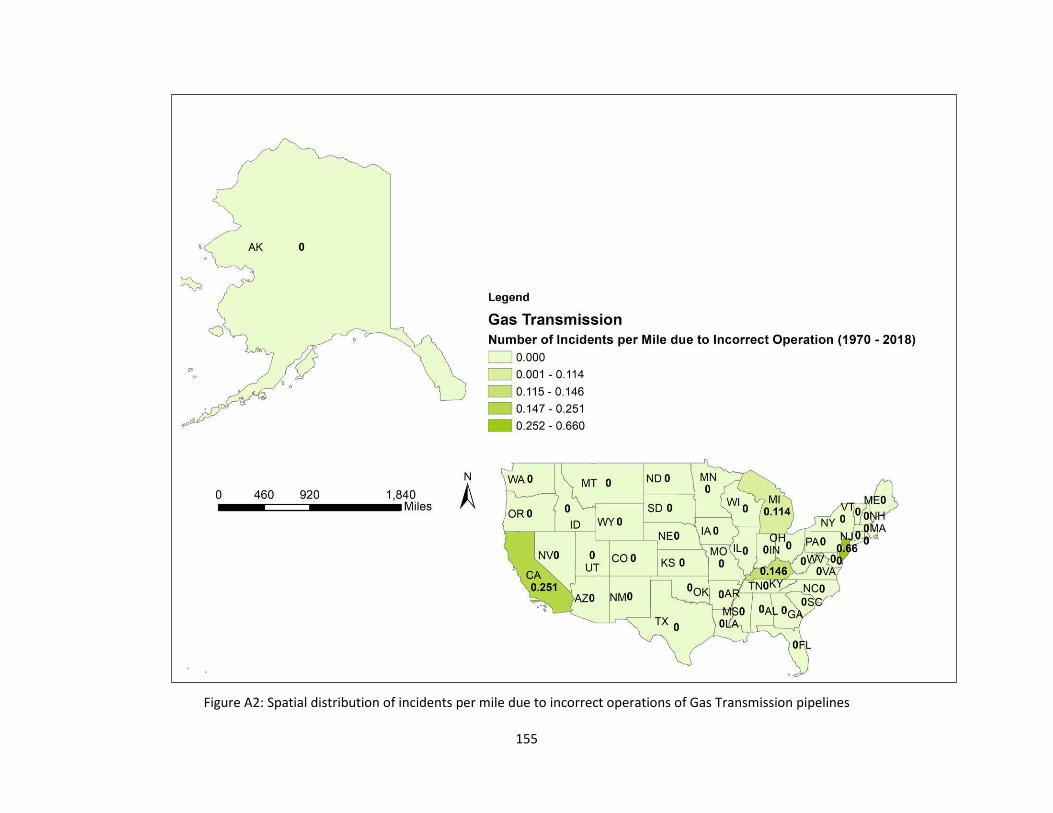
Figure A2: Spatial distribution of incidents per mile due to incorrect operations of Gas Transmission pipelines
155
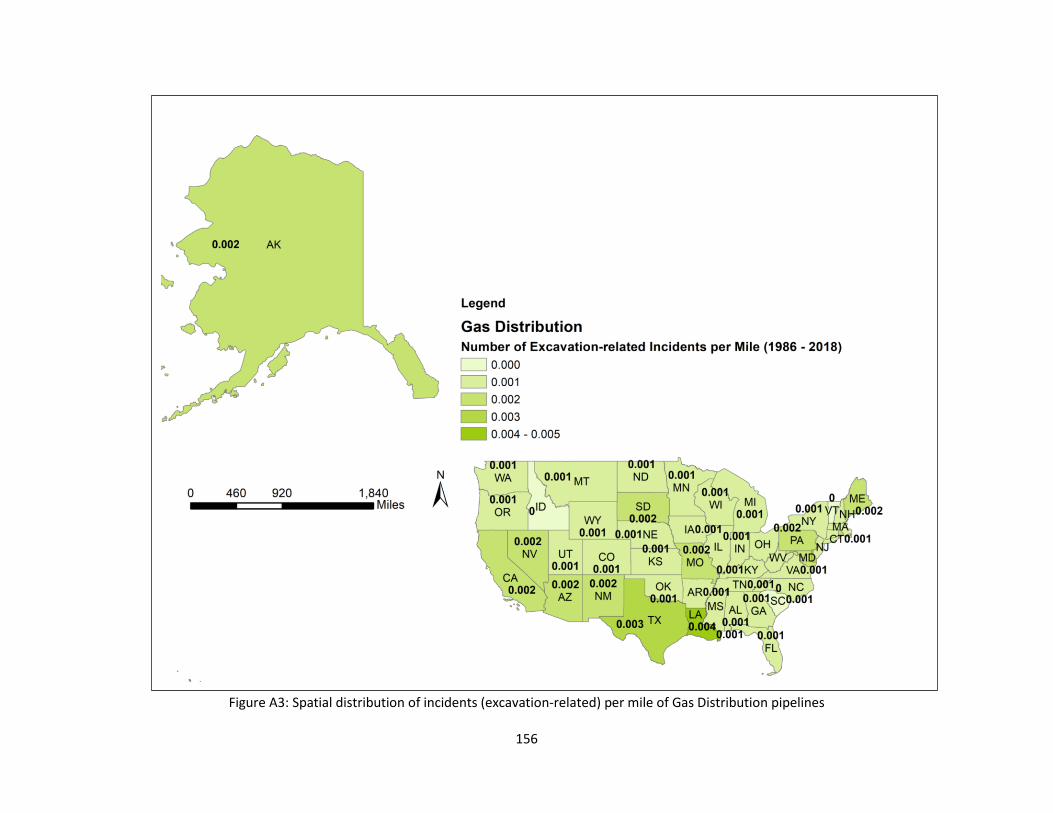
Figure A3: Spatial distribution of incidents (excavation-related) per mile of Gas Distribution pipelines
156
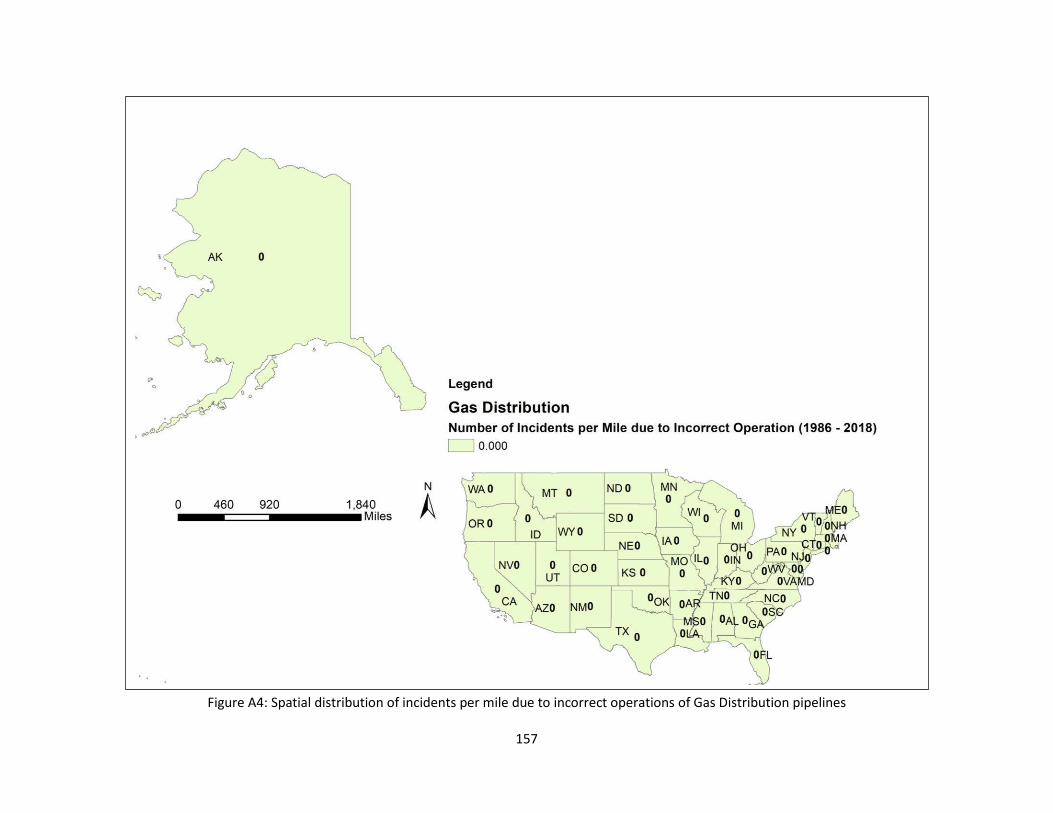
Figure A4: Spatial distribution of incidents per mile due to incorrect operations of Gas Distribution pipelines
157
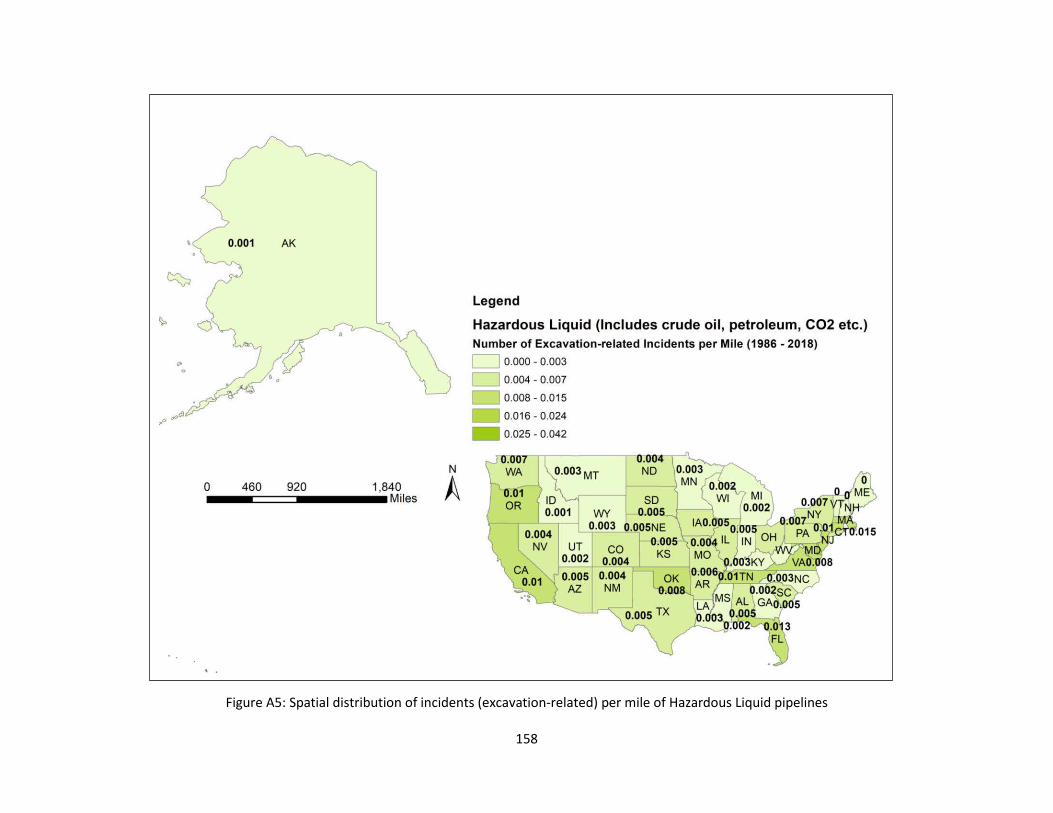
Figure A5: Spatial distribution of incidents (excavation-related) per mile of Hazardous Liquid pipelines
158
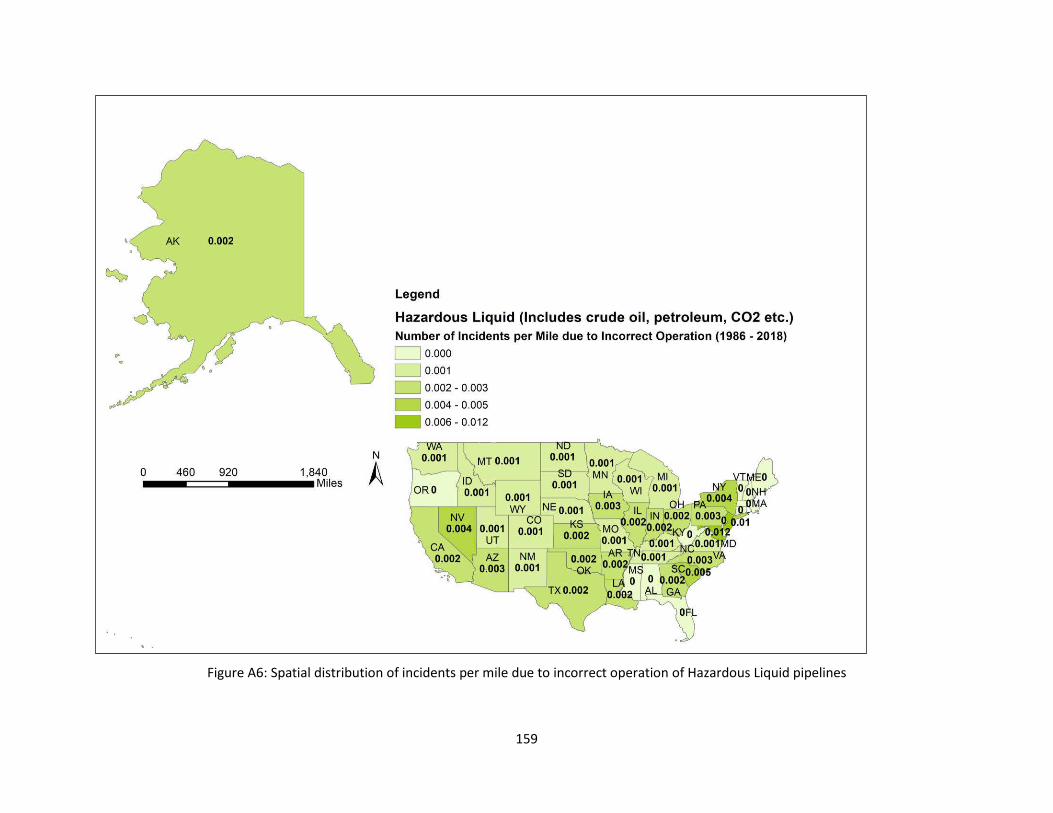
Figure A6: Spatial distribution of incidents per mile due to incorrect operation of Hazardous Liquid pipelines
159


