State of Alaska Workforce Profiledoa.alaska.gov/.../pdf/workforceProfile/dopannualreport.pdf ·...
39
Department of Administration | Division of Personnel and Labor Relations | Employee Planning and Information Center PO Box 110201 Juneau, AK 99811 | Phone: 907-465-4430 | http://doa.alaska.gov/dop State of Alaska Workforce Profile Fiscal Year 2017
-
Upload
truongdung -
Category
Documents
-
view
214 -
download
0
Transcript of State of Alaska Workforce Profiledoa.alaska.gov/.../pdf/workforceProfile/dopannualreport.pdf ·...
Department of Administration | Division of Personnel and Labor Relations | Employee Planning and Information CenterPO Box 110201 Juneau, AK 99811 | Phone: 907-465-4430 | http://doa.alaska.gov/dop
State of Alaska Workforce Profile
Fiscal Year 2017

Department of Administration, Division of Personnel & Labor Relations, Employee Planning & Information Center Page 1
State of Alaska - Workforce Profile 2017
Introduction
Dear Colleagues:
The Division of Personnel and Labor Relations is pleased to provide the Fiscal Year 2017 Annual Workforce Profile for the State of Alaska Executive Branch. This publication is designed to assist you, our executives, managers, and human resource professionals, to better understand our current workforce. Understanding the current workforce is an important step in the workforce planning process.
Included in the current profile are data and graphs representing demographics such as age and ethnicity distribution, average salaries, and retirement projections. The data presented is as of June 30, 2017.
As always, the data in this report includes all executive branch employees with permanent, probationary, and provisional status in the classified service as well as partially exempt and exempt employees. Excluded from this report are executive branch employees with nonpermanent, temporary, and emergency status, and employees of the National Guard, Alaska Railroad Corporation, and Alaska Housing Finance Corporation. Additionally, this report does not contain information about employees of the University of Alaska or the legislative and judicial branches of the State of Alaska.
We welcome your feedback and are ready to assist you with your workforce analysis needs. You may contact your agency human resource staff or the Employee Planning and Information Center team for assistance.
Kate SheehanDirector, Division of Personnel and Labor Relations
Department of Administration, Division of Personnel & Labor Relations, Employee Planning & Information Center Page 2
State of Alaska - Workforce Profile 2017
Table of Contents
Introduction ................................................................................................................................................1
Employee Count by Department ................................................................................................................4
Percentage of State Workforce by Department ..........................................................................................4
Employee Count by Region .......................................................................................................................5
Percentage of Employees by Region .........................................................................................................5
Employee Count and Percentage by Location............................................................................................6
Employee Count by Department and Gender .............................................................................................8
Chart of Employee Count by Department and Gender................................................................................8
Minority Count and Percentage by Department .........................................................................................9
New Hire Data ..........................................................................................................................................10
Employee Count by Age Range ...............................................................................................................11
Average Age of Employees by Year .........................................................................................................11
Average Age by Department and Gender .................................................................................................12
Average Age by Bargaining Unit..............................................................................................................13
Chart of Average Age by Bargaining Unit ...............................................................................................13
Average Salary by Department .................................................................................................................14
Average Base Monthly Salary by Bargaining Unit and Department ........................................................14
Average State Service ...............................................................................................................................17
By Department and Gender ....................................................................................................................17
By Bargaining Unit ...............................................................................................................................17
Retirement Projections .............................................................................................................................18
By Department......................................................................................................................................18
Percentage of Employees by Retirement Projection Category ...................................................................18
Tier 4 Employees Years of Service ...........................................................................................................19
By Department......................................................................................................................................19
Percentage By Years of State Service ......................................................................................................19
Department of Administration, Division of Personnel & Labor Relations, Employee Planning & Information Center Page 3
State of Alaska - Workforce Profile 2017
Retirement Projections by Department and Job Class Family
Office of the Governor ........................................................................................................................20
Department of Administration ............................................................................................................21
Department of Commerce, Community and Economic Development ...............................................22
Department of Corrections .................................................................................................................23
Department of Education and Early Development .............................................................................24
Department of Environmental Conservation ......................................................................................25
Department of Fish and Game ............................................................................................................26
Department of Health and Social Services .........................................................................................27
Department of Labor and Workforce Development ...........................................................................29
Department of Law .............................................................................................................................30
Department of Military and Veterans Affairs .....................................................................................31
Department of Natural Resources ......................................................................................................32
Department of Public Safety ..............................................................................................................34
Department of Revenue ......................................................................................................................35
Department of Transportation and Public Facilities ...........................................................................36
Credits and Contact Information ..............................................................................................................38

Executive Branch Employees: Classified (Permanent, Probationary, and Provisional), Partially Exempt, and Exempt
State of Alaska - Workforce Profile 2017
Department of Administration, Division of Personnel & Labor Relations, Employee Planning & Information Center Page 4
Department Employee Count
Office of the Governor 130Administration 896Commerce, Community and Economic Development 438Corrections 1721Education and Early Development 271Environmental Conservation 466Fish and Game 1296Health and Social Services 3039Labor and Workforce Development 655Law 461Military and Veterans Affairs 247Natural Resources 807Public Safety 764Revenue 477Transportation and Public Facilities 3024
Statewide 14692*
*There are 435 fewer employees when compared to the FY2016 report.
Percentage of State Workforce by Department
Employee Count by Department
Office of the Governor1%
Administration6%
Commerce, Community and Economic Development
3%
Corrections12%
Education and Early Development
2%
Environmental Conservation
3%
Fish and Game9%
Health and Social Services21%
Labor and Workforce Development
4%
Law3%
Mil i tary and Veterans Affa i rs
2%
Natura l Resources5%
Publ ic Safety5%
Revenue3%
Transportation and Public Faci lities
21%

Executive Branch Employees: Classified (Permanent, Probationary, and Provisional), Partially Exempt, and Exempt
State of Alaska - Workforce Profile 2017
Department of Administration, Division of Personnel & Labor Relations, Employee Planning & Information Center Page 5
Region Employee Count
Aleutian Chain 227Bristol Bay 117Greater Anchorage/Mat-Su 7099Greater Fairbanks 1760Kenai Peninsula 893Kuskokwim-Yukon 266North Slope 88Norton Sound 173Outside of Alaska 8Prince William Sound 196Southeast 3865Statewide 14692
Employee Count by Region
Percentage of Employees by Region
Aleutian Chain, 1.5%Bristol Bay, 0.8%
Greater Anchorage/Mat-Su,
48.3%
Greater Fairbanks, 12.0%
Kenai Peninsula, 6.1%
Kuskokwim-Yukon, 1.8%
North Slope, 0.6%
Norton Sound, 1.2%
Outside of Alaska, 0.1%
Prince Will iam Sound, 1.3%
Southeast, 26.3%

Executive Branch Employees: Classified (Permanent, Probationary, and Provisional), Partially Exempt, and Exempt
State of Alaska - Workforce Profile 2017
Department of Administration, Division of Personnel & Labor Relations, Employee Planning & Information Center Page 6
Employee Count and Percentage by Location
City Employee Count Percentage
Adak 2 0.01%
Akutan 3 0.02%
Anchor Point 9 0.06%
Anchorage 5199 35.39%
Anchorage International Airport 339 2.31%
Aniak 15 0.10%
Anvik 2 0.01%
Bethel 225 1.53%
Camp Carroll 60 0.41%
Cantwell 13 0.09%
Cascade 4 0.03%
Chandalar (Chandler) Camp 11 0.07%
Chena River 2 0.01%
Chignik 9 0.06%
Chulitna 6 0.04%
Coffman Cove 1 0.01%
Cold Bay 6 0.04%
Coldfoot Camp 5 0.03%
Cordova 57 0.39%
Craig 18 0.12%
Dalton Highway (Roving Crew) 10 0.07%
Deadhorse 14 0.10%
Delta Junction 40 0.27%
Denali 3 0.02%
Dillingham 63 0.43%
Douglas 17 0.12%
Dutch Harbor 18 0.12%
Eagle 5 0.03%
Eagle River 137 0.93%
Eielson Air Force Base 10 0.07%
Emmonak 8 0.05%
Ernestine 7 0.05%
Fairbanks 1565 10.65%
Finger Lake 6 0.04%
Fort Wainwright 6 0.04%
City Employee Count Percentage
Fort Yukon 1 0.01%
Gakona 2 0.01%
Galena 6 0.04%
Girdwood 7 0.05%
Glennallen 26 0.18%
Gustavus 2 0.01%
Haines 43 0.29%
Healy 7 0.05%
Homer 134 0.91%
Hoonah 6 0.04%
Hooper Bay 3 0.02%
Iliamna 3 0.02%
Jim River 6 0.04%
Joint Base Elmendorf-Richardson 169 1.15%
Juneau 2953 20.10%
Kalsin Bay 1 0.01%
Kasilof 1 0.01%
Kenai 267 1.82%
Ketchikan 503 3.42%
King Salmon 49 0.33%
Klawock 6 0.04%
Kodiak 169 1.15%
Kotzebue 37 0.25%
Kulis Air National Guard Base 1 0.01%
Livengood 8 0.05%
Mackenzie Point 365 2.48%
Manley Hot Springs 3 0.02%
McGrath 16 0.11%
Metlakatla 4 0.03%
Montana Creek 7 0.05%
Mount Edgecumbe 56 0.38%
Nancy 1 0.01%
Nelchina 4 0.03%
Nenana 7 0.05%
Nikiski 1 0.01%

Executive Branch Employees: Classified (Permanent, Probationary, and Provisional), Partially Exempt, and Exempt
State of Alaska - Workforce Profile 2017
Department of Administration, Division of Personnel & Labor Relations, Employee Planning & Information Center Page 7
Employee Count and Percentage by Location (cont.)
City Employee Count Percentage
Ninilchik 6 0.04%
Nome 166 1.13%
North Kenai Camp 3 0.02%
Northway 6 0.04%
Palmer 522 3.55%
Paxson 6 0.04%
Pelican 1 0.01%
Petersburg 39 0.27%
Port Moller 11 0.07%
Quartz Creek 4 0.03%
Sag River 10 0.07%
Saint Marys 15 0.10%
Sand Point 4 0.03%
Seattle, Washington 5 0.03%
Selawik 2 0.01%
Seldovia 1 0.01%
Seven Mile Camp 7 0.05%
Seward 252 1.72%
Silvertip 6 0.04%
Sitka 166 1.13%
Skagway 12 0.08%
Slana 7 0.05%
Soldotna 195 1.33%
South Fork 4 0.03%
Sterling 2 0.01%
Talkeetna 2 0.01%
Tazlina 25 0.17%
Tenakee Springs 1 0.01%
Thompson Pass 9 0.06%
Togiak 2 0.01%
Tok 50 0.34%
Trapper Creek 1 0.01%
Trimms Camp 3 0.02%
Unalakleet 7 0.05%
Unalaska 4 0.03%
City Employee Count Percentage
Utqiagvik (Formerly Barrow) 14 0.10%
Valdez 63 0.43%
Washington DC 3 0.02%
Wasilla 236 1.61%
Whittier 5 0.03%
Willow 9 0.06%
Wrangell 21 0.14%
Yakutat 16 0.11%

Executive Branch Employees: Classified (Permanent, Probationary, and Provisional), Partially Exempt, and Exempt
State of Alaska - Workforce Profile 2017
Department of Administration, Division of Personnel & Labor Relations, Employee Planning & Information Center Page 8
Department Males Females
Office of the Governor 39 30.0% 91 70.0%
Administration 366 40.8% 530 59.2%
Commerce, Community and Economic Development 181 41.3% 257 58.7%
Corrections 1069 62.1% 652 37.9%
Education and Early Development 101 37.3% 170 62.7%
Environmental Conservation 211 45.3% 255 54.7%
Fish and Game 740 57.1% 556 42.9%
Health and Social Services 920 30.3% 2119 69.7%
Labor and Workforce Development 232 35.4% 423 64.6%
Law 152 33.0% 309 67.0%
Military and Veterans Affairs 163 66.0% 84 34.0%
Natural Resources 458 56.8% 349 43.2%
Public Safety 521 68.2% 243 31.8%
Revenue 182 38.2% 295 61.8%
Transportation and Public Facilities 2266 74.9% 758 25.1%
Statewide 7601 51.7% 7091 48.3%
Employee Count by Department and Gender
Chart of Employee Count by Department and Gender
0.0% 10.0% 20.0% 30.0% 40.0% 50.0% 60.0% 70.0% 80.0%
Office of the Governor
Administration
Commerce, Community and Economic Development
Corrections
Education and Early Development
Environmental Conservation
Fish and Game
Health and Social Services
Labor and Workforce Development
Law
Military and Veterans Affairs
Natural Resources
Public Safety
Revenue
Transportation and Public Facilities
Males
Females
Executive Branch Employees: Classified (Permanent, Probationary, and Provisional), Partially Exempt, and Exempt
State of Alaska - Workforce Profile 2017
Department of Administration, Division of Personnel & Labor Relations, Employee Planning & Information Center Page 9
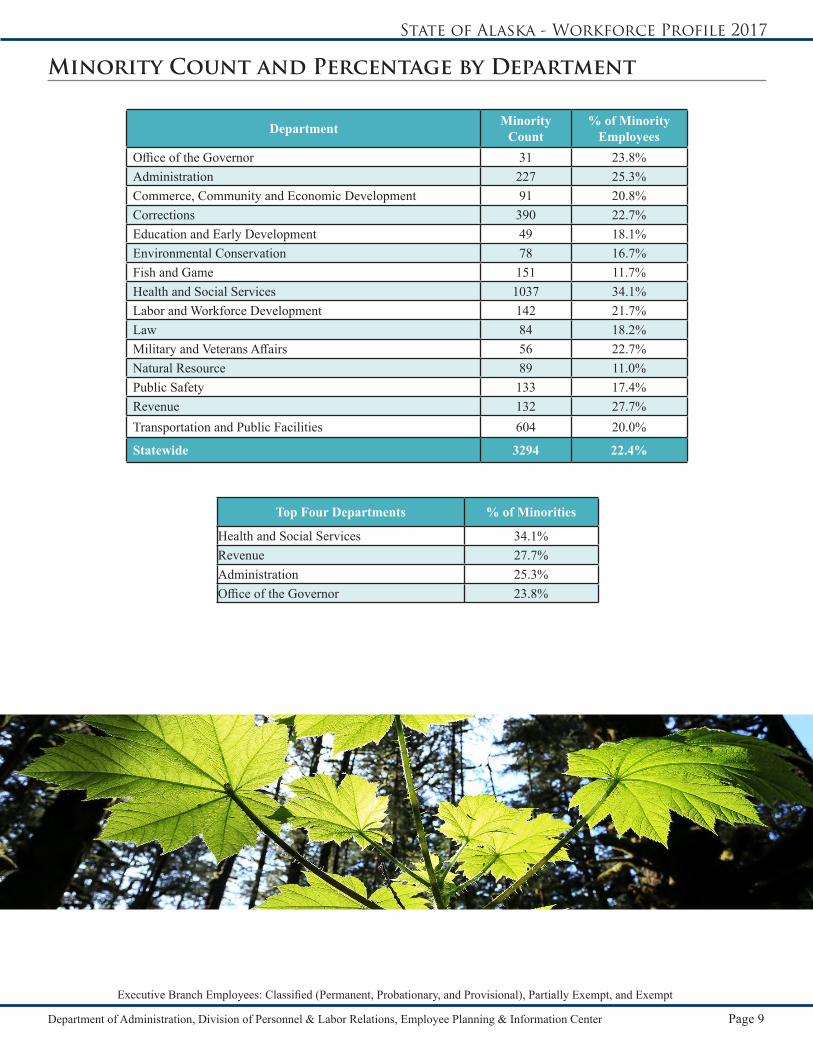
Minority Count and Percentage by Department
Department Minority Count
% of Minority Employees
Office of the Governor 31 23.8%Administration 227 25.3%Commerce, Community and Economic Development 91 20.8%Corrections 390 22.7%Education and Early Development 49 18.1%Environmental Conservation 78 16.7%Fish and Game 151 11.7%Health and Social Services 1037 34.1%Labor and Workforce Development 142 21.7%Law 84 18.2%Military and Veterans Affairs 56 22.7%Natural Resource 89 11.0%Public Safety 133 17.4%Revenue 132 27.7%Transportation and Public Facilities 604 20.0%
Statewide 3294 22.4%
Top Four Departments % of Minorities
Health and Social Services 34.1%Revenue 27.7%Administration 25.3%Office of the Governor 23.8%

Executive Branch Employees: Classified (Permanent, Probationary, and Provisional), Partially Exempt, and Exempt
State of Alaska - Workforce Profile 2017
Department of Administration, Division of Personnel & Labor Relations, Employee Planning & Information Center Page 10
Department New Hire Count
Average Age of New Hire
Average Age of New Hire
Male FemaleOffice of the Governor 13 37.9 38.0 37.9Administration 85 36.8 37.8 36.0Commerce, Community and Economic Development 53 38.1 37.4 38.5Corrections 167 36.3 36.5 36.2
Education and Early Development 29 35.5 33.8 36.3Environmental Conservation 41 37.1 40.3 35.9Fish and Game 160 30.3 30.1 30.5Health and Social Services 334 38.4 39.9 37.8Labor and Workforce Development 83 42.2 45.7 39.6Law 50 34.1 35.3 33.5Military and Veterans Affairs 36 39.6 43.5 31.6Natural Resources 90 37.7 36.9 39.2Public Safety 51 33.1 32.7 33.9Revenue 50 33.5 33.4 33.6Transportation and Public Facilities 234 38.4 38.4 38.2
Statewide 1476 36.8 37.3 36.3
New hire counts are permanent employees hired into existing and/or new positions within the fiscal year, and who are still employed at the end of the fiscal year.
New Hire Highest Average Age Lowest Average Age
Overall Average Labor and Workforce Development (42.2) Fish and Game (30.3)
Male Labor and Workforce Development (45.7) Fish and Game (30.1)
Female Labor and Workforce Development (39.6) Fish and Game (30.5)
New Hire Data
Executive Branch Employees: Classified (Permanent, Probationary, and Provisional), Partially Exempt, and Exempt
State of Alaska - Workforce Profile 2017
Department of Administration, Division of Personnel & Labor Relations, Employee Planning & Information Center Page 11
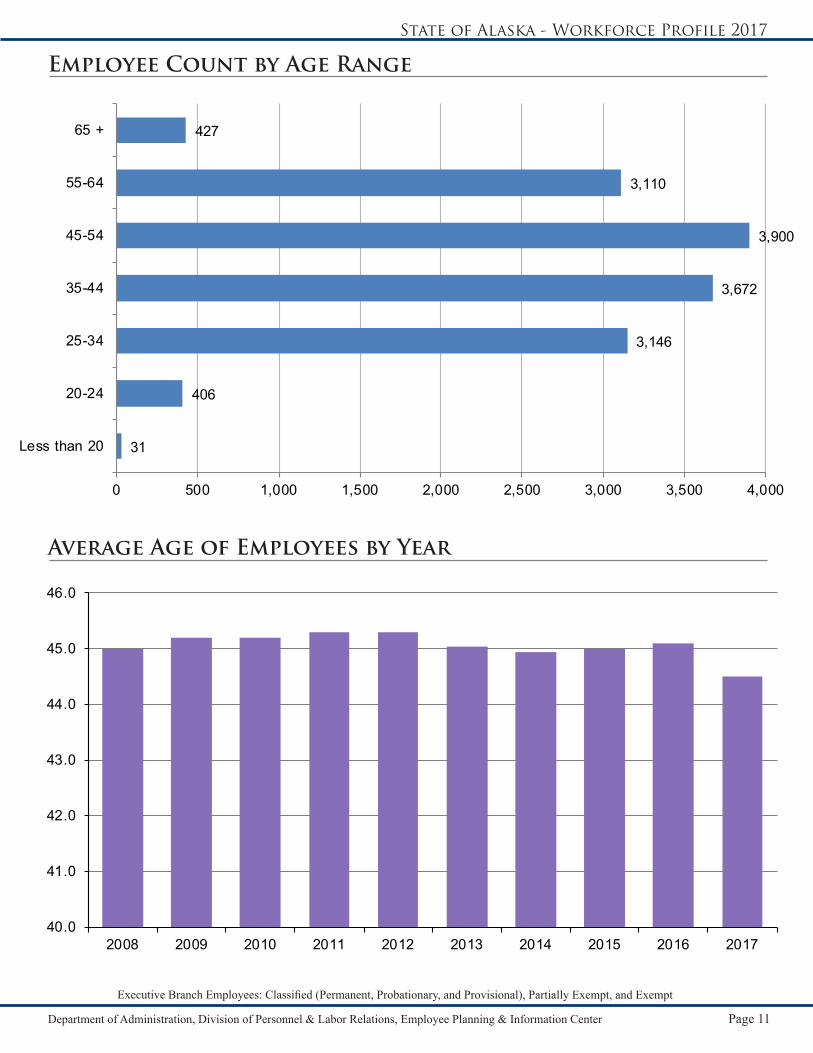
Employee Count by Age Range
Average Age of Employees by Year
31
406
3,146
3,672
3,900
3,110
427
0 500 1,000 1,500 2,000 2,500 3,000 3,500 4,000
Less than 20
20-24
25-34
35-44
45-54
55-64
65 +
40.0
41.0
42.0
43.0
44.0
45.0
46.0
2008 2009 2010 2011 2012 2013 2014 2015 2016 2017

Executive Branch Employees: Classified (Permanent, Probationary, and Provisional), Partially Exempt, and Exempt
State of Alaska - Workforce Profile 2017
Department of Administration, Division of Personnel & Labor Relations, Employee Planning & Information Center Page 12
Department Average AgeAverage Age
Male Female
Office of the Governor 45.2 44.5 45.5Administration 43.6 44.2 43.3Commerce, Community and Economic Development 45.3 46.8 44.2Corrections 43.0 42.8 43.3Education and Early Development 45.3 45.9 45.0Environmental Conservation 43.9 45.7 42.5Fish and Game 41.4 42.6 40.0Health and Social Services 45.4 45.7 45.2Labor and Workforce Development 47.9 48.1 47.8Law 42.8 43.7 42.3Military and Veterans Affairs 46.7 47.8 44.5Natural Resources 44.3 43.9 44.9Public Safety 42.1 41.7 43.1Revenue 43.7 42.8 44.2Transportation and Public Facilities 46.0 46.1 45.9Statewide 44.5 44.7 44.3
Employees Highest Average Age Lowest Average Age
Overall Average Labor and Workforce Development (47.9) Fish and Game (41.4)
Male Average Labor and Workforce Development (48.1) Public Safety (41.7)
Female Average Labor and Workforce Development (47.8) Fish and Game (40.0)
Average Age by Department and Gender

Executive Branch Employees: Classified (Permanent, Probationary, and Provisional), Partially Exempt, and Exempt
State of Alaska - Workforce Profile 2017
Department of Administration, Division of Personnel & Labor Relations, Employee Planning & Information Center Page 13
Bargaining Unit Average Age
AK Vocational Technical Center Teachers 52.3
Confidential Employees 42.5
Correctional Officers 40.9
Excluded Employees 47.0
Exempt / Partially Exempt Employees 45.9
General Government Employees 43.3
Inlandboatmen 47.8
Labor, Trades and Crafts Employees 47.2
Marine Engineers 50.8
Masters, Mates and Pilots 43.6
Mt. Edgecumbe Teachers 42.4
Public Safety Officers 39.7
Supervisory Employees 47.6
Average Age by Bargaining Unit
Average Age by Bargaining Unit ChartChart of Average Age by Bargaining Unit
52.3
42.5
40.9
47.0
45.9
43.3
47.8
47.2
50.8
43.6
42.4
39.7
47.6
0.0 5.0 10.0 15.0 20.0 25.0 30.0 35.0 40.0 45.0 50.0 55.0
AK Vocational Technical Center Teachers
Confidential Employees
Correctional Officers
Excluded Employees
Exempt / Partially Exempt Employees
General Government Employees
Inlandboatmen
Labor, Trades and Crafts Employees
Marine Engineers
Masters, Mates and Pilots
Mt. Edgecumbe Teachers
Public Safety Officers
Supervisory Employees
Executive Branch Employees: Classified (Permanent, Probationary, and Provisional), Partially Exempt, and Exempt
State of Alaska - Workforce Profile 2017
Department of Administration, Division of Personnel & Labor Relations, Employee Planning & Information Center Page 14
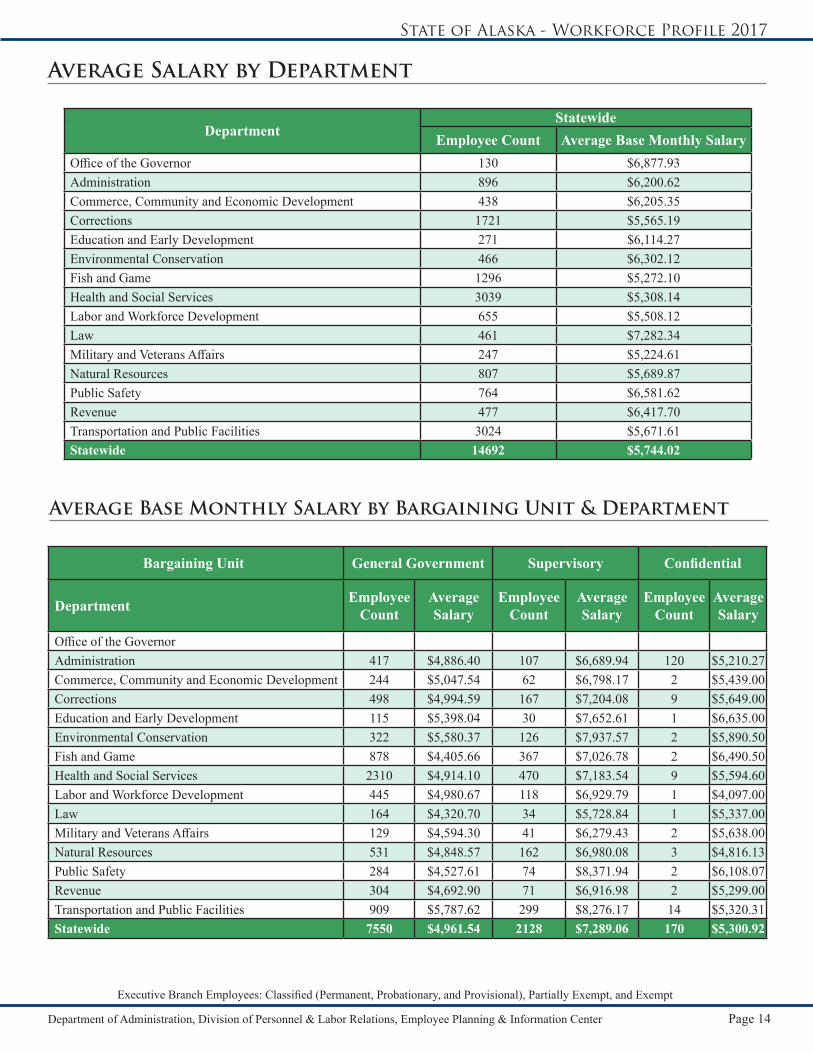
Average Salary by Department
DepartmentStatewide
Employee Count Average Base Monthly SalaryOffice of the Governor 130 $6,877.93Administration 896 $6,200.62Commerce, Community and Economic Development 438 $6,205.35Corrections 1721 $5,565.19Education and Early Development 271 $6,114.27Environmental Conservation 466 $6,302.12Fish and Game 1296 $5,272.10Health and Social Services 3039 $5,308.14Labor and Workforce Development 655 $5,508.12Law 461 $7,282.34Military and Veterans Affairs 247 $5,224.61Natural Resources 807 $5,689.87Public Safety 764 $6,581.62Revenue 477 $6,417.70Transportation and Public Facilities 3024 $5,671.61Statewide 14692 $5,744.02
Average Base Monthly Salary by Bargaining Unit & Department
Bargaining Unit General Government Supervisory Confidential
Department Employee Count
Average Salary
Employee Count
Average Salary
Employee Count
Average Salary
Office of the GovernorAdministration 417 $4,886.40 107 $6,689.94 120 $5,210.27Commerce, Community and Economic Development 244 $5,047.54 62 $6,798.17 2 $5,439.00Corrections 498 $4,994.59 167 $7,204.08 9 $5,649.00Education and Early Development 115 $5,398.04 30 $7,652.61 1 $6,635.00Environmental Conservation 322 $5,580.37 126 $7,937.57 2 $5,890.50Fish and Game 878 $4,405.66 367 $7,026.78 2 $6,490.50Health and Social Services 2310 $4,914.10 470 $7,183.54 9 $5,594.60Labor and Workforce Development 445 $4,980.67 118 $6,929.79 1 $4,097.00Law 164 $4,320.70 34 $5,728.84 1 $5,337.00Military and Veterans Affairs 129 $4,594.30 41 $6,279.43 2 $5,638.00Natural Resources 531 $4,848.57 162 $6,980.08 3 $4,816.13Public Safety 284 $4,527.61 74 $8,371.94 2 $6,108.07Revenue 304 $4,692.90 71 $6,916.98 2 $5,299.00Transportation and Public Facilities 909 $5,787.62 299 $8,276.17 14 $5,320.31Statewide 7550 $4,961.54 2128 $7,289.06 170 $5,300.92

Executive Branch Employees: Classified (Permanent, Probationary, and Provisional), Partially Exempt, and Exempt
State of Alaska - Workforce Profile 2017
Department of Administration, Division of Personnel & Labor Relations, Employee Planning & Information Center Page 15
Bargaining Unit Labor, Trades and Crafts Correctional Officers Public Safety Officers
Department Employee Count
Average Salary
Employee Count
Average Salary
Employee Count
Average Salary
Office of the GovernorAdministration 23 $4,761.51Commerce, Community and Economic DevelopmentCorrections 121 $4,426.52 901 $5,575.70Education and Early Development 5 $4,478.18Environmental Conservation 7 $4,858.52Fish and Game 11 $5,073.70Health and Social Services 192 $3,422.71Labor and Workforce Development 37 $4,900.82LawMilitary and Veterans Affairs 51 $4,551.15Natural Resources 45 $4,231.79Public Safety 14 $4,355.58 378 $7,754.35RevenueTransportation and Public Facilities 1087 $4,825.28 79 $6,296.36Statewide 1593 $4,597.88 901 $5,575.70 457 $7,502.31
Bargaining Unit Marine Engineers Masters, Mates and Pilots Inlandboatmen
Department Employee Count
Average Salary
Employee Count
Average Salary
Employee Count
Average Salary
Office of the GovernorAdministrationCommerce, Community and Economic DevelopmentCorrectionsEducation and Early DevelopmentEnvironmental ConservationFish and GameHealth and Social ServicesLabor and Workforce DevelopmentLawMilitary and Veterans AffairsNatural ResourcesPublic SafetyRevenueTransportation and Public Facilities 77 $7,189.78 92 $7,307.72 438 $4,768.67Statewide 77 $7,189.78 92 $7,307.72 438 $4,768.67
Average Base Monthly Salary by Bargaining Unit & Department (cont.)

Executive Branch Employees: Classified (Permanent, Probationary, and Provisional), Partially Exempt, and Exempt
State of Alaska - Workforce Profile 2017
Department of Administration, Division of Personnel & Labor Relations, Employee Planning & Information Center Page 16
Bargaining Unit Excluded Exempt /Partially Exempt
Department Employee Count
Average Salary
Employee Count Average Salary
Office of the Governor 130 $6,877.93Administration 229 $9,028.60Commerce, Community and Economic Development 130 $8,107.53Corrections 25 $11,086.24Education and Early Development 90 $6,925.64Environmental Conservation 9 $10,442.56Fish and Game 38 $8,338.24Health and Social Services 58 $12,001.64Labor and Workforce Development 3 $6,900.09 23 $7,763.18Law 262 $9,345.21Military and Veterans Affairs 24 $8,207.24Natural Resources 66 $10,325.46Public Safety 12 $9,887.83Revenue 100 $11,328.97Transportation and Public Facilities 29 $9,788.27Statewide 3 $6,900.09 1225 $9,031.77
Bargaining Unit AK Vocational Technical Teachers Mt. Edgecumbe Teachers
Department Employee Count
Average Salary
Employee Count Average Salary
Office of the GovernorAdministrationCommerce, Community and Economic DevelopmentCorrectionsEducation and Early Development 30 $5,142.67Environmental ConservationFish and GameHealth and Social ServicesLabor and Workforce Development 28 $6,750.73LawMilitary and Veterans AffairsNatural ResourcesPublic SafetyRevenueTransportation and Public FacilitiesStatewide 28 $6,750.73 30 $5,142.67
Average Base Monthly Salary by Bargaining Unit & Department (cont.)

Executive Branch Employees: Classified (Permanent, Probationary, and Provisional), Partially Exempt, and Exempt
State of Alaska - Workforce Profile 2017
Department of Administration, Division of Personnel & Labor Relations, Employee Planning & Information Center Page 17
Department Average State Service Male Female
Office of the Governor 8.23 8.45 8.13
Administration 9.57 9.35 9.73
Commerce, Community and Economic Development 8.71 8.71 8.71
Corrections 8.54 8.81 8.09
Education and Early Development 10.62 10.20 10.87
Environmental Conservation 9.88 10.41 9.45
Fish and Game 9.27 10.32 7.89
Health and Social Services 9.01 9.32 8.87
Labor and Workforce Development 10.30 9.26 10.88
Law 9.65 9.64 9.66
Military and Veterans Affairs 8.10 8.08 8.14
Natural Resources 9.19 8.75 9.75
Public Safety 10.71 11.10 9.85
Revenue 9.64 9.32 9.84
Transportation and Public Facilities 9.84 9.95 9.51
Statewide 9.40 9.62 9.17
Bargaining Unit Average State Service
AK Vocational Technical Center Teachers 9.07Confidential Employees 9.69Correctional Officers 8.36Excluded Employees 17.76Exempt / Partially Exempt Employees 10.02General Government Employees 8.26Inlandboatmen 8.38Labor, Trades and Crafts Employees 8.99Marine Engineers Not AvailableMasters, Mates and Pilots 12.18Mt. Edgecumbe Teachers 9.55Public Safety Officers 10.85Supervisory Employees 13.58
Average State Service by Department and Gender
Average State Service by Bargaining Unit

Executive Branch Employees: Classified (Permanent, Probationary, and Provisional), Partially Exempt, and Exempt
State of Alaska - Workforce Profile 2017
Department of Administration, Division of Personnel & Labor Relations, Employee Planning & Information Center Page 18
Retirement Projections
Eligible to Retire
DepartmentTotal
Employees in R&B System
Less than 1 Year
% Less than 1 Year
Between 1 and 5 Years
% Between 1 and 5 Years
More than 5 Years
No Retirement
Date Available
Office of the Governor 130 13 10.0% 7 5.4% 24 86Administration 896 85 9.5% 74 8.3% 219 518Commerce, Community and Economic Development 438 56 12.8% 38 8.7% 86 258Corrections 1721 166 9.6% 199 11.6% 267 1089Education and Early Development 271 30 11.1% 32 11.8% 90 119Environmental Conservation 466 49 10.5% 44 9.4% 112 261Fish and Game 1296 128 9.9% 92 7.1% 385 691Health and Social Services 3039 320 10.5% 250 8.2% 655 1814Labor and Workforce Development 655 94 14.4% 71 10.8% 159 331Law 461 45 9.8% 33 7.2% 109 274Military and Veterans Affairs 247 22 8.9% 19 7.7% 53 153Natural Resources 807 83 10.3% 78 9.7% 198 448Public Safety 764 113 14.8% 109 14.3% 169 373Revenue 477 44 9.2% 36 7.5% 122 275Transportation and Public Facilities 3024 361 11.9% 290 9.6% 739 1634
Statewide 14692 1609 11.0% 1372 9.3% 3387 8324
Employees in the licensed engineers bargaining unit, some employees on approved leave without pay on June 30, 2017 and other records being audited by Retirement & Benefits at the time of this report are not included in these calculations.
Tier 4 employees hired on July 1, 2006 or after are included in the “No Retirement Date Available” column.
Calculations are based on retirement dates projected by Division of Retirement & Benefits.
Percentage of Employees by Retirement Projection Category
Retirement Projections by Department
Less than 1 Year11%
Between 1 and 5 Years
9%
More than 5 Years23%
No Retirement Date Available
57%

Executive Branch Employees: Classified (Permanent, Probationary, and Provisional), Partially Exempt, and Exempt
State of Alaska - Workforce Profile 2017
Department of Administration, Division of Personnel & Labor Relations, Employee Planning & Information Center Page 19
DepartmentTotal
Employee Count
Less than
1 Year
1-2 Years
2-3 Years
3-4 Years
4-5 Years
5-6 Years
6-7 Years
7-8 Years
More than 8 Years
Office of the Governor 81 10 9 14 9 9 9 4 9 8
Administration 506 67 62 60 61 56 52 43 31 74
Commerce, Community and Economic Development 252 39 33 21 36 33 21 24 9 36
Corrections 1077 133 131 121 170 168 82 60 39 173
Education and Early Development 91 24 9 8 9 14 5 3 2 17
Environmental Conservation 256 32 25 32 31 28 29 21 20 38
Fish and Game 638 211 90 65 56 58 41 31 29 57
Health and Social Services 1774 257 224 233 185 184 162 124 116 289
Labor and Workforce Development 328 56 33 35 39 24 36 24 25 56
Law 260 33 27 23 31 29 29 21 22 45
Military and Veterans Affairs 150 27 22 13 10 10 15 15 11 27
Natural Resources 432 84 58 49 49 40 41 22 33 56
Public Safety 367 46 28 38 39 42 29 31 28 86
Revenue 270 38 31 29 27 39 23 21 14 48
Transportation and Public Facilities 1541 219 172 209 202 152 163 121 95 208
Total 8023 1276 954 950 954 886 737 565 483 1218
Tier 4 began July 1, 2006
Percentage of Tier 4 Employees by Years of State Service
Tier 4 Employees Years of State service
Less than 1 Year16%
1-2 Years12%
2-3 Years12%
3-4 Years12%
4-5 Years11%
5-6 Years9%
6-7 Years7%
7-8 Years6%
More than 8 Years15%
Retirement Projections by Department & Job Class Family
Executive Branch Employees: Classified (Permanent, Probationary, and Provisional), Partially Exempt, and Exempt
Department of Administration, Division of Personnel & Labor Relations, Employee Planning & Information Center Page 20
State of Alaska - Workforce Profile 2017
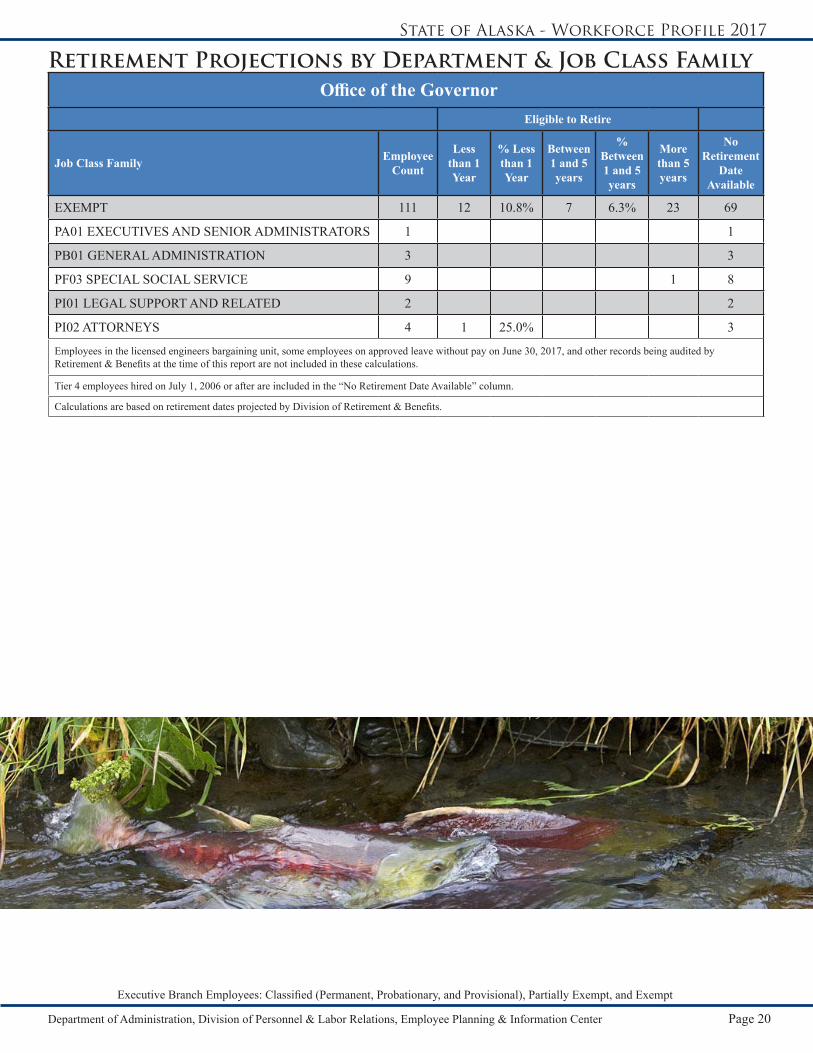
Office of the GovernorEligible to Retire
Job Class Family Employee Count
Less than 1 Year
% Less than 1 Year
Between 1 and 5 years
% Between 1 and 5 years
More than 5 years
No Retirement
Date Available
EXEMPT 111 12 10.8% 7 6.3% 23 69
PA01 EXECUTIVES AND SENIOR ADMINISTRATORS 1 1
PB01 GENERAL ADMINISTRATION 3 3
PF03 SPECIAL SOCIAL SERVICE 9 1 8
PI01 LEGAL SUPPORT AND RELATED 2 2
PI02 ATTORNEYS 4 1 25.0% 3
Employees in the licensed engineers bargaining unit, some employees on approved leave without pay on June 30, 2017, and other records being audited by Retirement & Benefits at the time of this report are not included in these calculations.
Tier 4 employees hired on July 1, 2006 or after are included in the “No Retirement Date Available” column.
Calculations are based on retirement dates projected by Division of Retirement & Benefits.

Retirement Projections by Department & Job Class Family
Executive Branch Employees: Classified (Permanent, Probationary, and Provisional), Partially Exempt, and Exempt
Department of Administration, Division of Personnel & Labor Relations, Employee Planning & Information Center Page 21
State of Alaska - Workforce Profile 2017
Department of AdministrationEligible to Retire
Job Class Family Employee Count
Less than 1 Year
% Less than 1 Year
Between 1 and 5 years
% Between 1 and 5 years
More than 5 years
No Retirement
Date Available
EXEMPT 27 5 18.5% 4 14.8% 1 17
PA01 EXECUTIVES AND SENIOR ADMINISTRATORS 17 2 11.8% 4 23.5% 7 4
PB01 GENERAL ADMINISTRATION 52 9 17.3% 2 3.8% 8 33
PB02 ACCOUNTING AND FISCAL 69 7 10.1% 11 15.9% 27 24
PB03 PERSONNEL AND EMPLOYEE RELATIONS 156 13 8.3% 14 9.0% 37 92
PB04 INFORMATION TECHNOLOGY 91 9 9.9% 10 11.0% 34 38
PB05 STATISTICS AND RESEARCH ANALYSIS 2 1 1
PB06 SUPPLY 23 3 13.0% 2 8.7% 4 14
PB07 OFFICE OF INFORMATION TECHNOLOGY 2 2
PB99 ADMINISTRATIVE CLASSES NOT OTHERWISE DESCRIBED 14 2 14.3% 5 7
PC05 REVENUE AND AUDIT 2 1 1
PD01 GOVERNMENT MANAGEMENT AND OPERATIONS 1 1
PD09 PROPERTY MANAGEMENT 2 2
PE02 TEACHING AND INSTRUCTION 4 2 2
PE06 ARTS, PHOTOGRAPHY AND INFORMATION 4 1 3
PF02 SOCIAL WORK 1 1
PF03 SPECIAL SOCIAL SERVICE 17 3 17.6% 1 5.9% 8 5
PH03 NATURAL RESOURCES AND FORESTRY 1 1
PI01 LEGAL SUPPORT AND RELATED 68 1 1.5% 2 2.9% 8 57
PI02 ATTORNEYS 162 11 6.8% 10 6.2% 42 99
PI03 JUDGES AND ADJUDICATORS 12 4 33.3% 4 4
PI04 EVIDENCE INVESTIGATION 17 5 29.4% 1 5.9% 2 9
PI05 LEGAL DOCUMENT PROCESSING 111 5 4.5% 9 8.1% 21 76
PK03 ENGINEERING, UNLICENSED 5 5
PK04 ENGINEERING, LICENSED 1 1 100.0%
PL04 BUILDING AND FACILITY MAINTENANCE 22 2 9.1% 2 9.1% 1 17
PL08 OFFICE EQUIPMENT OPERATION 13 5 38.5% 4 4
Employees in the licensed engineers bargaining unit, some employees on approved leave without pay on June 30, 2017, and other records being audited by Retirement & Benefits at the time of this report are not included in these calculations.
Tier 4 employees hired on July 1, 2006 or after are included in the “No Retirement Date Available” column.
Calculations are based on retirement dates projected by Division of Retirement & Benefits.

Retirement Projections by Department & Job Class Family
Executive Branch Employees: Classified (Permanent, Probationary, and Provisional), Partially Exempt, and Exempt
Department of Administration, Division of Personnel & Labor Relations, Employee Planning & Information Center Page 22
State of Alaska - Workforce Profile 2017
Department of Commerce, Community and Economic DevelopmentEligible to Retire
Job Class Family Employee Count
Less than 1 Year
% Less than 1 Year
Between 1 and 5 years
% Between 1 and 5 years
More than 5 years
No Retirement
Date Available
EXEMPT 109 15 13.8% 9 8.3% 18 67
PA01 EXECUTIVES AND SENIOR ADMINISTRATORS 14 2 14.3% 3 21.4% 1 8
PB01 GENERAL ADMINISTRATION 49 2 4.1% 1 2.0% 9 37
PB02 ACCOUNTING AND FISCAL 29 4 13.8% 7 18
PB03 PERSONNEL AND EMPLOYEE RELATIONS 2 1 1
PB04 INFORMATION TECHNOLOGY 22 1 4.5% 5 22.7% 7 9
PB05 STATISTICS AND RESEARCH ANALYSIS 5 1 20.0% 1 3
PB06 SUPPLY 2 1 50.0% 1
PB99 ADMINISTRATIVE CLASSES NOT OTHERWISE DESCRIBED 6 2 33.3% 1 3
PC01 BUSINESS FINANCE 22 1 4.5% 2 9.1% 8 11
PC02 BUSINESS REGULATION AND COMPLIANCE 90 11 12.2% 7 7.8% 15 57
PC05 REVENUE AND AUDIT 1 1
PD01 GOVERNMENT MANAGEMENT AND OPERATIONS 28 9 32.1% 3 10.7% 5 11
PD03 DEVELOPMENT AND INFRASTRUCTURE 2 1 50.0% 1
PD06 FERRY SYSTEM ADMINISTRATION 1 1
PD08 REAL ESTATE APPRAISAL 2 1 50.0% 1 50.0%
PE06 ARTS, PHOTOGRAPHY AND INFORMATION 4 1 25.0% 1 2
PG03 NURSING, PROFESSIONAL 2 1 50.0% 1
PI01 LEGAL SUPPORT AND RELATED 10 1 10.0% 1 10.0% 2 6
PI03 JUDGES AND ADJUDICATORS 4 2 50.0% 1 1
PI04 EVIDENCE INVESTIGATION 31 3 9.7% 2 6.5% 5 21
PK03 ENGINEERING, UNLICENSED 3 1 33.3% 1 1Employees in the licensed engineers bargaining unit, some employees on approved leave without pay on June 30, 2017, and other records being audited by Retirement & Benefits at the time of this report are not included in these calculations.Tier 4 employees hired on July 1, 2006 or after are included in the “No Retirement Date Available” column.
Calculations are based on retirement dates projected by Division of Retirement & Benefits.

Retirement Projections by Department & Job Class Family
Executive Branch Employees: Classified (Permanent, Probationary, and Provisional), Partially Exempt, and Exempt
Department of Administration, Division of Personnel & Labor Relations, Employee Planning & Information Center Page 23
State of Alaska - Workforce Profile 2017
Department of CorrectionsEligible to Retire
Job Class Family Employee Count
Less than 1 Year
% Less than 1 Year
Between 1 and 5 years
% Between 1 and 5 years
More than 5 years
No Retirement
Date Available
EXEMPT 17 2 11.8% 1 5.9% 1 13
PA01 EXECUTIVES AND SENIOR ADMINISTRATORS 9 1 11.1% 1 11.1% 5 2
PB01 GENERAL ADMINISTRATION 81 10 12.3% 3 3.7% 14 54
PB02 ACCOUNTING AND FISCAL 32 2 6.3% 1 3.1% 8 21
PB03 PERSONNEL AND EMPLOYEE RELATIONS 9 2 22.2% 3 4
PB04 INFORMATION TECHNOLOGY 14 1 7.1% 2 14.3% 3 8
PB05 STATISTICS AND RESEARCH ANALYSIS 2 2
PB06 SUPPLY 19 3 15.8% 5 11
PB99 ADMINISTRATIVE CLASSES NOT OTHERWISE DESCRIBED 1 1
PD09 PROPERTY MANAGEMENT 3 1 33.3% 1 33.3% 1
PE01 EDUCATION PROGRAMS 17 3 17.6% 5 29.4% 1 8
PE02 TEACHING AND INSTRUCTION 5 5
PF02 SOCIAL WORK 4 1 25.0% 1 25.0% 1 1
PF03 SPECIAL SOCIAL SERVICE 2 2
PG01 HEALTH ADMINISTRATION 7 1 14.3% 1 5
PG03 NURSING, PROFESSIONAL 116 5 4.3% 8 6.9% 11 92
PG04 MEDICAL, PROFESSIONAL 11 1 9.1% 1 9
PG05 MENTAL AND BEHAVIORAL HEALTH SERVICES 29 3 10.3% 1 3.4% 5 20
PG06 SPECIAL HEALTH SERVICES 5 2 40.0% 2 1
PI01 LEGAL SUPPORT AND RELATED 63 8 12.7% 3 4.8% 10 42
PJ03 CORRECTIONS 951 96 10.1% 128 13.5% 126 601
PJ04 PROBATION AND PAROLE 197 16 8.1% 23 11.7% 56 102
PL01 FOOD AND CUSTODIAL SERVICES 60 4 6.7% 7 11.7% 6 43
PL02 AIRCRAFT, AUTOMOBILE, OR VESSEL MAINTENANCE 4 1 25.0% 1 25.0% 2
PL04 BUILDING AND FACILITY MAINTENANCE 58 8 13.8% 8 13.8% 6 36
PL08 OFFICE EQUIPMENT OPERATION 5 5
Employees in the licensed engineers bargaining unit, some employees on approved leave without pay on June 30, 2017, and other records being audited by Retirement & Benefits at the time of this report are not included in these calculations.
Tier 4 employees hired on July 1, 2006 or after are included in the “No Retirement Date Available” column.
Calculations are based on retirement dates projected by Division of Retirement & Benefits.

Retirement Projections by Department & Job Class Family
Executive Branch Employees: Classified (Permanent, Probationary, and Provisional), Partially Exempt, and Exempt
Department of Administration, Division of Personnel & Labor Relations, Employee Planning & Information Center Page 24
State of Alaska - Workforce Profile 2017
Department of Education and Early DevelopmentEligible to Retire
Job Class Family Employee Count
Less than 1 Year
% Less than 1 Year
Between 1 and 5 years
% Between 1 and 5 years
More than 5 years
No Retirement
Date Available
EXEMPT 111 10 9.0% 20 18.0% 30 51
PA01 EXECUTIVES AND SENIOR ADMINISTRATORS 7 4 57.1% 1 14.3% 2
PB01 GENERAL ADMINISTRATION 11 2 18.2% 3 6
PB02 ACCOUNTING AND FISCAL 8 6 2
PB03 PERSONNEL AND EMPLOYEE RELATIONS 1 1
PB04 INFORMATION TECHNOLOGY 9 5 4
PB05 STATISTICS AND RESEARCH ANALYSIS 5 1 20.0% 1 20.0% 3
PB06 SUPPLY 1 1
PB99 ADMINISTRATIVE CLASSES NOT OTHERWISE DESCRIBED 5 2 3
PC01 BUSINESS FINANCE 9 2 22.2% 2 22.2% 5
PC05 REVENUE AND AUDIT 2 2
PD09 PROPERTY MANAGEMENT 2 1 50.0% 1
PE01 EDUCATION PROGRAMS 41 5 12.2% 4 9.8% 12 20
PE03 STUDENT SERVICES 5 1 20.0% 1 3
PE04 LIBRARY AND ARCHIVES 22 4 18.2% 1 4.5% 9 8
PE05 ANTHROPOLOGICAL RESEARCH AND EDUCATION 6 1 16.7% 3 2
PE06 ARTS, PHOTOGRAPHY AND INFORMATION 7 2 5
PF01 PUBLIC PROGRAMS 1 1
PF02 SOCIAL WORK 3 3
PG05 MENTAL AND BEHAVIORAL HEALTH SERVICES 1 1
PH04 PARKS 6 2 4
PK04 ENGINEERING, LICENSED 1 1 100.0%PL02 AIRCRAFT, AUTOMOBILE, OR VESSEL MAINTENANCE 1 1
PL04 BUILDING AND FACILITY MAINTENANCE 5 5
PL08 OFFICE EQUIPMENT OPERATION 1 1 100.0%
Employees in the licensed engineers bargaining unit, some employees on approved leave without pay on June 30, 2017, and other records being audited by Retirement & Benefits at the time of this report are not included in these calculations.
Tier 4 employees hired on July 1, 2006 or after are included in the “No Retirement Date Available” column.
Calculations are based on retirement dates projected by Division of Retirement & Benefits.
Retirement Projections by Department & Job Class Family
Executive Branch Employees: Classified (Permanent, Probationary, and Provisional), Partially Exempt, and Exempt
Department of Administration, Division of Personnel & Labor Relations, Employee Planning & Information Center Page 25
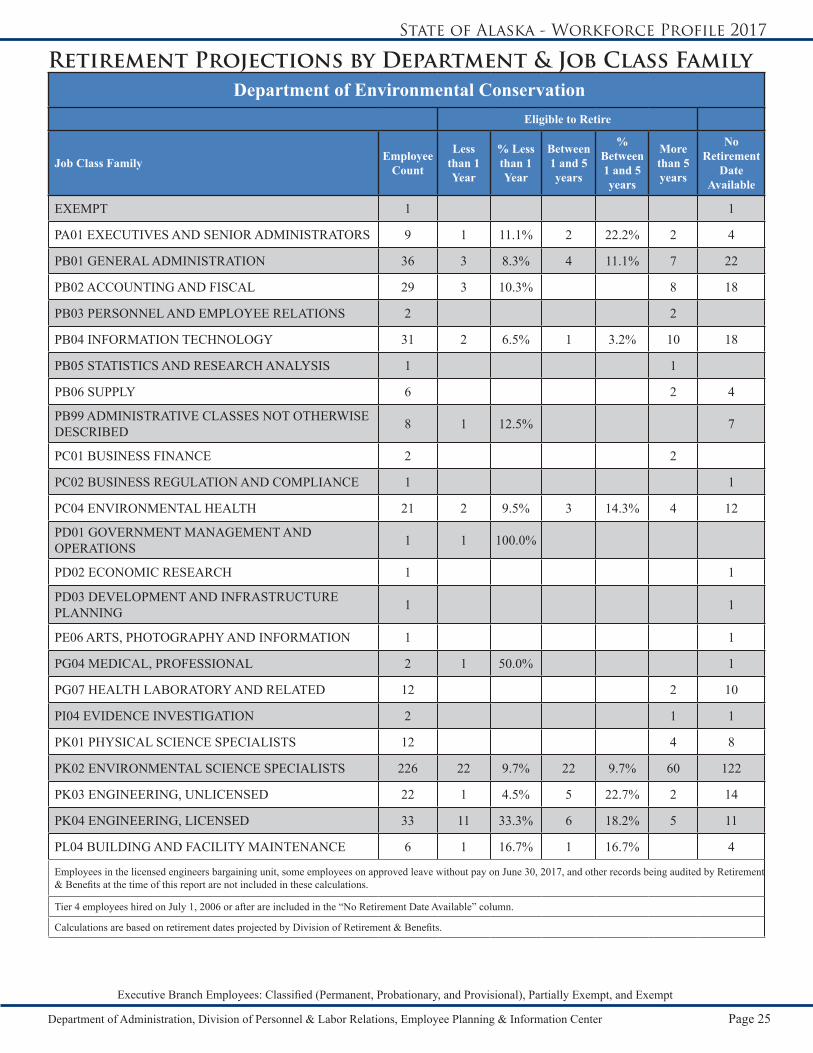
State of Alaska - Workforce Profile 2017
Department of Environmental ConservationEligible to Retire
Job Class Family Employee Count
Less than 1 Year
% Less than 1 Year
Between 1 and 5 years
% Between 1 and 5 years
More than 5 years
No Retirement
Date Available
EXEMPT 1 1
PA01 EXECUTIVES AND SENIOR ADMINISTRATORS 9 1 11.1% 2 22.2% 2 4
PB01 GENERAL ADMINISTRATION 36 3 8.3% 4 11.1% 7 22
PB02 ACCOUNTING AND FISCAL 29 3 10.3% 8 18
PB03 PERSONNEL AND EMPLOYEE RELATIONS 2 2
PB04 INFORMATION TECHNOLOGY 31 2 6.5% 1 3.2% 10 18
PB05 STATISTICS AND RESEARCH ANALYSIS 1 1
PB06 SUPPLY 6 2 4
PB99 ADMINISTRATIVE CLASSES NOT OTHERWISE DESCRIBED 8 1 12.5% 7
PC01 BUSINESS FINANCE 2 2
PC02 BUSINESS REGULATION AND COMPLIANCE 1 1
PC04 ENVIRONMENTAL HEALTH 21 2 9.5% 3 14.3% 4 12
PD01 GOVERNMENT MANAGEMENT AND OPERATIONS 1 1 100.0%
PD02 ECONOMIC RESEARCH 1 1
PD03 DEVELOPMENT AND INFRASTRUCTURE PLANNING 1 1
PE06 ARTS, PHOTOGRAPHY AND INFORMATION 1 1
PG04 MEDICAL, PROFESSIONAL 2 1 50.0% 1
PG07 HEALTH LABORATORY AND RELATED 12 2 10
PI04 EVIDENCE INVESTIGATION 2 1 1
PK01 PHYSICAL SCIENCE SPECIALISTS 12 4 8
PK02 ENVIRONMENTAL SCIENCE SPECIALISTS 226 22 9.7% 22 9.7% 60 122
PK03 ENGINEERING, UNLICENSED 22 1 4.5% 5 22.7% 2 14
PK04 ENGINEERING, LICENSED 33 11 33.3% 6 18.2% 5 11
PL04 BUILDING AND FACILITY MAINTENANCE 6 1 16.7% 1 16.7% 4
Employees in the licensed engineers bargaining unit, some employees on approved leave without pay on June 30, 2017, and other records being audited by Retirement & Benefits at the time of this report are not included in these calculations.
Tier 4 employees hired on July 1, 2006 or after are included in the “No Retirement Date Available” column.
Calculations are based on retirement dates projected by Division of Retirement & Benefits.

Retirement Projections by Department & Job Class Family
Executive Branch Employees: Classified (Permanent, Probationary, and Provisional), Partially Exempt, and Exempt
Department of Administration, Division of Personnel & Labor Relations, Employee Planning & Information Center Page 26
State of Alaska - Workforce Profile 2017
Department of Fish and GameEligible to Retire
Job Class Family Employee Count
Less than 1 Year
% Less than 1 Year
Between 1 and 5 years
% Between 1 and 5 years
More than 5 years
No Retirement
Date Available
EXEMPT 27 5 18.5% 1 3.7% 8 13
PA01 EXECUTIVES AND SENIOR ADMINISTRATORS 14 3 21.4% 4 28.6% 5 2
PB01 GENERAL ADMINISTRATION 77 10 13.0% 7 9.1% 16 44
PB02 ACCOUNTING AND FISCAL 41 2 4.9% 2 4.9% 8 29
PB03 PERSONNEL AND EMPLOYEE RELATIONS 2 1 1
PB04 INFORMATION TECHNOLOGY 60 7 11.7% 4 6.7% 28 21
PB05 STATISTICS AND RESEARCH ANALYSIS 19 2 10.5% 9 8
PB06 SUPPLY 6 1 16.7% 1 16.7% 1 3
PB99 ADMINISTRATIVE CLASSES NOT OTHERWISE DESCRIBED 17 2 11.8% 1 5.9% 10 4
PC02 BUSINESS REGULATION AND COMPLIANCE 1 1
PE01 EDUCATION PROGRAMS 10 1 10.0% 5 4
PE04 LIBRARY AND ARCHIVES 1 1 100.0%
PE05 ANTHROPOLOGICAL RESEARCH AND EDUCATION 15 1 6.7% 1 6.7% 4 9
PE06 ARTS, PHOTOGRAPHY AND INFORMATION 17 3 17.6% 4 23.5% 1 9
PG04 MEDICAL, PROFESSIONAL 1 1 100.0%
PG07 HEALTH LABORATORY AND RELATED 2 1 50.0% 1
PH01 FISH AND WILDLIFE 952 86 9.0% 62 6.5% 279 525
PH03 NATURAL RESOURCES AND FORESTRY 4 1 25.0% 2 1
PK04 ENGINEERING, LICENSED 1 1
PL02 AIRCRAFT, AUTOMOBILE, OR VESSEL MAINTENANCE 2 2
PL04 BUILDING AND FACILITY MAINTENANCE 11 3 27.3% 2 18.2% 1 5
PL07 VESSEL AND AIRCRAFT OPERATION 16 1 6.3% 6 9Employees in the licensed engineers bargaining unit, some employees on approved leave without pay on June 30, 2017, and other records being audited by Retirement & Benefits at the time of this report are not included in these calculations.
Tier 4 employees hired on July 1, 2006 or after are included in the “No Retirement Date Available” column.
Calculations are based on retirement dates projected by Division of Retirement & Benefits.

Retirement Projections by Department & Job Class Family
Executive Branch Employees: Classified (Permanent, Probationary, and Provisional), Partially Exempt, and Exempt
Department of Administration, Division of Personnel & Labor Relations, Employee Planning & Information Center Page 27
State of Alaska - Workforce Profile 2017
Department of Health and Social ServicesEligible to Retire
Job Class Family Employee Count
Less than 1 Year
% Less than 1 Year
Between 1 and 5 years
% Between 1 and 5 years
More than 5 years
No Retirement
Date Available
EXEMPT 37 4 10.8% 3 8.1% 9 21
PA01 EXECUTIVES AND SENIOR ADMINISTRATORS 21 4 19.0% 7 33.3% 7 3
PB01 GENERAL ADMINISTRATION 312 36 11.5% 17 5.4% 57 202
PB02 ACCOUNTING AND FISCAL 81 7 8.6% 12 14.8% 18 44
PB03 PERSONNEL AND EMPLOYEE RELATIONS 9 2 22.2% 2 5
PB04 INFORMATION TECHNOLOGY 105 10 9.5% 13 12.4% 33 49
PB05 STATISTICS AND RESEARCH ANALYSIS 34 1 2.9% 2 5.9% 7 24
PB06 SUPPLY 18 2 11.1% 7 9
PB99 ADMINISTRATIVE CLASSES NOT OTHERWISE DESCRIBED 55 6 10.9% 6 10.9% 12 31
PC01 BUSINESS FINANCE 16 3 18.8% 3 18.8% 6 4
PC02 BUSINESS REGULATION AND COMPLIANCE 61 7 11.5% 2 3.3% 18 34
PC03 SAFETY INSPECTION 1 1 100.0%
PC05 REVENUE AND AUDIT 14 2 14.3% 1 7.1% 2 9
PD03 DEVELOPMENT AND INFRASTRUCTURE PLANNING 1 1
PD04 EMERGENCY PLANNING AND RESPONSE 5 5
PD09 PROPERTY MANAGEMENT 6 2 33.3% 1 16.7% 1 2
PE02 TEACHING AND INSTRUCTION 8 2 6
PE03 STUDENT SERVICES 2 1 50.0% 1
PE06 ARTS, PHOTOGRAPHY AND INFORMATION 9 4 5
PF01 PUBLIC PROGRAMS 432 41 9.5% 44 10.2% 115 232
PF02 SOCIAL WORK 351 24 6.8% 12 3.4% 68 247
PF03 SPECIAL SOCIAL SERVICE 10 1 10.0% 9
PF05 LABOR AND EMPLOYMENT SERVICES 27 6 22.2% 2 7.4% 7 12
PG01 HEALTH ADMINISTRATION 187 25 13.4% 16 8.6% 43 103
PG02 NURSING, ASSISTIVE 328 31 9.5% 24 7.3% 52 221
PG03 NURSING, PROFESSIONAL 247 32 13.0% 18 7.3% 33 164
PG04 MEDICAL, PROFESSIONAL 11 1 9.1% 2 8
PG05 MENTAL AND BEHAVIORAL HEALTH SERVICES 51 13 25.5% 3 5.9% 9 26
Employees in the licensed engineers bargaining unit, some employees on approved leave without pay on June 30, 2017, and other records being audited by Retirement & Benefits at the time of this report are not included in these calculations.
Tier 4 employees hired on July 1, 2006 or after are included in the “No Retirement Date Available” column.
Calculations are based on retirement dates projected by Division of Retirement & Benefits.

Retirement Projections by Department & Job Class Family
Executive Branch Employees: Classified (Permanent, Probationary, and Provisional), Partially Exempt, and Exempt
Department of Administration, Division of Personnel & Labor Relations, Employee Planning & Information Center Page 28
State of Alaska - Workforce Profile 2017
Department of Health and Social ServicesEligible to Retire
Job Class Family Employee Count
Less than 1 Year
% Less than 1 Year
Between 1 and 5 years
% Between 1 and 5 years
More than 5 years
No Retirement
Date Available
PG06 SPECIAL HEALTH SERVICES 35 2 5.7% 6 17.1% 9 18
PG07 HEALTH LABORATORY AND RELATED 29 4 13.8% 2 6.9% 3 20
PI01 LEGAL SUPPORT AND RELATED 11 3 8
PI04 EVIDENCE INVESTIGATION 20 3 15.0% 9 8
PJ03 CORRECTIONS 220 17 7.7% 13 5.9% 67 123
PJ04 PROBATION AND PAROLE 88 9 10.2% 15 17.0% 22 42
PK01 PHYSICAL SCIENCE SPECIALISTS 2 2
PL01 FOOD AND CUSTODIAL SERVICES 150 21 14.0% 20 13.3% 18 91
PL04 BUILDING AND FACILITY MAINTENANCE 43 8 18.6% 2 4.7% 8 25
PL08 OFFICE EQUIPMENT OPERATION 2 2
Employees in the licensed engineers bargaining unit, some employees on approved leave without pay on June 30, 2017, and other records being audited by Retirement & Benefits at the time of this report are not included in these calculations.
Tier 4 employees hired on July 1, 2006 or after are included in the “No Retirement Date Available” column.
Calculations are based on retirement dates projected by Division of Retirement & Benefits.
Retirement Projections by Department & Job Class Family
Executive Branch Employees: Classified (Permanent, Probationary, and Provisional), Partially Exempt, and Exempt
Department of Administration, Division of Personnel & Labor Relations, Employee Planning & Information Center Page 29
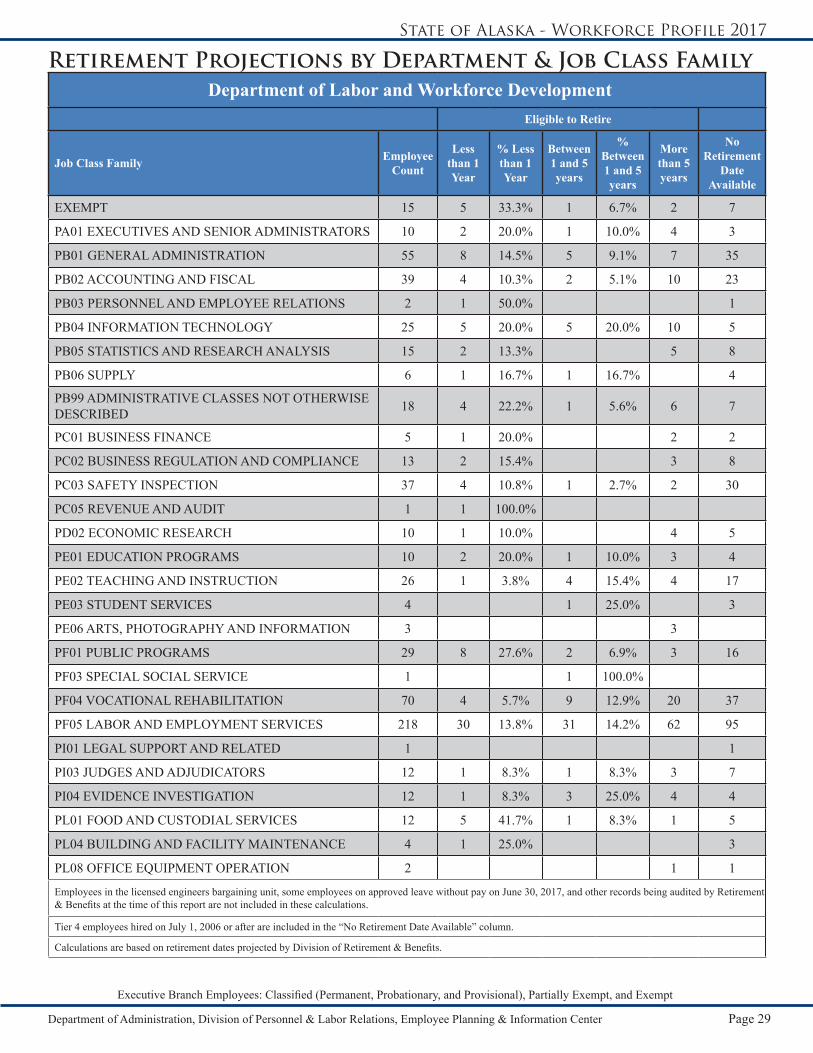
State of Alaska - Workforce Profile 2017
Department of Labor and Workforce DevelopmentEligible to Retire
Job Class Family Employee Count
Less than 1 Year
% Less than 1 Year
Between 1 and 5 years
% Between 1 and 5 years
More than 5 years
No Retirement
Date Available
EXEMPT 15 5 33.3% 1 6.7% 2 7
PA01 EXECUTIVES AND SENIOR ADMINISTRATORS 10 2 20.0% 1 10.0% 4 3
PB01 GENERAL ADMINISTRATION 55 8 14.5% 5 9.1% 7 35
PB02 ACCOUNTING AND FISCAL 39 4 10.3% 2 5.1% 10 23
PB03 PERSONNEL AND EMPLOYEE RELATIONS 2 1 50.0% 1
PB04 INFORMATION TECHNOLOGY 25 5 20.0% 5 20.0% 10 5
PB05 STATISTICS AND RESEARCH ANALYSIS 15 2 13.3% 5 8
PB06 SUPPLY 6 1 16.7% 1 16.7% 4
PB99 ADMINISTRATIVE CLASSES NOT OTHERWISE DESCRIBED 18 4 22.2% 1 5.6% 6 7
PC01 BUSINESS FINANCE 5 1 20.0% 2 2
PC02 BUSINESS REGULATION AND COMPLIANCE 13 2 15.4% 3 8
PC03 SAFETY INSPECTION 37 4 10.8% 1 2.7% 2 30
PC05 REVENUE AND AUDIT 1 1 100.0%
PD02 ECONOMIC RESEARCH 10 1 10.0% 4 5
PE01 EDUCATION PROGRAMS 10 2 20.0% 1 10.0% 3 4
PE02 TEACHING AND INSTRUCTION 26 1 3.8% 4 15.4% 4 17
PE03 STUDENT SERVICES 4 1 25.0% 3
PE06 ARTS, PHOTOGRAPHY AND INFORMATION 3 3
PF01 PUBLIC PROGRAMS 29 8 27.6% 2 6.9% 3 16
PF03 SPECIAL SOCIAL SERVICE 1 1 100.0%
PF04 VOCATIONAL REHABILITATION 70 4 5.7% 9 12.9% 20 37
PF05 LABOR AND EMPLOYMENT SERVICES 218 30 13.8% 31 14.2% 62 95
PI01 LEGAL SUPPORT AND RELATED 1 1
PI03 JUDGES AND ADJUDICATORS 12 1 8.3% 1 8.3% 3 7
PI04 EVIDENCE INVESTIGATION 12 1 8.3% 3 25.0% 4 4
PL01 FOOD AND CUSTODIAL SERVICES 12 5 41.7% 1 8.3% 1 5
PL04 BUILDING AND FACILITY MAINTENANCE 4 1 25.0% 3
PL08 OFFICE EQUIPMENT OPERATION 2 1 1
Employees in the licensed engineers bargaining unit, some employees on approved leave without pay on June 30, 2017, and other records being audited by Retirement & Benefits at the time of this report are not included in these calculations.
Tier 4 employees hired on July 1, 2006 or after are included in the “No Retirement Date Available” column.
Calculations are based on retirement dates projected by Division of Retirement & Benefits.

Retirement Projections by Department & Job Class Family
Executive Branch Employees: Classified (Permanent, Probationary, and Provisional), Partially Exempt, and Exempt
Department of Administration, Division of Personnel & Labor Relations, Employee Planning & Information Center Page 30
State of Alaska - Workforce Profile 2017
Department of LawEligible to Retire
Job Class Family Employee Count
Less than 1 Year
% Less than 1 Year
Between 1 and 5 years
% Between 1 and 5 years
More than 5 years
No Retirement
Date Available
EXEMPT 1 1
PA01 EXECUTIVES AND SENIOR ADMINISTRATORS 8 2 25.0% 5 1
PB01 GENERAL ADMINISTRATION 20 2 10.0% 1 5.0% 2 15
PB02 ACCOUNTING AND FISCAL 8 1 12.5% 1 12.5% 1 5
PB03 PERSONNEL AND EMPLOYEE RELATIONS 1 1
PB04 INFORMATION TECHNOLOGY 9 1 11.1% 1 7
PB06 SUPPLY 1 1
PC02 BUSINESS REGULATION AND COMPLIANCE 5 2 40.0% 1 20.0% 2
PC05 REVENUE AND AUDIT 1 1
PI01 LEGAL SUPPORT AND RELATED 149 7 4.7% 13 8.7% 27 102
PI02 ATTORNEYS 253 28 11.1% 16 6.3% 68 141
PI04 EVIDENCE INVESTIGATION 5 3 60.0% 2
Employees in the licensed engineers bargaining unit, some employees on approved leave without pay on June 30, 2017, and other records being audited by Retirement & Benefits at the time of this report are not included in these calculations.
Tier 4 employees hired on July 1, 2006 or after are included in the “No Retirement Date Available” column.
Calculations are based on retirement dates projected by Division of Retirement & Benefits.

Retirement Projections by Department & Job Class Family
Executive Branch Employees: Classified (Permanent, Probationary, and Provisional), Partially Exempt, and Exempt
Department of Administration, Division of Personnel & Labor Relations, Employee Planning & Information Center Page 31
State of Alaska - Workforce Profile 2017
Department of Military and Veterans AffairsEligible to Retire
Job Class Family Employee Count
Less than 1 Year
% Less than 1 Year
Between 1 and 5 years
% Between 1 and 5 years
More than 5 years
No Retirement
Date Available
EXEMPT 14 2 14.3% 1 7.1% 5 6
PA01 EXECUTIVES AND SENIOR ADMINISTRATORS 10 2 20.0% 2 20.0% 1 5
PB01 GENERAL ADMINISTRATION 23 1 4.3% 3 13.0% 6 13
PB02 ACCOUNTING AND FISCAL 16 1 6.3% 3 18.8% 3 9
PB03 PERSONNEL AND EMPLOYEE RELATIONS 2 2
PB04 INFORMATION TECHNOLOGY 10 1 10.0% 1 8
PB06 SUPPLY 10 2 20.0% 2 6
PB99 ADMINISTRATIVE CLASSES NOT OTHERWISE DESCRIBED 4 1 25.0% 1 2
PC01 BUSINESS FINANCE 7 2 5
PD03 DEVELOPMENT AND INFRASTRUCTURE PLANNING 2 1 1
PD04 EMERGENCY PLANNING AND RESPONSE 35 3 8.6% 3 8.6% 9 20
PD09 PROPERTY MANAGEMENT 6 1 5
PE02 TEACHING AND INSTRUCTION 20 2 10.0% 7 11
PE03 STUDENT SERVICES 29 1 3.4% 3 25
PE06 ARTS, PHOTOGRAPHY AND INFORMATION 1 1
PG03 NURSING, PROFESSIONAL 1 1
PG04 MEDICAL, PROFESSIONAL 1 1 100.0%
PG05 MENTAL AND BEHAVIORAL HEALTH SERVICES 1 1
PK02 ENVIRONMENTAL SCIENCE SPECIALISTS 6 6
PK03 ENGINEERING, UNLICENSED 1 1
PL01 FOOD AND CUSTODIAL SERVICES 9 2 22.2% 2 5
PL03 EQUIPMENT OPERATION 1 1
PL04 BUILDING AND FACILITY MAINTENANCE 38 6 15.8% 4 10.5% 7 21
Employees in the licensed engineers bargaining unit, some employees on approved leave without pay on June 30, 2017, and other records being audited by Retirement & Benefits at the time of this report are not included in these calculations.
Tier 4 employees hired on July 1, 2006 or after are included in the “No Retirement Date Available” column.
Calculations are based on retirement dates projected by Division of Retirement & Benefits.

Retirement Projections by Department & Job Class Family
Executive Branch Employees: Classified (Permanent, Probationary, and Provisional), Partially Exempt, and Exempt
Department of Administration, Division of Personnel & Labor Relations, Employee Planning & Information Center Page 32
State of Alaska - Workforce Profile 2017
Department of Natural ResourcesEligible to Retire
Job Class Family Employee Count
Less than 1 Year
% Less than 1 Year
Between 1 and 5 years
% Between 1 and 5 years
More than 5 years
No Retirement
Date Available
EXEMPT 57 8 14.0% 6 10.5% 14 29
PA01 EXECUTIVES AND SENIOR ADMINISTRATORS 14 4 28.6% 1 7.1% 3 6
PB01 GENERAL ADMINISTRATION 60 5 8.3% 15 25.0% 17 23
PB02 ACCOUNTING AND FISCAL 37 11 29.7% 4 10.8% 9 13
PB03 PERSONNEL AND EMPLOYEE RELATIONS 3 3
PB04 INFORMATION TECHNOLOGY 48 5 10.4% 2 4.2% 20 21
PB06 SUPPLY 5 2 40.0% 1 20.0% 2
PB99 ADMINISTRATIVE CLASSES NOT OTHERWISE DESCRIBED 5 1 20.0% 1 3
PC01 BUSINESS FINANCE 3 2 66.7% 1
PC03 SAFETY INSPECTION 1 1
PC05 REVENUE AND AUDIT 8 1 12.5% 3 4
PD02 ECONOMIC RESEARCH 1 1
PD03 DEVELOPMENT AND INFRASTRUCTURE PLANNING 4 1 3
PD04 EMERGENCY PLANNING AND RESPONSE 24 3 12.5% 5 20.8% 1 15
PD05 AIRPORT ADMINISTRATION 1 1 100.0%
PD08 REAL ESTATE APPRAISAL 4 1 25.0% 1 2
PE02 TEACHING AND INSTRUCTION 1 1 100.0%
PE05 ANTHROPOLOGICAL RESEARCH AND EDUCATION 16 3 18.8% 1 12
PE06 ARTS, PHOTOGRAPHY AND INFORMATION 6 1 16.7% 5
PH02 AGRICULTURE 8 1 7
PH03 NATURAL RESOURCES AND FORESTRY 328 20 6.1% 28 8.5% 79 201
PH04 PARKS 41 5 12.2% 3 7.3% 13 20
PI05 LEGAL DOCUMENT PROCESSING 35 4 11.4% 3 8.6% 5 23
PK01 PHYSICAL SCIENCE SPECIALISTS 36 3 8.3% 3 8.3% 11 19
PK02 ENVIRONMENTAL SCIENCE SPECIALISTS 1 1
PK03 ENGINEERING, UNLICENSED 8 2 6
PK04 ENGINEERING, LICENSED 5 1 20.0% 4
Employees in the licensed engineers bargaining unit, some employees on approved leave without pay on June 30, 2017, and other records being audited by Retirement & Benefits at the time of this report are not included in these calculations.
Tier 4 employees hired on July 1, 2006 or after are included in the “No Retirement Date Available” column.
Calculations are based on retirement dates projected by Division of Retirement & Benefits.
Retirement Projections by Department & Job Class Family
Executive Branch Employees: Classified (Permanent, Probationary, and Provisional), Partially Exempt, and Exempt
Department of Administration, Division of Personnel & Labor Relations, Employee Planning & Information Center Page 33
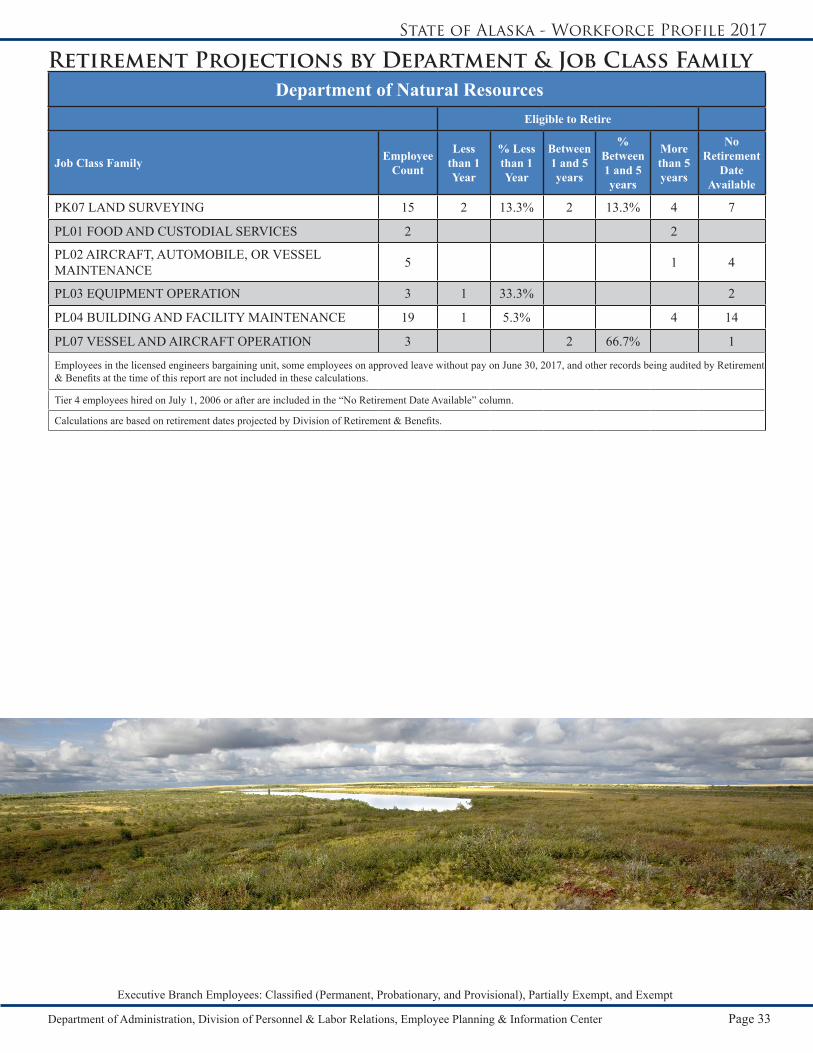
State of Alaska - Workforce Profile 2017
Department of Natural ResourcesEligible to Retire
Job Class Family Employee Count
Less than 1 Year
% Less than 1 Year
Between 1 and 5 years
% Between 1 and 5 years
More than 5 years
No Retirement
Date Available
PK07 LAND SURVEYING 15 2 13.3% 2 13.3% 4 7
PL01 FOOD AND CUSTODIAL SERVICES 2 2
PL02 AIRCRAFT, AUTOMOBILE, OR VESSEL MAINTENANCE 5 1 4
PL03 EQUIPMENT OPERATION 3 1 33.3% 2
PL04 BUILDING AND FACILITY MAINTENANCE 19 1 5.3% 4 14
PL07 VESSEL AND AIRCRAFT OPERATION 3 2 66.7% 1
Employees in the licensed engineers bargaining unit, some employees on approved leave without pay on June 30, 2017, and other records being audited by Retirement & Benefits at the time of this report are not included in these calculations.
Tier 4 employees hired on July 1, 2006 or after are included in the “No Retirement Date Available” column.
Calculations are based on retirement dates projected by Division of Retirement & Benefits.

Retirement Projections by Department & Job Class Family
Executive Branch Employees: Classified (Permanent, Probationary, and Provisional), Partially Exempt, and Exempt
Department of Administration, Division of Personnel & Labor Relations, Employee Planning & Information Center Page 34
State of Alaska - Workforce Profile 2017
Department of Public SafetyEligible to Retire
Job Class Family Employee Count
Less than 1 Year
% Less than 1 Year
Between 1 and 5 years
% Between 1 and 5 years
More than 5 years
No Retirement
Date Available
EXEMPT 3 2 66.7% 1 33.3%
PA01 EXECUTIVES AND SENIOR ADMINISTRATORS 8 4 50.0% 3 1
PB01 GENERAL ADMINISTRATION 94 12 12.8% 6 6.4% 22 54
PB02 ACCOUNTING AND FISCAL 16 3 18.8% 2 12.5% 11
PB03 PERSONNEL AND EMPLOYEE RELATIONS 2 1 50.0% 1
PB04 INFORMATION TECHNOLOGY 22 2 9.1% 20
PB05 STATISTICS AND RESEARCH ANALYSIS 5 1 20.0% 1 3
PB06 SUPPLY 7 1 6
PB99 ADMINISTRATIVE CLASSES NOT OTHERWISE DESCRIBED 10 3 30.0% 2 5
PC01 BUSINESS FINANCE 2 1 50.0% 1
PC02 BUSINESS REGULATION AND COMPLIANCE 1 1
PD03 DEVELOPMENT AND INFRASTRUCTURE PLANNING 1 1 100.0%
PD04 EMERGENCY PLANNING AND RESPONSE 29 1 3.4% 9 19
PD05 AIRPORT ADMINISTRATION 1 1
PD09 PROPERTY MANAGEMENT 1 1
PE06 ARTS, PHOTOGRAPHY AND INFORMATION 3 2 1
PI01 LEGAL SUPPORT AND RELATED 71 8 11.3% 9 12.7% 10 44
PI04 EVIDENCE INVESTIGATION 33 2 6.1% 8 23
PJ01 LAW ENFORCEMENT 413 66 16.0% 80 19.4% 97 170
PJ02 FIRE FIGHTING AND INSPECTION 15 3 20.0% 4 26.7% 4 4
PL01 FOOD AND CUSTODIAL SERVICES 2 1 1
PL02 AIRCRAFT, AUTOMOBILE, OR VESSEL MAINTENANCE 9 2 22.2% 2 22.2% 2 3
PL04 BUILDING AND FACILITY MAINTENANCE 4 1 25.0% 1 25.0% 1 1
PL07 VESSEL AND AIRCRAFT OPERATION 11 1 9.1% 2 18.2% 3 5
PL08 OFFICE EQUIPMENT OPERATION 1 1 100.0%
Employees in the licensed engineers bargaining unit, some employees on approved leave without pay on June 30, 2017, and other records being audited by Retirement & Benefits at the time of this report are not included in these calculations.
Tier 4 employees hired on July 1, 2006 or after are included in the “No Retirement Date Available” column.
Calculations are based on retirement dates projected by Division of Retirement & Benefits.

Retirement Projections by Department & Job Class Family
Executive Branch Employees: Classified (Permanent, Probationary, and Provisional), Partially Exempt, and Exempt
Department of Administration, Division of Personnel & Labor Relations, Employee Planning & Information Center Page 35
State of Alaska - Workforce Profile 2017
Department of RevenueEligible to Retire
Job Class Family Employee Count
Less than 1 Year
% Less than 1 Year
Between 1 and 5 years
% Between 1 and 5 years
More than 5 years
No Retirement
Date Available
EXEMPT 90 9 10.0% 7 7.8% 27 47
PA01 EXECUTIVES AND SENIOR ADMINISTRATORS 9 1 11.1% 3 5
PB01 GENERAL ADMINISTRATION 63 4 6.3% 4 6.3% 5 50
PB02 ACCOUNTING AND FISCAL 51 6 11.8% 5 9.8% 14 26
PB03 PERSONNEL AND EMPLOYEE RELATIONS 2 1 50.0% 1
PB04 INFORMATION TECHNOLOGY 31 6 19.4% 2 6.5% 8 15
PB05 STATISTICS AND RESEARCH ANALYSIS 1 1
PB06 SUPPLY 1 1
PB99 ADMINISTRATIVE CLASSES NOT OTHERWISE DESCRIBED 2 2
PC05 REVENUE AND AUDIT 62 4 6.5% 5 8.1% 20 33
PD02 ECONOMIC RESEARCH 5 1 4
PE06 ARTS, PHOTOGRAPHY AND INFORMATION 1 1
PF01 PUBLIC PROGRAMS 141 12 8.5% 12 8.5% 32 85
PG01 HEALTH ADMINISTRATION 1 1
PI04 EVIDENCE INVESTIGATION 9 1 11.1% 5 3
PL08 OFFICE EQUIPMENT OPERATION 8 1 12.5% 3 4
Employees in the licensed engineers bargaining unit, some employees on approved leave without pay on June 30, 2017, and other records being audited by Retirement & Benefits at the time of this report are not included in these calculations.
Tier 4 employees hired on July 1, 2006 or after are included in the “No Retirement Date Available” column.
Calculations are based on retirement dates projected by Division of Retirement & Benefits.

Retirement Projections by Department & Job Class Family
Executive Branch Employees: Classified (Permanent, Probationary, and Provisional), Partially Exempt, and Exempt
Department of Administration, Division of Personnel & Labor Relations, Employee Planning & Information Center Page 36
State of Alaska - Workforce Profile 2017
Department of Transportation and Public FacilitiesEligible to Retire
Job Class Family Employee Count
Less than 1 Year
% Less than 1 Year
Between 1 and 5 years
% Between 1 and 5 years
More than 5 years
No Retirement
Date Available
EXEMPT 7 3 42.9% 1 3
EXEMPT MARINE 607 68 11.2% 57 9.4% 144 338
PA01 EXECUTIVES AND SENIOR ADMINISTRATORS 22 3 13.6% 5 22.7% 9 5
PB01 GENERAL ADMINISTRATION 138 19 13.8% 12 8.7% 29 78
PB02 ACCOUNTING AND FISCAL 80 10 12.5% 12 15.0% 18 40
PB03 PERSONNEL AND EMPLOYEE RELATIONS 14 1 7.1% 4 9
PB04 INFORMATION TECHNOLOGY 48 5 10.4% 2 4.2% 19 22
PB05 STATISTICS AND RESEARCH ANALYSIS 10 5 5
PB06 SUPPLY 69 8 11.6% 8 11.6% 16 37
PB99 ADMINISTRATIVE CLASSES NOT OTHERWISE DESCRIBED 5 1 20.0% 1 3
PC01 BUSINESS FINANCE 4 3 75.0% 1
PC03 SAFETY INSPECTION 45 5 11.1% 3 6.7% 10 27
PC05 REVENUE AND AUDIT 4 2 50.0% 2
PD03 DEVELOPMENT AND INFRASTRUCTURE PLANNING 48 10 20.8% 4 8.3% 16 18
PD04 EMERGENCY PLANNING AND RESPONSE 19 5 26.3% 3 11
PD05 AIRPORT ADMINISTRATION 24 6 25.0% 3 12.5% 4 11
PD06 FERRY SYSTEM ADMINISTRATION 79 7 8.9% 5 6.3% 12 55
PD07 MAINTENANCE ADMINISTRATION 30 6 20.0% 6 20.0% 10 8
PD08 REAL ESTATE APPRAISAL 43 8 18.6% 4 9.3% 9 22
PD09 PROPERTY MANAGEMENT 30 10 33.3% 3 10.0% 11 6
PE02 TEACHING AND INSTRUCTION 3 1 33.3% 2
PE06 ARTS, PHOTOGRAPHY AND INFORMATION 7 3 4
PF03 SPECIAL SOCIAL SERVICE 9 1 11.1% 2 6
PJ02 FIRE FIGHTING AND INSPECTION 82 9 11.0% 5 6.1% 21 47
PK01 PHYSICAL SCIENCE SPECIALISTS 9 3 33.3% 1 5
PK02 ENVIRONMENTAL SCIENCE SPECIALISTS 42 6 14.3% 3 7.1% 7 26
PK03 ENGINEERING, UNLICENSED 293 32 10.9% 16 5.5% 97 148
PK04 ENGINEERING, LICENSED 165 23 13.9% 22 13.3% 69 51
Employees in the licensed engineers bargaining unit, some employees on approved leave without pay on June 30, 2017, and other records being audited by Retirement & Benefits at the time of this report are not included in these calculations.
Tier 4 employees hired on July 1, 2006 or after are included in the “No Retirement Date Available” column.
Calculations are based on retirement dates projected by Division of Retirement & Benefits.

Retirement Projections by Department & Job Class Family
Executive Branch Employees: Classified (Permanent, Probationary, and Provisional), Partially Exempt, and Exempt
Department of Administration, Division of Personnel & Labor Relations, Employee Planning & Information Center Page 37
State of Alaska - Workforce Profile 2017
Department of Transportation and Public FacilitiesEligible to Retire
Job Class Family Employee Count
Less than 1 Year
% Less than 1 Year
Between 1 and 5 years
% Between 1 and 5 years
More than 5 years
No Retirement
Date Available
PK06 VESSEL CONSTRUCTION 3 1 33.3% 1 1
PK07 LAND SURVEYING 27 4 14.8% 6 17
PK08 CARTOGRAPHY AND DRAFTING 15 3 20.0% 2 13.3% 1 9
PL01 FOOD AND CUSTODIAL SERVICES 57 11 19.3% 4 7.0% 5 37
PL02 AIRCRAFT, AUTOMOBILE, OR VESSEL MAINTENANCE 135 16 11.9% 17 12.6% 26 76
PL03 EQUIPMENT OPERATION 534 49 9.2% 57 10.7% 129 299
PL04 BUILDING AND FACILITY MAINTENANCE 176 28 15.9% 23 13.1% 31 94
PL05 INSTRUMENT TECHNICIAN 1 1
PL06 CONSTRUCTION SUPPORT 138 7 5.1% 4 2.9% 17 110
PL08 OFFICE EQUIPMENT OPERATION 2 2
Employees in the licensed engineers bargaining unit, some employees on approved leave without pay on June 30, 2017, and other records being audited by Retirement & Benefits at the time of this report are not included in these calculations.
Tier 4 employees hired on July 1, 2006 or after are included in the “No Retirement Date Available” column.
Calculations are based on retirement dates projected by Division of Retirement & Benefits.

Department of Administration, Division of Personnel & Labor Relations, Employee Planning & Information Center Page 38
State of Alaska - Workforce Profile 2017
State of Alaska Department of Administration
Division of Personnel & Labor Relations
Leslie RidleCommissioner
Kate SheehanDivision Director
Contributors:Kate Sheehan, Kim Garrett, Frank Hurt, Jeff Hahnlen, and Holly Cox
The Workforce Profile is written by and produced for the employees and clients of the Department of Administration, Division of Personnel & Labor Relations. It is published once per year.
Reader comments are encouraged. Reprint permission is granted on all materials not under owner copyright.Please credit this publication, and provide a copy of the publication in which the material is used.
DOPLR Workforce Profile EditorPO Box 110201
Juneau, AK 99811-0201
The Alaska Department of Administration complies with Title II of the 1990 Americans with Disabilities Act. This publication is available in alternative communication formats upon request. To make necessary arrangements, contact the Employee Planning and Information Center of the Division of Personnel and Labor Relations at (907) 465-4434 or the TDD for the hearing impaired at (800) 770-8973.
Credits and Contact Information
Division of Personnel & Labor RelationsState Office Building
333 Willoughby Avenue10th Floor
PO Box 110201Juneau, AK 99811-0201
Phone: 907-465-4430http://doa.alaska.gov/dop
Photo Credits: U.S. Fish and Wildlife Service (p. 1, 3, 7, 9, 12, 20, 28, 30, 33, 37) All photos are in the public domain.