State Medicaid Advisory Committee (SMAC) - azahcccs.gov · transportation and childcare, to...
116
State Medicaid Advisory Committee (SMAC) Wednesday, January 9, 2019 AHCCCS GOLD ROOM 3 rd Floor 701 E. Jefferson Street 1 p.m. – 3 p.m. Agenda I. Welcome Director Jami Snyder II. Introductions of Members ALL III. Approval of October 17, 2018 meeting summary ALL Agency Updates IV. SMAC Revised Bylaws ALL V. AHCCCS Updates Jami Snyder VI. State Health Assessment Update Sheila Sjolander Carla Berg VII. Committees/Councils Presentation Schedule to SMAC ALL VIII. Call to the public Jami Snyder IX. Adjourn at 3:00 p.m. ALL *2019 SMAC Meetings Per SMAC Bylaws, meetings are to be held the 2nd Wednesday of January, April, July and October. **Unfortunately due to scheduling conflicts the meeting dates have changed** All meetings will be held from 1 p.m.- 3 p.m. unless otherwise announced at the AHCCCS Administration 701 E. Jefferson, Phoenix, AZ 85034, 3rd Floor in the Gold Room: January 9, 2019 April 11, 2019 July 11, 2019 October 18, 2019 For more information or assistance, please contact Yisel Sanchez at (602) 364-4577or [email protected]
Transcript of State Medicaid Advisory Committee (SMAC) - azahcccs.gov · transportation and childcare, to...

State Medicaid Advisory Committee (SMAC) Wednesday, January 9, 2019
AHCCCS GOLD ROOM 3rd Floor 701 E. Jefferson Street
1 p.m. – 3 p.m. Agenda
I. Welcome
Director Jami Snyder
II. Introductions of Members
ALL
III. Approval of October 17, 2018 meeting summary
ALL
Agency Updates
IV. SMAC Revised Bylaws
ALL
V. AHCCCS Updates
Jami Snyder
VI. State Health Assessment Update
Sheila Sjolander Carla Berg
VII. Committees/Councils Presentation Schedule to SMAC
ALL
VIII. Call to the public
Jami Snyder
IX. Adjourn at 3:00 p.m.
ALL
*2019 SMAC Meetings
Per SMAC Bylaws, meetings are to be held the 2nd Wednesday of January, April, July and October.
**Unfortunately due to scheduling conflicts the meeting dates have changed** All meetings will be held from 1 p.m.- 3 p.m. unless otherwise announced at the AHCCCS Administration
701 E. Jefferson, Phoenix, AZ 85034, 3rd Floor in the Gold Room:
January 9, 2019
April 11, 2019
July 11, 2019
October 18, 2019
For more information or assistance, please contact Yisel Sanchez at (602) 364-4577or [email protected]

October 2018 Meeting Summary

Douglas A. Ducey, Governor Thomas J. Betlach, Director
801 East Jefferson, Phoenix, AZ 85034 • PO Box 25520, Phoenix, AZ 85002 • 602-417-4000 • www.azahcccs.gov
State Medicaid Advisory Committee (SMAC) Meeting Summary Wednesday, October 17 2018, AHCCCS, 701 E. Jefferson, Gold Room
1:00 p.m. – 3:00 p.m.
Members in attendance: Jami Snyder Cara Christ (phone) Tara McCollum Plese David Voepel Kim VanPelt Marcus Johnson Greg Ensell
Daniel Haley (phone) Leonard Kirschner Steven Jennings Gina Judy (phone) Phil Pangrazio (phone)
Members Absent: Kathy Waite; Kevin Earle; Amanda Aguirre; Peggy Stemmler; Vernice Sampson; Frank Scarpati; Kathleen Collins Pagels Staff and public in attendance: Yisel Sanchez, HRC Coordinator, AHCCCS Dana Hearn, AHCCCS Tim Walker, FEI SYSTEM Brendon Blake, AARP Erin Vredeveld, Canyon Physical Therapy Kelly Vredeveld, Canyon Physical Therapy
Kamita Bernstein, FTF Erika Mach, AACHC Shannon Grosppenber, JNJ Brian Hummell, ACA CAN Shirley Gunther Josh Crites, AHCCCS Jim Hammond, The Hartel Report Jennifer Carusetla, HSAA
AGENDA I. Welcome & Introductions Jami Snyder
II. Introductions of Members All III. Approval of October 17, 2017 Meeting Summary/Minutes Unanimous AGENCY UPDATES IV. SMAC Revised Bylaws All
o Revised bylaws to be sent to member for review o Discussion at January 2019 meeting
V. AHCCCS Updates Jami Snyder o AHCCCS Strategic Plan o SFY20 Budget Request o ACC o Post Go-Live Monitoring o AHCCCS Contract Timeline o State Opioid Grant o State Opioid Response o SOR Program Activities o Behavioral Health Service Schools o Strategies in CYE19

o Pending Waiver Requestso AHCCCS Workso Prior Coverageo On the Horizon
VI. DEMO ACC Update Angela Aguayo o DUGless Backgroundo Demographics Datao Transitiono 3 Pronged Strategyo Online Portalo Data Elementso Online Portal Reportingo
IX. Housing Update Josh Crites o Housing and Homeless in Arizonao AHCCCS play an important part in affordable housing throughout the stateo Over 3000 units of affordable housing for memberso Housing for SMI, GMH/SU, ALTCS and ACCo Who has the Funding?o ACC and Housing Human Services Campuso Driving Changeso Goal 1, Capital Investmento Laurel Tree, Surpriseo Goal 2, Innovative Rental Subsidyo Emerald Program, Prescott Valley/Flagstaffo Goal 3, Meaningful Public Housing Partnershipso Goal 4, Homeless Systems Collaborationo Mercy Care’s Phoenix Rise Programo Goal 5, Deliver Outstanding Supportive Housing Serviceso Upcoming Initiatives
X. Call to the Public Jami Snyder
XI. Adjourn at 3:07 p.m. All

Bylaws

Douglas A. Ducey, Governor Thomas J. Betlach, Director
BYLAWS FOR THE A.H.C.C.C.S
STATE MEDICAID ADVISORY COMMITTEE (SMAC)
MISSION
The SMAC will participate in the development of policy and program administration for the Arizona Health Care Cost Containment System (AHCCCS). Participation will include review of policy, rules and administrative issues for applicable AHCCCS programs. . The SMAC will advise the Director of AHCCCS on policy and administrative issues of concern to the SMAC member constituency.
To facilitate accomplishing its mission, the SMAC will, whenever practicable, recommend issues and/or policies for inclusion on the SMAC agenda in order to allow for consideration prior to implementation. SMAC membership may also request background information and/or policy papers in advance of SMAC meetings, allowing for a deliberative discussion of the issues with AHCCCS Senior Management during the SMAC meeting.
AUTHORITY
The SMAC operates in accordance with 42 CFR 431.12 and the State Medicaid Plan.
DEFINITIONS
“AHCCCS” or “Administration” means the Arizona Health Care Cost Containment System defined in Arizona Revised Statutes (A.R.S.) §§ 36‐2901, ‐2931, ‐2971 and ‐2981.
“SMAC” means the State Medicaid Advisory Committee, as appointed by the Director.
“Director” means the Director of AHCCCS as specified in A.R.S. §§ 36‐2901, ‐2931, ‐2971 and ‐2981.
SMAC COMPOSITION
The SMAC shall include the AHCCCS Director or designee, the Director of the Arizona Department of Health Services (ADHS) or a designee, and the Director of the Department of Economic Security (DES) or a designee. The remaining authorized members shall be no less than seventeen (17), as follows: eight (8) health care providers or professionals with a direct interest in the AHCCCS program; and nine (9) members of

Douglas A. Ducey, Governor Thomas J. Betlach, Director
the public (e.g. a Medicaid recipient, a consumer advocate, a representative of a tribal community, or a representative of the educational community, etc.). APPOINTMENT PROCESS AND LENGTH OF TERM The AHCCCS Director or a designee, the ADHS Director or a designee, and the DES Director or a designee positions are ex‐officio (i.e. permanent position by virtue of the position with their respective State agency). The remaining seventeen (17) committee members shall be appointed by the AHCCCS Director. A term shall last for two years from the date of appointment and no member shall serve more than three terms. After serving as a member for three consecutive terms, a member may be appointed again after a waiting period of 24 months. The AHCCCS Director or a designee is the SMAC chairperson and is responsible for setting meeting agendas. Special meetings of the SMAC may be called by the chairperson. Written notice of a special meeting shall be given at least five (5) days before the meeting, specifying the date, time and purpose of the meeting. The chairperson shall preside at all meetings, and shall facilitate discussion by the members. Any vacancy shall be filled by the AHCCCS Director. The SMAC shall submit to the Director a list of nominees for expiring terms. The Director may solicit or receive nominations from other sources. The appointment process will occur annually in October. At that time, new appointments will be made for seats for members who have served the maximum of three, two‐year terms. Any appointed member of the SMAC may resign by giving written notice to the SMAC, SMAC chairperson or SMAC Liaison. Any such resignation shall take effect at the time specified therein, or, if not specified therein, upon its receipt. Any SMAC member appointed by the Director may be removed by the SMAC or the Director whenever it is deemed to be in the best interest of the SMAC and AHCCCS. STAFF ASSISTANCE Staff assistance from the Administration shall be available to the SMAC at the request of the chairperson or the committee as a whole. The designated SMAC Liaison shall provide staff assistance. Independent technical assistance shall be available at the request of the SMAC, if determined necessary by the Director and appropriate funds are available. MEETINGS

Douglas A. Ducey, Governor Thomas J. Betlach, Director
SMAC meetings are open to the public. The meetings shall be held quarterly on the 2nd Wednesday of January, April, July and October or otherwise as the Director deems appropriate. A member may participate in a meeting by tele‐conference or online, so long as that method does not detract from other participants’ ability to communicate with one another. Participating in this manner shall constitute in person attendance. . If a SMAC member is unable to attend a meeting, that member is requested to notify the SMAC Liaison of their absence prior to the date of the meeting. Members are encouraged to send a representative to meetings they are unable to attend. Members are requested to notify the SMAC Liaison with the name of the individual who will be attending on their behalf. MEETING MATERIALS When available, handouts for the current agenda will be mailed two weeks in advance of the meeting. Members shall bring all mailed handouts to the meeting to facilitate discussion. If a member is unable to attend the meeting and is sending a representative, please forward the handouts to the representative to bring to the meeting. FEDERAL FINANCIAL PARTICIPATION Medicaid recipient members shall be reimbursed for necessary costs, such as transportation and childcare, to facilitate their attendance at committee meetings. If determined necessary and available by the AHCCCS Director, Federal financial participation at 50 percent shall be secured for expenditures for the participation of the Medicaid recipient members and for committee activities, including independent technical assistance costs.
AMENDMENT These Bylaws may be altered, amended or repealed and new or revised bylaws may be adopted by a majority of the SMAC at any regular meeting or special meeting, provided that at least ten (10) days written notice is given of intention to alter, amend, or repeal or to adopt new Bylaws at such meeting.

Douglas A. Ducey, Governor Thomas J. Betlach, Director
42 Code of Federal Regulations (CFR)
Part 431‐State Administration Subpart A‐Single State Medicaid Agency
42 CFR 431.12 § 431.12 Medical care advisory committee. (a) Basis and purpose. This section, based on section 1902(a)(4) of the Act, prescribes State plan requirements for establishment of a committee to advise the Medicaid agency about health and medical care services. (b) State plan requirement. A State plan must provide for a medical care advisory committee meeting the requirements of this section to advise the Medicaid agency director about health and medical care services. (c) Appointment of members. The agency director, or a higher State authority, must appoint members to the advisory committee on a rotating and continuous basis. (d) Committee membership. The committee must include –
(1) Board‐certified physicians and other representatives of the health professions who are familiar with the medical needs of low‐income population groups and with the resources available and required for their care;
(2) Members of consumers' groups, including Medicaid recipients, and consumer organizations such as labor unions, cooperatives, consumer‐sponsored prepaid group practice plans, and others; and
(3) The director of the public welfare department or the public health department, whichever does not head the Medicaid agency.
(e) Committee participation. The committee must have opportunity for participation in policy development and program administration, including furthering the participation of recipient members in the agency program. (f) Committee staff assistance and financial help. The agency must provide the committee with –
Douglas A. Ducey, Governor Thomas J. Betlach, Director
(1) Staff assistance from the agency and independent technical assistance as needed to enable it to make effective recommendations; and
(2) Financial arrangements, if necessary, to make possible the participation of recipient members.
(g) Federal financial participation. FFP is available at 50 percent in expenditures for the committee's activities. *Excerpts from SMAC Bylaws Rev. 5/2018

State Medicaid Advisory Committee (SMAC)
I ____________________________ (please print name) affirm to commit to attending all quarterly State Medicaid Advisory Committee meetings during the 2018 – 2019 calendar years. When I am unable to attend a meeting(s), I will send a delegate who can represent the views of the constituency I represent. If I am unable to meet this commitment as a member of the SMAC, I will notify the AHCCCS Director’s Office immediately to allow a new committee individual to be appointed to my committee slot. ________________________________ _____________________ (Signature) (Date)
*2019 SMAC Meetings
Per SMAC Bylaws, meetings are to be held the 2nd
Wednesday of January, April, July and October.
**Unfortunately due to scheduling conflicts the meeting dates have changed**
All meetings will be held from 1 p.m. - 3 p.m. unless otherwise announced at the AHCCCS Administration
January 10, 2019 April 11, 2019 July 11, 2019
October 18, 2019

AHCCCS Update

AHCCCS Update
State Medicaid Advisory Committee January 9, 2019

Organizational Structure
2 Reaching across Arizona to provide comprehensive quality health care for those in need
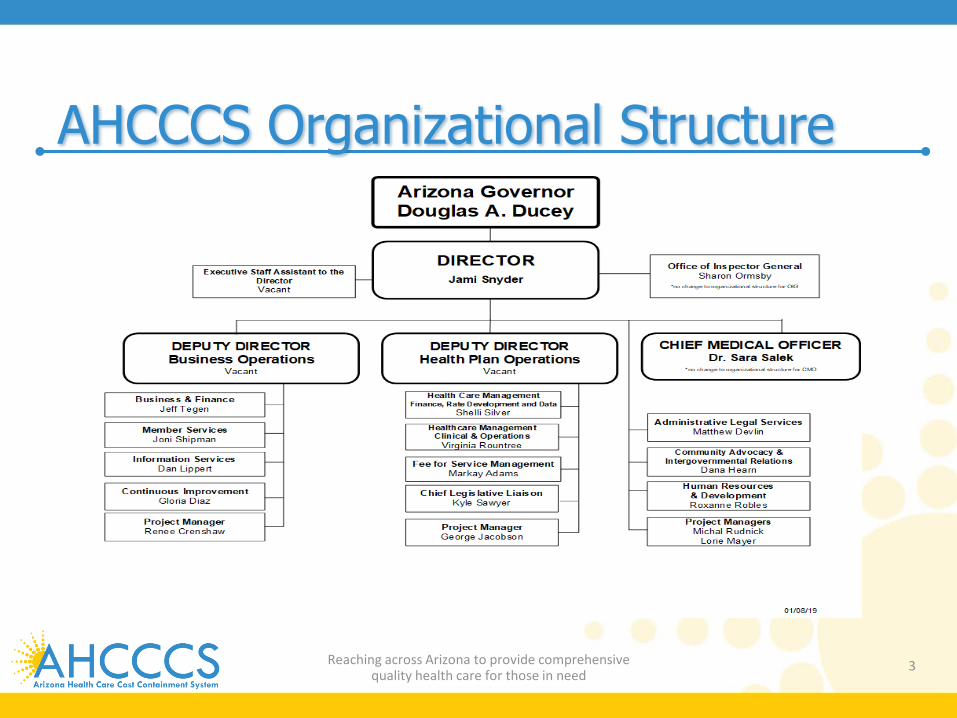
AHCCCS Organizational Structure
3 Reaching across Arizona to provide comprehensive quality health care for those in need

2019 Strategic Plan
4 Reaching across Arizona to provide comprehensive quality health care for those in need
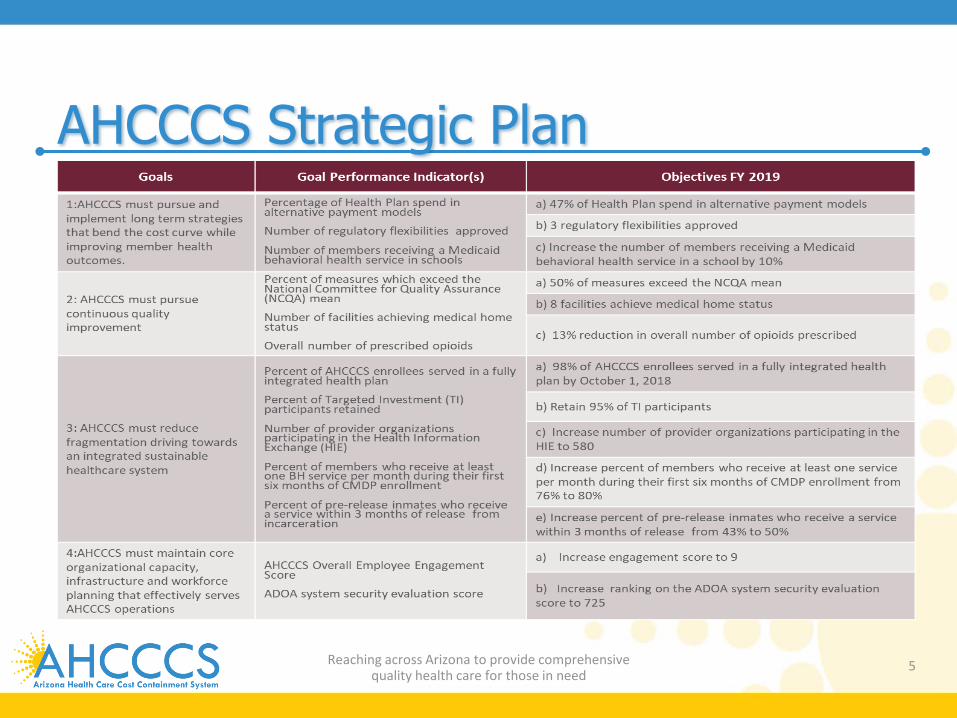
AHCCCS Strategic Plan
5 Reaching across Arizona to provide comprehensive quality health care for those in need
2019 Legislative Initiatives
6 Reaching across Arizona to provide comprehensive quality health care for those in need
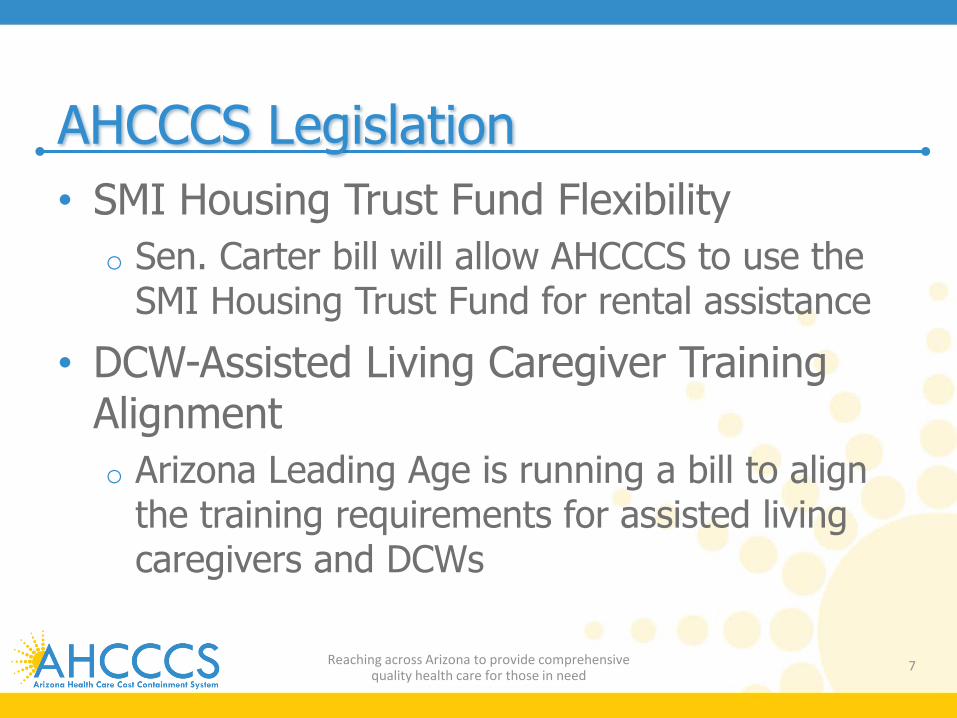
AHCCCS Legislation • SMI Housing Trust Fund Flexibility
o Sen. Carter bill will allow AHCCCS to use the SMI Housing Trust Fund for rental assistance
• DCW-Assisted Living Caregiver Training Alignment o Arizona Leading Age is running a bill to align
the training requirements for assisted living caregivers and DCWs
7 Reaching across Arizona to provide comprehensive
quality health care for those in need

Other Legislation • KidsCare • Dental Benefit for Pregnant Women • Telemedicine • Chiropractic Services • HIE Clean Up • Diabetes Education Services
8 Reaching across Arizona to provide comprehensive quality health care for those in need

On the Horizon
9 Reaching across Arizona to provide comprehensive quality health care for those in need
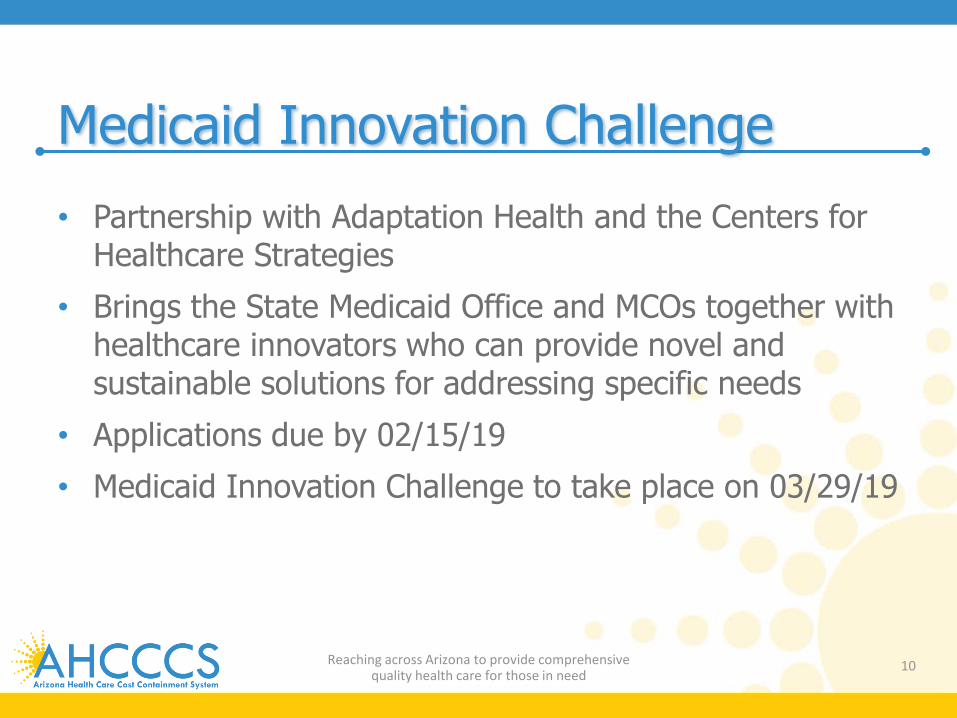
Medicaid Innovation Challenge • Partnership with Adaptation Health and the Centers for
Healthcare Strategies • Brings the State Medicaid Office and MCOs together with
healthcare innovators who can provide novel and sustainable solutions for addressing specific needs
• Applications due by 02/15/19 • Medicaid Innovation Challenge to take place on 03/29/19
10 Reaching across Arizona to provide comprehensive quality health care for those in need

• Areas of focus o Social determinants of health Assess member risk, share/house SDOH data,
identify/aggregate referral options, referral feedback o Digital member engagement Technologies to assist individuals in better
managing their care, accessing appropriate services, and empowering them to adopt healthier behaviors
11 Reaching across Arizona to provide comprehensive quality health care for those in need
Medicaid Innovation Challenge

Questions
12 Reaching across Arizona to provide comprehensive quality health care for those in need

SHA Presentation

Arizona State Health Assessment January 9, 2019
Presenting to State Medicaid Advisory Committee (SMAC)
Sheila Sjolander, MSW | Assistant Director
Carla Berg, MHS | Chief Strategy Officer

STATE HEALTH ASSESSMENT BACKGROUND

Assessment Framework
Assess Health Needs Assess Capacity Match
Needs & Capacity
Further in-depth studies of
specific needs
Set priorities & performance
objectives Strategic plan
and allocation of resources

Arizona Health Improvement Plan 2016 First Edition of the AzHIP Published in 2016, included:
• Asthma & Chronic Lower Respiratory Diseases (CLRD)
• Cancer • Diabetes • Healthcare Associated
Infections (HAI)
• Heart Disease & Stroke • Maternal & Child Health • Obesity • Oral Health • Tobacco • Unintentional Injury
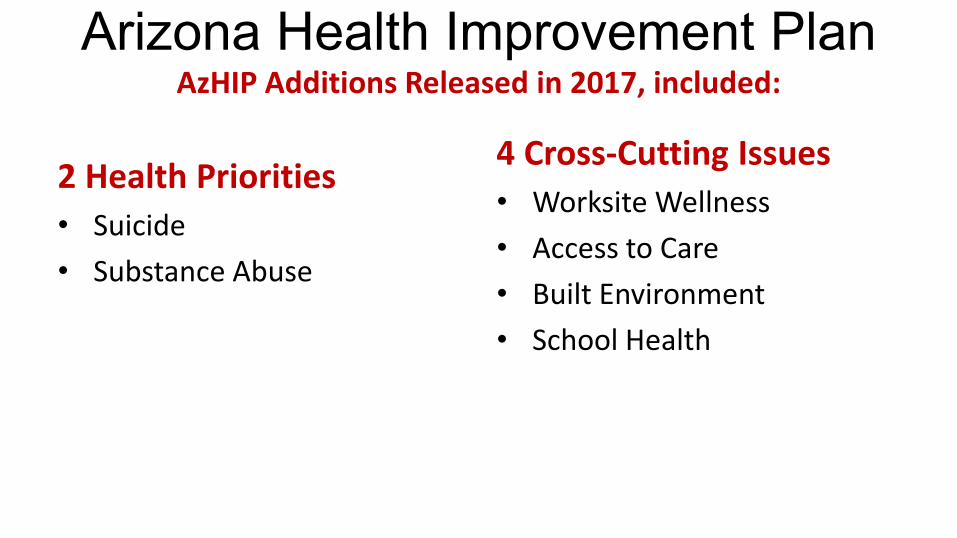
Arizona Health Improvement Plan AzHIP Additions Released in 2017, included:
2 Health Priorities • Suicide • Substance Abuse
4 Cross-Cutting Issues • Worksite Wellness • Access to Care • Built Environment • School Health

Healthy People, Healthy Communities Healthy People Outcomes Across the Lifespan
• Maternal, Child, and Adolescent Health • Healthy Adults • Healthy Aging
Healthy Communities • Neighborhood Impact • Social Influences • Tribal Health
Opportunities for Health

Main Data Sources
• ADHS Vital Records: Birth and death certificates filed with ADHS and filed in other states but affecting AZ residents. Pregnancies are the sum of live births, spontaneous terminations of pregnancy and induced terminations of pregnancy. • Behavioral Risk Factor Surveillance System (BRFSS): Annual Random selection telephone survey initiated in 1984 that collects data from Arizonan adults aged 18 and older. Results are used to monitor selected public health objectives related to general health status, health-related quality of life and well-being, determinants of health and disparities. Since BRFSS is used nationwide, comparisons can be made to other states and to the national average. • Youth Risk Behavior Surveillance System (YRBSS): National school-based survey developed in 1990. Monitors six categories of health-related behaviors that contribute to the leading causes of death, disability, and social problems among youth and adults. Survey is completed every 2 years (recent years 2013, 2015, and 2017).

HEALTHY PEOPLE

Arizona’s population is the 6th fastest growing in the United States. Since 2010, the average population growth rate is 1.4%.
7.01M
U.S. Census Bureau, National Population by Characteristics: 2010-2017
6.46M

Between 2010 – 2017, the largest population growth (36.3%) has been among residents ages 65 and older. Arizona’s population has decreased among infants by 2.2%.
Less than 1
United States
All Arizonans
Age 65 and Older
-10% 0% 10% 20% 30% 40%Growth Rate
U.S. Census Bureau, National Population by Characteristics: 2010-2017

The largest percentage of Arizonans are between 20 – 44 years of age. 32.7% of residents are within 20 and 44 years of age with 24.1% between ages 45 and 64.
0%
10%
20%
30%
40%
<1 Y 1-14 Y 15-19 Y 20-44 Y 45-64 Y >65 Y
U.S. Census Bureau, National Population by Characteristics: 2010-2017

White 54.9%
Hispanic 31.4%
Black 4.3%
Asian 3.3%
Multiracial 2.0%
American Indian and Alaska Native 4.0%
Native Hawaiian and Other Pacific Islander 0.2%
More than 85% of Arizonans are White or Hispanic/Latino.
U.S. Census Bureau, National Population by Characteristics: 2010-2017

Over 75% of Arizonans reside in Maricopa and Pima counties.
Office of Economic Opportunity and U.S. Census Bureau < 50,000 >1,500,000

OUTCOMES ACROSS THE LIFESPAN

1 2 3 4 5
Leading cause of death by age group in 2017 Rank <1Y 1-14Y 15 - 19Y 20-44Y 45-64Y 65+Y
1 Congenital Anomalies
92 Unintentional Injury
76 Unintentional Injury
107 Unintentional Injury
1,219 Cancer 2,727
Heart Disease 10,171
2 Short Gestation
64 Cancer
30 Suicide
62 Suicide
514 Heart Disease
1,853 Cancer 8,850
3 Maternal Complications
31 Suicide
16 Homicide
32 Cancer
301 Unintentional Injury
1,175
Chronic Lower Respiratory Disease 3,293
4 Unintentional Injury
23
Congenital Anomalies
13 Cancer
8 Homicide
268 Liver Disease
591 Alzheimer's Disease
2,997
5 SIDS 14
Homicide 10
Heart Disease *
Heart Disease 248
Diabetes 545
Stroke 2,292
6 Intrauterine hypoxia
11 Influenza & Pneumonia
* Abnormal Findings
* Liver Disease
149
Chronic Lower Respiratory Disease
460 Unintentional Injury
1,485
7 Homicide
10
Chronic Lower Respiratory Disease
* Diabetes
77 Suicide
413 Diabetes
1,411
8 Respiratory Distress
6 Asthma
* Obesity
45 Stroke
304 Hypertension
850
9 Influenza & Pneumonia
* Stroke
44 Hypertension
149 Parkinson's Disease
737
10 HIV 20
Influenza & Pneumonia 125
Influenza & Pneumonia 697
ADHS Vital Records 2017 All age group rank

The 3 leading causes of death by both count and years of potential life lost (YPLL) are heart disease, cancer and unintentional injury.
ADHS Vital Records 2017
12,285
11,917
4,085
3,779
3,050
2,647
2,037
1,304
1,122
1,018
1. Heart disease
2. Cancer
3. Unintentional injury
4. Chronic lower respiratory diseases
5. Alzheimer's disease
6. Cerebrovascular diseases
7. Diabetes
8. Suicide
9. Chronic liver disease & cirrhosis
10. Essential (primary) hypertension &hypertensive renal disease
Cause of Death (count) 89,604
82,697
56,505
35,206
18,741
16,485
16,275
14,133
10,060
4,690
1. Unintentional injury
2. Cancer
3. Heart disease
4. Suicide
5. Chronic liver disease & cirrhosis
6. Diabetes
7. Homicide
8. Chronic lower respiratorydiseases
9. Cerebrovascular diseases
10. Influenza & pneumonia
Cause of death (YPLL)

For 2018, Arizona ranked 30th according to America’s Health Ranking Annual Report.
America’s Health Ranking 2018 Annual Report - Arizona
Positive impact includes measures where Arizona is standard deviations from the national average.
Top Positive Impacts: Cancer Deaths Preventable Hospitalizations Smoking
Top Negative Impacts: Violent Crime Air Pollution High School Graduation
Positive impact includes measures where Arizona is standard deviations from the national average.

MATERNAL & CHILD HEALTH

Infant births over the last 10 years have decreased from more than 102,000 to 81,664.
Note: May include records with unknown county of residence. < 200 > 50,000
ADHS Vital Records 2007 – 2017
102,687
81,664
2007 2008 2009 2010 2011 2012 2013 2014 2015 2016 20172017 Births

In 2017, the infant (less than 1) mortality rate was lower than the national average. Black, American Indian/Alaska Native, and Hispanic Arizonans are disproportionately impacted.
ADHS Vital Records 2013 – 2017
Arizona and U.S. infant mortality rate, per 1,000 live births
5.3
6.2
5.6
5.4
5.6
2013 2014 2015 2016 2017
White non-Hipanic
Hispanic/ Latino
Black/African American American
Indian/Alaska Native
Asian/Pacific Islander
0
2
4
6
8
10
12
14
2013 2014 2015 2016 2017

Infant Mortality
Congenital malformations, deformations and chromosomal
abnormalities were the leading cause of infant deaths.
ADHS Vital Records 207
In 2017,
Short gestation & low birth weight
Congenital anomalies
Maternal complications
Unintentional injury
Sudden Infant Death Syndrome

Less than half of women have received advice about ways to prepare for healthy pregnancy
3 in 10 women prepare for healthy pregnancy with daily folic acid
2015 – 2017 BRFSS
A Snapshot of Preconception Health Women ages 18-45 were included in this analysis.

Between 2014 – 2017, 8 in 10 pregnant women in AZ received adequate prenatal care.
> 77% 61 - 70% < 50% ADHS Vital Records 2014 – 2017
68.1%
81.2%
American Indian orAlaska Native
Asian or PacificIslander
Black or AfricanAmerican
Hispanic or Latino White non-Hispanic
Percent receiving intermediate or adequate prenatal care by race/ethnicity

Rates of maternal mortality are on the rise both in Arizona and nationally. Based on the most recent Maternal Mortality Review, American Indian or Alaska Native women had the highest rate at 284 per 100,000 live births.
284
90 70
176
American Indianor Alaska Native
Hispanic orLatino
White, non-Hispanic
Other*
Maternal Mortality Review rates by race/ethnicity
ADHS Vital Records 2010 – 2016 and Arizona Maternal Mortality Review Program, 2012 – 2015
18.3 20.3
26.4
2010-2014 2011-2015 2012-2016
Maternal mortality rate per 100,000 live births

Since 2012, Neonatal Abstinence Syndrome (NAS) rates in Arizona have more than doubled.
3.7
7.9
2012 2013 2014 2015 2016 2017
NAS rate per 1,000 hospital births
Arizona Hospital Discharge Data 2012 – 2017 0 5 - 10 > 20
2017 NAS rates

Breastfeeding rates in Arizona follow national trends. 82.7% of Arizona’s infants born in 2015 were breastfed with 26.3% exclusively breastfed at 6 months.
National Immunization Survey, 2013 – 2015
0%
20%
40%
60%
80%
100%
2013 2014 2015
AZ Ever Breastfed U.S. Ever Breastfed
U.S. Breastfed at 1 year AZ Breastfed at 1 year
AZ Exclusively Breastfed at 6 months U.S. Exclusively Breastfed at 6 months

Mortality 15 - 19Y
Cancer
Homicide
Suicide
Mortality 1 - 14Y
Cancer
Congenital anomalies
Heart disease
Unintentional injury
Unintentional injury
ADHS Vital Records 2017
Unintentional injury was the leading cause
of death among children and adolescents.
In 2017,
Suicide
Homicide

Tooth decay is the #1 chronic disease in Arizona children.
2015 Healthy Smiles Healthy Bodies Survey

Non-medical exemption rates for childhood immunizations have increased across age groups. In the event of an outbreak, over 5,000 Arizona kindergarteners would be at risk for measles.
2017 Arizona Immunization Coverage Status Report
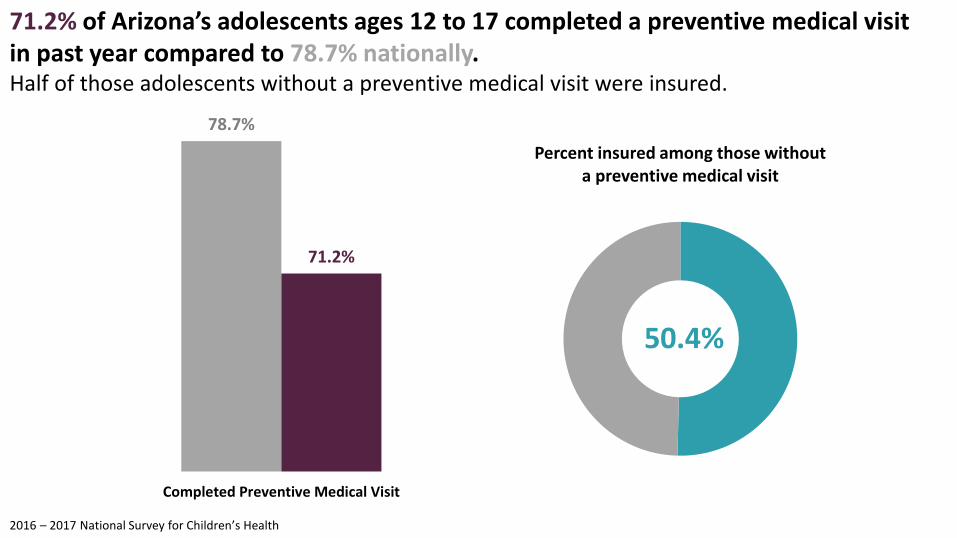
71.2% of Arizona’s adolescents ages 12 to 17 completed a preventive medical visit in past year compared to 78.7% nationally. Half of those adolescents without a preventive medical visit were insured.
2016 – 2017 National Survey for Children’s Health
78.7%
71.2%
Completed Preventive Medical Visit
50.4%
Percent insured among those without a preventive medical visit

Among Arizona’s children with a special healthcare need, 36.6% have a medical home. (Arizona vs. U.S.)
2016 – 2017 National Survey for Children’s Health
36.6%
43.2%
Arizona U.S.

52.3%
18.1%
11.8%
6.1%
6.5% 5.2%
012345 or more
Arizona ranks last in the country as the state with the highest proportion of children ages 0 – 17 who have experienced 2 or more ACEs at 30%. Parental separation or divorce and economic hardship are the most common ACEs in Arizona.
32%
27%
16%
13%
11%
Parent/guardian served time in jail
Saw or heard adult violence
Parent/guardian divorced or separated
Hard to cover basics like food or housing
Lived with someone who had problem with alcohol or drugs
2016 National Survey for Children’s Health

36.4%
2017 YRBSS
36.4% of students report feeling sad or hopeless almost every day for 2 weeks or more in a row so that they stopped doing some usual activities. Additionally, more than 1 in 10 Arizona youth indicating attempting suicide with 4.7% requiring medical treatment as a result of a suicide attempt. (AZ vs. U.S.)
11.3%
4.7%
7.4%
2.4%
Attempted suicide Suicide attempt with injury

Fewer teens reported smoking in 2017 compared to 2013.
2013 – 2017 YRBSS
AZ 43.9%
29.9%
U.S. 41.1%
2013 2015 2017
Ever tried cigarette smoking
AZ U.S.
AZ 20.1%
9.5%
U.S. 21.0%
2013 2015 2017
Currently smoke cigarettes or cigars
AZ U.S.

While 1 in 2 teens have ever used an electronic vapor product, 16.1% report current use. Current use of electronic vapor products has decreased from 27.5% in 2015. (AZ vs. U.S.)
2015 – 2017 YRBSS
27.5%
16.1%
24.1%
13.2%
2015 2017

Arizona’s teen pregnancy rate has decreased to a low at 13.8. Teen pregnancies accounted for 6.7% of pregnancies in the state in 2016 with a greater impact on American Indian/Alaska Native, Hispanic, and Black/African American female teens.
24.7
19.3
17.3
9.5
5
American Indian or AlaskaNative
Hispanic/Latina
Black/African American
White non-Hispanic
Asian/Pacific Islander
2016 Teen Pregnancy rate per 1,000 live births
ADHS Vital Records 2007 – 2017
0
10
20
30
40
2007 2008 2009 2010 2011 2012 2013 2014 2015 2016 2017

HEALTHY ADULTS

Cancer
Diabetes
Mortality 45 - 64Y
Heart disease
Unintentional injury
Suicide
Cancer
Homicide
Mortality 20 - 44Y
Liver disease
ADHS Vital Records 2017
Unintentional deaths was the leading cause
of death among adults ages 20 – 44.
In 2017,
Cancer was the leading cause of
death among adults ages
45 – 64. Unintentional injury
Heart disease

46.3
AZ 55.3
39.4
U.S. 49.4
2013 2014 2015 2016 2017
Unintentional injury-related mortality rates are on the rise both in Arizona and nationally with rates more than 2.5 times higher among American Indian Arizonans.
0
20
40
60
80
100
120
140
160
AmericanIndian or
Alaska Native
AfricanAmerican or
Black
White Non-Hispanic
Hispanic orLatino
Asian orPacific
IslanderADHS Vital Records 2013 – 2017

Suicide mortality rates in Arizona remain higher than national rates. Suicide deaths accounted for the loss of 1,304 Arizonans in 2017 with more than half identifying firearm as the injury type.
ADHS Vital Records 2013 – 2017
0% 20% 40% 60%
Firearm
Suffocation/Hanging
Poisoning
Cut/Pierce
Other
Not Specified
Fall
Drowning
17
AZ 18.0
12.6
U.S. 14.0
2013 2014 2015 2016 2017

0
20
40
60
80
10-14Y 15-19Y 20-24Y 25-34Y 35-44Y 45-54Y 55-64Y 65-74Y 75+Y
Mortality rates by age group and sex
Males accounted for more than 75% of the suicide deaths in Arizona last year. The highest rates are seen among men ages 55 to 64 and over 75. (Male vs. Female)
ADHS Vital Records 2017

The invasive cancer incidence rate from 2011 to 2015 impacted an average of 29,943 people each year. Arizona’s incidence rate remains lower than the national rate.
U.S. Cancer Statistics , CDC and National Cancer Institute
406.8 AZ 379.8
465.4 U.S. 437.7
2011 2012 2013 2014 2015
Invasive Cancer Incidence Rate
< 310 > 425 2011 – 2015 Invasive Cancer incidence rates

Cancer mortality rates in Arizona remain lower than national rates.
ADHS Vital Records 2012 – 2017 < 120 > 160 2017 Cancer mortality rates
144.8 AZ 136.7
163.2 U.S. 152.5
2013 2014 2015 2016 2017
Cancer Mortality Rates

The Arizona age-adjusted mortality rate for heart disease, the state’s leading cause of death, has remained below the U.S. rate over the last 5 years.
AZ Vital Records 2013 – 2017
2017 Heart disease mortality < 120 > 200
143 AZ
141.9
169.8 U.S. 165
2013 2014 2015 2016 2017

The Arizona diabetes mortality rate was 23.8 deaths per 100,000 population in 2017 with rates ranging from 16.5 to 60.2 by county.
ADHS Vital Records 2013 - 2017 < 20 > 50 2017 Diabetes mortality
23.6 AZ 23.8
21.2
U.S. 21.5
2013 2014 2015 2016 2017

Cancer
Mortality 65+
Heart disease
ADHS Vital Records 2017
Heart disease was the leading cause of death
among Arizonans ages 65 and
older.
In 2017,
Chronic lower respiratory disease
Alzheimer’s disease
Stroke

3,780 Arizonans died due to Chronic Lower Respiratory Disease (CLRD) in 2017. The 2017 CLRD mortality rate was 43 deaths per 100,000 residents.
AZ Vital Records 2016 – 2017 < 11 30 – 40 > 60
44.5 AZ
43.0 39.4
U.S. 47.4
2013 2014 2015 2016 2017
2017 CLRD mortality

Arizona lost 3,050 Arizonans to Alzheimer’s disease in 2017. The Alzheimer’s disease mortality rate in Arizona remains higher than the national rate.
ADHS Vital Records 2013 – 2017 < 20 30 - 40 > 50 2017 Alzheimer’s disease mortality
33.3
AZ 35.2
23.5
U.S. 31
2013 2014 2015 2016 2017

Over the last 5 years, the stroke mortality rate in Arizona has increased.
ADHS Vital Records 2013 – 2017 < 25 30 – 35 > 40 2017 Stroke mortality
28.2
AZ 38
36.2 U.S. 37.6
2013 2014 2015 2016 2017

HEALTHY ADULTS Behavioral Risk Factors

Arizona continues to follow the national average for healthy weight, overweight, and obesity. (Arizona vs. U.S.)
2013 – 2017 BRFSS
35.8%
32.9% 33.4%
2013 2014 2015 2016 2017Adults at a healthy weight

Over the last 5 years, the percentage of Arizonans who reported currently smoking has remained below the national average.
2013 – 2017 BRFSS < 11% > 20%
16.3% AZ
15.6%
19.0%
U.S. 17.1%
2013 2014 2015 2016 2017 2017 Adult smoking

Disparities in income and race/ethnicity exist for smoking prevalence in the state. 28.6% of Arizonans with an income less than $15,000 and 17.8% of African American Arizonans are current smokers.
2017 BRFSS
0%
10%
20%
30%
40%
Less than$15,000
$15,000 to$24,999
$25,000 to$34,999
$35,000 to$49,999
$50,000 to$74,999
$75,000 +6.3%
12.9%
14.5%
16.4%
17.8%
Asian/Pacific Islander
American Indian/AlaskaNative
Hispanic
Non-Hispanic White
Black/African American

5.3% of Arizonan adults use e-Cigarettes. Use of eCigarettes was initially captured in the 2016 BRFSS.
2016 – 2017 BRFSS < 2% > 7%
5.3% 5.3%
4.7%
2016 2017
2017 Adult e-Cigarette use

15.2% of Arizonans report binge drinking which has been below the national average for the last 5 years with pending 2017 national results.
2013 – 2017 BRFSS < 6% > 16%
13.4%
AZ 15.2%
16.8%
U.S. 16.9%
2013 2014 2015 2016 2017
2017 Adult binge drinking

586 671 621
561 454
526 569 679
800 949
69 96 89 123 92 137 190
248 311 344
517 575 532
438 362 389 379
431 489
605
2008 2009 2010 2011 2012 2013 2014 2015 2016 2017
Total Opioid
Rx/Synthetic Opioid Deaths
Heroin Deaths
ADHS Vital Statistics 2017
Arizona has been facing an opioid epidemic leading to hundreds of death each year.

0% 2% 4% 6% 8% 10% 12% 14% 16% 18% 20%
Hydromorphone
Tramadol
Methadone
Hydrocodone
Morphine
Cocaine
Fentanyl
Methamphetamine
Other Rx Opiate
Benzodiazepine
Oxycodone
Heroin
Heroin and oxycodone were the opiate drugs most commonly noted in overdoses determined to be due to opioids during review June 15,2017- November 29, 2018.
ADHS 5-day Opioid Surveillance System

29.5%
26.5%
≥ 75
65-74 Y
55-64 Y
45-54 Y
35-44 Y
25-34 Y
18-24 Y
15-17 Y
0-14 Y
Male Female Fatal
Verified Fatal Opioid Overdoses by Age and Gender: June 15, 2017-June 14, 2018
ADHS 5-day Opioid Surveillance System

Schizophrenia or schizoaffective
PTSD
Cancer
Anxiety
Diabetes
Suicidal ideation
Bipolar disorder
Depression
Chronic pain
0 200 400 600 800 1000 1200 1400 1600 1800
History of substance abuse including alcohol
COPD
Chronic pain was the most common pre-existing condition for non-fatal overdoses determined to be due to opioids during review June 15,2017- November 29, 2018.
ADHS 5-day Opioid Surveillance System
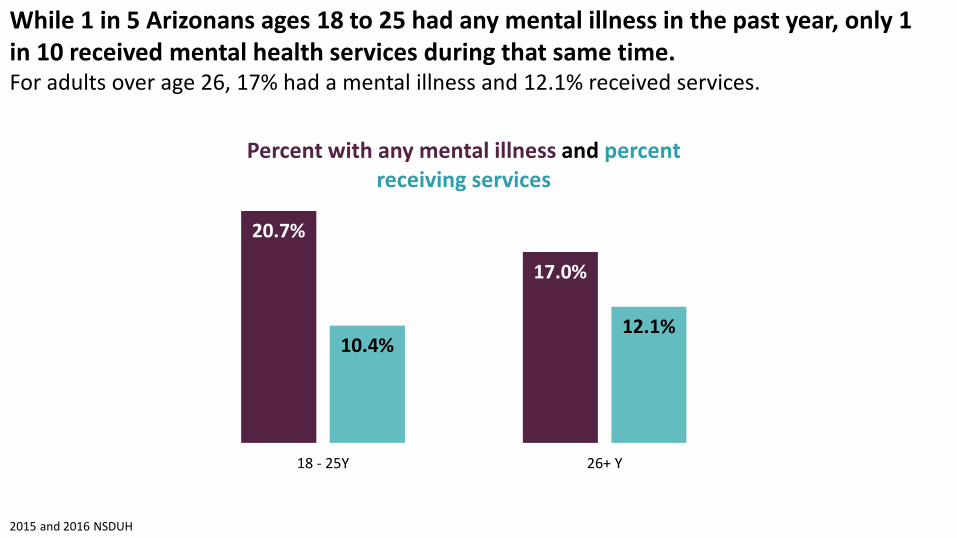
While 1 in 5 Arizonans ages 18 to 25 had any mental illness in the past year, only 1 in 10 received mental health services during that same time. For adults over age 26, 17% had a mental illness and 12.1% received services.
20.7%
17.0%
10.4% 12.1%
18 - 25Y 26+ Y
Percent with any mental illness and percent receiving services
2015 and 2016 NSDUH
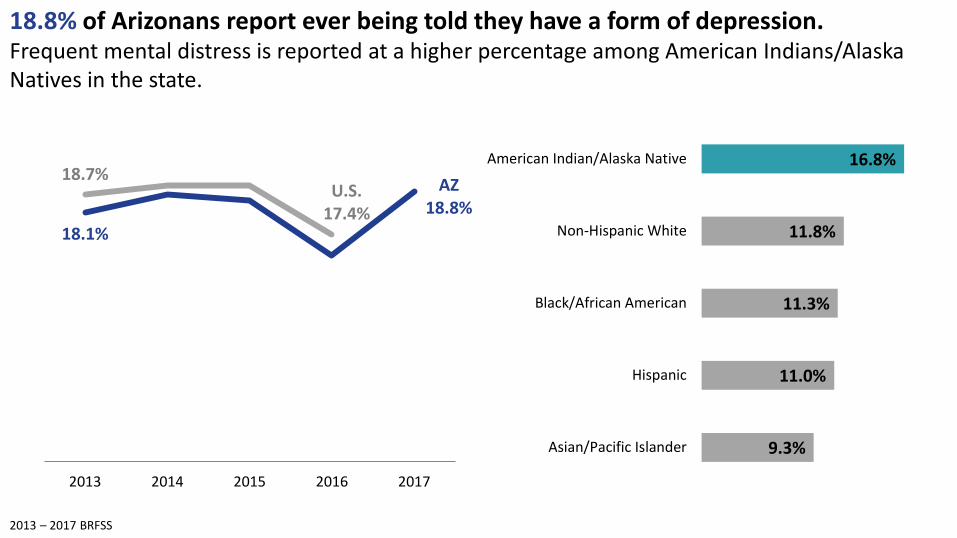
18.8% of Arizonans report ever being told they have a form of depression. Frequent mental distress is reported at a higher percentage among American Indians/Alaska Natives in the state.
2013 – 2017 BRFSS
9.3%
11.0%
11.3%
11.8%
16.8%
Asian/Pacific Islander
Hispanic
Black/African American
Non-Hispanic White
American Indian/Alaska Native
18.1%
AZ 18.8%
18.7% U.S.
17.4%
2013 2014 2015 2016 2017

STD cases have tripled since 2000 with 2016 rates indicating distribution statewide.
17,185
54,573
2000 2017
*2016 - Darker shades indicate higher rates.
CHLAMYDIA
GONORRHEA
EARLY SYPHILIS
Arizona Department of Health Services, 2017 STD Dashboard

The majority of people with hepatitis C are baby boomers. While rates of hepatitis C are increasing both in AZ and nationally, rates are higher among Arizonans.
104 109
66 73
2014 2015
US
AZ
ADHS Epidemiology and Disease Surveillance 2017

TRIBAL HEALTH

35% of American Indian/Alaskan Native Arizonans are living below the poverty level. American Indian/Alaskan Native Arizonans report the lowest percentage of very good or excellent health.
U.S. Census Bureau, 2012 – 2016 American Community Survey 5-year period estimates and BRFSS 2016
35% 25.5%
72.3%
AmericanIndian/Alaskan
Native
Hispanic Multiracial Other Black White Asian

In 2016, the leading cause of death among American Indian/Alaska Natives by gender and residence is unintentional injury for almost all groups with rates exceeding 12 deaths per 100,000 residents.
ADHS Vital Records 2016
Rank Female,
resided on reservation Female,
resided off reservation Male,
resided on reservation Male,
resided off reservation
1 Unintentional injury
12.4 Cancer
13.3 Unintentional injury
20.2 Unintentional injury
19.3
2 Heart disease
11.8 Heart disease
12.5 Heart disease
12.0 Heart disease
12.6
3 Cancer
10.5 Liver disease
10.2 Liver disease
8.8 Liver disease
9.6
4 Liver disease
8.5 Diabetes
7.8 Diabetes
8.4 Cancer
8.2
5 Diabetes
8.1 Unintentional injury
6.6 Cancer
7.3 Diabetes
6.4

ADHS Vital Records 2011 - 2015
Among American Indian/Alaska Natives in Arizona, unintentional injury is the leading cause of death with a mortality rate of 139 per 100,000 persons. The motor vehicle-related injury mortality rate for the same year was 54.3.
44.2
54.3
2011 2012 2013 2014 2015
Motor vehicle-related injury mortality rate
0
40
80
120
160
2012 2013 2014 2015 2016
American Indian unintentional mortality rate

HEALTHY COMMUNITIES

The average life expectancy in Arizona is 79.5 years. Six of the state’s counties fall below the nation average life expectancy of 78.6 years.
> 80 78 - 79 77 75 - 76 < 75 Virginia Commonwealth University, Center on Society and Health

A 13 mile distance could mean a difference in 14 years of life.
71 YRS ZIP 85004
85 YRS ZIP 85258
Virginia Commonwealth University, Center on Society and Health

13.5% of Arizonans report an education level less than high school degree compared to 12.7% nationally.
U.S. Census Bureau, 2013 - 2017 American Community Survey 5-year period estimates
13.5% 12.7%
Less than high school degree High school degree Some college education College graduate

17% of Arizonans are living below the federal poverty level.
< 16% > 30% U.S. Census Bureau, 2013 – 2017 American Community Survey 5-year period estimates
17%

4.6%
4.6% of Arizonans are unemployed.
9%
< 5% > 8% U.S. Bureau of Labor Statistics, August 2018

Among Arizonans reporting a good overall health status, higher percentages were identified among those with at least a high school degree and those with an income over $15,000.
2017 BRFSS
62.2%
83.9%
Less than High School At least High School
56.7%
84.8%
<$15,000 >$15,000

Almost 1 in 4 of Arizona’s children are living below the federal poverty level and 30.3% of children are living in households with public assistance including SSI, cash public assistance or SNAP benefits.
U.S. Census Bureau, 2013 – 2017 American Community Survey 5-year period estimates
30.3%

Since 2012, Arizona has seen an increase in residents with health insurance, however, we remain below the national average.
> 87% < 80% U.S. Census Bureau, 2012 – 2016 American Community Survey 5-year period estimates
83.0%
AZ 86.4%
85.1%
U.S. 88.3%
2012 2013 2014 2015 2016

Arizona suffers from a disproportionate distribution of providers evident by a total of 546 federally designated Health Professional Shortage Areas (HPSAs).
Primary Care Dental Mental Health
187 183 176
ADHS Health Systems Development, Health Resources and Services Administration

14.9% of households in Arizona face food insecurity. Low food access areas include areas where people lack access to healthy food and fresh produce. This negatively affects the health of low-income individuals because they lack the means to travel to obtain healthier foods.
USDA, Economics of Food, Farming, Natural Resources, and Rural America and 2015 USDA ERS Food access by census tract
12.3% AZ 14.9%
11.0%
U.S. 13.7%
2001-2003 2004-2006 2007-2009 2010-2012 2013-2015

The 2017 Point in Time survey identified an estimated 8,947 sheltered and unsheltered homeless individuals statewide. (Unsheltered vs. Sheltered) Between 2016 and 2017, the total number of homeless individuals increased by 3%.
AZ Department of Economic Security 2017 Annual Homeless Report
3,244 3,166
5,440 5,781
2016 2017

1 in 2 Arizonans pay a gross rent of 30% or more of their household income.
U.S. Census Bureau, 2012 – 2016 American Community Survey 5-year period estimates
8.7%
40.8%
Less than 15% 15 - 19% 20 - 24.9% 25 - 29.9% 30 - 34.9% 35% or more

45.3%
55.4%
AZ U.S.
Supportive Neighborhood
Fewer of Arizona’s adults believe their children live in a supportive neighborhood compared to nationally. 58.8% definitely agree their children live in a safe neighborhood.
2016 – 2017 Combined National Survey of Children’s Health
8.8%
32.4%
58.8%
Somewhat or definitely disagree
Somewhat agree
Definitely agree
Safe Neighborhood

Social vulnerability index (SVI) ranks communities by social factors and estimates readiness or vulnerability in the event of a emergency. The closer to 1 indicates the highest risk.
Socioeconomic Status
• Below Poverty • Unemployed • Income • No High School Diploma
Household Composition &
Disability
• Aged 65 or Older • Aged 17 or Younger • Civilian with a Disability • Single-Parent
Households
Minority Status & Language
• Minority • Speak English “Less than
Well”
Housing & Transportation
• Multi-Unit Structures • Mobile Homes • Crowding • No Vehicle • Group Quarters
ATSDR Social Vulnerability Index, 2016 < .65 .70 - .80 > .90

In 2017, 3 of Arizona’s counties ranked in the top 10 worst according to EPA’s Air Quality Index (AQI).
U.S. Environmental Protection Agency, 2017
Rank County State Median AQI
1 Hawaii HI 146
2 Riverside CA 87
3 Gila AZ 84
4 Kern CA 84
5 San Bernardino CA 84
Rank County State Median AQI
6 Tulare CA 80
7 Los Angeles CA 77
8 Pinal AZ 75
9 Fresno CA 74
10 Maricopa AZ 71

Arizona has $50 per person dedicated for public health from state and federal dollars directed by the CDC and HRSA, falling well below the national average of $86 per person with a public health funding ranking of 47th in the country.
$50
$86
AZ U.S.
Trust for America’s Health, 2015 – 2016; U.S. HHS, 2015 – 2016; U.S. Census Bureau, Annual Estimates of the Resident Population: April 1, 2010 to July 1, 2016

OPPORTUNITIES FOR HEALTH

Health priorities identified by Arizona’s County Health Improvement Plans
Substance Abuse Mental Health
Chronic Disease Heart Disease Diabetes
Safe Neighborhoods Injury Prevention
Obesity Health Lifestyles Nutrition & Physical Activity
Access to Care Health Literacy
Maternal & Child Health Teen Pregnancy

Impact of different factors on risk of premature death
Schroeder, SA (2007). We Can Do Better – Improving the Health of the American People. NEJM. 357:1221-8

Healthy People Healthy Communities: Moving Towards Health Equity
Robert Wood Johnson Foundation https://www.rwjf.org/en/library/features/achieving-health-equity.html#equity-in-action

Discussion
• How do we use this data to take action?
• What takeaways do you have from this snapshot?
• Would additional analysis be useful in understanding the health of Arizonans?
• How would you prioritize resources and activities?