State Injury Profile for Oklahoma - Centers for Disease...
26
State Injury Profile for Oklahoma
Transcript of State Injury Profile for Oklahoma - Centers for Disease...

State Injury Profilefor Oklahoma


The CDC State Injury Profiles
Gathering and sharing reliable data about the broad range of public health problems is among the many ways the Centers for Disease Control and Prevention protect the safety and health of Americans.
Policy makers and health care workers need access to the best, most current data available so they can make informed decisions about where to allocate limited resources to prevent diseases and injuries. Yet, many people find statistics difficult to understand and interpret. This State Injury Profile offers an easier way to look at statistics. Through maps and graphs, the Profile clearly shows how this state compares with others in the nation and what injury problems are most pressing.
CDC's National Center for Injury Prevention and Control gathers data about a broad range of intentional and unintentional injuries or what many people call 'violence' and 'accidents.' Injuries affect everyone. Injury is the leading cause of death for all Americans ages one to 34, and injury remains one of the leading causes of death, no matter how long someone may live.
Maps and graphs in this State Injury Profile show this state's death rates from in falls, poisoning, drowning, suffocation, fires and burns, suicide, homicide, traumatic brain injury and injuries related to firearms. The graphics show how this state compares with others and with mortality rates in the United States as a whole. You will also find a table showing the Ten Leading Causes of Death for the United States and for this state.
is a county-by-county map showing locations with higher for each type of injury.
you'll also find a list of all CDC-funded injury prevention and research programs
DEPARTMENT OF HEALTH AND HUMAN SERVICESCenters for Disease Control and Prevention
National Center for Injury Prevention and Control
New this year death rates
In addition to injury data, in this state for 2001.

To learn more
After you page through the State Injury Profile, if you want to know more, CDC has made it easy for you to find additional information about any injury and public health. Simply visit Or call the CDC National Center for Injury Prevention and Control, Office of Planning, Evaluation and Legislation at 1-770-488-4936.
These other resources offered or funded by the CDC may also interest you:
General information about injury in America
Customized data reports,
Consumer facts and tip sheets, or call the SafeUSA hotline toll free at 1-800-252-7751.
Intentional Injury
National Resource Center on Domestic Violence, 1-800-537-2238
National Sexual Violence Resource Center, or call 1-877-739-3895
National Violence Against Women Prevention Research Center, or call 1-843-792-2945
National Youth Violence Prevention Resource Center, or call 1-866-SAFEYOUTH (723-3968)
Violence Against Women Electronic Network (VAWnet),or call 1-800-537-2238
Unintentional Injury
National Program for Playground Safety, or call 1-800-554-PLAY (7529)
National Resource Center on Aging and Injury,or call 1-619-594-0986
www.cdc.gov/ncipc.
www.cdc.gov/ncipc/wisqars
www.cdc.gov/ncipc/safeusa
www.nsvrc.org
www.violenceagainstwomen.org
www.safeyouth.org
www.vawnet.org
www.uni.edu/playground
www.olderadultinjury.org
,
,
,
,
,
,

State Injury Profile for Oklahoma1989-1998
TM. .SAFER HEALTHIER PEOPLE
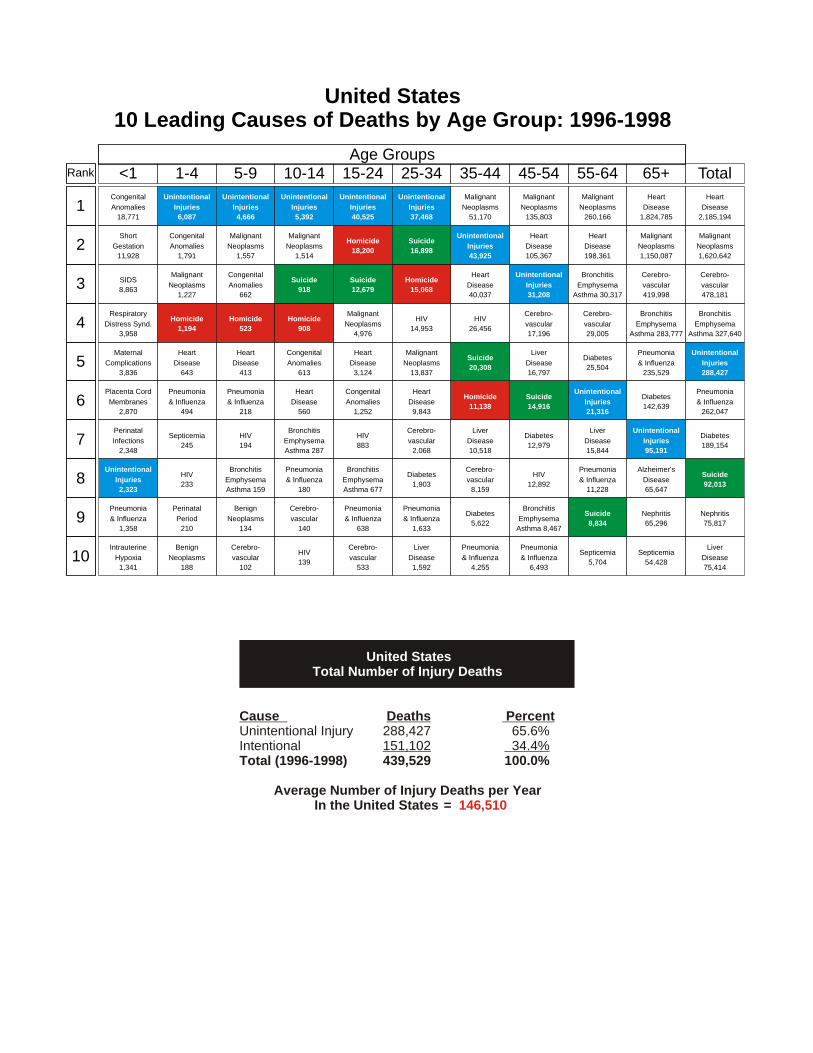
United StatesTotal Number of Injury Deaths
Cause Deaths PercentUnintentional Injury 288,427 65.6%Intentional 151,102 34.4%Total (1996-1998) 439,529 100.0%
Average Number of Injury Deaths per Year In the United States = 146,510
1
2
3
4
5
6
7
8
9
10
Total<1 1-4 5-9 10-14 15-24 25-34 35-44 45-54 55-64 65+Rank
Age Groups
Congenital
Anomalies
18,771
Short
Gestation
11,928
SIDS
8,863
Respiratory
Distress Synd.
3,958
Maternal
Complications
3,836
Placenta Cord
Membranes
2,870
Perinatal
Infections
2,348
Unintentional
Injuries
2,323
Pneumonia
& Influenza
1,358
Intrauterine
Hypoxia
1,341
Unintentional
Injuries
6,087
Congenital
Anomalies
1,791
Malignant
Neoplasms
1,227
Homicide
1,194
Heart
Disease
643
Pneumonia
& Influenza
494
Septicemia
245
HIV
233
Perinatal
Period
210
Benign
Neoplasms
188
Unintentional
Injuries
4,666
Malignant
Neoplasms
1,557
Congenital
Anomalies
662
Homicide
523
Heart
Disease
413
Pneumonia
& Influenza
218
HIV
194
Bronchitis
Emphysema
Asthma 159
Benign
Neoplasms
134
Cerebro-
vascular
102
Unintentional
Injuries
5,392
Malignant
Neoplasms
1,514
Suicide
918
Homicide
908
Congenital
Anomalies
613
Heart
Disease
560
Bronchitis
Emphysema
Asthma 287
Pneumonia
& Influenza
180
Cerebro-
vascular
140
HIV
139
Unintentional
Injuries
40,525
Homicide
18,200
Suicide
12,679
Malignant
Neoplasms
4,976
Heart
Disease
3,124
Congenital
Anomalies
1,252
HIV
883
Bronchitis
Emphysema
Asthma 677
Pneumonia
& Influenza
638
Cerebro-
vascular
533
Unintentional
Injuries
37,468
Suicide
16,898
Homicide
15,068
HIV
14,953
Malignant
Neoplasms
13,837
Heart
Disease
9,843
Cerebro-
vascular
2,068
Diabetes
1,903
Pneumonia
& Influenza
1,633
Liver
Disease
1,592
Malignant
Neoplasms
51,170
Unintentional
Injuries
43,925
Heart
Disease
40,037
HIV
26,456
Suicide
20,308
Homicide
11,138
Liver
Disease
10,518
Cerebro-
vascular
8,159
Diabetes
5,622
Pneumonia
& Influenza
4,255
Malignant
Neoplasms
135,803
Heart
Disease
105,367
Unintentional
Injuries
31,208
Cerebro-
vascular
17,196
Liver
Disease
16,797
Suicide
14,916
Diabetes
12,979
HIV
12,892
Bronchitis
Emphysema
Asthma 8,467
Pneumonia
& Influenza
6,493
Malignant
Neoplasms
260,166
Heart
Disease
198,361
Bronchitis
Emphysema
Asthma 30,317
Cerebro-
vascular
29,005
Diabetes
25,504
Unintentional
Injuries
21,316
Liver
Disease
15,844
Pneumonia
& Influenza
11,228
Suicide
8,834
Septicemia
5,704
Heart
Disease
1,824,785
Malignant
Neoplasms
1,150,087
Cerebro-
vascular
419,998
Bronchitis
Emphysema
Asthma 283,777
Pneumonia
& Influenza
235,529
Diabetes
142,639
Unintentional
Injuries
95,191
Alzheimer's
Disease
65,647
Nephritis
65,296
Septicemia
54,428
Heart
Disease
2,185,194
Malignant
Neoplasms
1,620,642
Cerebro-
vascular
478,181
Bronchitis
Emphysema
Asthma 327,640
Unintentional
Injuries
288,427
Pneumonia
& Influenza
262,047
Diabetes
189,154
Suicide
92,013
Nephritis
75,817
Liver
Disease
75,414
United States10 Leading Causes of Deaths by Age Group: 1996-1998

OklahomaTotal Number of Injury Deaths
Cause Deaths PercentUnintentional Injury 4,794 68.3%Intentional Injury 2,225 31.7%Total (1996-1998) 7,019 100.0%
Average Number of Injury Deaths per YearIn Oklahoma = 2,340
1
2
3
4
5
6
7
8
9
10
Total<1 1-4 5-9 10-14 15-24 25-34 35-44 45-54 55-64 65+Rank
Age Groups
Congenital
Anomalies
261
SIDS
144
Short
Gestation
117
Respiratory
Distress Synd.
62
Perinatal
Infections
44
Unintentional
Injuries
41
Placenta Cord
Membranes
38
Maternal
Complications
30
Pneumonia
& Influenza
19
Intrauterine
Hypoxia
13
Unintentional
Injuries
113
Congenital
Anomalies
25
Homicide
17
Heart
Disease
13
Malignant
Neoplasms
7
Perinatal
Period
5
Benign
Neoplasms
3
Cerebro-
vascular
2
Pneumonia
& Influenza
2
2
Tied
Unintentional
Injuries
85
Malignant
Neoplasms
22
Congenital
Anomalies
9
Heart
Disease
7
Homicide
7
Septicemia
4
Benign
Neoplasms
3
Bronchitis
Emphysema
Asthma 3
Pneumonia
& Influenza
2
6
Tied
Unintentional
Injuries
91
Homicide
25
Malignant
Neoplasms
23
Suicide
14
Bronchitis
Emphysema
Asthma 7
Congenital
Anomalies
6
Heart
Disease
3
Nephritis
3
Pneumonia
& Influenza
3
3
Tied
Unintentional
Injuries
724
Suicide
237
Homicide
208
Malignant
Neoplasms
64
Heart
Disease
47
Bronchitis
Emphysema
Asthma 17
Congenital
Anomalies
14
Pneumonia
& Influenza
9
Cerebro-
vascular
6
Diabetes
6
Unintentional
Injuries
575
Suicide
255
Malignant
Neoplasms
190
Homicide
179
HIV
120
Heart
Disease
114
Diabetes
36
Cerebro-
vascular
34
Pneumonia
& Influenza
21
2
Tied
Unintentional
Injuries
696
Malignant
Neoplasms
690
Heart
Disease
650
Suicide
319
HIV
166
Homicide
162
Liver
Disease
151
Cerebro-
vascular
124
Diabetes
98
Pneumonia
& Influenza
54
Malignant
Neoplasms
1,807
Heart
Disease
1,701
Unintentional
Injuries
490
Cerebro-
vascular
232
Suicide
226
Liver
Disease
210
Diabetes
186
Bronchitis
Emphysema
Asthma 128
Pneumonia
& Influenza
107
Homicide
99
Malignant
Neoplasms
3,601
Heart
Disease
3,325
Bronchitis
Emphysema
Asthma 549
Cerebro-
vascular
419
Unintentional
Injuries
396
Diabetes
382
Liver
Disease
207
Pneumonia
& Influenza
170
Suicide
128
Septicemia
78
Heart
Disease
27,971
Malignant
Neoplasms
15,058
Cerebro-
vascular
6,274
Bronchitis
Emphysema
Asthma 4,279
Pneumonia
& Influenza
3,622
Diabetes
1,872
Unintentional
Injuries
1,576
Nephritis
1,152
Athero-
sclerosis
1,060
Septicemia
829
Heart
Disease
33,885
Malignant
Neoplasms
21,472
Cerebro-
vascular
7,101
Bronchitis
Emphysema
Asthma 5,044
Unintentional
Injuries
4,794
Pneumonia
& Influenza
4,009
Diabetes
2,580
Suicide
1,435
Nephritis
1,291
Athero-
sclerosis
1,144
Oklahoma10 Leading Causes of Deaths by Age Group: 1996-1998

w
Oklahoma Only Unintentional Injury
Cause Deaths PercentMV Traffic 2,397 50.0%Fall 522 10.9%Poisoning 309 6.4%Suffocation 217 4.5%Fire/Burn 205 4.3%Other Causes 1,144 23.9%
4,794 100.0%
w
Oklahoma Only Homicide and Legal Intervention
Cause Deaths PercentFirearm 496 62.8%Cut/Pierce 75 9.5%Suffocation 21 2.7%Other Causes 198 25.1%
790 100.1%
w
Oklahoma Only Suicide
Cause Deaths PercentFirearm 936 65.2%Poisoning 219 15.3%Suffocation 216 15.1%Other Causes 64 4.5%
1,435 100.1%
Intentional Injury
Unintentional Injury
1996-1998 Leading Causes of Death
w
United StatesUnintentional Injury
Cause Deaths PercentMV Traffic 127,053 44.1%Fall 35,745 12.4%Poisoning 30,474 10.6%Suffocation 13,325 4.6%Drowning 12,416 4.3%Fire/Burn 10,809 3.7%Other Causes 58,605 20.3%
288,427 100.0%
w United States
Homicide and Legal Intervention
Cause Deaths PercentFirearm 39,951 67.6%Cut/Pierce 6,955 11.8%Suffocation 2,147 3.6%Other Causes 10,036 17.0%
59,089 100.0%
w
United StatesSuicide
Cause Deaths PercentFirearm 53,156 57.8%Suffocation 16,469 17.9%Poisoning 15,280 16.6%Other Causes 7,108 7.7%
92,013 100.0%

1989 1990 1991 1992 1993 1994 1995 1996 1997 1998
Year
0
4
8
12
16
20
24
28
32
36
United States Oklahoma
Ra
te p
er
10
0,0
00
United States and Oklahoma1989-1998
Unintentional Motor Vehicle, Traffic-Related Death RatesUnited States, 1996-1998
NH 11.26VT 12.98MA 7.71RI 8.81CT 10.31NJ 10.00DE 16.06MD 12.74DC 10.24
Deaths per100,000 Population
20.77 - 32.36
16.47 - 20.76
12.74 - 16.46
7.71 - 12.73
HI 10.91
26.43
20.6726.07
12.20
16.68
18.69
21.23
21.22
12.44 16.47
15.87
19.51
20.38
21.18
13.49
15.13
12.97
32.36
20.53
23.51
18.21
20.59
9.44
20.77
16.06
12.40
23.90
16.07
13.07
24.08
20.64
22.48
19.67
17.67
13.55
13.32
18.86
13.79
24.66
12.29
24.13

1989 1990 1991 1992 1993 1994 1995 1996 1997 1998
Year
0
1
2
3
4
5
6
7
8
9
United States Oklahoma
Ra
te p
er
10
0,0
00
United States and Oklahoma1989-1998
Unintentional Fall Death RatesUnited States, 1996-1998
NH 4.22VT 3.90MA 2.74RI 4.68CT 4.03NJ 3.19DE 3.29MD 4.18DC 5.15
Deaths per100,000 Population
6.17 - 9.24
4.79 - 6.16
4.03 - 4.78
2.74 - 4.02
HI 4.87
2.83
7.034.45
3.87
6.61
4.17
6.33
6.63
3.62 3.34
6.48
5.54
4.16
3.16
4.03
3.79
7.49
5.70
5.28
9.24
6.36
3.32
4.23
4.79
6.65
3.81
5.04
4.95
4.22
4.05
7.43
4.81
4.82
5.30
4.33
5.72
5.51
8.84
6.17
4.39
8.84

1989 1990 1991 1992 1993 1994 1995 1996 1997 1998
Year
0
1
2
3
4
5
6
7
8
9
United States Oklahoma
Ra
te p
er
10
0,0
00
United States and Oklahoma1989-1998
Unintentional Poisoning Death RatesUnited States, 1996-1998
NH 2.33VT 2.02MA 0.57RI 0.77CT 5.49NJ 5.39DE 5.62MD 0.91DC 6.07
Deaths per100,000 Population
4.89 - 11.69
2.83 - 4.88
1.78 - 2.82
0.57 - 1.77
HI 3.19
2.23
7.431.39
6.14
3.71
3.86
2.74
2.64
4.17 1.41
1.53
1.97
3.22
2.71
2.03
2.16
1.56
1.78
2.87
1.63
1.44
4.98
4.89
2.83
1.45
2.49
3.17
5.75
6.02
3.07
2.11
3.41
3.67
1.60
2.88
5.42
1.76
2.20
2.97
6.30
11.69
1989 1990 1991 1992 1993 1994 1995 1996 1997 1998
Year
0
0.5
1
1.5
2
2.5
3
3.5
4
4.5
United States Oklahoma
Ra
te p
er
10
0,0
00
United States and Oklahoma1989-1998
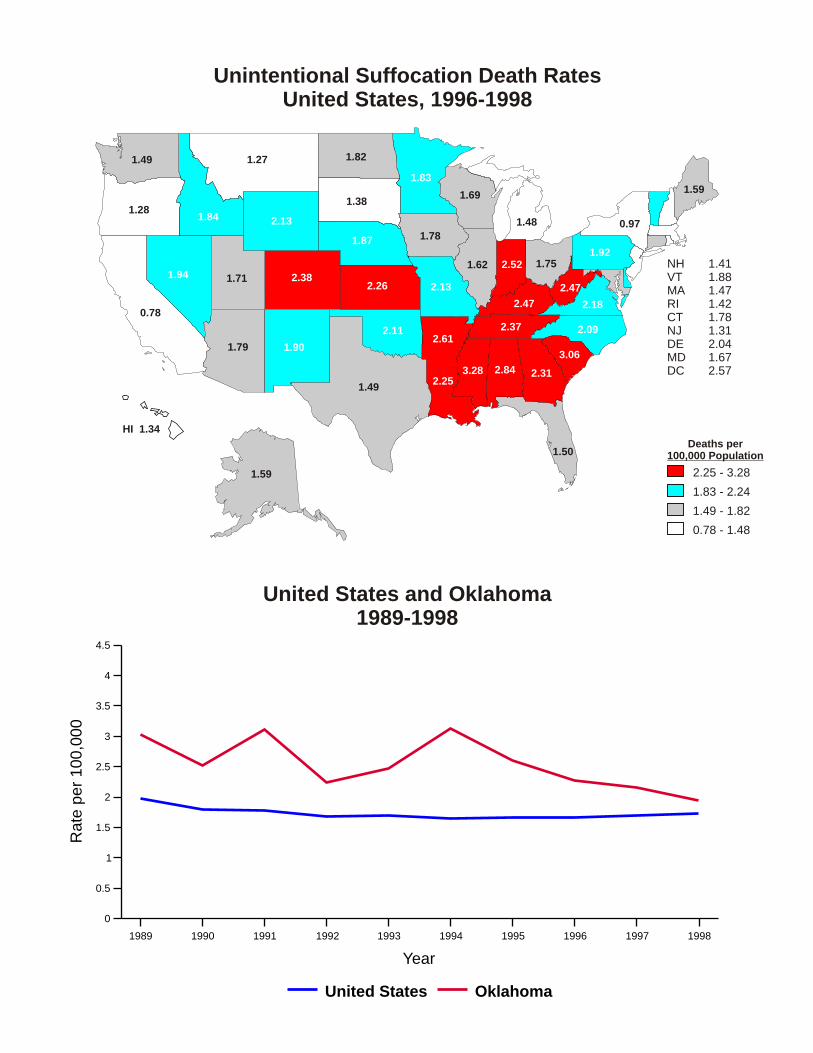
Unintentional Suffocation Death RatesUnited States, 1996-1998
NH 1.41VT 1.88MA 1.47RI 1.42CT 1.78NJ 1.31DE 2.04MD 1.67DC 2.57
Deaths per100,000 Population
2.25 - 3.28
1.83 - 2.24
1.49 - 1.82
0.78 - 1.48
HI 1.34
2.84
1.792.61
0.78
2.38
1.50
2.31
1.84
1.62 2.52
1.78
2.26
2.47
2.25
1.59
1.48
1.83
3.28
2.13
1.27
1.87
1.94
0.97
2.09
1.82
1.75
2.11
1.28
1.92
3.06
1.38
2.37
1.49
1.71
2.18
1.49
2.47
1.69
2.13
1.59
1.90

1989 1990 1991 1992 1993 1994 1995 1996 1997 1998
Year
0
0.5
1
1.5
2
2.5
3
3.5
4
4.5
United States Oklahoma
United States and Oklahoma1989-1998
Ra
te p
er
10
0,0
00
United States and Oklahoma1989-1998
Unintentional Drowning Death RatesUnited States, 1996-1998
NH 1.17VT 1.24MA 0.96RI 1.38CT 0.90NJ 0.82DE 1.18MD 0.98DC 1.34
Deaths per100,000 Population
2.04 - 6.45
1.56 - 2.03
1.18 - 1.55
0.70 - 1.17
HI 3.13
2.16
1.992.34
1.54
1.45
2.53
1.67
2.92
1.08 1.26
1.11
1.53
1.80
2.93
1.81
1.27
1.35
2.81
1.81
2.40
1.09
1.60
0.70
1.54
1.72
0.91
2.05
2.15
0.87
2.21
2.15
1.89
1.78
1.07
1.56
1.93
1.83
1.25
1.78
6.45
1.52

1989 1990 1991 1992 1993 1994 1995 1996 1997 1998
Year
0
0.5
1
1.5
2
2.5
3
3.5
4
4.5
United States Oklahoma
Ra
te p
er
10
0,0
00
United States and Oklahoma1989-1998
NH 0.85VT 1.71MA 0.88RI 0.46CT 1.00NJ 1.03DE 1.07MD 1.10DC 2.54
HI 1.05
2.39
0.882.68
0.81
0.69
0.92
2.08
1.07
1.41 1.61
1.20
1.26
1.93
2.40
1.29
1.44
0.88
3.94
1.82
1.50
0.95
1.04
1.21
1.87
1.09
1.13
2.04
1.11
1.59
2.56
0.96
2.41
1.42
0.52
1.59
0.92
2.18
1.21
0.91
3.28
1.51
Deaths per100,000 Population
1.87 - 3.94
1.21 - 1.86
0.96 - 1.20
0.46 - 0.95
Unintentional Fire and Burn-Related Death RatesUnited States, 1996-1998
1989 1990 1991 1992 1993 1994 1995 1996 1997 1998
Year
0
2
4
6
8
10
12
14
16
18
United States Oklahoma
Ra
te p
er
10
0,0
00
United States and Oklahoma1989-1998
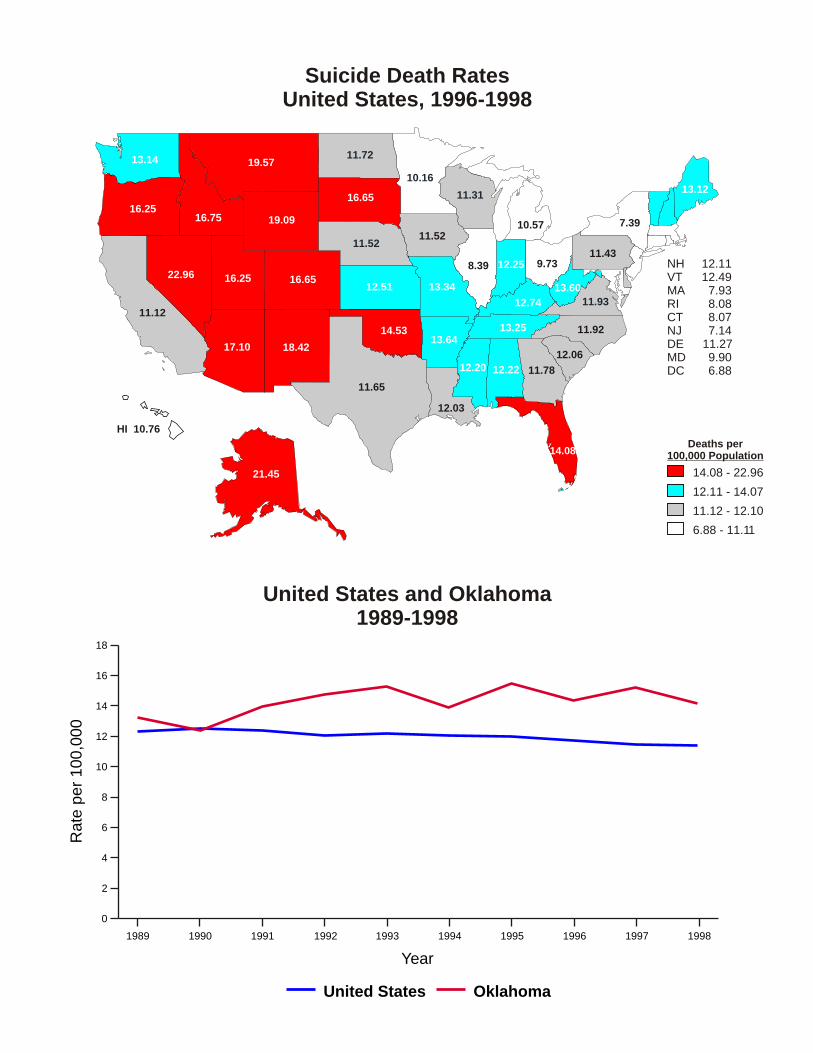
Suicide Death RatesUnited States, 1996-1998
NH 12.11VT 12.49MA 7.93RI 8.08CT 8.07NJ 7.14DE 11.27MD 9.90DC 6.88
Deaths per100,000 Population
14.08 - 22.96
12.11 - 14.07
11.12 - 12.10
6.88 - 11.11
HI 10.76
12.22
17.1013.64
11.12
16.65
14.08
11.78
16.75
8.39 12.25
11.52
12.51
12.74
12.03
13.12
10.57
10.16
12.20
13.34
19.57
11.52
22.96
18.42
7.39
11.92
11.72
9.73
14.53
16.25
11.43
12.06
16.65
13.25
11.65
16.25
11.93
13.14
13.60
11.31
19.09
21.45

1989 1990 1991 1992 1993 1994 1995 1996 1997 1998
Year
0
2
4
6
8
10
12
14
16
18
United States Oklahoma
Ra
te p
er
10
0,0
00
United States and Oklahoma1989-1998
Homicide Death RatesUnited States, 1996-1998
NH 1.88VT 1.67MA 2.53RI 2.78CT 4.72NJ 4.58DE 5.25MD 11.28DC 51.72
Deaths per100,000 Population
8.89 - 51.72
6.10 - 8.88
3.54 - 6.00
1.67 - 3.53
HI 3.24
11.40
9.6610.33
8.33
4.92
8.05
8.80
3.54
9.77 6.91
2.47
5.85
6.23
15.59
2.16
7.94
3.00
13.53
8.18
3.92
3.40
10.93
9.89
6.37
8.89
1.81
4.25
7.94
4.42
6.10
9.36
2.18
9.60
7.55
3.00
7.03
4.43
5.14
3.95
3.78
7.89

* Includes unintentional and intentional deaths from motor vehicles, firearms, falls, and other causes (of determined and undetermined intent).
1989 1990 1991 1992 1993 1994 1995 1996 1997 1998
Year
0
5
10
15
20
25
30
35
40
45
United States Oklahoma
Ra
te p
er
10
0,0
00
United States and Oklahoma1989-1998
Traumatic Brain Injury-Related Death Rates*United States, 1996-1998
NH 14.5VT 19.0MA 8.1RI 12.1CT 11.6NJ 10.8DE 17.3MD 14.7DC 26.6
Deaths per100,000 Population
25.6 - 33.9
20.9 - 25.5
16.6 - 20.8
8.1 - 16.5
HI 12.0
26.3
23.727.7
15.0
23.6
19.7
24.5
27.3
14.3 20.9
17.4
21.0
23.2
28.0
18.9
16.3
15.3
28.6
25.6
29.5
20.4
27.1
24.5
12.7
22.9
19.1
17.0
25.7
24.7
16.7
26.0
24.4
23.8
20.1
22.4
20.0
21.0
21.7
18.0
33.9
25.7

* Includes deaths from firearm suicide, firearm homicide, unintentional firearm-related deaths, and firearm-related deaths of undetermined intent.
1989 1990 1991 1992 1993 1994 1995 1996 1997 1998
Year
0
3
6
9
12
15
18
21
24
27
United States Oklahoma
Ra
te p
er
10
0,0
00
United States and Oklahoma1989-1998
Firearm-Related Death RatesUnited States, 1996-1998
NH 7.72VT 9.74MA 3.66RI 4.37CT 6.46NJ 5.01DE 8.48MD 14.10DC 42.84
Deaths per100,000 Population
15.57 - 42.84
13.12 - 15.56
8.72 - 13.11
3.66 - 8.71
HI 4.11
19.27
19.0517.84
11.89
12.61
13.42
15.57
14.37
11.20 13.38
7.75
12.15
14.34
21.52
8.82
11.78
7.33
20.28
14.63
16.06
9.31
22.49
6.91
14.80
7.85
8.69
15.12
13.22
11.00
15.44
11.07
17.87
13.12
11.52
13.36
10.55
13.60
8.72
16.95
20.61
17.76

Oklahoma 1989-1998
Traumatic Brain Injury Deaths/Year
U.S. 18.5OK 22.7Excess Deaths/Year
740
138
Motor Vehicle Deaths/Year
U.S. 16.4OK 22.1Excess Deaths/Year
719
185
Falls Deaths/Year
U.S. 4.3OK 4.1
135
Fires/Burns Deaths/Year
U.S. 1.6OK 2.3Excess Deaths/Year
74
21
Drownings Deaths/Year
U.S. 1.7OK 2.1Excess Deaths/Year
69
15
Poisonings Deaths/Year
U.S. 3.2OK 2.4
74
Firearms Deaths/Year
U.S. 13.7OK 16.0Excess Deaths/Year
517
73
Homicides Deaths/Year
U.S. 8.7OK 8.9Excess Deaths/Year
286
5
Suicides Deaths/Year
U.S. 12.0OK 14.3Excess Deaths/Year
459
74
Legend
At or above the 90th NATIONALpercentile
At or above the 75th but less thanthe 90th NATIONAL percentile


CDC-FundedInjury Control Projects
TM. .SAFER HEALTHIER PEOPLE


CDC-Funded Injury Control Projects inOKLAHOMA
The National Center for Injury Prevention and Control (NCIPC) funds seven programs in Oklahoma to build the state’s ability to keep its citizens safe.
Core Injury Programs
State-Based Core Injury Program Development Oklahoma is one of 23 states receiving CDC funding to establish a point of coordination for injury control efforts, assess injury data and surveillance resources within the state, and develop a state injury control plan. A core injury development program is a cooperative effort to develop or strengthen the capacity of state public health agencies to prevent and control injuries. These programs possess some combination of these features and tools:
1) injury prevention coordinator; 2) up-to-date profile of injuries within the state from existing data sources; 3) advisory structure to facilitate collaboration with public and private sector groups; 4) relationships with organizations, agencies, and individuals interested or
experienced in injury prevention or control; and 5) a current plan for injury prevention and control based on the state’s priorities.(Oklahoma State Department of Health)
State-Based Core Injury Surveillance and Program DevelopmentOklahoma’s advanced program will strengthen established surveillance capabilities and develop a comprehensive, statewide, ongoing injury surveillance system. (Oklahoma State Department of Health)
Intentional Injury
Surveillance of Intimate Partner Violence This will establish the Oklahoma Intimate Partner Violence Surveillance Program within the Injury Prevention Service. The program aims to
1) conduct statewide population-based surveillance to determine the annual incidence of intimate partner violence injuries that are either fatal or treated at a hospital, and to field test CDC’s Uniform Definitions and Recommended Data Elements forsurveillance of intimate partner violence;
2) design and conduct a self-report survey to determine the annual prevalence of intimate partner violence, including annual incidence of violent episodes, prevalence of related physical injury and disability, and use of mental health, substance abuse, and law enforcement services associated with intimate partner violence;
3) determine the proportion of persons who experience intimate partner violence and are seen at a hospital;

4) establish an intimate partner violence advisory committee; 5) analyze data and widely disseminate findings; and 6) develop guidelines for replicating the surveillance that can be used by other states
and localities. (Oklahoma State Department of Health)
Culturally appropriate Demonstration Project for Early Intervention and Prevention of Intimate Partner Violence and Sexual Violence Among Racial and Ethnic Minorities A project to implement and evaluate multiple interventions aimed at reducing the incidence and severity of intimate partner violence and sexual violence among Latinos in central Oklahoma. The program aims to increase availability of culturally appropriate intervention and prevention services among the Latino population. The program will also seek to reduce future incidence of intimate partner and sexual violence perpetrated by or against Latino school-aged youth. (Latino Community Development Agency, Inc.)
Rape Prevention and Education A nationwide grant program providing resources to states for rape prevention and education programs conducted by rape crisis centers, State sexual assault coalitions, and other publicand private nonprofit entities for:
1) educational seminars; 2) operation of hotlines; 3) training programs for professionals; 4) preparation of informational material; 5) education and training programs for students and campus personnel designed
to reduce the incidence of sexual assault at colleges and universities; 6) education and training to increase awareness about drugs to facilitate rapes
or sexual assaults; and 7) other efforts to increase awareness about, or to help prevent, sexual assault,
including efforts to increase awareness in underserved communities and awareness among individuals with disabilities.
(Oklahoma State Department of Health)
Unintentional Injury
Prevention of Fire-Related InjuriesA project to reduce residential fire-related deaths and injuries and their associated disabilities and costs in targeted communities. Program staff will distribute alarms by going door-to-door in the target communities. (Oklahoma State Department of Health)
Acute Care and Rehabilitation
Traumatic Brain Injury Surveillance Program This program characterizes the risk factors, incidence, external causes, severity, and short-term outcomes of traumatic brain injury (TBI) through population-based surveillance. These data will be used to develop prevention programs to address both the specific causes of TBI and populations at greatest risk. Data may also be used to improve injured persons’ access to health care and other services needed after injury. (Oklahoma State Department of Health)

Notes

Notes