State Initiatives and Priorities FASSW State Conference October 27, 2005 Jacksonville, Florida The...
47
State Initiatives and Priorities FASSW State Conference October 27, 2005 Jacksonville, Florida The Student Support Services Project — A collaborative project of the Florida Department of Education, Bureau of Exceptional Education and Student Services, and the University of South Florida
-
Upload
maximillian-ramsey -
Category
Documents
-
view
213 -
download
0
Transcript of State Initiatives and Priorities FASSW State Conference October 27, 2005 Jacksonville, Florida The...

State Initiatives and Priorities
FASSW State ConferenceOctober 27, 2005
Jacksonville, Florida
The Student Support Services Project — A collaborative project of the Florida Department of Education, Bureau of Exceptional Education and Student Services, and
the University of South Florida

Who’s Here?
• Name and Title
• School District or Location
• If I were not attending this conference, right now I would probably…

Agenda
• Student Achievement
• RRR Burning Issues
• School Reform
• Assistance Plus / FCIM
• Need for Support
• Disproportionality
• RtI / Problem Solving
• Targeted Legislation
• Anticipated Legislation
• Resources/Q & A’s

Strategic Imperatives-the focus
1. Highly Effective Teachers
2. Academic curricular & testing standards
3. Student Rates of Learning
4. Instructional Leadership
5. Education Options
6. Workforce Education Programs / the Economy
7. Financial Resources / Performance
8. Higher Student Learning

What do we know about Promotion in Florida?• What percent of students are promoted at
each grade level?
• What grade level has the highest promotion rate? ……the lowest?
• Comparing achievement on FCAT in reading or mathematics, what relationship is there between performance and promotion?

Promotion and Proficiency(2003-2004 data)
0
10
20
30
40
50
60
70
80
90
100
K 1 2 3 4 5 6 7 8 9 10 11 12
Grades
Percent
Promotion Reading Mathematics

What do we know about Retention in Florida?• What grade level has the highest retention
rate?
• ……the lowest?
• Comparing achievement on FCAT in reading or mathematics, what relationship is there between achievement and retention?

Retention & Level 1 Performance (2003-2004 data)
0
10
20
30
40
50
K 1 2 3 4 5 6 7 8 9 10 11 12
Grades
Percent
Retention Reading Mathematics
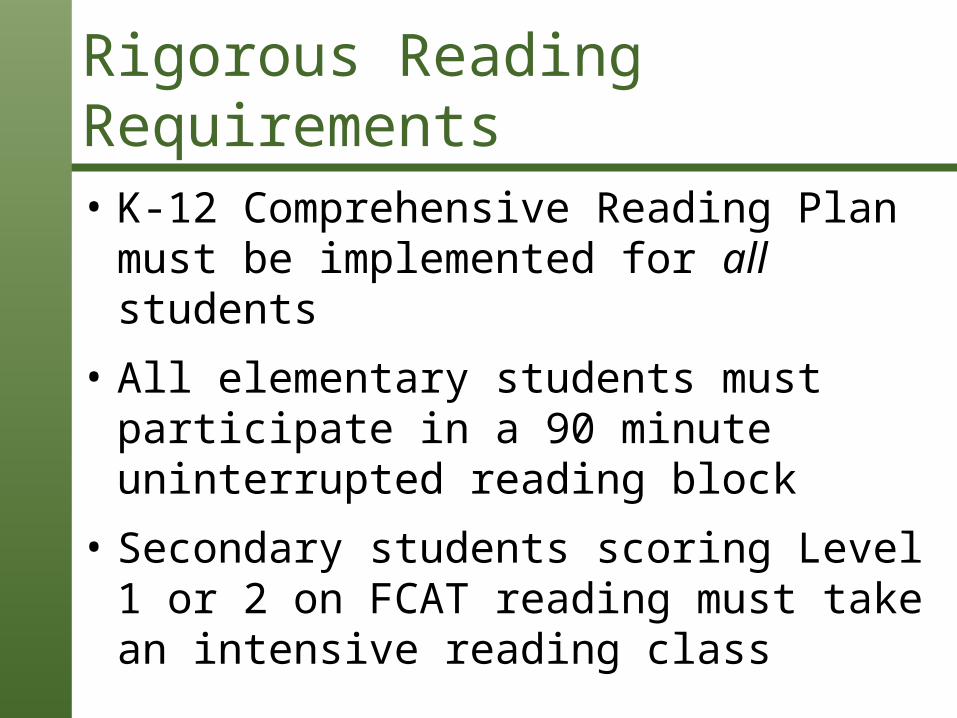
Rigorous Reading Requirements
• K-12 Comprehensive Reading Plan must be implemented for all students
• All elementary students must participate in a 90 minute uninterrupted reading block
• Secondary students scoring Level 1 or 2 on FCAT reading must take an intensive reading class

Middle Grades Reform
Purpose - Increase Rigor and Relevance• Course Offerings, Teacher Qualifications, Instructional Materials,
Instructional Practices
Personalized Middle School Success Plan (PMSSP)
• Beginning with 2004-2005 school year, staff must develop and implement a PMSSP for each student entering 6th grade who scored below Level 3 on FCAT reading.
• Plan must include specific components and continue until student completes 8th grade or scores Level 3 or above on FCAT reading

There is no better place to be than where you are, and no better time than now to make a difference.
Jim Kelly

Alone we can do so little; together we can do so much.Helen Keller

School Reform:The Role of School Social Worker
• Be informed and involved in reform/change
• Provide comprehensive, individualized student academic and behavioral advisement
• Provide support and casemanagement assistance to schools and to students/families
• Provide recommendations for students transitioning from elementary to middle to high school

So what is Florida’s Continuous Improvement
Model?
Effective Schools + TQM

Research Based Effective SchoolsFive characteristics of effective schools:
1. Strong instructional leadership
2. High expectations for student achievement
3. Instructional focus on reading, writing and mathematics
4. Safe/orderly climate
5. Frequent assessment

Where are we in this picture?
How does school social work support and contribute to these
imperatives?


A vision without a plan is only… a dream
Joel Barker

Fantasy is what [we] want, reality is what [we] need.
Lauren Hill

Maslow’s Hierarchy of Needs

If all children had a safe harbor, none would be at risk.
Unknown

Why Support Services?
Budgeting$18,392 p/y for a family of four = Poverty
The Hard Choices – How far does $18,392 go in America
today? – Budget--How? – What gets left out?

Basic Needs
Annual Income $18,392 • Rent -8,256 (~per year)$10,136 yr.
• Utilities/public services-1,944 (~per year)
$8,192 yr.• Transportation
-1,500 (~per year)$6,692 yr.
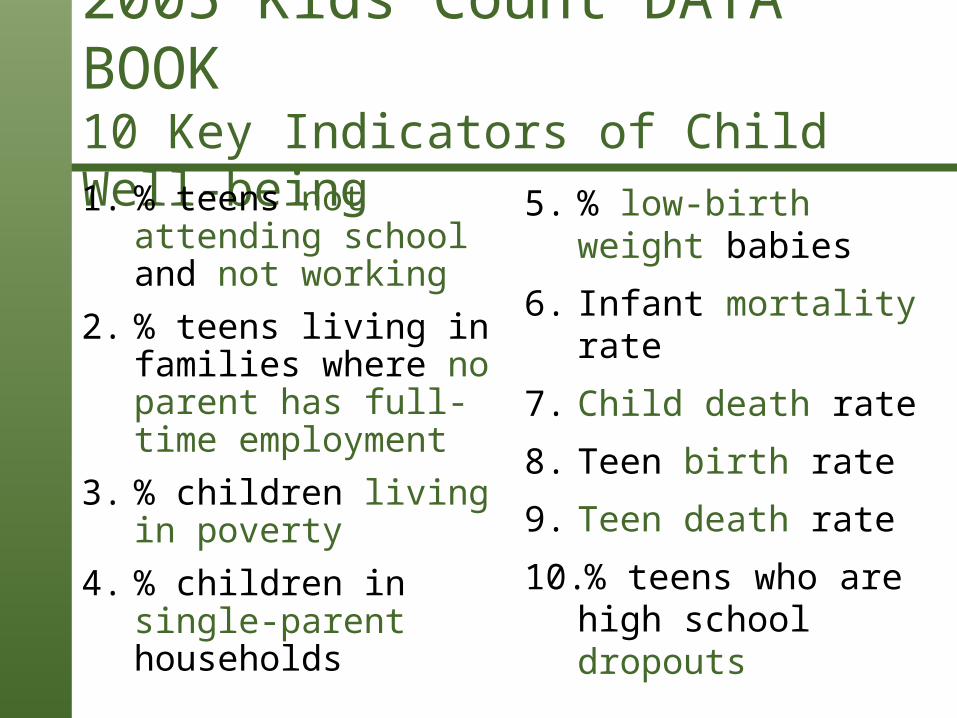
2005 Kids Count DATA BOOK10 Key Indicators of Child Well-being
1. % teens not attending school and not working
2. % teens living in families where no parent has full-time employment
3. % children living in poverty
4. % children in single-parent households
5. % low-birth weight babies
6. Infant mortality rate
7. Child death rate
8. Teen birth rate
9. Teen death rate
10.% teens who are high school dropouts

Disproportionality in Florida
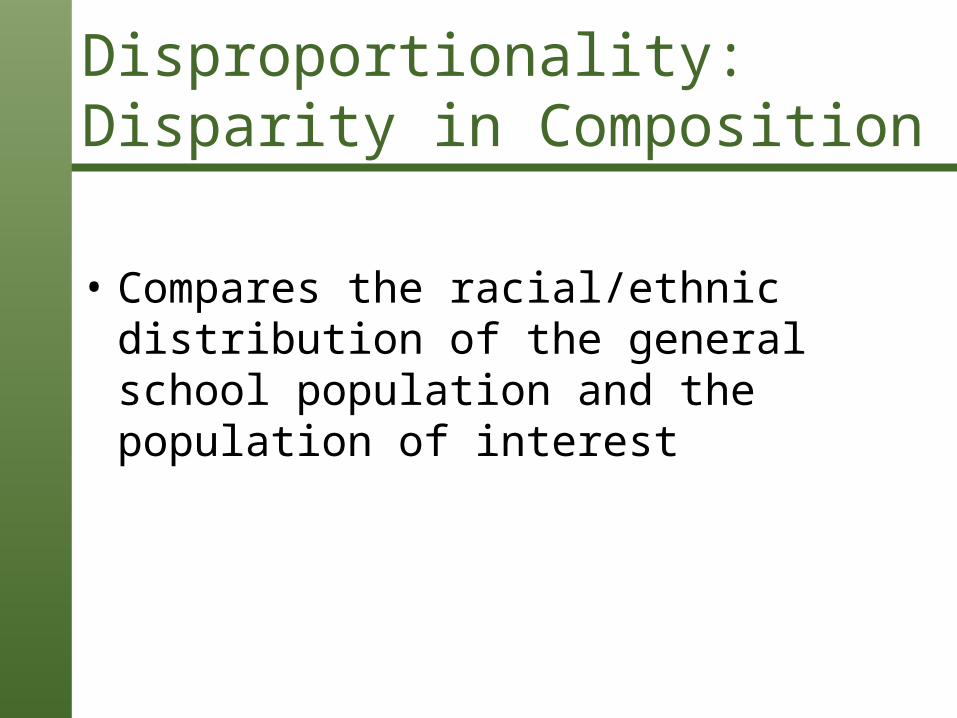
Disproportionality: Disparity in Composition
• Compares the racial/ethnic distribution of the general school population and the population of interest

Racial Distribution of Total, EMH, and EH/SED Populations February 2005
22.8%23.0%
50.8%
3.0%
38.5%
11.9%5.2%
23.5%
48.6%
14.2%
3.7%
46.0%
0%
10%
20%
30%
40%
50%
60%
White Black Hispanic Other
Total Population EMH Population EH/SED Population
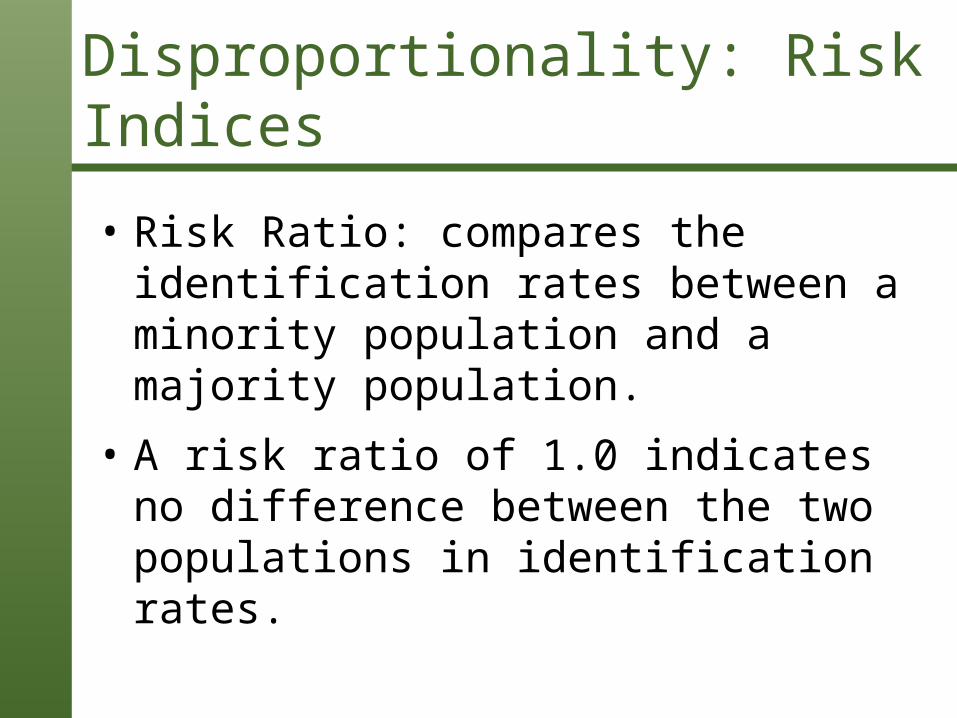
Disproportionality: Risk Indices
• Risk Ratio: compares the identification rates between a minority population and a majority population.
• A risk ratio of 1.0 indicates no difference between the two populations in identification rates.

Risk Ratio for Black Students Identified as EMH or EH/SED 2001-02 through 2004-05
3.33.33.33.4
1.71.71.71.7
0.0
0.5
1.0
1.5
2.0
2.5
3.0
3.5
4.0
2001-02 2002-03 2003-04 2004-05
MH EH/SED
Bureau Workgroup
• Compiled district data from 2000-05 and compared data to CIMPs
• Created policy to clarify eligibility for EMH programs (adaptive behavior & nonverbal assessment TAPs)
• Collected data from five selected districts to determine systemic concerns, if any

Findings and Next Steps
What We Found…• Not racial but rather SES disproportionality
• Absence of documented interventions prior to placement
• Absence of updated intellectual assessment data for transition from DD to MH
• More prevalent in select schools rather than district-wide
Our Next Steps…• Collect data, using revised protocol from 2 additional districts
• Collect and review data at the school level
• Focus on referral data/interventions used

There are 3 kinds of people: those who can count and those who can’t.
Unknown

Change is mandatory; growth is optional.
Michael Fullan

Leadership: A Call To Action
• School social work services - reframed as a comprehensive, multi-faceted and cohesive component of student services designed to address barriers to learning
• Student support services summit - within next 2 years

Response to Intervention(RtI)
• Based on a 3-Tiered Model of Service Delivery– Universal (Core Curriculum)
– Supplemental (Increase intensity/focus of curriculum)
– Intensive (Individually developed intensive interventions)
• A student’s “response to intervention” is the best indicator of the severity of the problem

RtI Implications
• Poor/lack of instruction must be ruled out
• Curricular access blocked by any of the following must be addressed-Attendance -Mental Health
-Physical Health -SES (basic needs)
-Mobility
• Sufficient exposure to and focus on the curriculum must occur
• Frequent, repeated assessment must be conducted

Problem Solving Process

Academic Systems Behavioral Systems
1-5%
Tier 3: Intensive, Individual InterventionsIndividual StudentsAssessment-basedHigh IntensityOf longer duration
1-5%
Tier 3: Intensive, Individual InterventionsIndividual StudentsAssessment-basedIntense, durable procedures
5-10%Tier 2: Targeted Group InterventionsSome students (at-risk)High efficiencyRapid response
5-10%Tier 2: Targeted Group InterventionsSome students (at-risk)High efficiencyRapid response
80-90%Tier 1: Universal InterventionsAll studentsPreventive, proactive
80-90% Tier 1: Universal InterventionsAll settings, all studentsPreventive, proactive
Students
Three Tiered Model of School Supports

Response to Intervention: How well are we doing?
• A systematic and data-based method for determining the degree to which a student has responded to evidence-based interventions
• Determined solely through analyzing data

RtI: How well are we doing?
• Services should intensify for a student as the student response to intervention is below expectations
• When the intensity of services exceed significantly those available through general education, then a student should be considered for special education funding

Here is the test to find whether your missionon earth is finished: if you’re alive, it isn’t.
Richard Bach

Legislation: Implementation Activities
• HB 723 (2004) Relating to the Education of Children in Foster Care– State level agreement / local agreements– DOE Resource Packet/Tool Kit– Implementation and technical assistance
• McKinney-Vento, Homeless Eduation Assistance Improvement Act– Access and Services– Liaison for @ school districthttp://www.firn.edu/doe/title1/homeless_cooridnators.htm

Legislation:School Health
• SB 1090 (2005) Psychotropic medication - school personnel may not compel or attempt to compel any specific action by the parent or require a student to take medication
• HB 279 “Kelsey Ryan Act” (2005) - allows a student with life-threatening allergic reactions to carry and self-administer epinephrine (“EPI pen”)

Anticipated Legislative Action: Child Abuse Prevention Training/Reporting
• Legislative staff have been looking at child abuse prevention training programs
• DOE is required to encourage school districts to provide such training
• Survey to determine what child abuse prevention training is being provided in school districts
• Public hearings for House Interim Project

Resources
• Measuring Adaptive Behavior - Parent Brochure
• Florida KIDS COUNT Data Book Flyer Center for the Study of Children’s Futures
• Florida Network of Child Advocacy Centers (FNCAC) Flyer
• Child Abuse Source Book for Florida School Based Personnel Document
• Florida’s State Plan for the Prevention of Child Abuse, Abandonment, and Neglect - Executive Summary
• Florida Suicide Prevention Strategy document & flyer
• Meeting the Needs of Students with Disabilities - Section 504 (Draft)Document

Packet of Resources
Department memo’s/TAP’s» Alternative Assessment
» Planning for 11th & 12th graders not passing FCAT
» K12 Comprehensive Reading Plans
» McKinney-Vento Act TAP
» Counseling as a Related Service
» Education of Children-Foster Care
Documents/ Flyers» Measuring Adaptive Behavior
» KIDS COUNT Flyer
» FNCAC Resources Flyer
» Child Abuse Source Book
» Florida’s 5-Year Prevention Plan (Executive Summary)
» Youth Suicide Prevention (Flyer)
» Florida Suicide Prevention Strategy
» Section 504: District Guide

Contact InformationGria Davison
School Social Work Services Consultant
Florida Department of Education
Bureau of Exceptional Education and Student Services
Student Support Services Project
Tallahassee, Florida
(850) 922-3727