State Highway Performance
24
April 23, 2015 State Highway Performance James Pinheiro, DDD O&M
-
Upload
american-society-of-civil-engineers-orange-county-branch -
Category
Engineering
-
view
97 -
download
2
Transcript of State Highway Performance

April 23, 2015
State Highway Performance
James Pinheiro, DDD O&M

Provide a safe, sustainable, integrated and efficient transportation system to enhance California’s economy and livability
Caltrans Mission Statement

1. Safety and Health
2. Stewardship and Efficiency
3. Sustainability, Livability and
Economy
4. System Performance
5. Organizational Excellence
Caltrans Goals

34 Cities
798 Square Miles
3.1M Population
1,964 Lane Miles
(4% of State total):
- Mix Flow 1,059
- HOV 226
- Toll Roads 314
- Highways 365
DISTRICT 12 PROFILE

TMS Resources
• 200 Miles of Fiber
• 497 Traffic Signals
• 71 CMS
• 287 CCTV
• 337 Ramp Meters
• 15% of Statewide TMS
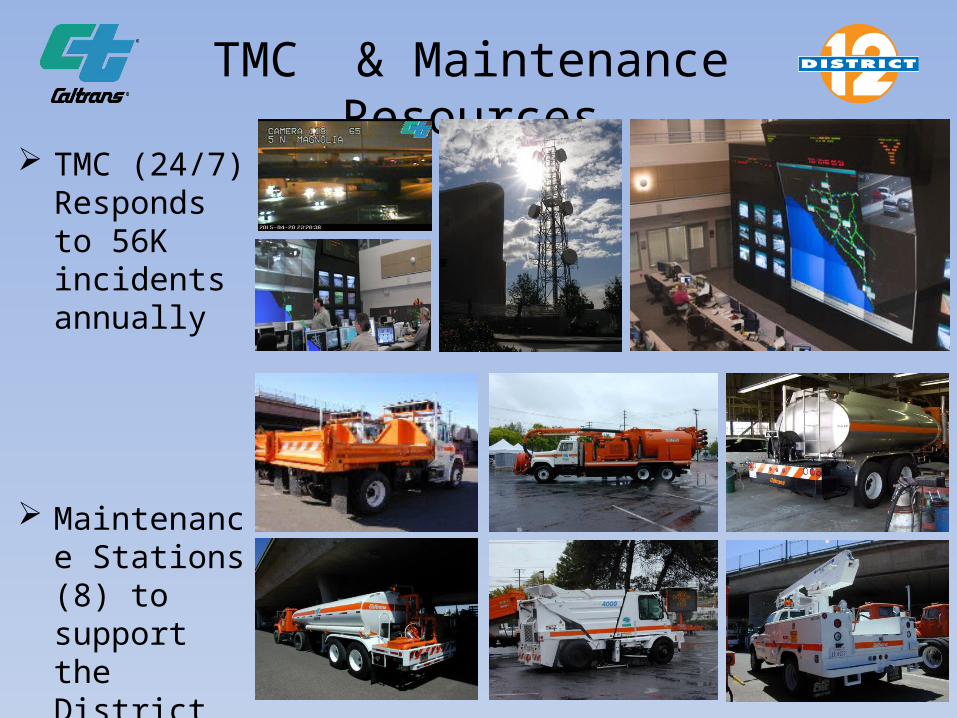
TMC (24/7) Responds to 56K incidents annually
Maintenance Stations (8) to support the District
TMC & Maintenance Resources

District 12 SHOPP (2018)
Major Damage Restoration
10%Collision
Reduction17%
Mandates9%
District Minors3%
Bridge Preservation
9%
Roadway Preservation
31%
Mobility Improve-
ments21%

District Resources
SHOPP
HM program
Workforce
Contracts
Equipment
Capital Projects
District Partners
CHP
OCTA
FSP
First
Responders

System Performance
Accident Monitoring
TASAS
Census
PED Safety
Bike Safety

System Performance ElementsGIS Based Pavement Condition

System Performance Elements% of State Highway System's Distressed
Pavement
2004 2005 2007 2011 2013 2014 2015 2016 2017 2018 2019 20200
5
10
15
20
25
30
35
15 16
20 19
16 15 14 14 14 14 13 12
2628
26 25
16
20 21
24
2729 30 31
Orange County California

System Performance MeasuresD-12 10 years Pavement Performance (2005-2014)
2005 2006 2007 2008 2009 2010 2011 2012 2013 2014
Dis-tressed LM
307 320.5 374 296.1 312.1 324.1 353 335.1 297 282.6
Treated LM (SHOPP)
44 0 361 22 0 22 0 123 140 106
Treated LM (HM1)
22 34 12 50 22 47 14 5 29 85
Treated LM (HM124/122)
39 0 22 24 186 0 501 41 16 72
Total Treated LM
105 34 395 96 208 69 515 169 185 263
%Distress LM
0.157435897435
897
0.164358974358
974
0.196531791907
514
0.155596426694
693
0.164004203888
597
0.170310036784
025
0.186871360508
205
0.177395447326
628
0.157476139978
791
0.149840933191
941
50
150
250
350
450
550
La
ne
-Mile
(L
M)
234 distress Lane-Mile (LM) goal set in the 2005 State of Pavement Report
Source: District 12 Pavement Management System, 2013 State of Pavement Report Projected Pavement Distressed LM in 2006, 2008, 2009, 2010, 2012, 2014 is based on the 2005-2014 Performance Actual Pavement Distressed LM in 2005, 2007, 2011, 2013 is based on the 2013 State of Pavement Report

System Performance MeasuresD-12 10 years Pavement Performance (2015-2024)
2015 2016 2017 2018 2019 2020 2021 2022 2023 2024
Dis-tressed LM
261.6 269 263.6 268.5 248.6 230.4 219.9 206.2 191.4 173.6
Treated LM (SHOPP)
82 114 73 158 146 121 145 146 147 113
Treated LM (HM1)
0 0 0 0 0 0 0 0 0 0
Treated LM (HM124/122)
30 62 82 75 94 92 52 60 87 86
Total Treated LM
112 176 155 233 240 213 197 206 234 199
%Distress LM
0.138706256627
784
0.142629904559
915
0.139766702014
846
0.142364793213
15
0.131813361611
877
0.122163308589
608
0.116595970307
529
0.109331919406
151
0.101484623541
888
0.092046659597
0308
25
75
125
175
225
275
La
ne
-Mile
(L
M)
234 distress Lane-Mile (LM) goal set in the 2005 State of Pavement Report
Source: District 12 Pavement Management System Projected Pavement Distressed LM in 2015-2024 is based on the 2005-2014 Performance

MobilitySystem Performance Elements
Recurrent Congestion
Incidents
Travel Time Reliability
LOS
Detection Health
Delay
GP & HOV
PeMS

BridgesSystem Performance Elements
Rehabilitation
Scour Mitigation
Rail Replacement/ Upgrade
Seismic Retrofit
Preventive Program
94.0
94.5
95.0
95.5
96.0
96.5
97.0
97.5
98.0
98.5
99.0
95.8
96.997.2
95.8
97.6
96.4
97.9
97.2
96.1
96.7
99.0
98.3
97.1
Districts
Brid
ge H
ealt
h In
dex

Mandates & EmergenciesSystem Performance Elements
ADA & PED
Hazard Waste Mitigation
Storm Water
Relinquishments
Fire, Flood, Wind, Rain, Severe
Accidents, Earthquakes or Terrorism
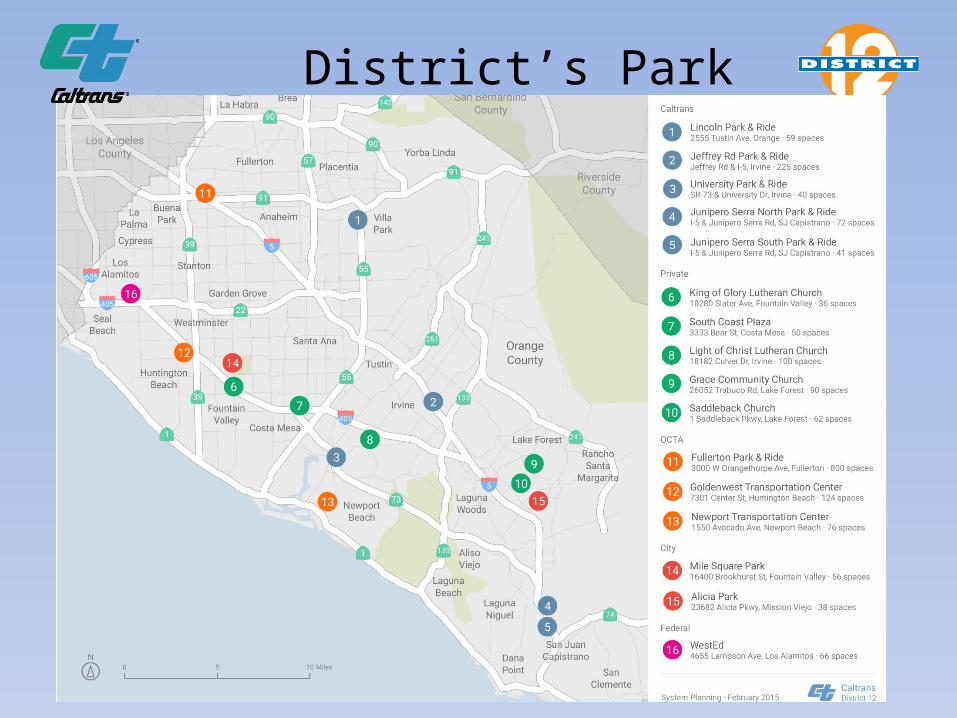
District’s Park & Ride
18
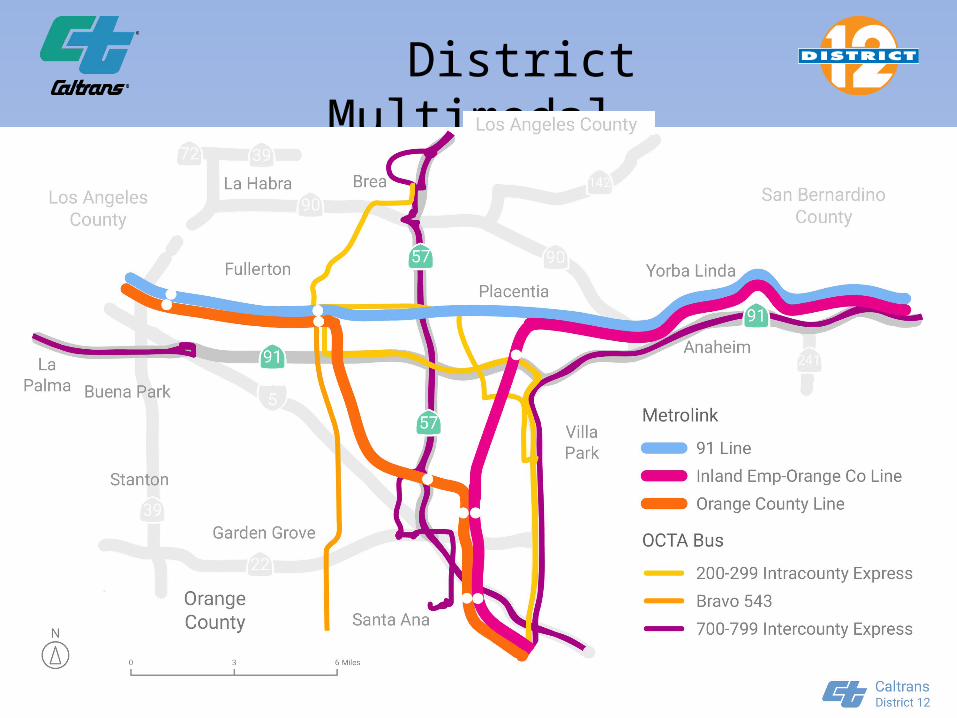
District Multimodal
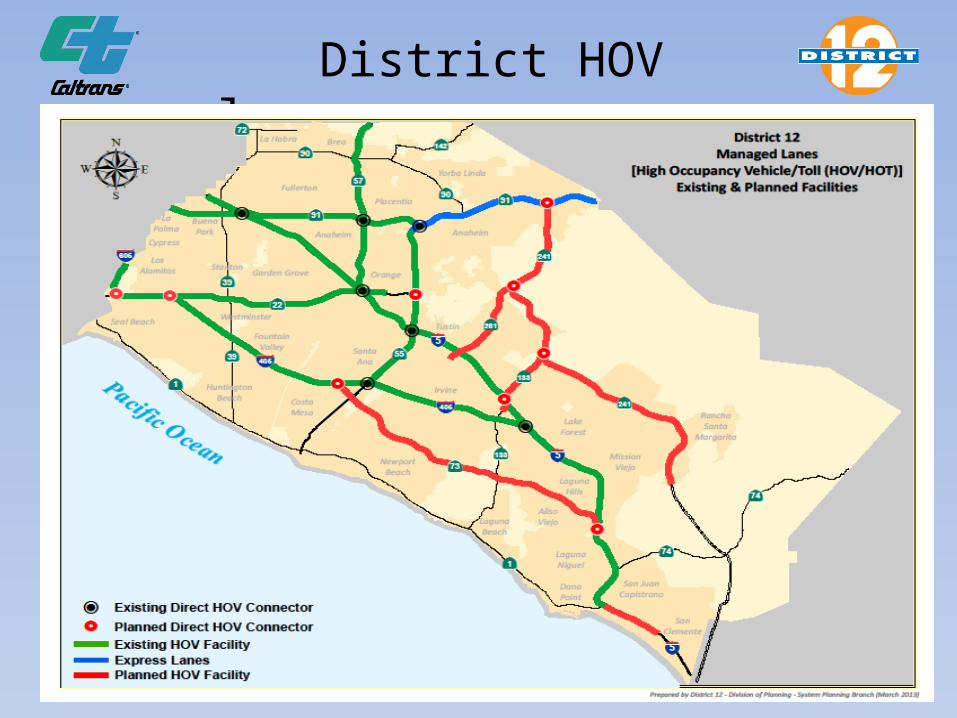
District HOV lane map
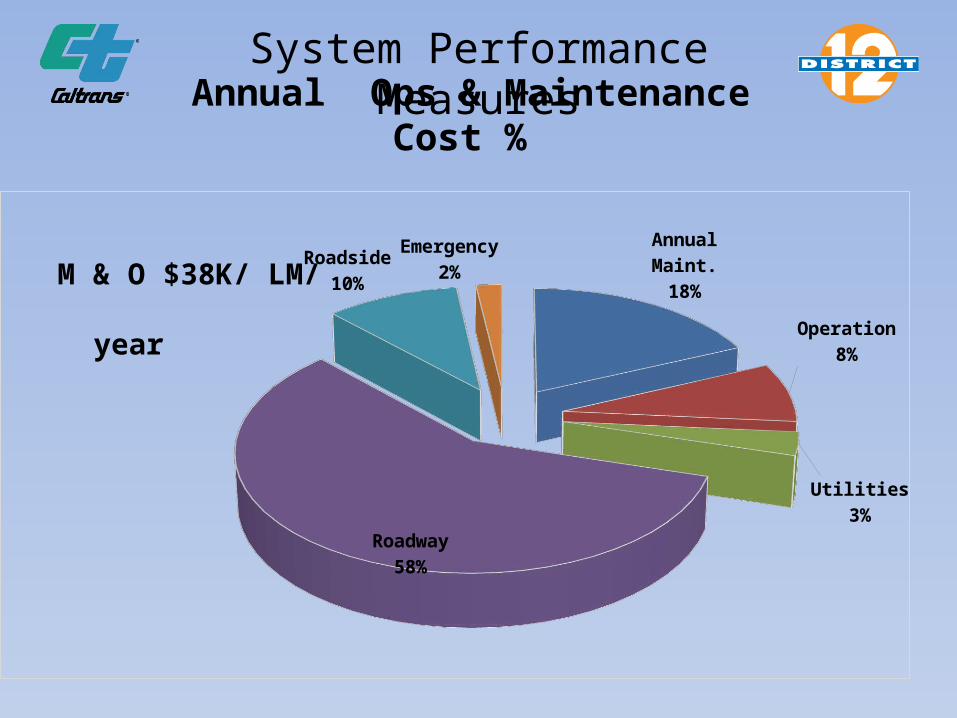
Annual Ops & Maintenance Cost % System Performance Measures
Annual Maint.18% Operation
8%
Utilities3%
Roadway58%
Roadside10%
Emergency2%M & O $38K/ LM/ year

System Performance MeasuresEmergency Operations
SEMS/ NIMS
Mutual Aid
Drills
EOC
Support
TMC

System Performance MeasuresHow D-12 compares Statewide

ICM
ITS
Connected Corridors
Managed Lanes
Automated Vehicles
Sustainable Energy
What’s in the Future

24
Thank You
Questions?