State Green Business Report 2011
66
stat f g bsss 2011 by Joel Makower and the editors of GreenBiz.com FEBRUARY 2011 greenbiz grou www.greenbiz.com
-
Upload
andi-agencia-de-noticias-do-direito-da-infancia -
Category
Documents
-
view
223 -
download
0
Transcript of State Green Business Report 2011
8/6/2019 State Green Business Report 2011
http://slidepdf.com/reader/full/state-green-business-report-2011 1/66
stat fgbsss2011by Joel Makower and the editors of GreenBiz.com
FEBRUARY 2011
greenbiz grou
www.greenbiz.com

8/6/2019 State Green Business Report 2011
http://slidepdf.com/reader/full/state-green-business-report-2011 2/66
© 2011 GreenBiz Group Inc. (www.greenbiz.com). May be reproduced for non-commercial purposes only, provided credit is given to GreenBiz Group Inc. and includes this notice.
stat f g bsss
201
2
ContEnts
IntroductIon 3
topSuStAInABLEBuSInESStrEndSoF2011 3
Consumer Giants Awaken to Green 5Companies Aim for ‘Zero’ 6
The Developing World Yanks the Supply Chain 8
Greener Transport Makes Its Move 10
Sustainable Food Becomes a Main Course 12
Metrics and Standards Become the Rule 14
Toxics Concerns Spur Greener Alternatives 16
Water Footprinting Makes a Splash 18
Companies Learn to Close the Loop 20
Bioplastics Become Material 21
thEGrEEnBIzIndEx
Introduction 23
Summary Chart 24
Carbon Intensity 26
Carbon Transparency 28
Cleantech Investments 30
Clean-Energy Patents 32
Corporate Reporting 34
Employee Commuting 36
Employee Telecommuting 38
Energy Efciency 40
Environmental Financial Impacts 42
E-Waste 44
Fleet Impacts 46
Green IT 48
Green Ofce Space 50
Green Power Use 52
Organic Agriculture 54
Packaging Intensity 56
Paper Use and Recycling 58Toxic Emissions 60
Toxics in Manufacturing 62
Transparency 64
Credits / About GreenBiz Group 66
Infographics by Seth Fields

8/6/2019 State Green Business Report 2011
http://slidepdf.com/reader/full/state-green-business-report-2011 3/66
stat f g bsss
2011
3
© 2011 GreenBiz Group Inc. (www.greenbiz.com). May be reproduced for non-commercial purposes only, provided credit is given to GreenBiz Group Inc. and includes this notice.
During 2010, we saw a steady march of progress, with
some of the world’s biggest companies and brands put-
ting a stake in the ground in the name of environmental
(and sometimes social) sustainability. Some are com-
panies that hadn’t previously been visible in these ways.
Others, it turned out, had been quietly taking action,
walking more than talking, only recently discovering that
modesty is no longer an asset in a world that increasingly
demands transparency. Still others have only recently
elevated sustainability to a level of importance, hiring
their rst senior executives to oversee and coordinate
sustainability commitments and goals.
All of this in spite of — and, in some cases, because of —
the stumbling economy.
As we noted last year, this recession was the rst eco-
nomic downturn where corporate environmental pro-fessionals weren’t the rst to be tossed overboard. They
largely kept their jobs, though some suffered budget
freezes and slashes, and more than a few endured reor-
ganizations that consolidated them with other func-
tions, or dispersed sustainability responsibilities within
other operations or business units.
These are growing pains, signs of a maturing business
function. We saw the same thing happen with informa-
tion technology professionals a quarter century ago.
Their work was initially seen as marginal, not core to
strategy. They sat off to the side, organizationally speak-
ing, with their own efdoms and unique, often impen-
etrable, jargon. We heard from them only when there
were problems. Today, of course, we can chuckle at
our naïveté, given our unconditional surrender to IT to
run our lives at work, at home, and at play. Today, nearly
everyone inside a company is an IT worker of sorts, as
we upgrade, troubleshoot, and plug and play technology
of previously unimaginable sophistication. Dedicated IT
professionals are viewed as key players, core to prots
and productivity, typically answering to a chief informa-
tion ofcer.
Sustainability seems to be on a similar path.
Today, managing a company’s environmental footprint
is less and less limited to the environmental depart-
ment. Increasingly, it is the domain of procurement,
nance, facilities, eets, legal, operations, real estate,
supply chain, marketing, investor relations, even human
tp sstaabl bsss tds f 2011
There’s a school of thought that says, in effect, it isn’t easy being green
even in a good economy. If that’s true, sustainable business activities
should pretty much have driven off a cliff during the Great Recession.
But the opposite seems to have happened. Indeed, a dramatic shift is
occurring in business: Companies are thinking bigger and longer term
about sustainability — a sea change from their otherwise notoriously
incremental, short-term mindset. And even during these challengingeconomic times, many have doubled down on their sustainability
activities and commitments.
8/6/2019 State Green Business Report 2011
http://slidepdf.com/reader/full/state-green-business-report-2011 4/66
stat f g bsss
2011
4
resources. Growing numbers of us are recycling,
telecommuting, rethinking business travel,
turning off lights, rooting out waste, and gen-
erally being more conscious of the impacts of
the things we do at work. In some companies,
such activities are tied to managers’ and execu-
tives’ performance evaluations and compensa-
tion. Increasingly, these efforts are directed by
someone in the C-suite.
All of this is especially noteworthy in light of
today’s political environment — the open hos-
tility with which environmental protection is
viewed by a swath of the political spectrum,
at least in the U.S. The general lack of political
leadership and will — due in large part to a mis-guided notion that we can’t afford to consider
sustainability during tough economic times — is
a stark contrast with the far more enlightened,
proactive leadership of corporate chieftains.
A growing number view environmental think-
ing — whether in the form of reducing waste,
improving efciency, or eyeing new business
opportunities — as key to competitiveness, as
well as a means of clawing our way back to eco-
nomic prosperity. When California voters had
the chance last November to set aside a toughclimate change law until better economic times,
they voted overwhelmingly to stay the course,
seeing instead the law’s potential to create jobs
while addressing a critical global challenge.
Much of the greening of business remains an
untold secret largely ignored by the mainstream
media and, in many cases, not widely discussed
even by companies. The former typically don’t
view corporate environmental leadership as
news, or cynically believe company activities to
be supercial marketing ploys. The latter fear
that by pointing out what they’re doing right, they
may unwittingly attract an unwelcome spotlight
on environmental challenges that remain unad-
dressed or unsolved. So they remain mum, lest
they be accused of “greenwashing.”
And so it goes. A great transformation is taking
place. Will the public take notice? Will political
leaders position themselves at the front of thisparade? Will growing the green economy ever
become a national cause?
Denitive answers are eeting. But in the pages
that follow, we aim to help illuminate the state
of the art, including what’s working — and what
promise remains unfullled.
To make sense of the year just passed, we
combed the nearly 2,200 news reports, blog
posts, opinion pieces, and podcasts pub-
lished during 2010 on GreenBiz.com and itsfour channels — ClimateBiz, GreenerBuildings,
GreenerComputing and GreenerDesign — in
search of trends and themes about the year
ahead. Here are 10, in no particular order.
A great
transformationis taking place.
Will the public
take notice?
Will political
leaders position
themselves at
the front of this
parade?

8/6/2019 State Green Business Report 2011
http://slidepdf.com/reader/full/state-green-business-report-2011 5/66
stat f g bsss
2011
5
Large consumer packaged goods companies,
the so-called CPGs, have long been reluctantentrants into the green world. The makers of
the leading brands of detergents, personal care
products, processed foods, and other things
found up and down supermarket aisles have
stayed largely on the sidelines, viewing green
marketing as a risky, if not losing, proposition.
Suddenly, the world’s biggest brands seem to
be leading the way. Kraft, Procter & Gamble, SC
Johnson, and Unilever were among the CPGs
making green pronouncements during 2010.
P&G, the world’s largest CPG, took several major
steps, not the least of which was a “sustainabil-
ity vision” that set a series of long-term goals:
Use renewable energy for 100 percent of its fac-
tories, use 100 percent renewable or recycled
materials for all products and packages, and
send zero consumer or manufacturing waste to
landlls. The company also set interim 10-year
goals, to be achieved by 2020.
That was just the beginning. During 2010, P&G
also introduced to the U.S. its Future Friendly campaign, an effort begun in Europe to raise
awareness about greener products and prac-
tices; created a high-prole advisory panel of
sustainability experts; launched a supplier
scorecard; reformulated a bestselling sham-
poo to reduce toxins; announced concen-
trated versions of powder laundry detergents
that signicantly reduce packaging and energy
use; and introduced sugarcane packaging to
three of its brands. All of which followed the
company’s 2009 commitment to sell $50 bil-lion in “sustainability-driven” products by 2012,
a goal the company says it is on target to meet.
Unilever, one of P&G’s biggest competitors, fol-
lowed suit, launching a Sustainable Living Plan
focusing on the company’s supply chain — from
the farms that supply raw materials for its prod-
ucts to the emissions and waste generated by
customer use of those products. The company
committed to sourcing 100 percent of agricul-
tural raw materials sustainably by 2015, includ-ing palm oil; change the hygiene habits of 1 billion
people in developing countries to help reduce
diarrhea, the world’s second biggest cause of
infant mortality; make drinking water safer in
developing countries by extending sales of its
Pureit home water purier; and improve stan-
dards of living by working with nonprot groups
to link 500,000 small-scale farmers and distrib-
utors to Unilever’s supply chain.
What’s going on here? Have these behemoths
suddenly become treehuggers? Unlikely. Such
initiatives are logical extensions of efforts
already being undertaken, sometimes quietly, to
address stakeholder concerns, improve opera-
tional efciencies, and hedge risks related to
petroleum use and greenhouse gas emissions.
All of which provide opportunities to be seen as
a leadership company — not just by consumers,
but by investors, job seekers, and employees.
Credit also must be given to Walmart, which has
been pressing CPGs large and small to take suchmeasures — part of the retail giant’s own com-
mitments related to waste reduction, renewable
energy use, and making affordable green prod-
ucts. Most of the leading CPGs also belong to the
Sustainability Consortium, a research group
set up by Walmart but now run independently.
Among the consortium’s 70-odd members are
Church & Dwight, Clorox, Colgate-Palmolive,
General Mills, Kellogg’s, Kimberly-Clark, P&G, SC
Johnson, and Unilever. Together, they represent
more than $200 billion in annual sales.
Few of these companies are doing much green
marketing. Most remain on the sidelines, devot-
ing their marketing budgets to more traditional
consumer value propositions. But behind the
scenes, they are making dramatic shifts — things
unlikely to end up on product labels, advertise-
ments, in-store promotions, or any of the other
tools of the marketing trade.
1. Cs gats aak t g
Few of these
companies are
doing much
green marketing.
But behind the
scenes they are
making dramatic
shifts.

8/6/2019 State Green Business Report 2011
http://slidepdf.com/reader/full/state-green-business-report-2011 6/66
stat f g bsss
2011
6
2. Cpas a f ‘Z’
The notion of factories without Dumpsters isn’t
new. Xerox, for one, began an internal initiative
in the early 1990s known as the Waste-Free
Factory. It hasn’t yet achieved that goal, but it
has driven the company to reach a 92 percent
recycling rate for non-hazardous materials.
Along the way, other companies have put “zero
waste” squarely in their sights. And a growing
number have hit the mark. Some, like General
Motors, which announced that more than half
of its 146 global manufacturing plants had
achieved zero waste, have been at this for more
than a decade. Others are just getting started.Procter & Gamble, for example, announced its
rst zero-waste manufacturing plant in North
America, part of a companywide zero-waste
goal. Still others reached admirable milestones.
Sunny Delight said its Sherman, Texas, plant
became the company’s nal site to get to zero
waste, while Kraft announced that nine facilities
had achieved that distinction.
As Kraft came to learn, with a little ingenuity
almost anything can be kept from landlls. An
Allentown, Pa., plant sends off 5 million pounds
of mustard seed hulls left over from making
Grey Poupon for use as animal feed, instead
of to the trash. Kraft’s Lowville and Campbell
plants in New York dump whey, left over from
making Philadelphia cream cheese, into digest-
ers to make biogas to generate heat, supplying
about 30 percent of the plants’ energy needs.
A Tang factory in China realized that instead of
sending sugar that didn’t t its recipe back to a
supplier, it could forward it to another Kraft plantin China that makes Halls cough drops. Sweet!
These companies join others that have reached
zero-waste goals, from Caterpillar to Coca-Cola,
Diageo to Disney, brewers (MillerCoors) to ball
clubs (the San Francisco Giants).
A far greater number of companies are on their
way to “zero.” Carpet manufacturer Interface,
which set a Mission Zero goal more than 15 years
ago, said that of the 400 million pounds of raw
material it purchased in 2009, only 3.4 million
pounds went to landll — less than 1 percent.
As these companies have learned, cutting waste
can yield multiple savings. Dell, for example,
which last year edged close to its goal to cut 20
million pounds of packaging, found that optimiz-
ing packaging had several benets. For example,
it examined packaging for its Inspiron laptop
and determined that by reducing what goes
inside the box and laying out items in the box
differently, it could shave off a few millimeters
— enough to t nine additional boxes on a pallet,reducing transportation and storage costs. You
don’t need a laptop to compute those savings.
It’s not all easy going. One issue is that there is
no generally accepted denition of what “zero
waste” means. For example, some companies
dene zero waste to include incineration and
other thermally driven technologies that many
nonprots, public agencies, and waste manage-
ment professionals don’t consider to be worthy
of inclusion. On the other hand, the Zero Waste
International Alliance states that “Businesses
and communities that achieve over 90 percent
diversion of waste from landlls and incinera-
tors are considered to be successful in achiev-
ing Zero Waste, or darn close.”
“Darn close” isn’t likely to cut it in the hyper-
sensitive world of green, so this is an area sure
to attract accusations of “greenwashing.” That
may be a good thing: It suggests companies are
engaged and striving to make zero-waste claims.
Competition and oversight will sort things out.
Whatever the denition, there are more “zero
heroes” to come. Several big companies, among
them P&G, Sony, and Walmart, have set ambi-
tious zero-waste goals, even if their timetables
are a decade or more away. That doesn’t mean
they aren’t starting now — indeed, they must,
in order to get from here to “zero.” All told, it’s a
bandwagon that’s just getting rolling.
One issue is
that there is
no generally
accepted
denition of
what “zero
waste” means.
8/6/2019 State Green Business Report 2011
http://slidepdf.com/reader/full/state-green-business-report-2011 7/66
stat f g bsss
2011
7
StALEmAtEdLAwSAndcorporAtEthAwS
Businesses continue to increase their investments in sustainability inversely to their con-dence in legislative and regulatory activities to support a green economy. This is an impres-
sive indicator of the health of the green economy, as companies invest in green initiatives
to decrease costs and gain competitive advantage rather than merely to comply with
regulations.
In 2008, we created the GreenBiz Intelligence Panel to take a monthly pulse of the green
business world. Twice a year, we ask the panel’s nearly 3,000 members for their views on key
economic indicators. Our January 2011 survey garnered 414 responses, with slightly more
than half from companies with revenues greater than $1 billion. The indicators remain positive
for the green economy, including environmental spending, employment, and product devel-
opment. Some key ndings:
• Investmentscontinuetorise. Eighty-nine percent said their 2011 environmental,health, and safety spending will be equal to or greater than 2010 (44 percent and 45
percent respectively). Investment in green product development also continues: 84
percent said spending will be equal to or greater than in 2010.
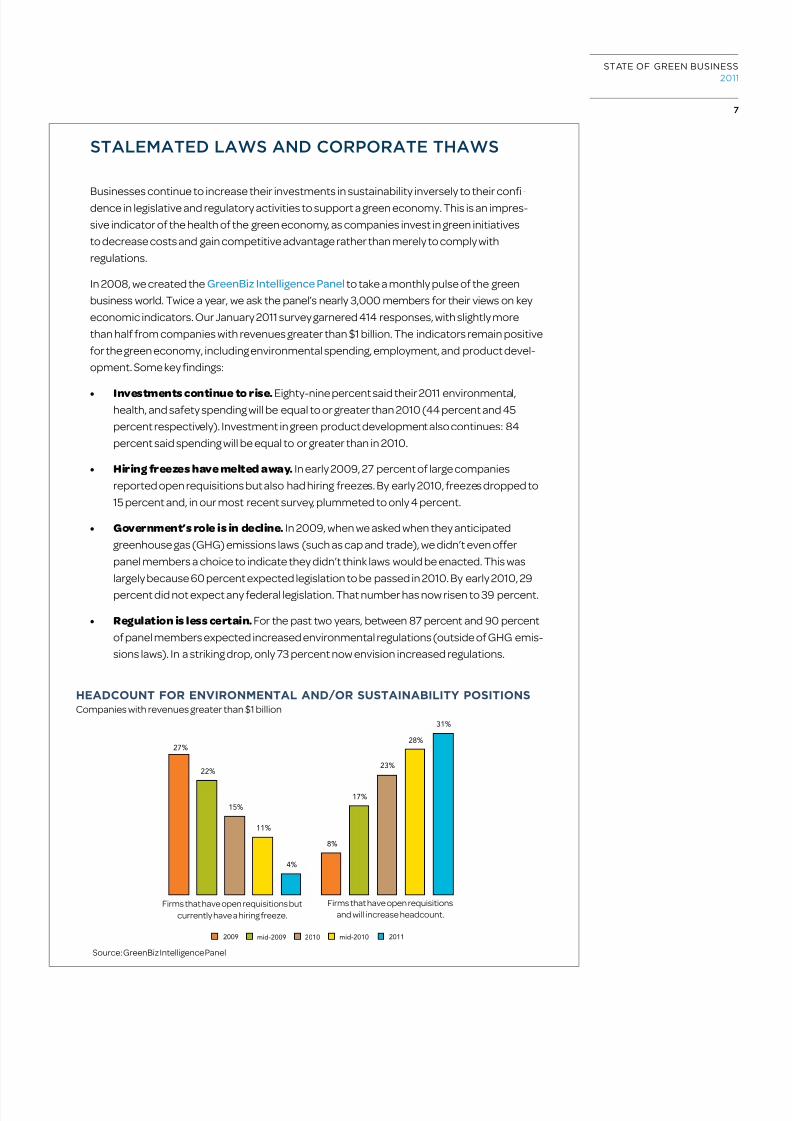
• Hiringfreezeshavemeltedaway. In early 2009, 27 percent of large companies
reported open requisitions but also had hiring freezes. By early 2010, freezes dropped to
15 percent and, in our most recent survey, plummeted to only 4 percent.
• Government’sroleisindecline. In 2009, when we asked when they anticipated
greenhouse gas (GHG) emissions laws (such as cap and trade), we didn’t even offer
panel members a choice to indicate they didn’t think laws would be enacted. This was
largely because 60 percent expected legislation to be passed in 2010. By early 2010, 29
percent did not expect any federal legislation. That number has now risen to 39 percent.
• Regulationislesscertain. For the past two years, between 87 percent and 90 percent
of panel members expected increased environmental regulations (outside of GHG emis-
sions laws). In a striking drop, only 73 percent now envision increased regulations.
Source: GreenBiz Intelligence Panel
HEAdCoUnt FoR EnviRonmEntAl And/oR sUstAinABilitY positionsCompanies with revenues greater than $1 billion
27%
22%
15%
11%
4%
8%
17%
23%
28%
31%
Firms that have open requisitions but
currently have a hiring freeze.
2009 mid-2009 2010 mid-2010 2011
Firms that have open requisitions
and will increase headcount.

8/6/2019 State Green Business Report 2011
http://slidepdf.com/reader/full/state-green-business-report-2011 8/66
stat f g bsss
2011
8
Environmental issues in developing economies
have long been of concern to Western compa-nies, but some issues are becoming more stra-
tegic, both to companies and countries. Geeky
buzzwords like “rare earths” and “conict miner-
als” are nding their way into mainstream media
and public discourse, and the sources of some
of the most widely used agricultural commodi-
ties are being scrutinized.
“Conict minerals” is a term that came into
widespread use during 2010. It refers to miner-
als mined in conditions of armed conict and
human rights abuses, notably in the eastern
provinces of the Democratic Republic of the
Congo, or DRC, where warring factions have
been embroiled in a decades-old civil war that
has caused 5 million deaths and displaced mil-
lions more.
Conict minerals include lesser-known sub-
stances — cassiterite, coltan, tantalum, tung-
sten, and wolframite — along with more com-
mon ones like tin and gold, which are essential to
manufacturing a variety of consumer electron-ics, including mobile phones, laptops, and MP3
players. Purchasing conict minerals, say activ-
ists, nances tribal ghting in the DRC. Armed
groups are present at many mines, often afli-
ated with rebel groups or the Congolese National
Army, both of which are said to use rape and vio-
lence to control the local population.
Tracking the use of conict minerals by compa-
nies has been difcult, and mostly in the domain
of a handful of activist groups. But in 2010, the
2,300-page nancial reform bill passed by the
U.S. Congress and signed into law contained a
provision aimed at curbing the use of four con-
ict minerals: gold, tin, tungsten and tantalum.
It put the burden of proof on the rms using
these minerals. The new law requires American
companies to submit an annual report to the
Securities and Exchange Commission disclos-
ing, starting in 2012, whether their products
contain any of these four substances from the
DRC or adjacent countries. If so, companiesmust describe what measures are being taken
to trace the minerals’ origin. The law goes well
beyond electronics companies: It applies to any
publicly traded U.S. rm that uses gold or tin in
its products. It may be a challenge for public
companies with deep supply chains to have
visibility into the practices of suppliers that sell
subcomponents and raw components that are
eventually integrated into parts sold to a nal
manufacturer or assembler.
Conict minerals are just the beginning. The
issue of palm oil loomed large for food proces-
sors during 2010. The oil — used increasingly in
the commercial food industry due to its lower
cost and the high stability of the rened prod-
uct when used for frying — is seen as a cause of
substantial and often irreversible environmental
damage, including deforestation, habitat loss of
critically endangered species such as the orang-
utan and Sumatran tiger, and climate change.
Last year saw a move by big players towardsourcing sustainable palm oil. Coalitions of large
companies like Nestlé and Unilever worked with
activist and other groups to better dene and
certify palm oil harvested sustainably. General
Mills committed to “sourcing palm oil in a
socially and environmentally responsible man-
ner” — specically, to purchase all palm oil exclu-
sively from members of the Roundtable for
Sustainable Palm Oil, a multi-stakeholder orga-
nization, by 2015. Walmart similarly commit-
ted to using 100 percent sustainably sourcedpalm oil for its branded products by late 2015.
Meanwhile, Burger King and Nestlé, both under
re from activists, agreed to stop purchases of
palm oil from unsustainable sources, while agri-
business giant Cargill agreed to initiate a review
of its palm oil sources.
All of this creates opportunities as well as chal-
lenges. Consider “rare earths,” a collection of 17
3. th dvlpg ld Yaks th spplY Cha
Geeky
buzzwords like
“rare earths”
and “conict
minerals” are
nding their way
into mainstream
media and public
discourse.

8/6/2019 State Green Business Report 2011
http://slidepdf.com/reader/full/state-green-business-report-2011 9/66
stat f g bsss
2011
9
chemical elements in the periodic table that are
used extensively in technologies such as wind
turbine generators, electric vehicle motors, bat-
teries, fuel cells, and energy-efcient lighting.
Ninety-seven percent of these materials come
from China — an economic challenge (due tolimited supply and global demand), an environ-
mental one (since mining, rening, and recycling
of rare earths can have major environmental
consequences), and a national security one
(since these materials are critical to infrastruc-
ture and transportation and China in 2010 began
restricting exports of these precious materials,
highlighting our dependence on them).
Viewing the challenges, Hitachi developed a
new, more efcient system to recycle the rare
earth magnets from discarded technology,
which previously went to landlls. The Japanese
manufacturer built what it says are the rst
machines of its kind, capable of extracting 100
magnets per hour, compared to the current
method, which requires workers to manually
extract magnets at a rate of about 12 per hour.
That’s a solid recipe for success in a resource-
constrained world.
ASmALLBuSInESSInnoVAtIonJuGGErnAut?
At the 2010 GreenBiz Innovation Forum, an annual confer-ence focusing on the intersection of innovation and sustain-
ability, a host of big companies touted their visions, commit-
ments, and accomplishments: How Procter & Gamble set
its sights on a billion new customers in the developing world; how Waste Management is reinventing
itself to prosper in a world of zero-waste factories; how Steelcase is using innovative mushroom-
based cushioning to replace polystyrene foam blocks when shipping its furniture to customers.
But it may be smaller entrepreneurial rms that can teach the Goliaths the most about innovation.
Small companies have the nimbleness to achieve radical innovations, but they lack scale. On the
other end of the spectrum are large companies that have the scale, but face the uncertainty of tak-
ing something that is working and trying to do it in a new way.
The Forum explored how some of the world’s largest companies are taking steps to nd and nur ture
small and sometimes little-known start-ups working on radically innovative technologies but lacking
the funding and the scale needed to move the needle forward. And how small startups can harness
innovation to compete with the big guys.
Consider Method, the maverick maker of cleaning products. It purposely killed one of its bestsell-
ling products — a liquid laundry detergent — in order to introduce a reforumlated version that is four
times more concentrated than competitors’ brands. Method’s chemistry breakthrough yielded a
laundry detergent that requires 75 percent less packaging and boasts a 35 percent smaller carbon
footprint. It enabled Method to compete with companies that are thousands of times its size.
“We’re probably the smallest consumer products company out there, with few exceptions,” Adam
Lowry, Method co-founder, told the Forum. “So for us, in order to compete in the category, we haveto radically innovate because we don’t have the scale. As a smaller company, we have to do that. We
don’t have a choice,” Lowry said. “And it’s easy for us to do. Let’s face it: We don’t have Wall Street
breathing down our necks.”

8/6/2019 State Green Business Report 2011
http://slidepdf.com/reader/full/state-green-business-report-2011 10/66
stat f g bsss
2011
10
4. g taspt aks ts v
The year 2010 will likely be remembered for the
rebirth of electric vehicles — not just the vauntedChevy Volt and Nissan Leaf, and not even the
pricey Tesla, but dozens of other brands, large
and small, that came into public view. And their
entrance has spurred a small but growing eco-
system of corporate alliances seeking to tap
into the new opportunities.
Some of these alliances are predictable —
for example, announcements by Hertz and
Enterprise to add EVs to their rental eets.
Others brought together large players with
smaller ones — a partnership by Better Place
and GE to build a battery recharging infrastruc-
ture, for example, or Panasonic’s investment in
Tesla, allowing the former to supply lithium-ion
batteries to the latter, while jointly they work on
next-gen battery cells. Meanwhile, a global alli-
ance chaired by Prince Albert of Monaco set a
target of getting 1 million more electric vehicles
on the road in the next ve years than auto-
makers have planned to bring to market. These
companies and public agencies join with other
early adopters, such as GE, which pledged to
buy 25,000 electric vehicles over the next ve
years for its own eet, as well as for customers in
its eet management business.
But the greening of transport goes well beyond
vehicles. Greener technologies and practices
are emerging for a raft of transportation types
on land, sea, and air.
Ocean-going vessels, the means by which two-
thirds of the goods purchased by U.S. consum-
ers arrive on American shores, have long been
an environmental problem. While ocean-going
vessels worldwide account for just 2 to 3 per-
cent of global fossil-fuel consumption, they are
responsible for 14 percent of the nitrogen emis-
sions from fossil fuels and 16 percent of all sulfur
emissions from petroleum, according to a study
by Carnegie Mellon University. One reason:
Cargo ships run on “bunker fuel,” the dirtiest,
cheapest product that remains once gas and
other high-grade fuels have been rened fromcrude oil.
Shippers traditionally have had no visibility into
which companies are using cleaner fuels, but
that’s changing. Last year, Maersk Line became
the rst in its industry to independently verify
its carbon emissions vessel by vessel, enabling
customers to track the environmental data
along with other performance information
about the shipping line. The company also said
it was slowing down its ships to save fuel and
cut emissions. It found that a 20 percent reduc-
tion in speed can cut fuel use and CO2
emissions
by up to 40 percent. Meanwhile, the world’s rst
hybrid electric tugboat, which plies Southern
California’s San Pedro Bay, emits 73 percent
less soot, 51 percent fewer nitrogen oxides and
27 percent less carbon dioxide than a standard
tug of comparable size, researchers found. Talk
about a sea change.
Up in the air, carriers found new ways to cut fuel
and emissions. Alaska Airlines began tests of a new emissions-reducing technology, wing-
ing its way to 35 percent reductions by recon-
guring how its planes descend for landing. Its
“Optimized Prole Descents” allow jets to idle
their engines for more of the descent, saving
nearly 60 gallons of fuel per ight. Virgin America
said that it would cut fuel use by up to 3 percent
this year simply because of better routing.
Back on terra rma, the biggest shipping compa-
nies revved up their competition to cut fuel use
and emissions. FedEx Corp. developed a new
program to unify the company’s efforts to meet
its goals of minimizing its environmental impact.
Its EarthSmart program is aimed at inspiring
innovations that will help the company improve
vehicle fuel efciency by 20 percent by 2020.
United Parcel Service, for its part, expanded
its carbon-neutral shipping program to 35
countries. Under the program, shippers in the
The greening of
transport goes
well beyond
vehicles.
Greener
technologies
and practices
are emerging
for a raft of
transportation
types on land,
sea, and air.
8/6/2019 State Green Business Report 2011
http://slidepdf.com/reader/full/state-green-business-report-2011 11/66
stat f g bsss
2011
11
U.S. can offset the carbon footprint of their
packages by paying a small fee that covers the
cost of the offsets, emissions calculation, and
administration.
Even railroads seemed to be moving down
the right track, environmentally speaking. U.S.
rail operator Amtrak may have given the term
“cattle car” a new meaning with the rst test of
a biodiesel train that runs on beef byproducts.
The government-owned rail company began
operating its daily Heartland Flyer traveling
between Oklahoma City and Forth Worth using
B20 biodiesel fuel. The fuel, which mixes 80 per-
cent diesel with 20 percent biofuel, cuts both
hydrocarbon and carbon monoxide emissions
by 10 percent.
GrEEnBuILdInGS:AFoundAtIonForGrowth
Green building remains a bright spot in a gloomy economy, according toGreenBiz’s 2010 Green Building Marketing & Impact Report. The report,
written by GreenerBuildings.com executive editor Rob Watson, one of the
founders of the LEED green building rating system, is an annual assess-
ment of the LEED market as well as the environmental impacts of green
buildings. Among the report’s ndings:
GreenConstructionRemainsStrong…forNow: In 2010, the certied
building space (measured in square feet of oor space) nearly equaled the
previous 10 years’ certied oor area combined. In 2010, newly built LEED-
certied oor area exceeded 20 percent of new construction additions.
However, LEED registrations — a leading indicator of green buildings under construction — were
down precipitously at the end of 2010.
TheGreeningofFacilitiesIsGrowing:In 2010, LEED for Existing Buildings: Operations and
Maintenance, or EBOM, certied almost 50 percent more oor area — over 80 million square
feet — than did LEED for New Construction, growing nearly 80 percent from the previous year.
Cumulatively, since its launch in 2004, LEED for existing buildings has certied nearly the same total
oor area as LEED NC since that standard’s launch in 2000. In spite of this success, LEED EBOM is
less than halfway to where it needs to be to sufciently contribute to minimizing climate change.
GreenBuildingYieldsStrongEnvironmentalBenets:Watson’s calculations and analysis
found that:
• LEED is having a signicant reduction in employee commuting, resulting in a reduction of 1.4
billion vehicle miles traveled, up from 400 million in 2008.
• Water savings from LEED buildings were also up signicantly in 2010 — to 33 billion gallons, or
0.5 percent of annual U.S. non-residential water use.
• LEED buildings were found to reduce greenhouse gas emissions by 8 million tons a year from
energy efciency and the use of renewables.
• Based on average materials costs, green building materials represented approximately $14.5
billion in cumulative spending through 2010.
• More than 1.5 million employees are currently enjoying improved indoor environments while
working in LEED buildings.

8/6/2019 State Green Business Report 2011
http://slidepdf.com/reader/full/state-green-business-report-2011 12/66
stat f g bsss
2011
12
5. sstaabl fd bCs a a Cs
sustainable seafood. Indeed, the tide is turning
on how some companies are sourcing sh, duein large part to years of activist pressure stem-
ming from concern about both depleted sh-
eries as well as the environmental damage of
large-scale sh farming. One target was Trader
Joe’s, which gave in to a relentless “Traitor
Joe’s” campaign by Greenpeace, saying it would
sell seafood only from sustainable sources by
the end of 2012. Greenpeace also played “good
cop,” praising retailers with sustainable seafood
policies, with Target leading the pack.
There was action by both companies and activ-
ists on integrating sustainability considerations
into a range of food and beverage products,
from coffee to cattle. And 2010 also brought
signs aplenty that food producers were cooking
up innovations that could reduce their prod-
ucts’ impacts — aquaculture environments that
mimic nature by raising a variety of ecologically
complementary species, for example.
Beyond that is a growing awareness of what it
takes to bring food to market, and the environ-mental implications of the journey a typical meal
travels. Of course, “food miles” and “locavores”
are hardly new concepts — and the growth of
farmers’ markets is an old, albeit positive, story.
But the conversation has gotten more sophis-
ticated as experts recognize that distance
traveled isn’t the only metric worth consider-
ing; sometimes, what’s local isn’t what’s most
sustainable.
Nonetheless, when one totals the miles in a rela-
tively simple meal, the results can provide food
for thought. Students at California College of
the Arts took on an assignment to map the local
“tacoshed” — the distance traveled of every
ingredient in that common Mexican dish — and
found that for a single, humble taco, the ingre-
dients had traversed a total of 64,000 miles, or
just over two and a half times the circumference
of the Earth. ¡Ay caramba!
It wasn’t very long ago that “sustainable agri-
culture” was the domain of the natural foodsindustry, locavores, and other greenies, refer-
ring to products aimed at a market niche of con-
sumers seeking foods they deemed healthy for
their families and the planet. But like so many
other things in the green arena, sustainable ag
has gone mainstream. A growing list of big com-
panies are making commitments and taking
actions that would have seemed unlikely just a
couple years ago.
This is yet another arena in which Walmart
seems to be playing a key role. In fall 2010, the
retailer announced a series of ve-year goals
addressing the food supply chain, from farm
to fork. The company set a goal of selling $1 bil-
lion in food sourced from 1 million small and
medium farms while providing training to 1 mil-
lion farmers and farm workers in such things as
crop selection and sustainable farm practices.
It also pledged to increase the income of the
small and medium farmers it sources from by
10 to 15 percent and, in the U.S., double its pur-
chase of locally sourced produce to 9 percent
by 2015. Finally, because an estimated 30 to
40 percent of the food grown around the world
never reaches a table, Walmart also set goals to
reduce food waste in the supply chain.
Walmart was hardly alone among big compa-
nies. Unilever launched a Cool Farm Tool to
help suppliers measure the greenhouse gas
emissions of agriculture practices, and help
farmers decrease their carbon footprint with
“what-if” scenarios. The U.K. consultancy Two Tomorrows ranked Unilever rst in the food
and beverage sector — ahead of Nestlé, Danone,
Pepsico, and Coca-Cola — in sustainability
leadership, citing their work in founding the
Marine Stewardship Council and Roundtable
on Sustainable Palm Oil, and as one of the early
supporters of fair trade and nutritional labeling.
Another pool of growing activity is focusing on
This is yet
another arena in
which Walmart
seems to be
playing a key
role.

8/6/2019 State Green Business Report 2011
http://slidepdf.com/reader/full/state-green-business-report-2011 13/66
stat f g bsss
2011
13
SuStAInABILItBEcomESAproFESSIon
There’s been a lot of talk about green jobs — what they are and their impact
on the economy. But less attention has been paid to the rising number of
chief sustainability ofcers and their impact on their companies. As the
number of senior executives overseeing environmental and corporate
responsibility strategy increases, we decided to nd out how much they
made, where they worked, and how they got the job.
During the summer of 2010, we surveyed 535 members of our GreenBiz Intelligence Panel and
published the rst annual GreenBiz Salary Survey. As a proxy for how important the role is within
corporations, we asked our panel members to identify the highest-ranking executive whose job is
100 percent focused on the company’s sustainability efforts. While there may be limited staff dedi-
cated to sustainability efforts on a full-time basis (54 percent of respondents had 1 to 5 full-time
employees dedicated to sustainability efforts), the individuals leading these efforts are relativelyhigh-ranking executives: 36 percent were at the vice president level and another 36 percent at the
director level.
Experience and education are critical to securing the top job. Sustainability executives at large com-
panies are well educated, with 65 percent of VPs, 57 percent of directors, and 58 percent of manag-
ers holding a master’s degree. Managers with a master’s degree earned almost 20 percent more
than their counterparts holding only a bachelor’s degree. More than 90 percent of vice presidents
have at least 16 years of experience, making deep and broad experience a minimum requirement for
those jobs.
In terms of gender, sustainability roles mirror other corporate executive positions, as men comprise
60 percent of sustainability executives in large companies. The disparity is greater for staff posi-
tions, where women comprise 63 percent of the sustainability staff in large companies.
While salary is one component of compensation, 67 percent of vice presidents reported receiv-
ing more than 20 percent of their salary in bonus compensation, as did 36 percent of directors.
Seventy-one percent of VPs and 63 percent of directors reported receiving stock or options grants.
At last, companies are rewarding sustainability professionals for a job well done.
Vice President
Director
Manager
$192,064
$160,320
$103,197
AvERAgE sAlARY FoR sUstAinABilitY ExECUtivEs
Source: GreenBiz Group

8/6/2019 State Green Business Report 2011
http://slidepdf.com/reader/full/state-green-business-report-2011 14/66
stat f g bsss
2011
14
6. tCs ad stadads bC th l
The paradox about sustainable business, say
some, is that there are too many standardsand not enough metrics. There’s truth to that,
though it’s misleading. For all of the hundreds of
eco-labels and certications, there remain huge
gaps — product categories where there are few
or no labels or certications, from cars to cloth-
ing to cosmetics.
Many of the existing standards and certica-
tions are limited in scope, focusing on, say,
energy consumption or greenhouse gas emis-
sions, but not necessarily on any of several
other impacts a given product may impose on
the environment.
A number of organizations are stepping in to ll
the gaps. Underwriters Laboratories is one exam-
ple: Its UL Environment division began issuing a
range of standards in 2010, such as one for cell
phones that takes into account their entire life-
cycle, from raw material extraction to customer
use to disposal. (UL Environment is also part-
nering with GreenBiz to create a company-level
sustainability standard, ULE 880, intended formanufacturing rms.) Green Seal expanded its
scope with a new pilot standard that seeks to
certify the sustainability of an entire company.
The group’s new GS-C1 certication is aimed at
consumer goods manufacturers.
Some standards are coming from companies
themselves. UPS launched a green standard for
responsible packaging, which allows customers
to ship their goods with a label attesting to that
fact. Its Eco Responsible Packaging Program
evaluates a customer’s shipment packaging
in three key areas — damage prevention, right-
sizing and packaging materials. The goal is to
use the least packaging that offers the greatest
protection. A group of apparel and footwear
companies, including Levi’s, Patagonia, and
Timberland, banded together to launch the
Eco Index, a set of guidelines, indicators, and
metrics for measuring the lifecycle impacts of
their products. Meanwhile, Nike created a one-
screen Environmental Apparel Design Tool, inwhich designers plug in what materials they’re
using, how much recycled or organic content
they have, and other details. The tool gives the
design an environmental score. Nike made the
tool available for other companies to use. And
Timberland announced that its Green Index,
which rates the environmental footprint of
about one in seven pairs of shoes it sells, will be
applied to all of its footwear by the end of 2012.
Such efforts reect the growing requests — or,
in some cases, demands — from customers
and stakeholders for manufacturers to mea-
sure, manage, and track the full impacts of their
products and processes. That’s given new life
to the world of lifecycle assessments, whether
through the use of formal LCAs or less-formal
(though not necessarily less accurate) lifecycle
measurement techniques.
One form of product assessment, called an
Environmental Product Declaration, or EPD, is
gaining favor. EPDs are structured and detaileddocuments disclosing the lifecycle impacts of
products. Modular carpet maker Interface said
it would complete EPDs for all of its products
by 2012 and challenged other companies to
set similar goals. UL Environment said it would
launch an EPD program in 2011 as a means to
provide greater product transparency.
The use of EPDs and LCAs is likely to grow in
lockstep with the introduction of software tools
and databases designed to help companies
conduct such assessments. Those tools are just
emerging. Seventh Generation, Walmart, and
Tetra Pak are among companies that said they
would test-drive something called Earthster
2 Turbo, an LCA tool with a companion open-
source database. It aims to give companies
greater knowledge of their supply chains in order
to make smarter, more sustainable design deci-
sions. Earthster is just one of a growing toolkit of
The paradox
about
sustainable
business is that
there are too
many standards
and not enough
metrics.
http://www.greenbiz.com/news/2010/09/13/green-seal-unveils-pilot-certification-sustainable-companies

8/6/2019 State Green Business Report 2011
http://slidepdf.com/reader/full/state-green-business-report-2011 15/66
stat f g bsss
2011
15
software products being marketed to help com-
panies track not just their products, but their
entire operations. Several carbon accounting
software products were on view at SAP’s 2010
annual user conference, among the many soft-
ware rms, large and small, eyeing the market
for sustainability tools — a market that’s grown
to north of a half-billion dollars a year.
And with new rules from the U.S. Securities and
Exchange Commission, and increasing pressurefrom other regulators, investors, and custom-
ers, GHG accounting has become an expected
practice for large companies, leading to a bevy
of new software tools.
The state of the art of sustainability measure-
ment and accounting is still relatively nascent,
but should grow as demand accelerates overall
for corporate sustainability (or corporate social
responsibility) reporting. Reporting by compa-
nies of their environmental (and social) impactscontinues to grow modestly, though there are
forces that could shift the landscape.
One force for change is the increasing demands
for transparency put on corporations by stake-
holders and shareholders. This isn’t a new phe-
nomenon, but it is a persistent one, pressure that
over time takes its toll on reluctant companies.
Accounting giant PricewaterhouseCoopers
reported that the number of sustainability
reports has continued to increase despite
the global economic recession, and that such
reports have “become critical to a company’s
credibility, transparency, and endurance.”
Among the global organizations pushing sus-
tainability reporting is the Organization for
Economic Co-operation and Development,
or OECD, a forum for industrialized nations.
During 2010, the OECD teamed with the Global
Reporting Initiative to bring “increased coher-ence and consistency” to sustainability report-
ing by big corporations. GRI’s Sustainability
Reporting Framework is the world’s most widely
used sustainability reporting mechanism.
GRI, for its part, is one of several global organiza-
tions pushing to marry sustainability reporting
with nancial reporting. The idea is that sustain-
ability metrics be standardized and integrated
into the nancial reports required of all publicly
held companies and, presumably, those volun-tarily produced by non-public companies.
The notion of such an integrated annual report
is the ultimate goal for reporting advocates, as
it would embody the triple bottom line of social,
environmental, and economic performance.
Such reports will be forthcoming within a few
years from a handful of leadership companies,
though it could take a decade or more before
integrated reporting becomes mainstream.
ASuStAInABILItStAndArdForBuSInESS
During 2010, GreenBiz Group, in partnership with UL Environment, unveiled a company-level sus-tainability standard, ULE 880 — Sustainability for Manufacturing Organizations. A draft of the stan-
dard — which covers a company’s policies and performance in environment, workforce, governance,
customers and suppliers, and communities and human rights — was published in mid-2010. A public
review period yielded more than 1,500 comments, which was followed by a two-day stakeholder
meeting and the subsequent issue, in January 2011, of an interim standard, which will be piloted by
several companies during 2011.
The standard is intended to enable procurement ofcials, customers, trading partners, investors,
and employees to consider company environmental and social performance in decision-making,
thereby elevating the importance of these issues to organizations.
For more information, visit www.greenbiz.com/ratings .

8/6/2019 State Green Business Report 2011
http://slidepdf.com/reader/full/state-green-business-report-2011 16/66
stat f g bsss
2011
16
7. txC CCs sp g altatvs
Revelations of toxic ingredients in consumer
goods reached a crescendo during 2010, ele-vating the topic on the agendas of companies,
activists, and regulators alike. Toxics, endocrine
disruptors, carcinogens, and other chemical
evils seemed to be showing up everywhere: baby
bottles, fast-food toys, celebrity-branded jew-
elry, mattresses, wallpaper and ooring, food
packaging, even cash register receipts.
Heavy scrutiny focused on bisphenol A, or BPA,
the primary component in a plastic used in the
resin lining of food and beverage cans. In ani-
mal studies, BPA exposure has been linked to
everything from cancer and diabetes to repro-
ductive abnormalities and changes in brain
development.
BPA came under re during 2010, the result of
scores of media reports that seemed to build
on one another. BPA was found to be present
in 91 percent of the Canadian population, par-
ticularly in teens aged 12 to 19, according to one
study. It was found in organic canned foods
produced by leading companies like GeneralMills. The fact that BPA had earlier been found
in a popular brand of stainless steel water bot-
tles used by green-minded consumers became
a cause célèbre for Oprah, Ellen, Martha, and
other talk-show hosts with large viewerships of
anxious moms. Politicians in Europe and North
America rattled their regulatory sabers, banning
— or threatening to ban — BPA from products.
Companies like Heinz and ConAgra led a run for
the exits, banning BPA from their packaging.
It wasn’t just BPA. Another toxin in the news was
triclosan, an antibacterial and antifungal agent
found in many consumer products. Laboratory
studies on animals have linked triclosan to
changes in hormone regulation, though there
was no clear-cut evidence of its impact on
humans. Nonetheless, activists pressed U.S.
regulators to ban the ingredient from soaps
and other products. By year end, the U.S.
Environmental Protection Agency was seeking
public comment on a petition to ban triclosan for some uses. Colgate-Palmolive said it would
move away from the ingredient, as did Staples,
the ofce retail giant, which said that it would
consider banning the ingredient from soaps and
hand sanitizers sold in its stores.
All of these activities and other forces shined a
bright light on the already growing eld of green
chemistry, a nascent movement that seeks to
transform the way products are made, reduc-
ing or eliminating the unknown and potentially
harmful substances commonly used in manu-
facturing. Green chemistry has been around for
well over a decade, though it is only recently hit-
ting its stride as mainstream chemical compa-
nies invest in new, more benign ways to arrange
molecules that perform the everyday miracles
of our modern age.
Example: BASF and Dow Chemical developed a
new way to make propylene oxide, which has a
worldwide demand of 14 billion pounds and is a
chemical building block for many industrial andcommercial products. The new method elimi-
nates hazardous efuents, creates up to 80 per-
cent less wastewater and uses 35 percent less
energy. Perhaps best of all, production facilities
using the new process are 25 percent cheaper
to build since they don’t need collection and
purication equipment.
As BASF and Dow showed, the economics of
green chemistry are becoming favorable. And
as larger rms begin to press chemical manu-
facturers to squeeze out problematic ingredi-
ents, the volumes are reaching a scale that will
increasingly make more green alternatives cost-
competitive. For example, Aveda leveraged the
scale of its parent company, Estée Lauder, when
it asked suppliers of ethoxylated surfactants
to make modications to align with Aveda’s
green chemistry efforts. The surfactants are
widely used in cosmetics as foaming agents,
Green chemistry
has been around
for well over a
decade, though
it is only recently
hitting its stride.
http://www.greenbiz.com/blog/2010/12/20/triclosan-dirty-secrets-can-land-your-products-toxic-lockout
8/6/2019 State Green Business Report 2011
http://slidepdf.com/reader/full/state-green-business-report-2011 17/66
stat f g bsss
2011
17
emulsiers and humectants, but their manufac-
turing process creates carcinogenic by-prod-
ucts. Leveraging both companies’ purchasingpower allowed them to reduce costs.
Perhaps the biggest driver of green chemistry is
legislation. Increasingly, regulators around the
world are eyeing the health and environmental
impacts of BPA, triclosan, and other problem-
atic ingredients. In the E.U. and the U.S., and
especially in the trendsetting state of California,
policy makers have trained their sights on drasti-
cally reducing public exposure to toxics.
The regulators at the U.S. EPA appears to haveawoken from a long slumber to take a proac-
tive role in chemical regulation. During 2010,
the agency said it was adding 700 chemicals to
the list of those being put through its ToxCast
screening system, which subjects chemicals
to 500 quick tests. But that’s still a drop in the
bucket: More than 84,000 chemicals are regis-
tered in the United States, and due to current
laws, the EPA has been able to order tests on
only a few hundred of them, and take action on
fewer still.
Perhaps more signicant was an EPA pro-
nouncement that could lift the veil of secrecy
surrounding chemicals in products. The rule,
handed down early last year, says that compa-
nies that submit information on chemicals that
pose substantial risks to humans and the envi-
ronment will not be able to claim that the identi-
ties of the chemicals are condential business
information. One study showed that companies
had been able to claim condentiality on some
17,000 registered chemicals.
And in California, a debate stewed throughout
the year, as yet unresolved, over the fate of a
Green Chemistry Initiative. Among other pro-
visions, it would require companies that manu-
facture anything deemed a chemical of concern
to perform an assessment of alternatives. The
hope is that shining a spotlight on non-toxic
options will leave companies with fewer reasons
to continue with toxic business as usual.
whGrEEnmArKEtInGcontInuEStoconFound
During 2010, the U.S. Federal Trade Commission issued a long-awaited update to its “Green
Guidelines,” which guides companies on what they can and can’t say about products they are pro-
moting as environmentally responsible. The guidelines were originally issued in the 1990s and hadn’t
been updated for more than a decade.
The proposed changes weren’t exactly earth-shattering, adding guidance on such matters as bio-
based materials, products made with renewable energy, and those claiming carbon offsets.
Like their predecessors, the guides represent a low bar, intended to eliminate outright misrepre-
sentation and fabrications. And they don’t address some of the more potent claims a company can
make about its product or packaging. Cradle to Cradle — a standard that certies products whose
ingredients can be recycled back into nature or industrial processes — is not mentioned. Biomimicry
— products inspired by nature that use less energy and whose designs or materials mimic plants,
bugs, sea life, and other critters — you won’t nd guidance for that. Green chemistry — the next-gensubstitutes for some of the world’s most toxic chemicals? It’s nowhere to be found.
There’s no guidance on the word “sustainable” or “sustainably.” Or “green.”
In the end, the FTC guidelines address only a tiny fraction of what companies are doing — the overt,
relatively minor improvements companies make to their products and processes. As such, green
marketing will continue to be a niche activity, as companies continue to pursue their most signicant
environmental actions quietly, with precious little fanfare.

8/6/2019 State Green Business Report 2011
http://slidepdf.com/reader/full/state-green-business-report-2011 18/66
stat f g bsss
2011
18
8. at ftptg aks a splash
Water has been rising as a sustainability issue.
In past reports, we’ve referred to it as “thenew carbon” due to its parallels to companies’
efforts with their greenhouse gas footprint:
understanding and measuring it, reducing it,
even offsetting it to the point of being “neutral.”
Companies in water-intensive industries, such
as beverages, semiconductors, electric power,
and chemicals, have been increasingly address-
ing their impacts over the past several years. But
now attention has trickled down to a broader
array of companies, as the tide of attention
reaches a new high-water mark.
Business headlines about water these days
almost always contain the word “risk.” “Why
Water Is A Risk And Opportunity Your Company
Can’t Ignore,” “Growing Water Scarcity And
Its ‘Hidden’ Risks To Investors,” and “The
Consequences of Ignoring Water Risks in the
U.S.” are just three of several such headlines
GreenBiz.com ran during 2010. These stories
stem from the growing understanding of how
global water issues will likely affect company
operations in the coming years, as droughts,
oods, climate shifts, growing populations,
increasing consumption, and other factors
cause manufacturing perturbations, disrupt
markets, displace customers, lead to energy
shortages, and otherwise wreak havoc on pro-
ductivity and prots. All of which places water
security squarely in the boardroom, where it is
becoming a strategic issue.
For boards, the rst order of business is inevita-
bly getting one’s arms around the nature of therisks. That means conducting a water footprint
analysis, a means of understanding how much
and what kinds of water are used in the making
of products and running a business, including
the water used by suppliers as well as custom-
ers — upstream and downstream, as it were.
Among other things, such analyses can yield
some surprising results about the amount of
water embedded in products. For example, a
water footprint conducted by one of Coca-Cola’s European operations found that it takes
70 liters of water to make one liter of the com-
pany’s agship cola, at least when producing
it in the Netherlands using Dutch sugar beets.
The measurement segregated water types into
three types of consumption: “green” (stored
rainwater used by farms to produce raw materi-
als), “blue” (water from rivers, lakes, and aquifers
used in factories and processors to manufac-
ture products and grow crops), and “grey” (fresh
water that absorbs pollutants from agricultureand manufacturing).
If all this sounds complex, it is. Water’s compari-
son to carbon notwithstanding, accounting for
the former can be more complicated than it is
for the latter. For one thing, the amount of water
used to produce something can vary widely,
depending on where and how it’s produced.
A given item can also consume all three types
of water. Example: a kilogram of sugar beets
sourced in Europe has, on average, a green water
footprint of 375 liters, a blue water footprint of
54 liters and a grey water footprint of 128 liters.
Despite the complexity, companies are nding
that conducting a water footprint analysis can
help them seek opportunities for efciency and
optimization. It can also lead to innovation. Levi
Strauss & Co. found a way to reduce the water
consumed to make a pair of jeans by up to 96
percent, reducing water use by 16 million liters in
a typical season. True, manufacturing accounts
for only about 4 percent of the 1,000-gallonfootprint of a pair of Levi’s jeans — 94 percent
of it comes from growing cotton and consumer
laundering of the jeans — but it is that 4 percent
that Levis pays for directly.
Water footprinting is an emerging discipline, and
companies are often left to create their own
rules. Kimberly-Clark, which makes bath tis-
sue, debated whether to include in its water
Business
headlines about
water these
days almost
always contain
the word “risk.”
8/6/2019 State Green Business Report 2011
http://slidepdf.com/reader/full/state-green-business-report-2011 19/66
stat f g bsss
2011
19
footprint the water used to ush a toilet, which
represented 85 percent of the tissue’s water
impact. The company found that the amount of
water a toilet uses can affect whether and how
its tissue goes down the drain. So the company
began giving away free Smart Flush bags , which
can save one liter of water per ush — up to
2,000 gallons a year for a family of four.
All of this represents the next wave of how com-
panies must think about water. Growing pres-
sures to disclose water footprints — much as
companies have done with their carbon foot-
print — will lead many companies to dive in. In late
2009, the Carbon Disclosure Project launched
CDP Water Disclosure, an initiative seeking to
increase reporting on water-related risks and
opportunities, especially by companies oper-
ating in water-intensive sectors. During 2010, it
received its initial responses from companies.
Among the ndings: There is a drought of met-
rics used by companies to measure and track
their water use.
That’s bound to change, and quickly, as water’s
importance to the bottom line becomes more
widely understood — and experienced — and
as new tools become available from a variety
of entities, and as more companies begin to go
with the ow.
wILLASIAout-GrEEnAmErIcA?
A great deal of ink and electrons have been spilled by publications and websites ringing the alarmabout China’s growing dominance over clean technology. Indeed, that country is becoming the
low-cost producer of a range of green innovations, from solar cells and wind turbines to batteries
for electric vehicles. In that regard, there is genuine concern within U.S. borders about whether
these technologies — many of them invented and perfected in America — will join the ranks of other
technologies lost to other countries.
China shouldn’t be the only concern. During 2010, a spate of Asian companies made bold gestures
toward a green future. The Korean industrial company LG announced it would spend nearly $18 bil-
lion over the next 10 years cutting its carbon footprint 40 percent and developing greener products.
It was just one of several Asian manufacturers to make signicant commitments last year to clean
technology and greener products:
• Panasonic unveiled a three-year plan called “Green Transformation 2012,” which it said will
lay the groundwork for it to become the world’s leading “Green Innovation Company” by 2018,
Panasonic’s 100th anniversary.
• Hitachi, which reached its century milestone in 2010, said it would put environmental innova-
tions at the core of the company’s operations for the next 100 years.
• Samsung said it spent $865 million during 2009 to develop greener products and make its
manufacturing sites more efcient as part of a multi-pronged effort to become one of the
world’s most environmentally friendly companies.
• NECCorp., Japan’s largest PC maker, unveiled plans to invest $1.1 billion over eight years in
battery and smart grid technologies.
The impact of these efforts won’t be known for years, but collectively, they made it loud and clear
that Asian rms view green and clean innovations as their path forward to growth — and, perhaps, to
long-lost protability.

8/6/2019 State Green Business Report 2011
http://slidepdf.com/reader/full/state-green-business-report-2011 20/66
stat f g bsss
2011
20
9. Cpas la t Cls th lp
The promise of a closed-loop society — where
everything is recycled endlessly into new prod-ucts and packaging — remains a distant dream,
though it creeps ever closer. Companies are
nding new and innovative ways to turn old
things into new things. It’s far from the Holy Grail
of Cradle to Cradle — in which every material is
recycled back to a raw material or into a benign
or benecial soil amendment — but it’s a start.
Sometimes, a little recycling becomes a step-
ping-stone to a bigger achievement. For exam-
ple, Starbucks announced it had completed
a test toward a longstanding goal: turning used
coffee cups into new cups. The coffee giant said
it wants to provide only recyclable or reusable
cups by 2015, and has run various recycling proj-
ects to see what its cups can be turned into. Its
pilot project sent about 8,000 pounds of cups
to a company that provides the post-consumer
content that’s been in Starbucks’ cups since
2006. The pulp processor sends the pulp to
various companies that make Starbucks’ cups.
All of the companies’ cups, including the newest
ones, have 10 percent recycled content.
Starbucks has put plenty of time and effort
into promoting recycling of its cups. It hosted
two “cup summits” to bring together all of the
relevant paper and recycling players. It also
sponsored a contest seeking ways to reduce
the number of non-recyclable cups leaving its
stores, which resulted in several submissions
for how to encourage customers to opt for reus-
able cups. For all this, Starbucks still has a ways
to go: Only a small fraction of the four billioncups it produces a year are kept out of landlls.
Walmart threw its hat into the loop, too, in the
form of a pilot project with TerraCycle, the
maverick manufacturer of consumer prod-
ucts made from branded waste packaging.
TerraCycle converts waste like candy wrappers,
yogurt tubs, pens, and coffee bags into prod-
ucts such as tote bags, plant pots, backpacks,
pencil cases, and portable speakers. Five U.S.
Walmart stores began testing a collection sys-tem for 28 types of trash to send to TerraCycle.
Walmart also launched a partnership with a rm
called Worldwise, in which the retailer will sell
pet products made from recycled materials —
dog beds made from used plastic soda bottles,
cat scratchers made from recycled hangers, lit-
ter liners made from old paper bags, and the like.
There are others. Hasbro, maker of G.I. Joe,
Transformers, and other iconic toys and games,
said it would increase the recycled content of
its packaging and paper materials to 75 per-
cent in 2011. Massachusetts-based Recycline
said it collected 50 tons of used polypropyl-
ene plastic in 2010 though its Gimme 5 recy-
cling program (polypropylene is marked as No.
5 in the plastics coding system), turning it into
toothbrushes and other goods. The company
makes razors, plates, mixing bowls, and more
out of 100 percent recycled polypropylene,
which is rarely accepted in recycling programs.
Pepsi-owned Naked Juice said it is making good
on its plan to convert all of its bottles to recy-
cled content. Last year, it began transitioning
its juices and smoothie bottles to 100 percent
post-consumer recycled content.
True, some of these efforts may seem under-
whelming, given the 300 million or so tons of
trash that comprise the municipal solid waste
stream in the U.S. each year. But each must
break through barriers to succeed, not the least
of which is the lack of an infrastructure to recy-
cle many types of packaging and product waste.
In truth, many of these efforts aren’t really
closed-loop. They involve increasing recycled
content in products or “upcycling” waste into
new products or packaging. Such cycles are
nite — perhaps amounting to just one addi-
tional use for a given item — and eventually, most
will end up in landlls. That they get a second life
is laudable — though it only delays the inevitable.
Starbucks has
put plenty of
time and effort
into promoting
recycling of its
cups, but only a
small fraction of
the four billion
cups it produces
a year are kept
out of landlls.

8/6/2019 State Green Business Report 2011
http://slidepdf.com/reader/full/state-green-business-report-2011 21/66
stat f g bsss
2011
21
10. bplastCs bC atal
For years, the search for alternatives to petro-
leum-based plastics has led researchers downa variety of paths, many of which turned out to
be dead ends. Henry Ford, the automaker and
showman, produced a prototype plastic car
made from soybeans in 1941, but plastic from
plants wilted as plastic from oil gained favor as
a substitute for scarce steel during World War II.
Since the 1970s, as concern over plastic’s envi-
ronmental impacts grew in lockstep with the
growth of plastic itself, a steady parade of inno-
vators in both large and small companies have
tried to create more environmentally benign
alternatives. Few succeeded, failing to meet the
demanding price and performance specica-
tions of today’s manufacturers. Now suddenly,
bioplastics made from plants and agricultural
materials are sprouting like — well, weeds.
Introductions of bioplastic materials and prod-
ucts reached a crescendo during 2010, as more
mainstream companies introduced bioplastics
from a dizzying array of commodities. Beverage
maker Odwalla, a Coca-Cola subsidiary, saidit was switching all of its single-serve drinks to
bottles made almost entirely of plastic derived
from molasses and sugarcane juice. (In 2009,
Coke announced it would begin phasing in a
similar bioplastic bottle for its agship cola.)
Procter & Gamble is bringing sugarcane to
shampoo and makeup with new packaging that
will be on shelves next year. The company will
start using sugarcane-based plastic packag-
ing for certain products from its Pantene Pro-
V, Covergirl, and Max Factor brands, made with
ethanol derived from Brazilian sugarcane.
Sugarcane is just the start. Electronics com-
pany NEC said it developed a bioplastic made
with an extract from non-edible cashew nut
shells and plant cellulose that is twice as strong
as another bioplastic typically made from corn
starch. The company says its material is not
just doubly strong, but also more than twice as
heat-resistant and molds in half the time as bio-
plastic made from polylactic acid resin, which istypically derived from corn starch or sugarcane.
Organic yogurt maker Stonyeld Farm began
switching its multi-packs to corn-based bio-
plastic and will fund the planting of enough
non-genetically modied corn crops to equal
the amount of corn used in the new packaging.
(About 85 percent of U.S.-grown corn is geneti-
cally modied.) The company was able to off -
set the extra costs of the bioplastic packaging
because it is stronger than the oil-based plastic
it replaces, and offers some other performance
characteristics. For example, it reduces break-
age during shipping and forms a tighter seal
with the lid. The plastic is stronger than polysty-
rene, so less is needed, making packages lighter.
Because of PLA’s higher efciencies and lower
losses, the shift to plant-based plastics was
done at no net cost increase to Stonyeld.
Ford said it was using foam derived from soy
instead of petroleum and would expand the
use of bio-based foams through nearly all of itsvehicle lineup with an eye toward one day using
compostable plastics. British snack company
Walkers said it was looking into transforming
potato peelings into crisp (chip) packets.
Two Texas companies teamed up to turn some
of the 50 million coconuts that fall from trees
each year into reusable packaging. Whole Tree
has been researching uses for coconut husks
for about two years, partnering with packaging
rm Compadre to design and test different uses
for coconut-based materials.
And then there’s the packaging material made of
mushroom roots and agricultural waste from a
startup called Ecovative Design. It makes pack-
aging by growing mushroom bers on wastes like
cottonseed, wood ber, and buckwheat hulls. Its
EcoCradle technology already consumes one-
tenth the energy used to manufacture foam
packaging, but a new version, made with a blend
Suddenly,
bioplastics
made from
plants and
agricultural
materials are
sprouting like —
well, weeds.

8/6/2019 State Green Business Report 2011
http://slidepdf.com/reader/full/state-green-business-report-2011 22/66
stat f g bsss
2011
22
of cinnamon bark oil, thyme oil, oregano oil, and
lemongrass oil, lowers its energy needs to just
1/40th of foam’s. The company’s packaging is
being used by some big companies, including
ofce furniture maker Steelcase, which last year
began shipping products packed in EcoCradle.
Bringing bioplastics to scale in the marketplace
will take more than innovators playing with
coconuts and mushrooms. It will also require
thinking through the “end of life” scenarios so
that bioplastics can either be integrated into
existing plastics recycling or sent to municipal
composting facilities.At present, bioplastics
can contaminate conventional plastics sent to
recycling, and the low volume of bioplastics inuse does not give recyclers much incentive to
invest in new technologies for identifying and
separating bioplastics. Meanwhile, the com-
posting infrastructure is nascent in the U.S.
overall, though one study found that most facili-
ties accept compostable packaging.
Those problems aside, innovative packaging
of any kind can occasionally have downsides,and that’s equally true of bioplastic packaging.
Consider the fate of SunChips, the snack food
made by Pepsico subsidiary Frito-Lay. In 2010,
it introduced a long-anticipated package made
from a corn-based polymer.
So far, so good. But the bag turned out to be noisy
— so noisy, in fact, that it engendered consumer
complaints. (It also became a social media phe-
nomenon, with a Facebook group called SORRY
BUT I CAN’T HEAR YOU OVER THIS SUN CHIPS
BAG garnering more than 50,000 fans.) Frito-
Lay ended up sacking the clamorous chip bag.
Consumers, it seems, want their packaging
green — soft green.
Bringing
bioplastics to
scale in the
marketplace
will take more
than innovators
playing with
coconuts and
mushrooms.

8/6/2019 State Green Business Report 2011
http://slidepdf.com/reader/full/state-green-business-report-2011 23/66
stat f g bsss
2011
23
© 2011 GreenBiz Group Inc. (www.greenbiz.com). May be reproduced for non-commercial purposes only, provided credit is given to GreenBiz Group Inc. and includes this notice.
As always, we had some indicators shift this year — some
fell off and new ones were added. This year we changedour Carbon Intensity metric to measure the greenhouse
gas emissions caused specically by energy use; added
a new metric on the growth of organic agriculture in the
U.S.; and another new metric looking at corporate trans-
parency, developed by Trucost, the research rm that
helped us develop our Environmental Financial Impacts
indicator. Those new data sets replace Greenhouse Gas
Commitments, which was folded into Carbon Intensity,
and Water Intensity, which continues to be a challenge,
with industry-specic, consistently compiled, year-
over-year data as elusive as a desert mirage.
This continuous evolution illustrates the challenges any
researcher faces when trying to gather reliable and com-
parable data on corporate sustainability. Data gathering
and reporting by government comes and goes, due to
funding, shifting politics, organizational shufes, and
other reasons. (At least one of the key data sets we’ve
relied upon in past years was delayed by several months,
well past our publication date, requiring us to scramble
to nd other sources.) Similarly, research rms, nonprof -
its, and trade associations that collected information a
certain way for years may stop doing so or may change
their methodologies or frequency of publication, lead-
ing us to search for reliable, alternative data sources.
In a few cases, indicators are measured differently this
year than last, though the change is consistent — that is,we’ve “backcast” the methodology to ensure we com-
pared data the same way from one year to the next.
For each of the 20 indicators, we’ve attempted to go
beyond the numbers to provide context, explaining why
the numbers did what they did, their historical underpin-
nings, and their likely short-term forecast. That context
is particularly important in the current economy, where
the recession and the stimulus have roiled some of the
indicators, in both positive and negative ways.
In aggregate, the GreenBiz Index paints a portrait of a green economy — or at least a greener one — that
is emerging, ever so slowly. The story it tells is one of
incremental change — too incremental, in many cases,
to result in meaningful progress in reducing the envi-
ronmental impacts of business at the scale and speed
needed to address some of the more serious problems.
We’ve summarized each data set via one of three icons,
stating whether we are making progress (“swimming”),
standing still (“treading”), or falling behind (“sinking”).
th gbZ dx
This fourth annual edition of the GreenBiz Index continues our quest to
measure and assess a representative basket of indicators that tell us,
in aggregate, the progress U.S. companies are (or aren’t) making in 20
aspects of environmental performance — from operational efciency to
employee commuting to investments in clean technologies.
s tad sk

8/6/2019 State Green Business Report 2011
http://slidepdf.com/reader/full/state-green-business-report-2011 24/66
stat f g bsss
2011
24
Indicator
What We Measured
What We Found
Swim
Tread
Sink
Carbon Intensity Emissions of energy-related
carbon dioxide per unit of
GDP
Emissions rise slightly
after years of decline
Carbon Transparency S&P 500 companies
responding to Carbon
Disclosure Project
U.S. response rates rise,
but lag global peers
Cleantech
Investments
Venture capital investments
in clean technology
Opportunities in
solar, EVs help charge
investor interest
Clean-Energy Patents Patents issued by U.S. Patent
Ofce
A surge of innovations
Corporate Reporting Number of reports from S&P
500 companies
Up slightly, but most
companies still avoiding
disclosure
Employee Commuting Number of workers driving
solo, carpooling or using
mass transit
Even in tough times,
commuters are stuck
behind the wheel
Employee
Telecommuting
Number of U.S.
telecommuter households
Slightly more
employees staying
home and logging in
Energy Efciency Energy use per unit of GDP Both buildings and
people get smarter
about energy use
Environmental
Financial Impacts
Environmental damage costs
as a percentage of economic
output
Costs of company
environmental damage
increase slightly
E-Waste Percentage of recovered
equipment
Mountains of waste
growing faster than
recyclers can handle
SWIM TREAD SINK
tHE gREEnBiZ indEx: sUmmARY

8/6/2019 State Green Business Report 2011
http://slidepdf.com/reader/full/state-green-business-report-2011 25/66
stat f g bsss
2011
25
SWIM TREAD SINK
Indicator
What We Measured
What We Found
Swim
Tread Sink
Fleet Impacts Estimated annual
greenhouse gas emissions
per vehicle
Changes in eet
management just getting
into gear
Green IT Products certied under
Energy Star and EPEAT
Micro electronics make
macro improvement
Green Ofce Space LEED-certied commercial
building space
Remains bright light in
construction world even
during recession
Green Power Use Renewable energy as a
percentage of all electricity
generation
Generation up, but lack
of policy puts damper on
growth
Organic Agriculture Acreage of U.S. agriculture
certied organic
Organics take root, but
still are a small bite of the
pie
Packaging
Intensity
Materials used per unit of
GDP
Manufacturers take
the wraps off green
innovations
Paper Use and
Recycling
Paper use and recycling per
unit of GDP
Paper use continues to
drop while recycling rises
Toxic Emissions Toxic releases per unit of
GDP
Emissions still falling, but
not enough to make a
dent
Toxics in
Manufacturing
Emissions per year of 27
bioaccumulative and toxic
chemicals
Piecemeal gains as green
chemists seek the right
formula
Transparency How much data companies
disclose on environmental
impacts
Incremental growth,
but far from radical
transparency

8/6/2019 State Green Business Report 2011
http://slidepdf.com/reader/full/state-green-business-report-2011 26/66
stat f g bsss
2011
26
CARBon intEnsitYpgss s gg th g dCt
Last year began and ended without compre-
hensive climate change legislation passing theSenate, and with the shift in political winds fol-
lowing the midterm elections, there’s a high like-
lihood 2011 will end without a climate law, too.
In spite of the uncertain policy environment,
carbon dioxide (CO2) emissions have declined in
recent years, largely due to the economic reces-
sion. Even with the economy on the upswing, the
U.S. Energy Information Administration doesn’t
believe CO2
from energy — which accounts
for more than 80 percent of all greenhouse
gas emissions — will return to 2005 levels until
around 2027.
We are turning our attention this year to energy-
related CO2, rather than total U.S. greenhouse
gas emissions, because of a lag in the release of
EIA data. The agency predicts energy-CO2
rose
3.8 percent in 2010 and blames it on a warm
summer in the Rocky Mountains and unusually
cold weather in the Southeast. When normal-
ized to gross national product, energy-CO2 intensity inched up in 2010, following years of
decline since at least 2003.
Companies from industries across the spec-
trum aren’t waiting for congressional action to
set goals for reducing emissions. The bottom-
line benets to carbon reduction are increas-
ingly hard to ignore, making carbon a remarkably
accurate proxy for efciency and a powerful
lens through which companies can uncover sav-
ings and improvements.
Toward that end, a growing number of com-
panies are setting greenhouse gas emissions
reduction targets. When we examined compa-
nies on Standard & Poor’s 500 Index, we found
that 54 percent responding to the Carbon
Disclosure Project reported emissions reduc-
tion targets, a slight uptick from 2009. Moreover,
our own informal survey of the nation’s 20
Source: U.S. Energy Information Administration
iion on o enery-ree C2
er miion or o gdp*
U.S. companies have
a long way to go in
setting meaningful
targets that will help
move the country
closer to President
Obama’s goal of reducing emissions 17
percent below 2005
levels by 2020.
*All GDP data in this report are from the U.S. Department of Commerce’s Bureau of Economic Analysis and
are stated in 2005 chained dollars.
2004 2005 2006 2007 2008 2009
487.2
474.5
456.1455.2
441.1
421.4
424.5
500
475
450
425
400
3752010

8/6/2019 State Green Business Report 2011
http://slidepdf.com/reader/full/state-green-business-report-2011 27/66
stat f g bsss
2011
27
largest companies by revenue revealed that at
least 15 had greenhouse gas emissions reduc-
tion targets in place or under development.
These targets varied widely but some common
traits emerged. The year 2012 was the most fre-
quently used target for commitments, while the
type of targets typically fell into two categories:
absolute or efciency/intensity based. (The for-
mer committed to a specic reduction in emis-
sions, while the latter pegged reduction levels
to revenue.) Most involved a reduction target
range of at least 10 percent, though some were
as high as 50 percent for longer-term goals.
But with such variation in the type of goals being
pursued, it can be difcult to assess whetherthese commitments are truly moving the nee-
dle, and by how much.
Research from the Carbon Disclosure Project
suggests U.S. companies have a long way to go
in setting meaningful targets that will help move
the country closer to President Obama’s stated
goal of reducing emissions 17 percent below
2005 levels by 2020. This would require a 1.05
percent average annual absolute reduction
rate; instead, emissions of S&P 100 companies
are growing at a rate of 0.36 percent a year, “cre-
ating a Carbon Chasm between current emis-
sions trends and required cuts,” says CDP.
The EIA believes 2011 should return to normal
temperatures, requiring less electricity and
lower coal consumption. With generation from
hydropower and other renewables expected
to swell in 2011, the agency forecasts energy-
related CO2
to fall 0.6 percent this year, despite
increases in petroleum consumption in the
transportation sector.
That’s progress, but not enough. Scientists have
been telling us for years that emissions need
to fall at least 25 percent below 1990 levels by
2020 and to 80 percent by 2050 in order to
stem the worst impacts from climate change.
Based on the incremental improvements we’ve
seen over the past few years, we’re simply not
going to get there.
10
20
30
40
50
60
Percentage of all S&P 500 rms with reported reduction targets
Percentage of CDP respondents with reported reduction targets
2007 2008 2009 2010
s&p 500 gREEnHoUsE gAs REdUCtion CommitmEnts

8/6/2019 State Green Business Report 2011
http://slidepdf.com/reader/full/state-green-business-report-2011 28/66
stat f g bsss
2011
28
CARBon tRAnspAREnCYptg ss QattY, bt t QaltY
The number of the U.S. companies commit-
ting to climate change disclosure continued
its steady climb in 2010, despite a struggling
economy and legislative gridlock that stymied
all efforts for a comprehensive energy bill.
Since its launch 10 years ago, the nonprot
Carbon Disclosure Project has kept tabs on how
the world’s largest companies are taking action
to address climate change through its annual
survey. The questionnaire, which has evolved to
include more pointed and probing questions, is
sent on behalf of institutional investors wanting
to know about the climate risks and opportuni-
ties lurking in their portfolios. The CDP rates the
quality of respondents’ disclosures, assigning
a score that is now available alongside compa-
nies’ traditional nancial statistics through such
outlets as Bloomberg and Google Finance.
For the rst time this year, we’re using data from
the S&P 500 for the Carbon Transparency indi-
cator — rather than global indices used previ-
ously, such as the Global 500 and FT500 — to
evaluate the speed with which U.S. companies
are disclosing their greenhouse gas emissions
and the risks they face from climate change. We
found that 70 percent of S&P 500 companies
responded to the CDP’s annual questionnaire in
2010, up from 66 percent the year before, con-tinuing an upward trend that has played out for
at least the past ve years.
U.S. rms share several traits compared to their
global peers, according to CDP: A smaller per-
centage have board-level oversight of climate
issues, fewer offer management incentives to
reduce carbon emissions, and they are less
likely to view climate change as a regulatory risk.
Source: Carbon Disclosure Project
umer o s&p 500 comnie reonin o Cron dicoure projec
A smaller percentage
of U.S. rms
have board-level
oversight of climate
issues, fewer offer
management
incentives to reducecarbon emissions, and
they are less likely to
view climate change
as a regulatory risk.
235
282
321332
350
2006 2007 2008 2009 2010

8/6/2019 State Green Business Report 2011
http://slidepdf.com/reader/full/state-green-business-report-2011 29/66
stat f g bsss
2011
29
80
85
90
85
90
Europe 300
Global 500
S&P 500
2008 2009 2010
* Europe 300 data n/a prior to 2009
*
Still, a number of factors are driving the upward
trend, including a growing awareness of climate
change, stakeholder pressure, and potential
business opportunities. Although Congress
failed to pass comprehensive climate legisla-
tion, another driver — regulatory activity — does
continue in some form, such as greenhouse gas
regulations under the EPA, the U.S. Securities
and Exchange Commission’s guidance on cli-
mate disclosure for public companies, and the
Obama Administration’s mandate for all federal
agencies to measure and report their emissions.
There is, however, a gap in response rates
between the companies in the S&P 500 and
those in other regions, although it appearsthe gap is closing. For example, the Europe
300 index boasted an 84 percent response
rate, while the Global 500 had an 82 percent
response rate, a sign that disclosure is more
mature in other regions.
As for why companies choose not to respond
to the CDP questionnaire, perhaps some don’t
see climate regulation as having a direct impact
on their operations, don’t view climate change
as a material risk, or don’t want to deal with the
hassle or expense.
Interestingly, there are a handful of S&P 500
companies that responded to the CDP or sup-plied information in 2009, but chose not to in
2010. The pressures to disclose how they’re
addressing climate change and its potential
business implications, however, will likely out-
weigh the reasons for staying on the sidelines in
future years, as more companies lean on suppli-
ers to increase transparency, and regulation at
various levels ramps up.
As mentioned, maturity in the process will play
a key role, not just in the number of companies
responding to the CDP, but in their level of dis-
closure. Although U.S. response rates are edging
higher, the quality of the responses lags global
peers. The average disclosure score for S&P
500 companies was 58 in 2010, compared to 65
for the Global 500 and 69 for the Europe 300.
U.S. Carbon Disclosure Leadership Index com-
panies, comprised of the highest-scoring rms
in each index, also trailed in 2010 (see graph),
after being on the verge of parity the year before.
AvERAgE CARBon disClosURE lEAdERsHip indEx sCoREs, BY REgion
Source: Carbon Disclosure Project
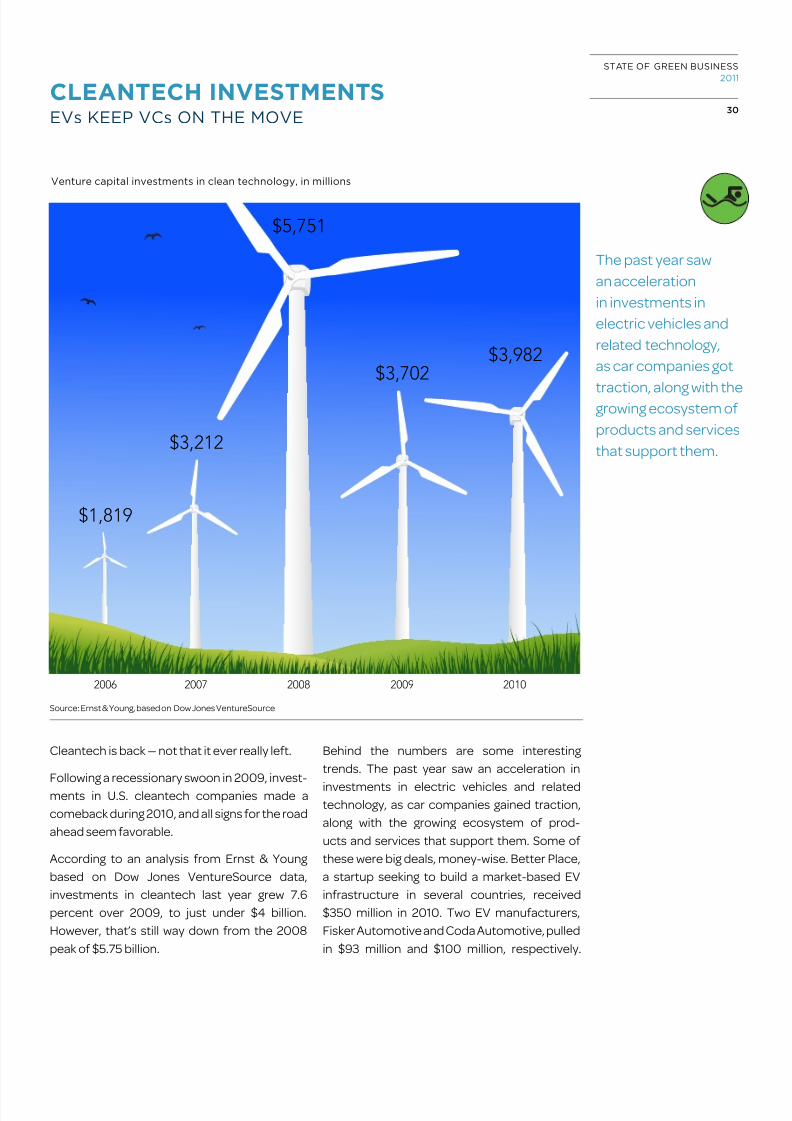
8/6/2019 State Green Business Report 2011
http://slidepdf.com/reader/full/state-green-business-report-2011 30/66
stat f g bsss
2011
30
ClEAntECH invEstmEntsv kp vC th v
Cleantech is back — not that it ever really left.
Following a recessionary swoon in 2009, invest-
ments in U.S. cleantech companies made a
comeback during 2010, and all signs for the road
ahead seem favorable.
According to an analysis from Ernst & Young
based on Dow Jones VentureSource data,
investments in cleantech last year grew 7.6
percent over 2009, to just under $4 billion.
However, that’s still way down from the 2008
peak of $5.75 billion.
Behind the numbers are some interesting
trends. The past year saw an acceleration in
investments in electric vehicles and relatedtechnology, as car companies gained traction,
along with the growing ecosystem of prod-
ucts and services that support them. Some of
these were big deals, money-wise. Better Place,
a startup seeking to build a market-based EV
infrastructure in several countries, received
$350 million in 2010. Two EV manufacturers,
Fisker Automotive and Coda Automotive, pulled
in $93 million and $100 million, respectively.
Source: Ernst & Young, based on Dow Jones VentureSource
venure ci inemen in cen ecnooy, in miion
The past year saw
an acceleration
in investments in
electric vehicles and
related technology,
as car companies got
traction, along with thegrowing ecosystem of
products and services
that support them.
2006 2007 2008 2010
$1,819
$3,212
$5,751
$3,702
2009
$3,982

8/6/2019 State Green Business Report 2011
http://slidepdf.com/reader/full/state-green-business-report-2011 31/66
stat f g bsss
2011
31
Investors shined brightly on solar companies,
too — 2010 investments were up 76 percent
over 2009.
Investments are also shifting toward later-stagedeals — that is, companies’ third, fourth, fth, or
later rounds of nancing, which tend to be big-
ger amounts of money aimed at taking a proven
concept to scale in the marketplace. That would
be appropriate for a maturing sector like clean-
tech, where we’ve seen a wave of funded start-
ups over the past several years. In 2010, 33 per-
cent of deals were rst round, compared to 36
percent in 2009 and 50 percent in 2008. “On
a proportional basis, it’s natural to see a shift in
later-stage nancing as these companies getfurther along the maturity scale,” says John
De Yonge, research director, Global Cleantech
Center, Ernst & Young LLP.
Another area of signicant investment is con-
struction — which may seem curious, given the
unsteady state of the building market, but likely
reects the growing interest in “smart” building
products and services that optimize resources
and improve occupant comfort and security.
Construction-related investments grew 75.5
percent in 2010 over the previous year. Similarly,
conservation and monitoring technologies grew
a whopping 347 percent year over year — again,
related to the growing interest in technologies
that can monitor nearly anything in any environ-
ment, indoors and out.
Still another growing sector is in energy-ef-
ciency technologies, a shift from conventional
thinking by venture capitalists that efciency —
principally service-based businesses — doesn’t
scale the way VCs like. “One segment that
popped was energy management and efciency
services,” notes De Yonge. “It’s not so much the
hardware but what can you do with the informa-
tion that’s being generated by the hardware.”
One other notable trend in cleantech investing
is the growing importance of corporate inves-
tors — large companies that place sizeable
nancial bets on emerging companies and tech-
nologies. Seventeen percent of all cleantech
investments included a corporate investor lastyear, compared to 12 percent of venture invest-
ments overall. “We’re seeing a lot of corpora-
tions interested in guring out how to play in the
space created by the advent of electric vehicles,
in terms of the infrastructure needs and new
kinds of relationships with customers,” says De
Yonge. These statistics understate the magni-
tude of corporate investments in cleantech.
They reect only deals in which a company par-
ticipated in a venture round of nancing. Other
deals are done privately, outside the VC arena.
Those trends — growing investments by big
companies and continued interest in the EV
ecosystem — will continue to dominate in 2011,
as the evolving world of transportation cata-
lyzes a new round of innovation and investment.
Solar $1,158.89 Fuel Cells $34.33
Power and Efficiency Management $365.28 Recycling $32.25
Biofuels $305.10 Wind $32.25
Energy Efficiency Products $249.73 Hydrogen Electricity $26.16
Batteries $136.94 Water Conservation & Monitoring $10.24
Solar Energy $107.90 Gasification $8.07
Water Treatment Processes $97.55 Waste Management $4.80
Industrial Products $73.98 Air Monitoring $3.07
Natural Gas $38.63 Hydropower $0.95
Source: Ernst & Young, based on Dow Jones VentureSource
ClEAntECH invEstmEnts 2010, BY sElECt CAtEgoRY(millions)

8/6/2019 State Green Business Report 2011
http://slidepdf.com/reader/full/state-green-business-report-2011 32/66
stat f g bsss
2011
32
ClEAn-EnERgY pAtEntsa battY f hgh-pd vat
Patents led for clean-energy technologies
provide a window into two aspects of the clean
economy. They are at once a lagging indicator
(of innovations in energy and energy-related
products and services) and a leading indicator(of potential forthcoming products and ser-
vices). As such, we include them here as another
key measure of business activity in the greening
of the economy.
In 2010, they told a compelling story: Clean-
energy patents seemed — well, electried.
Clean-energy patents reached an all-time high
in 2010, up almost 170 percent (757 patents)
over 2009. “This is the largest year-to-year jump
since we began tracking clean-energy patents,
by more than three times the previous year-to-
year difference,” says Victor A. Cardona, intellec-
tual property law attorney at Heslin RothenbergFarley Mesiti in Albany, N.Y., which compiles the
data. “This compares to a 31 percent increase
generally for all patents from 2009 to 2010 —
which was the best showing ever for patents
generally. Clean-energy innovation is clearly far
outpacing technology in general.”
Why is this? Part of it reects the overall growth
of clean technologies, and energy technologies
Source: Heslin Rothenberg Farley Mesiti P.C.
umer o en e wi e .s. pen n tremr ce
Clean-energy patents
reached an all-time
high in 2010, up almost
170 percent over
2009, far outpacing
technology in general.
1,882
884827
917 894928
1,125
2004 2005 2006 2007 2008 2009 2010

8/6/2019 State Green Business Report 2011
http://slidepdf.com/reader/full/state-green-business-report-2011 33/66
stat f g bsss
2011
33
Wind Solar
Hybrid or
Electric
Vehicle
Fuel
Cell
Hydro-
electric
Tide or
Wave
Geo-
thermal
Biomass/
Biofuels Other Total*
2002 42 162 144 349 6 9 2 12 9 723
2003 49 156 122 464 5 11 5 24 3 824
2004 72 124 98 551 8 18 8 16 4 885
2005 92 104 101 501 7 11 6 14 3 827
2006 109 95 105 572 8 18 5 13 5 917
2007 133 100 105 517 4 15 4 28 2 894
2008 155 95 86 530 10 34 9 19 9 928
2009 156 155 105 634 3 26 10 49 2 1,125
2010 245 363 168 996 19 40 6 63 17 1,882
* Row totals may be less than the sum of the row because a small number of patents fall into morethan one category
Source: Heslin Rothenberg Farley Mesiti P.C.
ClEAn EnERgY pAtEnts, BY tYpE
in particular. But that’s just the beginning of the
story. Increasingly, clean-energy technologies
are moving beyond venture-backed start-up
companies to the R&D labs of major companies.
And not just traditional energy companies. An
ever-increasing number of companies are nd-
ing their way into the energy business: chemical
companies (which make materials that wind up
in solar panels, fuel cells, and the like), auto-
motive companies (which are rapidly moving
to electric vehicle technologies, which involve
both energy production and storage), agri-
cultural companies (which make fuels from a
growing array of crops), information technology
companies (since today’s energy grid is getting“smarter” thanks to chips, switches, routers,
and software), and many others. Each of these
brings a wealth of research as well as a sizeable
appetite for innovations.
According to Heslin Rothernberg’s data, there
were more patents led in all but one category
of energy technology. Fuel cells continue to lead
the other clean energy sectors, almost tripling
the nearest competitor, up almost 160 percent
(362 patents) relative to 2009. Solar patents
followed fuel cells, outshining last year’s second
place winner, wind energy, and ending wind’s
four-year run in second place. Solar was up more
than 230 percent (208 patents) relative to the
year before. Wind patents were up 89 patents,
almost 160 percent over 2009. Hybrid and elec-
tric vehicles similarly went into high gear, grow-
ing 160 percent (63 patents) relative to 2009.
Tidal patents almost doubled (26 to 40) and
biomass/biofuel patents were up 14 patents.
Hydroelectric patents were up 630 percent, by
16 patents. Geothermal was the only technol-
ogy that cooled, decreasing activity from 2009
— but only by four patents.
All of this bodes well for the cleantech sector, as
it moves past adolescence into maturity. And it
bodes well for large corporations across a range
of sectors, which will be both the customers of
clean-energy innovations as well as the path-
ways for commercialization, as clean energy
moves out of the lab, and out of small-scale
pilots, and into the mainstream.

8/6/2019 State Green Business Report 2011
http://slidepdf.com/reader/full/state-green-business-report-2011 34/66
stat f g bsss
2011
34
CoRpoRAtE REpoRtingbYd CplaC, a aagt tl
If sustainability is a journey, as many like to say,the non-nancial corporate report is the vehicle
increasingly used by companies to document
the trip.
A slew of drivers are fueling the rise, such as
growing stakeholder and investor pressure,
interest from rating agencies, regulatory activity,
and the desire to protect brand and reputations.
The Great Recession may have put the squeeze
on bottom lines of companies across the board
these past few years, but the number of rmsreporting on their social and environmental per-
formance continued to grow in 2010. Forty-six
percent of companies on the Standard & Poor’s
500 index published a non-nancial report last
year, a near 17 percent increase over 2009.
This mirrors global trends, with the number of
rst-time reporters on the rise, according to
CorporateRegister.com, a London-based rm
that maintains a massive database of corporateresponsibility and sustainability reports dat-
ing back more than 20 years. Since 2008, it has
analyzed the S&P 500 to help us measure the
performance of the largest U.S. companies in
the realm of non-nancial reporting.
Beyond the S&P 500, U.S. rms are beginning
to catch up in terms of the sheer number of
reports, CorporateRegister.com’s Paul Scott
notes, though it is still fewer reports than are
produced by companies in the U.K., which has
a much smaller corporate base. U.S. companies
have historically lagged behind their European
peers, where non-nancial reporting has been
adopted more quickly, in part due to culture and
regulatory developments. Sweden, Norway, and
Denmark, for example, all have introduced man-
datory reporting for various types of companies,
from those that are state-owned (Norway) to
large and listed (Sweden, Denmark).
Source: CorporateRegister.com
umer o reor e y s&p 500 comnie
163
Overall, U.S. rms are
beginning to hold their
own in terms of the
number of reports
being produced.
37
108107
45
148
68
197
81
230
97131
55
2005 2006 2007 2008 2009 2010
All Reports
GRI-Compliant

8/6/2019 State Green Business Report 2011
http://slidepdf.com/reader/full/state-green-business-report-2011 35/66
stat f g bsss
2011
35
Roughly 42 percent of non-nancial reports pro-
duced by S&P 500 companies were compliant
with the Global Reporting Initiative, the world’s
most widely used reporting framework. This
percentage, which outpaces the global average,
will likely grow as GRI works to meet its 2015 goal
for all large and medium-sized companies to
disclose on environmental and social matters.
Companies also appear poised to begin accel-
erating the trend, such as Puma, which is training
its key suppliers to use the GRI to produce sus-
tainability reports.
S&P 500 companies lag in third-party veri-
cation, one of CorporateRegister.com’s key
barometers for report quality. Just 9.6 percentof non-nancial reports were veried for accu-
racy, a percentage that hasn’t reached more
than 14 percent in the last seven years. In com-
parison, verication rates in Europe run in the
low to mid-20 percent range.
It is hard to say whether verication will ever
catch on in the U.S., where companies are risk-
averse and generally hesitant to release anything
into the public domain that isn’t already there.
Verication offers many benets, from uncov-
ering errors and mitigating against reputational
risk, but it is an added cost for what may already
be an expensive process. Pulling together all the
information for a corporate report and produc-
ing it can cost up to several hundred thousand
dollars, one of many challenges facing compa-
nies in this type of endeavor.
But once they put in the necessary processes
needed to capture consistent data, companies
are nding that they can use the report as amanagement tool to make better business deci-
sions and improve performance. Ultimately, this
will help companies boost their bottom lines — a
critical milestone in any company’s sustainabil-
ity journey.
Source: CorporateRegister.com
CorporateRegister.com is the global corporate responsibility (CR) resources website. It hosts the world’s most comprehensivedirectory o CR and sustainability reports, profling over 30,000 reports worldwide rom almost 7,500 companies. With an archivestretching back to 1990, it is indispensable or anyone working in the feld o CR and sustainability reporting.
Working with some o the leading organizations in corporate responsibility, CorporateRegister.com hosts several ofcial reportingregisters. Further site eatures include a ully searchable directory o over 6,000 organisations (‘reporting partners’) actively involvedin CR reporting. CorporateRegister.com developed the world’s frst annual global online CR reporting awards, the CRRA – see www.reporting-awards.com
www.corporateregister.com • [email protected] • +44 20 7014 3366
Integrated
Social/Community
Sustainability
EnvironmentHealth & Safety& Community
EnvironmentHealth & Safety
Environment & SocialEnvironment
Corporate Responsibility
0.9%
6.1%3.9%
4.3% 0.9%
50.9%
27.8%
5.2%
s&p 500 REpoRt, BY tYpE

8/6/2019 State Green Business Report 2011
http://slidepdf.com/reader/full/state-green-business-report-2011 36/66
stat f g bsss
2011
36
EmploYEE CommUtinghat ll t tak t spaat Cts ad Cas?
Working Americans are stuck in trafc. Record
high gas prices in 2008 changed commuting pat-
terns a bit, but for the most part, we were back
behind the wheel in 2009, the most recent data
available, with 76.1 percent of Americans driving
solo to work. Only 10 percent carpooled in 2009,
down slightly from the year before and by about
half since the carpool heydey of the early 1980s,
driven by cheap gas, more affordable car owner-
ship, and longer commuting distances.
And while the American Public Transportation
Association gures that riding the bus or train
saved each commuter roughly $9,660 in 2010
(on average, depending on gas and parking
prices), only 7 million Americans commute by
public transit, compared to the 105 million who
drive alone to work. Transit ridership was down
slightly in the third quarter of 2010 compared to
the same time in 2009, which APTA attributes
to high unemployment as well as fare increases
Source: U.S. Census Bureau and American Community Survey
oe o commuin, y ercene
Only 7 million
Americans commute
by public transit,
compared to the
105 million who drive
alone to work.
64.4
73.2
75.776.1
1980 1990 2000 2009
19.713.4
12.210.0
6.4 5.3 4.7 5.0
Public Transportation Carpool Drive Alone

8/6/2019 State Green Business Report 2011
http://slidepdf.com/reader/full/state-green-business-report-2011 37/66
stat f g bsss
2011
37
that many transit agencies have been forced
to levy to make up for losses in revenue. If the
decline is, indeed, due to job losses, transit use
may increase as the economy recovers — espe-
cially if, in concert with a healthier economy, gas
prices rise.
Congress passed a one-year extension of the
commuter tax benet, which allows employ-
ers to provide a tax-free stipend of up to $230 a
month to cover commuting by mass transit. And
2008’s Bike Commuter Act allows employers to
offer workers a tax-exempt fringe benet of $20
a month for purchasing, maintaining, or storing a
bicycle as the primary ride to work.
But if you’re hoping for other policy changes to
give a lift to greener ways of getting to work, don’t
hold your breath, says commuting expert Alan
Pisarsky. Congress has been delaying spending
on transit systems, and the likelihood that the
new Congress will pass such legislation is slim,
partly because of political gridlock but mostly
because there’s simply no money to spend.
Pisarsky worries that when employment levels
rise, this lack of funding will leave transit systems
in poor shape to handle the growing demand.
That means it’s employers who hold the keys to
green commuting. A number of companies —facing everything from a lack of parking space
to corporate sustainability goals — are start-
ing to use car-sharing, either as a replacement
for maintaining eets of company cars or as a
lower-impact — and, often, less costly — alter-
native to paying mileage costs for employees to
use their own vehicle for company business.
Corporate car-sharing schemes are often tied
to vanpooling services or are part of alternative
commuting programs, and are designed to give
employees extra incentives to leave their own
cars at home. At Google’s Mountain View, Calif.,
campus, for example, employees who commit
to taking mass transit or getting to the ofce by
means other than driving are granted access to
a eet of hybrid or other low-emissions vehicles
from Enterprise’s WeCar program. This way,
they have wheels when they need to attend an
offsite meeting or run a personal errand.
City MonthlySavings AnnualSavings
1 New York $1,180 $14,159
2 Boston $1,083 $12,993
3 San Francisco $1,061 $12,738
4 Chicago $972 $11,660
5 Seattle $952 $11,427
6 Philadelphia $942 $11,305
7 Honolulu $922 $11,063
8 Los Angeles $866 $10,395
9 Minneapolis $848 $10,180
10 San Diego $839 $10,074
11 Portland $827 $9,926
12 Denver $821 $9,854
13 Baltimore $810 $9,726
14 Washington, DC $809 $9,709
15 Cleveland $805 $9,663
Source: American Public Transportation Association, Jan. 2011 gures
tiCkEt to RidEAmount Commuters Save on Mass Transit, Compared to Driving and Parking Costs

8/6/2019 State Green Business Report 2011
http://slidepdf.com/reader/full/state-green-business-report-2011 38/66

8/6/2019 State Green Business Report 2011
http://slidepdf.com/reader/full/state-green-business-report-2011 39/66
stat f g bsss
2011
39
Poughkeepsie
Fort Collins
Bremerton
Colorado Springs
Denver
St. Cloud
Bellingham
Santa Rosa
San Diego
RaleighSan Luis Obispo
Columbia
Chico
Pensacola
Boulder
5% or more telecommuting 4% telecommuting 3% telecommuting
employers’ facilities costs and often work longer
hours than the ofce-bound. Telecommuting
can dissuade some workers from looking for
a new job, too, reducing turnover. Combined,
these factors can save $10,000 a year per half-
time telecommuting employee, says TRN.
That doesn’t take into consideration emer-
gencies. For four days in the winter of 2010, a
blizzard (a.k.a. “Snowmageddon”) paralyzed
Washington, D.C., costing the feds $71 million a
day in lost productivity, according to the Ofce
of Personnel Management. Luckily, 30 percent
of federal workers could log into work remotely.
That helped win support for the Telework
Enhancement Act of 2010, signed into law in
December, which establishes a consistent tele-
working policy and structure across all govern-
ment agencies and provides training to telecom-
muters (or teleworkers, as they are referred to in
the Act) and their managers. It also requires that
teleworkers and non-teleworkers be treated
equally when it comes to promotions and work
requirements. And it requires that OPM collect
data on teleworking. If this leads to more quan-
titative proof of productivity gains among tele-
commuters, it could lead to greater employer
support of telecommuting.
Many large rms have embraced telework in
recent years — especially those, such as Cisco,
that make tools for virtual meetings and online
collaboration. But not all telecommuters work
for behemoths. IDC found that 36 percent of
rms with fewer than 100 workers and two-thirds
of midsized companies employ telecommuters.
The editorial staff of Inc. magazine, a publica-
tion that serves small companies and entrepre-
neurs, experimented with telecommuting for its
April 2010 issue. All staffers left the ofce for a
full month. While some loved the exibility (and
quiet writing time) it provided, others found
themselves yearning for coworkers’ company.
They’re not alone. IBM brings together manyof its 400,000 employees who telecommute,
through outing and mentoring clubs, and virtu-
ally, through an in-house social network, where
telecommuters can catch up with coworkers
and have digital water cooler chats.
So while telecommuting is still slow to grow,
its future is bright. And the next generation of
workers — raised in a digital world with social
media and online collaboration — will demand
telecommuting as a workplace benet. Private
employers may take Uncle Sam’s lead with bet-
ter designed telecommuting policies.
tElECommUting Hotspots15 metro regions with highest percentage of telecommuters
Source: TeleworkResearchNetwork.com

8/6/2019 State Green Business Report 2011
http://slidepdf.com/reader/full/state-green-business-report-2011 40/66
stat f g bsss
2011
40
EnERgY EFFiCiEnCYtg t sfta t fd had savgs
In 2009, the commercial and industrial sectors
consumed 1.76 BTU of primary energy — that is,
energy derived from its natural state, such as
coal or natural gas, and not converted energy,
such as electricity — for every dollar of U.S. gross
domestic product. That’s a solid improvement
over 2008, which was an improvement over
2007. So, we’re swimming in the right direction,and have been doing so for a while. In fact, ef-
ciency has led to lower energy consumption
for decades. In 2009, it took less than half the
energy to produce a dollar of GDP than in 1970.
We learned last year that the Great Recession
didn’t short-circuit energy-efciency projects in
2008, and it now appears that the trend contin-
ued in 2009, even as the recession languished
and despite a drop in energy prices.
But this doesn’t mean we’re swimming fast
enough, say many energy experts, pointing to
lagging investments and state budgets being
stripped of dollars once marked for efciency
projects. Plus, the Property Assessed Clean
Energy, or PACE, program, which the govern-
ment backed with $150 million in stimulus
funds and which was designed to make energyefciency improvements more affordable for
homeowners, was derailed this summer, as the
result of a California appeals court decision.
Still, some hopeful signs emerged in 2010. Inside
big companies, government agencies, ofce
complexes, and other large buildings, efciency
projects increasingly are managed through a
facility’s IT command center. Sometimes that
means installing energy management software
Source: U.S. Energy Information Administration
Energy management
software is helping
decision-makers see
the value and payback
achieved through
relatively low-cost
efforts.
8.33
6.96
6.37
4.57
3.12
2.42
1.861.76
1950 2000 20081960 1970 1980 1990 2009
bt er or o gdp

8/6/2019 State Green Business Report 2011
http://slidepdf.com/reader/full/state-green-business-report-2011 41/66
stat f g bsss
2011
41
and sensor-based control systems that allow
heating and cooling to be triggered on demand,
rather than being run indiscriminately. Other
times, this systems approach means taking
a broader view of energy management. For
example, the city of Las Vegas is using software
to measure the resources consumed and emis-
sions produced across the city, with the goal
of helping reach its sustainability goals, includ-
ing reducing its greenhouse gas emissions. The
odds are high they’ll also save money.
A number of big companies are collaborating to
improve and streamline the business of energy
management. For example, IBM joined forces
with Schneider Electric and Johnson Controlsto pair mechanical systems with software to
create smarter, more efcient buildings. Energy
management software is helping decision-mak-
ers see the value and payback achieved through
relatively low-cost efforts, such as updating
lighting or improving insulation, or even more
complex projects, like optimizing energy ow in
manufacturing systems.
Energy management software is the key to illu-
minating where and how energy is wasted, and
cutting that waste seems to be a high prior-
ity for companies. Sixty percent of the execu-
tives responding to a 2010 survey by Johnson
Controls said they planned on increasing expen-
ditures for energy efciency. GreenBiz Group’s
own survey of sustainability executives’ spend-
ing priorities placed energy efciency invest-
ments at the top of the list for the third year in
a row.
However, there’s little energy on the policy front
to compel corporations to cut power use or nd
cleaner sources of energy. Still, some notable
voluntary efforts to boost efciencies on a
grand scale grabbed headlines in 2010. Take the
Empire State Building: Its owners are complet-
ing a retrot that will reduce its energy use by
38 percent, driving down energy costs by more
than $4 million a year, a towering achievement.
The U.S. Energy Department is taking steps to
lead by example, installing a white roof on its D.C.
headquarters. It is only playing catch-up to the
National Nuclear Security Administration, which
has installed more than 2 million square feet of
energy-efcient cool and white roofs, saving
about $500,000 a year in energy costs.
We won’t know until later this year how much
energy the commercial and industrial sectors
squeezed out of each dollar of 2010’s GDP. But
by the end of 2011, if economists’ predictions
about higher oil prices are correct and if thepieces of the smart grid start coming together,
energy efciency could experience a surge.
One thing is certain: There are still plenty of
gains to be made in using less energy.
Agriculture
Wood Products
Glass
Mining
Paper
Rening
Aluminum
Iron & Steel
Bulk Chemicals
Cement 53.68
30.20
22.71
16.51
16.25
14.95
9.54
4.07
3.82
9.21
most EnERgY-intEnsivE indUstRiEsbt er or o rouc ie o mre
Source: U.S. Energy Information Administration

8/6/2019 State Green Business Report 2011
http://slidepdf.com/reader/full/state-green-business-report-2011 42/66
stat f g bsss
2011
42
EnviRonmEntAl FinAnCiAl impACtsa s hat Cpas a Cstg th ath
For more than a decade, the U.K.-based research
rm Trucost has measured the nancial costs of
hundreds of environmental impacts of 4,500 or
so companies. It does this through what it callsan “advanced environmental proling model,”
which tracks more than 700 environmental
impacts — a wide range of emissions into air,
water, and soil, including a witch’s brew of pol-
lutants from acetaldehyde to zinc. It assigns a
dollar amount to each impact. Trucost uses this
information both to assess and benchmark indi-
vidual companies and sectors, but also to track
interactions and cash ows in order to map
each sector’s supply chain.
Thanks to Trucost, we can also look at aggregate
data — the sum total of all of the impacts of all
of the companies it tracks — to gauge overall
improvements, or lack thereof, across the entire
economy.
Trucost’s latest research shows that, after a
sharp drop in 2008, the nancial costs of envi-
ronmental impacts ticked up in 2009, the most
recent year for which data is available. The rise
brought the impacts to roughly the same level
they were in 2007. All told, the direct and supply-
chain environmental impacts had a combined
cost of $995,783 million in 2009 — that is, nearlya trillion dollars.
Trucost prices the damage from pollutants and
natural resource use, including quantifying asso-
ciated human health costs. Trucost and many
academics believe that pricing these resources
and pollutants in nancial terms provides the
most suitable weighting factor to differentiate
the relative damage of a range of impacts. (The
same approach was applied by the Stern Review
on the Economics of Climate Change, a study
commissioned by the U.K. government in 2006.)
By applying a price to each resource, based on
the environmental impact of that resource, the
model is able to analyze, in nancial terms, the
productivity and environmental performance of
companies, sectors, indexes, etc.
Trucost has compiled a library of prices for
different natural inputs and outputs, derived
from academic and professional literature. For
Source: Trucost
Co o enironmen me ercene o economic ouu
All told, the direct
and supply-chain
environmental
impacts had a
combined cost of
$995,783 million in
2009 — that is, nearly atrillion dollars.
4.46
4.35
3.86
2006 2007 2008 2009
4.32

8/6/2019 State Green Business Report 2011
http://slidepdf.com/reader/full/state-green-business-report-2011 43/66
stat f g bsss
2011
43
example, it uses the marginal social damage cost
of $31 for each ton of greenhouse gas emissions.Trucost’s damage costs distinguish between
different methods used to manage resources
or waste. So, for example, process water has a
higher damage cost than cooling water used
by power utilities because of its higher con-
centration of pollutants. And costs assigned to
waste sent to landlls are higher than for waste
incineration.
To develop their scores, Trucost analyzes each
company’s publicly available nancial infor-
mation. Its data model can then predict the
environmental impact of a company, based
on Trucost’s understanding of the industries inwhich it operates. It then incorporates reported
environmental data for each company, as avail-
able from the company’s own public and pri-
vate disclosures. Companies are then given the
opportunity to respond with more or amended
information, which is incorporated into the
company prole. Trucost uses the completed
prole to calculate a company’s environmen-
tal and nancial impacts. To ensure apples-to-
apples comparisons, Trucost calculates what it
calls an Environmental Impact Ratio — a compa-ny’s environmental damage costs divided by its
overall revenue. So, if a company’s
environmental impacts are $10
million and its sales are $100 mil-
lion, the company’s Impact Ratio
will be 10.
So, why did the aggregate Impact
Ratio rise in 2009? Did the reces-
sion play a role? It’s possible,
at least in some sectors, says
James Salo, Trucost’s Senior Vice
President, Strategy and Research.
“If you have a depressed economy
you may have lower demands for
manufacturing, and that will gen-
erally decrease the environmen-
tal impacts,” he explains. But it’s
not that simple, he says. Some
industries may have a xed level
of resource use regardless of out-
put. “In those cases, you may be
having the same environmental
impact but making less money, so
you’re becoming more environ-
mentally intensive per dollar of
revenue.”
FinAnCiAl impACts, BY indUstRY(millions)
Source: Trucost

8/6/2019 State Green Business Report 2011
http://slidepdf.com/reader/full/state-green-business-report-2011 44/66
stat f g bsss
2011
44
E-wAstEgg CC, bt t gh aCt
Last year, we reported that one of the big trends
from 2009 was the ways in which IT aims to save
the world, through such things as dematerial-
ization, reducing travel, and saving energy. And
while that’s true, it doesn’t exactly explain away
the vast mountain of toxic trash generated by
all of this wondrous technology. Despite moreand more used electronics being taken back
for recycling at a growing number of locations,
those discarded gadgets are being replaced by
an equal or greater number of new ones.
Of course, as the data show, an increasing num-
ber of these gadgets aren’t going to landlls —
but that doesn’t mean we’re making progress.
Most of those unwanted, outdated, and often
broken electronics are exported to China, Africa,
and Latin America, where they are dismantled
under primitive and toxic conditions to salvage
the valuable metals they contain.
Sending all these unloved electronics to other
countries is starting to have national security
implications for the U.S. With global demand
for electronics climbing nonstop, high-value
materials critical to their manufacture — so-
called rare earth elements — are in ever-higher
demand. Seeing a market crunch coming, in
2010 China — both the world’s largest supplier
and one of the largest consumers of rare earths
— tightened its grip on its supplies. Once again,
Western nations are nding themselves at the
Source: U.S. Environmental Protection Agency
toun o on o eecronic icre n recyce nnuy in e .s.
Governments,
corporations, activists
and the public are
increasingly aware
that we are exporting
our environmental
impacts to thedeveloping world, even
as we are giving away
valuable resources.
2 0 0 0
2 0 0 5
2 0 0 7
2 0 0 8
2 0 0 9
1, 7 1 0
2, 2 7 0
2, 4 6 0
2, 6 0 0 2, 5 9 0
1 9 0
3 6 0
5 5 0
6 0 0
5 6 0
Co m p u te r s P ro
d uc t s D i sc a rde
d
C o l l e c t e d f o r
R e c y c l i ng

8/6/2019 State Green Business Report 2011
http://slidepdf.com/reader/full/state-green-business-report-2011 45/66
stat f g bsss
2011
45
mercy of another country for a critical resource.
The good news is that governments, corpora-
tions, activists, and the public are increasingly
aware of the fact that we are exporting our envi-ronmental impacts to the developing world,
even as we are giving away valuable resources.
But the pace at which reform is happening lags
the growth of the problem.
Since last year’s report, we’ve seen a number
of promising developments. About a dozen U.S.
states, leading the charge on e-waste regula-
tions in the face of inactivity in Washington,
enacted laws related to e-waste during 2010, or
implemented previously approved laws.
But as has long been the case, activist groups
and private companies were responsible for
the greatest progress on e-waste. In 2010, we
saw the launch of the e-Stewards e-waste recy-
cling certication, which joined the Responsible
Recycling (R2) standard in the suddenly com-
petitive market for responsible electronics take-
back. Both certications began at a multi-stake-
holder dialogue between the EPA, activists, and
the recycling industry, but talks fell apart in 2009
when the activists and some recyclers disagreedon how, where, and by whom electronics would
be responsibly recycled.
Those groups created e-Stewards to address the
perceived shortcomings of the industry-backed
R2; e-Stewards centers around a commitment
by recyclers and their customers to forbid the
use of incineration, prison labor, and exports in
dealing with unwanted electronics.
The two other big splashes in the world of
e-waste came from the private sector. First,
eBay launched its “Instant Sale” option for elec-
tronics, offering gadget owners a near-guaran-
teed sale on used goods, depending on the age
and quality of the gear.
And Best Buy unveiled a “Buy Back” program,
guaranteeing customers a percentage of their
money back when they return electronics within
two years. The hope is that by making it quick
and protable to sell back electronics, more
will end up in the collection stream and fewer in
landlls.
The success of e-Stewards will be on the radar
this year, with likely commitments from high-
prole companies and governments to use the
standard in their contracts. Congress will again
work on e-waste legislation, although its future is
uncertain.
And look for attention focused on the national
self-interest of recycling e-waste, as awareness
of looming shortages of rare earths moves to
the fore and policymakers realize how much of
a precious material we’re exporting instead of
keeping it for reuse in the United States.
Company Amount Region
Acer 2,177 North America
Dell 8,100 Worldwide
Fujitsu 6,445 Worldwide
HP 37,500 Americas
IBM 41,400 Worldwide
Lenovo 11,547 Worldwide
Sony 112,122 Worldwide
Source: GreenBiz Group research
E-wAstE tAkEBACk BY ElECtRoniCs mAnUFACtURERs(meric on)

8/6/2019 State Green Business Report 2011
http://slidepdf.com/reader/full/state-green-business-report-2011 46/66
stat f g bsss
2011
46
FlEEt impACts hYbds ad vs a ad th C
In recent years, we saw the recession lead to a
downshift in emissions per eet vehicle — not
necessarily because of conservation efforts as
much as lower demand. Fleets took a similar
route in 2010, with emissions down 5 percent
over 2009. The gallons of fuel consumed also
dropped, despite larger eets, signaling that
2010’s lower emissions aren’t due only to a
at economy, but also to concerted efforts to
reduce fuel consumption.
As in the past, we tracked greenhouse gas emis-
sions per vehicle, based on fuel consumption
patterns of the largest U.S. eet management
companies, including ARI, Donlen, Enterprise,
GE Capital Fleet Services, LeasePlan and PHH
Arval. The addition of new company data this
year required us to revise last year ’s results.
When it comes to vehicle eets, the math is
fairly simple: Manage more-efcient eets and
you’ll drive down fuel costs. And lower fuel costs
have special appeal to eet managers when the
economy’s engine stalls (and gas prices rise).
That could be one reason why the number of
eet managers who are measuring eet emis-
sions has soared — from 28 percent in 2008
to 49 percent in 2010, according to a survey by
PHH Arval.
The number of eet companies that are chas-
ing environmental goals is also up. Some say
the economy slowed their progress toward
these goals, while others say it accelerated
it. But nearly all (74 percent, according to the
PHH survey) said they’re turning to the people
behind the wheels to help reach those goals. By
Source: GreenBiz Group research
ime nnu reenoue emiion er eice (in on)
The number of eet
managers who are
measuring eet
emissions has soared
— from 28 percent in
2008 to 49 percent
in 2010, according toeet management
company PHH Arval.
14.5914.63
12.16
11.56
2007 2008 2009 2010

8/6/2019 State Green Business Report 2011
http://slidepdf.com/reader/full/state-green-business-report-2011 47/66

8/6/2019 State Green Business Report 2011
http://slidepdf.com/reader/full/state-green-business-report-2011 48/66
stat f g bsss
2011
48
gREEn itt’s t f stadads t bt
The past year has seen tremendous growth in
green IT, as measured by the numbers of com-
puting products certied under the two leading
standards for greener electronics, Energy Star
and EPEAT. Unfortunately, when it comes to
green computers and monitors, it’s possible to
have too much of a good thing.
Both of the standards that feed into the chart
above have been set at the same level — for
nearly two years, in the case of Energy Star,
and almost ve years in the case of EPEAT. Two
years is a lifetime in electronics, and ve years is
the tech equivalent of an eon, so both standards
are due for a reboot in the coming year, raising
the bar to push manufacturers to reduce IT’s
impacts on the planet. With a new set of stan-
dards, we’re sure to see a drop in the number
of products certied under both. The last time
Energy Star introduced a new spec, in 2009,
the number of certied notebooks dropped by
nearly 60 percent, and just one-sixth as many
monitors earned the certication by the end of 2009 as bore the Energy Star logo at the begin-
ning of that year.
But these changes have big environmental
impacts, and raising the bar gets companies
to step up their game. Consider televisions,
where the evolution from Energy Star 3.0 to
5.0 between 2008 and 2012 will drive down
the energy used by large TVs by as much as
*Denotes year of transition to new level of Energy Star certication requirements
Source: GreenBiz Group research
umer o comuer cerie y nery sr n pat
The evolution from
Energy Star 3.0 to 5.0
between 2008 and
2012 will drive down
the energy used by
large televisions by as
much as two-thirds.
6,196
7,004
3,656* 3,881*
2006 2007 2008 2009
0
2000
4000
6000
8000
100009,798
2010

8/6/2019 State Green Business Report 2011
http://slidepdf.com/reader/full/state-green-business-report-2011 49/66
stat f g bsss
2011
49
two-thirds. Such achievements are easily pos-
sible with computers and displays as well.
Energy efciency has been steadily on the rise
for IT products, driven in large part by the shift of the market toward battery-dependent mobile
devices: Laptops and netbooks accounted for
more than 5,300 Energy Star-certied com-
puter models in 2010, compared to just over
2,000 desktop models. But energy efciency is
easy to characterize as low-hanging fruit, and
there are many more — and more ambitious —
changes needed to achieve greener IT.
One area where manufacturers are making
steady progress, at least for some products, is
in lightweighting, exemplied by the quick evolu-
tion from the 200-pound console TV from the
1990s to the even larger LCD or plasma set you
can pick up to hang on your wall. The agency
responsible for collecting fees for Washington
state’s e-waste takeback law has tracked steady
improvements in lightweighting. As the table
below shows, TVs in particular have undergone
rapid weight loss, dropping as much as 20 per-
cent of their heft in just one year.
The EPEAT standard, administered by the Green
Electronics Council, looks beyond energy use
to award its ratings. Manufacturers must also
address hazardous chemicals, product pack-
aging, product disposal, and overall corporate
environmental performance. Despite this broad
and rigorous set of criteria, EPEAT keeps grow-
ing, expanding to 40 countries in 2009 and add-
ing certifying partners to keep up with demand.
There is still plenty of room for improvement,
especially when it comes to the end-of-life
impacts of electronics. The world’s largest com-
puter companies are working to phase out toxic
chemicals from products, and IT packaging is
getting increasingly smaller.
But there have been few signs of progress on
how we deal with IT’s short life-cycle from shiny
object to unwanted junk. While design for dis-
mantling is included among EPEAT’s criteria,
it’s a far cry from the vision of a short animated
2010 video called “The Story of Electronics”:
endlessly upgradable, easily recycled gadgets
that, while still an elusive goal, sets a high bar for
what green IT can be.
2009 2010 2011
LCD TV, 17-39" 24.4 24.2 19.4
LCD TV, 40”+ 78.7 68.6 65.5
Plasma TV, 17-39" 42.1 36.2 41.5
Plasma TV, 40”+ 108.4 91.1* 66.7
Rear Projection TV, 40+" 109.4 108.3 87.8
Direct View TV, 17-39" 89.6 91.1 84.3
LCD Monitor, < 19" 9.8 9.9 10.3
LCD Monitor, > 19" 15.9 16.5 18.4
Laptop, < 3 lbs 2.4 2.5 2.7
Laptop, 3-5 lbs 4.1 4.1 4.3
Laptop, 5-7 lbs 6.7 5.9 5.9
Laptop > 7 lbs. 10.2 10.3 10.4
PC, Tower 28 21.3 25.6
*Average weight Q1-Q2 2010 = 100.8 lbs., average weight Q3-Q4 2010 = 81.3 lbs
Source: Washington Materials Managment and Financing Authority
lEss is moREAverage weight of selected electronics, in pounds

8/6/2019 State Green Business Report 2011
http://slidepdf.com/reader/full/state-green-business-report-2011 50/66
stat f g bsss
2011
50
5491,453
2,1872,464
9,905
15,751
2006 2007 2008 2009
399767
1,711
2,775
2006 2007 2008 2009
CI Registrations
EB Registrations
CI Certifications
EB Certifications
13769 170
2,121
356
4,009
LEED - New Construction
199
701
209103
LEED - Existing Buildings and Commerical Interiors
927
5,205
2010
814
3,934
5,909
1,435
2010
3,744
18,573
NC Certifications
NC Registrations
42
626
gREEn oFFiCE spACEth pttal f xstg bldgs s skY-hgh
As far as green standards go, few have been as
successful, or as inuential, as the LEED stan-
dard developed by the U.S. Green Building
Council (USGBC). With a meteoric rise and pan-
oramic scope, LEED has become the blueprint
for green certications.
Despite a near-meltdown in the building mar-
ket, almost every element of the LEED ecosys-
tem for commercial buildings — LEED for New
Construction (NC), LEED for Existing Buildings:
Operations & Maintenance (EBOM), and LEED
for Commercial Interiors (CI) — continues to
There are more than
80 billion square feet
of existing building
oorspace in need
of energy- and
water-efciency
improvements.
Source: U.S. Green Building Council

8/6/2019 State Green Business Report 2011
http://slidepdf.com/reader/full/state-green-business-report-2011 51/66
stat f g bsss
2011
51
ProjectName City StateGross
SquareFeet
One Bryant Park New York NY 2,200,000
Hyatt Center Chicago IL 1,687,710
Duke Energy Tower Charlotte NC 1,500,000
Joe Serna Jr. Cal/EPA Headquarters Bldg. Sacramento CA 950,000
IFC Headquarters Building Washington DC 882,174
50 Fremont Center San Francisco CA 817,412
560 Mission Street (JP Morgan Chase) San Francisco CA 778,782
Two Constitution Square (Dept. of Justice) Washington DC 636,000
The Orrick Building San Francisco CA 560,513
Twelfth & Washington Mixed-Use Portland OR 551,932
Source: U.S. Green Building Council
nEw, Big, And gREEn10 Largest LEED-Platinum Commercial Buildings Certied in 2010
grow. Indeed, the certication of buildings under
all three reached record levels in 2010.
The most notable impact of the recession on
our data is the sharp slowdown of registrationsfor New Construction, with projects entering the
NC pipeline at the slowest rate since 2005.
But while companies are building fewer new
green buildings, they are increasingly seeking
to green existing ones, as evidenced by the still-
rapid growth of EBOM. This bodes as well for the
planet as for LEED: There are more than 80 bil-
lion square feet of existing building oorspace
that are in need of energy- and water-efciency
improvements, sustainably sourced materials,
and the other criteria that LEED factors into
its rating system. As noted by Rob Watson in
GreenBiz.com’s annual Green Buildings Market
and Impact Report, the growth of the EBOM
market represents the sweet spot for growth in
the LEED system.
Last year also saw the formal launch of two
new LEED standards: The LEED for Retail spec
focuses on the environmental impacts of retail
spaces as widely divergent as McDonald’s and
Kohl’s, Citigroup and Starbucks.
Retail chains are also likely to benet from the
other new LEED standard, the Volume pro-
gram. Aimed at large developers such as retail-
ers, hotels, school districts, and home builders,
LEED Volume lets companies that plan to build
25 or more similar buildings to achieve a batch
certication. Starbucks is among those joining
the Volume certication out of the gate, brew-
ing plans to get new stores certied.
Looking ahead to 2011, the biggest news on the
green building front comes from California,
which recently became the rst state to
require green building practices for all new
buildings. The state’s CALGreen building code
will require across-the-board improvements inwater use, construction waste, HVAC systems
and indoor air quality. (Separately, California
already requires state-operated facilities that
are new or undergoing major renovations to
reach at least a LEED Silver certication level. )
The state’s building code will likely set the pace
for the growth of green buildings nationwide.
And starting this year, the USGBC will begin the
process of upgrading all of its LEED standards,
to raise the ceiling on what green means for the
next generation of buildings.

8/6/2019 State Green Business Report 2011
http://slidepdf.com/reader/full/state-green-business-report-2011 52/66
stat f g bsss
2011
52
gREEn powER UsEa ld sg dspt a laCk f pltCal p
Although coal remains the source for nearly
half of all electricity generated in the U.S., the
percentage of electricity being produced from
solar, wind, geothermal, biomass, and other
sources continues to creep upward.
As a result, renewables’ share of total electric-
ity generated in the U.S. keeps growing. For the
rst nine months of 2010, non-hydro renewable
energy accounted for nearly 4 percent of all gen-
eration — its largest proportion ever. Moreover,
total generation of renewable energy during this
period was nearly 17 percent higher than it was
the year before. This follows a nearly 14 percent
growth in green power generation during 2009.
What’s unclear is if, in a changing political envi-
ronment, such growth is sustainable.
The growth in clean energy comes despite a
range of obstacles that have challenged the
growth of renewables in recent years. For exam-
ple, the tight credit market stalled many proj-
ects in 2009 before loosening up considerably
the following year. The recessionary economy
sapped demand for electricity across the board,
which in turn dragged down electricity prices
and negatively impacted green power purchase
contracts. Some utilities weighed whether they
even needed to buy additional energy in the face
of abundant capacity, and if they did buy renew-able energy, they wanted to pay less, even in
areas where buying renewables was mandatory.
But the recession also brought down costs of
renewable energy projects due to lower demand
for things like wind turbines and solar panels.
Project developers are still nding success if
they can carefully balance the demand side,
garnering reasonable prices from their utility
Source: U.S. Energy Information Administration
* As of September 2010
percene o .s. eecriciy enerion rom non-yroower renewe ource
65
84
121
138
146
140In 2010, wind
installations declined
by nearly 50 percent
due to lower demand
and lack of a long-term
national policy.
2004 2005 2006 2007 2008 2009 2010
2.16
2.22
2.41
2.57
3.10
3.68
3.95*
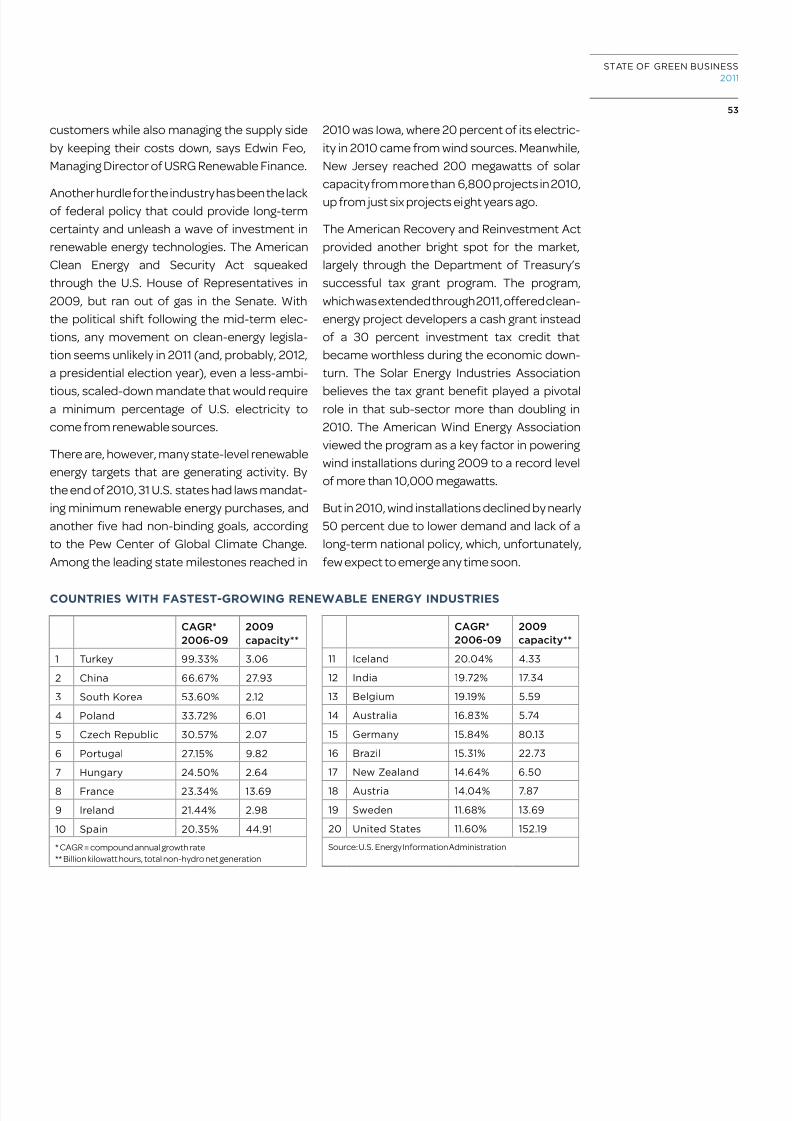
8/6/2019 State Green Business Report 2011
http://slidepdf.com/reader/full/state-green-business-report-2011 53/66
stat f g bsss
2011
53
customers while also managing the supply side
by keeping their costs down, says Edwin Feo,
Managing Director of USRG Renewable Finance.
Another hurdle for the industry has been the lackof federal policy that could provide long-term
certainty and unleash a wave of investment in
renewable energy technologies. The American
Clean Energy and Security Act squeaked
through the U.S. House of Representatives in
2009, but ran out of gas in the Senate. With
the political shift following the mid-term elec-
tions, any movement on clean-energy legisla-
tion seems unlikely in 2011 (and, probably, 2012,
a presidential election year), even a less-ambi-
tious, scaled-down mandate that would requirea minimum percentage of U.S. electricity to
come from renewable sources.
There are, however, many state-level renewable
energy targets that are generating activity. By
the end of 2010, 31 U.S. states had laws mandat-
ing minimum renewable energy purchases, and
another ve had non-binding goals, according
to the Pew Center of Global Climate Change.
Among the leading state milestones reached in
2010 was Iowa, where 20 percent of its electric-
ity in 2010 came from wind sources. Meanwhile,
New Jersey reached 200 megawatts of solar
capacity from more than 6,800 projects in 2010,
up from just six projects eight years ago.
The American Recovery and Reinvestment Act
provided another bright spot for the market,
largely through the Department of Treasury’s
successful tax grant program. The program,
which was extended through 2011, offered clean-
energy project developers a cash grant instead
of a 30 percent investment tax credit that
became worthless during the economic down-
turn. The Solar Energy Industries Association
believes the tax grant benet played a pivotalrole in that sub-sector more than doubling in
2010. The American Wind Energy Association
viewed the program as a key factor in powering
wind installations during 2009 to a record level
of more than 10,000 megawatts.
But in 2010, wind installations declined by nearly
50 percent due to lower demand and lack of a
long-term national policy, which, unfortunately,
few expect to emerge any time soon.
CoUntRiEs witH FAstEst-gRowing REnEwABlE EnERgY indUstRiEs
cAGr*
2006-09
2009
aaiy**
1 turey 99.33% 3.06
2 Cin 66.67% 27.93
3 sou kore 53.60% 2.12
4 pon 33.72% 6.01
5 Czec euic 30.57% 2.07
6 poru 27.15% 9.82
7 hunry 24.50% 2.64
8 frnce 23.34% 13.69
9 ren 21.44% 2.98
10 sin 20.35% 44.91
* CAGR = compound annual growth rate
** Billion kilowatt hours, total non-hydro net generation
cAGr*
2006-09
2009
aaiy**
11 cen 20.04% 4.33
12 ni 19.72% 17.34
13 beium 19.19% 5.59
14 auri 16.83% 5.74
15 germny 15.84% 80.13
16 brzi 15.31% 22.73
17 ew Zen 14.64% 6.50
18 auri 14.04% 7.87
19 sween 11.68% 13.69
20 nie se 11.60% 152.19
Source: U.S. Energy Information Administration

8/6/2019 State Green Business Report 2011
http://slidepdf.com/reader/full/state-green-business-report-2011 54/66
stat f g bsss
2011
54
oRgAniC AgRiCUltUREstadY gth, bt stll sall ptats
Agriculture, for all its bounty, eats up massive
amounts of water, carbon sinks, and biodiver-
sity. Pesticides, fertilizers, and genetically modi-
ed seeds have allowed farmers to tease greater
yields out of the ground, but they’ve also caused
a long list of problems, including soil erosion,
toxic runoff, and greenhouse gas emissions. The
Intergovernmental Panel on Climate Change g-
ures agriculture accounts for roughly 6 percent
of global greenhouse gases.
But ag is changing. Acre by acre, producers in
the U.S. are growing food using methods of sus-
tainable agriculture — a term the author Wendell
Berry denes as that which “does not deplete
soils or people.” And certied organic agricul-
ture — food produced in accordance with thefederal government’s standard for the practices
and inputs that make organic products — is play-
ing a major part in this process.
Now at nearly 5 million acres, the amount of cer-
tied organic farmland in the U.S. has steadily
increased since the early 1990s, sprouting
nearly 150 percent between 2002 and 2008.
Also increasing is the public’s willingness to pay
higher prices for organic foods. Despite slowing
sales in organics during the recession, organic
food sales experienced 17.4 percent average
annual growth from 2000 to 2009, compared
to just 3.5 percent for all food products.
While organic farming costs more — average
annual production costs are roughly $172,000
compared to $109,359 for all farms — it also
earns more. U.S. organic farms had aver-
age annual sales of $217,675, compared with
$134,807 for farms overall, according to the
USDA. So it’s not surprising that between 1992
and 2008, the number of certied organic oper-
ations tripled, from 3,857 to 12,941.
Yet, organic ag is small potatoes, a mere 0.54
percent of all cropland in the U.S., up from 0.2
percent in the early 2000s. In agriculture overall,
the trend is a shift to bigger farms. In 2002, farms
with more than $1 million in sales generated 47
percent of all U.S. production. By 2007, their
slice of the pie was up to 59 percent. The con-
centration of large producers means farmers
are striving to maximize yield at the lowest cost
to satisfy demand from major buyers. Larger
Source: U.S. Department of Agriculture
Organic agriculture
represents a mere
0.54 percent of all
cropland in the U.S., up
from 0.2 percent in the
early 2000s.
2.20
3.054.05
2.94
4.29
4.80
2003 2004 2005 2006 2007 2008
acree o .s. ricuure cerie ornic (in miion)

8/6/2019 State Green Business Report 2011
http://slidepdf.com/reader/full/state-green-business-report-2011 55/66
stat f g bsss
2011
55
farmers are planting more and more acreage
and increasing their use of petrochemical fertil-
izers and pesticides, says Fred Kirschenmann,
distinguished fellow for the Aldo Leopold Center
for Sustainable Agriculture.
Thankfully, this trend has a counterweight, not
just among organic farmers but also among
those practicing other methods such as integra-
tive pest management (IPM). And these alterna-
tive growing methods are starting to bear fruit.
The IPM Institute works with growers to employ
farming practices aimed at reducing erosion
and use of pesticides and fertilizers. It has cre-
ated a set of protocols called the EcoApple pro-
gram, used by apple growers in the Northeast.
Due to pests and climate, growing apples organ-
ically in that region can be prohibitively expen-
sive. EcoApple growers use traps and biological
controls against pests, allowing them to reduce
their use of chemical pesticides, making apple
growing more affordable.
The IPM Institute, along with the American
Farmland Trust and the USDA’s NaturalResources Conservation Service, also offers
farmers who grow commodity crops a risk-free
opportunity to reduce their use of nitrogen,
phosphorous, and potassium fertilizers, as well
as reducing tillage. The program, called the Best
Management Practice Challenge, uses a side-
by-side system in which participating farmers
work with researchers to study weather pat-
terns and manage fertilizer use and tillage prac-
tices. If test strips yield fewer crops than the
strips employing conventional techniques, thefarmer is compensated for his losses.
Such efforts, along with increasing interest
among consumers in sustainably and locally
grown food, is helping ag turn over a new leaf.
sliCing tHE oRgAniC piE2009 U.S. organic food sales, by product type, (millions)
Source: Organic Trade Association
Fruits and Vegetables ($9,425)
Dairy ($3,720)Packaged and Prepared
Foods ($3,472)
Beverages
($3,224)
Breads and Grains($2,728)
Snack Foods($1,240)
Meat, Poultry andFish ($496)
Condiments($496)

8/6/2019 State Green Business Report 2011
http://slidepdf.com/reader/full/state-green-business-report-2011 56/66
stat f g bsss
2011
56
pACkAging intEnsitYstadY pgss, as paCkags ap vats
The amount of stuff used to package our stuff
is decreasing, slowly but surely. In 2009, 4,340
tons of packaging were used in the U.S. per every
billion dollars of GDP. This represents a 5.4 per-cent drop over 2008 — progress, but a smaller
decline than the previous year. Still, it shows that
packaging continues to remain an important
area of improvement.
In the past year we’ve seen the trend toward
alternative materials surge ahead. New materi-
als made from renewable sources will play a vital
role in long-term packaging sustainability, but
consumers won’t always immediately embrace
the changes. Frito-Lay — whose compostableSunChips bag was introduced in 2010 but pulled
from the market after complaints about the
noise the bag made — continues to study and
experiment with new materials. In fact, Frito-Lay
Canada didn’t pull the bag; instead, it launched
a lighthearted public service campaign offering
earplugs to consumers.
The overall drop in packaging use is due in part
to the increased use of recycled plastics. The
amount of recycled polyethylene terephthalate,
or PET, used in bottles (both food and non-food
grade) and lm grew by 154 percent from 2000
to 2009, according to the National Associationfor PET Container Resources (see chart p. 57).
But the amount of PET captured needs to
be much higher, says Anne Johnson of the
Sustainable Packaging Coalition. Recycling has
stagnated in the U.S. over the past decade or
so, she notes, and less than a third of the PET
packaging used in the U.S. is recycled — with
more than half of that exported to Asia, where it
is used largely to manufacture polyester. “When
we recovered from the Depression, we builtroads,” says green packaging advocate Dennis
Salazar. “Now, we should be building a national,
consistent recycling infrastructure.”
You might not want to start stockpiling empty
soup cans in anticipation of such an overhaul,
but Kim Jeffery, president of Nestlé Waters
North America, has proposed an industry-led
effort to boost recycling rates that would use
an extended producer responsibility model,
Source: GreenBiz Group research
toun o on o cin meri er iion or o gdp
New materials made
from renewable
sources will play a
vital role in long-
term packaging
sustainability, but
consumers won’talways immediately
embrace the changes.
5.105.09
4.90
4.34
2005 2006 2008 20092007
4.59

8/6/2019 State Green Business Report 2011
http://slidepdf.com/reader/full/state-green-business-report-2011 57/66
stat f g bsss
2011
57
wherein industry would subsidize municipal
recycling programs.
Another means by which industry is trying to
address packaging’s footprint is the GlobalPackaging Project. Started by the Consumer
Goods Forum, it aims to establish a common
industry language for packaging and sustainabil-
ity and recently issued a guidance document
that creates common metrics for things such as
water consumption and recycled content.
But alongside new and better recycled materi-
als, the rst “R” in the “Reduce, Reuse, Recycle”
mantra continues to knock down the amount of
materials needed to do a given job, referred to
as packaging intensity.
Lightweighting — reducing the amount of mate-
rials used to protect, ship, and display products
on shelves — has emerged as an important strat-
egy for reducing packaging intensity.
And in 2010 we saw the marriage of lightweight-
ing and reusability in the form of the Replenish
bottle, a design that lets consumers mix con-
centrated detergent with water at home, then
reuse the bottle indenitely, purchasing only
rells of concentrated detergent.
Look for more companies launching new materi-
als and packaging innovations — including more
reusable containers — in 2011. The SunChips bag
made a lot of noise, but it didn’t let the air out of
efforts to re-package packaging.
100
200
300
400
500
100
200
300
400
500
2000 2002 2004 2006 2008 2009
RECYClEd mAtERiAls UsEd in pACkAgingMillions of pounds of recycled PET used in bottles and lm
Source: National Association for PET Container Resources

8/6/2019 State Green Business Report 2011
http://slidepdf.com/reader/full/state-green-business-report-2011 58/66
stat f g bsss
2011
58
pApER UsE And RECYClingh Ch btt Ca t gt?
Paper intensity — the amount of paper used to
power our economy — has been one of the shin-
ing examples of progress over the past few years.
This year nds the emergence of an even more
promising double-trend: Paper use declined for
the second year running, even as the percent-
age of used paper recovered for recycling con-
tinued to climb.
Between 2007 and 2008, paper intensity —
dened as the amount of paper used to gen-
erate a dollar of gross domestic product —
dropped by almost 6 percent while recovery
grew by just 1.5 percent. But between 2008 and
2009, intensity dropped 4 percent as recovery
grew by its fastest rate ever, rising to 63 percent.
This progress cannot continue forever, of
course, and in all likelihood we’re within just a
few years of reaching a plateau, where all the
paper that reasonably can be recycled is recov-
ered and reused. The American Forest and
Paper Association, an industry group, estimates
that once we reach about 80 percent over-
all recovery, the remainder will be unt for the
reuse stream: Bath tissues and building papers
alike pose challenges to recycling for both obvi-
ous and less obvious reasons.
But there is still room for improvement, and
while businesses have led the charge in making
the corrugated bers that go into shipping prod-
ucts the most-recycled type of paper around,
Source: American Forest & Paper Association
toun o on o er er iion or o gdp
Should a binding
climate agreement or
U.S. climate law take
effect, the methods
used to address the
carbon impacts from
forests could compelcompanies to recycle
every last scrap of
paper.
9.77
9.16
8.58 8.56
7.887.76
7.33
6.79
1999 2000 2001 2002 2003 2004 2005 2006 2007 2008 2009
8.28 8.31
11
10
9
8
7
6
6.13

8/6/2019 State Green Business Report 2011
http://slidepdf.com/reader/full/state-green-business-report-2011 59/66
stat f g bsss
2011
59
other areas of business use are lagging. For
example, despite the seeming ubiquity of theblue recycling bin in ofces nationwide, ofce
and writing papers remain the least-recycled.
This shortcoming is due in part to the contracts
that companies sign with waste haulers serv-
ing their ofces. These are generally long-term
agreements — some have been in place since
before recycling took on the prominence it now
holds — and changing these contracts can be a
daunting task.
In addition, education campaigns at home aswell as at the ofce are needed to continue
to increase recycling. The business-focused
nonprot Net Impact last year partnered with
Staples and International Paper, launching a
competition to develop new ideas and real-
world strategies to help companies increase
recycling rates. AF&PA hands out annual recy-
cling awards, recognizing companies, commu-
nities, and schools for their efforts to improve
recycling. Continental Airlines landed the 2010
business award; Hewlett-Packard, Boise, andGiant Eagle are among previous winners.
In addition to the environmental benets of
sending fewer tons of paper to landlls, there’sa growing economic incentive. The recession
shredded the recovered pulp market, thanks
to the overall drop in demand for paper, but the
lull in that market was short-lived, with demand
already at or above pre-crash levels.
What’s more, demand is likely to grow geometri-
cally as the booming economies of India and
China become, well, paper tigers.
The biggest question looming over paper has to
do with the same question looming over mostgreen business issues: climate legislation. At
the 2010 COP16 climate summit in Cancún, the
United Nations took a step forward on funding
and supporting REDD+ — for Reducing Emissions
from Deforestation and Forest Degradation
— moving sustainable forest management
practices up the agenda, potentially impacting
world paper and pulp supplies. Should a bind-
ing climate agreement or U.S. climate law take
effect, the methods used to address the carbon
impacts from forests could compel companiesto recycle every last scrap.
45%
55%
65%
200920072005200320011999
45%
63%
pApER RECovERY RAtEPercentage recovered of total paper supply, 1999-2009
Source: American Forest & Paper Association
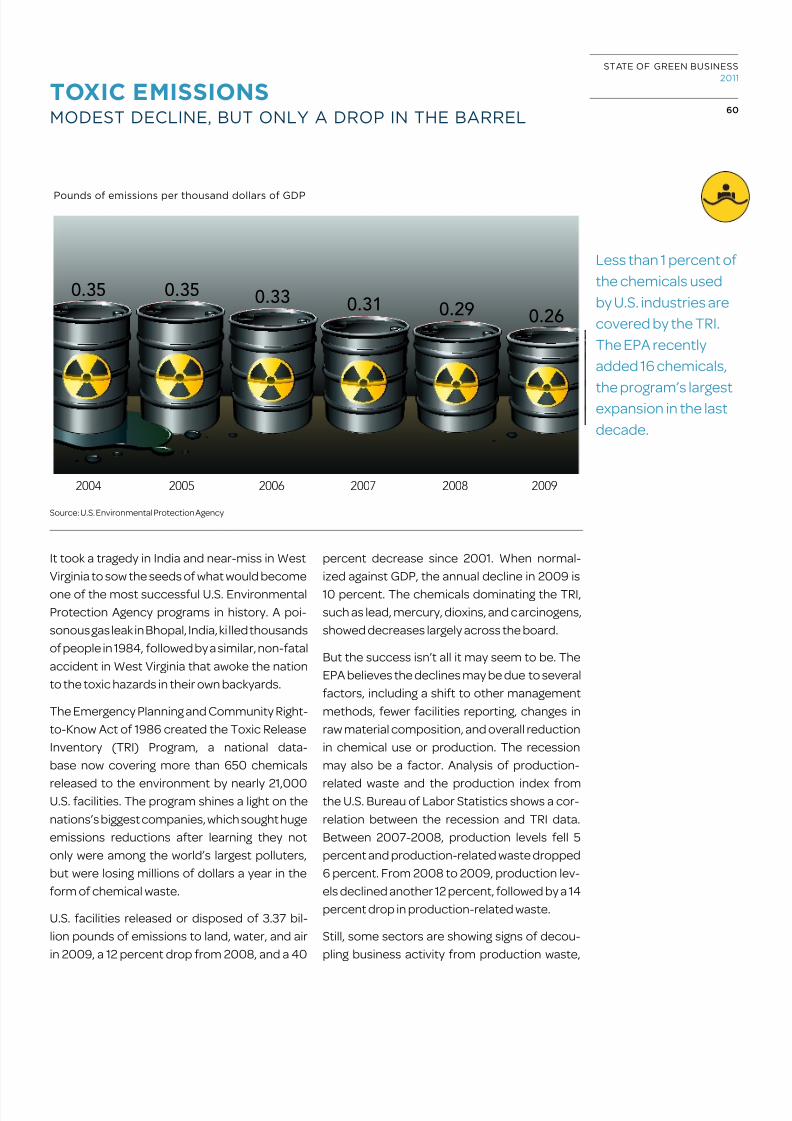
8/6/2019 State Green Business Report 2011
http://slidepdf.com/reader/full/state-green-business-report-2011 60/66
stat f g bsss
2011
60
toxiC Emissionsdst dCl, bt lY a dp th bal
It took a tragedy in India and near-miss in West
Virginia to sow the seeds of what would become
one of the most successful U.S. Environmental
Protection Agency programs in history. A poi-
sonous gas leak in Bhopal, India, ki lled thousands
of people in 1984, followed by a similar, non-fatal
accident in West Virginia that awoke the nation
to the toxic hazards in their own backyards.
The Emergency Planning and Community Right-
to-Know Act of 1986 created the Toxic Release
Inventory (TRI) Program, a national data-
base now covering more than 650 chemicals
released to the environment by nearly 21,000U.S. facilities. The program shines a light on the
nations’s biggest companies, which sought huge
emissions reductions after learning they not
only were among the world’s largest polluters,
but were losing millions of dollars a year in the
form of chemical waste.
U.S. facilities released or disposed of 3.37 bil-
lion pounds of emissions to land, water, and air
in 2009, a 12 percent drop from 2008, and a 40
percent decrease since 2001. When normal-
ized against GDP, the annual decline in 2009 is
10 percent. The chemicals dominating the TRI,
such as lead, mercury, dioxins, and carcinogens,
showed decreases largely across the board.
But the success isn’t all it may seem to be. The
EPA believes the declines may be due to several
factors, including a shift to other management
methods, fewer facilities reporting, changes in
raw material composition, and overall reduction
in chemical use or production. The recession
may also be a factor. Analysis of production-
related waste and the production index fromthe U.S. Bureau of Labor Statistics shows a cor-
relation between the recession and TRI data.
Between 2007-2008, production levels fell 5
percent and production-related waste dropped
6 percent. From 2008 to 2009, production lev-
els declined another 12 percent, followed by a 14
percent drop in production-related waste.
Still, some sectors are showing signs of decou-
pling business activity from production waste,
Source: U.S. Environmental Protection Agency
poun o emiion er oun or o gdp
Less than 1 percent of
the chemicals used
by U.S. industries are
covered by the TRI.
The EPA recently
added 16 chemicals,
the program’s largestexpansion in the last
decade.
2004 2005 2006 2007 2008 2009
0.35 0.350.33
0.31 0.290.26
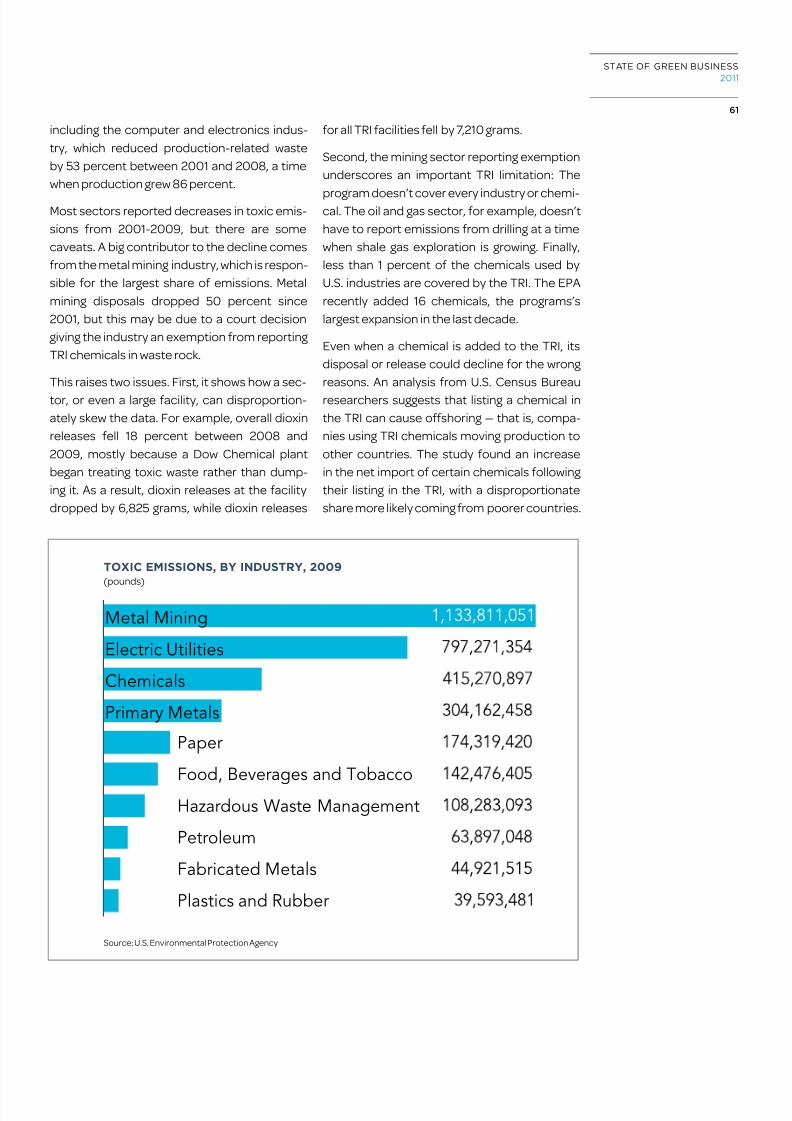
8/6/2019 State Green Business Report 2011
http://slidepdf.com/reader/full/state-green-business-report-2011 61/66
stat f g bsss
2011
61
including the computer and electronics indus-
try, which reduced production-related waste
by 53 percent between 2001 and 2008, a time
when production grew 86 percent.
Most sectors reported decreases in toxic emis-
sions from 2001-2009, but there are some
caveats. A big contributor to the decline comes
from the metal mining industry, which is respon-
sible for the largest share of emissions. Metal
mining disposals dropped 50 percent since
2001, but this may be due to a court decision
giving the industry an exemption from reporting
TRI chemicals in waste rock.
This raises two issues. First, it shows how a sec-
tor, or even a large facility, can disproportion-
ately skew the data. For example, overall dioxin
releases fell 18 percent between 2008 and
2009, mostly because a Dow Chemical plant
began treating toxic waste rather than dump-
ing it. As a result, dioxin releases at the facility
dropped by 6,825 grams, while dioxin releases
for all TRI facilities fell by 7,210 grams.
Second, the mining sector reporting exemption
underscores an important TRI limitation: The
program doesn’t cover every industry or chemi-cal. The oil and gas sector, for example, doesn’t
have to report emissions from drilling at a time
when shale gas exploration is growing. Finally,
less than 1 percent of the chemicals used by
U.S. industries are covered by the TRI. The EPA
recently added 16 chemicals, the programs’s
largest expansion in the last decade.
Even when a chemical is added to the TRI, its
disposal or release could decline for the wrong
reasons. An analysis from U.S. Census Bureau
researchers suggests that listing a chemical in
the TRI can cause offshoring — that is, compa-
nies using TRI chemicals moving production to
other countries. The study found an increase
in the net import of certain chemicals following
their listing in the TRI, with a disproportionate
share more likely coming from poorer countries.
Plastics and Rubber
Fabricated Metals
Petroleum
Hazardous Waste Management
Food, Beverages and Tobacco
Paper
Primary Metals
Chemicals
Electric Utilities
Metal Mining
toxiC Emissions, BY indUstRY, 2009(pounds)
Source: U.S. Environmental Protection Agency

8/6/2019 State Green Business Report 2011
http://slidepdf.com/reader/full/state-green-business-report-2011 62/66
stat f g bsss
2011
62
toxiCs in mAnUFACtURingll th fds hlp t t th td?
The latest data on the use of toxic chemicals by
U.S. companies shows a promising downward
trend, but even that relatively good news serves
to illustrate the shortcomings of the system.
Although the intensity of use of the 27 hazard-ous chemicals we measure as a proxy for overall
toxics in manufacturing has declined for the sec-
ond year in a row — down nearly 15 percent since
a 2007 peak — these are a tiny fraction of the
84,000-plus chemicals licensed for use in the
U.S., most of which we know little about in terms
of their health and environmental impacts.
This piecemeal approach to addressing toxics
in products amounts to a game of legislative
Whac-a-Mole: Find lead in children’s jewelry?
Pass a law setting limits on its use, as California
did in 2006. Cadmium later found in the same
products? Pass another law. As a result, a patch-
work of legislation is spreading across the U.S.,
in part spurred by bisphenol A, the poster child
for toxic chemicals in consumer goods. In the
wake of news about BPA’s prevalence in a wide
range of products, 17 states are working on legis-
lation to ban BPA, either entirely or from specic
products, while the U.S. EPA listed it as a chemi-
cal of concern, the rst step on an action plan to
regulate it.
The EPA seems to be stepping up its work on
toxics, moving forward in 2010 with a projectto test some of the most-used chemicals for
toxic impacts, and the continuing growth of its
ToxCast program to more quickly predict nega-
tive impacts from chemicals. The U.S. govern-
ment’s role in regulating chemicals looms large
for 2011, as Congress considers taking up a long-
overdue reform of the Toxic Substances Control
Act (TSCA), the overarching toxics law in the U.S.
Recent history shows that legislation and gov-
ernment action can have a huge impact on the
issue of toxics in products. For example, the
Consumer Product Safety Improvement Act,
signed into law in 2008, set a steadily decreasing
limit for the amount of lead in products, as well
as for other chemicals of concern. Two years
after its implementation, NGOs testing prod-
ucts for lead have found near-universal compli-
ance with the law, far above what you’d nd with,
say, speed limits.
Source: U.S. Environmental Protection Agency
The piecemeal
approach to
addressing toxics in
products amounts to
a game of legislative
Whac-a-Mole: Find
lead in children’s
jewelry? Pass a law
setting limits on its
use. Cadmium later
found in the same
products? Pass
another law.
18.4918.94
19.28
23.57
22.26
2004 2005 2006 2007 2008 2009
20.10
ton o eece oic cemic ue er iion or o gdp

8/6/2019 State Green Business Report 2011
http://slidepdf.com/reader/full/state-green-business-report-2011 63/66
stat f g bsss
2011
63
The work done by activist groups has proven
critical to progress on reducing toxics. Whether
the news is about nding cadmium in drinking
glasses, lead in reusable shopping bags, or form-
aldehyde in beauty products, the alarms more
often than not have been sounded by nonprof-
its or private citizens, spurring governments and
companies to take action.
On the positive side, green chemistry continued
to grow in prominence, with companies and uni-
versities steadily expanding their research into
benign alternatives to chemicals in use today.
The EPA’s Design for Environment label showed
steady growth, as the chart below shows. The
certication amounts to an annual reduction of 600 million pounds a year of chemicals of con-
cern in consumer products. Large retailers are
driving the change, notably Home Depot’s “Eco
Options” label and the private labels of Walmart,
Safeway, and Giant Foods.
The brightest green news of 2010, however, lost
a bit of its shine as the year wound down: The
California Green Chemistry Initiative was sent
back to the drawing board in December after
years of development. The brakes were applied
in the wake of last-minute changes to the law
that supporters said would render meaning-
less a potentially groundbreaking effort to test
chemicals for toxicity and close the information
gap on what we don’t know about the impacts of
chemicals in everyday use.
The year ahead will bring more challenges and
opportunities in the world of toxics regulation.
Will the administration of Gov. Jerry Brown
revive and redirect California’s Green ChemistryInitiative? Will Congress start work on TSCA
reform, and will it have teeth? Companies will
continue to target the toxics in their products,
but a scattershot approach is the most likely
solution for the coming year.
500
1000
1500
2000
2500
20102009200820072006200520042003
dEsign FoR EnviRonmEnt-CERtiFiEd pRodUCtsNumber certied per year, 2003-2010
Source: U.S. Environmental Protection Agency

8/6/2019 State Green Business Report 2011
http://slidepdf.com/reader/full/state-green-business-report-2011 64/66

8/6/2019 State Green Business Report 2011
http://slidepdf.com/reader/full/state-green-business-report-2011 65/66
stat f g bsss
2011
65
Agriculture
Wood Products
Glass
MiningPaper
Rening
Aluminum
Iron & Steel
Bulk Chemicals
Cement 53.68
30.20
22.71
16.51
16.25
14.959.54
4.07
3.82
9.21
AvERAgE EnviRonmEntAl disClosURE, BY sECtoR(percentage of data disclosed)
Source: Trucost
reports, press accounts, company presenta-
tions, and other means. And some information
isn’t disclosed at all. In those cases, Trucost lls
in the gaps through its own proprietary modeling
and calculations, using industry averages and
adjusting for size, sector, and other factors.
Along the way, Trucost also has tracked overall
disclosure and transparency trends: How much
of their material environmental impacts they
are disclosing — and how many companies dis-
close nothing at all.
Both trends are positive, if gradual. Between
2007 and 2009, the latest reporting periods,
the percentage of data disclosed by compa-
nies increased from 31 percent to 39 percent,
while the number of non-disclosing compa-
nies decreased from 53 percent to 44 percent.
These are promising trends, though we’re only
marginally impressed. That nearly half of com-
panies are still not disclosing any information is
troubling in a world that increasingly demands
“radical transparency” of companies.
“Overall, companies are improving their trans-
parency, and are disclosing more of the envi-
ronmental impacts that are most signicant to
them,” notes James Salo, Trucost’s senior vice
president of Strategy and Research.
According to Salo, companies that disclose the
most are ones that have historic regulatory pres-
sures, such as utilities and chemical companies,
or those that have high brand presence, such as
telecoms. The sectors with the weakest trans-
parency are all in the service sector — nancial
services, retail, and media — businesses not tra-
ditionally linked to spewing smokestacks, drain-
pipes, and Dumpsters.
Of course, service-sector companies — which
also include transportation, hospitality, real
estate, and health care — can have large envi-
ronmental impacts. It will be interesting to watch
this indicator over time, as these sectors inevi-
tably come under scrutiny, to see whether and
how they respond in a world where accountabil-
ity and transparency become the rule.

8/6/2019 State Green Business Report 2011
http://slidepdf.com/reader/full/state-green-business-report-2011 66/66
stat f g bsss
2011
66
Dening and accelerating the business of sustainability.
According to Accenture’s survey of 750 CEOs, we are entering “a new age in sustainability” in which 93% ofglobal CEOs see sustainability as important to their future success. GreenBiz Group is an integrated media
company that has placed itself at the nexus of this business movement, providing a wealth of tools, resources
and knowledge to help companies capitalize on the sustainability opportunity.
We accomplish this through the four pillars of our business.
Our acclaimed websites and newsletters are daily
“must reads” for sustainable business professionals.
We Tell the Stories
Our peer-to-peer learning platforms create valuable
opportunities for professionals — both online and off.
We Build the Network
Our conferences and forums bring together
thought leaders and professionals to share trends,
technologies, and leadership practices.
We Advance the Profession
Our backgrounders, reports and analysis provide the
essential information professionals need to make
intelligent decisions.
We Provide the Insight