State Bank of Pakistan - sbp.org.pk CENTRAL BOARD OF DIRECTORS Syed Salim Raza Governor & Chairman...
121
THE STATE OF PAKISTAN’S ECONOMY Third Quarterly Report for the year 2009-2010 of the Central Board of State Bank of Pakistan State Bank of Pakistan
Transcript of State Bank of Pakistan - sbp.org.pk CENTRAL BOARD OF DIRECTORS Syed Salim Raza Governor & Chairman...

THE STATE OFPAKISTAN’S ECONOMY
Third Quarterly Reportfor the year 2009-2010 of the
Central Board of State Bank of Pakistan
State Bank of Pakistan

CENTRAL BOARD OF DIRECTORS
Syed Salim Raza Governor & Chairman
Mr. Salman Siddique Member
Mr. Kamran Y. Mirza Member
Mr. Zaffar A. Khan Member
Mirza Qamar Beg Member
Mr. Asad Umar Member
Mr. Waqar A. Malik Member
Mr. Aftab Mustafa Khan Corporate Secretary

LETTER OF TRANSMITTAL
State Bank of PakistanKarachi.June 01, 2010
Dear Mr. Chairman,
In accordance with Section 9A(f) of the State Bank of PakistanAct, 1956, I submit herewith the Third Quarterly Report for the year2009-2010 of the Central Board of Directors of the State Bank ofPakistan on the State of the Economy.
With best regards,
Mr. Farooq H. NaekChairmanSenateIslamabad
Yours sincerely,
(SYED SALIM RAZA)Governor

LETTER OF TRANSMITTAL
State Bank of PakistanKarachi.June 01, 2010
Dear Madam Speaker,
In accordance with Section 9A(f) of the State Bank of PakistanAct, 1956, I submit herewith the Third Quarterly Report for the year2009-2010 of the Central Board of Directors of the State Bank ofPakistan on the State of the Economy.
With best regards,
Dr. Fehmida MirzaSpeakerNational AssemblyIslamabad
Yours sincerely,
(SYED SALIM RAZA)Governor

The Team
Team Leader
Mohammad Mansoor Ali [email protected]
Researchers
Asma Khalid [email protected]
Bilal Khan [email protected]
Dr. Mian Farooq Haq [email protected]
Farrukh Abbas Mirza [email protected]
Fatima Khaliq [email protected]
Fayyaz Hussain [email protected]
Mohib Kamal Azmi [email protected]
Moinuddin [email protected]
Muhammad Farooq Arby [email protected]
Muhammad Idrees [email protected]
Muhammad Laiq [email protected]
Muhammad Naqi Akbar [email protected]
Muhammad Sharif Khawaja [email protected]
Muhammad Usman Abbasi [email protected]
Muhammad Zeb [email protected]
Naila Iram [email protected]
Sabahat [email protected]
Sabina Khurram Jafri [email protected]
Sadia Bader [email protected]
Saghir Pervaiz Ghauri [email protected]
Shabbir Ahmad [email protected]
Syed Zulqernain Hussain [email protected]
Tamkinat Rauf [email protected]
Tosif Hussain [email protected]
Waseem Fazal ur Rehman [email protected]
Zahid Hussain [email protected]
Editing
Umar Siddique [email protected]
Formatting
Fatima Khaliq [email protected]
Imran Naveed Khan [email protected]
Shabbir Ahmad [email protected]
Tamkinat Rauf [email protected]

Contents Page No.
1. Overview and Economic Outlook 1
1.1
Overview 1
1.2
Looking Forward 4
1.3
Executive Summary 6
2. Real Sector 11
2.1
Agriculture Sector Performance 14
2.2
Large Scale Manufacturing 24
2.3
Services 28
3. Prices 31
3.1
Overview 31
3.2
Consumer Price Index 32
3.3
Wholesale Price Index 38
3.4
Sensitive Price Indicator 40
3.5
Global Inflation Scenario 41
4. Money & Banking 45
4.1
Monetary Policy 45
4.2
Developments in Monetary Aggregates 47
4.3
Private Sector Credit 51
4.4
Deposit Mobilization 53
5. Fiscal Developments 59
5.1
Overview 59
5.2
Domestic Budgetary Financing 59
5.3
FBR Tax Collection 61
5.4
Domestic Debt 64
6. External Sector 69
6.1
Overview 69
6.2
Current Account Balance 71
6.3
Financial Account 77
6.4
Services Trade 82
6.5
Foreign Exchange Reserves 90
6.6
Exchange Rate 92
6.7
Trade Account 94
Special Section: Low-Income Housing in Pakistan: Opportunities
and Challenges
107
Acronyms 115

1 Overview and Economic Outlook
1.1. Overview Despite various economic and social challenges, with the passage of months, it
can be said that the country’s macroeconomic environment has improved. The
April 2010 inflation of 13.3 percent YoY implies that average annual inflation for
FY10 will be close to 12
percent; significantly lower
than 20.8 percent for the
previous year. The current
account deficit has also fallen
sharply (see Table 1.1) with
foreign exchange reserves
improving, and, although the
fiscal deficit is expected to be
above target, borrowings from
the central bank have so far,
been relatively low, relative to
past years. The resulting
improvement in business
confidence, together with
reasonable harvests,
expansionary fiscal stance, and
a small recovery in the global
economy have fostered growth.
in FY10. Real GDP growth for
FY10 is estimated at 4.1
percent against the annual target for 3.3 percent.
But these macroeconomic silver linings accompany clouds that carry considerable
risks to the fragile recovery currently underway. Despite the deceleration in
inflation it remains high, and there has been resurgence in inflation in recent
months. Increases in international commodity prices (particularly oil) threaten to
accelerate this rising trend, and raise the risk that the external account imbalances
will also increase in months ahead. The latter risk is all the more worrying given
that the country is already facing problems in financing a current account deficit
that is substantially lower than in the previous year. Similarly, if the fiscal deficit
continues to increase, the risks to macroeconomic stability will rise, particularly if
there is higher recourse to budgetary borrowings from the central bank and if the
Table 1.1: Selected Economic Indicators
FY08 FY09 FY10
Growth rate (percent)
LSM Jul-Mar 5.1 -7.4 4.4
Exports (fob) Jul-Apr 9.9 -3.4 8
Imports (cif) Jul-Apr 28.3 -9.8 -2.8
Tax revenue (FBR) Jul-Mar 13.9 19.9 11.6
CPI (12 mma) Apr 9.8 22.0 11.8
Private sector credit Jul-Apr 15.5 1.5 5.0
Money supply (M2) Jul-Apr 9.3 2.4 8.1
billion US Dollars
Total liquid reserves1 end-Apr 12.4 11.6 14.9
Home remittances Jul-Apr 5.3 6.4 7.3
Net foreign
investment Jul-Apr 3.8 2.2 1.7
percent of GDP2
Fiscal deficit Jul-Dec 3.5 2.0 2.7
Trade deficit Jul-Apr 10.0 8.7 6.9
Current a/c deficit Jul-Apr 6.7 5.5 1.7 1. With SBP & commercial banks. 2. Based on full-year GDP in the denominator. For FY10,
provisional estimates by FBS full year GDP has been used.

The State of the Pakistan’s Economy
2
use of quasi-fiscal operations is not contained. It should be noted that although
budgetary borrowings from the central bank have so far been contained in FY10
(relative to levels in preceding years), the resulting rise in government sector
credit demands means that this has been at the risk of seriously crowding out
private investment. Thus, as public sector investment has reportedly also been
curtailed in H2-FY10, this raises questions about the medium-term sustainability
of the economic recovery.
For example, although large scale manufacturing (LSM) sector witnessed a better
than expected growth during the first eight months of FY10, this has been made
possible by capacities built up by investments in yester years. Thus, as business
confidence improved and aggregate demand increased, LSM was in a position to
respond, despite continuing energy shortages, law & order issues as well as
financial constraints. However, if aggregate demand further gathers pace, the
slowdown in investments could potentially constrain future output growth, and
add to pressures on the external account and inflation.
In other words, the increase in the fiscal deficit FY08 onwards poses risks to
macroeconomic stability. This impact of the fiscal deficit is compounded by the
substantial increase in quasi-fiscal activities in recent years that have not only
contributed to the build-up of inter-locking debt chains (circular debt) in the
energy and agri-commodity sectors, but also raised the financial costs for all
borrowers in the economy, restricting output growth.
Increased risk averseness of banks played an important role in slower expansion
of credit to the private sectors during FY09. However, banks’ ability to sustain
this trend into FY10 was probably assisted by the ever-rising demand from the
government sector for bank
borrowings. A look at the
pattern of the growth in broad
money (M2) during the two
years clearly testifies this
argument. A substantial part of
the growth in broad money
during FY10, in particular, is
principally due to borrowings by the government sector (see Table 1.2).
The existing fiscal rigidities meant that an increase in the full year fiscal deficit
was probably unavoidable in FY10 given the additional need for army operations
against militants, and to help the resulting internally displaced population.
However, even after excluding defense services, the growth in current spending
Table 1.2: Contribution of Government Sector to M2 growth
(Jul-Apr)
flows in billion Rupees, growth in percent
Flows Growth
FY09 FY10 FY09 FY10
Broad money (M2) 114.1 414.0 2.4 8.1 of which
Government borrowing 315.2 325.0 20.9 16.0
Credit to private sector 43.4 144.3 1.5 5.0

Third Quarterly Report for FY10
3
for H1-FY10 is high at 15.7 percent YoY. Moreover, the impact of the high
fiscal deficit was compounded by shortfall in external receipts. The latter
contributed to lower liquidity in the banking system and problems in financing
the current account deficit.
The central bank continued to
inject liquidity in the banking
system during most of the year
to mitigate part of the impact of
the pressures from fiscal and
quasi-fiscal operations, but
overnight rates have remained
close to the ceiling during most of the fiscal year. Similarly, despite a sharp
decline in the current account deficit, the overall external account position
remains vulnerable, since financing receipts have also plummeted (see Table
1.3). It should be remembered that the sustainability of the current account
depends on a country’s ability to finance it (preferably from the non-debt creating
inflows).
Indeed, the risks to macroeconomic stability from the fiscal and external deficits,
as well as resurgence in CPI inflation were key parameters in the SBP inability to
further ease its monetary stance. Ironically, it was the government’s decision to
lower fiscal imbalances and reduce allocational inefficiencies that proved to be a
key contributor to this revival of inflation. The reduction in subsidy on power
and upward adjustment in the domestic prices of key fuels following rising
international prices was immediately felt in the domestic economy.
In particular, the impact of rising fuel prices on transportation was immediately
seen in higher prices of food commodities. Consequently, headline inflation rose
to 13.3 percent in April 2010. While sharply lower than the 17.2 percent seen in
the same month of the preceding year, it was nonetheless high. Moreover, the
impact was greatest on the purchasing power of low-income groups due to
persistent high food inflation. The significant role of essential energy and food
prices in the current CPI inflation uptrend also raises the risk of higher second
round inflationary impacts.
The latter could be further compounded if imported inflation becomes a greater
concern. Fortunately the substantial assistance from the IMF has supported an
increase in the country’s foreign exchange reserves, and underpinned the relative
stability of the exchange rate. Pakistan has to move aggressively to attract fresh
Table 1.3: External Accounts
billion US Dollar
Jul-Apr FY10
FY09 FY10 Q1 Q2
Jan-
Apr
A-Current account balance
-9.0 -3.1 -0.6 -1.5 -0.9
B-Financial/capital
balance 4.5 3.9 2.8 0.5 0.7

The State of the Pakistan’s Economy
4
investment by implementing additional reforms to increase economic efficiency
and improve the business environment.
Steps to increase investment must also be accompanied by measures to foster
savings. In this regard, SBP is looking to increase the access of people to the
financial system, and also introducing projects to improve the transmission of
policy rates to savers. The greater impact is likely to be through improving
institutional savings, for which there is an urgent need to reform the institutional
structure of pension and provident funds in the country, to foster the expansion of
the pool of long-term savings.
1.2 Looking Forward Initial provisional estimates by
FBS are in conformity with the
earlier SBP assessment of a
rebound in real GDP growth; it
is estimated at 4.1 percent for
FY10 from an anemic 1.2
percent in the preceding year.
The recovery was contributed
mainly by above target growth
in the livestock and LSM sub-
sectors as well as the services
sector.
As far as inflation is concerned,
resurgence in inflationary
pressures during H2-FY10 was
anticipated. However, the
impact of adjustment in power
tariff was further fueled by
sharp rise in international prices of oil, cotton, and metals. In contrast, benefits of
a fall in international prices of wheat were not passed on to the consumers,
ironically, as a result of government interventions in market mechanisms. In
view of these, SBP forecasts suggest that annual average headline CPI inflation
will be slightly higher than estimated earlier, falling in the range of 11.5 – 12.5
percent during FY10 (see Table 1.4). The upward revision in the forecast range
indicates that inflationary pressures strengthened in the economy.
Encouragingly, projections for current account deficit indicate an improved
picture, with the deficit now expected to fall even lower, in the range of 2.2 - 2.8
Table 1.4: Projections of Major Macroeconomic Indicators
FY09 FY10
Annual plan
targets
SBP
projections
growth rates in percent
GDP* 1.2R 3.3 4.1
Average CPI inflation 20.8 9.0 11.5 - 12.5
Monetary assets (M2) 9.6 - 13.5 – 14.5
billion US Dollars
Workers’ remittances 7.8 7.0 8.5 – 9.0
Exports (fob-BoP data) 19.1 19.9 19.5 – 20.0
Imports (fob-BoP data) 31.7 28.7 31.0 - 31.5
percent of GDP
Fiscal deficit 5.3 4.9 5.1 - 5.6
Current account deficit 5.7 5.3 2.2 – 2.8
Note: Targets of fiscal and current account deficit to GDP ratios
are based on nominal GDP in the budget document for FY10, while their projections are based on provisional estimates of
nominal GDP for the year by FBS. R: Revised; (*): Show provisional estimates by FBS; retrieved on May 21, 2010 from
http://www.statpak.gov.pk/depts/fbs/statistics/national_accounts/
national_accounts.html

Third Quarterly Report for FY10
5
percent of GDP during FY10, substantially lower from earlier forecasts of 3.2-3.8
percent of GDP and actual deficit of 5.7 percent of GDP seen in FY09. This
improvement is mainly due to an impressive performance of exports and workers’
remittances.
However, the fiscal performance remained lackluster. SBP estimates for fiscal
deficit have been revised upwards to 5.1 - 5.6 percent of GDP. Although the
main factor for pressures on fiscal accounts is rising current expenditure, a low
tax to GDP ratio is also a source of concern. Implementation of value added tax
(VAT) could be an appropriate remedy if supported by appropriate systems to
curtail misuse of VAT refunds. Even though tax collection is likely to drop
during the initial phase of implementation, tax collection and documentation in
the economy will improve in later years.
Equally critical is the efficient use of taxpayers’ money. Government has to
reduce quasi fiscal activities and aggressively privatize loss making public sector
commercial entities. Improvement in governance, institution building and
effective enforcement of investor friendly laws are prerequisites for sustainable
growth. Both good governance and effective legislation could attract substantial
investment, which is needed to exploit the potential of the economy and
accelerate employment generation. Such a structural transformation is needed to
accelerate employment generation in the economy.
For example, progress is needed towards protecting intellectual property rights
(IPRs) and enforcing contracts, in order to encourage innovation. While
recognition and enforcement of intellectual property rights is a concern globally
(particularly in emerging markets), Pakistan lags behind many countries.
Similarly, the domestic construction industry could be encouraged, if tenancy
laws could be reformed such that these are neither biased towards tenants nor
distinctly in favor of landlords. Adoption of best international practices regarding
tenancy laws may attract massive investment in housing sector and help bridge
the gap between demand and supply.
Finally, the provision of basic utilities and infrastructure is equally important.
While LSM has grown despite energy shortages, it is quite likely that the impact
on small & medium manufacturers and traders has been quite severe, with
consequent loss of output and employment. The impact of power outages on
SMEs was compounded with the rising prices of key fuels and non-availability of
gas. The roots of energy shortages lie, in part, in inappropriate pricing and an
inefficient distribution system. The continued provision of untargeted subsidies
generated a cobweb of debt in the energy sector, with negative repercussions for

The State of the Pakistan’s Economy
6
output growth. For example, as a conseuqunce of a debt build-up domestic
refineries and IPPs are working below capacity. On a broader note there is a need
for lower direct government intervention in market prices, with market structure
problems being handled by independent regulatory authorities such as the
Competition Commission of Pakistan.
1.3 Executive Summary
Real Sector
Agriculture
Despite water shortages and unfavorable weather conditions during FY10,
agriculture sector is expected to achieve a reasonable growth of 3.0 percent; close
to the average growth of the last 10 years. Contrary to expectations that growth
by minor crops would be strong due to switch over of area from major to minor
crops, recent information suggests that most of the minor crops also suffered from
lower winter rains during FY10.
One positive was that adequate fertilizer and agri-credit was available to
undertake agri-activities during FY10. Another positive development during
FY10 was a significant contribution of agriculture in exports. This resulted in
relatively higher domestic prices of most surplus agri-produce, and would
encourage farmers to invest to increase output.
Large-Scale Manufacturing (LSM) After posting a modest recovery in H1-FY10, LSM growth gathered further pace
in Q3-FY10. Re-entry of commercial banks in consumer financing helped
strengthen the demand for consumer durables, especially automobiles, despite
rising cost pressures. Moreover, export-based industries, particularly value-added
textile, finally picked-up in response to improved global demand as well as
domestic policies.
The rising demand was absorbed by the available capacities in LSM sector
without entailing any significant pressure on prices. The trend in capacity
utilization in Jul-Feb FY10, however, was mixed; it increased in case of
automobiles, electronics and cement sectors, and declined in petroleum and steel
mainly due to liquidity constraints. Nonetheless, it appears that despite the
available capacities in many sectors, sustaining a decent growth in LSM, going
forward, could be constrained due to energy insufficiency in the country.
In specific terms, supply of energy will be a major determinant of capacity
utilization going forward. Particularly, industrial energy mix is progressively

Third Quarterly Report for FY10
7
shifting towards natural gas, a fuel that is also being increasingly demanded by
CNG, household, and power sectors. The insignificant gas exploration activity in
the country during the last few years means that the demand-supply gap has
widened in recent years, which is restricting capacity utilization in many
industries, especially in the small-scale sector. In the short run, there seems little
hope of improvement, though rigorous gas and electricity conservation measures
may offer some respite. However, in the longer-run, the construction of dams and
utilization of untapped domestic coal and gas resources will be crucial to ensure
sustainable industrial growth.
Prices
Headline CPI inflation (YoY) rose to 13.3 percent by April 2010, slightly higher
than the 12.9 percent in the preceding month, but significantly higher than the
short-term low of 8.9 percent in October 2009. Core inflation measured by 20%
trimmed mean remained unchanged during April 2010. However, core inflation
measured by non-food non-energy (NFNE) increased to 10.6 percent during April
2010 compared with 9.9 percent in March 2010, showing that inflationary
pressures were relatively broad-based in April 2010.
The increase in inflation in recent months is attributed to a number of factors,
such as: (a) higher international commodity prices, particularly crude oil, metals,
pulses and cotton; (b) upward adjustment in electricity tariffs and administered
domestic fuel prices; (c) relatively weak harvests amid water shortages coupled
with strong growth in exports of vegetables, fruits, livestock, etc., (d)
expansionary fiscal stance; and (e) recovery in domestic economy.
Money and Banking
The SBP kept its policy rate unchanged at 12.5 percent in the last two consecutive
monetary policy decisions; in January and March 2010.1 A cautious approach to
easing the policy rate was adopted to strike a balance between supporting the
recovery in aggregate demand while guarding against the re-emergence of
macroeconomic imbalances, including a resurgence of inflation.
The recent build-up in inflationary momentum largely reflecting the power tariff
rationalization drive was compounded by global commodity price pressures. The
situation was exacerbated by considerable deficit monetization as the government
turned to the banking system to finance the rising deficit due to higher
1 The policy rate was cut by a cumulative 150 bps in H1-FY10; by 100 bps in August and 50 bps cut
in November 2010.

The State of the Pakistan’s Economy
8
expenditures amid elusive pledged foreign inflows. Resultantly, the government
breached the IMF’s March 2010 quarterly ceiling for deficit monetization.
In terms of monetary aggregate, M2 registered growth of 8.1 percent for Jul-Apr
FY10 compared with 2.4 percent in the corresponding period last year. The
improvement in M2 resulted from a robust growth in net domestic assets (NDA)
which grew by 9.8 percent during Jul-Apr FY10 against 8.3 percent growth in the
same period last year. On the other hand, net foreign assets (NFA) of the banking
system witnessed a moderate decline; contracting by 7.2 percent during Jul-Apr
FY10 compared with steep fall of 33.6 percent in the same period last year. In
line with monetary expansion, deposits of the banking industry staged a recovery.
They registered robust growth of 8.6 percent during Jul-Apr FY10, in stark
contrast to a contraction of 0.2 percent in the same period last year.
Fiscal Developments
The budgetary data for Q3-FY10 is not yet available, but some preliminary
information suggests that the fiscal sector remained under stress and the
government is likely to miss its budget deficit target. Although the FBR has
regained its revenue path in the third quarter of the year and non-tax revenue also
propped up by appropriation of SBP profit in a considerable amount and
realization of coalition support fund of US$ 349 million, the budget deficit is
expected to be higher than the target. This primarily because of higher than
budgeted public expenditures.
FBR improved its performance in the 3
rd quarter of the year with 26 percent
growth in the tax receipts. However, going forward, tax revenue target for FY10
will remain challenging as it would require a YoY growth of 37.6 percent during
Q4-FY10 in order to attain Rs 1.38 trillion tax collection (budget) target for the
year; compared with 5-year average tax revenue growth in the last quarter at 15.7
percent.
The aggregate government borrowing from domestic sources stood at Rs 535.3
billion during July-Mar FY10, which is significantly higher than the domestic
budgetary requirements in the corresponding period of FY09. With shortfall in
external borrowing for budgetary support, the widening budgetary imbalance was
predominantly financed from banking system during Jul-Mar FY10 raising risks
of crowding out of private investment.

Third Quarterly Report for FY10
9
External Sector
Balance of Payments
Aided by lower imports and sustained inflow of remittances, the current account
deficit during Jul-Apr FY10 remained significantly lower than in the
corresponding period last year. The impact of this improvement on overall
external balance was, however, limited due to considerable fall in capital and
financial account surplus during the period.
Apart from lower imports (accompanied with lower freight costs) and strong
increase in current transfers, YoY contraction in current account deficit during
Jul-Apr FY10 was also attributed to lower payments on account of repatriation of
dividends and interest on debt. Likewise, lower outflows from foreign exchange
companies and nominal increase in exports also contributed to this improvement
in current account deficit.
On the financing side, however, surplus in financial account declined noticeably
during Jul-Apr FY10 compared with the same period last year. This deterioration
was on account of both, fall in equity and loan inflows. As a result, overall
external account for Jul-Apr FY10 period recorded only a nominal surplus.
Country’s reserves, nevertheless, improved by US$ 2.2 billion owing largely to
one off SDR allocation by the IMF. Moreover, exchange rate also exhibited
relative stability; depreciating by 3.9 percent during Jul-Apr FY10 as compared to
16.2 percent in the same period last year.
Trade Account
Trade deficit contracted by 13.9 percent during Jul-Apr FY10 against 15.6
percent decline recorded in the same period last year. This contraction in the
trade deficit was the result of a 2.8 percent YoY fall in the imports, which was
complimented by an encouraging 8.0 percent YoY rise in the exports.
The contraction in import bill was due to lower input prices that reduced the
import bill in the first five months of FY10. This negative price impact more than
offset the rise in quantum of imports during almost the entire Jul-Apr period. The
recovery in exports was broadly led by food and textile group. In case of food
group, exports increased on account of rise in quantum of rice, fruits and
vegetables. Textile exports on the other hand, benefited from rise in the low
value added categories exports, that is, raw cotton and cotton yarn.
2 Real Sector
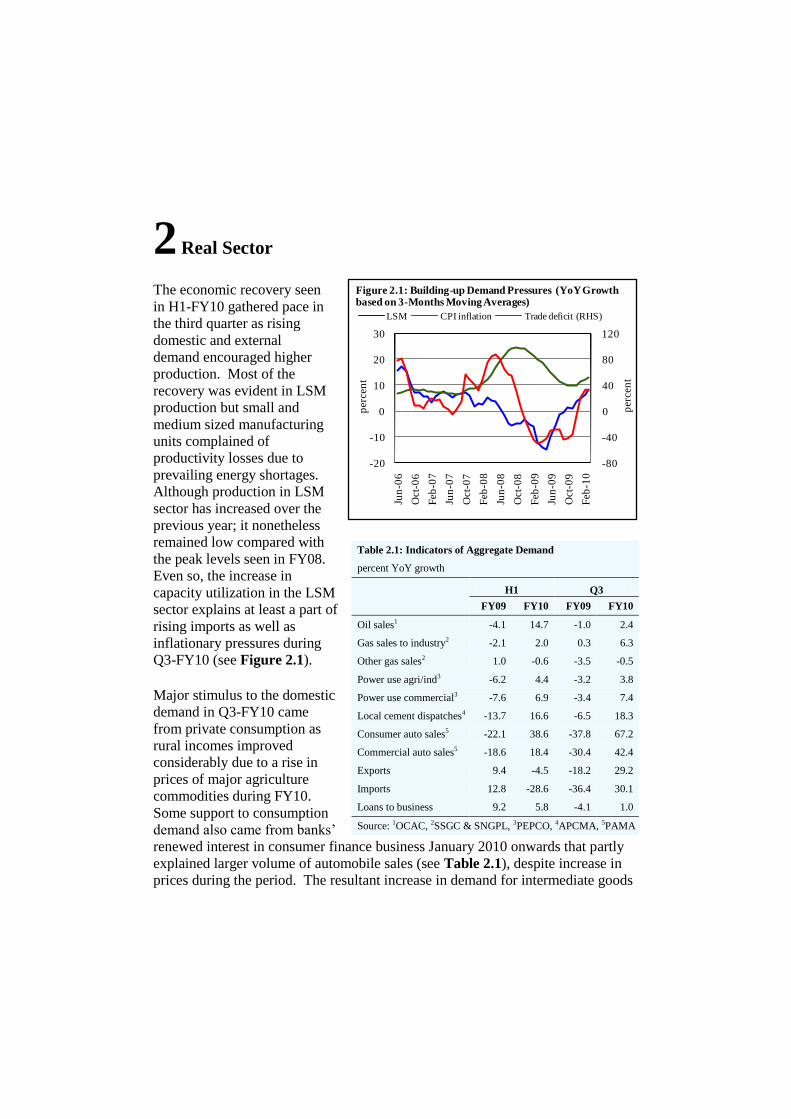
The economic recovery seen
in H1-FY10 gathered pace in
the third quarter as rising
domestic and external
demand encouraged higher
production. Most of the
recovery was evident in LSM
production but small and
medium sized manufacturing
units complained of
productivity losses due to
prevailing energy shortages.
Although production in LSM
sector has increased over the
previous year; it nonetheless
remained low compared with
the peak levels seen in FY08.
Even so, the increase in
capacity utilization in the LSM
sector explains at least a part of
rising imports as well as
inflationary pressures during
Q3-FY10 (see Figure 2.1).
Major stimulus to the domestic
demand in Q3-FY10 came
from private consumption as
rural incomes improved
considerably due to a rise in
prices of major agriculture
commodities during FY10. Some support to consumption
demand also came from banks’
renewed interest in consumer finance business January 2010 onwards that partly
explained larger volume of automobile sales (see Table 2.1), despite increase in
prices during the period. The resultant increase in demand for intermediate goods
Table 2.1: Indicators of Aggregate Demand
percent YoY growth
H1 Q3
FY09 FY10 FY09 FY10
Oil sales1 -4.1 14.7 -1.0 2.4
Gas sales to industry2 -2.1 2.0 0.3 6.3
Other gas sales2 1.0 -0.6 -3.5 -0.5
Power use agri/ind3 -6.2 4.4 -3.2 3.8
Power use commercial3 -7.6 6.9 -3.4 7.4
Local cement dispatches4 -13.7 16.6 -6.5 18.3
Consumer auto sales5 -22.1 38.6 -37.8 67.2
Commercial auto sales5 -18.6 18.4 -30.4 42.4
Exports 9.4 -4.5 -18.2 29.2
Imports 12.8 -28.6 -36.4 30.1
Loans to business 9.2 5.8 -4.1 1.0
Source: 1OCAC, 2SSGC & SNGPL, 3PEPCO, 4APCMA, 5PAMA
-80
-40
0
40
80
120
-20
-10
0
10
20
30
Jun
-06
Oct
-06
Feb
-07
Jun
-07
Oct
-07
Feb
-08
Jun
-08
Oct
-08
Feb
-09
Jun
-09
Oct
-09
Feb
-10
LSM CPI inflation Trade deficit (RHS)
per
cen
t
per
cen
t
Figure 2.1: Building-up Demand Pressures (YoY Growth based on 3-Months Moving Averages)

The State of the Pakistan’s Economy
12
was bolstered with improvement in corporate liquidity emanating from better
earnings and improved availability of bank loans.
The external demand also gathered pace further following sharp growth in Asian
economies and decent recovery in advanced economies in Q3-FY10. As a result,
country’s export of manufactured goods as well as agricultural products increased
sharply in Q3-FY10. Putting this in perspective, the export growth in Q3-FY10 is
the largest YoY export growth in any quarter since Q4-FY03. Notably, the
strengthening recovery in aggregate consumption appears to have lifted investors’
confidence as is evident from higher production of capital goods during Q3-FY10
and increase in demand for machinery in some sectors, including agriculture and
textiles.1
The domestic manufacturing sector was well placed to respond to rising demand
given the available capacities. As a result, the LSM sector grew by 9.6 percent in
Q3-FY10 which is the strongest quarterly growth since FY07. The higher Q3
growth took the cumulative growth in Jul-Mar FY10 to 4.4 percent as against a
decline of 7.4 percent in the same period of FY09. Most of the growth was seen
in consumer automobiles and electronics industries followed by a few exporting
industries including textiles, pharmaceuticals, etc. Thus, it appears that prevailing
energy shortages in the country did not obstruct LSM activities to a larger extent;
though it may be argued that a higher LSM growth rate could have been achieved
if not for energy shortages.
The apparent resilience of LSM
sector to energy shortages
stemmed mainly from the
composition of energy
requirement and its sources
(see Table 2.2). In specific
terms, 40-45 percent of the
industry’s energy requirements
are met through natural gas
(excluding gas used as
feedstock in fertilizer production). Furthermore, in terms of priority allocation,
gas supplies to industries where it is used as raw material (mainly fertilizers,
synthetic fiber, etc.), order above the supplies for power generation and transport
1 Capital goods industries registered a growth of 47.6 percent in Q3-FY10 compared with a decline
of 29.2 in Q3-FY09.
Table 2.2: Composition of Energy Consumption by Industrial
Sector (Excluding Gas for Feedstock)
percent share
FY06 FY07 FY08 FY09
Oil 14.7 12.7 7.9 8.4
Gas 40.4 41.5 40.1 44.7
Electricity 13.9 13.4 12.4 13.5
Coal 31.1 32.4 39.6 33.4
Source: HDIP

Third Quarterly Report for FY10
13
usage.2 As far as the general industries are concerned, the data for Q3-FY10
suggests a sharp rise in gas sales; 4.0 percent growth over Q3-FY09 sales and 1.2
percent growth over Q3-FY08 sales. Similarly, the energy from coal and oil
constitute another 40-45 percent of industrial requirements which is largely met
through imports. Thus productivity losses caused by power disruptions are limited
to that fraction of the industry that has direct reliance on the power network.3 For
large scale manufacturing, this effect was slightly mitigated by the fact that large
firms can cope with energy shortages by operating on expensive back-up supplies.
Furthermore, a few textiles, sugar, chemicals and steel industries are operating
with captive power plants that ensure sufficient availability to their own units.
In contrast, small scale manufacturing appears to have been hit hard by power
outages, and reportedly a large number of small manufacturing units closed down
with negative repercussions on exports and employment.4 Meanwhile, activities
in local construction industry strengthened further with stable building material
prices and growing housing demand, as is evident from higher growth in cement
dispatches during Q3-FY10 compared with Q3-FY09 as well as H1-FY10.
Thus, the overall industrial sector production comfortably surpassed the annual
target of 1.7 percent in FY10. The improvement in industrial production and
rising trade volumes has brightened the prospects of recovery in services sector.
Specifically, higher than expected growth in wholesale & retail trade, strong
contribution from public administration & defense, rising transport related
activities and increase in investments in telecommunications have lifted services
sector growth. The higher industry and services sector growth more than offset
slight weakening in agriculture sector during the year and, as a result, the GDP
growth rebounded strongly and rose to 4.1 percent in FY10.5 The GDP growth is
envisaged to increase further in FY11 with prospects of recovery in major crops,
induction of new capacities in major LSM sector and a little improvement in
energy supplies.
2 As per Natural Gas Allocation and Management Policy 2005. 3 Indirect effects include limited activities in commercial sectors, increase in consumer spending on
UPS/generators and limited use of household appliances, etc. 4 According to relevant business associations, 75 percent of ready-made garments, towels and bed-
wear exporting firms are small and medium sized. 5 Provisional estimates by FBS; retrieved on May 21, 2010, from
http://www.statpak.gov.pk/depts/fbs/statistics/national_accounts/national_accounts.html

The State of the Pakistan’s Economy
14
2.1 Agriculture Sector
Performance
Despite water shortages and
unfavorable weather conditions
during FY10, agriculture sector
achieved a reasonable growth
of 2.0 percent, against the target
of 3.8 percent (see Figure 2.2).
This growth is principally
driven by an impressive
performance by the livestock
sector. The growth by major
crops was hit hard by water
shortages and lower prices of
rice and sugarcane at sowing
time resulting in decline in area under important major crops except cotton (see
Figure 2.3). The impact of this
was compounded by a fall in
wheat and cotton yields. It is
important to note that decline in
wheat harvest would have been
much greater, if farmers had not
used balanced mix of nutrients
in FY10. In fact, relatively
lower prices of DAP helped
farmers to offset the impact of
water shortages.
Contrary to expectations that
growth by minor crops would
be strong due to switch over of
area from major to minor crops,
initial information suggests that most of the minor crops also suffered from lower
winter rains during FY10. On positive glimpse, strong domestic and external
demand for livestock, adequate availability of fertilizer and agri-credit during
FY10 helped the sector to contribute positively in overall economy.
Another positive development during FY10 was a significant contribution of
agriculture sector in exports. While, it resulted in relatively higher domestic
prices of most of the agri-produce, this will encourage farmers to continue efforts
to increase output.
-2
0
2
4
6
FY08 FY09 FY10
perc
en
t
Kharif* Rabi** Total
*:sugarcane, rice and maize , **:wheat and gram
Figure 2.3: Growth in Cultivated Area
-4
-2
0
2
4
6
8
FY
01
FY
02
FY
03
FY
04
FY
05
FY
06
FY
07
FY
08
FY
09
FY
10
E
perc
en
t
Figure 2.2: Growth in Agriculture
Agri growth Target
E: estimates

Third Quarterly Report for FY10
15
Cropping sector
Although FY10 wheat harvest
slightly declined compared to
the preceding year’s record
output, (see Table2.3) it is
better than expectations given
lower availability of irrigation
water and winter rains. Even
increased area under wheat
cultivation in Punjab (by 0.8
percent) failed to offset the
impact of lower yield. The
impact of water shortages was
further compounded by late
sowing amid delayed sugarcane
crushing, extended cotton
picking, unfavorable weather
(rising temperatures at
pre-harvesting period), and
weakened wheat seed size that
led to decline in yield in Punjab.
Despite fall in area under wheat
and water shortages, Sindh
harvested a bumper wheat crop
with efficient farm management,
favorable weather, and
balanced use of nutrients (see
Figure 2.4).
A second record high wheat
harvest in FY10 and
substantial carryover stocks
of about 4.0 million tons of
wheat6 posed a challenge to
the government for financing
commodity operations and
storage of the grain. The
government intends to export
2.0 million tons of wheat to
6 By end-March 2010.
Table 2.3 :Performance of Major Crop
Area Under Cultivation (000 hectares) % change
in FY10
over FY09
Crops FY08 FY09P FY10T FY10E
Cotton 3,055 2,850 3,200 3,072 7.8
Sugarcane 1,241 1,029 1,106 939 -8.7
Rice 2,516 2,963 2,526 2,858 -3.5
Wheat 8,550 9,046 9,045 9,026 -0.2
Gram 1,107 1,092 1,022 - -
Maize 1,037 1,062 1,039 915 -13.8
Production (’000 tons; cotton in ’000 bales of 170.09 kg each)
Cotton 11,655 12,060 13,360 12,700 5.3
Sugarcane 63,920 50,045 56,527 47,030 -6.0
Rice 5,561 6,954 5,949 6,741 -3.1
Wheat 20,959 24,032 25,000 23,863 -0.7
Gram 475 740 749 571 -22.8
Maize 3,109 3,548 3,414 3,204 -9.7
Yield (Kg/hectare)
Cotton 649 720 710 709 -1.5
Sugarcane 51,507 48,635 51,109 50,085 3.0
Rice 2,210 2,347 2,355 2,359 0.5
Wheat 2,451 2,657 2,764 2,644 -0.5
Gram 429 696 733 - -
Maize 2,998 3,341 3,286 3,502 4.8
P: provisional, T: target, E: estimates Source: MINFA
-14
-7
0
7
14
21
Area Prod. Area Prod.
FY09 FY10E
perc
en
t
Punjab Sindh
Khyber Pakhpunkhwa Balochistan
Figure 2.4: Wheat Area and Production Growth
E: estimates

The State of the Pakistan’s Economy
16
resolve both these issues. However, given lower international prices, this policy
entails a substantial fiscal cost. Ironically, it is difficult to reduce wheat support
price that enable private sector to come forward and buy wheat for export and
domestic consumption. It would also be challenging for the government to
arrange financing and proper storage of targeted procurement quantity of wheat.
In case of a below target procurement, wheat price in open market are likely to
collapse and farmers would face unanticipated losses. This situation suggests that
(a) government involvement in commodity market and price setting should be
restricted only to ensure food security as excessive intervention creates distortions;
and (b) there is a need to introduce futures market with all its prerequisites.
Minor Crops
A fall in the output of minor crops is quite surprising given a decline in area under
major crops during FY10, a relative stability in the prices of most of the minor
crops, as well as, an impressive performance of these on the exports front.
However, since a number of minor crops are grown in non-irrigated (barani) areas,
these were hit hard by the lower rains during FY10. In particular, pulses output
dropped for the second consecutive year. Almost all minor crops, except potatoes,
witnessed fall in output during FY10. Importantly, a drought in India created
severe shortages or delayed harvesting of various agri-products in India. This
situation provided an opportunity to Pakistani traders to export agri-produce to
India and capture Indian share in other countries. The combined impact of lower
production of minor crops during FY10 and substantial rise in exports resulted in
surge in domestic prices (see Table 2.4).
Table2.4: Minor Crops
Commodities
Production1
(thousand tons)
Consumption1
(thousand tons)
Export2
(thousand US$)
Domestic prices3
(Rs/kg for Jul-Apr)
FY10 % change
over FY09 FY10 FY10
% change
over FY09 FY10
% change
over FY09
Mash 13.3 -2.1 45.0 10.4 -99.2 121.9 62.8
Mong 126.1 -19.9 102.0 1,204.3 1,577.3 71.2 41.3
Masoor 11.7 -19.0 50.0 206.6 95.1 121.9 -0.6
Potato 3,007.9 2.3 1,700.0 15,671.9 68.6 22.9 15.7
Onion 1,533.2 -10.0 1,400.0 20,997.9 375.6 25.3 -3.1
Chillies * 104.5 -44.3 149.0 2,412.0 29.8 47.6 11.7
Sources: 1MINFA, 2SBP, 3FBS.
* Total consumption of chilies based on per capita consumption for 2005-06 in HIES-FBS.

Third Quarterly Report for FY10
17
Livestock Market Opportunities
Like minor crops, exports of livestock products increased7 by 40.7 percent YoY to
24.1 thousand tons in Jul-Feb FY10.8 Here too, rising exports put pressures on
domestic prices in recent months. Reports9 suggest that Middle East will remain a
major market for livestock, particularly sheep, cattle, goats and camels. Pakistan
may enhance its share in this region by providing quality livestock and adopting
international halal standards (see Box 2.1). However, there is a concern regarding
exports of live animals. Country should promote exports of value added products
to earn better returns and protect domestic employment. It should also be noted
that slaughtering also provides raw material to domestic leather industry, which is
also an important export industry in Pakistan.
Box 2.1: MOU between Pakistan and Malaysia to Increase Livestock Trade Pakistan will benefit from MoU signed between Pakistan and Malaysia regarding development of
meat trade with standardization of halal meat in Pakistan with Malaysian assistance. To ensure
quality and authentication, Malaysian International Halal Integrity (IHI) group, will assist to setup a
Halal standard board and accreditation body in Pakistan. The alliance will also provide expertise
with testing laboratories and arrange training series in Pakistan. This will not only increase livestock
trade between Pakistan and Malaysia but will also improve export opportunities for livestock
products to the Middle Eastern region in particular and Muslims around the globe.
Agriculture Credit
Performance
Agri-credit disbursement10
increased by 9.5 percent YoY
in Jul-Mar FY10, slightly
lower than the increase of 9.6
percent during the same period
of FY09 (see Table 2.5). This
was entirely due to a fall in
developmental loans which
offset the impact of 11.2
percent increase in production
related loans (see Figure 2.5).
The rise in the latter is
attributed to higher credit
7 Meat and meat preparations. 8 Export of livestock products was only 9.9 thousand tons in FY07. 9 Western Australian Agri-food and Fiber Market Outlook-Middle East
http://agric.wa.gov.au/objtwr/imported_assets/content/amt/bn_middle_east_to_2015.pdf 10 Agri-credit disbursement slowed to 7.6 percent during Jul-Apr FY10 compared with 10.9 percent
last year.
-2
0
2
4
6
8
10
FY09 FY10
Production Development
per
cen
tage
po
ints
Figure 2.5: Contribution in Agri-credit Growth (Jul-Mar)

The State of the Pakistan’s Economy
18
disbursement for rabi crops amid surge in fertilizer off-take.
On supply side, aggressive
lending by the five large
commercial banks (5 CBs) for
production purposes has mainly
supported the growth in agri
credit. Consequently, the share
of 5 CBs in agri-credit market
rose to 51.2 percent. The rise in
disbursement by these
institutions is a reflection of (a)
improvement in loan recovery
by banks; and (b) declining
NPLs during the first nine months of the current fiscal year. Disbursements by
domestic private banks (DPBs) also exhibited a trend reversal and posted a
marginal increase during Jul-Mar FY10. However, disbursements for
development purpose from both 5 CBs and DPBs contracted during Jul-Mar
FY10. In contrast, growth in agri-credit disbursement by ZTBL slowed in Jul-Mar
FY10, mainly due to decline in lending for production purposes.
Crop-wise credit disbursement shows that lending for fruits and vegetables
declined during Jul-Mar FY10. However, disbursement for other crops increased
during Jul-Mar FY10 over the last year (see Table 2.6). It is important to note
that the disbursement in
absolute terms to fruits,
vegetables and other crops
(mostly minor crops) are
significantly low. In particular,
modern cultivation methods
(drip irrigation, hydroponics,
green houses, etc.), marketing
and storage for most of the
minor crops, vegetables and
fruits require substantial investment. Access to institutional credit would help
boost production and exports of these commodities.
Purpose wise Agri-credit
Lending performance of banks revealed their exposure to different sectors.
Commercial banks are cautious in lending for developmental purposes. However,
short term lending by 5-large CBs showed a considerable growth of 22.6 percent
YoY during Jul-Mar FY10 compared with 9.8 percent in Jul-Mar FY09 (see
Table2.5: Agriculture Credit Growth (Jul-Mar)
Name of Banks Disbursement Recoveries
FY09 FY10 FY09 FY10
All CBs 8.2 10.6 15.3 14.3
5 Big CBs 14.2 14.5 13.7 19.3
DPBs -4.8 0.3 19.3 1.7
Spec. banks 12.5 7.3 14.9 2.0
ZTBL 14.6 7.9 15.3 2.4
PPCBL -11.5 -0.3 11.5 -1.1
Total 9.6 9.5 15.1 10.5
Table 2.6: Agriculture Credit in Cropping Sector (Jul-Mar)
amount in billion Rupees, growth in percent
Groups
Amount Growth
FY08 FY09 FY10 FY09 FY10
All crops 59.8 80.2 81.4 34.0 1.6
Vegetables 18.6 2.3 2.3 -87.6 -0.5
Fruits 3.1 3.1 2.9 -0.9 -4.5
Others 13.0 11.3 15.4 -13.4 36.3

Third Quarterly Report for FY10
19
Table 2.7). In case of specialized banks, strong growth was seen in medium to
long term financing by ZTBL
probably due to tractor
financing schemes. In addition,
disbursement by ZTBL also
increased for land improvement,
orchards, godown, cold storage
silos, and seed processing units.
Furthermore, ZTBL put more
efforts to maintain the
production to development ratio
at normal level (70:30) previously it was about 80:20. This would probably help
improve farm mechanization in the country.
Sector-wise Credit
A disaggregate analysis
suggests that the growth in
disbursement to farm sector was
lower than the rise in credit to
the non-farm sector yet for
another year. Resultantly, the
share of farm sector in total
credit disbursement dropped to
69.0 percent by Jul-Mar FY10
compared with 70.0 percent in
the same period last year.
Within farm sector, the share of
subsistence farmers is 87.3
percent in total number of
borrowers but their share in
total credit is only 60.0 percent (see Figure 2.6). Small farmers mostly rely on
non-institutional resources for financial requirements, albeit at high interest rates
and exploitative terms to market their produce.
Despite slowdown in growth, disbursement to non-farm sector increased by a
healthy 13.1 percent YoY during Jul-Mar FY10. Major sources of sustained rise
in disbursement in this sector are livestock and fisheries sub sectors. High prices
of meat, fish, and export of live animals attract investment in non-farm sector.
Moreover, running finance for poultry sector also increased on account of record
high prices of poultry amid strong domestic demand. It is expected that poultry
Table 2.7: Purpose-wise Agri-credit Growth (July-Mar)
Banks Production Development
FY09 FY10 FY09 FY10
5- large CBs 9.8 22.6 91.0 -67.4
ZTBL 11.4 -3.4 33.1 60.9
PPCBL -0.4 1.6 -64.0 -24.1
DPBs -2.0 3.6 -30.0 -40.9
Total 7.5 11.2 29.9 -3.3
0
19
38
57
76
95
* $ @ * $ @
Borrowers Amount
per
cen
t
Figure 2.6: Holding-wise Share in Agri-credit (Jul-Mar)
FY09 FY10
*: subsistence; $:economic; @:above economic

The State of the Pakistan’s Economy
20
output would increase further
and financing requirements
for working capital as well as
fixed investment would
continue to grow.
Provincial Agri-credit
Disbursement
The increasing share of Sindh
province in agriculture credit
exhibited a decline during the
first nine months of FY10
(see Figure 2.7). As a mirror
image, share of the Punjab
increased reaching over 85
percent. Some of the decline in
the share of Sindh is owed to
restriction in changes in land
record with the revenue
department in the province.11
The major imputes to growth in
Punjab came from a healthy
15.0 percent rise in production
related loans, as developmental
loans dropped by 8.5 percent
during Jul-Mar FY10. In
contrast, production related loans declined by 2.7 percent in Sindh during this
period, probably showing the impact of restriction on land mutation.
The share of other provinces and regions is negligible in agri-credit (see Table
2.8). This may be due to both weak demand and inadequate supply. SBP is
conducting regional seminars/workshops to create awareness regarding
availability of agri-credit, to create demand for institutional finance. At the same
time, provincial governments may speed up the provision of title documents to
farmers that would help them to avail institutional finance. On supply side,
specialized and commercial banks need to tap the potential of agri-credit market
11 Revenue Department of Sindh has been restrained from effecting mutation of any entry in the
village record. However, the same directives were eased in the case of already approved agricultural
loans effective from 16th March, 2010 for a period of three months.
Table 2.8: Agriculture Credit Disbursement
billion Rupees
FY07 FY08 FY09 FY10
Punjab 92.8 116.7 127.0 142.4
Sindh 11.7 15.0 18.2 18.3
Khyber
Pakhtunkhwa 6.1 6.1 5.8 4.7
Balochistan 0.3 0.3 0.3 0.4
Azad Kashmir 0.2 0.3 0.4 0.3
Gilgit - Baltistan 0.1 0.2 0.2 0.2
All Pakistan 111.2 138.6 151.9 166.3
10.0
10.4
10.8
11.2
11.6
12.0
83
84
84
85
85
86
FY07 FY08 FY09 FY10
per
cen
t
per
cen
t
Punjab Sindh (RHS)
Figure 2.7: Share in Agri-credit Disbursement (Jul-Mar)

Third Quarterly Report for FY10
21
through increase in outreach
and use of modern technology.
For example, commercial
banks in some developing
countries are using mobile
banking in far
flung rural areas with the help
of internet, laptop and
identification equipment to get
thumb impression. All these
measures could help bolster
the size of agri-credit market
and increase the share of
smaller provinces.
Recovery
Like weaker growth in credit
disbursement, recovery also
demonstrated a slower growth
of 10.5 percent during Jul-Mar
FY10 compared to 15.1 percent
in the same period last year.
However, recovery ratios12
for
commercial banks improved due
to their focus on disbursements
for short-term production loans
(see Figure 2.8). In contrast, a
bulk of disbursements by ZTBL
was extended for long tenure
developmental loans, thus their
recovery ratios deteriorated
during the first nine months of
the current fiscal year.
Fertilizer off-take
Following higher commodity prices of most of agriculture commodities, farmers
increased fertilizer off-take to enhance crop yields. Fertilizer off-take increased
by 23.8 percent in Jul-Mar FY10 as against 3.0 percent fall during the
corresponding period of FY09. This increase is mainly attributed to lower
12 Ratio of recovery to disbursements.
Table 2.9: Fertilizer Off-take Growth
percent
FY08 FY09 FY10
Urea
Jul-Sep 20.2 -2.9 25.6
Oct-Dec 0.7 -3.3 26.0
Jan-Mar 60.9 10.0 -8.4
Oct-Mar (Rabi) 23.2 2.7 8.7
Jul-Mar 22.2 0.9 13.6
DAP
Jul-Sep 76.5 -56.7 376.9
Oct-Dec -36.7 -22.6 24.0
Jan-Mar -50.0 111.1 10.5
Oct-Mar (Rabi) -37.9 -6.9 20.9
Jul-Mar -24.1 -20.8 77.3
Total (urea and DAP) Jul-Mar 9.3 -3.0 23.8
Oct-Mar (Rabi) 3.1 0.8 10.9
70
77
84
91
98
105
Commercial banks Specialized banks
FY08 FY09 FY10
per
cen
t
Figure 2.8: Recovery to Disbursement Ratio (Jul-Mar)

The State of the Pakistan’s Economy
22
fertilizers prices than last year, ample availability, improved farm income and
strong commodity prices. During Oct-Mar FY10 (rabi) fertilizer off-take
increased by 10.9 percent compared with 0.8 percent in the same period last year
(see Table 2.9).
Higher off-take is largely due
to strong increase in DAP,
which recovered with an
impressive growth of 77.3
percent in Jul-Mar FY10
against a decline registered
during the preceding two
years. Higher DAP off-take
during pre wheat sowing
period proved a wise decision
as farmers were able to make
heavy purchases when DAP
prices were at their lowest
levels. During the preceding
year, farmers used excessive urea instead of DAP due to higher prices of the latter.
However, share of DAP in total fertilizer off-take increased during Jul-Mar FY10
as a result of use of balanced nutrients mix (see Figure 2.9).
Urea off-take also increased by 13.6 percent during Jul-Mar FY10 compared with
only 0.9 percent rise in the same period last year. Its off-take mainly increased in
the first two quarters of
FY10, crucial growth period
of kharif and sowing of rabi
crops. Urea off-take during
the third quarter, however,
declined by 8.4 percent
against 10.0 percent increase
in Q3-FY09. Overall off-
take during rabi FY10 (Oct-
Mar) also registered 8.7
percent increase compared
with 2.7 percent last year.
Given the positive impact of
balanced use of fertilizers on
yields during FY10,
70
73
76
79
82
85
15
18
21
24
27
30
FY07 FY08 FY09 FY10
DAP Urea (RHS)
Figure 2.9: Fertilizer Off-take Share (Jul-Mar)
per
cen
t
per
cen
t
55
59
63
67
71
75
FY
01
FY
02
FY
03
FY
04
FY
05
FY
06
FY
07
FY
08
FY
09
FY
10
FY
11
mil
lio
n a
cre
feet
Kharif estimates Kharif normal
Figure 2.10: Irrigation Water Availability

Third Quarterly Report for FY10
23
particularly on wheat crop,13
farmers are likely to continue this practice.
However, uninterrupted availability of fertilizers at reasonable prices coupled with
clear price incentives are some important factors to ensure the use of balanced mix
of the nutrients.
Irrigation Water
IRSA14
estimated a 6.4 percent drop in irrigation water availability for FY11
kharif season on top of a 2.1 percent decline in the same season last year (see
Figure 2.10). Consequently, irrigation water availability would be 1.9 percent
less than the normal levels for kharif FY11. The dropping level of irrigation
water15
poses a risk to the agriculture and the economy; urgent measures are
needed to improve water management and efficient use of available water.
Inadequate storage capacity of reservoirs in the country and waterworks by India
are adding to the stress.
In addition, power shortages, rising prices of diesel oil and deepening underground
water level also make tube-well water expensive for farmers. It is pertinent to
note that kharif season is traditionally influenced by the glaciers melting in May
and June, whereas the monsoon rains play an important role in filling up the major
reservoirs and improve river/canal supply.
Outlook-Kharif FY11
Despite water shortages
prospects for kharif FY11 are
bright due to increasing use of
quality seeds – Bt cotton and
rice hybrid seed, sufficient
fertilizer availability and clear
incentives in terms of strong
commodity prices. Government
supportive policies such as (a)
Rs 500 per bag subsidy on
potash to promote balanced use
of fertilizer; and (b) distribution
of 10,000 tractors under Benazir Tractor Scheme, would also help increase
13 FY10 wheat yield could have dropped substantially due to water shortages. 14 Indus River Water Authority. 15 Pakistan is fast moving from being a water stressed country to a water scarce country,
groundwater is over-exploited and polluted in many areas; most of the water infrastructure (even
some of the major barrages) is in poor repair (World Bank, 2006).
Table 2.10 : Crop Targets
area in '000 hectares; production in '000 tons
Crops FY10 FY11
Area Production Area Production
Cotton 3,200 13,360 3,200 14,000
Rice 2,526 5,949 2,708 6,048
Sugarcane 1,106 56,527 1,070 53,665
Maize 1,039 3,414 1,010 3,452
Mung 205 126 232 160
Mash 27 13 30 15
Chillies 49 105 65 158
Note: cotton in thousand bales of 170.09 kg each

The State of the Pakistan’s Economy
24
enthusiasm among the farmers. There is a strong likelihood that FY11 cotton,
sugarcane and rice harvests would surpass their targets (see Table 2.10).
However, final outcome will mainly be determined by the favorable weather and
water availability.
2.2 Large-Scale Manufacturing
Growth in LSM sector gained
further momentum in Q3-FY10,
largely in response to rising
domestic consumption as well as
global recovery (see Table 2.11).
Specifically, a large part of the
LSM growth was driven by a sharp
rise in consumer durable industries
including automobiles and consumer electronics. Furthermore, in textiles,
pharmaceuticals, and chemicals
sub-sectors manufacturers
benefited from rising export
orders. As a result, LSM index
showed a strong growth of 9.6
percent in Q3-FY10; the strongest
quarterly growth since FY07. A
number of positive developments
reinforced growth January 2010
onwards and dispelled earlier fears
of significant moderation, to a
large extent. For instance, the growth in
consumer auto industry proved resilient to frequent upward price adjustments by
local auto assemblers. The strong demand was supported by banks’ renewed
interest in consumer finance business January 2010 onwards. Anecdotal evidence
suggests that auto assemblers and banks established liaisons whereby a number of
banks are offering car-financing at reduced mark-ups for specific car brands.
Similarly, it was earlier feared that the activities in textiles might slow down with
the end of cotton season as a large part of textile sector activities in H1-FY10 were
observed in low value-added sector (ginning and spinning). However, the pick-up
in value-added textile exports has eased these concerns. Specifically, the
Table 2.11: Performance of Selected Industries
percent YoY growth
H1 Q3
FY09 FY10 FY09 FY10
Overall LSM -4.8 1.6 -12.0 9.6
Consumer durable
Cars & M. cycles -42.4 22.9 -50.4 82.9
Cons. electronics -14.3 -3.2 -59.9 115.5
Construction-led
Cement 2.3 15.7 12.2 3.4
Steel coils & sheets -28.7 -8.8 -17.6 4.3
Paints 18 -4.4 13.9 9.2
Transformers -4.4 -26.2 -38.0 51.6
Export-led
Cotton cloth -0.3 -0.3 -0.4 1.1
Cotton yarn -0.5 -2.1 0.3 -1.1
Pharmaceutical 0.9 4.9 2.7 12.2
Leather 2.5 26.9 5.5 17.3
Agriculture-led
Fertilizer 22.4 1.7 18.6 43.8
Tractors 7 27.3 20.1 26.1
Agri. machinery -37.8 51 50 21.5
Food -4.4 -2.6 -16.3 -4.6
For detailed data please visit: www.statpak.gov.pk

Third Quarterly Report for FY10
25
imposition of quota on yarn exports improved the availability of raw material for
high value added textiles which explains at least a part of pick up in high value-
added textile exports in the third quarter.16
Nonetheless, the value added textile
sector is still complaining of high yarn prices and demanding the imposition of 25
percent regulatory duty along with quota restrictions on yarn export. On the other
hand, the spinning sector that suffered huge losses in previous 3 years due to
depressed global cotton and yarn prices wants to benefit from favorable prices in
FY10 and is therefore against any interventions to free market. Succumbing to
rising pressures from both the stakeholders, the government decided on May 12,
2010, to impose 15 percent regulatory duty (for 60 days) but withdrew the quota
restrictions on yarn exports.
Finally, demand for electronic appliances remained strong. Anecdotal evidence
suggests that the last year’s low sales of cooling appliances have shifted the
deferred demand to this year. Nonetheless, the fear of slowdown in manufacturing
growth cannot be disregarded given the prevalent energy bottlenecks, rising
commodity prices and a vulnerable law & order situation. From the capacity point
of view, however, it appears that the growth momentum can be maintained with
better administrative mechanism and utilizing available export opportunities.
Specifically, production levels are still low in a number of industries despite a
high growth, and the manufacturing capacity is largely under-utilized in many
industries (see Table 2.12).
16 Government first imposed a quota of 50 million kg per month via SRO 26(I)/2010. However, the
quota was reduced to 35 million kg per month March 01, 2010 onwards vide SRO 119(I)/2010.
Table 2.12: Capacity Utilization in Selected Industries (estimated)
percent
Annual utilization Jul-Mar
FY05 FY06 FY07 FY08 FY09
FY09 FY10
POL 88.4 88.2 87.4 89.9 82.9
81.6 75.0
Cement 91.3 88.6 74.3 72.0 68.0
65.4 67.7
Wheat milling 16.5 16.5 17.6 17.0 17.3
17.1 16.5
Edible oil & ghee 42.5 46.9 48.3 46.9 44.9
44.2 44.0
Sugar 47.9 45.5 54.3 72.8 49.1
65.4 63.1
Pig iron 92.5 62.4 82.0 80.8 64.3
69.5 42.1
Coke 79.7 18.8 33.6 30.0 43.7
45.3 36.2
Cars ( single shift) 77.3 98.0 97.9 89.9 45.5
44.8 64.4
Source for installed capacity: OCAC, APCMA, PFMA, PVMA, PSMA, Pakistan Steel, FBS

The State of the Pakistan’s Economy
26
For instance, there is excess capacity in food sector which can be brought on line
with appropriate market mechanism. This is especially true in case of sugar
manufacturing where sugar production declined for the second consecutive year
due to conflicts among cane growers and mill owners over price settlement during
FY08 and FY09. Similarly, the country’s capacity for wheat milling is reported to
be around four times larger than the current demand for wheat products. Wheat
milling activities have been low since FY08 when the government banned export
of wheat products to Afghanistan due to domestic wheat shortages.17
Although
the ban was lifted in January 2010 due to better availability of wheat in the
country, a large price differential in domestic and international wheat prices does
not allow these exports to increase substantially. Flour mill owners are therefore
demanding from the government to also allow export of wheat products at
subsidized rates in addition to allowing wheat exports. The export of wheat
products will result in increased value-addition and employment in the country.
Likewise, liquidity shortages driven by fiscal constraints in petroleum refining and
metal industry are forcing manufacturing firms to operate at low utilization level.
Not only has this caused a decline in domestic production but also led to increased
import pressures in the face of high domestic demand. For instance, the refining
industry is operating at around 76 percent utilization level as against over 86
percent utilization in the last few years. Similarly, Pakistan’s largest steel mill is
going through severe financial constraints. The mill is facing acute raw material
shortage and is not able to utilize a large part of its capacity despite strong
demand. Resultantly, import payments during Jul-Mar FY10 increased by 18.5
percent on petroleum products and 35.8 percent on pig iron over Jul-Mar FY09.
Furthermore, the existing
production levels in
automobiles and cement
sector are quite low
compared with the available
capacities. In case of
automobiles, low production
levels are seen mainly in cars
with engine capacities within
1000 cc, which cater to the
demand of medium-income
group and mostly financed
through banks (see Figure
2.11). With the renewed
17 Exports to Afghanistan used to constitute 15 to 25 percent of total wheat milling in the country.
0
4
8
12
16
20
Jul-
06
Oct
-06
Jan
-07
Ap
r-0
7
Jul-
07
Oct
-07
Jan
-08
Ap
r-0
8
Jul-
08
Oct
-08
Jan
-09
Ap
r-0
9
Jul-
09
Oct
-09
Jan
-10
00
0 n
um
bers
800 cc to 1000 cc Over 1000 cc
Figure 2.11: Composition of Car Sales

Third Quarterly Report for FY10
27
interest of banks in car financing, it appears that sales and production levels of
automobiles will increase in coming months.
Besides available capacities, local manufacturers may also benefit from
opportunities arising from export demand. The exporting industries should take
benefit of appreciation of Chinese and Indian currencies which renders their
exports more expensive in the global markets. Moreover, some improvement in
liquidity of textile firms with the provision of 2.5 percent mark-up rate facility18
(as per the textile policy 2010) as well as a rise in profitability of most textile
companies also provides opportunity to these firms benefiting from rising global
demand. Similarly, in case of pharmaceuticals and cement industries, rising
demand in African countries provides a strong opportunity for local manufacturers
to increase export penetration.
Thus, given the demand potential and capacities available in the sector; the debate
on sustainability of LSM growth boils down to the issue of energy sufficiency.
So far in FY10, gas supplies seem more or less sufficient to cater to LSM
requirements. However, with the commissioning of a new gas-run steel plant in
mid-May 2010, rising capacity utilization of a newly commissioned fertilizer plant
and induction of new fertilizer capacity in Q1-FY11 will add to pressures on gas
demand. Urea production, in particular, entails the usage of natural gas as both a
raw material and as a source of fuel. Moreover, increasing use of gas-based
generators and other appliances has lifted up domestic demand.
The rising demand for gas in fertilizer and household sectors means that the
availability of gas for thermal generation will be less as both
household/commercial sector and fertilizer production hold the top two priority
positions for gas supplies. However, to improve gas supply to power sector, the
government has decided to suspend CNG supplies for one day in a week to ensure
supply to power sector. Although such re-allocations might help in lessening
economic losses for a short term, for sustainable growth, there is a need to
enhance gas provisions. In this regard, it is unfortunate that gas exploration
activities have weakened significantly in the past few years mainly due to natural
decline in gas reserves. Nonetheless, with a global decline in gas prices owing to
adoption of cost effective extraction technologies, the import of gas might be a
convenient option going forward.
As far as electricity supplies are concerned, the energy summit in end-April 2010
has taken a number of sweeping measures for energy conservation. Moreover, it
18 SMEFD Circular No. 03 of 2010.

The State of the Pakistan’s Economy
28
is also expected that at least a couple of private power projects would be
completed by end of 2010. Besides electricity generation, government is also
working at replacing existing transmission infrastructure to reduce transmission &
distribution losses as already evident in recent increase in production of
transformers and other power related products.
From long-run sustainability perspective, it is crucial to bring dams’ construction
on top priority to avoid possible water shortages as well as to increase cheaper
hydel generation. Equally important is to expedite the infrastructure build-up to
tap available coal reserves in the country. This would not only ensure energy
sufficiency at low cost for economic activities but will also be helpful in
mitigating pressures of increasing growth on energy driven external imbalances.
Specifically, energy related imports have reached 4 percent of GDP in FY09 and
FY10 and any substantial increase in growth will further increase import
pressures.
2.3 Services Sector
The first nine months data for FY10 on major indicators reinforces the earlier
assessment of an above-target services growth in FY10. Initial estimates suggest
growth of 4.6 percent in services sector compared with the target of 3.9 percent.
Most of the improvement in growth during FY10 has come from wholesale &
retail trade that benefited from rising LSM production and imports (see Table
2.13). Contribution from
public administration &
defense has also remained
strong.
Secondly, activities in
transportation services also
witnessed a sharp increase in
FY10 due to higher demand for
both public and private cargo
transport. This is evident from
higher sales of petrol and
passenger vehicles
(approximately 58 percent of
total transport value-
addition19
), as well as increased sea and road freight.20
Within the goods transport,
it appears that the sea transport constituted the bulk of FY10 growth as PIA has
19 Includes Pakistan Railways, PIA, buses, passenger wagons, taxies, and rikshaws.
Table 2.13: Services Growth Rate Targets
5-yr.
avg.
share
FY09r FY10t FY10p
Overall 1.6 3.9 4.6
Transport & comm. 19.5 2.7 3.0 4.5
Wholesale & retail trade 33.6 -1.4 3.3 5.1
Finance & insurance 10.6 -7.0 3.0 -3.6
Public admin. & defense 11.5 3.6 4.0 7.5
Community & personal 19.5 8.8 6.0 6.6
Ownership of dwellings 5.3 3.5 3.6 3.5
r=revised, t=target, p=provisional; Source: Provisional estimates
by FBS; retrieved on May 21, 2010 from
http://www.statpak.gov.pk/depts/fbs/statistics/national_accounts/national_accounts.html

Third Quarterly Report for FY10
29
reported a decline in cargo during Jul-Mar FY10. However, the national shipping
company (PNSC) could not benefit from this recovery in the face of tough global
competition in the form of low tariffs as well as shortage of vessels.21
Consequently, a part of the shipping demand had to be met via imports.22
However, the recent addition of two oil-carrier ships and scrapping of outdated
vessels could strengthen earnings in the next quarter.
Similarly, the telecommunications sector presents a mixed trend. While the largest
fixed line services provider posted a decline in earnings during FY10, the growth
in cellular companies is expected to register some recovery due to increase in the
subscriber base by 2.0 percent over June 2009. This increase in mobile
subscribers is despite the fact that PTA discarded three million unverified mobile
SIMs in FY10, and has largely come about in response to the fiscal incentives
introduced in FY10.23
The growing demand has been followed by network
expansion projects by the cellular services’ suppliers.
Public administration & defense registered the strongest growth within the
services sector. In particular, an inevitable expansionary fiscal deficit mainly due
to war against terror has helped significant growth under public administration &
defense sub-sector in FY10.
Finally, the financial accounts of most listed banks confirm higher earnings in
FY10, despite a rise in provisioning expenses, mainly due to volumetric expansion
and high spreads (see Tables 2.13 and 2.14). However, as a result of a fall in the
value addition by other components, growth in finance & insurance declined
during FY10.
20 Interestingly, despite the sharp increase in the sales of diesel-run trucks and LCVs, a similar
growth was not observed in diesel sales. Anecdotal evidence suggests that diesel is being smuggled
into Pakistan via Iran where the fuel is highly subsidized. 21 It appears that revenues of PNSC could have been higher if not for low crude-oil imports. In
specific terms, the national shipping company has long-term contracts with three major refineries
and due to circular debt issue, the refineries were not able to import sufficient crude quantities. 22 Chartering of foreign ships increased to $24 million in Jul-Mar FY10, up from US$ 12 million last
year. 23 These included reduction in FED and activation charges on new mobile connections, custom duty
reduction on the imports of mobile sets, and elimination of regulatory duty on mobile set imports.
The resulting demand recovery is evident from a sharp increase in mobile phone imports during the
review period.

The State of the Pakistan’s Economy
30
Table 2.14: Indicators of Services Sector Performance
percent YoY growth unless mentioned otherwise
Q3 Jul-Mar
FY09 FY10 FY09 FY10
Wholesale & retail trade (33.6)
Credit to wholesale and commission trade -5.5 -11.1 5.1 -14.9
Credit to retail trade 21.0 7.0 32.9 4.8
FDI in trade -6.3 -53.6 -5.8 -53.6
Manufacturing growth -12.1 9.7 -7.5 4.5
Import growth -36.4 30.1 -6.6 -3.9
Transport (16.0)
Cargo handling at ports -8.0 11.9 -0.2 17.4
PNSC operating profit – Dec. latest 34.8 -33.2 12.1 -42.2
Commercial vehicles sale -35.0 45.4 -15.7 16.7
HSD & MS sales for transport 17.1 -0.7 0.5 2.9
Transport & communication price index 21.4 11.3 30.5 2.1
PIA operating profit -110.5 -132.7 223.4 -81.6
Passage earnings of Pakistani air companies -0.7 12.7 8.1 -0.6
Trade volume -16.9 29.7 -4.6 -8.8
Communication (3.0)
Teledensity (percentage of population) 60.3 62.4 .. ..
PTCL operating profit 20.7 22.5 -10.9 -6.7
Telecomm imports -66.2 2.7 -52.4 -35.3
Mobile phone imports -88.7 299.2 -76.0 54.6
Communication services exports 44.1 53.4 -16.7 136.1
Finance & insurance (10.6)
Transfer of SBP profits to govt. .. -29.0 22.9 101.6
PAT of 7 major banks -16.1 10.4 11.9 19.0
Percent of advances at 12% or above - inc 84.0 82.0 .. ..
Percent of deposits held at 8% or above - inc 57.2 53.2 .. ..
Interest rate spread - stock 7.7 7.3 .. ..
Interest rate spread - inc. 6.3 6.1 .. ..
Financial services exports 114.6 -61.3 73.7 43.3
Insurance services exports -35.7 41.5 45.6 -23.9
Government services (11.5)
Government borrowing 62.0 101.1 50.8 137.5
Govt. services exports -58.3 171.7 10.3 28.0
Figures in parentheses are 5-year average contribution to services value-addition.

3Prices
3.1 Overview
Inflationary pressures eased
during H1-FY10 resurged
January 2010 onwards1 (see
Figure 3.1). Importantly,
inflationary pressures largely
emanated from non-core (food
& energy) components. Rise in
food and energy prices have
strong second-round effects,
therefore, core inflation is also
likely to increase in months
ahead. Inflation measured by
both CPI and SPI is moving in a
narrow range; evident from
lower variability during Jan-
Apr FY10.2
Headline CPI inflation (YoY)
rose to 13.3 percent by April
2010, slightly higher than 12.9
percent seen in the preceding
month, but significantly higher
than the short-term low of 8.9
percent in October 2009. Core
inflation measured by 20%
trimmed mean is in the
trajectory of headline CPI
inflation (see Figure 3.2).
However, core inflation
measured by non-food non-
1 Average CPI inflation was 10.3 percent during H1-FY10, rose to 13.2 percent in the third quarter of
FY10. 2 Standard deviation reduced to 0.4 during Q3-FY10 compared with 0.8 in H1-FY10 and 1.0 in Q3-
FY09. A low standard deviation with high average inflation indicates persistence of inflation at high
level.
8
9
11
12
14
15
Jul
Au
g
Sep
Oct
No
v
Dec Jan
Feb
Mar
Ap
r
per
cen
t
Overall CPI NFNE Trim
Figure 3.2: Inflation during FY10 (YoY)
0
8
16
24
32
40
Ap
r-0
8
Jun
-08
Au
g-0
8
Oct
-08
Dec
-08
Feb
-09
Ap
r-0
9
Jun
-09
Au
g-0
9
Oct
-09
Dec
-09
Feb
-10
Ap
r-1
0
per
cen
t Yo
Y
CPI SPI WPI
Figure 3.1: Inflation Trends
Inflation bottomed out
CPI and SPI inflation are moving in a narrow band

The State of Pakistan’s Economy
32
energy (NFNE) was declining
up to March 2010 and dropping
to single digits, for the first time
in 23 months. However, NFNE
measure of core inflation also
witnessed an uptick during April
2010, showing that inflationary
pressures are strengthening (see
Table 3.1). A resurge in NFNE
and an unchanged trimmed
mean indicate that inflationary
pressures are broad-based and
probably reflect second round
effects of persistently high food
and energy inflation in the
economy during recent months.
Increase in inflation in recent
months is largely attributed to a number of factors, such as: (a) higher
international commodity prices, particularly crude oil, metals, pulses and cotton;
(b) upward adjustment in electricity tariffs and administered domestic fuel prices;
(c) relatively poor harvests amid water shortages coupled with strong growth in
exports of vegetables, fruits, livestock, etc.,3 (d) expansionary fiscal stance; and
(e) recovery in domestic economy as indicated by a 4.4 percent rise in LSM
growth during Jul-Mar FY10 against a fall of 7.4 percent in Jul-Mar FY09.
Small resurgence in inflationary pressures was already anticipated given
scheduled upward revisions in electricity tariff and pressures on international
prices of crude oil. As elaborated in previous Monetary Policy announcement at
end-March 2010, persistence of high inflation was one of the reasons that the
central bank adopted a cautious monetary stance. Moreover, expansionary fiscal
stance also infuses inflationary pressures. However, SBP was mindful of the fact
that an increase in policy rate to curb inflationary pressures may hurt the recovery
in manufacturing sector, which is in its initial stage. In this backdrop, SBP
forecasts suggest that annual average headline CPI inflation will be slightly higher
than estimated earlier, falling in the range of 11.5 – 12.5 percent during FY10.
3 For details see Section 2.1 Performance of Agriculture Sector.
Table 3.1: Different Dimensions of Inflation
percent YoY
Apr-09 Mar-10 Apr-10
Overall CPI 17.2 12.9 13.3
Food group 17.0 14.5 14.5
Non-food group 17.3 11.6 12.2
HRI 18.9 12.0 11.2
WPI 8.3 21.8 22.0
Food group 17.2 16.3 15.2
Non-food group 1.8 26.5 27.7
SPI 15.0 17.6 17.4
Core inflation
NFNE 17.7 9.9 10.6
NFNE excl. HRI 16.6 8.0 10.0
Trimmed 17.6 12.7 12.7
Trimmed excl. HRI 17.4 13.0 13.5

Third Quarterly Report for FY10
33
3.2 Consumer Price Index
(CPI)
Headline CPI inflation (YoY) is
hovering around 13 percent for
the fourth consecutive month in
April 2010 (see Figure 3.3).
Although, CPI inflation at 13.3
percent by April 2010 is
substantially lower than the
17.2 percent seen in April 2009,
it remained at uncomfortably
high level. Importantly, while
inflation was sharply declining
in the corresponding period,
inflation is moving in a narrow
range in recent months. This
persistence in inflation is
largely due to; (a) high-food
inflation (see Figure 3.4); (b)
upward adjustment in electricity
tariffs; and (c) rise in the prices
of key fuels. Upward pressures
on CPI inflation are also
evident from the fact that share
of number of items registering
double digit inflation during
recent months has been
increasing since November
2009 (see Figure 3.5). Most of
the commodities witnessing higher increases in prices were from food and energy
sub-groups. However, a rise in CPI non-food inflation from 11.6 percent in March
2010 to 12.2 percent in April 2010 is also contributed by; (a) impact of higher
cotton prices on apparel & textiles; (b) rise in the prices of medicines; and (c)
sharp upward revision in television license fee.
At glance, Table 3.2 reveals that major contribution in CPI inflation was from
food and energy items. Out of top ten commodities contributing in CPI inflation
during April 2010, six were from food group and three from energy group.
5
7
9
11
13
15
Jul-
09
Au
g-0
9
Sep
-09
Oct-
09
No
v-0
9
Dec-0
9
Jan
-10
Feb
-10
Mar-
10
Ap
r-1
0
perc
en
t
Figure 3.3: CPI Inflation (YoY)
5
11
17
23
29
35
Ap
r-0
8
Jun
-08
Au
g-0
8
Oct
-08
Dec
-08
Feb
-09
Ap
r-0
9
Jun
-09
Au
g-0
9
Oct
-09
Dec
-09
Feb
-10
Ap
r-1
0
per
cen
t
Non-food Food
Figure 3.4: CPI Inflation (YoY)

The State of Pakistan’s Economy
34
Combined weighted
contribution of these food
items4 in overall CPI inflation
was 32.1 percent. A very high
contribution (9.6 percent) in
food inflation is from wheat
flour, which is mainly a
function of government’s
pricing policy. While wheat
price in international market
plummeted, its impact on
domestic market has not been
fully realized. This is despite
the fact that the country
achieved bumper wheat harvest
for the consecutive two years and ample domestic stocks.
On the other hand, domestic fuel prices are increasing due to rising international
oil prices. It suggests that the government’s involvement in price setting
mechanism is harmful for the consumers. It becomes more important when
government is unable to extend subsidies to consumers due to either limited fiscal
space or in compliance with IFIs. Reduction in subsidy on electricity is the case in
point here. The combined impact of fuel and electricity charges on inflationary
expectation cannot be underestimated. While a part of food inflation is due to
significantly lower availability of vegetables and fruits, increased transportation
cost is also responsible for rising food prices. In contrast, despite a downtrend,
4 Having a total weight of 20.8480 percent in CPI basket.
Table 3.2: Weighted Contribution in CPI Inflation (YoY)
Weights Apr-08 Apr-09 Jul-09 Feb-10 Mar-10 Apr-10
1. House rent index 23.4298 15.4 24.4 34.9 22.1 21.0 19.1
2. Milk fresh 6.6615 8.7 6.7 10.4 8.1 8.7 9.2
3. Meat 2.6981 1.5 3.7 4.9 5.5 6.4 6.6
4. Electricity 4.3698 1.4 4.9 7.0 5.3 5.2 5.0
5. Wheat flour 5.1122 15.8 9.9 7.9 9.6 9.8 4.8
6. Sugar 1.9467 -1.5 4.8 4.9 7.4 6.1 4.6
7. Petrol 1.7253 3.5 -2.1 -7.2 2.9 3.5 3.8
8. Vegetables 1.7623 2.2 1.2 4.0 4.4 4.4 3.6
9. Natural gas 2.0458 1.2 4.3 0.8 4.0 4.0 3.5
10. Vegetable ghee 2.6672 10.5 -4.0 -6.1 2.8 3.0 3.3
5
19
33
47
61
75
Ap
r-0
8
Jun
-08
Au
g-0
8
Oct
-08
Dec
-08
Feb
-09
Ap
r-0
9
Jun
-09
Au
g-0
9
Oct
-09
Dec
-09
Feb
-10
Ap
r-1
0
per
cen
t
< 5 % 5-10 % > 10 %
Figure 3.5: Distribution of Price Changes (YoY)

Third Quarterly Report for FY10
35
house rent index (HRI) has continuously remained higher contributor in CPI
inflation5 due to its high weight.
3.2.1 CPI Food Inflation
CPI food inflation bottomed out at 7.5 percent YoY in October 2009, has bounced
back in double digits since then. Encouragingly, while it showed no change in
April compared to March 2010, it remained at very high level of 14.5 percent.
The impact of declines in the prices of sugar, wheat and some perishable
commodities during April 2010 relative to the preceding month was offset by the
increases in the prices of pulses, milk, rice, tomatoes and some beverages.
Domestic sugar prices retreated due to falling international prices since January
2010. International sugar prices plummeted due to increased production in Brazil
and India.6 However, going forward, sugar-importing countries are expected to
make fresh purchases to replenish domestic stocks. Therefore international sugar
prices are likely to rise again by mid 2010. In this background, it would be
prudent to import adequate sugar to meet strong domestic demand in summer and
holy month of Ramadan.
A recent moderation in wheat
prices may not last long due to
aggressive public procurement
and possible export. A major
contribution to CPI food
inflation came from dairy &
livestock products. A part of
this rise is coming from
increasing cost of transportation
and fodder. However growing
domestic as well as external
demand is also instrumental in a
continuous surge in the prices
of meat and milk.
5 HRI has the highest weight of 23.43 percent in CPI basket. The high contribution of HRI in CPI
inflation is primarily due to its high rate in the consumer basket. Therefore, if the objective is to
analyze inflation itself, then HRI contribution becomes less significant. Thus major drivers of
inflation remain food and energy items. 6 Sugar output is estimated to increase by 17.0 percent YoY (from 33.1 to 38.7 million tons) in Brazil
during 2010. Indian sugar output estimates have been gradually revised upward from 14.5 million
tons to 18.5 million tons during 2010.
-30
-15
0
15
30
45
Ap
r-0
8
Jun
-08
Au
g-0
8
Oct-
08
Dec-0
8
Feb
-09
Ap
r-0
9
Jun
-09
Au
g-0
9
Oct-
09
Dec-0
9
Feb
-10
Ap
r-1
0
perc
en
t -Y
oY
Domestic CPI food International
Figure 3.6: Domestic Food Inflation is Less Volatile
Source : IMF for international prices and FBS for CPI food

The State of Pakistan’s Economy
36
It is instructive to note that a sustained rise in the prices of some food
commodities (e.g., milk & meat), nominal stickiness in domestic food prices, as
well as, government intervention led to a lower volatility in domestic food
inflation relative to highly volatile international food prices (see Figure 3.6).
However, domestic food inflation remained higher most of the time, which
implies that domestic consumers are paying the cost of: (a) lower productivity in
some areas; (b) imperfect markets; and (c) government intervention in commodity
prices. It has also been observed that domestic prices of most of the food items
rise with the surge in their international prices. However, in case of a decline in
international prices, the pass through is largely insignificant. For example, tea
prices rose in international market during Q4-CY09 then came back to their
normal levels by March 2010. In contrast, domestic tea prices are witnessing a
continued uptrend (see Box 3.1). Price trends of sugar, wheat, rice, palm oil etc.
also reveals similar story.
Box 3.1: Tea Prices
International tea prices surged above
US$ 5.0/kg by end-October 2009 from
its average of US$ 3.5/kg for the last
one year (November 2008-October
2009). The departure from its normal
range was mainly attributed to
reduction in production due to drought
in key tea producing countries, mainly
Kenya. However, international tea
prices peaked out at US$ 5.5/kg by end-
December and retreated to their normal
levels (US$ 3.6/kg) by end-April 2010
after improvement in weather
conditions.
Domestic tea prices also responded to
rise in international prices, almost
immediately. However, despite a
significant downward correction in international prices, domestic tea prices continued to rise in
recent weeks (see Figure 3.1.1). A part of adjustment in domestic tea prices is justified given rise in
electricity tariff, transportation cost and pressures on wages. However, these components have very
small share in cost of tea supplied in the domestic markets. The disappointment here is that the
domestic tea prices did not see any correction, rather the uptrend is continued.
A plausible justification of accumulated inventory can be made. However, if traders enjoyed
inventory gains when international tea prices were rising (Oct-Dec 2009), a continued rising trend in
domestic tea prices seems unjustified, since international prices are declining from January 2010.
0
12
24
36
48
60
40
60
80
100
120
140
16
-Oct
-08
11
-Dec
-08
5-F
eb-0
9
2-A
pr-
09
28
-May
-09
23
-Ju
l-0
9
17
-Sep
-09
12
-No
v-0
9
7-J
an-1
0
4-M
ar-1
0
29
-Ap
r-1
0
Rs
per
kg
Rs
per
kg
Figure 3.1.1: Tea Prices (Weekly )
Difference (RHS) Domestic World
Source: Bloomberg, The Public Ledger

Third Quarterly Report for FY10
37
3.2.2 CPI Non-food
Inflation
CPI non-food inflation
(YoY) remained in double
digits and moving in a
narrow range during recent
months. CPI non-food
inflation was recorded at
12.2 percent in April 2010,
slightly higher than 11.6
percent registered in the
preceding month, but
significantly lower than 17.3
percent in April 2009 (see
Figure 3.7). In fact, the
impact of a slowdown in HRI and education sub-groups was more than offset by
acceleration in transport & communication, apparel, textiles & footwear,
recreation & entertainment, cleaning & laundry and medicare sub-groups during
April 2010 over the preceding month.
Inflation in transport & communications sub-group surged as a result of rising
crude oil prices in international market and subsequent upward adjustment in the
prices of key fuels (see Table 3.3). Apparel, textile & footwear sub-group
continued to exhibit acceleration since December 2009 mainly due to rising prices
of cotton and cotton products (see Box 3.2).
Table 3.3: CPI Non-food Inflation (YoY) by Groups
percent
MoM YoY
Weights Apr-09 Mar-10 Apr-10 Apr-09 Mar-10 Apr-10
Non-food group 59.6584 0.9 0.8 1.5 17.3 11.6 12.2
Apparel, textile, etc. 6.0977 0.7 0.8 2.2 12.3 6.1 7.7
House rent 23.4298 1.3 0.6 0.6 18.9 12.0 11.2
Fuel & lighting 7.2912 0.0 -0.1 -0.4 26.7 17.1 16.7
Household furniture & equipment 3.2862 0.3 0.4 0.9 12.6 5.3 5.9
Transportation & communication 7.3222 0.1 3.4 5.8 8.6 14.0 20.5
Recreation & entertainment 0.8259 0.1 0.1 10.0 13.9 4.3 14.7
Education 3.4548 6.2 0.2 2.7 23.0 12.5 8.8
Cleaning & laundry 5.8788 0.0 0.3 0.4 16.0 8.6 9.1
Medicare 2.0704 0.1 0.2 2.6 13.4 6.0 8.6
0
7
14
21
28
35
Ap
r-0
8
Jun
-08
Au
g-0
8
Oct
-08
Dec
-08
Feb
-09
Ap
r-0
9
Jun
-09
Au
g-0
9
Oct
-09
Dec
-09
Feb
-10
Ap
r-1
0
per
cen
t-Y
oY
Non-food HRI Energy
Figure 3.7: Components of CPI Non-Food Inflation
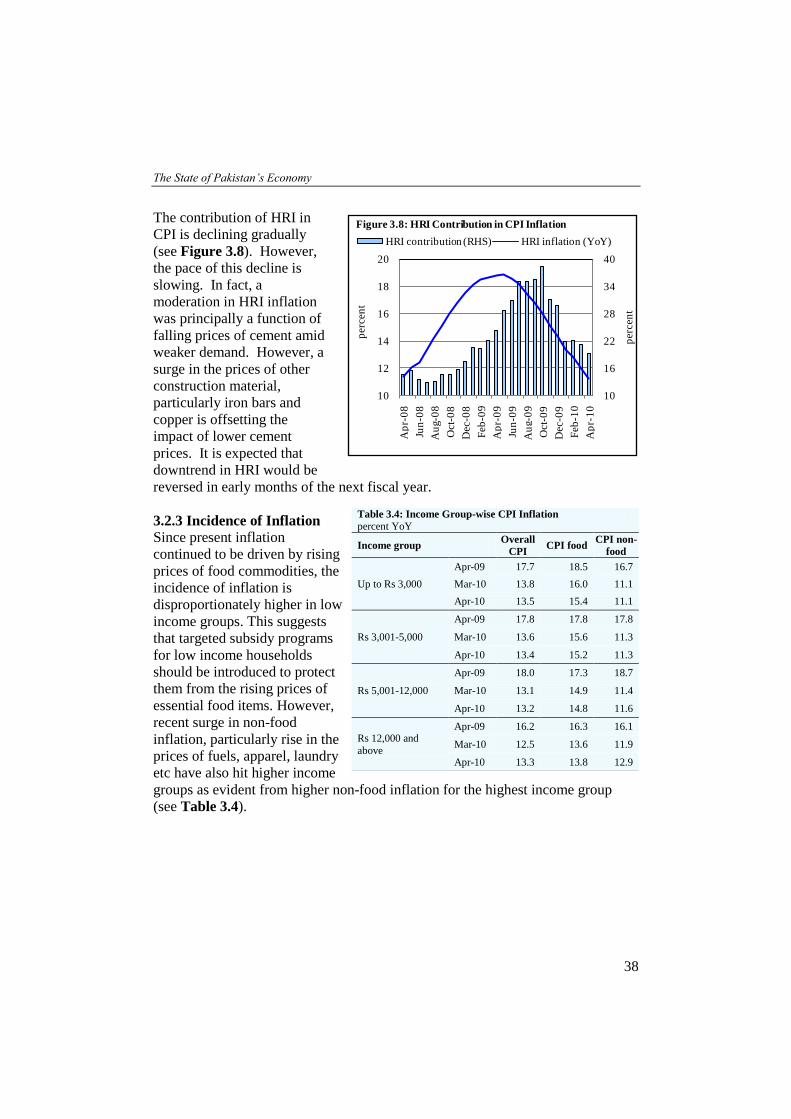
The State of Pakistan’s Economy
38
The contribution of HRI in
CPI is declining gradually
(see Figure 3.8). However,
the pace of this decline is
slowing. In fact, a
moderation in HRI inflation
was principally a function of
falling prices of cement amid
weaker demand. However, a
surge in the prices of other
construction material,
particularly iron bars and
copper is offsetting the
impact of lower cement
prices. It is expected that
downtrend in HRI would be
reversed in early months of the next fiscal year.
3.2.3 Incidence of Inflation
Since present inflation
continued to be driven by rising
prices of food commodities, the
incidence of inflation is
disproportionately higher in low
income groups. This suggests
that targeted subsidy programs
for low income households
should be introduced to protect
them from the rising prices of
essential food items. However,
recent surge in non-food
inflation, particularly rise in the
prices of fuels, apparel, laundry
etc have also hit higher income
groups as evident from higher non-food inflation for the highest income group
(see Table 3.4).
Table 3.4: Income Group-wise CPI Inflation
percent YoY
Income group Overall
CPI CPI food
CPI non-
food
Up to Rs 3,000
Apr-09 17.7 18.5 16.7
Mar-10 13.8 16.0 11.1
Apr-10 13.5 15.4 11.1
Rs 3,001-5,000
Apr-09 17.8 17.8 17.8
Mar-10 13.6 15.6 11.3
Apr-10 13.4 15.2 11.3
Rs 5,001-12,000
Apr-09 18.0 17.3 18.7
Mar-10 13.1 14.9 11.4
Apr-10 13.2 14.8 11.6
Rs 12,000 and
above
Apr-09 16.2 16.3 16.1
Mar-10 12.5 13.6 11.9
Apr-10 13.3 13.8 12.9
10
16
22
28
34
40
10
12
14
16
18
20
Ap
r-0
8
Jun
-08
Au
g-0
8
Oct-
08
Dec
-08
Feb
-09
Ap
r-0
9
Jun
-09
Au
g-0
9
Oct-
09
Dec-0
9
Feb
-10
Ap
r-1
0
perc
en
t
per
cen
t
HRI contribution (RHS) HRI inflation (YoY)
Figure 3.8: HRI Contribution in CPI Inflation

Third Quarterly Report for FY10
39
3.3 Wholesale Price Index Inflationary pressuures are more evident in stubbornly high WPI inflation. WPI
inflation rose to 22.0 percent YoY during April 2010 from its bottom of 0.3
percent in August 2009 (see
Figure 3.9). While CPI non-
food inflation is moving in a
narrow range , WPI non-food
inflation is increasing sharply.
This is due to the direct impact
of rising international prices of
cotton, base metals and POL on
WPI.
During the initial months of
FY10, WPI inflation was
significantly lower than the CPI
inflation. Nonetheless, WPI
inflation surpassed CPI
inflation in recent months. This
divergence is explained by the surge in WPI non-food inflation as food inflation in
both indices are moving in tandem (see Figure 3.10). In addition, bullish
prospects of international commodity prices suggests that WPI inflation would
remain strong in months ahead.
Within WPI non-food group, raw materials, building material, and fuel & lighting
-10
0
10
20
30
40
Ap
r-0
8
Jun
-08
Au
g-0
8
Oct-
08
Dec-0
8
Feb
-09
Ap
r-0
9
Jun
-09
Au
g-0
9
Oct-
09
Dec-0
9
Feb
-10
Ap
r-1
0
perc
en
t
General Food Non-food
Figure 3.9: WPI Inflation YoY
Inflation bottomed out
WPI inflation mainly driven by non-food group
-10
0
10
20
30
40
Ap
r-0
8
Jun
-08
Au
g-0
8
Oct
-08
Dec
-08
Feb
-09
Ap
r-0
9
Jun
-09
Au
g-0
9
Oct
-09
Dec-0
9
Feb
-10
Ap
r-1
0
CPI non-food WPI Non-food
5
11
17
23
29
35
Ap
r-0
8
Jun
-08
Au
g-0
8
Oct-
08
Dec
-08
Feb
-09
Ap
r-0
9
Jun
-09
Au
g-0
9
Oct
-09
Dec-0
9
Feb
-10
Ap
r-1
0CPI food WPI food
Figure 3.10: Movements in CPI & WPI Inflation (YoY-percent)

The State of Pakistan’s Economy
40
sub-groups witnessed
significant acceleration in
inflation. Inflation in the former
group rose sharply largely due
to surge in the prices of cotton
and cotton products. Fuel &
lighting sub-component
witnessed increase amid rising
prices of crude oil in
international market.
Buidling materials sub-group
was dragging WPI inflation
downward due to continued
deflation. However, inflation in
in building materials sub-index
has increased significantly to
7.8 percent in April 2010 from
deflation in the preceding
months. This trend reversal is
attributed to sharp rise in the
prices of base metals and
cement products. The rising
prices of cement blocks, despite
declining prices of cement,
probably indicate pressures on
wages, rising prices of other
material and increasing
transportation cost. This shows
that the contribution of this
group will further increase in WPI inflation in months ahead.
3.4 Sensitive Price Indicator
Following trends in CPI and WPI, SPI inflation has also increased during recent
months. SPI inflation (YoY) was 17.4 percent during April 2010 compared to 17.6
percent in March 2010. Higher incidence of SPI inflation was mainly due to rise
in the prices of essential food items (see Figure 3.11).
On the other hand, weekly SPI inflation (YoY) bottomed out at 6.1 percent in the
third week of October 2009, but remained above 16 percent from the 1st week of
January 2010 (see Figure 3.12). SPI inflation reached as high as 18.4 percent by
-2
0
2
4
6
0
7
14
21
28
35
Ap
r-0
8
Jun
-08
Au
g-0
8
Oct
-08
Dec
-08
Feb
-09
Ap
r-0
9
Jun
-09
Au
g-0
9
Oct
-09
Dec
-09
Feb
-10
Ap
r-1
0
Figure 3.11: SPI Inflation (percent)
YoY 12-mma MoM (RHS)
5
11
17
23
29
35
V-J
uly
III-
Au
g
II-S
ep
I-O
ct
IV-O
ct
II-N
ov
I-D
ec
IV-D
ec
II-J
an
I-F
eb
IV-F
eb
III-
Mar
II-A
pr
V-A
pr
per
cen
t
weeks
Figure 3.12: SPI Inflation (YoY)
FY09 FY10

Third Quarterly Report for FY10
41
the 2nd
week of April 2010 before retreating to 16.3 percent by the fifth week of
April 2010.
3.5 Global Inflation Scenario
Inflation worldwide has trended
upwards due to a stronger global
recovery than anticipated
earlier. Growth in emerging
economies is strong, and largely
driven by strong domestic
demand whereas, in developed
economies though growth is
fragile but real activity is
rebounding with supportive
monetary and fiscal policies.
Uptrend in inflation is partially
attributed to fiscal and monetary
stimulus and partly attributed to
rising international commodity
prices.
Resurge in inflation is most
evident in developing countries
where food and fuel represents a larger share of consumer spending. Whereas,
according to the World Bank’s Economic Monitoring Team, core inflation has
been more stable and continue to moderate across many countries (similar to the
case of Pakistan). In order to
manage inflationary pressures
led by growth amid excess
liquidity (injected through fiscal
stimulus packages), central
banks are moving towards
contractionary policies.
Australia, India, Malaysia and
Singapore have recently raised
their inertest rates (see Table
3.5). Going forward it is likely
that some other countries also
tighten monetary policy in order
to avoid the formation of asset
bubbles.
Table 3.5: Policy Rates in Major Economies
Major
economies
Current policy
rate Previous Changed on
United States 0.25 1.00 Dec 16 2008
United Kingdom 0.50 1.00 Mar 05 2009
Euro Area 1.00 1.25 May 07 2009
Japan 0.10 0.30 Dec 20 2008
Canada 0.25 0.50 Apr 21 2009
Australia 4.50 4.25 May 04 2010
China 5.31 5.58 Dec 22 2008
India 5.25 5.00 Apr 20 2010
Korea, South 2.00 2.50 Feb 12 2009
Malaysia 2.25 2.00 Mar 04 2010
Indonesia 6.50 6.75 Aug 05 2009
Philippines 4.00 4.25 Jul 09 2009
Thailand 1.25 1.50 Apr 08 2009
New Zealand 2.50 3.00 Apr 30 2009
Pakistan 12.50 13.00 Nov 24 2009
Sources: Bloomberg, central banks’ websites.
-56
-28
0
28
56
84
112
Ap
r-0
8
Jun
-08
Au
g-0
8
Oct-
08
Dec-0
8
Feb
-09
Ap
r-0
9
Jun
-09
Au
g-0
9
Oct-
09
Dec-0
9
Feb
-10
Ap
r-1
0
perc
en
t
Overall Food Metals Energy
Figure 3.13: IMF Price Indices (YoY)
Source : IMF
Q2
Q3

The State of Pakistan’s Economy
42
3.5.1 International Commodity Prices
International commodity prices rose by 48.4 percent YoY in April 2010 compared
with a fall of 45.5 percent a year earlier. In particular, increase in energy and
metal prices was more pronounced (see Figure 3.13). This has been attributed to
(a) relative weakening of US dollar; (b) recovery in global economy; and (c)
revision in price setting mechanism for iron ore.
Food
Fortunately, rise in food prices slowed down somewhat amid ample supplies of
food grains based on huge carryover stocks and favorable prospects for 2010
crops. Decline in sugar prices was the major source of deceleration in food
commodity prices. Upward revisions in sugar production estimates in India and
significant rise in sugar production in Brazil resulted in sharp contraction in the
international sugar prices. Raw sugar prices dropped from a 29 year high of US
cents 28.4/pound in January 2010 to US$ 16.3/ pound by April 2010. Tea prices
also declined during the third quarter of FY10 owing to improvement in weather
in dorught striken parts of Kenya and Uganda.
Energy
Crude oil prices remained in the range of US$70 – US$80 per barrel during Q3-
FY10. In April 2010, it rose to US$ 84.2 per barrel, the highest level since
September 2008. Positive macroeconomic developments such as; (a) improved
manufacturing and services sectors along with employment generation in the US,
the largest consumer of oil in the world and; (b) IMF upward revision in its
forecast of world economy growth to 4.2 percent from January 2010 forecast of
3.9 percent, kept crude oil prices at higher levels during recent months.
Metals
Industrial metal prices recovered sharply during last six months registering 69.3
percent growth in April 2010. Metals prices also rose on economic optimism
based on strong growth in China and India coupled with encouraging news from
OECD countries led by US and Japan. Revision in the mechanism of customary
annual contract price of iron ore has also pushed up base metal prices in
international market.
Cotton
Cotton prices have increased sharply since November 2009 due to recovery in
textile demand together with supply shortage in raw cotton markets (see Box 3.2).
Cotton prices retreated by mid March 2010. However, as a result of imposition of
a ban on exports by India, cotton prices resurged again by the second week of
April 2010.

Third Quarterly Report for FY10
43
Box 3.2: Surge in International Cotton Prices
International cotton prices rose to a record US$ 0.88/pound by April 2010 from US$ 0.57/pound in
April 2009. This sharp jump was mainly driven by; (a) increase in cotton consumption amid
recovery in global economy; (b) decline in cotton output principally in China and US; as well as, (c)
estimated decline in cotton stocks by end of this year. According to US Department of Agriculture
Foreign Agricultural Services (USDA FAS),7 global cotton production this year is estimated to be
22.3 million metric tons (MMT) against earlier estimates of 22.4 MMT and 23.4 MMT during 2008-
09 (see Figure 3.2.1).
Apparently, the pace of rise in domestic cotton prices seems higher than the international cotton
prices. This difference however, disappeared after exchange rate adjustment. It means the
movements in domestic cotton prices fully explained by changes in international prices. This is an
outcome of a number of factors including: (a) government is out of cotton business; and (b) domestic
cotton market is performing well.
Domestic cotton prices reached to as
high as Rs 6800/40kg by end April
2010, almost double than a year
earlier. The recent spike (end-April
2010) in cotton prices is a result of
imposition of a ban on cotton export
by India.
An improvement in FY10 cotton
harvest was quite fortunate for the
domestic farmers, particularly in
Sindh where farmers were able to
raise yield. Spinning sector also took
advantage of higher global prices and
export of cotton yarn increased by a
hefty 38.9 percent in value (31.7
percent in quantum) during Jul-Mar
FY10. Given, importance of cotton in agriculture and economy, there is a need to increase domestic
output by using quality seeds and modern cultivation methods to meet the growing domestic and
external demand. The role of government is appreciable in cotton market; it should continue to act
as a facilitator and regulator.
7 USDA FAS revised its estimates of world cotton supply, use, and trade in April 2010 from earlier
forecasts in March 2010.
-40
-20
0
20
40
60
80
Ap
r-0
8
Jun
-08
Au
g-0
8
Oct
-08
Dec
-08
Feb
-09
Ap
r-0
9
Jun
-09
Au
g-0
9
Oct
-09
Dec
-09
Feb
-10
Ap
r-1
0
in p
erce
nt
Figure 3.2.1: Change in Cotton Prices (YoY)
WPI cotton index Cotton outlook 'A' index
Source : FBS, IMF

4 Money and Banking1
4.1 Monetary Policy
The key challenge for the SBP
in the last 12 months has been
to support the recovery in
economic growth while curbing
inflationary pressures. Easing
of inflation from an average of
over 20.8 percent in FY09 to
about 10.3 percent in H1-FY10
allowed the SBP to cut its
policy rate by 150 basis points
during the first six months of
the current fiscal year.
However, resurgence in
inflationary pressures in Q3-
FY10 (with an average of 13.2 percent during the quarter) along with an
expansionary fiscal stance and weakening external receipts, all militated against a
further easing of monetary policy. Consequently, the SBP decided to keep the
policy rate unchanged at 12.5 percent in two consecutive monetary policy
announcements (i.e. January and March 2010).
Despite a sustained rise in LSM production during Q3-FY10 over the same period
last year,2 contribution of domestic supply-side pressures to inflation remained
limited due to the prevailing excess capacity in a number of industries.3 This is
also evident from a gradual decline in core inflation - as measured by NFNE (non-
food, non-energy) –to single digit (i.e. 9.9 percent) by March 2010.4 However,
NFNE bounced back to 10.6 percent in April, 2010. The trend reversal in NFNE
in April 2010 indicates strengthening inflationary pressures, possibly due to
second round effects of persistently high food and energy inflation (see Figure
4.1). Though a part of the rise in inflation was expected on account of upward
revisions in electricity tariffs, increases in prices of key international commodities
1 The money and banking analysis is based on data available up to April 2010. 2 During Q3-FY10 LSM growth was 9.6 percent compared with a fall of 12.0 percent in the same
period last year. 3 For detail, see section 2.2: Large Scale Manufacturing. 4 NFNE YoY inflation dropped to 9.9 percent by end-March 2010, compared with 18.5 percent in
March 2009.
3
8
13
17
22
27
Jun
-06
Sep
-06
Dec
-06
Mar
-07
Jun
-07
Sep
-07
Dec
-07
Mar
-08
Jun
-08
Sep
-08
Dec
-08
Mar
-09
Jun
-09
Sep
-09
Dec
-09
Mar
-10
per
cen
t
Overall Core (trimmed) Core (NFNE)
Figure 4.1: CPI Inflation (YoY)

Third Quarterly Report for FY10
46
such as crude oil, pulses, metal and cotton compounded the inflationary pressures.
While CPI YoY inflation in April 2010 has been substantially low when compared
with 17.2 percent in April 2009, it exhibits persistence and thus carries the
potential to fuel the inflation expectations in the economy.5
An allied concern is the persistent upwards pressure on the external account.
Though the current account deficit dropped to US$ 3.0 billion during Jul-Apr
FY106 – the lowest deficit in the last four years - compared with US$ 9.0 billion in
Jul-Apr FY09, the continued fall in capital and financial inflows has exerted
considerable pressure on the overall external account balance. Putting this in
perspective, financing of even a small current account deficit became increasingly
challenging given the uncertainty on realization of promised external inflows,
particularly the Tokyo pledges.
The problems attached with timely realization of external inflows were worsened
by rising fiscal spending and low tax receipts, pushing the fiscal deficit upward. 7
This situation coupled with lingering quasi-fiscal activities such as continued
borrowing of energy sector due to circular debt and lower than expected
retirement by procurement agencies and food departments for commodity
operations led to a buildup of pressures on banking system liquidity. As a result,
it appears that financing costs for the government may go up considerably. The
sharp increase in government borrowing costs has implications not just for the
fiscal account, but also exerts upward pressure on the corporate sector lending
rate. Anecdotal evidence suggests that banks are benchmarking corporate sector
rate equivalent to the high
government rate.
In the face of lower than
anticipated external inflows
(mainly the third IMF tranche)
the financing mix of the fiscal
deficit in Q3-FY10 is likely to
skew towards the banking
system.8 Specifically, the
5 More importantly, core inflation measured by trimmed mean has also shown resilience in recent
months. 6 It must be noted here that the recent increase in imports were largely offset by the receipts against
logistic supports and high worker remittances. 7 It may be noted here that fiscal deficit in H1-FY10 was Rs 403.3 billion much higher compared
with Rs 249.5 billion in H1-FY09. Even though the IMF also provided relaxation in the target of
fiscal deficit for Q2-FY10. For detail, see Chapter 5: Fiscal Developments. 8 Data for Q3-FY10 was not available. However, anecdotal evidence suggests that government
borrowing from the banking system has increased substantially.
Table 4.1: Breakup of NDA Contribution in FY10
percentage points
Jul-Apr Q1 Q2 Q3
NDA growth
(percent) 9.8 0.1 7.2 0.4
Government 7.1 0.8 1.9 1.0
Non-government 2.7 -0.7 5.3 -0.6

The State of Pakistan’s Economy
47
government exceeded its quarterly limits of deficit monetization agreed with IMF
for end March 2010. Government borrowing from the SBP was in addition to the
government financing requirement for heavy maturities of T-bills; though these
have been rolled over by scheduled banks as the seasonal credit off-take remained
low during the period of analysis.
Consequently, most of the contribution in NDA of the banking system came from
government related financing in Jul-Apr FY10 (see Table 4.1). Thus, unlike last
year, M2 growth is largely explained by NDA expansion during Jul-Apr FY10.
4.2 Developments in Monetary Aggregates
Growth in broad money aggregates (M2) increased sharply to 8.1 percent during
Jul-Apr FY10, despite a steep contraction of Rs 56 billion in Jan-23 Apr FY10
(see Table 4.2). Indeed the cumulative growth in M2 was 5.5 percent during Jul-
23 rd
Apr FY10. The large impetus to M2 growth in the last week of April 2010
came from a continued increase in government financing requirement for
Table 4.2: Monetary Aggregates
flows in billion Rupees, growth in percent
Flows Growth
Jul-Apr Jan-Apr Jul-Apr
FY09 FY10 FY09 FY10 FY09 FY10
Broad money (M2)
114.1 414.0 11.4 74.4 2.4 8.1
NFA
-226.9 -37.5 65.0 -41.5 -34.0 -7.2
SBP
-246.9 -12.2 47.0 -32.4 -51.4 -3.8
Scheduled banks 20.0 -25.3 18.0 -9.1 10.7 -13.1
NDA
341.0 451.5 -53.6 115.9 8.5 9.8
SBP
157.1 121.6 -56.8 12.8 20.3 13.8
Scheduled banks 184.0 329.9 3.2 103.1 5.7 8.8
of which
Government borrowing 315.2 325.0 95.7 203.5 20.9 16.0
For budgetary support 250.3 361.4 40.0 230.6 18.3 21.5
SBP 124.4 168.5 -98.4 231.2 12.0 14.5
Scheduled banks 125.9 192.9 138.4 -0.6 38.0 37.3
Commodity operations 66.7 -35.6 55.8 -27.6 52.4 -10.6
Non-government sector 185.3 217.7 -79.1 0.9 6.1 6.8
Credit to private sector 43.4 144.3 -159.89 19.7 1.5 5.0
Credit to PSEs 142.1 72.5 80.7 -20.5 125.0 27.2
Other items net -159.5 -91.1 -70.2 -88.5 31.5 15.1

Third Quarterly Report for FY10
48
budgetary borrowing 9and rise in net foreign assets (NFA) of the banking
system.10,11
It may be noted here that
though government recourse to
bank financing remained
substantially higher during
FY10 so far than the increase
seen in the corresponding
period of last year,12
the impact
of this on M2 growth was partly
offset by a contraction in NFA
of the banking system.
Net Foreign Assets (NFA)
The contraction in the stock of
NFA of the banking system
which began in October 2009
continued in Jan-Apr FY10 as
well; as pressures on external
account persisted largely on
account of lower than
anticipated external inflows
(see Figure 4.3). Putting this in
perspective, had these expected
external inflows realized, NFA
of the banking system would
have witnessed a net inflow
during the period of analysis.
Similar to Q2-FY10, the
depletion in NFA of the
banking system during Jan-Apr
FY10 was mainly evident in the SBP NFA due to the retirement of official loans;
9 During the last week of April 2010 government borrowed Rs 75.0 billion from the banking system
compared to Rs 155.6 billion during Jan-23rd Apr FY10. 10 Consequently, growth in M2 during Jan-Apr FY10 is mainly driven by NDA, which is in contrast
to Jan-Apr FY09, when NFA was mainly responsible for M2 growth (see Figure 4.2). 11 During the last week of Apr FY10, NFA of the banking system rose sharply mainly on account of
inflows of logistic support funds of US$188 million. 12 In particular, government borrowing from SBP exceeded its quarterly ceiling by end Mar 2010.
The outstanding stock of government borrowing from SBP on cash basis reached Rs 1,193.7 billion
by end March 2010, Rs 63.7 billion higher than the quarterly target ceiling.
-1.2
-0.6
0.0
0.6
1.2
1.8
2.4
NDA NFA
per
cen
tage
po
ints
FY09 FY10
Figure 4.2: Contribution to M2 Growth (Jan-Apr)
-60
-45
-30
-15
0
15
30
45
Jul-
09
Au
g-0
9
Sep
-09
Oct
-09
No
v-0
9
Dec
-09
Jan
-10
Feb
-10
Mar
-10
Ap
r-1
0
bil
lio
n R
s
SBP Scheduled banks
Figure 4.3: Cumulative Flows of Banking System NFA

The State of Pakistan’s Economy
49
particularly the Sukuk bond
payment in the month of
January 2010 (see Figure
4.4).13
These payment
pressures on SBP NFA were
compounded by (a) SBP net
forex interventions in the
interbank market January 2010
onwards, and (b) non-
materialization of IMF third
tranche of US$ 338 million in
March 2010. The impact of
these factors overshadowed the
inflows of official grants and
coalition support funds.14
NFA of the scheduled banks witnessed a depletion of Rs 25.3 billion during Jul-
Apr FY10 compared to a net expansion of Rs 20 billion in the corresponding
period last year. Substantial retirement of foreign currency loans by the traders
last year, mainly explained the net expansion in NFA of the scheduled banks.
However, these retirements remained significantly lower during Jul-Apr FY10.
This coupled with high payments of oil imports, a fall in foreign investments and
lower inflows under net foreign private loans exerted considerable pressure on
NFA of the scheduled banks
during the period under review.
Net Domestic Assets (NDA)
After hitting a 32- month low
YoY growth in end-October
2009 (10.2 percent), the YoY
growth in NDA accelerated in
the following months (see
Figure 4.5). Resultantly, NDA
of the banking system grew by
9.8 percent in Jul-Apr FY10;
slightly higher than the growth
(8.5 percent) recorded in the
13 Besides Sukuk bonds, other official payments include IDB and World Bank. 14 The country received US$ 184.9 million official grants and US$ 537.4 million as logistic support
during Jan-Apr FY10.
6
12
18
24
30
36
Feb
-07
May
-07
Au
g-0
7
No
v-0
7
Feb
-08
May
-08
Au
g-0
8
No
v-0
8
Feb
-09
May
-09
Au
g-0
9
No
v-0
9
Feb
-10
perc
en
t
Figure 4.5: YoY Growth in NDA of the Banking System
-180
-135
-90
-45
0
45
90
FY
09
FY
10
FY
09
FY
10
FY
09
FY
10
Q1 Q2 Q3
bil
lio
n R
s
Jan Feb Mar
Figure 4.4: Quarterly Trends in NFA of SBP
Sukuk payment

Third Quarterly Report for FY10
50
same period last year. Two developments make the Jul-Apr FY10 NDA growth
particularly significant: persistently high governement borrowing from the
banking system, and lower than expected retirement under commodity finance.
Government Borrowing for Budgetary Support
The government’s borrowing from the banking system during Jul-Apr FY10 rose
by Rs 361.4 billion compared to Rs 250.3 billion in the corresponding period last
year. Half of this cumulative increase in government borrowing during Jul-Apr
FY10 was visible January 2010 onwards.15
A considerably high reliance on the
banking system by the government for budgetary borrowing during Jan-Apr FY10
was caused mainly by (a) a continued increase in fiscal spending; (b) lower than
anticipated external flows; and (c) low inflows in NSS during Q3-FY10 compared
with the same period last year.
Within the banking system, the central bank provided the bulk of budgetary
finance during Jan-Apr FY10. It may,however, be noted that this incremental
budgetary borrowing from the SBP does not include the government’s funding
requirements related with maturing T-bills that were rolled over by commercial
banks. The government borrowed above its auction target (net of maturity) in Q3-
FY10 (see Table 4.3), and
exceeded the quaterly limits for
deficit monetization agreed with
IMF by end-March 2010.
Interestingly, the later was
despite the transfer of non-tax
reciepts in the month of March
2010. This suggests that the
available room for the
government’s borrowing from SBP in the final quarter of FY10 would be lower
given the end-June 2010 target. In addition, uncertainty attached with the
realization of committed external flows and funds mobilized through non-bank
sources suggests high recourse to the scheduled banks in months ahead.
Commodity Finance
The outstanding stock of commodity finance declined by Rs 35.6 billion during
Jul-Apr FY10, compared with net increase of Rs 66.7 billion in the same period
last year. Most of this retirement was recorded in wheat finance and is visible in
Jan-Apr FY10. In particular, the stock of wheat loans declined by Rs16.3 billion
15 During Jan-Apr FY10, government borrowing increased by Rs 203.5 billion – substnatially higher
when comapred with a rise of Rs 95.7 billion in the same period last year.
Table 4.3: T-bills Auction Analysis during FY10
billion Rupees
Jul-Apr Q1 Q2 Jan-Apr
Net targets 248.3 144.2 70.1 34.0
Net offer 1,667.4 596.7 438.0 632.7
Net acceptance 376.4 188.7 86.6 101.1
Auction maturities 796.7 180.8 74.9 541.0

The State of Pakistan’s Economy
51
during Jan-Apr FY10 to reach Rs 220.3 billion by end April 2010; still higher than
Rs 149.9 billion in April 2009.
With less than the expected retirement under wheat finance by the government
agencies, additional bank finance for the procurement of the 2010 wheat crop will
exert pressures on banks’ liquidity. In this enviroment, it appears that financing
rates for commodity operations may go up considerably as banks are pricing
liquidity and maturity risks associated with commodity operations.16
Further,
given the limited funding resources available to the government, the pricing power
of banks appears to have increased in recent months.
Public Sector Enterprises (PSE)
The cumulative growth in PSE borrowing was 27.2 percent in Jul-Apr FY10
compared with a robust growth of 125.0 percent in the same period last year.
Retirements by a few POL related PSEs, and low credit disbursement to a public
sector steel mill in Jan-Apr FY10 has limited the net expansion of PSEs borrowing
during FY10 so far.17
This public sector steel mill is unable to open LCs for raw material imports despite
strong demand as banks are reluctant to disburse incremental loans on account of
huge net losses of the entity.
Despite the lingering issue of circular debt in the energy sector, a few POL related
PSEs showed retirement during Jan-Apr FY10 on account of their receipts from
the suppliers in the month of
March 2010.
4.3 Private Sector Credit
Credit to the private sector
expanded in Q3-FY10 by Rs
22.6 billion compared with a
sharp contraction of Rs 127.1
billion in the same period last
year (see Figure 4.6).
16 For instance, banks are charging around KIBOR plus 2.5 to 2.75 percent on commodity operation
loans at present, which is considerably high when compared with KIBOR plus 2.0 in June 2009. 17 High PSE borrowing in Q3-FY09 was on account of issuance of PPTFCs by a public sector entity
to settle part of circular debt claims.
Table 4.4: Flows in Advances to Private Sector
billion Rupees
Jul-Dec Jan-Mar
FY09 FY10 FY09 FY10
Credit to private sector 203.1 124.6 -127.1 22.6
Business sector advances 194.1 124.7 -93.6 23.0
Working capital 74.0 58.6 -109.3 2.8
Fixed investment 122.0 46.0 15.1 21.6
Trade financing -1.3 19.6 0.5 -0.8

Third Quarterly Report for FY10
52
The deceleration in credit was
largely explained by
exceptionally low demand for
working capital loans during
the period under review (see
Table 4.4). The decline was
broad-based, as a large number
of industries witnessed
retirement; except a few
industries (see Table 4.5). For
instance, the seasonal credit
demand in sugar sector was Rs
47 billion in Q3-FY10-
exceptionally high- compared
with an average increase of Rs
18.7 billion during the last four
years. Interestingly, this increase in credit demand was despite the decline seen in
the sugar production. This apparent anomaly is explained by high sugarcane
prices in response to supply shortages as a result of a poor 2010 crop.
In contrast, demand for fixed investment loans witnessed a rise in Q3-FY10,
largely visible in a few sectors such as power, telecoms, and textile. Borrowing
by few corporates in the telecommunications sector was largely to finance import
LCs. Further, a rise in textile machinery imports as a result of incentives
announced by the government and the SBP18
partly explain credit demand for
long-term loans under the long term financing facility (LTFF) during the period of
analysis.
Since most industries are still operating under capacity, demand for additional
financing for capital expenditure is likely to remain limited in the months ahead.
18 In September 2009, import duty on textile machinery was completely eliminated, compared to 5
percent previously. Further, SBP has extended the refinancing of second hand machinery under the
LTFF scheme up-to June 30, 2010. For detail, see SMEFD Circular Letter No. 3 of 2010.
-90
0
90
180
270
360
450
Jul
Au
g
Sep Oct
No
v
Dec
Jan
Feb
Mar
Ap
r
May Jun
bil
lio
n R
s
Avg. (FY05-06) Avg. (FY07-08)FY09 FY10
Figure 4.6: Cumulative Flows in Private Sector Credit

The State of Pakistan’s Economy
53
Further, it is worth
mentioning that renewed
interest by banks’ towards
consumer financing –
primarily auto finance - was
observed January 2010
onwards. Recovery in this
segment reflects a strong
performance of the
automobile industry
coupled with significantly
increased efforts by banks.
Anecdotal evidence
suggests that banks
campaigns –e.g.
partnerships with
automakers to facilitate the
financing procedure for
clients and offering specific
car brands on reduced mark
ups – supported credit off-
take observed during the
period under review.
4.4 Deposit Mobilization19
The gradual pickup in the
deposit base which began in
September 2009 continued
in the subsequent months. Resultantly, deposits of the banking industry recorded
robust growth of 8.6 percent during Jul-Apr FY10, in stark contrast to a
contraction of 0.2 percent in the corresponding period of FY09.20
While monetary
expansion supported deposit growth in Q2-FY10, growth during Q3-FY10-
despite a contraction in M2- largely reflects the absorption of currency in
circulation into the banking system. 21
The acceleration in deposit growth during Jul-Apr FY10 is particularly significant
because of:
19 The analysis is based on total deposits of the banking industry, including government deposits. 20 It may be noted that average growth for the Jul-Apr period for FY07-08 stood at 7.7 percent. 21 The currency-to-deposit ratio declined to 31.3 percent by end-April 2010, from 34.1 percent in
November 2009. However, it remained higher than the average of 29.8 percent for Apr FY08-09.
Table 4.5: Break-up of Working Capital Loans (Jan-Mar)
billion Rupees
FY09 FY10
Working capital loans -109.3 2.8
Excluding advances to sugar sector -131.0 -44.2
A. Agriculture -0.9 -1.6
B. Manufacturing -51.7 16.8
a. Food products and beverages 10.7 43.4
Rice processing -4.0 -2.1
Edible oil and ghee -3.6 0.0
Sugar 21.6 47.0
b. Textiles -30.8 -16.1
Spinning of fibers -17.6 -12.9
c. Coke, refined petroleum products -1.4 2.2
d. Chemicals -13.1 -6.9
Fertilizers and nitrogen compounds -6.2 -3.7
e. Non-metallic mineral products -4.4 0.5
Cement -2.7 0.0
C. Electricity, gas and water supply -26.8 2.0
Production, transmission, distribution of power -25.7 2.2
D. Construction -2.0 -1.4
E. Commerce and trade -9.5 -9.8
F. Transport, storage, and communications -5.4 2.0
Telecommunications -5.4 1.6
G. Real estate, renting, and business activities -7.5 -1.5
Other business activities -7.1 -0.3
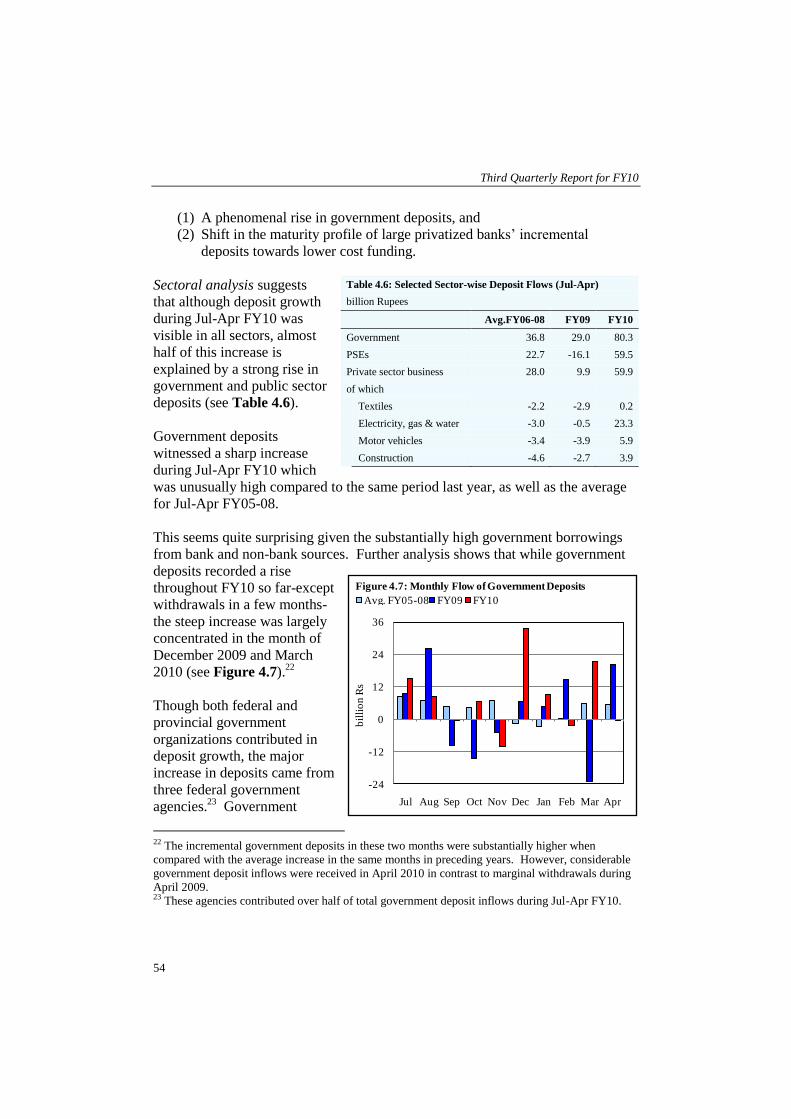
Third Quarterly Report for FY10
54
(1) A phenomenal rise in government deposits, and
(2) Shift in the maturity profile of large privatized banks’ incremental
deposits towards lower cost funding.
Sectoral analysis suggests
that although deposit growth
during Jul-Apr FY10 was
visible in all sectors, almost
half of this increase is
explained by a strong rise in
government and public sector
deposits (see Table 4.6).
Government deposits
witnessed a sharp increase
during Jul-Apr FY10 which
was unusually high compared to the same period last year, as well as the average
for Jul-Apr FY05-08.
This seems quite surprising given the substantially high government borrowings
from bank and non-bank sources. Further analysis shows that while government
deposits recorded a rise
throughout FY10 so far-except
withdrawals in a few months-
the steep increase was largely
concentrated in the month of
December 2009 and March
2010 (see Figure 4.7).22
Though both federal and
provincial government
organizations contributed in
deposit growth, the major
increase in deposits came from
three federal government
agencies.23
Government
22 The incremental government deposits in these two months were substantially higher when
compared with the average increase in the same months in preceding years. However, considerable
government deposit inflows were received in April 2010 in contrast to marginal withdrawals during
April 2009. 23 These agencies contributed over half of total government deposit inflows during Jul-Apr FY10.
Table 4.6: Selected Sector-wise Deposit Flows (Jul-Apr)
billion Rupees
Avg.FY06-08 FY09 FY10
Government 36.8 29.0 80.3
PSEs 22.7 -16.1 59.5
Private sector business 28.0 9.9 59.9
of which
Textiles -2.2 -2.9 0.2
Electricity, gas & water -3.0 -0.5 23.3
Motor vehicles -3.4 -3.9 5.9
Construction -4.6 -2.7 3.9
-24
-12
0
12
24
36
Jul Aug Sep Oct Nov Dec Jan Feb Mar Apr
Avg. FY05-08 FY09 FY10
bil
lio
n R
s
Figure 4.7: Monthly Flow of Government Deposits

The State of Pakistan’s Economy
55
deposits were not only concentrated in a few agencies, but also in a few banks.
Specifically, more than half of
incremental government
deposits in Jul-Apr FY10 were
recorded in three public sector
banks.24
Similar to government deposits,
public sector enterprises (PSEs)
recorded buoyant deposit
inflows during the current fiscal
year compared to net withdrawals during Jul-Apr FY09. Interestingly, PSE
deposit inflows were also visible mainly in the months of December 2009 – led by
a few power sector entities – and April 2010.25
In terms of maturity profile,
incremental deposits of the
banking system shifted sharply
towards shorter tenors during
Jul-Apr FY10 compared to
previous years26
. In particular,
inflows under the fixed
category slowed; as banks
mobilized nearly half of their
deposits under the savings
category (see Table 4.7).
The lower contribution of fixed
deposits27
in total deposit
growth during Jul-Apr FY10
mainly reflects considerable
24 It may be noted that one large public sector bank alone accounted for over half of the total increase
in government deposits over Jul-Apr FY10 period. 25 PSE deposit inflows of Rs 30.1 billion were registered in Dec 2009, with one enterprise
accounting for one-third of the inflow. Further inflows of Rs 36.7 billion received in April 2010
with one entity contributing almost half of this. 26 It may be noted that during FY09, large privatized banks provided a significant impetus to fixed
deposit growth. 27 It may be noted that the contribution of fixed deposits to total deposit growth for Jul-Feb FY10 is
almost half of that for the Jul-Apr period – this reflects significant government current withdrawals
in a large public sector bank, and subsequent placement under the fixed category in March 2010.
Table 4.7: Maturity-wise Contribution to Deposit Growth
(Jul-Apr)
percentage points
Avg.FY07-08 FY09 FY10
Fixed 5.3 4.1 1.8
Savings 1.3 -0.9 4.1
Current 1.1 -3.3 2.7
Total growth (percent) 7.7 -0.2 8.6
* includes all current and other categories
0
32
64
96
128
160
-44
-22
0
22
44
66
88
FY 08 FY 09 FY 10
Large pvt. banks Other dom. pvt. banksAll banks (RHS)
Figure 4.8: Fixed Deposit Flows during FY08-10 (Jul-Apr)
bil
lio
nR
s
bil
lio
nR
s

Third Quarterly Report for FY10
56
fixed deposit withdrawals in the large privatized banks28
during Q1 and Q3.
These withdrawals were strong enough to offset the increase seen under the same
category in other domestic private banks 29
(see Figure 4.8).
However, fixed deposit withdrawals in large privatized banks, must be seen in the
context of the extraordinary surge in the same category due to the rumor driven
deposit withdrawal during the
period of Sep-Oct 08. Last
year, these banks faced
considerable withdrawals in
shorter tenor deposits, and
responded by increasing their
fixed deposit base.30
Therefore,
fixed deposit withdrawals
during Jul-Apr FY10 possibly
reflect a strategic shift by these
banks to lower the interest
burden associated with longer-
tenor time liabilities.
Consequently, these
withdrawals brought the share
of fixed deposits in their total
deposit base close to its pre-
crisis level by end-April 2010
(see Figure 4.9).
Nonetheless, total deposits of
large privatized banks increased
by Rs 56.5 billion, on account of
mobilizing shorter tenor
individual and corporate
deposits during Jul-Apr FY10;
compared with a net withdrawal
of Rs 11.5 billion in the same
28 Large privatized banks faced fixed deposit withdrawals of Rs 39.3 billion during Jul-Apr FY10.
However, it may be noted that in contrast to other large privatized banks, one bank in the group
increased its fixed deposit base during this period. 29 This group comprises domestic private banks that are not in the merged or Islamic category. 30 To put this in perspective, Rs 66.6 billion was mobilized under the fixed category by these banks
during Jul-Apr FY09. This was exceptionally high compared to an average increase of Rs 23.5
billion for Jul-Apr FY 07-08.
Table 4.8: Bank Group Deposit Flows (Jul-Apr)
billion Rupees
FY09 FY10
Public sector 38.7 113.1
Large privatized -11.5 56.5
Other domestic private -3.3 99.6
Merged 6.1 30.6
Islamic 28.9 41.0
Foreign 15.0 10.7
All banks* -5.9 351.6
*includes specialized banks
-45
-30
-15
0
15
30
45
18
20
22
24
26
28
30
May
-06
Sep
-06
Jan
-07
May
-07
Sep
-07
Jan
-08
May
-08
Sep
-08
Jan
-09
May
-09
Sep
-09
Jan
-10
Flows (RHS) Stocks as percent of total depositsp
erce
nt
Figure 4.9: Large Privatized Banks' Fixed Deposits
bil
lio
nR
s

The State of Pakistan’s Economy
57
period last year (see Table 4.8)31.
On the other hand, other domestic private banks witnessed a sharp increase in
their fixed and saving deposits during Jul-Apr FY10 compared with the same
period last year. These banks attracted longer-tenor deposits by offering
competitive returns, as well as a wide range of savings products. Thus, the total
deposit base of other domestic private banks increased by Rs 99.6 billion during
Jul-Apr FY10 compared with Rs 3.3 billion in the corresponding period last year.
A disaggregated analysis highlights two banks from this group that received
almost one-fourth of the banking industry’s fixed and saving deposit inflows for
Jul-Apr FY10. While one bank received considerable government deposits during
this period, the other bank achieved this mainly by mobilizing private individual
deposits.
31 It may be noted that Islamic banks recorded significant deposit growth during Jul-Apr FY10 as
well as in the corresponding period in previous years. Anecdotal evidence suggests this significant
increase in the deposit base enabled these banks to actively participate in Shariah compliant
interbank placements in an environment of liquidity pressures facing the banking industry.

5 Fiscal Developments
5.1 Overview
The budgetary data for Q3-FY10 is not yet available, but some preliminary
information suggests that the fiscal sector is under stress and the government is
likely to miss its budget deficit target. Although the FBR has regained its revenue
path in the third quarter of the year and non-tax revenue also propped up by
appropriation of SBP profit and realization of coalition support fund of US$ 349.0
million, the budget deficit is expected to be higher than the target primarily
because of higher than budgeted public expenditure.
After revenue shortfall in H1-FY10, FBR improved its performance in the third
quarter of the year with 26 percent growth in the tax receipts. However, going
forward, achievement of tax revenue target for FY10 will remain challenging for
the FBR as it would require a YoY growth of 37.6 percent during Q4-FY10 to
attain Rs 1.38 trillion tax collection (budget) target for the year; compared with 5-
year average tax revenue growth in the last quarter at 15.7 percent.
The widening budgetary imbalance was predominantly financed by banking
system during Jul-Mar FY10 raising risks of crowding out of private investment.
The government needs to take steps for fiscal consolidation challenged by high
security outlays and severe external financing shortfalls. The government has
indicated that it intends to slash non-priority development spending to handle
these fiscal risks. This suggests the need to urgently work towards broadening the
tax base to provide required essential services and public goods. It remains to be
seen if the current drive by FBR to replace general sales tax by a value added tax
(VAT) will significantly help expand the tax base and curb leakages in the revenue
stream.
5.2 Domestic Budgetary Financing1
Budgetary financing from domestic sources stood at Rs 535.3 billion during Jul-
Mar FY10 compared to Rs 321.2 billion in the same period a year earlier. Apart
from showing a rise in fiscal deficit, the sharp increase in financing from domestic
sources was due to the shortfall in financing from external sources. Within
1 This section is mainly based on SBP estimates, derived from Monetary Survey and outstanding
stock of domestic debt, as MoF numbers will only be available by end-May 2010. Also, budgetary
financing numbers consider the impact of government deposits with the banking system whereas the
debt numbers do not.

The State of the Pakistan’s Economy
60
domestic sources of budgetary finance, non-bank contribution witnessed a strong
expansion with its share in the total domestic source of financing jumping to 60.6
percent in Jul-Mar FY10 from 44.7 percent in the same period last year.
Moreover, financing from the banking system, during this period, increased by
19.6 percent YoY.
Financing from Banking
System2
Net budgetary financing from
the banking system was Rs
210.8 billion during Jul-Mar
FY10 compared to Rs 176.2
billion during the same period
last year. Although,
government financing from the
SBP decreased compared to the
same period last year, it
exceeded the quarterly limit
imposed by IMF for the first
time since the inception of the
program. During Jul-Mar
FY10, the SBP provided Rs
66.8 billion through issuing
of fresh MRTBs to the
government. However the
net budgetary financing
amounts to Rs 30.0 billion,
as government deposits with
the SBP (including other
deposits) stood at Rs 36.8
billion during the period (see
Figure 5.1).
During Jul-Mar FY10,
financing from scheduled
banks through government
securities amounted to Rs 261.2 billion which is more than twice the amount
2 Budgetary financing from the banking system is worked out on cash basis and hence, these will
differ from government financing numbers reported in the section on Money and Credit where data
is measured on accrual basis.
0
25
50
75
100
125
Q1 Q2 Q3 Q4 Q1 Q2 Q3
FY09 FY10
bil
lio
n R
s
BSC+PBA SSC+SSA RIC+MAA
Figure 5.2: Net Financing through Major NSS Instruments
-132
0
132
264
396
FY08 FY09 FY10
bil
lio
n R
s
Scheduled banks SBP
Figure 5.1: Borrowing from the Banking System

Third Quarterly Report for FY10
61
invested a year earlier during the same months. The increase in financing from
scheduled banks through government securities reflect their interest in relatively
risk free government T-bills compared to risk prone credit to private sector. The
increase in government deposits with the scheduled banks limited the net
financing to Rs 180.8 billion. Although a reduction in financing from SBP would
be helpful in containing inflationary pressures to some extent, a rise in government
financings from the scheduled banks will have negative implications for liquidity
and will place upward pressure on interest rates.
Financing from Non-bank
Net receipts from NSS instruments (including prize bonds) during Q3-FY10 stood
lower than that of the same period last year. However, due to higher net receipts
in the first two quarters of FY10, net financing through NSS instruments during
Jul-Mar FY10 reached Rs 169.4 billion compared to Rs 163.6 billion during the
same period last year.
Within NSS instruments, Behbood Savings Certificates (BSC) and Pensioners
Benefit Account (PBA) together fetched Rs 59.2 billion during Jul-Mar FY10 for
budgetary financing that is less by an amount of Rs 14.7 billion from the previous
year (see Figure 5.2). Special Savings Certificates (SSC) and Special Savings
Account (SSA) together fetched an amount almost equal to that of the
corresponding period a year earlier. Also the government issued a new NSS
instrument ‘National Savings Bonds’ (NSB) in January 2010 through which an
amount of Rs 3.7 billion was mobilized up to March 2010.
5.3 FBR Tax Collection
During third quarter of FY10, FBR tax revenue showed robust performance
largely due to increased collection under the head of direct taxes and import-based
indirect taxes. During Jul-Mar FY10 total tax collection stood at 65.9 percent of
Table 5.1: FBR Tax Collection (Net) during Jul-Mar
billion Rupees; change in percent
Net collection Percent of
annual target YoY change
Annual target
FY09 FY10 FY09 FY10 FY09 FY10 FY09 FY10
Direct taxes 498.9 565.6 307.6 342.3 61.7 60.5 19.4 11.3
Indirect taxes 751.1 814.4 507.5 567.3 67.6 69.7 20.2 11.8
Sales tax 469.9 499.4 321.1 371.2 68.3 74.3 24.2 15.6
FED 112.0 152.8 81.0 84.4 72.3 55.2 31.1 4.2
Customs 169.2 162.2 105.4 111.7 62.3 68.9 3.4 6.0
Total collection 1,250.0 1,380.0 815.1 909.6 65.2 65.9 19.9 11.6
Source: Federal Board of Revenue

The State of the Pakistan’s Economy
62
the annual budget target (see Table 5.1). To achieve the annual target, FBR is
required to collect Rs 157.0 billion per month on the average in the remaining
three months of FY10.
Direct Tax Collection
Growth in direct tax
collection which remained
very subdued in H1-FY10
accelerated to 11.3 percent
during Jul-Mar FY10. The
collection of the direct taxes
during Jan-Mar 2010
remained robust compared
with the same months of the
last year. This reflects the
effect of the extension
announced by the FBR in the
due date of filing the income
tax returns.3
The FBR administration introduced a change in the advanced tax payment system
according to which the quarterly advanced tax payment is now to be paid by 15th
of the following month. As a result, we see a shortfall in direct tax collection
compared to interpolated monthly targets in last month of each quarter and a
corresponding increase in next month, i.e., October 2009, January 2010 and
expectedly April 2010 (see
Figure 5.3).
Indirect Tax Collection
Collection from indirect taxes
also improved in the third
quarter of FY10 largely due to
increase in tax receipts from
import source (see Table 5.2).
During Jul-Mar FY10, indirect
tax collection reached 69.7
percent of the annual budget
3 FBR extended the date for filing of income tax returns up to January 25, 2010. This is why income
tax payment shifted to month of January 2010, resulting in an increase in direct tax collection during
January 2010.
Table 5.2: Indirect Tax Collection (Net) during Jul-Mar
billion Rupees, growth in percent
Collection
Growth rate
FY09 FY10
FY09 FY10
Imports 263.3 294.0
3.7 11.6
Sales tax 147.3 172.9
3.9 17.4
FED 10.7 9.4
4.2 -12.1
Customs duty 105.4 111.7
3.4 6.0
Domestic 244.2 273.3
44.9 11.9
Sales tax 173.9 198.3
48.7 14.0
FED 70.3 75.0
36.3 6.7
Total collection 507.5 567.3
20.2 11.8
Source: Federal Board of Revenue
0
20
40
60
80
100
Jul Aug Sep Oct Nov Dec Jan Feb Mar
bil
lio
n R
s
FY09 FY10 Targets for FY10*
Figure 5.3: Month-wise DirectTax Collection
* Monthly targets worked out by SBP on the basis of annual targets and monthly seasonal pattern of tax collection.

Third Quarterly Report for FY10
63
target reflecting 11.8 percent YoY growth. Within indirect taxes the performance
of sales tax remained encouraging.
Sales Tax
During Jul-Mar FY10 sales tax collection registered YoY growth of 15.6 percent,
while collection amounted to 74.3 percent of the annual target. This was
contributed by sales tax from imports that showed a growth of 17.4 percent during
Jul-Mar FY10 compared with 3.9 percent growth in the corresponding period last
year. Although sales tax collection from domestic goods and services has not
been encouraging so far compared to the last year, a revival in the economy
coupled with increase in prices of electricity are likely to increase collection from
domestic sources in the months ahead.
Federal Excise Duty (FED)
Federal excise duty registered the lowest growth of all the FBR taxes during Jul-
Mar FY10. Unlike other FBR taxes, collection from FED during Q3-FY10
remained slightly below than the first two quarters of FY10.
Customs Duty
Growth in collection from
customs duty which remained
negative upto H1-FY10
turned positive during
January 2010, resulting in an
overall growth of 6.0 percent
during Jul-Mar FY10. This
is in line with recent growth
in rupee value of imports (see
Figure 5.4). A higher
growth in customs duty than
the growth in its base, i.e.,
imports, indicates the
buoyant nature of the tax.
However, actual performance
of this tax can be analyzed with disaggregated information of dutiable and non-
dutiable imports that is not available yet.
-24
-18
-12
-6
0
6
Jul-
09
Au
g-0
9
Sep
-09
Oct-
09
No
v-0
9
Dec-0
9
Jan
-10
Feb
-10
Mar-
10
perc
en
t
Rupee value of imports Customs duty
Figure 5.4: Cumulative Growth in Imports and Customs Duty

The State of the Pakistan’s Economy
64
5.4 Domestic Debt4
After sharp rise of 7.0 percent
in Q2-FY10, the growth in
domestic debt moderated to 4.4
percent during Q3-FY10 (see
Figure 5.5). The slowdown in
the growth of domestic debt
was despite the increase in the
fiscal deficit and weak external
financing inflows. The
apparent disconnect is
explained by huge withdrawals
of government deposits with the
central bank.
Composition of Domestic Debt
With shortfall on account of
budgeted external financing in
the presence of higher fiscal
deficit, the government had to
rely on additional financing
from domestic sources. In the
absence of substantial inflow
from NSS, financing structure
remained skewed toward
banking system during Jul-Mar
FY10. Scheduled banks’
increased participation in T-
bills auctions; funded Rs 310.6
billion government budget
deficit compared to Rs 159.1
billion in the same period last
year. Consequently, dominance of short term debt in total domestic debt
continued for the second consecutive year. This reflects increased vulnerability to
adverse short-term interest rate movements that could introduce uncertainty in
future debt management.
4 It includes FEBCs, FCBCs, DBCs and Special US Dollar Bonds held by the residents. Previously,
these were the part of External Debt Liabilities which are now in Domestic Debt.
4
5
6
7
8
Q1 Q2 Q3
perc
en
t
FY09 FY10
Figure 5.5: Growth in Domestic Debt
0
12
24
36
48
60
FY07 FY08 FY09 FY10
bil
lio
n R
s
Ijara Sukuk PIBs Prize bonds
Figure 5.6: Net Flows in PIBs, Ijara Sukuk and Prize Bonds

Third Quarterly Report for FY10
65
The breakup of permanent debt data reveals that PIBs retained its dominant share
in outstanding stock of permanent debt by adding Rs 52.4 billion during Jul-Mar
FY10 against Rs 9.7 billion in the same period last year. Mobilization through
prize bonds also saw significant improvements during Jul-Mar FY10 by adding Rs
27.3 billion in total deficit financing (see Figure 5.6). Although the government
received Rs 94.4 billion through fresh creation of prize bonds during Jul-Mar
FY10, huge encashment has reduced the net receipts to much lower level.
Floating debt, comprising
treasury bills recorded relatively
higher growth in Jul-Mar FY10
compared to last year (see Table
5.3). The sharp rise in floating
debt stemmed from commercial
banks’ holding of T-bills which
increased by 39.0 percent in Jul-
Mar FY10 compared to 29.6
percent increase in the
corresponding period last year.
On the other hand, T-bills for replenishment grew by 7.7 percent in Jul-Mar FY10
compared to 11.5 percent a year earlier. The growth of MRTBs, however,
remained a source of concern, as it has breached the quarterly limit on government
financing from the central bank imposed by IMF under Stand-By Arrangement.
Quarterly growth in the outstanding stock of unfunded debt continued its
downward slide in Q3-FY10. The main cause of this slowdown was lower net
sales of National Savings Schemes instruments. The outstanding debt against all
major NSS instruments recorded positive growth except for DSCs which showed a
net retirement of Rs 35.1 billion. It is important to note that the net mobilization
Table 5.3: Domestic Debt (Jul-Mar)
debt in billion Rupees, growth and share in percent
Debt
Growth rate
Share
FY09 FY10 FY09 FY10 FY09 FY10
Permanent 652.3 771.2 7.2 13.7 17.4 17.2
Floating 1,923.5 2,299.8 17.5 20.8 51.2 51.2
of which
MTBs 696.1 1,106.7 29.6 39.0 18.5 24.6
MRTBs* 1,227.3 1,193.1 11.5 7.7 32.7 26.6
Unfunded 1,174.7 1,411.7 15.1 11.1 31.3 31.4
Foreign currency
instruments 8.0 8.0
-5.9 0.0
0.2 0.2
Domestic debt 3,758.4 4,490.7 14.8 19.5 100.0 100.0
*Includes outright sale of MRTBs to commercial banks.
Table 5.4: Gross & Net Receipts of Major NSS Debt
Instruments (Jul-Mar)
billion Rupees
FY09
FY10
Gross Net Gross Net
DSCs 53.5 -15.7 37.4 -35.1
SSCs 220.5 69.0 95.4 52.0
RICs 67.3 26.4 48.3 33.9
BSCs 285.2 57.6 72.7 45.1
SSAs 57.4 13.4 46.5 29.8
others 210.4 5.9 140.0 16.4
Total 894.3 156.6 440.8 142.1
Source: Central Directorate of National Savings (CDNS)

The State of the Pakistan’s Economy
66
through NSS stood at Rs 141.1 billion during Jul-Mar FY10, which constitutes
only 61.4 percent of the government budgetary estimates for FY10. As a result,
the government financing requirement from the banking system increased sharply
during this period.
Gross mobilization through NSS stood at Rs 440.8 billion during Jul-Mar FY10,
almost three times compared with the net receipts in the same period (see Table
5.4). Secondary market information on domestic debt reveals that the non banks
investment in the government securities (T-bills & PIBs) increased abruptly
during the period. For instance, non bank holding of the T-bills stood at Rs 96.7
billion during Jul-Mar FY10 compared to Rs 4.7 billion in the same period last
year. This reflects investors’ preferences to invest their funds in the short term
debt instruments.
Interest Payment on Domestic Debt
Interest payment on domestic
debt registered 3.1 percent
growth in Jul-Mar FY10,
considerably moderate
compared to 27.2 percent
recorded in the same period last
year. The deceleration in the
growth of interest payment on
domestic debt is attributed to
decline in interest payment on
floating debt in the period under
discussion (see Figure 5.7).
A further break up shows that
debt servicing cost of
permanent debt rose sharply
during Jul-Mar FY10. This increase was largely due to interest payment on 10-
year PIBs, in line with its increasing share in the total outstanding stock of PIBs.
On the other hand, interest payment on floating debt registered a decline of 7.1
percent during Jul-Jan FY10 compared to a rise of 115.6 percent in the same
period last year. This slowdown largely came from reduced interest payments on
MRTBS, as government was able to retire substantial amount in the initial period
of current fiscal year. However, increased reliance on commercial banks’
financing by the government through T-bills can boost the interest payments on
floating debt in the remaining months of current fiscal year.
0
43
86
129
172
215
FY08 FY09 FY10
bil
lio
n R
s
Permanent debt Floating debt Unfunded debt
Figure 5.7: Interest Payments on Domestic Debt (Jul-Mar)

Third Quarterly Report for FY10
67
The interest payments on unfunded debt stood at Rs 210.0 billion during Jul-Mar
FY10 compared to Rs 202.1 billion in the same period last year. The
disaggregation of data reveals that the interest payments on BSCs, SSCs and
PBAs increased significantly during the period. This seems in line with their
increased share in the outstanding stock of unfunded debt. On the other hand,
monthly outflow in the form of interest payment on DSCs observed a persistent
declining trend. However with net addition of Rs 126.2 billion in total interest
cost, DSCs still remained the largest contributor among servicing of unfunded
debt components.
Box 5.1: Government Guarantees-A Risk to Fiscal Sustainability
Countries with higher and persistent budget deficits have serious implications of government
guarantees for fiscal outlook of the country. Most recently, many governments have introduced new
methods of public support by issuing guarantees to many public sector enterprises and government
institutions. These off-budget activities result in additional burden on the government outlays and
consequently can lead to increasing debt/GDP ratios.
In case of Pakistan, government guarantees normally exist in the form of contingent liabilities.
These liabilities are not recognized as direct, as the actual cost of the government is linked with the
occurrence of any particular event in future. The element of uncertainty in the contingent liabilities
results in several complications in fiscal analysis. The coverage of government guarantees in fiscal
analysis is also important, as government normally covers all risks that in turn can increase the
possibility of default. Although it is
impossible for the government to avoid
all fiscal risks, however, these risks can
be minimized by recognizing and
considering these issues in their policy
choices.
Table 5.1.1 shows that the new
guarantees issued during Jul-Mar FY10
reached Rs 177.9 billion reaching at
1.18 percent of GDP, less than the full
year limit of 2 percent imposed by
FRDL Act 2005. It is important to note
that the volume of government
guarantees issued during FY09 has
reached Rs 274.3 that has breached the
limit imposed by FRDL Act 2005.
Information on new liabilities incurred by the government suggests that WAPDA remained the
major recipient among the guarantees issued during the period, as government provided guarantees
of Term Financing Certificates (TFCs) issued by Pakistan Electric Power Company (PEPCO) in
settling the circular-debt. The power holding company, established by the GoP has partially owed
the power companies debt by issuing Rs 85.0 billion worth of TFCs on 30th September 2009. The
volume of these guarantees can increase in the coming months due to extension in the deadline for
the elimination of remaining stock of circular debt and delays in the power tariff differentials
Table 5.1.1: Guarantees Issued by Government
billion Rupees
FY09 Jul-Mar FY10
PIA 25.0 6.8
WAPDA 228.3 133.0
PAF Shahbaz Air H.Q 1.0 6.0
NIT 20.0
Railways division 17.0
PSM 10.0
KESC 3.0
Pak Textile City Ltd. 1.0
TIP 1.1
Total 274.3 177.9
As % of GDP 2.1 1.18
Source: Budget Wing, EF Wing and DPCO staff calculations

The State of the Pakistan’s Economy
68
adjustments. These steps would result in additional burden on the government outlays and could
lead to ever increasing debt to GDP ratios.
In addition to the guarantees already issued to many PSEs, the government is now issuing guarantees
on TCP, PASSCO and provincial governments commodity financing loans. These guarantees,
however, were never included in the limit of 2 percent of GDP imposed by FRDL Act 2005. Such
activities not only understate the volume of the public debt stock and pose a risk of increasing future
liabilities but also potentially crowed out private investment.
Moving forward, government should re-examine the role of numerous public sector entities involved
in quasi-fiscal activities. Specifically, the efficiency of these public sector entities can be enhanced
by strengthening governance structures. The government needs to remain transparent while issuing
guarantees to PSEs and should provide estimates of resulting stock of its hidden debt. Also, there
should be a clear policy initiative to deal with such contingencies. Although in FRDL Act 2005, the
government control over issuance of new guarantees is restricted, the solution must include the
creation of a legal and institutional framework that forces proper accounting of these hidden costs to
the government.
The problem in this case is the fiscal accounting that sometimes misrepresents the effect of the
government’s stance. Usually, public finance data is recorded on cash basis. In case of Pakistan,
guarantees are usually adjusted in the fiscal accounts when contingency occurs and cash payment is
actually made. International accounting standards require the recording of the guarantees on accrual
based accounting. The government needs to judge the guarantees to be recorded as liability or
contingent liability at the time of budgeting and if the probability that the expense will be realized is
high, government can estimate the expected cost and can make provisions in the budget.

Third Quarterly Report for FY10
69
6 External Sector
6.1 Overview
Aided by lower imports and
sustained inflow of remittances
the current account deficit
during Jul-Apr FY10 remained
significantly lower than in the
corresponding period last year.
The impact of this improvement
on overall external balance was,
however, limited by
considerable fall in capital and
financial account surplus during
the period (see Table 6.1).
In fact, given the rise in current
account deficit recorded in Q2
over Q1, it was expected that
current account deficit would
rise further in subsequent
months due to an anticipated
rise in imports. In the event, not
only was the rise in imports
during Jan-Apr less than
expected, but exports also
staged a significant recovery.
As a result, the current account
deficit in Jan-Apr was lower
than Q2-FY10. Accordingly,
SBP now expects the current account deficit for FY10 to range between 2.2-2.8
percent of GDP against earlier estimates ranging between 3.2-3.8 percent of GDP.
This would be much lower than the 5.6 percent in FY09.
The news on the financing side, however, is not encouraging. Specifically, the
financial account after recording a substantial surplus in Q1-FY10, witnessed
sustained decline in the ensuing months. Thus, for aggregate Jul-Apr FY10
period, the surplus in the financial account remained noticeably lower than the
same period last year.
Table 6.1: Summary of External Accounts (Jul-Apr)
billion US dollar
FY10
FY09 FY10 Q1 Q2
Jan-
Apr
A-C/A balance -9.0 -3.1 -0.6 -1.5 -0.9
i) Trade balance -11.1 -9.1 -2.8 -3.0 -3.3
Exports 15.8 16.2 4.6 4.7 6.9
YoY growth (%) -3.6 2.1 -19.1 6.8 19.7
Imports 27.0 25.2 7.4 7.7 10.2
YoY growth (%) -5.9 -6.3 -27.4 -5.2 17.6
ii) Invisible balance 2.2 6.0 2.2 1.4 2.4
Remittances 6.4 7.3 2.3 2.2 2.8
B-Financial/capital
balance 4.5 3.9 2.8 0.5 0.7
i) FDI 3.2 1.8 0.5 0.5 0.8
ii) FPI -1.0 0.0 0.2 0.1 -0.3
iii) Other investment 2.1 2.0 2.0 -0.2 0.1
C-Errors & omissions 0.2 -0.2 -0.4 0.4 -0.1
D-Overall balance -4.3 0.7 1.8 -0.7 -0.4
Drawings from IMF* 3.9 1.3 0.5 0.8 0.0
Net change in overall reserves
0.1 2.4 2.5 0.5 -0.6
* This does not include IMF support for bridge financing

The State of Pakistan’s Economy
70
The weakness of the financial account mirrored the declines in both, equity and
loan inflows. Lower equity
inflows are not surprising, given
the uncertainties surrounding the
both the domestic economy and
the global financial markets, but
non-realization of FoDP pledges
and commitments made by some
other lending agencies led to an
unexpected shortfall from levels
projected earlier.1
The persistent fall in financial
inflows has impaired country’s
ability to finance even the
smaller current account deficit
(see Figure 6.1). For instance,
despite movement of current
account deficit in a narrow
range, overall external account
position deteriorated in the post
Q1-FY10 period (see Figure
6.2).
It should be remembered that the
sustainability of the current
account also depends on the
country’s ability to finance it
(preferably from the non-debt
creating inflows). Pakistan, for
a number of years, supported
large current account deficits
only because it was able to finance it. The external position becomes highly risky
if both the current and financial accounts are in deficit.
So far, overall external account for Jul-Apr FY10 period is showing nominal
surplus. As a result, Pakistan foreign exchange reserves showed improvement and
1For instance, realization of Tokyo pledges during Jul-Apr FY10 remained less than 10 percent of
the total budget estimate.
-2.5
-2.0
-1.5
-1.0
-0.5
0.0
0.5
Jul-
08
Oct-
08
Jan
-09
Ap
r-0
9Ju
l-0
9O
ct-
09
Jan
-10
Ap
r-1
0
bil
lio
n U
S$
Figure 6.1a: Current Account Balance
0.0
0.3
0.5
0.8
1.0
1.3
Sep
-08
No
v-0
8Ja
n-0
9M
ar-
09
May
-09
Jul-
09
Sep
-09
No
v-0
9Ja
n-1
0M
ar-
10
bil
lio
n U
S$
Figure 6.1b: Capital/Financial Account Balance (3MMA)
-4
-3
-2
-1
0
1
2
Q1
FY
09
Q2
FY
09
Q3
FY
09
Q4
FY
09
Q1
FY
10
Q2
FY
10
Jan
-Ap
rFY
10
bil
lio
n U
S$
Figure 6.2: Overall Balance of Payments

Third Quarterly Report for FY10
71
the exchange rate has also exhibited relative stability during the period under
review. The situation, however, remains precarious and can deteriorate rapidly.
6.2 Current Account Balance
Current account deficit recorded
65.9 percent YoY contraction
during Jul-Apr FY10 compared
with a 20.1 percent decline in
the same period last year. In
absolute terms, this is the lowest
deficit for the Jul-Apr period in
the last four years (see Figure
6.3a).
While all components of the
current account deficit recorded
YoY improvement during the
period under review, a major
impetus came from a fall in imports and a strong increase in current transfers,
which together contributed around 54.5 percent of the overall improvement. Fall
in payments on account of repatriation of dividends, interest on debt, freight on
merchandise imports and lower outflows from foreign exchange companies were
other major contributory factors behind the contraction in the current account
deficit during the period under consideration.
Quarterly analysis, however, shows that a large part of the YoY improvement in
current account deficit was concentrated in H1-FY10 as it has shown deterioration
during Q3-FY10 (see Figure 6.3b).
6.2.1 Trade Account2
Trade deficit declined by 18.3 percent during Jul-Apr FY10 compared with 9.0
percent fall in the same period last year. Although, this decline is largely driven
by fall in imports, a small recovery in exports also contributed to decline in the
deficit.
While recovery in exports is mainly attributed to better agriculture performance
(rice, cotton and fruits), fall in imports was chiefly on account of lower average
2This section is based on exchange record compiled by SBP that does not tally with more detailed
FBS data used in section 6.7: Trade.
-4.5
-3.8
-3.0
-2.3
-1.5
-0.8
0.0
Q1 Q2 Q3 Aprb
illi
on
US
$
FY09 FY10
Figure 6.3b: Current Account Balance
-14
-11
-7
-4
0
4
7
FY
05
FY
06
FY
07
FY
08
FY
09
FY
10
bil
lio
n U
S$
Invisible balanceTrade balanceCurrent account balance
Figure 6.3a; Current Account Balance (Jul-Apr)

The State of Pakistan’s Economy
72
import prices. However, a part of YoY decline in imports was offset by rising
import volumes (especially for petroleum products and fertilizer) during Jul-Apr
FY10.
Almost the entire YoY improvement in trade deficit during the period was
concentrated in H1-FY10. Indeed, as international prices begin recovering, YoY
increase in imports more than offset modest recovery in exports in the following
quarter. As a result, trade deficit increased during Jan-Apr FY10 compared with
the same period last year.
6.2.2 Services (net)
Services account deficit declined
by 39.0 percent during Jul-Apr
FY10 on the top of 42.8 percent
decline in the same period last
year. A large part (61.9 percent)
of this improvement stemmed
from lower services imports,
while the rest was contributed
by an increase in services
exports. (For details, see section
2.3: Services).
6.2.3 Income Account
After widening continuously in
the last four years, deficit in the
income account declined
considerably (29.9 percent)
during Jul-Apr FY10 (see
Figure 6.4). Fall in the
payments on both investment
(repatriation of profit &
dividends) and debt (interest)
contributed to this decline.
Specifically, the fall in
investment income contributed
around 86.0 percent of the
decline in income account
deficit while interest payment
contributed around 14.0 percent during the period.
0.0
0.8
1.5
2.3
3.0
3.8
FY05 FY06 FY07 FY08 FY09 FY10
bil
lio
n U
S$
Figure 6.4: Income Account Deficit (Jul-Apr)
0 50 100 150 200 250
Other
Trade
Power
Petroleum
Financial
Oil & gas
Communication
million US$
FY10 FY09
Figure 6.5: Sector-wise Repatriation of Profits & Dividends (Jul-Apr)

Third Quarterly Report for FY10
73
The decline in payments on investment during Jul-Apr FY10 mainly reflects a fall
in repatriation of dividends and lower government’s purchases of crude oil & gas.
The major sectors recording
decline in repatriation of profit
& dividends during the period
included petroleum refining,
power and oil & gas, i.e. the
sectors severely affected by
circular debt issue (see Figure
6.5).3
On the other hand, financial
business and communication
sectors recorded YoY increase
in repatriation of profit &
dividends during Jul-Apr FY10.
Dividends payments by a major
bank4 chiefly explain the
increase in the former while
repatriation of profit by a large
telecom company explains the
increase in the latter.
In line with the repatriation
patterns, a larger part of
dividends repatriation was
concentrated in second quarter
during current fiscal year (see
Figure 6.6b). Seasonal pattern
suggests that profit & dividends
payments are likely to increase
in the last quarter of current
fiscal year as well.5
3As large part of repatriation of profit& dividends is based on FY09 results, for detail analysis,
please see Second Quarterly Report on State of Pakistan Economy for FY10. 4Out of total US$ 47.7 million profit & dividends payments of financial business, HBL’s amount
was around US$ 30 million. Based on results for the full-year 2009, HBL announced final cash
dividends of Rs 6.00 per share at end Feb-2010. 5Most of the companies repatriate their profits and dividends on annual basis. Some of the
companies have financial year Jan-Dec and some have financial year Jul-Jun. In this respect, they
repatriate their profits & dividends with the lag of 3 or 4 months after audit and other procedures.
0.0
0.5
1.0
1.5
2.0
FY
05
FY
06
FY
07
FY
08
FY
09
FY
10
bil
lio
n U
S$
Govt purchases of oil &gasDividendsProfits
Figure 6.6a: Payments on Investment Outflows (Jul-Apr)
0.0
0.1
0.1
0.2
0.2
0.3
Q1 Q2 Q3 Apr
bil
lio
n U
S$
FY09 FY10
Figure 6.6b: Repatriation of Profit and Dividends
Seasonalincrease
0
220
440
660
880
1100
FY05 FY06 FY07 FY08 FY09 FY10
mil
lio
n U
S$
Interest payments Reciepts Net payments
Figure 6.7: Net Interest Payments (Jul-Apr)

The State of Pakistan’s Economy
74
Almost the entire decline in net interest payments emanated from lower gross
interest payments during Jul-Apr FY10 (see Figure 6.7). Along with relatively
lower international interest rates; a fall in stock of expensive debt stock (IDB loans
and Euro bond) also contributed to this decline as did lower interest payments on
foreign currency deposits.
Nonetheless, higher payments on IMF loan in the wake of rising debt stock and
lower earnings on foreign exchange reserves offset a part of the abovementioned
gains.
6.2.4 Current Transfers
In sharp contrast to 7.0 percent
fall last year, current transfers
increased by 16.9 percent during
Jul-Apr FY10. Apart from
persistent increase in workers
remittance, reversal of inflows
in Resident Foreign Currency
Accounts (RFCAs) and higher
cash grants for government6
contributed to this increase (see
Figure 6.8).
However, fall in other private
transfers (mainly RFCAs
conversion) offset a part of the
aforementioned gains during the
period under review.
Workers’ Remittances
Worker remittances have recorded strong growth for the Jul-Apr period of last six
successive years. Specifically, workers’ remittances increased by 15.0 percent
during Jul-Apr FY10 on the top of 14.9 percent average increase during the
corresponding period of the last five years.
Given the difference in their financial year, their outflows mostly fall in the second and fourth
quarter as per our fiscal year. 6This mainly shows United States Support worth US$ 44.0 million for Internally Displaced Persons
(IDPs).
-2
0
2
4
6
8
10
12
FY08 FY09 FY10
bil
lio
n U
S$
Others RFCAs Remittances
Figure 6.8: Current Transfers (Jul-Apr)

Third Quarterly Report for FY10
75
Unlike the previous years,
however, almost the entire
growth during current year
stemmed from remittances
through banks; remittances
routed through exchange
companies fell for the first time
in the last six years (see Figure
6.9). Strong increase in
remittances through banks
probably reflects PRI’s effort to
attract remittances through this
channel. Moreover, at least a
part of remittances is also
diverted from exchange
companies to banks in the wake
of;
(a) Possibility of further action
against foreign exchange
companies involved in illegal
funds transfer; and
(b) Tough competition from
banks.
Country-wise data suggests that
a large part of remittances
growth during Jul-Apr FY10
was sourced from United Arab
Emirates, United Kingdom, and
Saudi Arabia. Other important
contributors included Qatar,
United States Canada and
Australia (see Table 6.2).
Monthly Trends Monthly trend shows that a
large part of remittances growth was concentrated in Jul-Oct FY10 and
remittances growth slowed down significantly in the subsequent months (Nov-
Apr) (see Figure 6.10). Slowdown in workers’ remittances growth is partly a
statistical artifact, reflecting the stronger numbers seen October onward last year.
Moreover, this deceleration in remittances growth may also be attributed to high
Table 6.2:Country-wise Workers' Remittances (Jul-Apr)
million US$; share percent; growth contribution percentage
points
Countries FY09 FY10 Share Contribution
in growth
Gulf region: 3,626.9 4,222.1 57.8 9.4
Bahrain 127.6 128.5 1.8 0.0
Kuwait 360.3 369.3 5.1 0.1
Qatar 276.7 299.1 4.1 0.4
Saudi Arabia 1,264.1 1,525.9 20.9 4.1
Oman 231.4 236.0 3.2 0.1
U.A.E. 1,366.8 1,663.2 22.8 4.7
U.S.A. 1,435.7 1461.8 20.0 0.4
U.K 468.0 734.6 10.1 4.2
Canada 65.1 94.0 1.3 0.5
Germany 80.3 69.0 0.9 -0.2
Japan 3.6 5.0 0.1 0.0
Australia 26.8 48.6 0.7 0.3
Others 648.9 670.6 9.2 0.3
Total 6,355.1 7,305.6 100.0 15.0
0.0
1.6
3.2
4.8
6.4
8.0
FY05 FY06 FY07 FY08 FY09 FY10
bil
lio
n U
S$
Banks* Exchange companies Total
* Include post offices
Figure 6.9: Composition of Workers' Remittances (Jul-Apr)

The State of Pakistan’s Economy
76
kerb market premium and the
disruptions in the last week of
December 2009 on account of
religious holidays and closure of
businesses following terrorist
acts.
In particular, kerb market
premium appears to be an
important factor for remittances
inflows. For instance,
exceptionally high premium in
Oct-2008 as well as in Feb-2010
caused sharp fall in remittances
inflows (see Figure 6.11).
Recovery in Mar-Apr 2010
During Mar-Apr FY10,
however, remittances from all
major source countries recorded
an uptick, mainly on account of
a fall in kerb market premium
(see Figure 6.11). This was an
across the board improvement as
remittances not only increased
from all major source countries
but also through all the channels
(see Figure 6.12).
Within different channels, a
large part of increase in inflows
during Mar-Apr FY10 was
attributed to banking channel.
In particular, remittances
through banks touched an all-
time high during Mar FY10.
This is because, on the one hand,
stability in exchange rate led to
increase in rupee conversion
from foreign currency accounts,
and, on the other hand 25
60
95
130
165
200
Jul-
08
Oct
-08
Jan
-09
Ap
r-0
9Ju
l-0
9O
ct-0
9Ja
n-1
0A
pr-
10
mil
lio
n U
S$
UAE USAKSA UK
Figure 6.12a: Remittances from Major Countries
0
130
260
390
520
650
Jul-
08
Oct
-08
Jan
-09
Ap
r-0
9Ju
l-0
9O
ct-0
9Ja
n-1
0A
pr-
10
mil
lio
n U
S$
BanksExchange companiesPost offices
Figure 6.12b: Channel-wise Workers Remittances
-16
0
16
32
48
64
430
520
610
700
790
880
Jul
Au
g
Sep
Oct
No
v
Dec Jan
Feb
Mar
Ap
r
per
cen
t
mil
lio
n U
S$
FY09 FY10 Monthly growth (RHS)
Figure 6.10: Workers' Remittances Growth (YoY)
Base for Nov-Apr growth
Base for Jul-Oct growth
-0.5
0.0
0.5
1.0
1.5
2.0
450
530
610
690
770
850
Jul-
08
Oct
-08
Jan
-09
Ap
r-0
9
Jul-
09
Oct
-09
Jan
-10
Ap
r-1
0
Ru
pee
s
mil
lio
n U
S$
Kerb premium (RHS) Remittances
Figure 6.11: Workers' Remittances Vs Kerb Premium
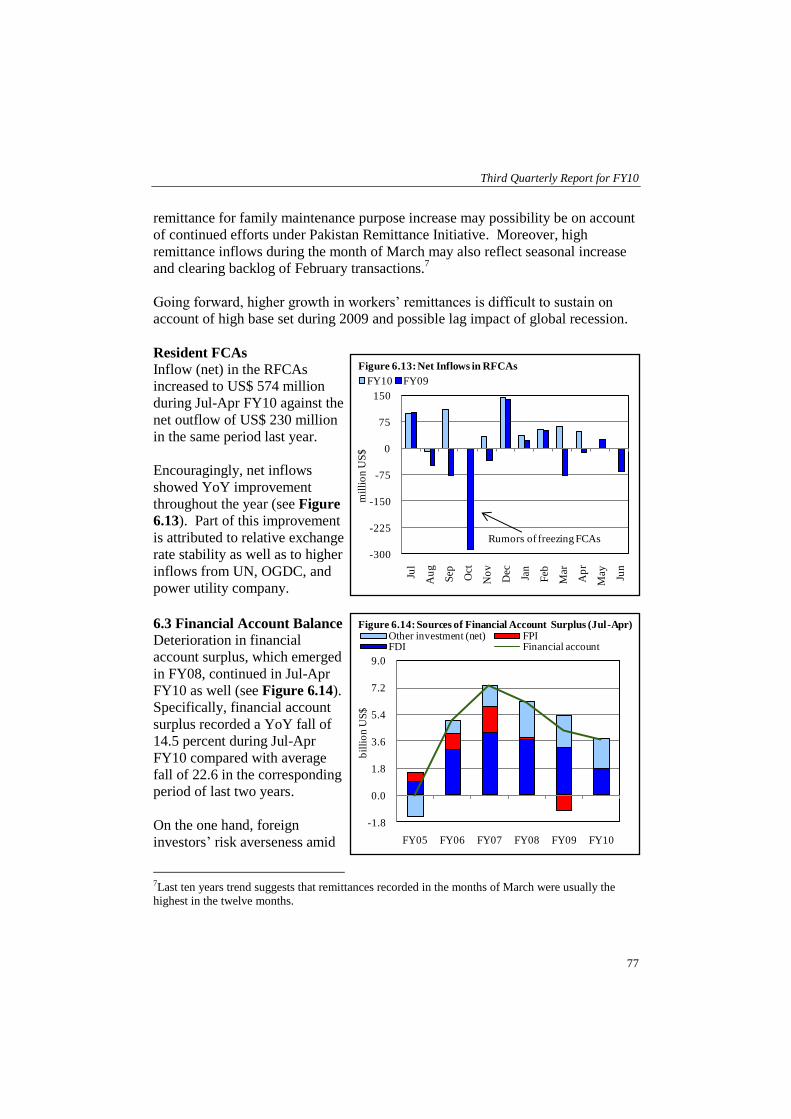
Third Quarterly Report for FY10
77
remittance for family maintenance purpose increase may possibility be on account
of continued efforts under Pakistan Remittance Initiative. Moreover, high
remittance inflows during the month of March may also reflect seasonal increase
and clearing backlog of February transactions.7
Going forward, higher growth in workers’ remittances is difficult to sustain on
account of high base set during 2009 and possible lag impact of global recession.
Resident FCAs Inflow (net) in the RFCAs
increased to US$ 574 million
during Jul-Apr FY10 against the
net outflow of US$ 230 million
in the same period last year.
Encouragingly, net inflows
showed YoY improvement
throughout the year (see Figure
6.13). Part of this improvement
is attributed to relative exchange
rate stability as well as to higher
inflows from UN, OGDC, and
power utility company.
6.3 Financial Account Balance
Deterioration in financial
account surplus, which emerged
in FY08, continued in Jul-Apr
FY10 as well (see Figure 6.14).
Specifically, financial account
surplus recorded a YoY fall of
14.5 percent during Jul-Apr
FY10 compared with average
fall of 22.6 in the corresponding
period of last two years.
On the one hand, foreign
investors’ risk averseness amid
7Last ten years trend suggests that remittances recorded in the months of March were usually the
highest in the twelve months.
-300
-225
-150
-75
0
75
150
Jul
Au
g
Sep Oct
No
v
Dec
Jan
Feb
Mar
Ap
r
May Jun
mil
lio
n U
S$
FY10 FY09
Figure 6.13: Net Inflows in RFCAs
Rumors of freezing FCAs
-1.8
0.0
1.8
3.6
5.4
7.2
9.0
FY05 FY06 FY07 FY08 FY09 FY10
bil
lio
n U
S$
Other investment (net) FPIFDI Financial account
Figure 6.14: Sources of Financial Account Surplus (Jul-Apr)

The State of Pakistan’s Economy
78
global crises and severe power deficit in Pakistan led to substantial fall in foreign
direct investment. On the other hand, lower than anticipated disbursement by
international donors’ reduced net loan inflows. The fall in financial account
surplus would have been even higher, had it not been for (a non-recurring) SDRS
allocation by the IMF.
On the positive side, foreign investment in stock market has revived significantly
during the period under review8. However, these inflows are short term in nature
and notoriously volatile.
The quarterly trend suggests that
after recording surplus in Q1-
FY10, surplus in financial
account fell drastically in the
subsequent quarters (see Figure
6.15). During Oct-Apr FY10,
substantial fall in financial
inflows (net) mainly reflected
lower loan inflows and the
maturity of sovereign financial
instrument (Sukuk worth US$
600 million).
Net Foreign Investment
Fall in foreign investment (net)
during Jul-Apr FY10 mainly
owed to substantial fall in
foreign investment. This was
unlike the previous year, when
considerable outflow from
portfolio investment largely
explained fall in overall
investment.
Specifically, foreign direct
investment fell by 44.7 percent
while net outflows from
portfolio investment decelerated
8Investment in stock market has revived to US$ 570.9 million during Jul-Apr FY10 compared with
net outflows of US$ 451.5 million in the same period last year.
Table 6.3: Pakistan Foreign Investment( Net Inflow) Jul-Apr
million US Dollar; growth percent
FY09 FY10 Growth
Foreign investment 2,212.4 1,726.3 -22.0
I. Private investment 2,753.5 2,343.8 -14.9
Foreign direct investment 3,205.0 1,772.9 -44.7
Portfolio investment -451.5 570.9 226
Equity securities -451.5 570.9 226
Debt securities 0 0 0
II. Public investment -541.1 -617.5 -14.1
of which: Debt securities* -541.1 -617.5 -14.1
* Net sale/purchase of Special US dollar bonds, Eurobonds, FEBC, DBC, T bills and PIBs
-1
0
1
2
3Q
1F
Y0
9
Q2
FY
09
Q3
FY
09
Q4
FY
09
Q1
FY
10
Q2
FY
10
Jan
-Ap
r
bil
lio
n U
S$
Other investment FPI FDI Financial account
Figure 6.15: Financial Account Balance
SDRs allocation
Eurobond maturity Sukuk bond maturity

Third Quarterly Report for FY10
79
by 95.4 percent during Jul-Apr FY10. This deceleration in net outflows from
portfolio investment mainly owed to considerable investment in equity market
which offset a large part of outflows from debt securities (mainly Sukuk bond
repayment) (see Table 6.3).
Foreign Direct Investment
After remaining relatively stable
for two years, foreign direct
investment fell drastically
during Jul-Apr FY10 (see
Figure 6.16). In particular,
YoY fall in foreign direct
investment accelerated to 44.7
percent during Jul-Apr FY10
compared with 12.4 percent
average fall in the same period
of last two years.
Although a combination of
factors explains this fall, the
most prominent amongst them
are: foreign investors risk
averseness amid uncertainty
about pace and extent of the
global economic recovery and
adverse security
developments as well as
electricity shortages at home.
The risk averseness of foreign
investors is reflected in across
the globe fall in foreign direct
investment. Further in
Pakistan, Overseas Investors
Chamber of Commerce and
Industry (OICCI) survey 2009
shows foreign investors plan lower investment mainly because of law & order
situation and power deficit (see Figure 6.17).
0
0.9
1.8
2.7
3.6
4.5
FY05 FY06 FY07 FY08 FY09 FY10
bil
lio
n U
S$
Reinvested earnings Equity FDI
Figure 6.16: Foreign Direct Investment (Jul-Apr)
Law
&O
rder
En
ergy
Def
icit
Go
vt.
Sta
bil
ity
Infr
astr
uct
ure
Co
st o
f o
per
atio
ns
Leg
isla
tio
n
Hu
man
Res
ourc
es
Co
py
Rig
hts
& I
PR
Ch
angi
ng
So
cial
Val
ues
Figure 6.17: Top Challenges to Business in Pakistan-2009
Source: Overseas Investors Chamber of Commerce and Industry
1 23
45
67 8
9

The State of Pakistan’s Economy
80
Component-wise analysis suggests that around one- third of the fall in overall
investment during Jul-Apr FY10 was explained by lower reinvested earnings
while rest of the fall was explained by lower equity inflows and decline in intra-
company loans. The former mainly owed to either lower profits or higher losses
while the latter may be explained by both the lower margins and foreign investors
difficulty in obtaining credit. Although foreign direct investment recorded across
the board fall during Jul-Apr FY10, main share (around 70 percent) came from
lower investment in telecommunication and financial business (see Table 6.4).
Apart from lower reinvested earnings, foreign investment in telecom sector was
adversely affected by market saturation and stiff competition while investment in
financial business was hurt by lack of merger& acquisition and repayment of
intra-company loans.
Moreover, investment in petroleum refining declined mainly on account of
circular debt issue while lower investment in oil& gas largely reflects poor law&
order situation.
Foreign Portfolio Investment Net outflow from foreign portfolio investment has shown considerable YoY
deceleration during Jul-Apr FY10. This improvement entirely owed to revival of
foreign inflows in equity market which offset a large part of Sukuk payment worth
US$ 600 million (see Figure 6.18). Specifically, net outflow from portfolio
Table 6.4: Sector -wise Foreign Direct Investment (Jul-Apr)
million US Dollar FY09 FY10
Sectors Cash Re-invested
earnings Total Cash
Re-invested
earnings Total
Chemicals 4.2 53.7 58.0 46.9 32.2 79.1
Petroleum refining 30.4 73.3 103.7 15.1 55.2 70.3
Oil & gas explorations 423.3 188.9 612.1 448.0 156.7 604.7
Cement 9.0 22.7 31.7 0.1 0.5 0.5
Power 91.6 -18.3 73.3 112.5 -101.5 11.0
Construction 78.1 -1.3 76.8 91.3 -5.0 86.3
Trade 109.3 38.4 147.7 51.3 26.7 78.0
Telecommunications 809.4 -42.4 767.1 394.5 -84.7 309.8
Financial business 494.3 186.7 681.0 101.9 31.1 133.0
Personal services 75.6 4.4 79.9 40.7 3.8 44.5
Others 415.8 157.7 573.5 306.0 49.7 355.7
Total 2,541.1 663.9 3,205.0 1,608.2 164.7 1,772.9

Third Quarterly Report for FY10
81
investment decelerated to US$ 46 million during Jul-Apr FY10 from net outflow
of US$ 1.0 billion9 in the same period of last year.
In line with regional trends,
investment in the stock market
staged an appreciable recovery,
increasing to US$ 571 million
during Jul-Apr FY10 compared
to net outflow of US$ 451
million in the same period last
year. Market sources suggest
that foreign institutional
investors often invest in
Pakistan’s stock market while
investing in other major regional
markets. For instance, foreign
investment in stock markets of
India and Pakistan are closely
associated (see Figure 6.19).
Other factors contributing to
higher foreign investment
inflows in Pakistan’s equity
market includes: a) re-entry of
the country into MSCI frontier
market index,; b) the fact that
Pakistan’s market is trading at
discount compared with regional
markets; and c) considerable fall
in Pakistan’s risk premium as
reflected by fall in Credit
Default Swap (CDS) spread.
Outstanding Export Bills
The stock of aggregate
outstanding export bills has increased by US$ 370 million during Jul-Apr FY10
against a decline of US$ 526 million in the comparable period last year. This
increase is entirely explained by the outstanding export bills held by the exporters,
because the bills held by banks declined by US $ 7 million during the period under
review
9This included US$ 500 million Euro bond payment.
-0.1
0.0
0.1
0.2
0.3
Jul-
08
Oct-
08
Jan
-09
Ap
r-0
9
Jul-
09
Oct-
09
Jan
-10
Ap
r-1
0
bil
lio
n U
S$
Pakistan India
Figure 6.19: Net Foreign Investment in Stock Market (3MMA)
-1200
-900
-600
-300
0
300
600
Jul-Apr FY09 Jul-Apr FY10
mil
lio
n U
S$
Debt securities Equity securities Total
Figure 6.18: Foreign Portfolio Investment
Euro bond payment (US$ 500 million)
Sukuk payment (US$ 600 million)

The State of Pakistan’s Economy
82
This increase may partly be attributed to recovery in exports and partly to
expectations of exchange rate depreciation.
Currency and Deposits (Assets)
Currency and deposits declined by US$ 270 million during Jul-Apr FY10 against
an increase of US$ 36 million during the same period last year. This decline is
largely attributed to fall in commercial bank trade nostros in the wake of shifting
oil payments to interbank market.
Loan Inflows (Net)
Net loan inflows declined to US$ 0.6 billion during Jul-Apr FY10 from US$ 1.3
billion during the same period last year. This decline owed to lower gross
disbursements for the private sector as well as fall in official loan inflows (net).
Major official loan inflows are IMF’s bridge financing (US$ 1.1 billion), ADB
(US$ 0.2 billion) and World Bank (US$ 0.3 billion).
It may be pointed out that IDB loan repayment (US$ 323 million) which was due
in December 2009 has been rolled over for six months.
Other Liabilities (Net)
Other liabilities (net) recorded a substantial increase of US$ 1.1 billion during Jul-
Apr FY10. The entire increase reflects IMF SDRs allocation.
6.4 Services Trade
During Jul-Apr FY10, services account deficit declined to US$ 2.0 billion,
contracting by 39.0 percent compared to the contraction of 42.8 percent in the
same period last year. The contraction in services trade deficit was a combination
of 12.2 percent decline in services imports and 15.3 percent rise in services
exports.
The decline in the import growth was expected on account of restrictions on
outflows of exchange companies and decline in freight payments resulting from
falling merchandise imports. Fortunately, deceleration in import growth was
complimented by an increase in government services exports and commendable
performance of telecommunication services exports that resulted in substantial
decline in the services trade deficit (see Table 6.5).

Third Quarterly Report for FY10
83
Services Exports
Services exports registered a
growth of 15.3 percent during
Jul-Apr FY10 compared to
growth of 16.5 percent in the
same period last year, largely on
account of improvement in
receipts under “government
services”. In addition,
telecommunication, financial
and other business also
contributed to services export
growth during Jul-Apr FY10
(see Figure 6.20).
Monthly YoY analysis of services export reveals improvement in the exports Feb-
2010 onwards. This recovery stemmed from a combination of factors like logistic
support inflows, increased passage earnings of Pak airlines, higher receipts from
international tourists, continuity of telephone traffic from legitimate channel and
Table 6.5: Causative Factors of Contraction in Services Trade Deficit (Jul-Apr)
million US Dollar
FY09 FY10
Value Abs. Change Value Abs. Change
Exports 3,126 442 3,605 479
Of which: Transportation receipts 1,106 248 952 -154
Telecommunication 95 7 185 90
Logistic 465 183 537 72
Non-logistic 461 -127 950 489
All others 999 131 981 -18
Imports 6,344 -1,966 5,567 -777
Of which: Transportation payments 3,119 103 2,812 -307
Travel & other business 2,298 -2,017 1,646 -652
Of which: Payments through FECs 1,138 -2,161 553 -585
Government services 319 -37 505 186
All others 608 -15 605 -3
Trade deficit 3,218 -2,408 1,962 -1,256
-9
-5
0
5
9
14
18
23
Jul-Apr FY09 Jul-Apr FY10
per
cen
t
Transportation Travel CommunicationFinancial Computer & info. Other businessGovernment Others
Figure 6.20: Contribution in Services Exports Growth

The State of Pakistan’s Economy
84
increase in other miscellaneous business services (see Table 6.6).
The exports of transportation services declined by 13.9 percent YoY during Jul-
Apr FY10, sharply down from
the growth of 28.9 percent
during the same period of FY09
on account of relatively lower
freight earnings, reduced
passage earning of domestic
airlines, and curtailed operations
of foreign transport companies.
Passage earnings of Pakistani
airlines, having the largest share
in transportation receipts,
witnessed a modest fall of 1.1
percent during Jul-Apr FY10
compared to an increase of 6.4
percent last year.
Monthly analysis shows
Table 6.6: Major Services Exports (FY10)
million US Dollar; growth percent
Absolute value Growth
Jul-Jan Feb-Mar Jul-Mar Jul-Jan Feb-Mar Jul-Mar
Transportation 661 287 948 -22.5 13.4 -13.9
Travel 166 72 238 -20.2 12.5 -12.5
Communication 144 56 200 182.4 -6.7 80.2
Construction 9 4 13 -60.9 -20.0 -53.6
Insurance 25 10 35 -30.6 -16.7 -27.1
Financial 74 21 95 100.0 0.0 44.8
Computer and information 114 41 155 0.9 -2.4 0.0
Royalties and license fees 4 2 6 -60.0 100.0 -45.5
Other business 288 144 432 -3.7 28.6 4.9
Personal, cultural & recreational 1 3 4
Government services 618 868 1,486 -22.1 552.6 60.6
Of which: logistic support 0 537 537 -100.0 15.5
Total 2,104 1,508 3,612 -13.2 114.5 15.3
-28
-14
0
14
28
42
Jul-
08
Oct
-08
Jan
-09
Ap
r-0
9
Jul-
09
Oct
-09
Jan
-10
Ap
r-1
0
per
cen
t
Figure 6.21: Passage Earnings of Pakistani Airlines

Third Quarterly Report for FY10
85
recovery in passage earnings of Pakistani airlines (see Figure 6.21) that came in
wake of decisions by some of the international airlines to discontinue their
operations in Pakistan on security concerns.10
Furthermore PIA opened up some
new destinations and increased flight frequency to some of the established
destinations. This also explains the increase in the category foreign travelers
under travel services exports during the period under review.
Freight earnings declined by 29.7 percent during Jul- Apr FY10 against an
increase of 1.8 percent last year. It may be pointed out that unlike the link
between merchandise imports and freight payments: the link between merchandise
exports and freight earnings is weak. Domestic shipping lines only cater to12-13
percent of the total requirement, while payments made by foreign importers to
other than domestic shipping lines are not reflected in country’s accounts. Thus
even if the merchandise exports rise, it would not necessarily result in higher
freight earnings as in the case of freight payments and merchandise imports.
Travel Services exports fell by 12.3 percent on account of decline in receipts
through foreign exchange companies. The decline of US$ 56 million in receipts
through exchange companies was on account of restrictions imposed on exchange
companies by SBP.11
This fall in receipts of exchange companies was partially offset by the increase in
the category: Foreign Tourists. The receipts from foreign national tourists
improved slightly from US$ 168 million in Jul-Apr FY09 to US$ 193 million
during Jul-Apr FY10 reflecting an increase of 14.5 percent.
Communication services exports recorded a phenomenal growth of 80.3 mainly
on the back of telecommunication services exports, which grew by 95.6 percent
during the period under consideration. This remarkable increase is attributable to
the PTA’s implementation of Monitoring and Reconciliation of International
Telephone Traffic to curtail the illegal traffic. The lowering of settlement rates
during the current fiscal year also contributed to this increase.12
10British Airways discontinued its operations from Pakistan in March 2009; Gulf airlines suspended
its operations from Peshawar in August 2009, while Singapore Airway discontinued its operations
from Pakistan in March 2009 in Feb 2010. 11These receipts prior to 2009 were recorded in the current transfers as a contra item. Outflows
through exchange companies used to be offset by the inward workers’ remittances and other inflows.
These other inflows 2009 onwards are being recorded in travel services receipts through FECs. 12As per Telecom Quarterly Review of Dec 2009, settlement rates declined from US cents 12.5 per
minute to US cents 10.5 per minute
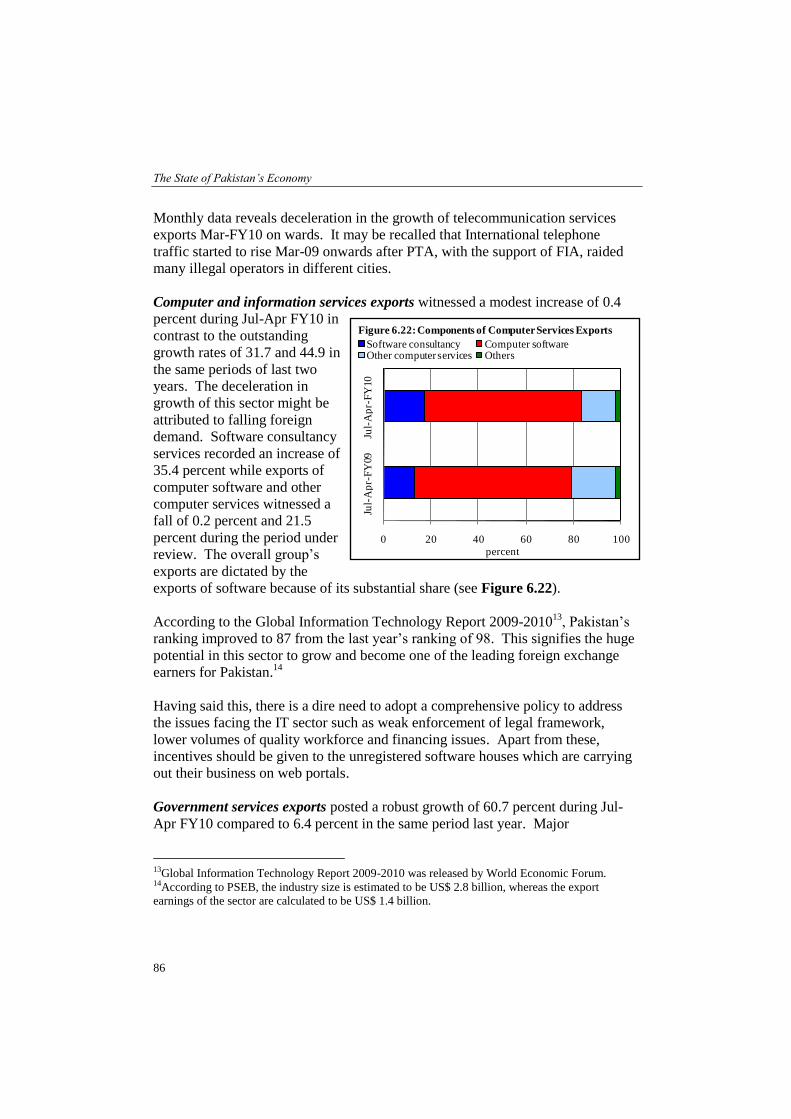
The State of Pakistan’s Economy
86
Monthly data reveals deceleration in the growth of telecommunication services
exports Mar-FY10 on wards. It may be recalled that International telephone
traffic started to rise Mar-09 onwards after PTA, with the support of FIA, raided
many illegal operators in different cities.
Computer and information services exports witnessed a modest increase of 0.4
percent during Jul-Apr FY10 in
contrast to the outstanding
growth rates of 31.7 and 44.9 in
the same periods of last two
years. The deceleration in
growth of this sector might be
attributed to falling foreign
demand. Software consultancy
services recorded an increase of
35.4 percent while exports of
computer software and other
computer services witnessed a
fall of 0.2 percent and 21.5
percent during the period under
review. The overall group’s
exports are dictated by the
exports of software because of its substantial share (see Figure 6.22).
According to the Global Information Technology Report 2009-201013
, Pakistan’s
ranking improved to 87 from the last year’s ranking of 98. This signifies the huge
potential in this sector to grow and become one of the leading foreign exchange
earners for Pakistan.14
Having said this, there is a dire need to adopt a comprehensive policy to address
the issues facing the IT sector such as weak enforcement of legal framework,
lower volumes of quality workforce and financing issues. Apart from these,
incentives should be given to the unregistered software houses which are carrying
out their business on web portals.
Government services exports posted a robust growth of 60.7 percent during Jul-
Apr FY10 compared to 6.4 percent in the same period last year. Major
13Global Information Technology Report 2009-2010 was released by World Economic Forum. 14According to PSEB, the industry size is estimated to be US$ 2.8 billion, whereas the export
earnings of the sector are calculated to be US$ 1.4 billion.
0 20 40 60 80 100
Jul-
Ap
r-F
Y09
Jul-
Ap
r-F
Y10
percent
Software consultancy Computer software Other computer services Others
Figure 6.22: Components of Computer Services Exports

Third Quarterly Report for FY10
87
contribution came from the non-
logistic receipts which recorded
an increase of 106.1 percent
during the period under review
(see Figure 6.23).
Non-logistic support rose on
account of increases in
remittances by foreign missions
in Pakistan as well as
remittances received by
international organizations. A
part of this rise in non-logistic
support could be attributed to
the increase in diplomatic
operations of US.
Other business services exports increased by 5.0 percent during Jul-Apr FY10
compared to 14.2 percent rise
recorded in the corresponding
period last year. The increase in
the group’s exports was mainly
due to the decline in refunds,
although increase in exports of
merchant. & trade related
activity and business
consultancy also contributed
positively to the group’s exports
(see Figure 6.24).
Miscellaneous category, which
has the largest share (42.6
percent) in overall business
services exports, increased by
2.4 percent. However, the
categories agency commission and technical & engineering services witnessed fall
during the period under analysis.
Services Imports
Overall services imports fell by 12.2 percent during Jul-Apr FY10 compared to
23.6 percent fall recorded in the same period last year. A continuous decline in
outflows through exchange companies as well as lower freight payments on
-16
0
16
32
48
64
Jul-Apr-FY09 Jul-Apr-FY10
perc
en
t
Non-logistic support Logistic support
Figure 6.23: Contribution in Growth of Govt. Services Exports
-18
-9
0
9
18
27
Jul-Apr-FY09 Jul-Apr-FY10
per
cen
t co
ntri
buti
on in
gro
wth
Merchanting & trade LegalBusiness consultancy Agency commissionAdv. market research Arch., engg. & technicalMiscellaneous RefundsAll others
Figure 6.24: Other Business Services Exports

The State of Pakistan’s Economy
88
account of decline in
merchandise imports were the
main factors behind this fall in
services imports (see Figure
6.25).
Services import growth dropped
sharply in November 2008
(FY09) as the impact of
crackdown on one of the
exchange companies and
outflows restrictions imposed by
SBP were complimented by fall
in imports (see Figure 6.25).
This trend continued for a year,
however, Dec 2009 onwards,
services imports have started to recover. The YoY monthly recovery in services
imports owes to rise in merchandise imports, higher travel payments and increase
in payments through
international bodies.15
Transportation services
payments which account for
half of the total services import
payments fell by 9.8 percent
during Jul-Apr FY10 compared
to a 3.4 percent increase in the
comparable period last year.
The principal reason for this fall
was lower freight payments
compared to last year due to fall
in merchandise imports in H1-
FY10 (see Figure 6.26).
Passage earnings of foreign airlines and Pakistani transport companies’ expenses
also fell during the period under review. Closure of flight operations by some
major international airlines continued to restrict the passage earnings of foreign
15Payment to international bodies (such as UN, WHO, USAID, etc.) is paid in rupee counterpart
(converted to dollars for accounting purposes) to these organizations against receipts from these
organizations.
-60
-40
-20
0
20
40
Jul-
08
Oct-
08
Jan
-09
Ap
r-0
9
Jul-
09
Oct-
09
Jan
-10
Ap
r-1
0
per
cen
t
Transportaion Travel Other business Govt. Others
Figure 6.25: Contribution in Imports Growth
-44
-22
0
22
44
66
Jul-
08
Oct
-08
Jan
-09
Ap
r-0
9
Jul-
09
Oct
-09
Jan
-10
Ap
r-1
0
per
cen
t
Freight payments Merchandise imports
Figure 6.26: Monthly Imports Growth

Third Quarterly Report for FY10
89
airlines. The category’s imports are likely to decline further after the
discontinuation of flight operations by Singapore airlines.16
In line with the expectations,
travel services and other
business services imports declined on account of
restrictions on outflows through
exchange companies. Payments
through exchange companies,
which constitute the bulk of
overall groups’ imports,
declined by 51.4 percent during
Jul-Apr FY10 (see Figure 6.27).
Although travel services
payments fell by 18.2 percent,
its sub category ‘holiday on
recreational tours abroad’ increased to US$ 55 million during Jul-Apr FY10 from
US$ 8 million in the corresponding period last year. This probably reflects the
shift of local tourists to international destinations due to security concerns within
the country.
Similar to travel services
imports, other business services
imports also fell by 35.0 percent.
Monthly data however, shows
deceleration in the declining
trend of both these categories.
Travel services even posted a
positive growth in Q3-FY10.
The rising trend in both, travel
and other business services
imports reflect the withering of
the impact of fall in the
payments through exchange
16Singapore Airlines, the flag-carrier airline of Singapore, has informed the Civil Aviation Authority
of Pakistan it will stop flight operations from February 17, 2010.
-0.6
0.0
0.6
1.2
1.8
2.4
Jul-Apr-FY09 Jul-Apr-FY10
bil
lio
n U
S$
SBP Commercial banks
Figure 6.28: Foreign Exchange Reserves Flows
0
20
40
60
80
100
Jul-Apr-FY09 Jul-Apr-FY10
per
cen
t
Exchange companies Holiday Hajj Others
Figure 6.27: Major Components of Travel Services Imports

The State of Pakistan’s Economy
90
companies17
in the aftermath of crackdown and outflows restrictions imposed by
SBP.
6.5 Foreign Exchange Reserves
Pakistan’s foreign exchange reserves increased by US$ 2.4 billion to reach US$
15.2 billion by the end of April 2010 (see Figure 6.28). While a large part (US$
1.8 billion) of this increase was contributed by SBP’s reserves, commercial banks’
reserves also made a positive
contribution of US$ 560 million.
Quarterly analysis suggests that
accumulation in reserves was
concentrated in Q1-FY10, while
reserves increased only
marginally in the subsequent
quarters. This is because a
substantive part of the rise in
reserves during Q1-FY10 owed
to SDRs allocation and
disbursements by IMF under
SBA. Thus, lower disbursement
from IMF in the following
quarters limited the rise in
reserve (see Figure 6.29).
Apart from IMF support,
increase in SBP’s reserves
during Jul-Apr FY10 may also
be attributed to shifting of oil
payments to interbank market
and exchange rate adjustment.
While the former significantly
reduced need for market
interventions, the latter helped in
curtailment of current account
deficit.18
17During FY09 SBP imposed number of restrictions on outflows from exchange companies. In Oct
FY09 one of the exchange companies was also raided by the FIA. These two factors substantially
curtailed both imports and export payments through exchange companies. 18Had current account deficit not contracted, foreign exchange reserves would have either depleted
or would not have shown any improvement
-1
0
1
2
3
Q1 Q2 Jan-Apr
bil
lio
n U
S$
Figure 6.29: Forex Reserves Flows during FY10
-540
-360
-180
0
180
360
Q1
-FY
09
Q2
-FY
09
Q3
-FY
09
Q4
-FY
09
Q1
-FY
10
Q2
-FY
10
Jan
-Ap
r
mil
lio
n U
S$
FE-25 Commercial banks total
Figure 6.30: Commercial Banks Reserves

Third Quarterly Report for FY10
91
The rise in commercial bank reserves during Jul-Apr FY10, on the other hand,
largely reflects increase in foreign currency deposits and retirement of foreign
currency loans (see Figure 6.30). Increase in both of them was a function of
expectation of exchange rate depreciation, which not only encouraged inflows in
foreign currency accounts but also discouraged lending from FE-25 deposits. The
increase in commercial bank reserves is quite remarkable, given the shifting of oil
payments to interbank market which led to negative trade nostros of commercial
banks.
While there was a US$ 19.5
million YoY decline in the net
trade financing during Jul-Apr
FY10, export financing recorded
substantial disbursements in
Mar-Apr 2010. The rise in
disbursements in March and
April 2010 seems to be the result
of 0.7 and 0.5 percent monthly
appreciation of Pak rupee vis-à-
vis US dollar and the increase in
interest rate differential between
EFS and weighted average
foreign currency lending rate
(see Figure 6.31).
Reserve Adequacy Indicators
There are a number of methods
to assess the reserves adequacy,
of these the most common is
import coverage ratio or import
adequacy ratio. This ratio is
particularly relevant for low-
income countries exposed to
current account shocks and
without significant access to
capital markets. During Jul-Apr
FY10 owing to fall in imports,
Pakistan’s import coverage ratio
remained fairly stable with
reserves adequate to finance
more than six months of imports (see Figure 6.32a).
-90
-60
-30
0
30
60
Jul
Oct
Jan
Ap
r
mil
lio
n U
S$
Exports financingImports financing
-1.5
-1.0
-0.5
0.0
0.5
1.0
1.5
1.8
2.1
2.4
2.7
3.0
3.3
Jul
Sep
No
v
Jan
Mar
per
cen
t
per
cen
t
Interest rate differentialDepreciation (RHS)
Figure 6.31: Trade Financing and it's Determinants
1
2
3
4
5
6
7
Jul-
08
Oct
-08
Jan
-09
Ap
r-0
9
Jul-
09
Oct
-09
Jan
-10
Ap
r-1
0
mo
nth
s o
f im
por
ts
Benchmark
Figure 6.32 (a): Import Coverage Ratio
0
1
2
3
4
Q1
-FY
09
Q2
-FY
09
Q3
-FY
09
Q4
-FY
09
Q1
-FY
10
Q2
-FY
10
Benchmark
Figure 6.32 (b): Reserves to Short Term Debt and Liab.

The State of Pakistan’s Economy
92
Another benchmark, known as the Greenspan-Guidotti rule, is widely used
measure of assessing vulnerability to capital account crisis. Pakistan’s foreign
exchange reserves to short term debt & liabilities (STDL) ratio also stood
comfortably at 3.1 by the end-Dec-09 (see Figure 6.32b). The benchmark level of
this ratio is 1(see Box 6.1).19
Box 6.1: Significance of Reserves to STDL Ratio and Definition of Short-Term External Debt
The significance of forex reserves/short term debt and liabilities ratio as a vulnerability indicator has
become increasingly evident,
(1) A country with a low international reserves/short-term external debt ratio is more vulnerable to
external shocks; (2) A low reserves/short-term external debt ratio may be an indication of imprudent
macroeconomic policies; (3) An economic crisis will tend to be more severe if the ratio is low, as the
current account and exchange rate adjustments required to balance the macroeconomic accounts are
magnified.
However, calculating this indicator is not an easy task. The definition of short term debt and
liabilities is one of the major obstacles in computing this vulnerability indicator apart from data
issues. Short term external debt is identified as a cross border debt with the maturity of a year or
less. At present two definitions are being used for short term debt20 .
1) Remaining maturity concept: According to this concept all external or cross border debt is
regarded as short term debt which becomes due within a year, regardless of its original maturity.
This definition is being used by Bank for International Settlements (BIS).
2) According to World Bank's publication Global Development Finance, short term debt encompass
only external liabilities, including official trade credits extended to developing countries as reported
by OECD, with original maturities of one year or less.
6.6 Exchange Rate
During Jul-Apr FY10 Pak rupee
exhibited relative stability,
depreciating by only 3.5 percent
compared to 16.3 percent in the
same period of the previous
year. While lower trade deficit
and sustained growth in
workers’ remittances lent
support to rupee stability,
decline in financial inflows
acted adversely. Nevertheless,
as overall external account
balance remained in surplus and
19STDL constitutes the total short term external debt as well as the payments of principal and/or
interest due within a year or less. 20Source: IMF
81
82
83
84
85
86
87
2-J
ul-
09
28
-Ju
l-0
9
23
-Au
g-09
18
-Sep
-09
14
-Oct
-09
9-N
ov
-09
5-D
ec-0
9
31
-Dec
-09
26
-Jan
-10
21
-Feb
-10
19
-Mar
-10
14
-Ap
r-1
0
10
-May
-10
Pk
R /
US
$
Interbank selling rate Kerb selling rate
Figure 6.33: Forex Market

Third Quarterly Report for FY10
93
the reserve position was stable, pressures on the rupee remained manageable.
Volatility in the kerb-market however, remained substantial throughout the Jul-
Apr FY10 period, initially on account of Hajj related demand and later due to
shifting of oil payments. Demand for the US$ in the kerb-market was particularly
high in January and February 2010, which led to substantial rise in the kerb
premium and volatility in the exchange rate (see Figure 6.33 and 6.34).
Anecdotal evidence suggests
that the exaggerated demand for
the hard currency in Jan-Feb
FY10 was mostly speculative as
it died out in the following
month (March 2010). The
calming of the speculative
pressure in the kerb-market may
also have been influenced by
rise in portfolio investment and
increased in workers’
remittances in this month.
The improvement in inflows
allowed Pak rupee to regain
some of the ground it lost in
February as rupee appreciated
by 1.22 percent vis-à-vis US
dollar between end- Feb and
end-Apr 2010.
Pak Rupee Performance
against Major Currencies
US dollar has been gaining
strength against major
currencies i.e. euro and pound
since December 2009. Events
in Greece and concerns about
future problems in other
European countries: Portugal,
Ireland and Spain are keeping
the dollar stronger. Also the fact, that the economy is improving more in the US
than in Europe is helping dollar gain strength.
0.0
0.1
0.2
0.3
0.4
0.5
0.6Ju
l-0
9
Au
g-09
Sep
-09
Oct
-09
No
v-0
9
Dec
-09
Jan
-10
Feb
-10
Mar
-10
Ap
r-1
0
stan
dar
d d
evia
tion
Interbank Kerb
Figure 6.34: Volatility Comparison of Interbank and Kerb Rate
-4
-2
0
2
4
6
Jul-
09
Au
g-0
9
Sep
-09
Oct
-09
No
v-0
9
Dec
-09
Jan
-10
Feb
-10
Mar
-10
Ap
r-1
0
per
cen
t
EURO GBP JPY
Figure 6.35: Movement of Pak Rupee Vs Major Currencies

The State of Pakistan’s Economy
94
The relative strength of dollar against euro and pound, and Pak rupee’s stability
against the US dollar resulted in Pak rupee’s appreciation against major
international currencies Dec-09 onwards (see Figure 6.35).
Pak rupee, however, depreciated against the trade weighted basket of currencies.
The Nominal Effective
Exchange Rate (NEER)
depreciated by 4.6 percent
during Jul-Mar FY10 compared
to 6.4 percent during the same
period last year (see Figure
6.36). This depreciation was
more than offset by the increase
in the Relative Price Index (RPI)
that is due to higher domestic
inflation compared to the trading
partner countries. As a result
Real Effective Exchange Rate
(REER) appreciated by 3.5
percent (see Figure 6.36).
6.7 Trade Account21
A decent 8.0 percent YoY rise in
exports accompanied by a
smaller 2.8 percent YoY
contraction in imports caused
the country’s trade deficit to
record 13.9 percent YoY fall
during Jul-Apr FY10.
The entire improvement in trade
deficit was concentrated in the
initial five months of the period
under review. This was
principally due to compression
in imports on account of sharp
fall in import prices during this
21The analysis is based on provisional data provided by the Federal Bureau of Statistics, which is
subject to revisions. This data may not tally with the exchange record numbers posted in the section
of Balance of Payments.
-8 -4 0 4 8 12
RPI
NEER
REER
percent
FY09 FY10
Figure 6.36: Changes in REER, NEER and RPI (Jul-Mar)
-66
-44
-22
0
22
44
66
Jul-
08
Sep
-08
No
v-0
8
Jan
-09
Mar-
09
May
-09
Jul-
09
Sep
-09
No
v-0
9
Jan
-10
Mar-
10
perc
en
t
Trade deficit Exports Imports
Figure 6.37: Trade Account - Growth

Third Quarterly Report for FY10
95
period. Import growth, however, recovered strongly December 2009 onwards
outpacing a substantial recovery in export growth. As a result, trade deficit
recorded YoY increase from December 2009 (see Figure 6.37).
The December 2009 onwards
increase in import growth is
attributable to, reemergence of a
positive price impact; (see
Figure 6.38a) as well as, some
revival in domestic demand.
The revival in domestic demand
probably benefited from the
government policies which
aimed at stimulating economic
activity. Encouragingly, these
policy support measures, along
with some recovery in the global
economy, were also helpful (see
Figure 6.38b) in bringing about
a reasonable recovery in exports
growth post Q2-FY10.
Going forward, imports bill is likely to rise on account of continued price and
demand pressures. A corresponding recovery in exports, however, is likely to
keep trade deficit for the whole FY10 in the negative territory.
Exports
A variety of supportive external
and domestic factors led
country’s exports to record a
redeemably 8.0 percent YoY
growth during Jul-Apr FY10,
compared to a marginal 3.6
percent YoY decline recorded
during the same period last year.
In terms of monthly
performance, after remaining in
the negative territory for almost
a year, export growth started to
pickup from October 2009 (see
-42
-28
-14
0
14
28
42
Jul-
08
Oct-
08
Jan
-09
Ap
r-0
9
Jul-
09
Oct-
09
Jan
-10
Ap
r-1
0
perc
en
t
Pakistan exports
World imports
Figure 6.38(b): Growth in Exports and World Demand
-60
-40
-20
0
20
40
60
Jul-
08
Oct-
08
Jan
-09
Ap
r-0
9
Jul-
09
Oct-
09
Jan
-10
Ap
r-1
0
perc
en
t
Global com. price index Imports
Figure 6.38(a): Growth in Imports and World Prices
-30
-15
0
15
30
45
Jul-
08
Oct-
08
Jan
-09
Ap
r-0
9
Jul-
09
Oct-
09
Jan
-10
Ap
r-1
0
perc
en
tage p
oin
ts
Food group Textile groupPetroleum group Other manufactures groupAll other items
Figure 6.39: Contribution in Export Growth

The State of Pakistan’s Economy
96
Figure 6.39). The recovery in exports has been broad based led by better
performance of food group; textile and jewelry exports (see Table 6.7).
The rise in food group exports was largely on account of increase in exports
quantum of other varieties of rice, fruits & vegetables, meat, etc., with rise in
export quantum of other varieties of rice making highest contribution to export
growth during Jul-Apr FY10. This was, in turn, helped by higher left over stocks
of FY09 (see Box 6.2) and better than targeted rice production during FY10. 22
In
addition weak rice crop in Philippines and India, preferential duty extension to
Pakistan’s Irri-6 rice by Kenya also helped in achieving higher export volumes
during the period under review.23
More than half of the impact of rise in export
quantum, however, was offset by a YoY fall in export unit values of rice during
this period.
22The target of rice production for FY10 was 5.9 million tons, while the estimated production is 6.3
million tons. 23Pakistani rice exports are being charged 35 percent import duty while others are charged 70
percent.
Table 6.7: Export Growth Composition Analysis
value million US Dollar; growth percent
Jul-Apr FY10 Quarterly YoY growth
Value Growth Abs ∆ Quantum
impact
Price
impact Q1 Q2- Jan- Apr
Major drivers of export growth
of which Other varieties of
rice 1,108.9 44.1 339.1 758.4 -418.8 -18.5 30.6 116.6
Cotton yarn 1,211.0 32.1 294.5 272.0 22.5 9.0 53.8 34.2
Art silk and
synthetic textiles 381.5 66.9 153.0 102.2 50.7 -28.1 360.2 72.7
Jewelry 397.0 102.6 201.1 293.6 26.0 16.1
Raw cotton 194.2 140.2 113.3 94.2 19.2 39.3 200.8 188.5
Fruits 208.8 55.1 74.1 54.7 21.8 11.8 147.4 46.0
Chemicals and
pharmaceuticals 621.6 22.0 112.3 - - 4.7 10.9 44.4
Other textile material
229.0 31.4 54.7 - - -6.5 34.9 82.1
Readymade
garments 1,059.6 5.2 52.5 -71.1 123.6 -2.7 -1.3 19.2
Petroleum products 456.2 13.7 55.1 76.5 -21.5 -43.9 21.1 112.4
Others 10,016.3 -2.6 -269.2 -3.2 -495.2 -22.6 -2.1 18.0
Total exports 15,884.1 8.0 1,180.0 1,283.8 -697.7 -14.9 10.4 29.8

Third Quarterly Report for FY10
97
The fall in the unit values was
not surprising as international
rice prices were expected to
revert back to long-term trends
after recording an unusual rise
during Jan to Jun, 2008 (see
Figure 6.40).
The fall in unit values of basmati
and other varieties of rice during
Jul-Apr FY10 resulted in large
negative price impact in both
these categories.
Box 6.2: Rice Exports and Domestic Stocks Position
Pakistan’s rice export season starts around October with the arrival of new crop and lasts till around
March. During this time around 50 percent of the total rice production is exported, while the
remaining is available as unsold stocks for domestic consumption and gradual exports till the arrival
of new crop. During FY09, country harvested a bumper rice crop to the tune of 6.9 million tonnes,
however, due to a variety of reasons, only 40 percent of the total production was exported.24 As a
result there was a large stock carried forward to FY10 (see Table 6.2.1).
In FY10 also, rice production was better
than the targets set by the government.
Hence, during Jul-Apr FY10 although
the rice export quantum recorded a sharp
66.6 percent surge, a significant stock is
still lying unsold with the growers and
exporters.
With production of Vietnam and
Thailand entering the international
market Feb onwards, it would become
increasingly difficult for Pakistan to
unload its existing stocks at competitive
prices. In this scenario there is a possibility of a large carried forward stock of rice from FY10 to
FY11 as well. This could potentially lead to a supply glut in the domestic market that is likely to
adversely affect both, the exporters and the rice farmers. What is more worrying is the fact that the
losses may force farmers to reduce area under cultivation for rice crop thus depriving country of an
important foreign exchange earner in FY11.
24These include 1) tough competition from competitors 2) the government procurement of rice by
PASSCO and TCP, which prevented an expected large fall in the domestic prices of rice, thus
hurting competitiveness of country’s exporters 3) ambiguity regarding the crop size which hindered
exporter’s ability to make proper assessment of exportable surplus. 25Wastage refers to harvesting and milling losses. These are taken as 5 percent of the whole produce
for the purpose of analysis.
Table 6.2.1: Estimated Rice Exports, Consumption, Stock
Position
million metric tonnes
FY08 FY09 Jul-Mar
FY10
A Production 5.6 6.9 6.7
B Wastage25 0.3 0.3 0.3
C A-B+ Previous carried forward stock
5.7 7.5 9.1
D Exports 2.8 2.7 3.3
E Average approx. consumption 2 2 1.5
C-D-E = carry forward 0.9 2.8 4.3
250
450
650
850
1050
1250
Jul-
07
Oct
-07
Jan
-08
Ap
r-0
8
Jul-
08
Oct
-08
Jan
-09
Ap
r-0
9
Jul-
09
Oct
-09
Jan
-10
Ap
r-1
0
US
$ /M
T
Rice global price Export unit value
Figure 6.40: Global Rice Prices and Export Unit Values

The State of Pakistan’s Economy
98
As with rice, the rise in fruits,
vegetables and meat exports
was also helped by large
increases in quantum (see Table
6.8) during Jul-Apr FY10. The
rise in fruits exports was
recorded in the categories of
mangoes, dates, edible nuts, and
kinos26. Better marketing
efforts were instrumental in this
improved performance of the
fruit export category.27
Similarly, meat exports also recorded a large volume increase during Jul-Apr
FY10. Specifically, exports of goat meat to Saudi Arabia doubled in absolute
terms, due to which its share in total meat exports increased from 21 to 35 percent.
The increase in the meat exports appears to be the result of ban imposed by Saudi
Arabia on meat imports from Ethiopia in FY09. Ethiopia has been one of the
main suppliers of meat to Saudi Arabia.
Exports of many agricultural categories (fruits, vegetables, meat, fish, etc.) are,
however, under pressure due to large scale smuggling of these products.
Smuggling is rampant due to 1)-Export of these categories generally faces strict
SPS related requirements, and smuggling is the means to avoid these restrictions;
2) The rise in smuggling to Iran may also be the result of international sanctions
on this country due to which, many banks decline to open letter of credits for this
country; 3) Smuggling is also a mean to avoid high import duties imposed by
importing countries. The smuggling of these products not only deprives country
from earning foreign exchange on these goods (due to barter or payments made in
domestic currency), but it also leads to rise in their domestic prices. Further
sometimes, the poor quality of smuggled products also leads to imposition of
restrictions on formal trade.
Textile exports recorded a 7.1 percent YoY rise during Jul-Apr FY10 compared
with a 9.2 percent YoY fall observed during the same period last year. A large
share of this increase was contributed by low value added categories such as raw
26Mangoes, dates, edible nuts and fresh kinos exports posted growth of 34.0, 29.0, 450.0 and 28.0
percent, respectively, during Jul-Apr FY10. 27Country was able to increase exports to Russia, Iran, Poland, Sudan, etc. due to rising demand as
well as better marketing efforts.
Table 6.8: Food Group Exports (Jul-Apr)
change in million US dollar; growth percent
Abs
change
Growth
in value
Growth in
quantity
Rice 125.6 7.4 66.2
Basmati -212.9 -23.4 2.7
Non-basmati 339.5 44.1 100.5
Fruits 74.1 55.0 40.6
Vegetables 41.9 71.2 7.3
Meat and meat preparation 23.8 39.8 42.0
Total 180.2 8.0 N.A

Third Quarterly Report for FY10
99
cotton, and cotton yarn, etc. (see Table 6.9). In high value categories readymade
garments and towels recorded some increases.
The improved domestic cotton production during FY1028
and lower production of
cotton in China29
raised demand
for raw cotton, cotton yarn and
synthetic textiles exports from
Pakistan during Jul-Apr FY10.
The increase in cotton yarn
exports led to domestic shortage
of this category resulting in an
increase in domestic prices of
cotton yarn. This raised
concerns from exporters of
downstream high value added
sector30
. To mitigate these
concerns, government capped
cotton yarn exports in January
201031
(see Figure 6.41). As a
result of this decision the surge
28Cotton production increased from 12.06 million bales to 12. 70 million bales during FY10. 29In FY10, cotton production in China declined by 14.4 percent YoY. 30The quantum of yarn exports in total cotton yarn production increased from 18,000 tons per month
in FY09 to 25000 per month during Jul-Mar FY10. 31In January, government imposed a cap on export quantum of 50,000 tons per month, while in
March 2010 the cap was revised downward to 35,000 tons per month.
Table 6.9 : Major Textile Exports Price & Quantum Impact (Jul-Apr)
million US Dollar
FY09
FY10
Due to
Due to
Absolute ∆ Quantum Price Absolute ∆ Quantum Price
Textile Group -800.8 556.3
of which
Raw cotton 22.8 32.2 -9.4 113.3 94.2 19.2
Cotton yarn -166.5 -97.5 -69.0 294.5 272.0 22.5
Cotton fabrics 15.2 -3.3 18.5 -175.4 -223.2 47.7
Knitwear -95.3 145.2 -240.6 -10.1 -121.2 111.1
Bed wear -175.2 -67.3 -108.0 -8.6 27.8 -36.4
Towels 27.1 65.1 -38.0 25.5 141.5 -116.1
Readymade garments -176.5 -289.3 112.8 52.5 -71.1 123.6
Art silk and synthetic textiles -0.1 -0.1 0.0 153.0 102.2 50.7
80
96
112
128
144
160
176
30
40
50
60
70
80
Jul-
08
Oct
-08
Jan
-09
Ap
r-0
9
Jul-
09
Oct
-09
Jan
-10
Ap
r-1
0
Ind
ex
00
0M
T
Export quantum Domestic prices (RHS)
Figure 6.41: Cotton Yarn Exports and Domestic Prices
Cap on yarn export quantum Jan. 2010 = 50,000 tonnes/month March=
35,000 tonnes/month

The State of Pakistan’s Economy
100
in the export of this category is
likely to cool down in the
remaining months of FY10.
It is also probable that the rise in
domestic yarn prices adversely
affected country’s cotton fabrics
exports, resulting in significant
fall in their export quantum
during Jul-Apr FY10 (see Table
6.9).
The exports of high value
categories recorded a modest
revival from Q2-FY10 (see
Figure 6.42). Much of the
increases in high value added
categories’ exports in Q2 and
Q3 FY10 were contributed by
increases in export quantum (see
Figure 6.43). This reflects
improved external demand as
well as better domestic
manufacturing conditions during
this period.
The rise in jewelry export was
mainly caused by a sharp 23.2
percent YoY rise in
international gold prices along
with higher demand from UAE
and US. Further, the facilities
and incentives provided by the
government32
may also have
helped to improve exports of
this category.
32The shipment period for export of gold jewelry against imported gold under Entrustment Scheme,
has been enhanced from 120 days to 180 days. Import of gold, silver, platinum, palladium,
diamonds and gemstones under all schemes are exempted from normal import tariffs.
Table 6.10 : Other Manufactures Exports (Jul-Apr) change million US$, shares percent
Abs ∆ Growth Share in other
manufacturers
Leather manufactures -102.3 -21.7 12.7
Engineering goods -13.4 -6.3 7.35
Jewelry 201.0 102.6 12.58
Molasses -42.4 -49.9 1.27
Cement -81.1 -17.0 13.48
Total 21.8 0.7 N.A
-24
-12
0
12
24
36
Q1
-FY
09
Q2
-FY
09
Q3
-FY
09
Q4
-FY
09
Q1
-FY
10
Q2
-FY
10
Jul-
Ap
r-F
Y10
per
cen
t
Low value added High value added
Figure 6.42: Textile Export - YoY Growth
-300
-200
-100
0
100
200
Q1
-FY
09
Q2
-FY
09
Q3
-FY
09
Q4
-FY
09
Q1
-FY
10
Q2
-FY
10
Jul-
Ap
r F
Y1
0
mil
lio
n U
S D
oll
ar
Price impact Quantum impact
Figure 6.43: High Value Added Textile Exports

Third Quarterly Report for FY10
101
Apart from the categories with improved export performance, some major
categories for instance leather manufacture and cement recorded large YoY
declines during Jul-Apr FY10 (see Table 6.10).
The fall in leather manufactures exports is attributable to both falling external
demand as well as persistence of domestic structural bottlenecks.
As regards cement exports, the
YoY fall in this category was led
by both falling quantum and
export unit values during Jul-
Apr FY09. 33
Although the
production of cement increased
during the period under
consideration, the share of
exports in total production
declined substantially (see
Figure 6.44).
The decline in export quantum
can be explained by depressed
demand from major importers
i.e. Afghanistan, India, U.A.E, Oman, and Qatar, etc. 34
However, going
forward there is a likelihood of a rise in demand from African countries.
Imports
During Jul-Apr FY10 imports recorded a 2.8 percent YoY fall against a 9.8
percent decline recorded during the same period last year. The contraction in
import bill was due to a large negative price impact that deflated import bill in the
first five
33The APCMA (All Pakistan Cement Manufacturers Association) data shows 4.1 percent YoY
increase in export dispatches during Jul-Mar FY10. 34Share of Qatar in Pakistan exports declined from 22 to 14 percent, while share of Oman and UAE
declined from 10 to 6 and 15 to 4 percent respectively during the period under review.
0
12
24
36
48
60
Jul-
08
Sep
-08
No
v-0
8
Jan
-09
Mar
-09
May
-09
Jul-
09
Sep
-09
No
v-0
9
Jan
-10
Mar
-10
per
cen
t
Share in total prodction Average share in FY08-09
Figure 6.44: Share of Exports in Production of Cement

The State of Pakistan’s Economy
102
months of FY10.35
The negative price impact more than offset the rise in quantum
of imports during almost the entire Jul-Apr period.36
In terms of monthly performance, due to anincrease in international commodity
prices and some revival in domestic demand of number of categories, import
growth also moved in positive range from December 2009 onwards (see Figure
6.45 & Table 6.11).
Categories with rising quantum impact:
Petroleum group imports recorded a marginal YoY rise of 1.3 percent during Jul-
Apr FY10. In terms of quantum, while petroleum crude recorded a marginal YoY
decline, petroleum products increased substantially (see Table 6.12). 37
35Specifically, 58 percent of the fall in petroleum group import was on account of the price impact. 36During Jul-Apr FY10 period, quantum impact is 644.0 million US$, while price impact is -1,136.3
million US$. 37 In terms of quantum, largest increase was observed in the import of furnace oil. Demand for
furnace oil emanated from the power generating sector, while strong auto and motor cycle sales,
narrowing CNG-petrol price differential and increasing use of generators resulted in higher demand
for motor gasoline.
Table 6.11: Import Growth Composition Analysis (Jul-Apr)
value: million US Dollar, growth percent
Growth Absolute
change
Percentage
point share
in growth
Price
impact
Quantum
impact
FY09 FY10 FY10
Major commodities recording Increase
of which
Petroleum products 4,612.4 5,305.3 15.0 692.9 2.4 -420.0 1,112.9
Air crafts, ships and
boats 379.7 579.2 52.6 199.5 0.7 N.A N.A
Road motor vehicles 755.3 948.9 25.6 193.6 0.7 N.A N.A
Medicinal products 447.8 611.4 36.5 163.6 0.6 2.8 160.9
Fertilizer manufactured 494.4 666.6 34.8 172.2 0.6 -218.6 415.3
Major commodities recording fall
of which
Wheat un-milled 1,053.8 35.4 -96.6 -1,018.3 -3.5 -1,024.3 6.0
Petroleum crude 3,404.6 2,813.3 -17.4 -591.4 -2.0 -334.9 -256.5
Other machinery 1,845.7 1,336.0 -27.6 -509.7 -1.8 N.A N.A
Telecom 857.1 598.6 -30.2 -258.5 -0.9 N.A N.A
Iron and steel 1,090.7 1,017.7 -6.7 -73.1 -0.3 -16.3 -56.3
Others 13,979.8 14,236.1 1.8 256.3 0.9 -271.3 452.9
Total imports 28,921.3 28,122.6 -2.8 -798.8 -2.8 -1,173.9 726.5

Third Quarterly Report for FY10
103
Liquidity shortage, arising from the circular debt issue, along with negative
product margins curtailed
refineries ability to import crude
oil and thus provide relatively
cheaper petroleum products
domestically. SBP’s internal
estimates indicate that the
country could have saved
significant amount on petroleum
group imports during Jul-Apr
FY10 if refineries were able to import the same level of crude as they did in
FY08.38
In that case POL group imports during Jul-Apr FY10 would have
registered negative growth.
Transport group imports recorded a significant 35.5 percent YoY growth during
Jul-Apr FY10. This was largely on the back of a revival in domestic demand for
road motor vehicles). In this category, imports of CKDs in particular, increased
due to high demand from local producers.
Sugar imports also recorded a
sharp increase during the period
under review owing to domestic
shortages caused by lower
production during FY10 crop
season.39
In addition rise in the
international sugar prices also
inflated the import bill.40
Sugar
imports are likely to rise further
in the remaining months of
FY10, as the government has
plans to import a large quantum
38For this exercise the volume of crude imported during Jul-Apr FY08 i.e. 7.0 million tonnes is taken
as a base. 39Domestic production during FY10 was recorded at 2.8 million MT compared to production of 3.1
million MT during FY09. 40The average unit import value was 566.9 US$/MT during Jul-Apr FY10 compared with 433.4
US$/MT during Jul-Apr FY09.
Table 6.12: POL Group Imports (Jul-Apr FY10)
value million US Dollar; growth percent
YoY
growth
Absolute YoY
∆
Quantum
impact
Price
impact
Petroleum
group 1.3 101.6
Petroleum products
15.0 692.9 1,112.9 -420.0
Petroleum
crude -17.4 -591.4 -334.9 -256.5
-50
-25
0
25
50
75
-1800
-1200
-600
0
600
1200
Jul-
08
Oct-
08
Jan
-09
Ap
r-0
9
Jul-
09
Oct-
09
Jan
-10
Ap
r-1
0
Price impact Quantum impactOthers Import growth (RHS)
Figure 6.45: Factors of YoY Change in Imports

The State of Pakistan’s Economy
104
to fill the domestic demand-
supply gap.41
Fertilizer imports increased
substantially during Jul-Apr
FY10 due to rising volumes, as
well as, import prices. Demand
for imported fertilizer originated
from high off-take of both Urea
and DAP during Rabi 2009-10 42
(see Figure 6.46). The higher
import of Urea is attributable to
shortages of gas, which led to a
fall in its domestic production.
The production of Urea is
expected to gain momentum
with the start of a new plant in March 2010, while another plant is also expected to
start operating in the coming
months.43
Although machinery group
imports recorded a large 18.7
percent YoY fall during the
whole Jul-Apr FY10 period (see
Figure 6.47), import of this
category increased during Jan-
Apr-FY10. This rise was
observed in power generating
machinery, cell phones, textile
machinery, agriculture
machinery, etc. 44
In the case of power generating
41Average consumption of sugar is estimated to be around 3.8 million MT per year, whereas
production during FY10 is 2.8 million MT. Keeping this in view, the government announced 1.0
million MT imports of sugar in order to bridge the demand-supply gap during FY10. So far only
0.27 million MT sugar has been imported. 42According to National Fertilizer Development Centre, urea off-take increased by 11.6 percent,
while DAP imports increased by 26.6 percent during Rabi 2009-10. 43Fatima Fertilizer came online in March 2010. 44Imports of power generating machinery, mobile phones, textile machinery and agricultural
machinery increased by 3.3, 299.2, 125.8 and 411.1 percent YoY respectively during Q3-FY10.
50
110
170
230
290
350
Urea DAP
mil
lio
n U
S$
FY09 FY10
Figure 6.46: Imports of Fertilizer Manufactured
-40
-30
-20
-10
0
10
20
Jul-
08
Oct-
08
Jan
-09
Ap
r-0
9
Jul-
09
Oct-
09
Jan
-10
Ap
r-1
0
perc
en
t
Figure 6.47: Machinery Imports Growth (YoY)
Third Quarterly Report for FY10
105
machinery imports, the rise could be attributed to depletion of inventories and rise
in industrial as well as household demand, due to continuous power outages.
The increase in the textile machinery imports is attributable to government and
SBP support announced for this sector.45, 46
These support measures were in
response to the demand of high value added sector, to improve its productivity.
Imports of mobile phones recorded a large 69.9 percent YoY increase during Jul-
Apr FY10. Anecdotal evidence suggests that improvement in overall consumer
demand, launching of new models, and slowdown in sales of smuggled Chinese
cell phones along with relaxation in import duties led to rise in the imports of this
category.47
45SRO 809(I)/2009 dated 19th September 09, allows elimination of 5 percent import duty on textile
machinery. 46SMEFD Circular Letter No. 03 of 2010, according to which import of second hand machinery up-
to June 30, 2010 shall also be eligible for refinancing under the Long Term Financing Facility. 47Reduction of custom duty from Rs 500 to Rs 250 per set and 50 percent reduction in Subscriber
Identification Module (SIM) activation charges.

Third Quarterly Report for FY10
107
Special Section 1
Low Income Housing in Pakistan: Opportunities and Challenges
According to resolution 22/2 of the Governing Council of UN-HABITAT on
affordable housing finance,
Encourages all member States, including the regional ministerial conferences on
housing and urban development, to establish sound and conducive frameworks
and mechanisms to enable extended public and private investment in slum
upgrading and prevention, affordable housing and urban development including
infrastructure and basic services.
Housing is one of the most important sectors of the economy with large positive
externalities in terms of economic growth, public health and societal stability1.
Provision of adequate housing2 is a necessity for survival and is considered a vital
investment in health leading to increase in productive capacity and overall well
being of a person and his/her family3. Importance of housing can be gauged from
the fact that Article 25 (1) of Universal Declaration of Human Rights, Article
11(1) of International Covenant on Economic, Social and Cultural Rights, United
Nations Declaration on Social Progress and Development (1969) and the United
Nations Vancouver Declaration on Human Settlements (1976), all recognize
adequate housing as the right of everyone4.
Despite the fact that housing constitutes one of the basic human rights, more than
a billion people around the globe, including over 14 percent of the population of
South Asia, live in inadequate housing5. Pakistan is no exception to this problem.
According to some estimates housing shortage in the country has reached around
1 Abhas K. Jha (2007), Low-income Housing in Latin America and the Caribbean, Enbrve No. 101,
World Bank 2 United Nation’s Special Rapporteur on the Right of Adequate Housing’s working definition of the
human right to adequate housing is the right of every woman, man, youth and child to gain and
sustain a secure home and community in which to live in peace and dignity. 3 Speech by Mr. Muhammad Shamsul Haque, Deputy Managing Director, Operations Wing, Islami
Bank Bangladesh Limited, at Workshop on Housing Finance in South Asia, May 28, 2009, Jakarta. 4Source: http://www.ohchr.org/Documents/Publications/FactSheet21en.pdf 5 Source: “Expanding Housing Finance to the Underserved in South Asia: Market Review and
Forward Agenda”. Presented by Ms. Tatiana Nenova, Senior Economist (South Asia) World Bank
Group, at South Asia Regional Housing Finance Conference
January 27-29, 2010, New Delhi, India.

The State of Pakistan’s Economy
108
7.57 million units in 2009 with nearly 80 percent of the shortage attributed to
lower and middle income groups6.
Like other developing countries, rapid urbanization over the years in Pakistan has
resulted in growth of slums in urban areas of the country, adding pressure on low
income housing demand. This rising trend of urbanization compounded with a
rapidly growing population7 implies that demand for housing is increasing at a
high pace. According to some estimates, housing deficiency in the country has
been increasing by 300000 houses annually8.
Given the importance of housing and prevailing shortfall of housing facilities in
the country, this special section discusses supply side issues of housing finance,
while focusing on low income housing in particular. It concludes with some
policy recommendations.
Housing Finance Portfolio in Pakistan
In Pakistan most of the housing finance is arranged through personal resources.
The formal financial sector caters to only 1 to 2 percent of all housing transactions
in the country9. Within the formal sector, commercial banks and House Building
Finance Corporation (HBFC), a specialized housing finance institution, are
providing housing finance.
With expansion of HBFC over the years the institution’s present loan portfolio
covers 80 cities and towns of the country with a target to expand its business to
150 towns and cities10
. On the other hand, housing loan portfolio of commercial
banks is generally confined to major metropolitan cities of the country11
. Further
analysis of housing finance portfolio shows that the share of HBFC in overall
housing finance portfolio has witnessed a fall from 55 percent in 2004 to 21
percent in 2009. Consequently the gross outstanding housing finance portfolio of
HBFC decreased from Rs 20.3 billion in 2004 to Rs 15.6 billion in 2009 (see
Figure SS 1.1).
6 Source: Special Address by Kamran Shehzad, Deputy Governor, State Bank of Pakistan, at South
Asia Regional Housing Finance Conference January 27-29, 2010, New Delhi, India. 7 Population growth rate in Pakistan currently stands at 1.7 percent. 8 Presentation by Kamran Shehzad, Deputy Governor, State Bank of Pakistan on Housing Finance
Market in Pakistan, at World Bank- IFC Conference on Housing Finance, May 27-29, 2009, Jakarta. 9 Speech by Kamran Shehzad, Deputy Governor, State Bank of Pakistan, at Workshop on Housing
Finance in South Asia, May 27, 2009, Jakarta. 10 Source: www.hbfc.com.pk 11 Source: http://sahf-
forum.info/Presentation/Rizvi_SessionOverview_RegionalCountriesPresentations.pdf

Third Quarterly Report for FY10
109
One of the reasons for this decrease in HBFC share is rise in NPLs12
that have led
to low disbursement in the subsequent period. On the other hand, banks and other
DFIs witnessed an increase in their outstanding portfolio from Rs 16.6 billion in
2004 to Rs 67.0 billion in 2008 before registering a decline in 2009 to reach Rs
58.8 billion. However, in terms of number of borrowers HBFC still caters around
76 percent of the total borrowers in the housing finance sector. This implies that
HBFC generally disburses smaller amount of loan to a larger number of
borrowers, as compared to commercial banks and other DFIs which are more
inclined to disbursing larger amount of loan to relatively smaller number of
borrowers.
It is important to note that since the active involvement of commercial banks in
housing finance, the overall housing finance portfolio grew significantly from
Rs37 billion in 2004 to Rs84 billion by December 2008. However, in 2009, the
housing sector witnessed
downturn as housing finance
portfolio experienced a dip of
11 percent, reflecting the
impact of economic
slowdown, and now stands at
around Rs74 billion by the
end of calendar year 2009
(see Figure SS 1.1).
Despite showing an increase
in overall housing finance
portfolio, the current level
still remains insufficient13
to
address the housing needs in
the country. In particular,
lower income groups seem to be deprived of housing finance facilities, as
numerous barriers prevent the poor from accessing financing from formal
financial institutions including lack of formal employment, regular incomes and
formal credit histories14
. Given the importance of housing finance, several policy
initiatives have been taken over the decades, with a focus on expanding housing
finance activities in the country. Some of these are discussed below.
12 NPLs of HBFC have increased from Rs 6.2 billion in 2008 to Rs 6.5 billion in 2009. 13 Consumer financing by commercial banks for house building/construction/renovation constitutes
only 2.5 percent of the overall private sector business. 14 Source: GH Bank Housing Journal, Volume 3 Number 8, July-September 2009.
0
15
30
45
60
75
90
2004 2005 2006 2007 2008 2009
bil
lio
n R
s
All banks & other DFIs HBFC
Fig SS 1.1: Gross Outstanding Housing Finance

The State of Pakistan’s Economy
110
Policy Initiatives in Pakistan
As an initial step HBFC was established as a statutory federal body in 1952 with
the objective of providing financial assistance for the construction of houses.
However, after the establishment of HBFC, no major steps towards providing
housing facilities were seen until the establishment of Pakistan Housing Authority
(PHA) in 1999. PHA is a subsidiary of Ministry of Housing and Works and was
established to undertake construction of approximately 4500 apartments at
affordable prices for low and middle income groups. PHA has so far undertaken
18 projects involving 4476 housing units in four major cities including Karachi,
Lahore, Islamabad and Peshawar15
.
In 2001, National Housing Policy was initiated realizing the fact that housing is
one of the major pillars of the macro-economy and that there is ever increasing
short fall of housing stock in the country. The policy emphasised on resource
mobilization, increasing land availability, provision of incentives for home
ownership, provision of incentives to developers and constructors and promotion
of research and development activities to make construction cost effective16
.
Apart from the above mentioned steps various other initiatives have also been
taken for improving housing facilities in the country. Amongst these are the
Prime Minister’s housing programme that was announced in 2008 under which
one million housing units would be constructed for government employees, media
men and general public at affordable cost mainly through foreign investment and
joint ventures. Such a step on part of the government is appreciable but the focus
of this scheme does not seem to be on low income housing.
State Bank of Pakistan is also striving hard for improving housing finance
activities in the country17
. In this regard the central bank is working with the
International Finance Corporation of the World Bank for the establishment of
Mortgage Refinance Company (MRC), for availability of low cost housing
finance and establishment of an observatory for real estate market. Housing
Advisory Group (HAG) has also been established by the SBP in order to carry out
a comprehensive analysis of the current regulatory and policy framework
regarding housing finance.
In order to improve human capital related to the housing industry, SBP has
launched a comprehensive housing finance training program covering all aspects
15
www.pha.gov.pk 16 Source: Board of Investment, Government of Pakistan.
http://www.pakboi.gov.pk/pdf/Sectoral%20Policies/National%20Housing%20Policy%202001.pdf 17 For details see http://www.sbp.org.pk/SME/pdf/DFG-Dec-09.pdf

Third Quarterly Report for FY10
111
of housing finance from product development, loan marketing and origination to
loan underwriting, servicing, and risk management.
In accordance with the recommendations of HAG, SBP in coordination with
Association of Mortgage Bankers is also working towards the development of web
portal aimed at providing reliable information on various factors of
housing/mortgage industry.
Challenges & Way Forward
Though various steps have already been taken for providing housing base in the
country, a high number of people still remain without access to adequate housing
finance. Lower segments of the society, particularly in the urban areas18
, still
remain deprived of appropriate housing facilities.
The widening gap between demand and supply of housing in the country can be
seen as an opportunity by private entrepreneurs and developers. However,
incentives are necessary in order to attract entrepreneurs and private developers.
Global experience shows that in order to attract private developers into low-
income housing construction, governments use wide range of incentives at the
central and local level, including tax deductions, density bonuses, direct subsidies,
land grants, land classification shifts from commercial to residential use, and
bureaucratic and administrative streamlining to reduce processing costs and time19
.
Given the labor intensive nature of construction in the country, growth in the
construction activities also has the potential of bringing major socio-economic
impacts in the country including generation of job opportunities as several
industries are directly or indirectly linked with construction activities20
.
However there are several challenges confronting the domestic housing finance
industry at present. These include: (a) shortage of finance especially for low
income housing; (b) limited land registration information system; (c) lack of
proper legal framework protecting rights of house owners; (d) issues in land
availability for construction purposes especially in urban areas; (e) limited
targeted subsidy programs for low income housing; (f) inadequate research for
introducing cost effective construction techniques; and (g) lack of incentives for
private developers to enter low income housing schemes. It is therefore necessary
18 Over 45 percent of the total urban population is believed to be living in slums, Source:
Development of Strategic Goals for Housing Finance in Pakistan (2009): Infrastructure and Housing
Finance Department State Bank of Pakistan 19 Source: Low-Income Housing Policies: Lessons from International Experience: Observations and
Suggestions, Asian Development Bank (ADB) 2009. 20 Source: GH Bank Housing Journal, Volume 3 Number 8, July-September 2009

The State of Pakistan’s Economy
112
that all housing finance stake holders put concerted efforts for improving housing
base in the country. Some of the measures that can serve towards betterment in
providing housing finance facilities are discussed below.
A major step towards improvement can be the introduction of appropriate legal
reforms ensuring private property rights that augment housing finance activities.
There should also be proper documentation, computerization, and automation of
title registration and title transfer.
Given that major urban centers of the country are already densely populated, one
of the options available with the government is to start housing and infrastructure
improvement programs in the suburb areas of urban centers. However such an
effort is both costly as well as difficult. Therefore priority can be given to
improvements in the already existing poor communities (see Box 1).
One of the major steps towards provisioning of affordable housing to lower and
middle income groups can be the reduction in overall cost of construction
activities. In this regard improving land availability for construction activities can
help in reducing land price escalation in the country. This can be achieved by
utilization of vacant public land for construction activities especially for low
income housing schemes21
. Moreover construction of high rise buildings
accommodating a large number of people, can also serve to solve the problem of
land availability.
Micro housing finance is another area that can be explored for enhancing the
access to finance for lower and middle income groups. Though SBP has already
made amendments in prudential regulation for microfinance banks (PR 10),
whereby maximum loan size up to Rs 500,000 to a single borrower with
household annual income up to Rs 600,000 is allowed, this area is still in its
infancy stage. Micro housing program of Grameen Bank Bangladesh shows that
such programs can help in providing housing facilities to low income groups (see
Box 1).
Given that access to adequate housing facilities cannot be provided to lower
income groups without government intervention it is therefore necessary that
appropriate subsidy programs should be developed with a focus on the poor
segments of the society. Since government has already introduced various safety
net programs, data available from such programs can be used to identify potential
21 Source: Recommendations for Nationwide Provision of Housing Finance, Housing Advisory
Group (HAG), State Bank of Pakistan.

Third Quarterly Report for FY10
113
recipient of these subsidy programs. Such subsidy programs are already prevalent
in the regional economies and have remained successful, e.g., India, China, Hong
Kong, Malaysia, and Indonesia, provide subsidies targeted for low-price
housing22
.
Conclusion
Domestic housing finance sector has shown growth over the years but the present
level still remains far below the housing requirements in the country. Given the
huge backlog in housing sector and an increasing housing deficiency in the
country, opportunities remain abundant especially if efforts are concentrated in the
lower and middle income groups which form a major part of the housing backlog.
Present housing finance portfolio seems to be concentrated in the upper income
groups and appropriate targeted schemes for lower income groups remains a
challenge.
Though several policy initiatives have already been taken but there is still room
for improvement. Joint efforts by all housing finance stakeholders particularly,
the public sector-federal government, provincial governments, and housing
finance institutions are required. Such joint efforts will increase both transparency
as well as efficiency for providing adequate housing to lower and middle income
segments of the society.
Box 1: Low Income Housing (Success Stories)
Housing Micro Finance Grameen Bank Bangladesh. Grameen started providing housing micro
finance in 1984. Loans are provided to customers on group basis and cost efficient houses are built
according to functional design/technology specified by Grameen Bank. The repayment period is 5
years with a concessionary interest rate of 8 percent per annum. As of March 2010, the total
outstanding loan of housing finance stands at US $ 2.67 million with overdue loan accounting for
only US $ 0.162 million.
Saiban Pakistan. Saiban incremental housing has been operational in Pakistan for the last 20 years
providing housing needs to poor segments of the society through Khuda Ki Basti’s (KKBs).
According to the scheme after necessary verification, an onsite plot is provided to a family with
payment in installments. Construction is initiated by the family on an incremental basis subject to
their financial means with technical and other support in construction provided by the management.
The program requires the fulfillment of on-site living conditional for a non-transferable ownership of
the plot to the family.
Each KKB offers regular and prime plots. The regular plots are provided on no profit no loss basis
to low income families earning between Rs 5000 to Rs 15000. The remaining plots are sold in the
open market for profit. Presently, fourth KKB project is operational in Lahore in association with
22 Source: GH Bank Housing Journal, Volume 3 Number 8, July-September 2009

The State of Pakistan’s Economy
114
Acumen Fund of USA. According to some estimates, over 30000 people have so far benefited from
the KKB schemes.
Metro Manila Slum Resettlement: Philippines. In 1997, for expansion of Metro Manila Railway
tracks, around 80000 slum dwellers had to be evacuated. The National Housing Authority
constructed a rehabilitation program for which financing was provided by a Chinese government
consortium. According to the resettlement program, land at subsidized cost (US $ 2200) along with
housing material (US $ 870) and cash for labor (US $ 220) was provided to the people on cost-
recovery basis. The total amount of US $ 3290 is to be repaid in 30 years at 6% annual interest, in
monthly payments. As of 2005, 7297 families from Metro Manila have been relocated.
Phnom Penh, Cambodia. Since 1998 organized poor communities of Phnom Penh along with
district, municipal and national governments and support from UPDF (the local community
development fund) are working collectively for developing housing and settlement improvement
projects for nearly one third of city’s poor communities. According to the scheme municipality and
government pays for new land where local people design and build their own houses. For
construction activities, UPDF provides soft housing loans and infrastructure subsidies. Available
data shows that the partnership has planned, built, managed and paid for 3,000 houses in 108
communities since its inception.
Lyari Expressway Resettlement Project, Pakistan. For resettlement of more than 250,000 people
displaced due to construction of Lyari Expressway, Karachi, a resettlement program was initiated by
the government. According to the program land and financial compensation for construction at
newly developed suburbs in Hawk’s Bay, Taiser Town and Baldia Town was provided to the
displaced people. These suburbs are properly planned with utilities, transport, schools, parks and
roads. Thus people living in unplanned localities at the banks of Lyari River were resettled at
comparatively better living environments.
Baan Mankong Up-gradation Program Thailand. Since 2003, Thailand’s Community
Organizations Development Institute (CODI) has started a slum up-gradation program named Baan
Mankong, for poor urban communities. According to the program local communities create slum
up-gradation plans that can be accomplished in three years. Communities create collective savings
accounts while government provides funds in the form of infrastructure subsidies and soft housing
loans directly to those communities. The local community carries out improvements to their
housing, environment and basic services and manage the budget themselves. Approximately 54,000
households are directly receiving CODI’s financial resources and technical support under the
program.
Sources:
GH Bank Housing Journal, Volume 3 Number 8, July-September 2009.
http://pcij.org/stories/cost-of-resettling-40000-families-deliberately-hidden/
http://www.gcgf.org/ifcext/economics.nsf/AttachmentsByTitle/CON_Housing-
Regional_SouthAsia_May2009_RizviLowIncomePaper/$FILE/Rizvi_LowIncomeHousingPakist
an_overviewpaper.pdf
www.grameen.com

Third Quarterly Report for FY10
115
Acronyms
A/C Account
ABL Allied Bank Limited
ADB Asian Development Bank
APCMA All Pakistan Cement Manufacturers Association
bn billion
BoP Balance of Payments
BP British Petroleum
BSC Behbood Savings Certificate
BSF Business Support Fund
CA Current Account
CAD Current Account Deficit
CBs Commercial Banks
CBU Completely Built Unit
CGS Credit Guarantee Schemes
CIB Credit Information Bureau
CiC Currency in Circulation
c.i.f Cost of Insurance and Freight
CKD Completely Knockdown Unit
CODI Community Organizations Development Institute
CPI Consumer Price Index
CSF Competitiveness Support Fund
CY Calendar Year
DAP Di-Ammonium Phosphate
DBCs Dollar bearer certificates
DD Domestic Debt
DFIs Development Finance Institutions
DPBs Domestic Private Banks
DS Debt Servicing
DSC Defense Savings Certificate
EDL External Debt & Liabilities
EFS Export Finance Scheme
ER Exchange Rate
EU European Union
FAO Food and Agriculture Organization
FBR Federal Board of Revenue
FBS Federal Bureau of Statistics
FC Foreign Currency
FCAs Foreign Currency Accounts
FDI Foreign Direct Investment

The State of Pakistan’s Economy
116
FE Foreign Exchange
FEBCs Foreign Exchange Bearer Certificates
FED Federal Excise Duty
FE-25 Foreign Exchange Cir.No.25
FIA Federal Investigation Agency
FMCG Fast Moving Consumer Goods
FMC Fund Management Company
FO Furnace Oil
f.o.b Free on Board
FoDP Friends of Democratic Pakistan
FOREX Foreign Exchange
FPI Foreign Portfolio Investment
FRDL Fiscal Responsibility and Debt Limitation
FSV Forced Sale value
FY Fiscal Year
GCI Global Competitiveness Index
GDP Gross Domestic Product
GH Bank Government Housing Bank
GoP Government of Pakistan
H Half
HAG Housing Advisory Group
HBFC House Building Finance Corporation
HBL Habib Bank Limited
HDIP Hydrocarbon Development Institute of Pakistan
HRI House Rent Index
HSD High Speed Diesel
IDA International Development Association
IDB Islamic Development Bank
IDBP Industrial Development Bank of Pakistan
IDPs Internally Displaced Persons
IFIs International Financial Institutions
IMF International Monetary Fund
KESC Karachi Electric Supply Corporation
KIBOR Karachi Inter Bank Offer Rate
KSE Karachi Stock Exchange
LCVs Light Commercial Vehicles
LC Letter of Credit
LDI Long Distance & International
LSM Large Scale Manufacturing
LTFF Long Term Financing Facility
MAA Mahana Amadni Account

Third Quarterly Report for FY10
117
MAF Million Acer Feet
MFN Most Favored Nation
MMA Months Moving Average
MoM Month-on-Month
MoU Memorandum of Understanding
MPS Monetary Policy Statement
MRC Mortgage Refinance Company
MRTB Market Related Treasury Bills
MS Motor Spirit
MSCI Morgan Stanley Capital International
MT Metric Ton
NBFIs Non Banking Financial Institutions
NBP National Bank of Pakistan
NDA Net Domestic Asset
NEER Nominal Effective Exchange Rate
NFA Net Foreign Asset
NFI Net Foreign Investment
NFNE Non Food Non Energy
NHA National Highway Authority
NIT National Investment Trust
NPLs Non Performing Loans
NSS National Savings Scheme
NSB National Savings Bond
NWFP North-West Frontier Province
OAEM Other Items Especially Mention
OCAC Oil Companies Advisory Committee
OECD Organization for Economic Cooperation and Development
OGDC Oil and Gas Development Corporation
OIN Other Items Net
OMOs Open Market Operations
OPEC Organization of the Petroleum Exporting Countries
PAF Pakistan Air Force
PAMA Pakistan Automotive Manufacturers' Association
PASSCO Pakistan Agriculture Storage & Services Corporation
PBA Pensioners Benefit Account
PCGA Pakistan Cotton Ginners’ Association
PEPCO Pakistan Electric Power Company (Private) Limited
PFMA Pakistan Flour Mills Association
PHA Pakistan Housing Authority
PIA Pakistan International Airlines
PIBs Pakistan Investment Bonds

The State of Pakistan’s Economy
118
PO Post Office
POL Petroleum, Oil and Lubricants
PPCBL Punjab Provincial Cooperative Banks limited
PPTFC Privately placed Term Finance Certificates
PRI Pakistan Remittance Initiative
PSC Private Sector Credit
PSDP Public Sector Development Program
PSEs Public Sector Enterprises
PSM Pakistan Steel Mills
PSMA Pakistan Sugar Manufacturers' Association
PTA Pakistan Telecommunication Authority
PTCL Pakistan Telecommunication Company Limited
PVMA Pakistan Vanaspati Manufacturers' Association
Q Quarter
QoQ Quarter on Quarter
RBI Reserve Bank of India
RDF Refused Drive Fuel
REER Real Effective Exchange Rate
RES Reserves
RFCAs Residents Foreign Currency Accounts
RHS Right Hand Side
RIC Regular Income Certificate
RPI Relative Price Index
Rs Rupees
RTGS Real Time Gross Settlements
SBA Stand-By Arrangement
SBP State Bank of Pakistan
SDRs Special Drawing Rights
SECP Securities and Exchange Commission of Pakistan
SLR Statutory Liquidity Requirements
SMEs Small and Medium Enterprises
SMEDA Small and Medium Enterprise Development Authority
SMEFD Small and Medium Enterprises Finance Department
SNGPL Sui Northern Gas Pipelines Limited
SPI Sensitive Price Index
SRO Statutory Regulatory Order
SSA Special Savings Account
SSC Special Savings Certificate
SSGC Sui Southern Gas Company
T-bills Treasury Bills
TCO Textile Commissioner’s Organization

Third Quarterly Report for FY10
119
TCP Trading Corporation of Pakistan
TED Total External Debt
TFC Term Finance Certificate
TR Total Revenue
UAE United Arab Emirates
UBL United Bank Limited
UK United Kingdom
UN United Nation
UNCTAD United Nations Conference on Trade and Development
USA United States of America
USAID United States Agency for International Development
USDA United States Department of Agriculture
VAT Value Added Tax
VC Venture Capital
VSS Voluntarily Separation Scheme
WA Weighted Average
WAPDA Water and Power Development Authority
WEO World Economic Outlook
WPI Wholesale Price Index
XGS Exports of Goods & Services
YoY Year on Year
ZTBL Zarai Taraqiati Bank Limited