STARTUPS, ACCELERATORS AND ROLE OF...funding; 3) Accelerators Market in Finland and VIGO. The main...
117
STARTUPS, ACCELERATORS AND ROLE OF TEKES EVALUATION REPORT Halme, K., Salminen, V., Wiikeri, J. (4FRONT Oy); Rouvinen, P., Kotiranta, A., Pajarinen, M. (Etlatieto Oy); Barge, B., Walker, A., Miller, C. (The Evidence Network Inc); Borella, P. (Boro Ltd), Autio, E. (Idea Group LLP) REPORT 1/2018
Transcript of STARTUPS, ACCELERATORS AND ROLE OF...funding; 3) Accelerators Market in Finland and VIGO. The main...
1
STARTUPS, ACCELERATORS AND ROLE OF TEKESEVALUATION REPORT
Halme, K., Salminen, V., Wiikeri, J. (4FRONT Oy); Rouvinen, P., Kotiranta, A., Pajarinen, M. (Etlatieto Oy); Barge, B., Walker, A., Miller, C. (The Evidence Network Inc); Borella, P. (Boro Ltd), Autio, E. (Idea Group LLP)
REPORT 1/2018

Disclaimer:
This evaluation was commissioned by Tekes – The Finnish Funding Agency for Innovation to Forefront Oy and carried out by the evaluation team comprised of 4Front Oy., Etlatieto Ltd., The Evidence Net work Inc., Boro Ltd, and IDEA Group LLP. This report is the product of the authors, and responsibility for the accuracy of the data included in this report rests with the authors. The findings, interpretations, and conclusions presented in this report do not necessarily reflect the views of Tekes.
ISSN 1797-7339ISBN 978-952-457-635-2
Cover photo: Mikael AhlforsGraphic design: Maria SinghPage layout: DTPage Oy
3
TABLE OF CONTENTS
FOREWORD ........................................................................................4
ACRONYMS AND ABBREVIATIONS ..................................................5
SUMMARY ..........................................................................................6
TIIVISTELMÄ ....................................................................................9
1 INTRODUCTION ........................................................................ 12
Background and Objectives of the Evaluation .......................... 12
Approach and Methodology ...................................................... 14
2 FINNISH STARTUP ECOSYSTEM AND TEKES .......................... 17
Startups and the evolution of startup policies ......................... 17
Evolution of the Finnish startup ecosystem .............................24
Tekes activities in the startup ecosystem ................................29
Summary of previous evaluations of Tekes startup and accelerator activities ..........................................................35
3 TEKES IMPACT ON STARTUPS ................................................ 40
Evidence from econometric analyses ...................................... 40
Evidence from the surveys........................................................ 61
NIY experiences & spill-overs – evidence from interviews .......78
4 TEKES IMPACT ON ACCELERATOR MARKET ............................85
Finnish accelerator market and the VIGO programme .............85
Performance of the VIGO accelerators .....................................94
5 CONCLUSIONS AND RECOMMENDATIONS .............................102
REFERENCES ................................................................................. 113
APPENDICES
1 Tekes impact model ......................................................... 116
2 List of interviews .............................................................. 117
Annexes to the main report:
Annex report 1. Extended survey report (by The Evidence Network Inc.)
Annex report 2. How to benchmark accelerators and other Business Support Programs? (by The Evidence Network Inc.)
4
FOREWORD
Start-up companies has several dynamic effects in eco-nomic renewal. The national start-up business environ-ment has developed significantly over the last ten years. Finland offers a good innovation environment to start-ups and growth-oriented businesses. It is remarked that Finland has improved its relative position especially in entrepreneurial culture, and Finland is now one of the best performing countries for example in R&D activity and patents.
The majority of startups use Tekes funding to gain a deeper knowledge of international markets, collect cus-tomer feedback, and develop their teams and the first versions of their products. The most promising compa-nies may be selected to the Young Innovative Compa-ny (NIY) funding scheme, which helps them to rapidly expand into international markets. Funding is primarily awarded for the development of business activities. It can be used to strengthen a team, to develop a business model and growth strategy, and to open up new markets.
Tekes has been active in operating with VIGO acceler-ator, which was active 6 years (2009-2015) launched by The Finnish Ministry of Employment and Economy. Tekes carried out the programme and monitored a coordinator, which made possible a co-operation between contact per-sons, portfolio companies and accelerators. Vigo was a new type of acceleration program designed to complement the Finnish innovation ecosystem. The programme bridged
the gap between early stage technology firms and interna-tional venture funding. the Vigo Programme in 2009.
As of January 2018, Finpro – the Finnish trade pro-motion organization – and Tekes – the Finnish Funding Agency for Innovation – have been united as Business Finland. This change gives more opportunities for start-ups to grow internationally.
Well-functioning innovation environment for start-ups and accelerators help business activities to grow by bringing radical innovations to the economy. Such de-velopment expand innovation activities to new business fields. A goal for this impact study was to find the im-pact effects for 1) Tekes-funded start-ups; 2) Tekes NIY funding; 3) Accelerators Market in Finland and VIGO. The main question of the evaluation therefore was how Tekes activities for start-ups have improved their suc-cess in the global market.
This impact study was carried out by the evaluation team from 4Front Ltd., Etlatieto Ltd., The Evidence Net-work Inc., Boro Oy and IDEA Group LLP. Business Fin-land wishes to thank the writers for their thorough and systematic approach. Business Finland expresses its gratitude to steering group and all others that have con-tributed to the study.
Helsinki, February 2018
Business Finland
5
ACRONYMS AND ABBREVIATIONS
B2B Business-to-BusinessCAGR Compound Annual Growth RateCEM Coarsened Exact MatchingDID Difference-in-differences analysisETLA Economic Research Institute of FinlandFDI Foreign Direct InvestmentFIBAN Finnish Business Angel NetworkFINAC Finnish Business Acceleration NetworkGEI Global Entrepreneurship IndexHGF High Growth FirmICT Information and Communication TechnologiesIPO Initial Public OfferingMEE Ministry of Employment and the EconomyNIY Nuoret innovatiiviset yritykset (Young Innovative Companies, YIC)OECD Organisation of Economic Cooperation and DevelopmentR&D Research and DevelopmentSME Small and Medium-sized EnterpriseTekes The Finnish Funding Agency for Innovation (2018=Business Finland)TEN The Evidence Network Inc.VAINU Vainu.io softwareVC Venture CapitalVIGO VIGO Accelerator
6
SUMMARY
This evaluation provided an assessment of the role of Tekes activities in the Finnish startup-ecosystem as well as provide recommendations on how Tekes can improve its impact on the Finnish startup and accelerator eco-system. The evaluation focused on Tekes R&D funding for startups, NIY programme and the VIGO programme. The evaluation utilised several different methods and approaches, including econometric analyses, web-based surveys, interviews and case-studies.
The evaluation concluded that, although the start-up ecosystem has developed largely independent of Tekes, its role in catalysing and shaping the startup ecosystem should not be neglected. Tekes (Business Finland) remains an important ‘feeder’ and its main ac-tivities are highly relevant tools to support the startup ecosystem also in the near future. Tekes should main-tain its role as a ‘feeder’ instead of a ‘leader’ in the eco-system. In addition, there could be an opportunity for strengthening the ‘facilitator’ role in the future.
Regarding Tekes impact on startups, the evaluation concluded that:• Tekes funding has had a clear positive impact on
startup growth. Evidence from econometric analy-ses suggests that there is impact beyond ‘selection
effect’, i.e., that it is not simply that Tekes is able to pick better companies to fund but also that its fund-ing has some positive causal effect on startup per-formance. The survival rates of Tekes startups and counterparts are largely similar, although the Tekes startups have higher dispersion of growth outcomes (vs non-treated counterparts), which is consistent with desired risk-taking by Tekes.
• Tekes funding has complemented private VC funding. The findings from econometric analyses, in line with previous studies, suggest that Tekes funding complements private VC funding.
• Tekes has boosted startups’ capabilities and growth. Findings from the surveys suggest that Tekes funding has had significant positive impact on startups’ capabilities and performance. NIY pro-gramme participants attribute the most impact on their ability in getting into international markets and capacity to raise capital. Other startups attri-bute greatest impact on their improved R&D activ-ities and product/service offerings.
• Less significant impact on networking and link-ages. The survey findings indicate that the impact on companies’ networks and linkages has been less significant than on other capabilities. This suggest
7
that there is an opportunity to further improve the impact on networking and linkages with different forms of non-financial support.
• Increased impact with non-financial support. Companies that use non-financial support (e.g. mentoring, advisory or networking) to a greater degree attribute higher average impact to Tekes on improvements to their capabilities and perfor-mance. However, most companies only used non-fi-nancial support offerings to a low degree, or did not use them at all.
• NIY flexible but room for improvement. NIY funding was praised especially for its suitability to commercialisation and scaling up the business in-ternationally. The companies, in general, also seem to value the NIY funding process and the mandato-ry ‘milestones’ which help in crystallising goals and business plans. However, there is also room to fur-ther improve the flexibility of the NIY programme by, for example, better allowing rapid pivoting and reallocations of the funding.
• Despite good results, broadening the NIY scope not feasible. It seems that increasing the number of companies would mean that lower quality startups would be accepted, i.e., the programme can probably only grow as the population of aspiring startups in Finland grow in years to come.
Regarding Tekes impact on the accelerator market, the evaluation concludes that:• Finnish ‘accelerator market’ is diverse and het-
erogeneous, corporate venturing important trend – no major interventions needed. All in all, the analysis suggests that the accelerator / ear-ly stage VC market is shaping up and several pri-vate sector actors have emerged. Especially corpo-rate venturing/acceleration appears as an important trend. Currently it seems that there is no rationale for new major public intervention to boost it. Howev-er, further knowledge transfer and facilitation would help to develop the ecosystem.
• Despite its limitations, VIGO has catalysed the accelerator market. The interviews and analysis of VIGO founders suggest that the VIGO programme –despite its apparent and widely acknowledged flaws – has had a clear (although limited) role in catalys-ing the Finnish accelerator and early stage VC mar-ket. It seems that the positive outcomes are largely a result of active entrepreneurs’ own activities, and the role of the VIGO programme was limited but not in-significant. VIGO programme helped to build experi-ence to the Finnish early stage VC investment market ecosystem and provided valuable learnings and ex-periences of different models.
8
• VIGO accelerators have contributed to the emer-gence of high growth ventures. Despite some lim-itations, the analysis of the VIGO accelerators’ port-folio companies suggest that VIGO accelerators have contributed to the emergence of new high-growth companies in Finland – although with mixed results.
The following recommendations are given for Tekes (and Business Finland) in order to further develop the Finnish startup ecosystem and to boost startup devel-opment. The recommendations are elaborated in more detail in the main report.1. Adopt stronger role as ‘facilitator’ and better syn-
chronise activities with other actors. Tekes should maintain its strong ‘feeder’ role in the startup ecosys-tem by providing funding and other support for the most potential Finnish startups. At the same time, Tekes (as part of Business Finland) should explore options for improving its role as a ‘facilitator’, for ex-ample by increasing knowledge transfer, making the ecosystem more transparent, facilitating policy level discussion on ecosystem bottlenecks and strength-ening linkages to leading startup ecosystems. Tekes should also better synchronise its startup activities with other ecosystem actors such as accelerators, VCs and startup communities. Tekes should also consider utilising more challenge-driven approaches and bet-ter aligning its startup activities with societal chal-lenges, for example by allocating larger share of the startup funding through challenge competitions or other challenge-driven funding instruments.
2. More attention to linkages and spill-over effects. In order to improve its broader economic and social impact, and in line with the first recommendation, Tekes (and Business Finland) should put more at-tention on directly promoting the spill-over effects of its funding services (i.e. promoting the transfer of knowledge, technologies, talent, etc. in the start-up ecosystem).
3. Fine-tune existing products and services – and keep exploring new ones. Tekes’ main instru-ments for startups seem to be working reasonably well. However, there is some room for further adjust-ments and improvements as well as exploring new kinds of products and services. These are elaborated in more detail in the main report.
4. Explore more market-driven selection process-es. Acknowledging Tekes’ important ‘gate-keeping’ role in the startup ecosystem and the importance of company selection in Tekes impact model, Tekes should explore and experiment more market-driven selection processes. This could mean for example strengthening the NIY expert panel review process (for example by extending the expert pool with inter-national industry experts); exploring the opportuni-ties of using artificial intelligence for making fund-ing decisions; and putting more weight on private investor involvement in startups when making the funding decisions.
9
TIIVISTELMÄ
Tämä arviointi on tuottanut tietoa Tekesin roolista ja vaikutuksista Suomen startup-ekosysteemissä, sekä esittää suosituksia Tekesin (Business Finlandin) vai-kuttavuuden lisäämiseksi. Arvioinnissa tarkasteltiin erityisesti Tekesin startupeille suunnatun t&k-rahoi-tuksen, NIY-ohjelman ja VIGO ohjelman vaikuttavuut-ta. Arvioinnissa hyödynnettiin useita menetelmiä ja lähestymistapoja, mukaan lukien ekonometrisia ana-lyyseja, sähköisiä kyselyitä, haastatteluita ja tapaus-tutkimuksia.
Arviointi toteaa, että vaikka Suomen startup-ekosys-teemin viimeaikainen kehitys on ollut suurelta osin riip-pumatonta Tekesistä, on Tekesillä kuitenkin ollut selkeä ja tärkeä rooli ekosysteemin perustan rakentamisessa ja potentiaalisimpien yritysten kehityksen vauhdittami-sessa. Tälle roolille on kysyntää jatkossakin. Lisäksi Te-kesin (Business Finlandin) aiempaa aktiivisempi rooli eri toimijoiden välisen yhteistyön fasilitoinnissa on ar-vioinnin perusteella perusteltu.
Startup-yrityksiin kohdistuneiden vaikutusten osal-ta arviointi toteaa seuraavaa: • Tekesin rahoituksella on ollut selvä positiivinen
vaikutus startup-yritysten kasvuun. Ekonometris-ten analyysien perusteella tämä vaikutus ei perustu
vain siihen, että Tekes valitsisi parempia yrityksiä rahoituksen piiriin, vaan myös rahoituksen kausaali-seen vaikutukseen startup-yritysten kasvuun. Lisäk-si Tekesin rahoittamien startupien toteutunut me-nestys vaihtelee vertailuryhmän yrityksiä enemmän, mikä viittaa oikeansuuntaiseen riskinottoon rahoi-tettavien hankkeiden valinnassa.
• Tekesin rahoitus on täydentänyt yksityistä VC-ra-hoitusta. Ekonometristen analyysien perusteella Tekesin rahoitus täydentää yksityistä VC rahoitus-ta. Tulokset ovat linjassa aikaisempien tutkimusten kanssa.
• Tekesin rahoitus on vahvistanut startupien ky-vykkyyksiä ja sitä kautta yritysten kasvua. Ky-selytulosten perusteella Tekesin rahoituksella on ollut merkittävä positiivinen vaikutus startup-yri-tysten kyvykkyyksiin ja menestykseen. NIY-ohjel-maan osallistuneet yritykset arvioivat vaikutusten olevan suurimmat markkinoille pääsyyn ja rahoi-tuksen hankintaan liittyviin kyvykkyyksiin. Muut startupit arvioivat vaikutusten olevan suurimmat t&k-toimintaan ja tuote- tai palvelutarjontaan liit-tyviin kyvykkyyksiin.
10
• Verkostoihin liittyvät vaikutukset ovat kuiten-kin olleet vähäisempiä. Kyselyaineiston perusteel-la Tekesin rahoituksen vaikutus yritysten verkos-toihin ovat vähäisempiä kuin vaikutukset muihin kyvykkyyksiin. Tämän perusteella Tekesin rahoituk-sen vaikuttavuutta on mahdollista parantaa vahvis-tamalla verkostoihin liittyvää ei-rahallista tukea.
• Ei-rahallinen tuki vahvistaa vaikutuksia. Kysely-aineiston perusteella yritykset, jotka ovat hyödyn-täneet sekä rahallista että ei-rahallista tukea (esim. mentorointi, verkostoituminen) muita enemmän, arvioivat vaikutukset suurimmiksi. Suurin osa yri-tyksistä on kuitenkin hyödyntänyt ei-rahallista tu-kea vain vähän tai ei lainkaan.
• NIY-rahoitus on joustava ja toimiva rahoitus-muoto, mutta parannettavaakin löytyy. Yritykset pitävät NIY-rahoitusta erityisen toimivana instru-menttina liiketoiminnan skaalausvaiheeseen. Lisäk-si yritykset pitävät rahoitusprosessia ja siihen liitty-viä välietappeja toimivana käytäntönä tavoitteiden ja suunnitelmien täsmentämiseen. NIY-rahoitusta toivotaan kuitenkin kehitettävän siihen suuntaan, että se mahdollistaisi nykyistä paremmin ”pivotoin-nin” ja suunnitelmien nopeat muutokset rahoitus-kauden aikana.
• NIY-rahoituksen laajentaminen ei suositeltavaa hyvistä tuloksista huolimatta. Aineiston perus-teella näyttäisi siltä, että NIY-rahoituksen laajen-taminen johtaisi siihen, että mukaan pääsisi myös heikomman potentiaalin yrityksiä. Toisin sanoen
NIY-rahoituksen volyymi voi kasvaa vain korkean potentiaalin startup-yritysten määrän kasvaessa.
Kiihdyttämökenttään kohdistuvien vaikutusten osal-ta arviointi toteaa seuraavaa:• Suomalainen kiihdyttämökenttä on monimuotoi-
nen ja hajanainen − uusille merkittäville julkisil-le interventioille ei tarvetta. Analyysin perusteella suomalainen kiihdyttämö- ja/tai varhaisen vaiheen VC-markkina on kehittymissä, ja alalle on syntynyt myös yksityisiä toimijoita. Suurten yritysten star-tup-toiminta (ns. corporate venturing) näyttäytyy nousevana trendinä, joka on syytä huomioida. Täl-lä hetkellä ei näyttäisi kuitenkaan olevan perusteita merkittäville uusille julkisille interventioille tai toi-menpiteille. Tiedonvaihdon lisääminen ja vahvem-pi yhteistyön fasilitointi voisi kuitenkin edistää eko-systeemin kehitystä.
• Selvistä puutteistaan huolimatta, VIGO-ohjelma on ”katalysoinut” kiihdyttämökenttää. Arvioin-nin perusteella VIGO-ohjelmalla oli − selvistä ja ylei-sesti tunnistetuista “valuvioista” huolimatta − selvä rooli suomalaisen kiihdyttämömarkkinan kehittämi-sessä. Kehitys vaikuttaisi suurelta osin perustuvan yksittäisten yrittäjien ja aktiivisten yksilöiden roo-liin, VIGO-ohjelman roolin jäädessä rajalliseksi. Oh-jelma kuitenkin auttoi rakentamaan kiihdyttämö- ja varhaisen vaiheen VC-toimintaan liittyvää osaamis-ta ja toi arvokkaita oppeja erilaisista malleista ja toi-mintavoista.

11
• VIGO kiihdyttämöt ovat osaltaan vaikuttaneet uusien kasvuyritysten syntyyn. Analyysiin liitty-vistä rajoitteista huolimatta VIGO-kiihdyttämöil-lä näyttäisi olleen selvä (joskin vaihteleva) rooli uusien suomalaisten kasvuyritysten kehityksessä.
Tekesin (Business Finlandin) vaikuttavuuden kehit-tämiseksi arviointi suosittelee seuraavaa:1. Fasilitointiroolin vahvistaminen ja yhteistyön
tiivistäminen. Tekesin tulisi säilyttää vahva roo-linsa ekosysteemin ”feederinä” tarjoamalla jatkos-sakin rahoitusta ja palveluita lupaavimmille suo-malaisille startupeille. Samalla Tekesin (Business Finlandin) tulisi vahvistaa fasilitointirooliaan esi-merkiksi lisäämällä tiedonkulkua tai vahvistamalla yhteyksiä kansainvälisiin johtaviin startup-ekosys-teemeihin. Lisäksi Tekesin tulisi tiivistää yhteis-työtään ekosysteemin muiden toimijoiden (esim. kiihdyttämöiden, VC-sijoittajien ja startup-yhteisö-jen) kanssa. Tekesin tulisi myös harkita haasteläh-töisten lähestymistapojen hyödyntämistä nykyistä enemmän, esimerkiksi erilaisten haastekilpailui-den kautta.
2. Lisää huomiota verkostoihin ja spill-over-vai-kutuksiin. Tekesin (Business Finlandin) tulisi kiin-nittää nykyistä enemmän huomiota rahoituksen spill-over-vaikutusten edistämiseen eli tiedon, ide-oiden, osaamisen ja teknologioiden leviämiseen startup-ekosysteemissä (konkreettisia toimenpitei-tä eriteltyä tarkemmin raportissa).
3. Nykyisten ja uusien rahoitusinstrumenttien kehittäminen startupeille. Tekesin startupeille suunnatut rahoitusinstrumentit vaikuttaisivat pää-osin hyvin toimivilta, mutta kehittämisen varaa löy-tyy edelleen. Lisäksi Tekesin tulisi jatkuvasti etsiä uusia tuotteita palveluita vastaamaan startup-eko-systeemin kehitykseen ja muuttuviin tarpeisiin. Tar-kempia ehdotuksia on yksilöity raportissa.
4. Markkinavetoisten valintaprosessien kehittämi-nen. Tekesin tärkeä “portinvartjiarooli” huomioi den, Tekesin tulisi kehittää ja kokeilla aiempaa markki-navetoisempia valintaprosesseja. Käytännössä tämä voisi tarkoittaa esimerkiksi NIY-asiantuntijapanee-lin vahvistamista ja laajentamista kansainvälisillä asiantuntijoilla, tekoälyn tarjoamien mahdollisuuk-sien selvittämistä ja hyödyntämistä rahoituspäätök-sissä tai yksityisten sijoitusten vahvempaa arvotta-mista rahoituksen kriteerinä.
12
1 INTRODUCTION
BACKGROUND AND OBJECTIVES OF THE EVALUATION Startups have an important role in economic growth and renewal. Not only do young and rapidly growing compa-nies create a disproportionately large share of new jobs (and tax revenues), they are also sources of new innova-tive products, services, technologies, and business mod-els, which can catalyse the renewal − or even the disrup-tion − of whole industries (see more in chapter 2). These impacts are also arguments for public intervention for supporting startups as innovation and entrepreneurship policies in advanced economies have increasingly shift-ed towards supporting young companies with the great-est potential.
In Finland, Tekes has arguably been the most import-ant implementation organisation of Finnish policies for startups and high-growth companies. In 2016, the total Tekes funding for startups (less than six-year old com-panies) was €142 million, of which €25 million was pro-vided through the Young Innovative Companies (NIY) programme. Tekes was also responsible for implement-
ing the VIGO programme (2009–2015), which aimed to attract new experienced investor teams into the Finnish VC field.
Meanwhile, during the last 10 years the Finnish start-up ecosystem has gone through significant changes, and is constantly evolving. This highlights the need to review the role of Tekes in the Finnish startup ecosystem. This is the purpose of this report, which presents the find-ings of an independent evaluation of Tekes activities for startups and accelerators. The overall purpose of the evaluation is to provide an assessment of the role of Te-kes activities in the Finnish startup-ecosystem as well as provide recommendations on how Tekes can improve its impact on the Finnish startup and accelerator eco-system.
Although there have been individual studies and anal-yses of Tekes programmes and activities related to start-ups, we believe this is the first report that provides a holistic overview of the Tekes activities for startups and accelerators.
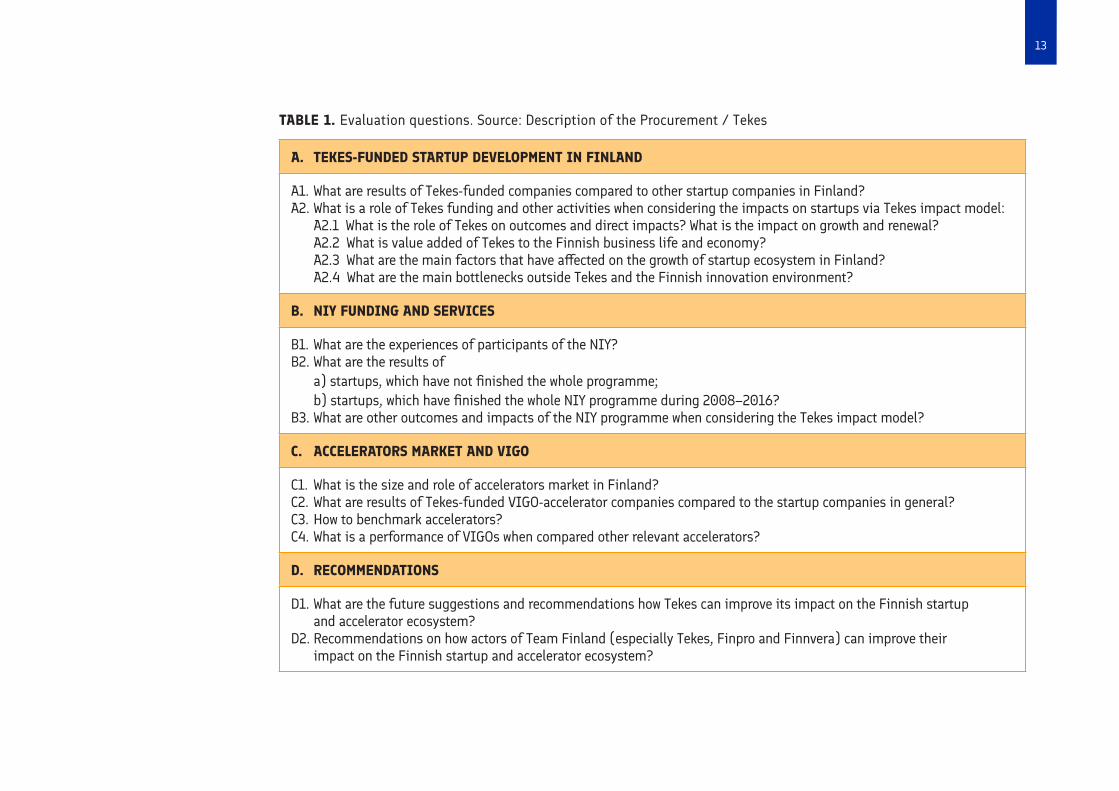
The evaluation questions, presented in the original Description of the Procurement, are listed in Table 1.
13
TABLE 1. Evaluation questions. Source: Description of the Procurement / Tekes
A. TEKES-FUNDED STARTUP DEVELOPMENT IN FINLAND
A1. What are results of Tekes-funded companies compared to other startup companies in Finland?A2. What is a role of Tekes funding and other activities when considering the impacts on startups via Tekes impact model: A2.1 What is the role of Tekes on outcomes and direct impacts? What is the impact on growth and renewal? A2.2 What is value added of Tekes to the Finnish business life and economy? A2.3 What are the main factors that have affected on the growth of startup ecosystem in Finland? A2.4 What are the main bottlenecks outside Tekes and the Finnish innovation environment?
B. NIY FUNDING AND SERVICES
B1. What are the experiences of participants of the NIY?B2. What are the results of a) startups, which have not finished the whole programme; b) startups, which have finished the whole NIY programme during 2008–2016?B3. What are other outcomes and impacts of the NIY programme when considering the Tekes impact model?
C. ACCELERATORS MARKET AND VIGO
C1. What is the size and role of accelerators market in Finland?C2. What are results of Tekes-funded VIGO-accelerator companies compared to the startup companies in general?C3. How to benchmark accelerators? C4. What is a performance of VIGOs when compared other relevant accelerators?
D. RECOMMENDATIONS
D1. What are the future suggestions and recommendations how Tekes can improve its impact on the Finnish startup and accelerator ecosystem?D2. Recommendations on how actors of Team Finland (especially Tekes, Finpro and Finnvera) can improve their impact on the Finnish startup and accelerator ecosystem?
14
APPROACH AND METHODOLOGYOur approach to the evaluation is based on a combina-tion of counter-factual approaches, intervention logic, and utilisation focussed evaluation. Counter-factual ap-proaches aim to isolate the effects of interventions, or treatment effects, and typically refer to methods that compare the outcomes of a ‘treated group’ (those who have benefitted from a policy or a programme) with a ‘comparison group’. In this case, counter-factual ap-proaches are adopted in econometric analyses. We also identify treatment effects using a specialised methodol-ogy implemented through surveys that isolates the im-pact (or treatment) of business support programmes on companies. Intervention logic refers to approaches where
the aim is to better understand what works, how and why. Surveys and case-studies have adopted this type of ap-proach. The third approach can be labelled utilisation fo-cused evaluation. It highlights the intended uses (utili-sation) of the evaluation and emphasises the usability of the evaluation information during the whole assignment. The evaluation is also highly forward-looking as it seeks to identify areas for improving the impact of Tekes (and Business Finland) activities in the future.
EVALUATION FRAMEWORK
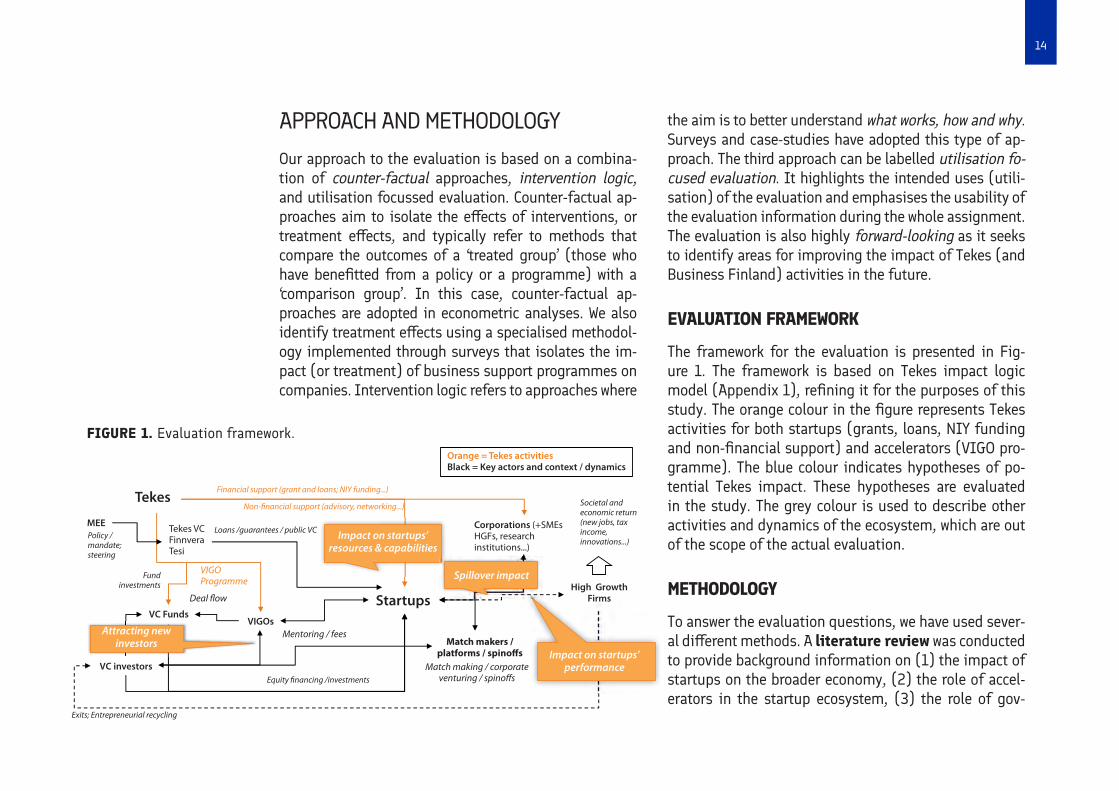
The framework for the evaluation is presented in Fig-ure 1. The framework is based on Tekes impact logic model (Appendix 1), refining it for the purposes of this study. The orange colour in the figure represents Tekes activities for both startups (grants, loans, NIY funding and non-financial support) and accelerators (VIGO pro-gramme). The blue colour indicates hypotheses of po-tential Tekes impact. These hypotheses are evaluated in the study. The grey colour is used to describe other activities and dynamics of the ecosystem, which are out of the scope of the actual evaluation.
METHODOLOGY
To answer the evaluation questions, we have used sever-al different methods. A literature review was conducted to provide background information on (1) the impact of startups on the broader economy, (2) the role of accel-erators in the startup ecosystem, (3) the role of gov-
Societal andeconomic return(new jobs, taxincome,innovations...)
VIGOProgramme
Financial support (grant and loans; NIY funding...)
Non-financial support (advisory, networking...)
Match making / corporateventuring / spinoffsEquity financing /investments
Exits; Entrepreneurial recycling
Mentoring / fees
Deal flow
Fundinvestments
Loans /guarantees / public VCTekes VCFinnveraTesi
Orange = Tekes activitiesBlack = Key actors and context / dynamics
Policy /mandate;steering
Match makers /platforms / spinoffs
Corporations (+SMEsHGFs, researchinstitutions...)
High GrowthFirms
MEE
VC Funds
VC investors
Attracting newinvestors
Impact on startups’performance
Impact on startups’resources & capabilities
Spillover impact
VIGOs
Startups
Tekes
FIGURE 1. Evaluation framework.
15
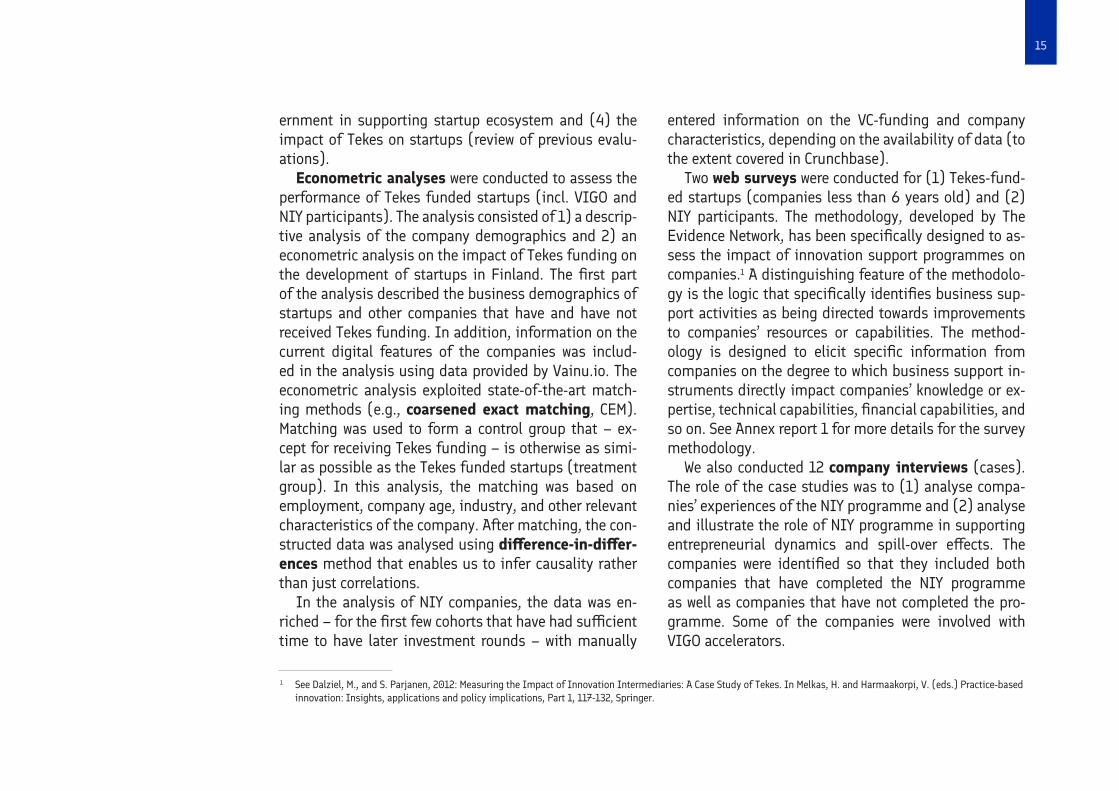
ernment in supporting startup ecosystem and (4) the impact of Tekes on startups (review of previous evalu-ations).
Econometric analyses were conducted to assess the performance of Tekes funded startups (incl. VIGO and NIY participants). The analysis consisted of 1) a descrip-tive analysis of the company demographics and 2) an econometric analysis on the impact of Tekes funding on the development of startups in Finland. The first part of the analysis described the business demographics of startups and other companies that have and have not received Tekes funding. In addition, information on the current digital features of the companies was includ-ed in the analysis using data provided by Vainu.io. The econometric analysis exploited state-of-the-art match-ing methods (e.g., coarsened exact matching, CEM). Matching was used to form a control group that – ex-cept for receiving Tekes funding – is otherwise as simi-lar as possible as the Tekes funded startups (treatment group). In this analysis, the matching was based on employment, company age, industry, and other relevant characteristics of the company. After matching, the con-structed data was analysed using difference-in-differ-ences method that enables us to infer causality rather than just correlations.
In the analysis of NIY companies, the data was en-riched – for the first few cohorts that have had sufficient time to have later investment rounds – with manually
entered information on the VC-funding and company characteristics, depending on the availability of data (to the extent covered in Crunchbase).
Two web surveys were conducted for (1) Tekes-fund-ed startups (companies less than 6 years old) and (2) NIY participants. The methodology, developed by The Evidence Network, has been specifically designed to as-sess the impact of innovation support programmes on companies.1 A distinguishing feature of the methodolo-gy is the logic that specifically identifies business sup-port activities as being directed towards improvements to companies’ resources or capabilities. The method-ology is designed to elicit specific information from companies on the degree to which business support in-struments directly impact companies’ knowledge or ex-pertise, technical capabilities, financial capabilities, and so on. See Annex report 1 for more details for the survey methodology.
We also conducted 12 company interviews (cases). The role of the case studies was to (1) analyse compa-nies’ experiences of the NIY programme and (2) analyse and illustrate the role of NIY programme in supporting entrepreneurial dynamics and spill-over effects. The companies were identified so that they included both companies that have completed the NIY programme as well as companies that have not completed the pro-gramme. Some of the companies were involved with VIGO accelerators.
1 See Dalziel, M., and S. Parjanen, 2012: Measuring the Impact of Innovation Intermediaries: A Case Study of Tekes. In Melkas, H. and Harmaakorpi, V. (eds.) Practice-based innovation: Insights, applications and policy implications, Part 1, 117-132, Springer.
16
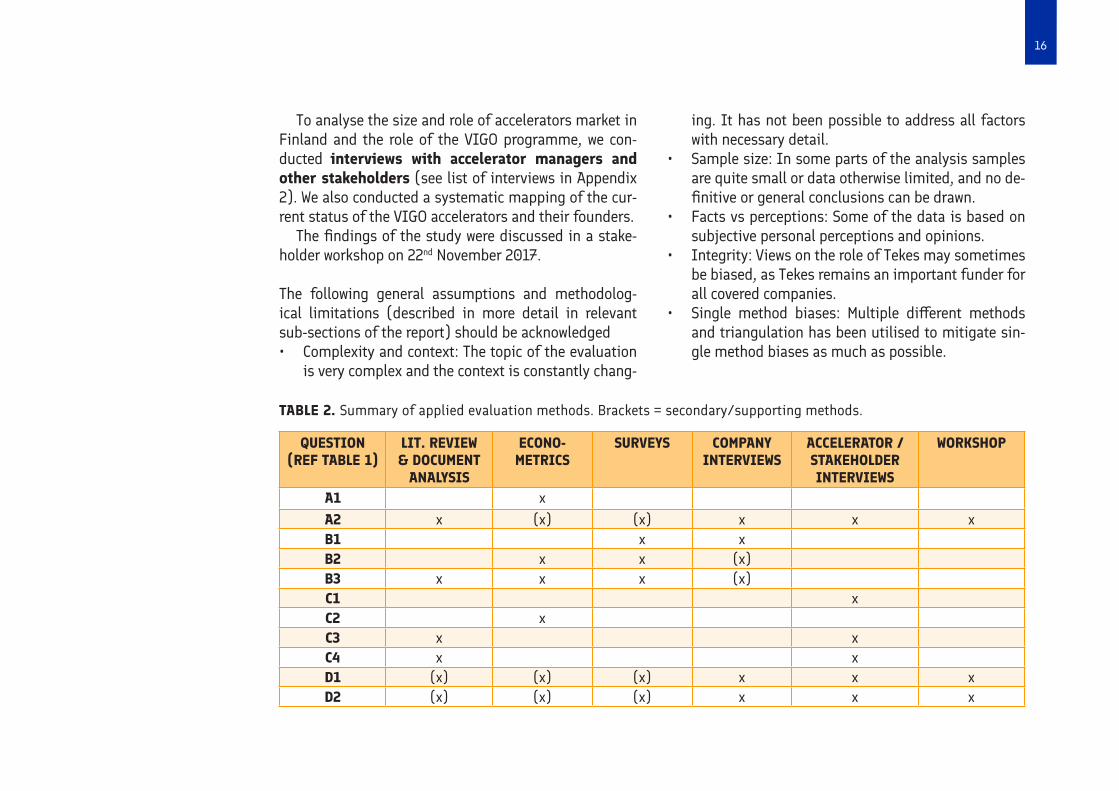
To analyse the size and role of accelerators market in Finland and the role of the VIGO programme, we con-ducted interviews with accelerator managers and other stakeholders (see list of interviews in Appendix 2). We also conducted a systematic mapping of the cur-rent status of the VIGO accelerators and their founders.
The findings of the study were discussed in a stake-holder workshop on 22nd November 2017.
The following general assumptions and methodolog-ical limitations (described in more detail in relevant sub-sections of the report) should be acknowledged• Complexity and context: The topic of the evaluation
is very complex and the context is constantly chang-
ing. It has not been possible to address all factors with necessary detail.
• Sample size: In some parts of the analysis samples are quite small or data otherwise limited, and no de-finitive or general conclusions can be drawn.
• Facts vs perceptions: Some of the data is based on subjective personal perceptions and opinions.
• Integrity: Views on the role of Tekes may sometimes be biased, as Tekes remains an important funder for all covered companies.
• Single method biases: Multiple different methods and triangulation has been utilised to mitigate sin-gle method biases as much as possible.
QUESTION (REF TABLE 1)
LIT. REVIEW & DOCUMENT
ANALYSIS
ECONO- METRICS
SURVEYS COMPANY INTERVIEWS
ACCELERATOR / STAKEHOLDER INTERVIEWS
WORKSHOP
A1 xA2 x (x) (x) x x xB1 x xB2 x x (x)B3 x x x (x)C1 xC2 xC3 x xC4 x xD1 (x) (x) (x) x x xD2 (x) (x) (x) x x x
TABLE 2. Summary of applied evaluation methods. Brackets = secondary/supporting methods.
17
This chapter describes the context of the evaluation. The first part discusses the general context by briefly describing the role of startups in the economy as well as the development of startup policies in general. The second part analyses the overall context of the Finnish startup ecosystem and its recent developments. The second part describes Tekes activities for startups and accelerators, and summarises the previous evaluations and analyses on Tekes activities.
STARTUPS AND THE EVOLUTION OF STARTUP POLICIES
This chapter presents the key concepts and themes of the evaluation and discusses them based on previous literature. Accelerators have been defined in later parts of the report.
WHAT IS A STARTUP?
Startups are generally defined as young (newly emerged) entrepreneurial ventures with ambitious growth plans and scalable business models built around innovative product(s), service(s) or platform(s). An often-cited definition is the one by Steve Blank, who defines a start-up as “a temporary organisation designed to search for a repeatable and scalable business model”.2 The ‘Blank definition’ is also the starting point of this evaluation study. However, for methodological purposes (e.g. it is impossible to define which companies have ambitious growth plans or scalable business models from statis-tics), we have adopted more practical definitions for some of the tasks in this evaluation. These have been further explained in relevant sections of the report.
2 FINNISH STARTUP ECOSYSTEM AND TEKES
2 Blank, S. (2010). What’s A Startup? First Principles. January 25, 2010. https://steveblank.com/2010/01/25/whats-a-startup-first-principles/
18
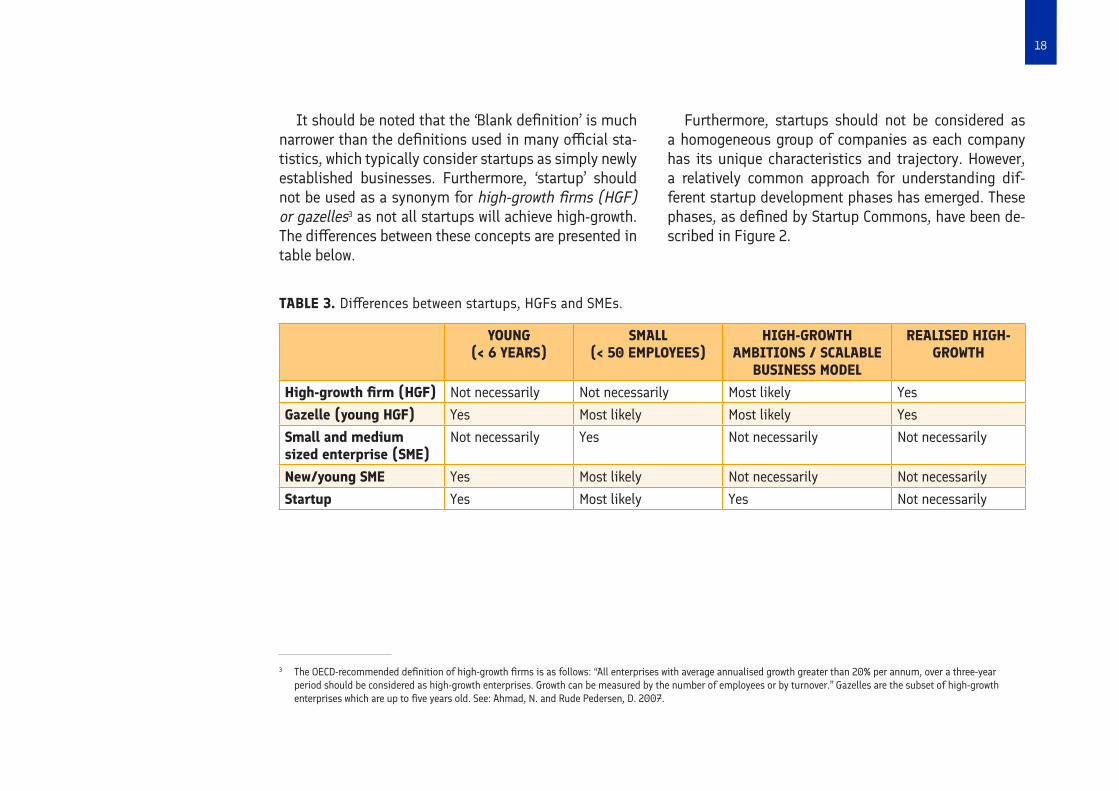
It should be noted that the ‘Blank definition’ is much narrower than the definitions used in many official sta-tistics, which typically consider startups as simply newly established businesses. Furthermore, ‘startup’ should not be used as a synonym for high-growth firms (HGF) or gazelles3 as not all startups will achieve high-growth. The differences between these concepts are presented in table below.
YOUNG (< 6 YEARS)
SMALL (< 50 EMPLOYEES)
HIGH-GROWTH AMBITIONS / SCALABLE
BUSINESS MODEL
REALISED HIGH-GROWTH
High-growth firm (HGF) Not necessarily Not necessarily Most likely YesGazelle (young HGF) Yes Most likely Most likely YesSmall and medium sized enterprise (SME)
Not necessarily Yes Not necessarily Not necessarily
New/young SME Yes Most likely Not necessarily Not necessarilyStartup Yes Most likely Yes Not necessarily
TABLE 3. Differences between startups, HGFs and SMEs.
Furthermore, startups should not be considered as a homogeneous group of companies as each company has its unique characteristics and trajectory. However, a relatively common approach for understanding dif-ferent startup development phases has emerged. These phases, as defined by Startup Commons, have been de-scribed in Figure 2.
3 The OECD-recommended definition of high-growth firms is as follows: “All enterprises with average annualised growth greater than 20% per annum, over a three-year period should be considered as high-growth enterprises. Growth can be measured by the number of employees or by turnover.” Gazelles are the subset of high-growth enterprises which are up to five years old. See: Ahmad, N. and Rude Pedersen, D. 2007.
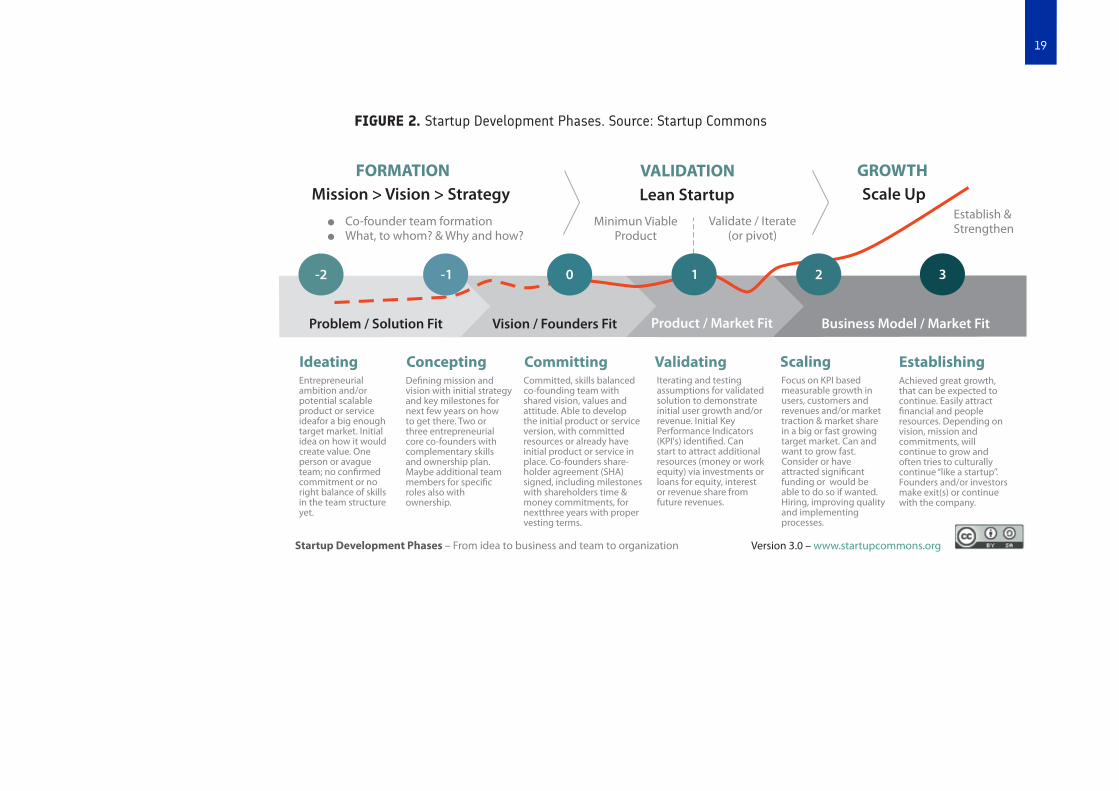
19
FIGURE 2. Startup Development Phases. Source: Startup Commons
Mission > Vision > Strategy
Product / Market Fit
l Co-founder team formationl What, to whom? & Why and how?
Lean Startup
Validate / Iterate (or pivot)
Scale UpEstablish &Strengthen
Problem / Solution Fit
-2 -1 0 1 2 3
Vision / Founders Fit Business Model / Market Fit
Minimun ViableProduct
Focus on KPI basedmeasurable growth inusers, customers and revenues and/or market traction & market sharein a big or fast growingtarget market. Can andwant to grow fast. Consider or have attracted significant funding or would be able to do so if wanted.Hiring, improving quality and implementingprocesses.
Version 3.0 – www.startupcommons.orgStartup Development Phases – From idea to business and team to organization
Achieved great growth, that can be expected to continue. Easily attractfinancial and people resources. Depending onvision, mission and commitments, will continue to grow andoften tries to culturally continue “like a startup”.Founders and/or investorsmake exit(s) or continue with the company.
Entrepreneurialambition and/orpotential scalableproduct or service ideafor a big enough target market. Initialidea on how it wouldcreate value. One person or avague team; no confirmed commitment or noright balance of skillsin the team structureyet.
IdeatingDefining mission and vision with initial strategyand key milestones fornext few years on howto get there. Two or three entrepreneurial core co-founders withcomplementary skills and ownership plan. Maybe additional teammembers for specific roles also withownership.
Concepting Committing Committed, skills balancedco-founding team withshared vision, values andattitude. Able to developthe initial product or serviceversion, with committed resources or already have initial product or service inplace. Co-founders share-holder agreement (SHA) signed, including milestoneswith shareholders time &money commitments, fornextthree years with proper vesting terms.
Validating Scaling EstablishingIterating and testing assumptions for validatedsolution to demonstrateinitial user growth and/orrevenue. Initial Key Performance Indicators(KPI's) identified. Canstart to attract additionalresources (money or workequity) via investments orloans for equity, interest or revenue share from future revenues.
FORMATION VALIDATION GROWTH

20
ECONOMIC AND SOCIETAL IMPACT OF HIGH-GROWTH FIRMS (HGFS)
High-growth firms are very rare. Depending on the defi-nition, their share of total companies varies from under one percent to maximum of 10 percent.4 Yet, it has been widely acknowledged that this small number of compa-nies have a disproportionately large economic and soci-etal impact.5 These firms are typically young companies or “gazelles”, and there is substantial evidence that es-pecially small and young companies are responsible for large share of job creation.6 Yet, for example Acs et al (2008) and Brown et al (2014) have pointed out that high-impact firms are not necessarily small and young, rather, some recent studies suggest they are in fact old-er and larger than traditionally believed.7
This difficulty here is that the literature typically fo-cuses on high-growth firms − not startups (as defined above), of which only very few will become successful (achieve high-growth). According to some estimates over 90% of startups will fail8, and even those who suc-ceed do not necessarily create new jobs.
Therefore, in order to understand the role of startups for the economy and society, we should look beyond the impact on jobs and growth, i.e. spill-over impacts. Start-ups not only impact the people and other organisations directly associated with them, they can also impact the emergence of new companies or decline of existing ones. By creating or exploiting new knowledge, products, ser-vices and business models, startups can also stimulate competition and efficiency in the markets and expand the total amount of knowledge in the ecosystem, thus strengthening the basis for new innovations, ideas, and other startups to emerge. Thus, the impact of startups can extend beyond their own existence: even if the com-panies fail, they may have created valuable impact for the economy and society.9 However, this does not always happen, but rather requires a well-functioning innova-tion-friendly, supportive ecosystem.
To sum up, startups do have a highly important role for the economy and society, but they should not be re-garded as silver-bullets to remedy slow growth or unem-ployment. In addition, the spill-over effects of startups only materialises when there is a well-functioning entre-
4 Pajarinen, M., & Rouvinen, P. (2009). Esitutkimus kasvuyrittäjyyden ja kasvuyrityspolitiikan kansantaloudellisesta merkityksestä. 5 See e.g. Birch, D. (1981). Who Creates Jobs? The Public Interest 65, 3-14; Acs, Z. J., Parsons, W., & Tracy, S. (2008). High-Impact Firms: Gazelles Revisited. In Handbook of
Research on Entrepreneurship and Regional Development: National and Regional Perspectives.; Pajarinen, M., & Rouvinen, P. (2009).6 See e.g. Birch (1981); Anyadike-danes, M., Bjuggren, C., Gottschalk, S., Hölzl, W., Johansson, D., Maliranta, M., & Myrann, A. (2014). Accounting for Job Growth:
Disentangling Size and Age Effects in an International Cohort Comparison.; Criscuolo, C., et al (2014), “The Dynamics of Employment Growth: New Evidence from 18 Countries”, OECD Science, Technology and Industry Policy Papers, No. 14, OECD Publishing
7 Acs et al (2008); Brown, R., Mason, C., & Mawson, S. (2014). Increasing “The Vital 6 Percent”: Designing Effective Public Policy to Support High Growth Firms. Nesta Working Paper 14/01.
8 See e.g. Patel, N. (2015). 90% Of Startups Fail: Here’s What You Need To Know About The 10%. Forbes, Jan 16, 2015. https://www.forbes.com/sites/neilpatel/2015/01/16/90-of-startups-will-fail-heres-what-you-need-to-know-about-the-10/#5616be786679
9 For an overview, see e.g. Pajarinen, M., & Rouvinen, P. (2009).
21
preneurial ecosystem in place. This has been well sum-marised by Krisztina Holly as follows:
“We don’t always have the patience to see entrepre-neurship through. Entrepreneurship drives economic growth, but it requires long-term patient investments in research, a culture that accepts failure, agile and skilled talent, and a resilient ecosystem that will en-able workers and ideas to flow easily from one firm to the next. As a place like Silicon Valley demonstrates, this can take decades to develop, and most policy-makers won’t wait that long for the results. A focus on jobs alone undervalues the benefits of entrepreneurship. New ventures are critical for innova-tion because they can challenge the status quo. They are a breeding ground for new ideas and new talent. They are a key component for competitiveness global-ly. And for many, they can provide a path to economic independence and therefore can serve as a driver for democracy globally. But governments and advocates who buy into the myth that startups are a quick fix for unemployment are likely to lose interest before their investments bear fruit.”10
POLICIES FOR SUPPORTING STARTUPS AND HGFS
In recent years various programmes for supporting (young) high-growth firms (HGFs) have been introduced in many countries.11 This development can be seen as part of a broader trend, which has witnessed a shift from a general small business support policies in the 1980s towards supporting technology and innovation in the 1990s and high-growth companies in the 2000s.12
It has been acknowledged that policies that support startups (and high-growth firms) should differ from general SME policies.13 According to Autio et al, good high-growth policies are “(1) highly selective; (2) em-phasise strong growth motivation as a key selection cri-terion; (3) control milestone achievement and condition progressively more substantial and hands-on support on the achievement of specific milestones; (4) promote the exchange of experiential insights on how to effect rap-id organisational growth; and (5) rely on public–private partnerships for hands-on, capacity-boosting support”.14
According to Brown et al (2014), current policies em-phasise increasing R&D within firms, despite the fact
10 Holly, K. (2013). https://www.forbes.com/sites/krisztinaholly/2013/09/20/seven-reasons-why-startups-wont-save-the-economy/#3d6ab2c15ec0 11 For a more detailed review see e.g. OECD. (2013). An International Benchmarking Analysis of Public Programmes for High-Growth Firms. OECD. 12 Autio, E., et al (2014). Analyses on the Finnish High-Growth Entrepreneurship Ecosystem. Aalto University13 See. e.g. Autio, E., et al (2014). Analyses on the Finnish High-Growth Entrepreneurship Ecosystem. Aalto University.; Brown, R., Mason, C., & Mawson, S. (2014); Autio, E., &
Rannikko, H. (2016). Retaining Winners: Can Policy Boost High-Growth Entrepreneurship? Research Policy, 45(1), 42-55.14 Autio, E., & Rannikko, H. (2016).
22
that many HGFs use a variety of open innovation sources. Policies also often emphasise equity financing despite many HGFs prefer to retain full ownership in their com-pany. There is also a strong focus in policies supporting exports and organic growth, despite the fact that many HGFs grow and internationalise through a variety of ap-proaches (e.g. joint ventures, overseas FDI, acquisitions, partnering). Importantly, HGF policies also often focus on new startups although majority of HGFs emerge from already existing SMEs. Thus, programmes supporting HGFs (or SMEs) in general might not always be appropri-ate to supporting startups (and vice versa). The authors also underline the importance of timing of interventions and highlight the need of time-sensitiveness and flexibil-ity (instead of prescribed schedule). They also encourage policy-makers not to design support only for high-tech firms and highlight that the provision of ‘entrepreneurial finance’ (venture capital) may not work for all high-growth firms, and multiple sources of finance are needed.15
Another important element of good HGF support pol-icies is the focus on relational support and peer-based learning. According to an OECD review of HGF support programmes, the best programmes tend to focus on knowledge transfer and skill development rather than direct funding or financial incentives.16
”Policy towards high growth entrepreneurship would benefit from a stronger focus on ‘relational’ rath-er than ‘transactional’ support. Often high potential firms are not interested in obtaining new forms of money, per se, such as grants and subsidies, etc. Of greater importance is the desire for more in-depth relational support. As noted previously, research on HGFs has shown that many of these firms prefer to obtain advice from their peers, rather than policy-makers, consultants, venture capitalists, or business angels (Fischer and Reuber, 2003). In the light of this evidence, more peer-based interventions are like-ly to be of significant benefit to growth businesses.”17 (Brown et al 2014)
As for the impact of public R&D funding, despite var-ied findings, there is a relatively positive stance towards supporting innovation among researchers, and literature provides a strong rationale for public R&D subsidies.18 However, there is much less research and evidence on spill-overs, which is one main argument for public R&D support.19
Regarding public VC funding, Lerner has highlight-ed that as the governments cannot ‘govern’ the devel-opment of venture markets ‘top-down’, governments
15 Brown, R., Mason, C., & Mawson, S. (2014)16 OECD (2013)17 Brown, R., Mason, C., & Mawson, S. (2014).18 Ylhäinen, I., Rouvinen, P. & Kuusi, T. (2016). Katsaus yksityisen t&k-toiminnan ja sen julkisen rahoituksen vaikuttavuuteen. Valtioneuvoston selvitys- ja tutkimus-
toiminnan julkaisusarja 57/2016; Koski, H., & Pajarinen, M. (2013). The role of business subsidies in job creation of startups, gazelles and incumbents. Small Business Economics, 41(1), 195-214.
19 Ylhäinen et al (2016).
23
should carefully align and weigh their actions in the broader context and let the private sector provide the direction for the actions. Lerner underlines that building an entrepreneur-friendly environment should always be the first step for government policies, and that the im-pact of the actions always take a lot of time.20
STARTUP ECOSYSTEMS AND THE ROLE OF THE GOVERNMENT
There are various definitions and approaches for startup (or entrepreneurial) ecosystems. Mason & Brown define entrepreneurial ecosystems as
“a set of interconnected entrepreneurial actors (both potential and existing), entrepreneurial organisa-tions (e.g. firms, venture capitalists, business an-gels, banks), institutions (universities, public sector agencies, financial bodies) and entrepreneurial pro-cesses (e.g. the business birth rate, numbers of high growth firms, levels of ‘blockbuster entrepreneurship’, number of serial entrepreneurs, degree of sell-out mentality within firms and levels of entrepreneurial ambition) which formally and informally coalesce to connect, mediate and govern the performance within the local entrepreneurial environment.”21
Another approach − in line with the previous one al-though with some specific characteristics − is provided by The Global Entrepreneurship Development Index, building on the definitions by Acs et al (2017). It high-lights that “an ecosystem, as opposed to a system has both living and non-living components” and highlights the role entrepreneurial dynamics (individual actions of entrepreneurs) in the context of specific institutional conditions. They define entrepreneurial ecosystems at the socio-economic level having properties of self-or-ganisation, scalability and sustainability as “...dynamic institutionally embedded interaction between entrepre-neurial attitudes, abilities and aspirations, by individu-als, which drives the allocation of resources through the creation and operation of new ventures.”22
An important characteristic of startup ecosystems is their lifecycle. In their latest Global Startup Ecosystem Ranking (2017), Startup Compass uses the following four stages to describe the lifecycle of a startup ecosystem:• Activation phase: the ecosystem consists of a lim-
ited number of startups, limited local experience and generalised resource gaps that cause resource leakages.
• Globalisation phase: The number of startups in the ecosystem is growing by attracting resources and startups from nearby regions, but important re-
20 Lerner, J. (2009). Boulevard of Broken Dreams: Why Public Efforts to Boost Entrepreneurship and Venture Capital Have Failed - and What to Do About It. Princetown University Press, New Jersey.
21 Mason, C., & Brown, R. (2014). Entrepreneurial Ecosystems and Growth Oriented Entrepreneurship. Background paper prepared for the workshop organised by the OECD LEED Programme and the Dutch Ministry of Economic Affairs on Entrepreneurial Ecosystems and Growth Oriented Entrepreneurship. OECD.
22 Acs, Z., Szerb, L., Autio, E. & Lloyd, A. (2017). Global Entrepreneurship Index. The Global Entrepreneurship Development Institute.
24
source gaps still exist. At the same time, large exits have placed the ecosystem as one of the best places to build a startup on the state, province, or national level.
• Expansion phase: At this stage, several multi-mil-lion dollar exits and unicorns have elevated the ecosystem to a globally significant level and it has started to attract resources from all over the world. Overall, resources are more abundant but there are still some resource gaps in funding and global con-nectedness.
• Integration phase: When the ecosystem reaches this stage, it hosts several thousands of startups, its resources are balanced and it is can compete against other top ecosystems around the world.23
It is also important to understand the role of government in supporting startup ecosystems. In his book on Start-up Communities, Brad Feld highlighted the importance of entrepreneurs as the leaders of the startup ecosys-tem, and that the role of government is to support rather than lead the development of the ecosystem24. In other words, the public sector should ensure that the business environment is optimal for the ecosystem to thrive in, rather than trying to interfere directly and sometimes excessively, with the ecosystem too much directly.
Along the same lines, Isenberg (2010) has formu-lated a set of principles on which governments should focus on when trying to build and support a local start-up ecosystem. Isenberg highlights that the role of the government is to help ecosystems grow organically (not over-engineering them). Furthermore, Isenberg high-lights the need to shape the ecosystem around the lo-cal conditions (instead of emulating Silicon Valley, for example), engaging the private sector from the start, focusing on the most ambitious and high potential startups/entrepreneurs, and avoiding “flooding” the ecosystem with easy money (exposing startups to cer-tain level of resource scarcity).25
EVOLUTION OF THE FINNISH STARTUP ECOSYSTEM
This section describes briefly the development of the Finnish startup ecosystem, based on available interna-tional rankings and expert interviews conducted as part of this project. The role of this study is not to provide a comprehensive analysis and statistics of the Finnish ecosystem, rather describe the main broader factors for better understanding the role of Tekes in the ecosystem.
23 Startup Genome (2017). The Global Startup Ecosystem Ranking 2017. Compass.co. 24 Feld, B. (2012) Startup Communities: building an entrepreneurial ecosystem in your city, Hoboken: NJ, Wiley.25 Isenberg, D. J. (2010). The big idea: How to start an entrepreneurial revolution. Harvard Business Review, 88(6).
25
AMONG THE TOP RUNNER-UPS
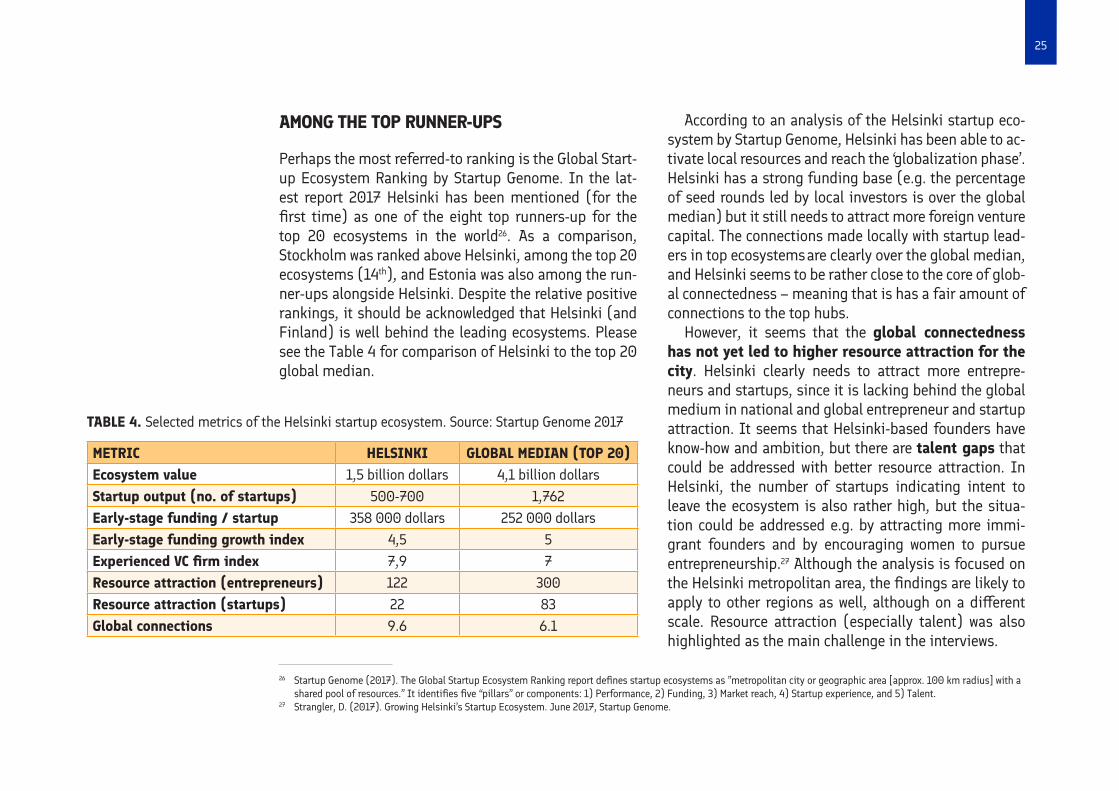
Perhaps the most referred-to ranking is the Global Start-up Ecosystem Ranking by Startup Genome. In the lat-est report 2017 Helsinki has been mentioned (for the first time) as one of the eight top runners-up for the top 20 ecosystems in the world26. As a comparison, Stockholm was ranked above Helsinki, among the top 20 ecosystems (14th), and Estonia was also among the run-ner-ups alongside Helsinki. Despite the relative positive rankings, it should be acknowledged that Helsinki (and Finland) is well behind the leading ecosystems. Please see the Table 4 for comparison of Helsinki to the top 20 global median.
According to an analysis of the Helsinki startup eco-system by Startup Genome, Helsinki has been able to ac-tivate local resources and reach the ‘globalization phase’. Helsinki has a strong funding base (e.g. the percentage of seed rounds led by local investors is over the global median) but it still needs to attract more foreign venture capital. The connections made locally with startup lead-ers in top ecosystems are clearly over the global median, and Helsinki seems to be rather close to the core of glob-al connectedness – meaning that is has a fair amount of connections to the top hubs.
However, it seems that the global connectedness has not yet led to higher resource attraction for the city. Helsinki clearly needs to attract more entrepre-neurs and startups, since it is lacking behind the global medium in national and global entrepreneur and startup attraction. It seems that Helsinki-based founders have know-how and ambition, but there are talent gaps that could be addressed with better resource attraction. In Helsinki, the number of startups indicating intent to leave the ecosystem is also rather high, but the situa-tion could be addressed e.g. by attracting more immi-grant founders and by encouraging women to pursue entrepreneurship.27 Although the analysis is focused on the Helsinki metropolitan area, the findings are likely to apply to other regions as well, although on a different scale. Resource attraction (especially talent) was also highlighted as the main challenge in the interviews.
METRIC HELSINKI GLOBAL MEDIAN (TOP 20)Ecosystem value 1,5 billion dollars 4,1 billion dollarsStartup output (no. of startups) 500-700 1,762Early-stage funding / startup 358 000 dollars 252 000 dollarsEarly-stage funding growth index 4,5 5Experienced VC firm index 7,9 7Resource attraction (entrepreneurs) 122 300Resource attraction (startups) 22 83Global connections 9.6 6.1
TABLE 4. Selected metrics of the Helsinki startup ecosystem. Source: Startup Genome 2017
26 Startup Genome (2017). The Global Startup Ecosystem Ranking report defines startup ecosystems as ”metropolitan city or geographic area [approx. 100 km radius] with a shared pool of resources.” It identifies five “pillars” or components: 1) Performance, 2) Funding, 3) Market reach, 4) Startup experience, and 5) Talent.
27 Strangler, D. (2017). Growing Helsinki’s Startup Ecosystem. June 2017, Startup Genome.
26
ENTREPRENEURSHIP BECOMING MORE POPULAR, SERIAL ENTREPRENEURSHIP INCREASING
Interviewees highlighted the increased popularity of en-trepreneurship as a career option as one of the most pos-itive trends in the Finnish startup ecosystem. Although
PILLARS INSTITUTIONAL VARIABLES
INDIVIDUAL VARIABLES
Opportunity perception 0.91 Market agglomeration 0.98 Opportunity recognition 0.69Starup skills 0.94 Tertiary education 1.00 Skill perception 0.42Risk acceptance 0.75 Business risk 1.00 Risk perception 0.52Networking 0.99 Internet usage 0.94 Know entrepreneur 0.69Cultural support 0.90 Corruption 1.00 Career status 0.46Entrepreneurial attitudes 78.27Opportunity startup 1.00 Economic freedom 1.00 Opportunity motivation 0.83Technology absorption 0.60 Tech absorption 0.87 Technology level 0.71Human capital 0.46 Staff training 0.64 Educational level 0.58Competition 0.38 Market dominance 0.68 Competitors 0.36Entrepreneurial abilities 56.31Product innovation 0.79 Technology transfer 1.00 New product 0.61Process innovation 0.87 GERD 1.00 New tech 0.42High growth 0.65 Business strategy 0.95 Gazelle 0.58Internationalisation 0.68 Globalization 0.95 Export 0.71Risk capital Depth of capital
market0.81 Informal investment 0.69
Entrepreneurial aspirations
66.16
GEI 66.91 Institutional 0.92 Individual 0.59
28 The percentage of the 18-64 aged population claiming to possess the required knowledge/skills to start business
29 The status and respect of entrepreneurs calculated as the average of Career and Status. (Career = The percentage of the 18-64 aged population saying that people consider starting business as good career choice; Status = The percentage of the 18-64 aged population thinking that people attach high status to successful entrepreneurs).
30 Percentage of the TEA businesses started in those markets where not many businesses offer the same product.
31 Percentage of the TEA businesses using new technology that is less than 5 years old average
32 GEDI. https://thegedi.org/ Global Entrepreneurship Index (GEI), developed by The Global Entrepreneurship and Development Institute (The GEDI Institute), is tool for measuring the quality and dynamics of entrepreneurship ecosystem at a national and regional level. It consists of 14 different pillars, each consisting of both individual and institutional factors. In the most recent GEI ranking (2017) Finland is ranked 11th best entrepreneurial ecosystem, behind the likes of Sweden, Denmark, Iceland, Ireland and Netherlands, but above the likes of Germany.
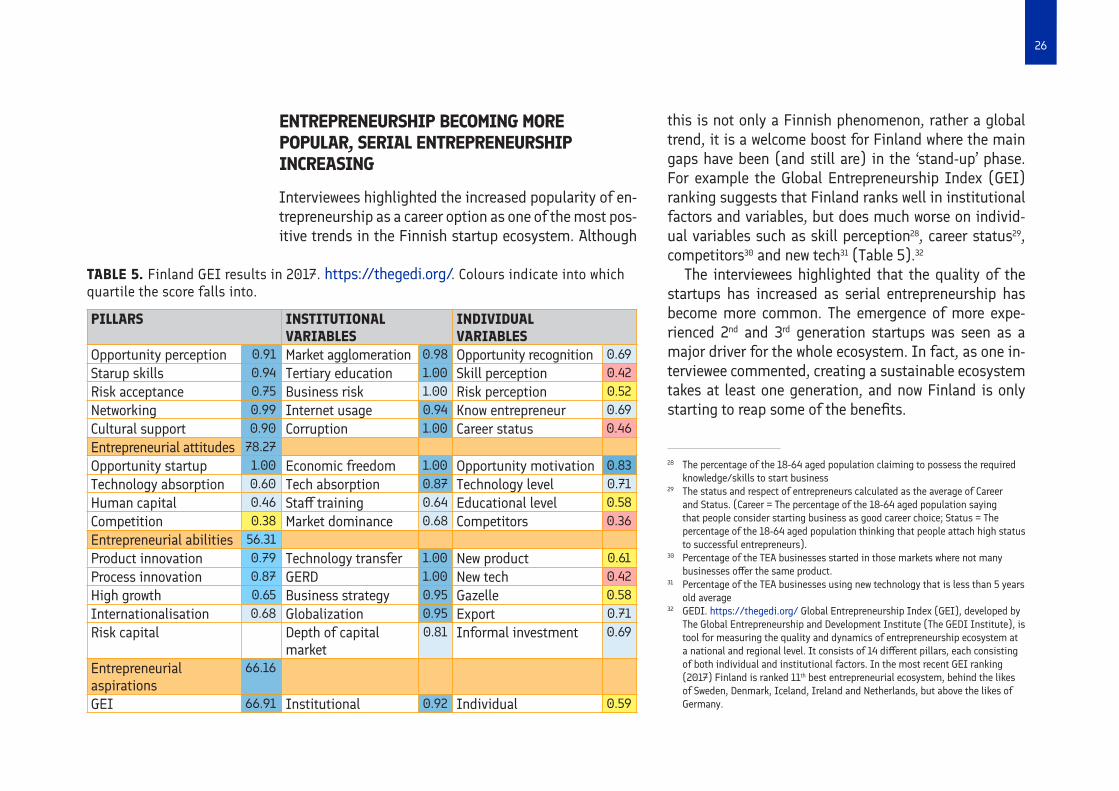
this is not only a Finnish phenomenon, rather a global trend, it is a welcome boost for Finland where the main gaps have been (and still are) in the ‘stand-up’ phase. For example the Global Entrepreneurship Index (GEI) ranking suggests that Finland ranks well in institutional factors and variables, but does much worse on individ-ual variables such as skill perception28, career status29, competitors30 and new tech31 (Table 5).32
The interviewees highlighted that the quality of the startups has increased as serial entrepreneurship has become more common. The emergence of more expe-rienced 2nd and 3rd generation startups was seen as a major driver for the whole ecosystem. In fact, as one in-terviewee commented, creating a sustainable ecosystem takes at least one generation, and now Finland is only starting to reap some of the benefits.
TABLE 5. Finland GEI results in 2017. https://thegedi.org/. Colours indicate into which quartile the score falls into.
27
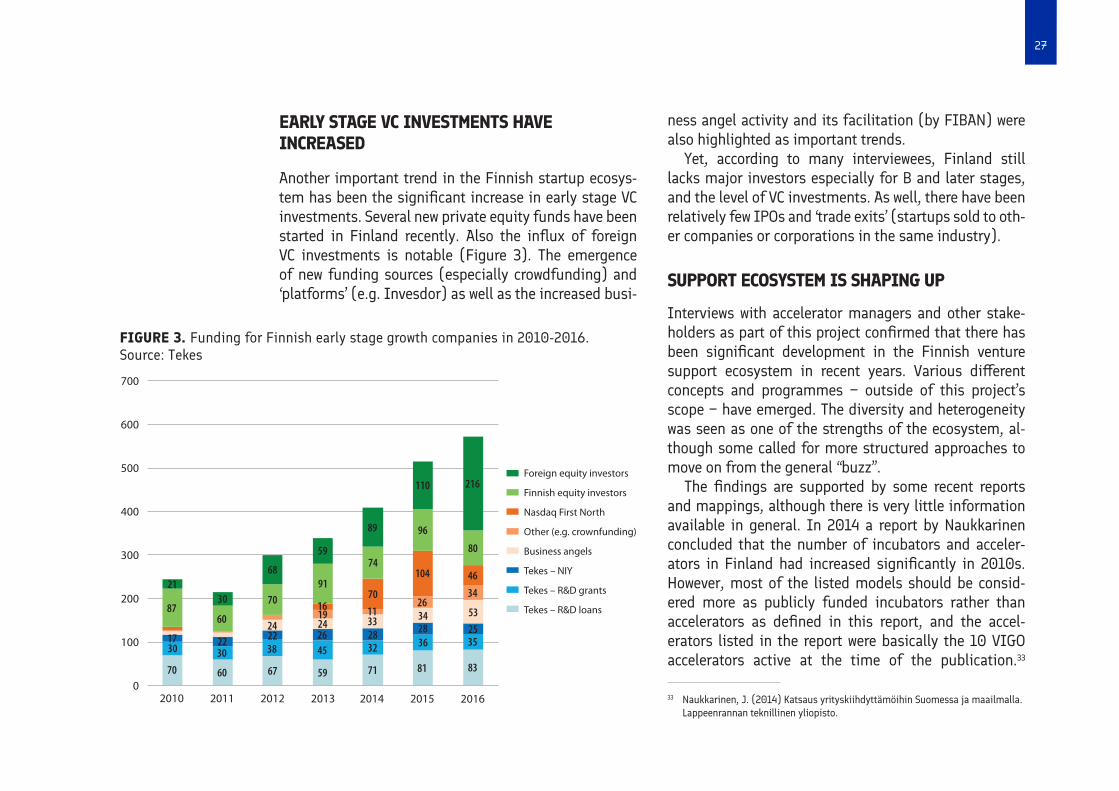
EARLY STAGE VC INVESTMENTS HAVE INCREASED
Another important trend in the Finnish startup ecosys-tem has been the significant increase in early stage VC investments. Several new private equity funds have been started in Finland recently. Also the influx of foreign VC investments is notable (Figure 3). The emergence of new funding sources (especially crowdfunding) and ‘platforms’ (e.g. Invesdor) as well as the increased busi-
ness angel activity and its facilitation (by FIBAN) were also highlighted as important trends.
Yet, according to many interviewees, Finland still lacks major investors especially for B and later stages, and the level of VC investments. As well, there have been relatively few IPOs and ‘trade exits’ (startups sold to oth-er companies or corporations in the same industry).
SUPPORT ECOSYSTEM IS SHAPING UP
Interviews with accelerator managers and other stake-holders as part of this project confirmed that there has been significant development in the Finnish venture support ecosystem in recent years. Various different concepts and programmes − outside of this project’s scope − have emerged. The diversity and heterogeneity was seen as one of the strengths of the ecosystem, al-though some called for more structured approaches to move on from the general “buzz”.
The findings are supported by some recent reports and mappings, although there is very little information available in general. In 2014 a report by Naukkarinen concluded that the number of incubators and acceler-ators in Finland had increased significantly in 2010s. However, most of the listed models should be consid-ered more as publicly funded incubators rather than accelerators as defined in this report, and the accel-erators listed in the report were basically the 10 VIGO accelerators active at the time of the publication.33
Foreign equity investors
Finnish equity investors
Nasdaq First North
Other (e.g. crownfunding)
Business angels
Tekes – NIY
Tekes – R&D grants
Tekes – R&D loans
700
600
500
400
300
200
100
02010
21
22 22 2624 24 25
3536
46
32
33 34
34
53
83817170 60 67
87
17
60
70
28 28
2630
30 30 38 45
59
19
9170
11
74104
59
89
80
216
68
96
110
16
2011 2012 2013 2014 2015 2016
FIGURE 3. Funding for Finnish early stage growth companies in 2010-2016. Source: Tekes
33 Naukkarinen, J. (2014) Katsaus yrityskiihdyttämöihin Suomessa ja maailmalla. Lappeenrannan teknillinen yliopisto.
28
In 2016 an updated mapping of Finnish startup sup-port services was provided as part of broader report on Finnish startup companies. The mapping identified 116 different startup support programmes or services, most of them established after 2010. Of the 116 programmes, 27 were categorised as startup hubs or communities, 26 as pre-accelerator or entrepreneurship programmes, 17 as co-working spaces, and 20 as “venture accelerators”. The latter group included VIGO accelerators as well as early stage VC funds such as Butterfly Ventures, First Round and Courage Ventures.34
Some of the programmes have been set up by cities and regional actors (e.g. NewCo, Levelup Startup Acceler-ator, Life Science Accelerator) and some, importantly, by active entrepreneurs and students, for example by entre-preneur societies at universities (e.g. Aalto ES or Boost Turku). The Startup Foundation (Startup säätiö), set up in 2012, has especially become a key player introducing internationally recognised programmes and concepts such as SLUSH, Junction hackathon event, Rising North grants programme, Startup Sauna accelerator, Wave Ventures VC fund, Maria 01 startup community, and The Shortcut programme promoting diverse employment in startups.35
CORPORATIONS HAVE BECOME ACTIVE PLAYERS
Finally, an important trend in the ecosystem has been the increased activity of large corporations in the startup ecosystem. This should be seen in the context of a global trend, for example, the Startup Weekend concept spon-sored by Google and operated by Techstars.36 It should not be seen as a new innovation, as corporate ventur-ing concepts such as Nokia Ventures have also existed in Finland. However, according to the interviews, these approaches have become more popular and increasingly more Finnish corporations have started to become more active and setting up their own concepts (e.g. OP Labs) or using external service providers (e.g. Nestholma, Ver-tical and Avanto Ventures provide such services) to fa-cilitate corporate venturing. In addition, these models are seen to expand the traditional corporate venturing from pure investing (as a VC in startups) towards a more holistic approach with a more active role in scouting, nurturing and growing startups co-developing solutions benefitting the corporations.
The more active role of corporations in the startup ecosystem was seen as a very important trend for the whole Finnish economy as it will help to facilitate the re-newal of more established businesses and industries by introducing lean startup approaches. However, whether this increased interest will last is likely to depend on the experiences and success stories of the programmes in Finland and globally.
34 Lahtinen, H. et al. (2016). Startup-yritysten kasvun ajurit ja pullonkaulat. Valtioneuvoston selvitys- ja tutkimustoiminnan julkaisusarja 30/2016, Valtioneuvoston kanslia.
35 Startup Foundation webpage. http://www.startup-saatio.fi/36 https://www.googleforentrepreneurs.com/startup-communities/startup-
weekend/
29
TEKES ACTIVITIES IN THE STARTUP ECOSYSTEM
This section describes briefly Tekes activities in the Finnish startup ecosystem. First, we describe the gener-al funding and services for startups. Second, we provide a more detailed overview of the Young Innovative Com-panies (NIY) programme and the VIGO programme.
FUNDING AND OTHER SERVICES FOR STARTUPS
Tekes has three main funding instruments for startups: Tempo funding (grants) for testing business concepts and investigating product-market fit, R&D funding (loans) for product and service development, and fund-ing for business development in young innovative com-panies prorgamme (NIY). It should also be noted that substantial part of the funding for larger corporations will eventually also “trickle” down to startups through subcontracting and service purchases.
Tempo funding (previously known as Kansainvälisen Kasvun Suunnittelu, KKS) is intended for startups that have been operating for under 5 years, are registered in Finland and have sufficient assets for project comple-tion (generally €30 thousand of their own funds). The idea with Tempo funding is that companies can test the functionality of the business concept, get feedback from
potential customers, explore demand in international markets and implement demos or prototypes. As part of the application process, each company and Tekes agree on 2–5 measurable goals for the funding (e.g. realisa-tion of customer pilots, turnover growth, development of internationalisation processes, strengthening the part-ner network, strengthening the team, etc.). Success in achieving the goals is an important factor for funding the next stage of developmet (e.g. with R&D loans). The maximum amount of funding is €50 thousand covering 75% of the overall project budget. Tempo funding is De Minimis grant and eligible costs include salaries, indi-rect personnel costs, purchased services and other costs (max 20% of the sum of salary and purchased service costs).37
Startup R&D funding, i.e. funding for research, de-velopment and piloting, is intended for startups that have already tested the functionality of their product or service and aim to expand to the export markets. The funding is in the form of loan and needs to be paid back to Tekes – although, if the project fails or its results cannot be exploited, the loan may be partially converted into a grant. The interest rate is 1% and, in most cases, no collateral is required. The loan covers either 50% or 70% of the total project costs. A typical loan period is seven or ten years.
Young Innovative Companies (NIY)38 funding is in-tended for the most promising and ambitious startups.
37 https://www.tekes.fi/en/funding/startup/tempo/38 This section is based on: https://www.tekes.fi/en/funding/startup/young-innovative-companies/
30
The funding can be used for the comprehensive devel-opment of business activities such as strengthening a team, developing a business model and growth strategy or opening new markets (not only specific R&D projects).
NIY is a three-phase combination instrument. The funding for the first phase (typically 6–12 months) is a €250 thousand grant. Tekes sets goals for the compa-ny in its funding decision, which, if realised, enable the company to move on to the next phase of funding. Goals are typically related to the turnover development, abil-ity to get external funding, and/or expanding into new markets. The maximum amount of funding amounts to €1.25 million, of which a maximum of €500 thousand may be funded as a grant, and €700 thousand as a loan. The funding covers 75% of eligible costs, which specif-ically do not include R&D activities or product/service development, in at least three phases.
The preconditions for the NIY funding are:• The company is less than five years old. The young
innovative company funding must be granted before five years has passed since the company was regis-tered. The funding will end, at the latest, when the company has been registered for eight years. Tekes has to make the funding decision before the compa-ny reaches five years of age.
• The company is small. The company must be clas-sified as small, and registered in Finland. The num-ber of personnel in a small company is less than 50 and, either its maximum annual turnover is €10 mil-lion, or its maximum final balance is €10 million.
• The company makes strong efforts in innovation activities. The company must substantially focus its resources on research and development activ-ities. At the application phase, the company must provide a confirmation from an auditor that it has invested at least 10% of all its business costs in re-search and development, during at least one of the previous three years.
• The company is independent. The company must be independent and administer its own IP rights.
• The company should not have distributed profits and not been formed through a merger.
In order to be successful in their application, the com-pany should also have proof of a scalable business mod-el and the opportunity for fast growth in international markets; evidence of promising business activities and customer references; a clear plan to grow in internation-al markets, and the capacity to implement the plan; a competitive edge with which it is possible to attain an important market position; a committed and competent management team; and the ability to attract venture capital.
During the first funding phase companies need to present (“pitch”) their ideas to an evaluation panel com-posed of 3–5 experts (capital investors, business angels or board professionals). The panel assesses the busi-ness potential and development needs of the company, and provides Tekes an advisory statement on the com-pany’s suitability for NIY funding.
31
In addition to funding, Tekes (in collaboration with other Team Finland actors) provides the following non- financial services which are available also for most startups:• Innovation voucher (€5,000 + VAT) for purchasing
new knowledge and skills in order to develop new in-novations
• Team Finland Explorer for purchasing expert ser-vices to support company’s international growth (€5,000–10,000, covering max. 50% of total costs)
• Into funding for developing innovation competenc-es (e.g. external expertise, advisor services, IPR pro-tection)
• Foreign accelerator programmes. Tekes can cover a part of the participation costs of international ac-celerator programmes.
• Market access programmes, which provide a tai-lor-made market entry plan (US, China, Southeast Asia) prepared by MBA students in world’s top uni-versities.
• Market Opportunities, offering free market-specific information on sales leads, business opportunities, operational environment etc.
• Networking, events and information through Tekes programmes and other initiatives on specific the-matic areas. The programmes are mainly targeted for Finnish SMEs, large businesses, and research or-ganisations.
FUNDING VOLUME FOR STARTUPS
In 2016, the total Tekes funding for companies less than six-year old accounted for €142 million, of which €25 million was through the NIY programme. Tekes received approximately 1,300 applications from startups (com-panies less than 6 years old), and funded 1,000 projects (825 different companies). The number of applications was 22% higher than in 2015. At the initial stage, Tekes accepts approximately 70% of the applications.
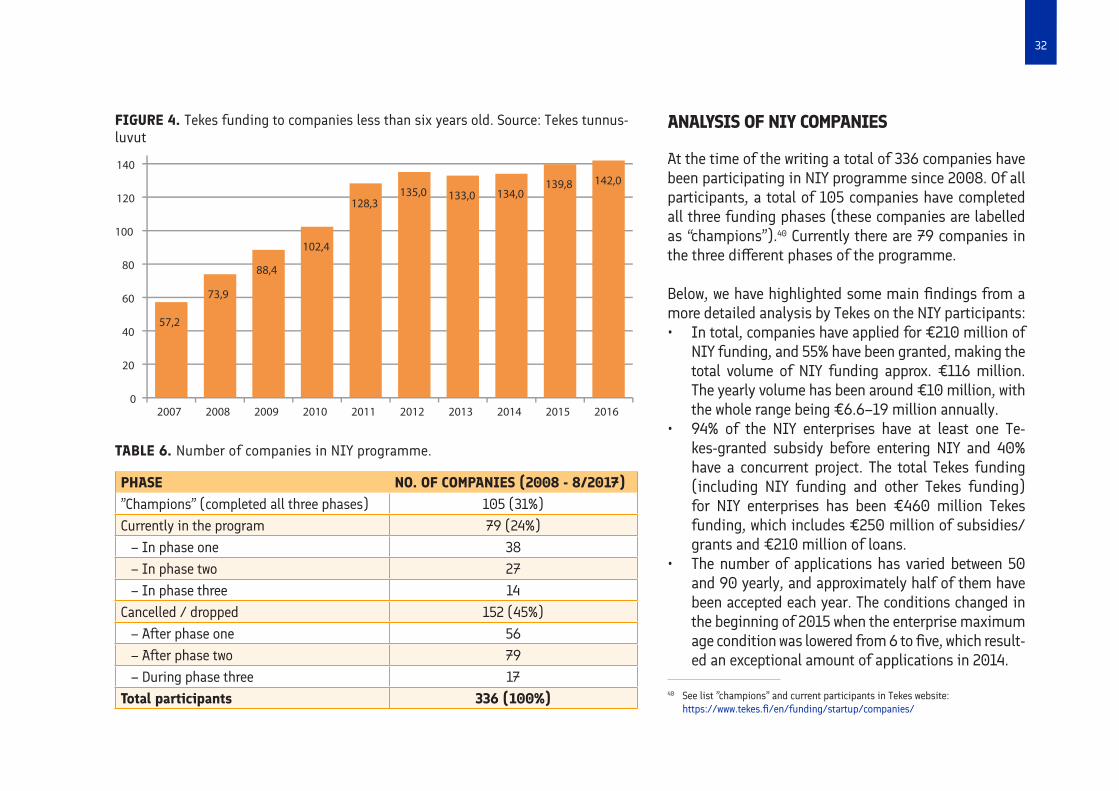
Funding for startups account approximately 24% of Tekes total funding budget. Approximately 50% of the total startup funding goes to companies that are less than 3 years old. The average size of a startup compa-ny funded by Tekes employs 6 persons. In recent years, Tekes has increased its funding to startups (compa-nies less than 6 years old). In 2007 the total funding was only €57.2 million (compared to €142 million in 2016).39 Recently, the role of Tekes activities for start-ups has further been emphasised as cuts to Tekes’ bud-get have been limited to funding for larger companies and research organisations.
39 Tekes-tunnusluvut, www.tekes.fi; https://www.tekes.fi/en/funding/startup/startup-facts-and-figures/
32
ANALYSIS OF NIY COMPANIES
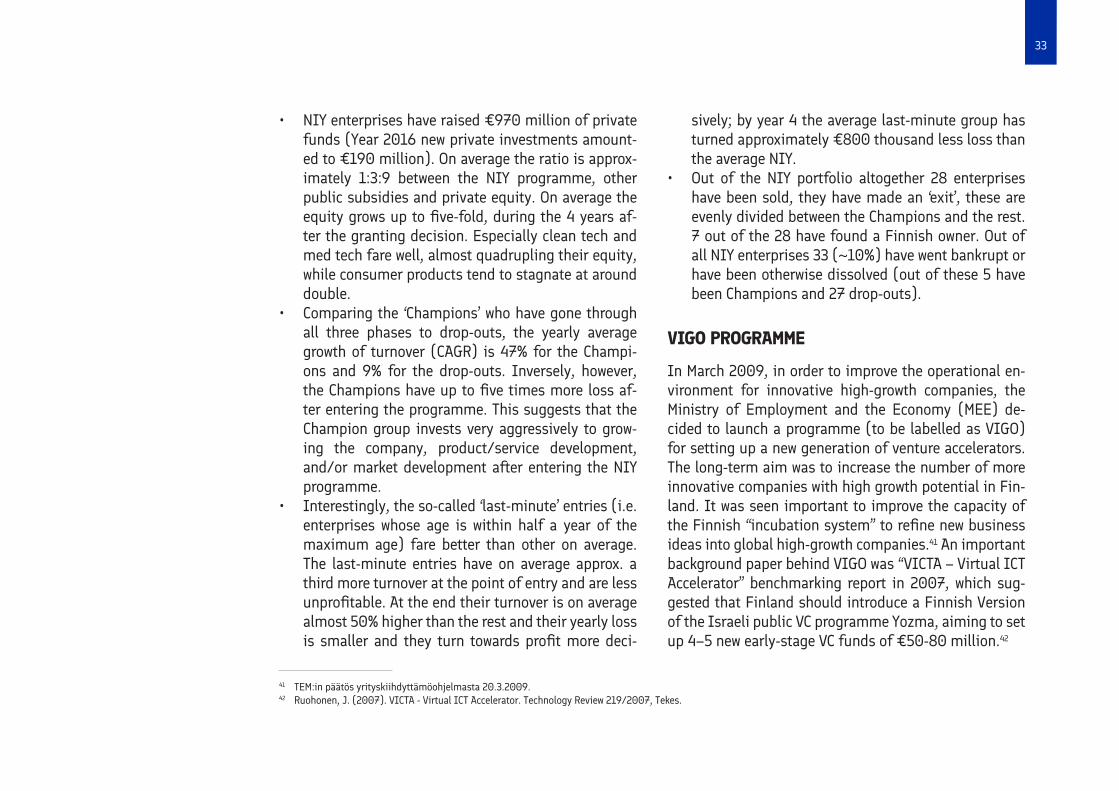
At the time of the writing a total of 336 companies have been participating in NIY programme since 2008. Of all participants, a total of 105 companies have completed all three funding phases (these companies are labelled as “champions”).40 Currently there are 79 companies in the three different phases of the programme.
Below, we have highlighted some main findings from a more detailed analysis by Tekes on the NIY participants:• In total, companies have applied for €210 million of
NIY funding, and 55% have been granted, making the total volume of NIY funding approx. €116 million. The yearly volume has been around €10 million, with the whole range being €6.6–19 million annually.
• 94% of the NIY enterprises have at least one Te-kes-granted subsidy before entering NIY and 40% have a concurrent project. The total Tekes funding (including NIY funding and other Tekes funding) for NIY enterprises has been €460 million Tekes funding, which includes €250 million of subsidies/grants and €210 million of loans.
• The number of applications has varied between 50 and 90 yearly, and approximately half of them have been accepted each year. The conditions changed in the beginning of 2015 when the enterprise maximum age condition was lowered from 6 to five, which result-ed an exceptional amount of applications in 2014.
FIGURE 4. Tekes funding to companies less than six years old. Source: Tekes tunnus-luvut
57,2
73,9
88,4
102,4
128,3135,0 133,0 134,0
139,8 142,0
0
20
40
60
80
100
120
140
2007 2008 2009 2010 2011 2012 2013 2014 2015 2016
PHASE NO. OF COMPANIES (2008 - 8/2017)”Champions” (completed all three phases) 105 (31%)Currently in the program 79 (24%) – In phase one 38 – In phase two 27 – In phase three 14Cancelled / dropped 152 (45%) – After phase one 56 – After phase two 79 – During phase three 17Total participants 336 (100%)
TABLE 6. Number of companies in NIY programme.
40 See list ”champions” and current participants in Tekes website: https://www.tekes.fi/en/funding/startup/companies/
33
• NIY enterprises have raised €970 million of private funds (Year 2016 new private investments amount-ed to €190 million). On average the ratio is approx-imately 1:3:9 between the NIY programme, other public subsidies and private equity. On average the equity grows up to five-fold, during the 4 years af-ter the granting decision. Especially clean tech and med tech fare well, almost quadrupling their equity, while consumer products tend to stagnate at around double.
• Comparing the ‘Champions’ who have gone through all three phases to drop-outs, the yearly average growth of turnover (CAGR) is 47% for the Champi-ons and 9% for the drop-outs. Inversely, however, the Champions have up to five times more loss af-ter entering the programme. This suggests that the Champion group invests very aggressively to grow-ing the company, product/service development, and/or market development after entering the NIY programme.
• Interestingly, the so-called ‘last-minute’ entries (i.e. enterprises whose age is within half a year of the maximum age) fare better than other on average. The last-minute entries have on average approx. a third more turnover at the point of entry and are less unprofitable. At the end their turnover is on average almost 50% higher than the rest and their yearly loss is smaller and they turn towards profit more deci-
sively; by year 4 the average last-minute group has turned approximately €800 thousand less loss than the average NIY.
• Out of the NIY portfolio altogether 28 enterprises have been sold, they have made an ‘exit’, these are evenly divided between the Champions and the rest. 7 out of the 28 have found a Finnish owner. Out of all NIY enterprises 33 (~10%) have went bankrupt or have been otherwise dissolved (out of these 5 have been Champions and 27 drop-outs).
VIGO PROGRAMME
In March 2009, in order to improve the operational en-vironment for innovative high-growth companies, the Ministry of Employment and the Economy (MEE) de-cided to launch a programme (to be labelled as VIGO) for setting up a new generation of venture accelerators. The long-term aim was to increase the number of more innovative companies with high growth potential in Fin-land. It was seen important to improve the capacity of the Finnish “incubation system” to refine new business ideas into global high-growth companies.41 An important background paper behind VIGO was “VICTA – Virtual ICT Accelerator” benchmarking report in 2007, which sug-gested that Finland should introduce a Finnish Version of the Israeli public VC programme Yozma, aiming to set up 4–5 new early-stage VC funds of €50-80 million.42
41 TEM:in päätös yrityskiihdyttämöohjelmasta 20.3.2009.42 Ruohonen, J. (2007). VICTA - Virtual ICT Accelerator. Technology Review 219/2007, Tekes.
34
Basically, the VIGO programme was set up to attract (with public incentives) the most potential venture development teams to develop Finnish startups, and ensure sufficient funding for the companies. A steering group was nominated to guide the programme implementation, which was assigned for Tekes.43
The goals of the VIGO programme were:44 • Give incentives to the best business developers to
help the most promising startups grow into success-ful companies
• Ensure early stage funding for startups, increase their shareholder value, and make the startups at-tractive targets for venture investors
• Continue to raise significant venture capital invest-ments after the acceleration stage to support expan-sion of the target companies
• Invigorate the Finnish venture capital market and bring more international acceleration and venture capital players into Finland
At the core of the VIGO Programme were the VIGO Ac-celerators. The accelerators were independent private companies, run by experienced entrepreneurs, who also invested − both their time and money − into the start-ups in their portfolio. The accelerators were selected in competitive calls for applications. In total, 14 VIGO ac-
celerators were established during the VIGO programme period (2009–2/2016). In February 2016, the VIGO Programme was officially ended (as planned) and the VIGO brand was transferred to the Finnish Business Ac-celerator Network (FINAC). At the end of the programme (2/2016) there were 10 VIGO Accelerators and around 150 portfolio startups in total. During the course of the programme, the companies received 100 million euros public funding (from Tekes and Finnvera), and attracted approximately €300 million of private funding, of which 2/3 was from abroad.45
The acceleration process in VIGOs typically lasted from 18 to 24 months, after which the companies were no longer qualified for preferred public funding but could remain in the accelerator portfolio as a normal portfolio investment. The business model of the accelerators was based on the revenues generated by the exits of their portfolio companies. Some accelerators also included monthly management fees (for which the companies could use the NIY funding). Total funding (private and public) for the startups during the acceleration period varied between €1–2 million. The companies in VIGOs were not automatically entitled to Tekes or Finnvera funding, but a fast-track process was set up between VIGOs and Tekes. The VIGOs were also required to have the capability to invest at least €30 thousand in each of the portfolio firms.46
43 TEM:in päätös yrityskiihdyttämöohjelmasta 20.3.2009.44 VIGO Venture Accelerators. Driving Fast Growth of High Potential Startups. Presentation at www.vigo.fi 45 Source: Tekes.46 VIGO Venture Accelerators. Driving Fast Growth of High Potential Startups. Presentation at www.vigo.fi
35
TEKES VC47
Tekes Venture Capital Ltd, established in 2014, is a state-owned company investing in venture capital funds, which − in turn − invest in early stages Finnish growth companies. The long-term goal of Tekes VC is to estab-lish the Finnish VC market, and thus support the faster development and growth of Finnish startups and im-prove the productivity and renewal of the economy.
The funds are managed by private management com-panies, operating on commercial grounds. The target fund managers should have “solid industry expertise, reliable entrepreneurial or investment background and proof of successful commercial operations or invest-ments”, as well as “realistic prospects to raise enough private capital for the fund”.
Tekes VC aims to invest into 2–4 funds annually. The total capital of the target fund may be up to ca. €20 million. At least half of the capital in target funds is raised by private investors. The maximum amount of Tekes commitments is six million euros. By the end of 2017, Tekes VC has invested total of approx. €31 million in 10 funds that have raised funds in the total amount of €112 million. The funds have invested in approxi-mately 150 companies.
SUMMARY OF PREVIOUS EVALUATIONS OF TEKES STARTUP AND ACCELERATOR ACTIVITIES
This section summarises the findings of the previous evaluations and assessments of Tekes activities relat-ed to startups and accelerators. It should be noted that there are a variety of evaluations and assessments of Tekes activities and programmes,48 but only few focus on assessing Tekes’ impact on startups or accelerators, which is the focus in this project.
EVALUATIONS OF TEKES FUNDING FOR STARTUPS
According to an analysis of Tekes’ long-term objectives by Etla, the survival-rates of Tekes funded companies did not significantly differ from other startups. This could either mean that Tekes funded projects are not − in general − that risky or ambitious, or that Tekes-fund-ed startups’ business model and operations is already more refined and professional than in other startups. The latter explanation is supported by the fact that Te-kes clients (7 employees on average) were also larger than other startups (5 employees on average) in 2005. Tekes clients also grew much faster than other startups. Overall the findings suggest that Tekes has managed to target its funding for innovative and growth-oriented startups.49
47 This section is based on: http://tekes.vc48 See e,g, the list of references and publications at https://www.tekes.fi/tekes/
tulokset-ja-vaikutukset/ 49 https://www.tekes.fi/globalassets/julkaisut/tekesin-vaikuttavuuden-
tavoitteet_337_2017.pdf
36
As part of an analysis of Finnish private equity in-vestments, Etla examined the role of Tekes funding. The analysis revealed that Tekes client companies (as well as companies that have received private equity) have per-formed better than companies in a comparison group. The report also concluded that “the relationship between Tekes and venture capitalists is a symbiotic one; Tekes is typically involved in the earlier stages of the develop-ment of startup firms, whereas venture capitalists come along during the later stages of commercialization and growth.” At best, Tekes provides deal flow for private eq-uity investors. It was also noted that the NIY Programme has utilized private investors in assessing the applicant companies. Many VC investors also regarded Tekes ac-tivities important for their own investment decisions. Tekes is regarded an important actor especially in early stage innovation funding.50
In 2015 Halme et al analysed the impact of public funding (incl. Tekes grants and loans) on young compa-nies (less than 6 years old). The analysis was based on the survey methodology developed by The Evidence Network, also used in this assignment. The analysis concluded that Tekes grants and loans had significant positive impact on companies’ resources and capabilities, especially on their R&D activities. There was also evidence that com-panies that had used both financial and non-financial support attributed greater impact to Tekes funding than companies that had only used financial support.51
EVALUATIONS OF THE NIY PROGRAMME
There are several previous assessments and evalua-tions covering the NIY programme. The first one, con-ducted by The Evidence Network in 2013, revealed that The NIY Programme is having a significant impact on both strengthening the resources and capabilities of companies (e.g. improvements to leadership, business planning, selling into new markets) as well as the com-panies’ performance (acquisition of new international customers, increases in employment and time to mar-ket). It also highlighted that companies, which reported to have used non-financial support to a greater degree, attributed the greatest impact to the programme. It also revealed that for the 108 companies that participated in the survey, attributed a total of approximately €99 mil-lion to revenues and 1,172 jobs to the NIY programme (more than half of the total revenues and employment of the companies).
According to an analysis of NIY companies by Autio et al (2014), NIY companies’ sales and employment grew more strongly than in a comparison group, and that the NIY companies grew their sales “substantially more rap-idly than the comparison group”. An econometric anal-ysis (Propensity Score Matching) also strongly support-ed the conclusion that the programme had “produced a genuine and substantial, positive effect on the sales growth of its participating firms.” An analysis of the bal-
50 Pajarinen, M., Rouvinen, P. & Ylhäinen, I. (2016). Kasvun nälkä. Pääomasijoitetut yritykset muutosagentteina. Tekes ja FVCA. 51 Halme, K., Salminen, V., Lamminmäki, K., Rikama, S., Barge, B., Dalziel, M., & Miller, C. (2015). Nuorten kasvavien yritysten merkitys, menestystekijät ja yritystukien rooli
kasvun ajurina. Työ- ja elinkeinoministeriö.

37
ance sheets of NIY and VIGO companies also revealed that the companies had been able to attract new equity funding during 2009-2011. The NIY companies also per-ceived easier access to finance than the reference group companies and it appears that the NIY Programme had “significantly alleviated the financial resource constraint for its participating firms”. The analysis also suggests that companies participating in the NIY programme sought external equity funding more often and were more successful in obtaining it.
Most recently a report by Halme et al (2015) compared the impact of different public funding instruments. The analysis highlighted that of all instruments assessed, the NIY Programme had the most impact on companies’ resources and capabilities as well as their performance. It also highlighted the differences between the target companies of the funding instruments, most notably in their growth ambitions. Almost 90% of the NIY compa-nies responding to the survey (n=33) aimed for rapid international growth, compared to e.g. approximately 65% of young (under 6 years) companies receiving Te-kes grants and loans.
EVALUATIONS OF THE VIGO PROGRAMME
VIGO Programme was evaluated in 2013 by Autio et al. As concluded by Autio et al. in the mid-term evalu-ation of the VIGO Programme, the programme can be seen as a systemic intervention to address specific per-ceived gaps in the Finnish entrepreneurship ecosystem:
“(1) insufficient number of new ventures with potential for high growth; (2) equity funding gap in the region from approximately €20 thousand to €200 thousand; and (3) insufficient experience and competence base in high-growth venturing.”52 The positioning of VIGOs in the Finnish high-growth entrepreneurship ecosystem, as seen by Autio et al, is presented in Figure 5.
The evaluation concluded that VIGO had successfully achieved its early-stage goals. 1. First, the programme was seen to be on course to
achieving its target of attracting significant equity investment in Finnish high-potential startups (€60 million of the targeted €200 million by June 2012 with the overall public-private ratio being 1:1).
2. Second, according to the evaluation, there is evi-dence that “experienced accelerator teams have been attracted to the sector, and at least some of these would not have entered the field without the VIGO Programme”.
3. Third, as indicated by improved deal flow and in-vestment activity, the programme seems to have helped to facilitate the creation of investment-ready, high-potential new ventures in Finland.
4. Fourth, the setting up of two new venture funds with significant investment by foreign investors indicates that the programme was on course to revitalising and internationalising the Finnish venture capital sector. There was also evidence of active networking with non-Finnish venture funds.
52 Autio, E. et al (2013). The VIGO Programme Mid-Term Evaluation. MEE;
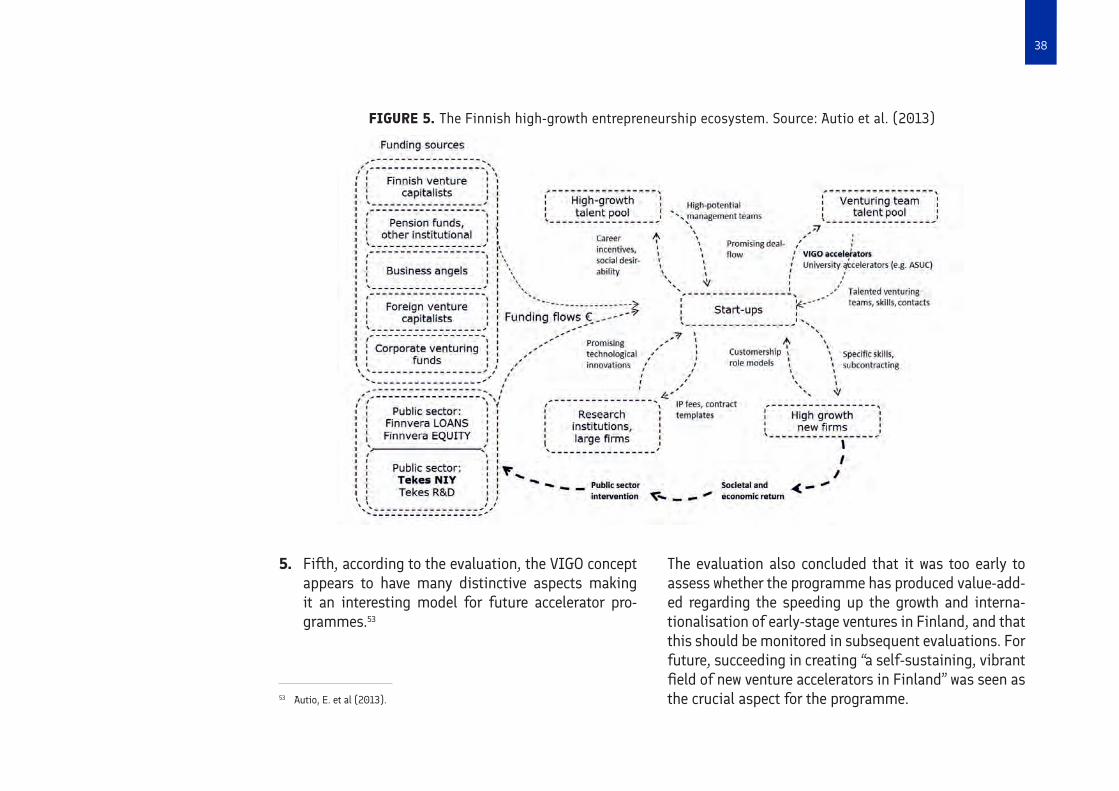
38
5. Fifth, according to the evaluation, the VIGO concept appears to have many distinctive aspects making it an interesting model for future accelerator pro-grammes.53
The evaluation also concluded that it was too early to assess whether the programme has produced value-add-ed regarding the speeding up the growth and interna-tionalisation of early-stage ventures in Finland, and that this should be monitored in subsequent evaluations. For future, succeeding in creating “a self-sustaining, vibrant field of new venture accelerators in Finland” was seen as the crucial aspect for the programme.
FIGURE 5. The Finnish high-growth entrepreneurship ecosystem. Source: Autio et al. (2013)
53 Autio, E. et al (2013).
39
The evaluation also proposed two future alternatives for VIGOs as part of the broader ecosystem (beyond its initial six-year period which ended in 2015). In the first scenario, VIGO would be discontinued as the accelera-tor concept becomes established, the accelerator field self-sustaining, and collaborative procedures with key stakeholders (e.g. Tekes, Finnvera, universities) es-tablished. In the second scenario VIGO would become a (possibly reduced) on-going state programme. This would be possible if the accelerator field would not be-come self-sustaining and gaps in ecosystem persist. An-other potential scenario was VIGO to “become a feeder mechanism towards some kind of fund-of-funds struc-ture that attracts new accelerator teams to the field and provides an opportunity for these to establish a suffi-cient track record and credentials to raise and operate new early-stage equity funds”.
Prior to the mid-term evaluation, after the first oper-ational year of the VIGO programme, Luukkonen (2010) concluded that although there were new features in the programme and the programme aimed to combine pub-
lic resources and private experience, the quick launch of the programme led to “design features counterpro-ductive to its goals”. According to Luukkonen, “there are questions about the value-added of the programme, since the ventures can apply to these public schemes ir-respective of being part of the accelerator programme”. Luukkonen also highlighted that the main value-added of the accelerators are the screening and coaching as well extra funds from their own resources and networks. However, Luukkonen argued that “it seems that the pro-gramme is implemented half-heartedly, and the public funding agencies do not sufficiently trust the market mechanisms and their representatives, the accelerators, which they are expected to team with in the programme”, and that “unwillingness to make a notification to the EU, to change the law, and the vested interests of existing stakeholders, that is, public agencies and public venture capital organisations wanting to continue their prevail-ing practices, prevented experimenting with a really new policy design.”54
54 Luukkonen, T. (2010). The Effectiveness of the Finnish Pre-seed and Seed Policy Schemes to Promote Innovative High-growth Entrepreneurial Ventures. Etla Discussion Paper 1221, Etla.
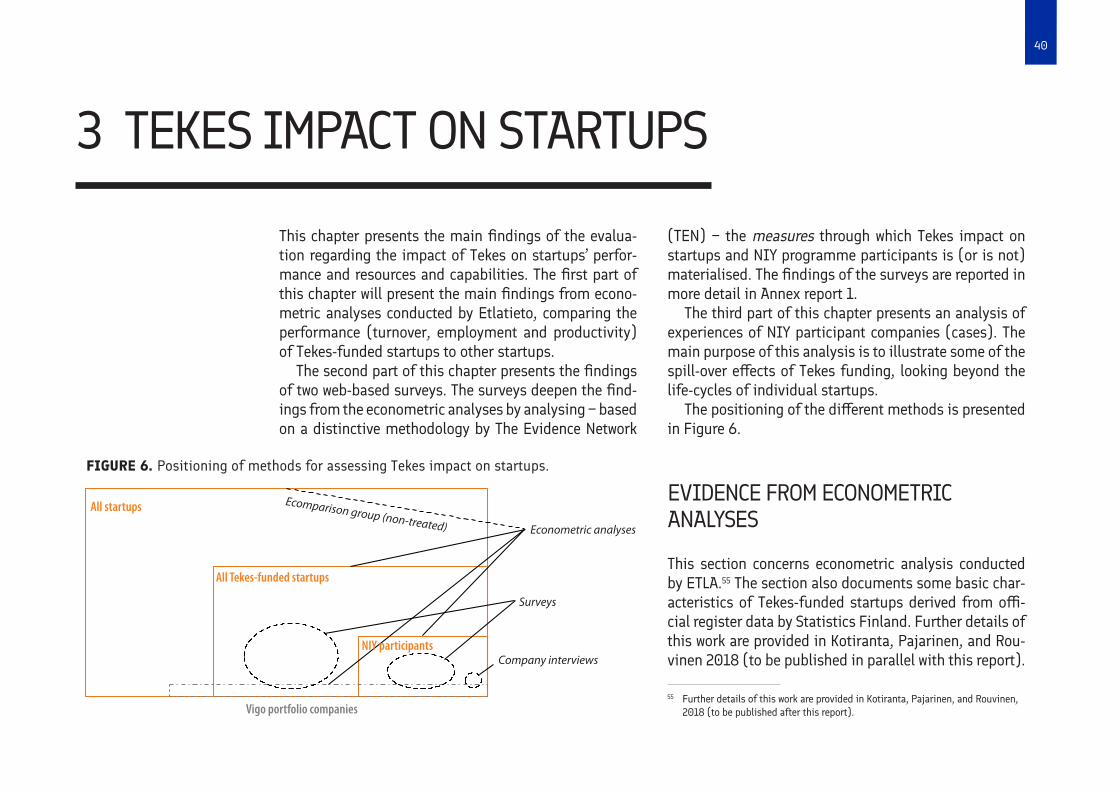
40
This chapter presents the main findings of the evalua-tion regarding the impact of Tekes on startups’ perfor-mance and resources and capabilities. The first part of this chapter will present the main findings from econo-metric analyses conducted by Etlatieto, comparing the performance (turnover, employment and productivity) of Tekes-funded startups to other startups.
The second part of this chapter presents the findings of two web-based surveys. The surveys deepen the find-ings from the econometric analyses by analysing − based on a distinctive methodology by The Evidence Network
(TEN) − the measures through which Tekes impact on startups and NIY programme participants is (or is not) materialised. The findings of the surveys are reported in more detail in Annex report 1.
The third part of this chapter presents an analysis of experiences of NIY participant companies (cases). The main purpose of this analysis is to illustrate some of the spill-over effects of Tekes funding, looking beyond the life-cycles of individual startups.
The positioning of the different methods is presented in Figure 6.
EVIDENCE FROM ECONOMETRIC ANALYSES
This section concerns econometric analysis conducted by ETLA.55 The section also documents some basic char-acteristics of Tekes-funded startups derived from offi-cial register data by Statistics Finland. Further details of this work are provided in Kotiranta, Pajarinen, and Rou-vinen 2018 (to be published in parallel with this report).
3 TEKES IMPACT ON STARTUPS
All startups
All Tekes-funded startups
NIY participants
Econometric analyses
Ecomparison group (non-treated)
Surveys
Company interviews
Vigo portfolio companies
FIGURE 6. Positioning of methods for assessing Tekes impact on startups.
55 Further details of this work are provided in Kotiranta, Pajarinen, and Rouvinen, 2018 (to be published after this report).
41
SUMMARY OF MAIN FINDINGS
• The number of Tekes funded startups has grown in recent years. Two thirds of these companies em-ploy initially less that five persons. While they then grow rapidly in relative terms, absolute growth is somewhat limited by their modest initial size. Software and other ICT-related services is clear-ly the most common line of business among Te-kes-startups.
• Tekes support has a positive impact on startup growth (beyond a simple selection effect). When compared to otherwise similar startups not receiv-ing Tekes support, it is found that Tekes-start-ups grow more quickly in terms of employment and turnover. Realized growth is more dispersed among Tekes-startups, which is consistent with (desired) risk taking on behalf of Tekes.
• Overall, Tekes tends to be involved with startups earlier than private venture capitalists.56 This is not, however, the case when it comes to the NIY programme: about half of NIYs do not receive VC-funding but of those that do, the majority re-ceives private VC funding before entering the NIY programme. This is hardly surprising, as the NIY program serves as the end of Tekes funding fun-nel and concerns startups that have gone through multiple stages of selection.
DESCRIPTION OF DATA AND THE APPROACH
The analysed startups are divided into four groups. First, we label a firm as a Tekes-startup, if it meets our basic requirements for a startup or if it has received Tekes funding from the NIYs or VIGO programmes. In the sec-ond and third groups, we separately study the firms of the NIYs and VIGO programmes. The fourth group con-sists of Tekes-funded startups excluding the NIYs and VIGO firms.
Figure 7 depicts the count of Tekes-startups by the first treatment year in the four groups analysed. The number of all new Tekes-startups has nearly doubled in the last ten years from slightly over 100 per year in the 2000s to around 200 in the most recent years, which reflects the stronger emphasis of Tekes funding towards startups. The number of firms joining to the NIYs programme has varied from 21 to 54 startups, the average being 35 firms over the period 2008–2015. The VIGO programme has been even smaller: in 2009–2015 in total of 110 startups have received funding from the programme. In a typical year in that period 15–20 firms have entered for the first time to the treatment stage. Lastly, when excluding from Tekes-startups the firms belonging to the NIYs or VIGO programmes, we can notice a clear upward trend in the recent years in the number of funded startups, exceeding 150 firms in 2014 and 2015.
56 Earlier work by Pajarinen, Rouvinen, and Ylhäinen, 2016, suggests that that there is a reasonably well-functioning devision of labor between Tekes and VCs; in essence, Tekes feeds into private VCs portfolios
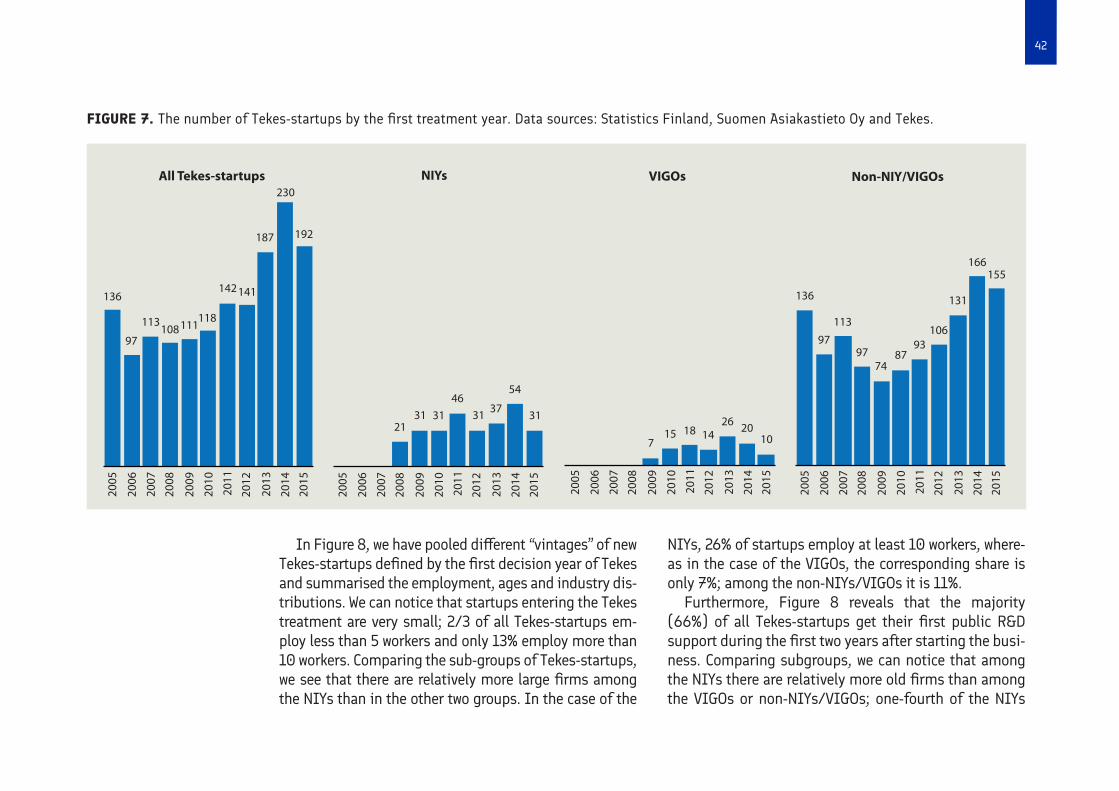
42
FIGURE 7. The number of Tekes-startups by the first treatment year. Data sources: Statistics Finland, Suomen Asiakastieto Oy and Tekes.
VIGOs Non-NIY/VIGOsNIYs
192
141
111113
136
97 9797
113
136 131
166
2005
2006
2007
2008
2009
2010
2011
2012
2013
2014
2015
2005
2006
2007
2008
2009
2010
2011
2012
2013
2014
2015
2005
2006
2007
2008
2009
2010
2011
2012
2013
2014
2015
2005
2006
2007
2008
2009
2010
2011
2012
2013
2014
2015
106
155
8774
93
217
26 2010
1815 14
31
4654
31 31 3137
118108
142
187
230All Tekes-startups
In Figure 8, we have pooled different “vintages” of new Tekes-startups defined by the first decision year of Tekes and summarised the employment, ages and industry dis-tributions. We can notice that startups entering the Tekes treatment are very small; 2/3 of all Tekes-startups em-ploy less than 5 workers and only 13% employ more than 10 workers. Comparing the sub-groups of Tekes-startups, we see that there are relatively more large firms among the NIYs than in the other two groups. In the case of the
NIYs, 26% of startups employ at least 10 workers, where-as in the case of the VIGOs, the corresponding share is only 7%; among the non-NIYs/VIGOs it is 11%.
Furthermore, Figure 8 reveals that the majority (66%) of all Tekes-startups get their first public R&D support during the first two years after starting the busi-ness. Comparing subgroups, we can notice that among the NIYs there are relatively more old firms than among the VIGOs or non-NIYs/VIGOs; one-fourth of the NIYs
43
have reached the age of 5 years before having their first public R&D support, while in the VIGOs the proportion is only 6% and among the non-NIYs/VIGOs it is 1%.
The industry distribution in Figure 8 indicates that the most popular line of business among the Tekes-startups has been software and other services related to informa-tion and communication technology (ICT). The share of ICT services varies from 40% in the non-NIYs/VIGOs to 59% among the VIGOs. The next most popular industry with a 20–29% share has been in all sub-groups of oth-er business services, such as architectural/engineering activities and technical testing/analysis. In total, more than 4/5 of firms in all studied groups are in service industries. The percentage is the highest (89%) among the VIGOs. The share of manufacturing startups is 15% among the NIYs and non-NIYs/VIGOs and 11% among the VIGOs.
Figure 9 illustrates the development of employment in the different vintages (2005–2014) of Tekes-start-ups. In the case of all Tekes-startups, the firms employ an average of 5.0–6.6 workers in the first treatment year. We notice different magnitudes of the growth for different vintages. Comparing the development over 5-year periods, the employment grew the most in the 2005 and 2009 vintages. The startups in these vintages have more than doubled their number of workers in the five years after the first injection of Tekes, employing on average 13.1–14.3 workers. In other vintages, the growth has been more moderate; on average, the number of workers in the 5 years after the first treatment ranged from 8.7 to 10.8 workers.
Firms in the NIY programme have employed an av-erage of 7.8–10.1 workers in their first year of support. In all vintages, the number of workers increases after the treatment year. The growth is the highest in the two years after the treatment in the 2008 and 2013 vintag-es. Five years after their first support, the NIYs employ an average of 14.4–17.4 workers.
Compared to the NIYs, the VIGO firms are smaller in the first treatment year but their employment growth is higher after the treatment. Depending on the vintage, in their first support year, they have an average of 2.6–6.2 workers. After the treatment, the employment rapidly grows. In year 5 after the first treatment, they employ an average of 15.3–15.5 workers.
Excluding the NIYs and VIGOs from the all Tekes-start-ups does not significantly change the results. The aver-age size of startups in the first treatment year slightly decreases to 4.0–6.6 workers. The average employment in year 5 after the first treatment also slightly decreases to 7.2–14.3 workers.
To conclude, we can observe somewhat diverging growth patterns of employment by different vintages. In the case of all Tekes-startups, it takes an average of 3–4 years after the first treatment year for startups to grow from micro-sized (<10 workers) to small (>10 workers) firms. In the VIGOs, this movement occurs on average in two years. The NIYs, which are on average reaching the small-size criteria in the first treatment year, typically employ more than 10 workers after the first year follow-ing the support.
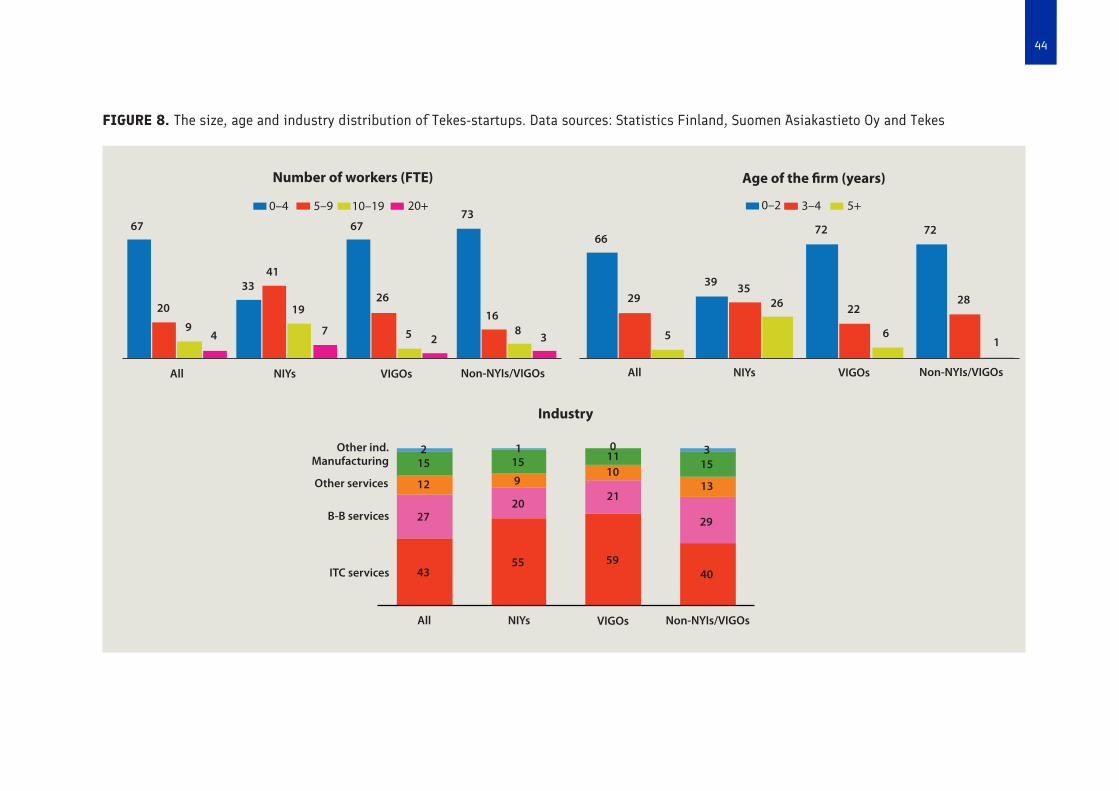
44
FIGURE 8. The size, age and industry distribution of Tekes-startups. Data sources: Statistics Finland, Suomen Asiakastieto Oy and Tekes
Number of workers (FTE) Age of the firm (years)
Industry
Other ind.Manufacturing
Other services
B-B services
ITC services
All NIYs VIGOs Non-NYIs/VIGOs
All All
55749
20
33
19
41
2
2 111
21
10
20 27
12
4355 59
29
40
15 15 15
13
3
9
0
168
3
736767
26
6
22282629
66
0–20–4 3–45–9 10–19 5+20+
39 35
7272
1
NIYs NIYsVIGOs VIGOsNon-NYIs/VIGOs Non-NYIs/VIGOs
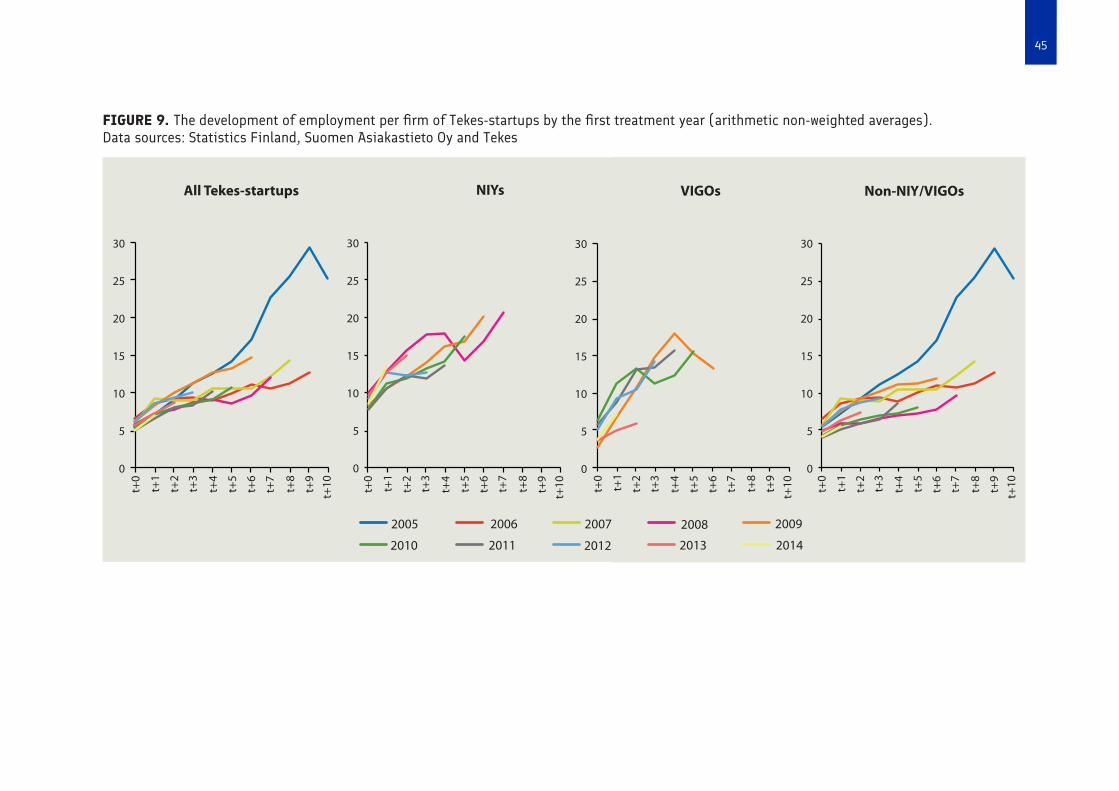
45
FIGURE 9. The development of employment per firm of Tekes-startups by the first treatment year (arithmetic non-weighted averages). Data sources: Statistics Finland, Suomen Asiakastieto Oy and Tekes
t+0
t+1
t+2
t+3
t+4
t+5
t+6
t+7
t+8
t+9
t+10t+0
t+1
t+2
t+3
t+4
t+5
t+6
t+7
t+8
t+9
t+10 t+0
t+1
t+2
t+3
t+4
t+5
t+6
t+7
t+8
t+9
t+10t+0
t+1
t+2
t+3
t+4
t+5
t+6
t+7
t+8
t+9
t+10
2005 2006 2007 2008 2009
2010 2011 2012 2013 2014
VIGOs Non-NIY/VIGOsNIYsAll Tekes-startups
30
25
20
15
10
5
0
30
25
20
15
10
5
0
30
25
20
15
10
5
0
30
25
20
15
10
5
0
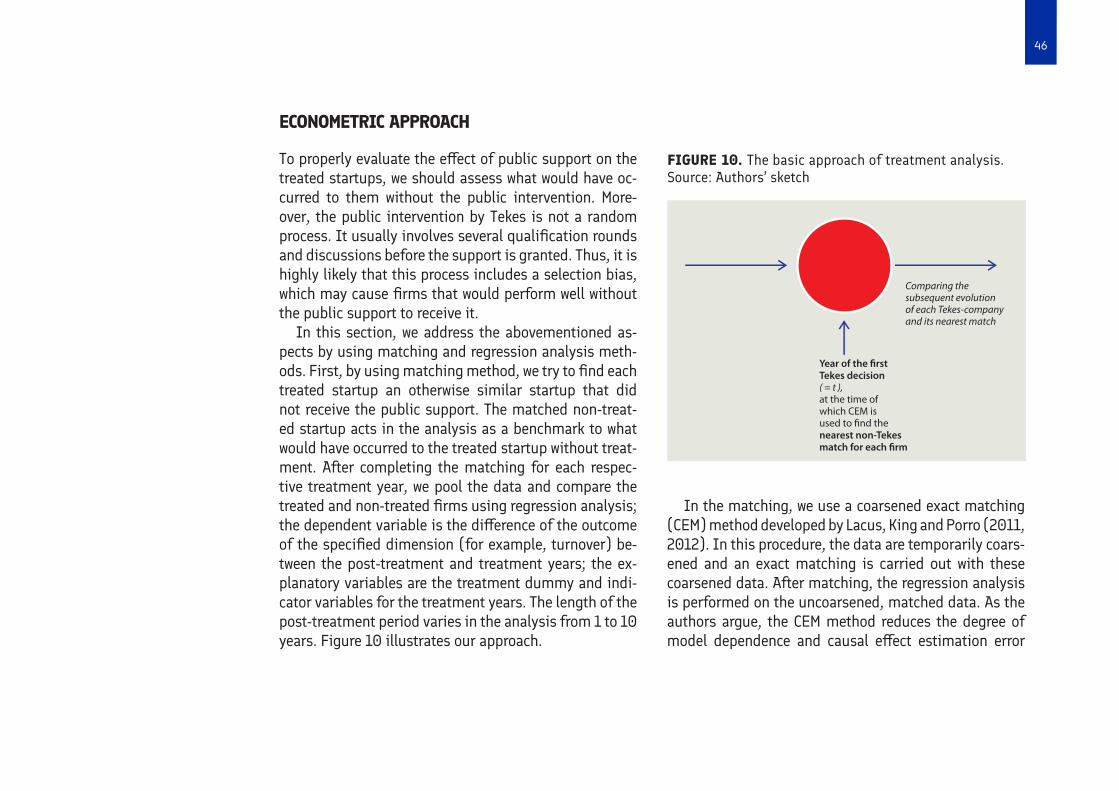
46
ECONOMETRIC APPROACH
To properly evaluate the effect of public support on the treated startups, we should assess what would have oc-curred to them without the public intervention. More-over, the public intervention by Tekes is not a random process. It usually involves several qualification rounds and discussions before the support is granted. Thus, it is highly likely that this process includes a selection bias, which may cause firms that would perform well without the public support to receive it.
In this section, we address the abovementioned as-pects by using matching and regression analysis meth-ods. First, by using matching method, we try to find each treated startup an otherwise similar startup that did not receive the public support. The matched non-treat-ed startup acts in the analysis as a benchmark to what would have occurred to the treated startup without treat-ment. After completing the matching for each respec-tive treatment year, we pool the data and compare the treated and non-treated firms using regression analysis; the dependent variable is the difference of the outcome of the specified dimension (for example, turnover) be-tween the post-treatment and treatment years; the ex-planatory variables are the treatment dummy and indi-cator variables for the treatment years. The length of the post-treatment period varies in the analysis from 1 to 10 years. Figure 10 illustrates our approach.
In the matching, we use a coarsened exact matching (CEM) method developed by Lacus, King and Porro (2011, 2012). In this procedure, the data are temporarily coars-ened and an exact matching is carried out with these coarsened data. After matching, the regression analysis is performed on the uncoarsened, matched data. As the authors argue, the CEM method reduces the degree of model dependence and causal effect estimation error
FIGURE 10. The basic approach of treatment analysis. Source: Authors’ sketch
Comparing thesubsequent evolutionof each Tekes-companyand its nearest match
Year of the firstTekes decision( = t ),at the time ofwhich CEM is used to find thenearest non-Tekesmatch for each firm
47
by ex-ante user choice; the method uses monotonic imbalance bounding so that reducing the maximum imbalance on one variable has no effect on others. It does not require a separate procedure to restrict data to common support; the method is approximately invariant to measurement error and balances nonlinearities and interactions in the data. In the matching, our covariates are firms’ employment, age and industry. To coarsen the data, the cut points for employments are 5, 10 and 20 workers, for ages 2 and 5 years and there are 20 indica-tor variables (0/1) for industries. The dependent vari-ables in the regressions after the matching are employ-ment, turnover and labour productivity. In addition, we compare (without regressions) the survival, the usage of digital technologies, and private equity involvement of the matched treated and non-treated firms.
EMPLOYMENT, TURNOVER AND LABOUR PRODUCTIVITY
In the following figures (Figure 11 − Figure 13), we sum-marise the difference of the outcomes between treated and non-treated startups from the first decision year of Tekes onwards based on the matching and regression analysis of the pooled cross-sectional data. In the fig-ures, we report the mean estimates and their 90% con-
fidence intervals. The difference is statistically signifi-cant at the 10% level, if the mean estimate and the lower bound of the estimate are also positive. If the mean estimate is negative, then it is statistically significant at the 10% level if upper bound of the estimate is also negative. Depending on the group analysed, we observe the farthest post-treatment outcomes 4–10 years from the treatment year.
Figure 11 depicts the differences in employment de-velopment. We can see that in all four groups, the num-ber of workers increases more substantially in the treat-ed rather than in the non-treated firms. The difference is statistically significant at the 10% level in all (t+1 – t+10) post-treatment years in the case of all Tekes-start-ups. In the NIYs, the difference is statistically signifi-cant for the 5 years after the treatment, and in the case of the VIGOs, the three years. In the non-NIYs/VIGOs, the difference is also statistically significant in all but year t+6. However, the magnitudes of the differences in employment growth are relatively small. In the five years after receiving the support, all Tekes-startups em-ploy an average of 1.7 full-time equivalent workers more than the non-treated startups. In the case of the NIYs, the difference is an average of 3.9 full-time equivalent workers, and in the case of the VIGOs, it is an average of 3.3 full-time equivalent workers.
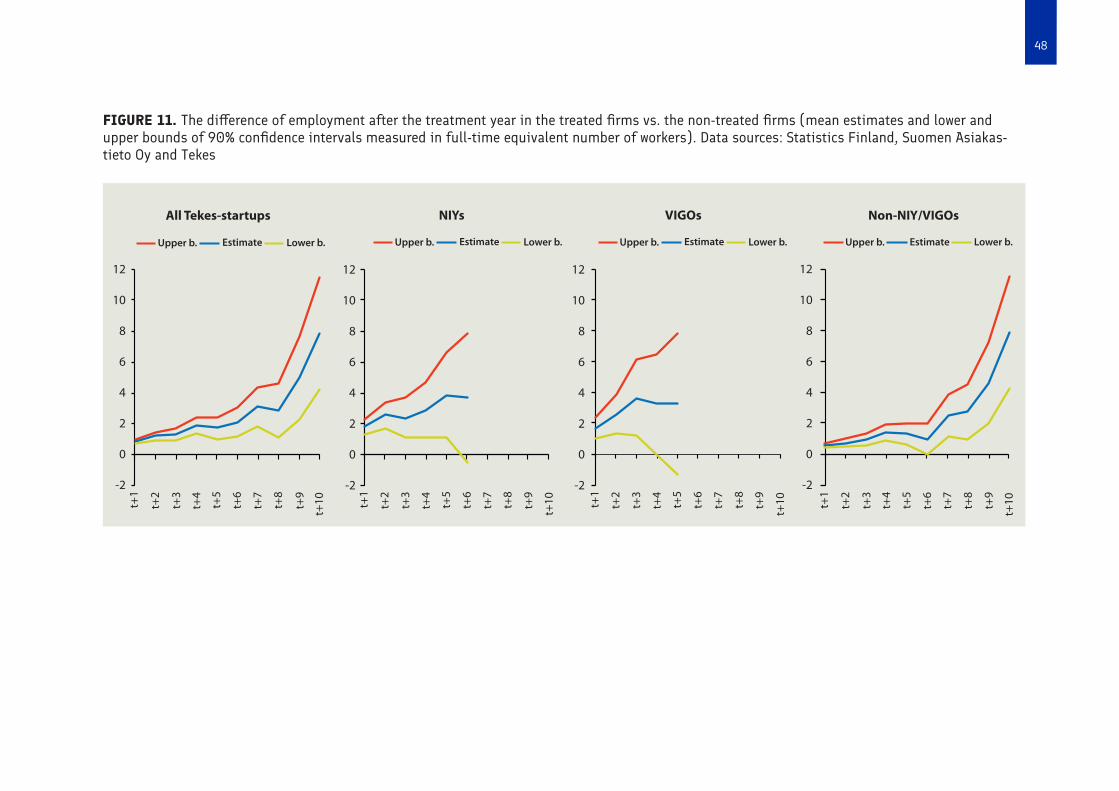
48
FIGURE 11. The difference of employment after the treatment year in the treated firms vs. the non-treated firms (mean estimates and lower and upper bounds of 90% confidence intervals measured in full-time equivalent number of workers). Data sources: Statistics Finland, Suomen Asiakas- tieto Oy and Tekes
VIGOs
Upper b. Estimate Lower b.
Non-NIY/VIGOsNIYsAll Tekes-startups
12
10
8
6
4
2
0
-2
12
10
8
6
4
2
0
-2
12
10
8
6
4
2
0
-2
12
10
8
6
4
2
0
-2
t+1
t+2
t+3
t+4
t+5
t+6
t+7
t+8
t+9
t+10 t+1
t+2
t+3
t+4
t+5
t+6
t+7
t+8
t+9
t+10 t+1
t+2
t+3
t+4
t+5
t+6
t+7
t+8
t+9
t+10 t+1
t+2
t+3
t+4
t+5
t+6
t+7
t+8
t+9
t+10
Upper b. Estimate Lower b.Upper b.Upper b. EstimateEstimate Lower b.Lower b.
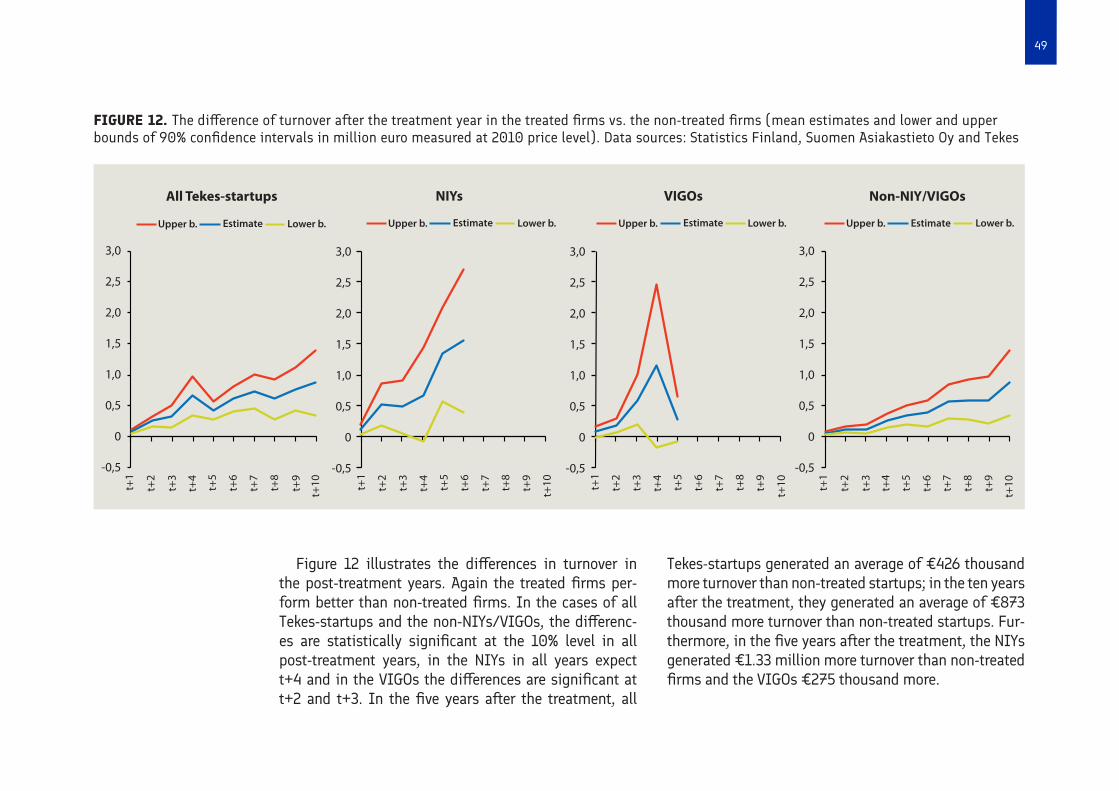
49
FIGURE 12. The difference of turnover after the treatment year in the treated firms vs. the non-treated firms (mean estimates and lower and upper bounds of 90% confidence intervals in million euro measured at 2010 price level). Data sources: Statistics Finland, Suomen Asiakastieto Oy and Tekes
VIGOs
Upper b. Estimate Lower b.
Non-NIY/VIGOsNIYsAll Tekes-startups
Upper b. Estimate Lower b.Upper b.Upper b. EstimateEstimate Lower b.Lower b.
t+1
t+2
t+3
t+4
t+5
t+6
t+7
t+8
t+9
t+10 t+1
t+2
t+3
t+4
t+5
t+6
t+7
t+8
t+9
t+10 t+1
t+2
t+3
t+4
t+5
t+6
t+7
t+8
t+9
t+10 t+1
t+2
t+3
t+4
t+5
t+6
t+7
t+8
t+9
t+10
3,0
2,5
2,0
1,5
1,0
0,5
0
-0,5
3,0
2,5
2,0
1,5
1,0
0,5
0
-0,5
3,0
2,5
2,0
1,5
1,0
0,5
0
-0,5
3,0
2,5
2,0
1,5
1,0
0,5
0
-0,5
Figure 12 illustrates the differences in turnover in the post-treatment years. Again the treated firms per-form better than non-treated firms. In the cases of all Tekes-startups and the non-NIYs/VIGOs, the differenc-es are statistically significant at the 10% level in all post-treatment years, in the NIYs in all years expect t+4 and in the VIGOs the differences are significant at t+2 and t+3. In the five years after the treatment, all
Tekes-startups generated an average of €426 thousand more turnover than non-treated startups; in the ten years after the treatment, they generated an average of €873 thousand more turnover than non-treated startups. Fur-thermore, in the five years after the treatment, the NIYs generated €1.33 million more turnover than non-treated firms and the VIGOs €275 thousand more.
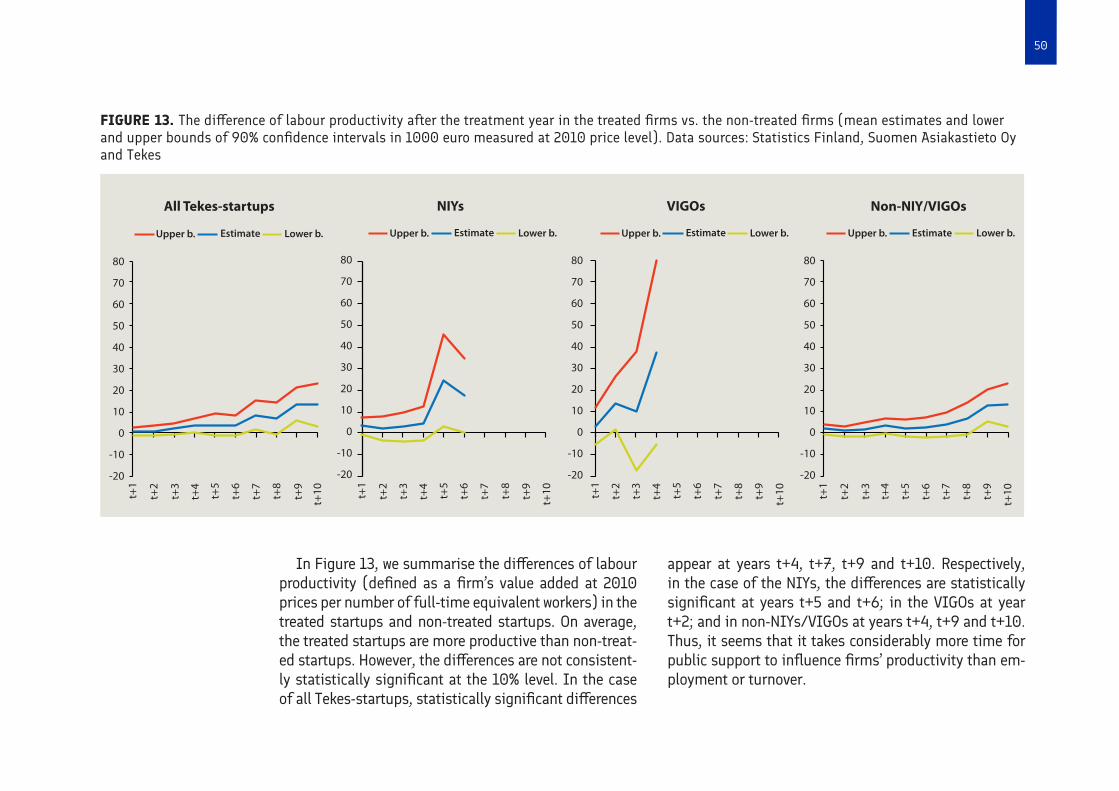
50
FIGURE 13. The difference of labour productivity after the treatment year in the treated firms vs. the non-treated firms (mean estimates and lower and upper bounds of 90% confidence intervals in 1000 euro measured at 2010 price level). Data sources: Statistics Finland, Suomen Asiakastieto Oy and Tekes
VIGOs
Upper b. Estimate Lower b.
Non-NIY/VIGOsNIYsAll Tekes-startups
Upper b. Estimate Lower b.Upper b.Upper b. EstimateEstimate Lower b.Lower b.
80
70
60
50
40
30
20
10
0
-10
-20
80
70
60
50
40
30
20
10
0
-10
-20
80
70
60
50
40
30
20
10
0
-10
-20
80
70
60
50
40
30
20
10
0
-10
-20
t+1
t+2
t+3
t+4
t+5
t+6
t+7
t+8
t+9
t+10 t+1
t+2
t+3
t+4
t+5
t+6
t+7
t+8
t+9
t+10 t+1
t+2
t+3
t+4
t+5
t+6
t+7
t+8
t+9
t+10 t+1
t+2
t+3
t+4
t+5
t+6
t+7
t+8
t+9
t+10
In Figure 13, we summarise the differences of labour productivity (defined as a firm’s value added at 2010 prices per number of full-time equivalent workers) in the treated startups and non-treated startups. On average, the treated startups are more productive than non-treat-ed startups. However, the differences are not consistent-ly statistically significant at the 10% level. In the case of all Tekes-startups, statistically significant differences
appear at years t+4, t+7, t+9 and t+10. Respectively, in the case of the NIYs, the differences are statistically significant at years t+5 and t+6; in the VIGOs at year t+2; and in non-NIYs/VIGOs at years t+4, t+9 and t+10. Thus, it seems that it takes considerably more time for public support to influence firms’ productivity than em-ployment or turnover.

51
THE DISPERSION BETWEEN FUNDED AND NON-FUNDED STARTUPS
One aim for public support is to finance projects that do not get enough funds from private investors but are regarded valuable in terms of social returns (e.g., due to spill-over effects or the accumulation of societal knowl-edge). These kinds of projects are often risky. In this study, we address this issue by plotting histograms of 3-year changes in labour effort, turnover and labour pro-ductivity of the treated and non-treated startups. Fig-ures 14–16 depict the results. Our interpretation of the histograms is that a larger “mass” at the far ends in the above (treated) versus the below (non-treated) histo-gram, the more that Tekes takes risks (and thus has a more “fat-tailed” distribution of outcomes).
Figure 14 summarises the results regarding the dis-persion of 3-year growth rates in labour effort in the treated and non-treated startups. In general, in all four comparison groups, the distributions of the treated firms seem to be more fat-tailed than the distributions of the non-treated firms. This result indicates that Tekes is indeed funding risky projects. There is some variation between the groups. This variation is especially true in the case of the VIGOs, where there is much mass in both ends of the histogram when compared to the non-treat-ed counterparts or other Tekes groups. The NIYs seem to have more mass on the right compared to non-treat-ed firms or other Tekes groups. They have also a large concentration of mass in the center of the distribution.
These observations may indicate that, after the selec-tion process, there are a lot of well-performing firms and somewhat less risky businesses among the NIYs than in other Tekes groups.
Figure 15 illustrates the distributions with respect to turnover growth. In this case, there is also more mass at the ends of the distributions in the treated startups than in the non-treated startups. Compared to the histograms of employment growth, in all Tekes groups, there is more mass on both tails of the distributions. The same kind of observation can also be performed when comparing the treated group to their non-treated counterparts, al-though this applies more when viewing the high positive growth outcomes rather than the negative outcomes. For instance, in the all Tekes-startups, 37% of firms have at least doubled their turnover in 3 years, and 27% have lost at least a half of their treatment year’s turnover, whereas in the non-treated group, the shares are 14% and 25%.
Figure 16 depicts the distributions with respect to la-bour productivity growth. We can make the same kind of observations here as in the cases of employment and turnover growth distributions; the distributions in all treated groups are more fat-tailed than in the non-treat-ed groups. Compared to the employment and turnover distributions, there are more firms in the extreme left of the distribution (-100%). A reason for this is that in addition to the firms that have had -100% changes, this category also includes firms that do not report enough information on their businesses to calculate the labour productivity measure.
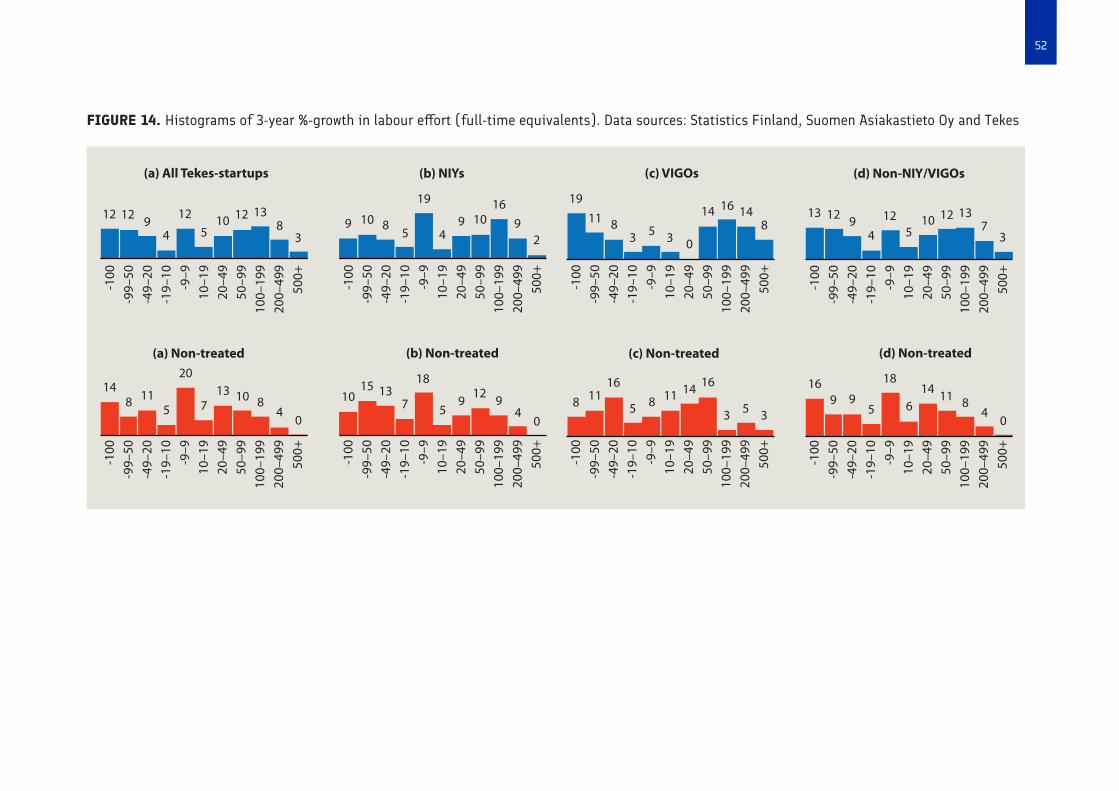
52
FIGURE 14. Histograms of 3-year %-growth in labour effort (full-time equivalents). Data sources: Statistics Finland, Suomen Asiakastieto Oy and Tekes
(a) Non-treated (b) Non-treated (c) Non-treated (d) Non-treated
(c) VIGOs (d) Non-NIY/VIGOs(b) NIYs(a) All Tekes-startups
117 88 88
5
8 83
9
19
9 94
18
73
411
49
54 5 5
84
9
11 14
1013
10
10 10
10 10
95
9
2
3 5 5 699
030 0
3 350
7
12 12
-100
-99–
50-4
9–20
-19–
10-9
–910
–19
20–4
950
–99
100–
199
200–
499
500+
-100
-99–
50-4
9–20
-19–
10-9
–910
–19
20–4
950
–99
100–
199
200–
499
500+
-100
-99–
50-4
9–20
-19–
10-9
–910
–19
20–4
950
–99
100–
199
200–
499
500+
-100
-99–
50-4
9–20
-19–
10-9
–910
–19
20–4
950
–99
100–
199
200–
499
500+
-100
-99–
50-4
9–20
-19–
10-9
–910
–19
20–4
950
–99
100–
199
200–
499
500+
-100
-99–
50-4
9–20
-19–
10-9
–910
–19
20–4
950
–99
100–
199
200–
499
500+
-100
-99–
50-4
9–20
-19–
10-9
–910
–19
20–4
950
–99
100–
199
200–
499
500+
-100
-99–
50-4
9–20
-19–
10-9
–910
–19
20–4
950
–99
100–
199
200–
499
500+
12 12
12
12131411
19 16
8814
14 14
12 1216
20
13
13 1318 16 1616
114 5
15
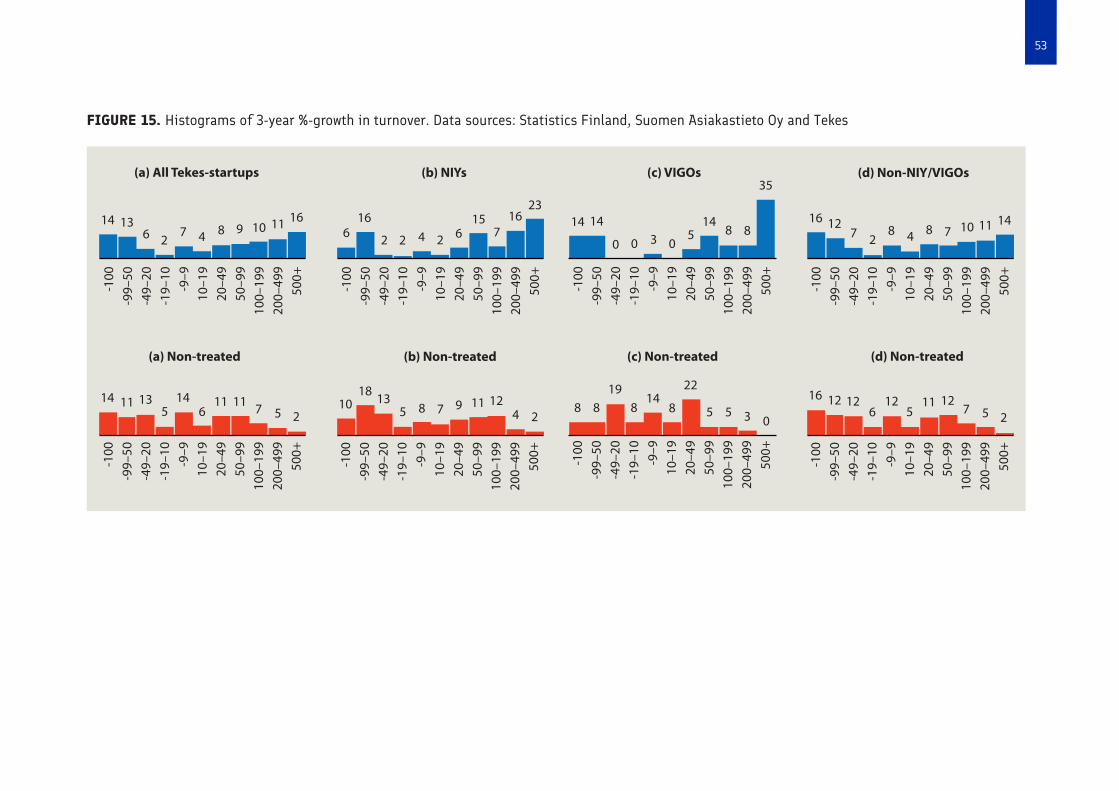
53
FIGURE 15. Histograms of 3-year %-growth in turnover. Data sources: Statistics Finland, Suomen Asiakastieto Oy and Tekes
(a) Non-treated (b) Non-treated (c) Non-treated (d) Non-treated
(c) VIGOs (d) Non-NIY/VIGOs(b) NIYs(a) All Tekes-startups
14 14 14
1414
11 11
11 16
11 136
6 616
7 7
7
8 819 22
8
8
8 82
8 7716 12
8 84
444 8
29
9
11 11
1110
12 1216 12 121213
13
1810
10
5 5 2
2 2 2 615 16 14 14
0 0 3
3
514
35
0
0
23
72
5 5 275655
-100
-99–
50-4
9–20
-19–
10-9
–910
–19
20–4
950
–99
100–
199
200–
499
500+
-100
-99–
50-4
9–20
-19–
10-9
–910
–19
20–4
950
–99
100–
199
200–
499
500+
-100
-99–
50-4
9–20
-19–
10-9
–910
–19
20–4
950
–99
100–
199
200–
499
500+
-100
-99–
50-4
9–20
-19–
10-9
–910
–19
20–4
950
–99
100–
199
200–
499
500+
-100
-99–
50-4
9–20
-19–
10-9
–910
–19
20–4
950
–99
100–
199
200–
499
500+
-100
-99–
50-4
9–20
-19–
10-9
–910
–19
20–4
950
–99
100–
199
200–
499
500+
-100
-99–
50-4
9–20
-19–
10-9
–910
–19
20–4
950
–99
100–
199
200–
499
500+
-100
-99–
50-4
9–20
-19–
10-9
–910
–19
20–4
950
–99
100–
199
200–
499
500+
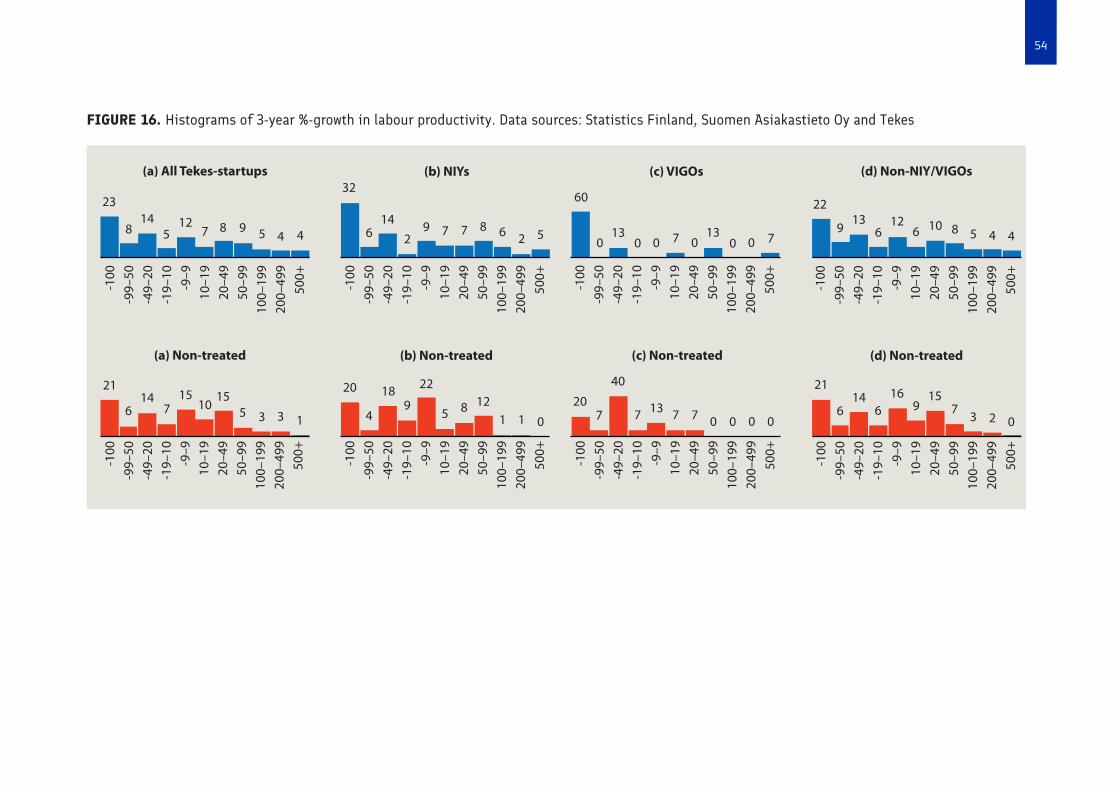
54
FIGURE 16. Histograms of 3-year %-growth in labour productivity. Data sources: Statistics Finland, Suomen Asiakastieto Oy and Tekes
(a) Non-treated (b) Non-treated (c) Non-treated (d) Non-treated
(c) VIGOs (d) Non-NIY/VIGOs(b) NIYs(a) All Tekes-startups
2332
20
14 126
4
14
18
712
8 5 4 49
22139
9
4 48 9 108 5 2
22
2
1
6
1
5
0 7 7 713 7 71516
966
2114
0 3 2 00 0 0
20
40
60
0 0 013 7 713
0 0 07
8
7
55 3 1314
76
2115 15
10
8
12
5 6 6
-100
-99–
50-4
9–20
-19–
10-9
–910
–19
20–4
950
–99
100–
199
200–
499
500+
-100
-99–
50-4
9–20
-19–
10-9
–910
–19
20–4
950
–99
100–
199
200–
499
500+
-100
-99–
50-4
9–20
-19–
10-9
–910
–19
20–4
950
–99
100–
199
200–
499
500+
-100
-99–
50-4
9–20
-19–
10-9
–910
–19
20–4
950
–99
100–
199
200–
499
500+
-100
-99–
50-4
9–20
-19–
10-9
–910
–19
20–4
950
–99
100–
199
200–
499
500+
-100
-99–
50-4
9–20
-19–
10-9
–910
–19
20–4
950
–99
100–
199
200–
499
500+
-100
-99–
50-4
9–20
-19–
10-9
–910
–19
20–4
950
–99
100–
199
200–
499
500+
-100
-99–
50-4
9–20
-19–
10-9
–910
–19
20–4
950
–99
100–
199
200–
499
500+
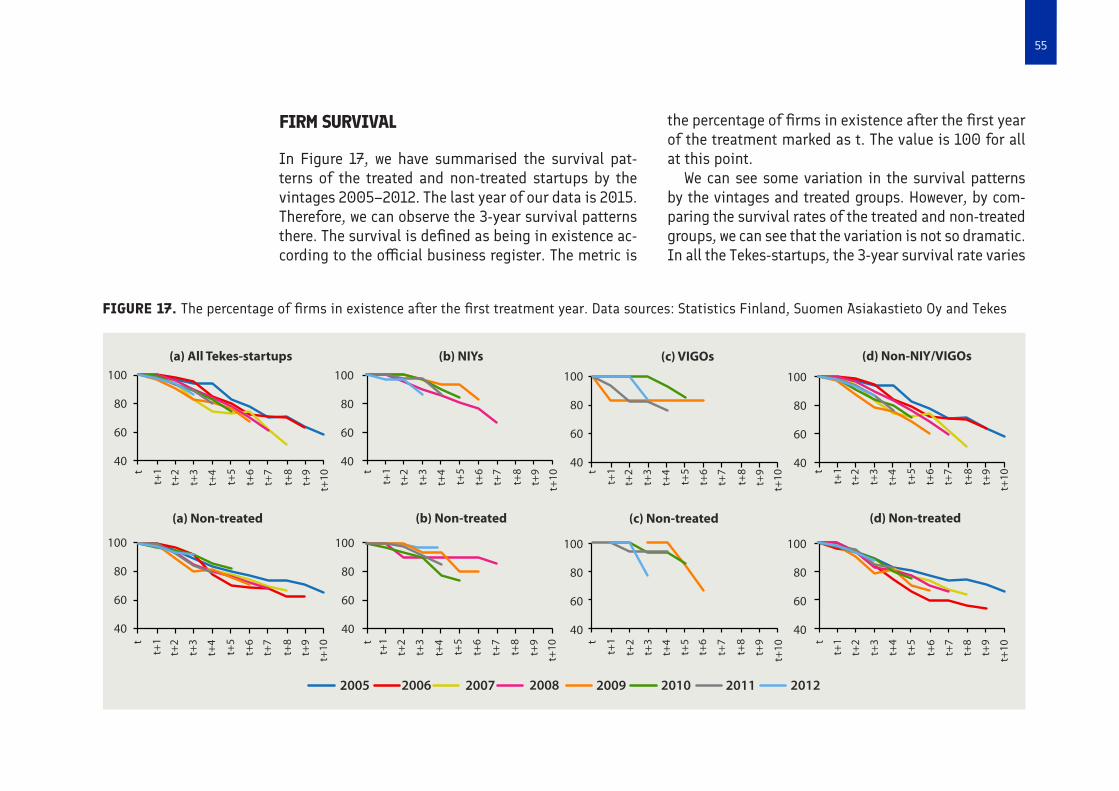
55
FIRM SURVIVAL
In Figure 17, we have summarised the survival pat-terns of the treated and non-treated startups by the vintages 2005–2012. The last year of our data is 2015. Therefore, we can observe the 3-year survival patterns there. The survival is defined as being in existence ac-cording to the official business register. The metric is
the percentage of firms in existence after the first year of the treatment marked as t. The value is 100 for all at this point.
We can see some variation in the survival patterns by the vintages and treated groups. However, by com-paring the survival rates of the treated and non-treated groups, we can see that the variation is not so dramatic. In all the Tekes-startups, the 3-year survival rate varies
2005 2006 2007 2008 2009 2010 2011 2012
(a) Non-treated (b) Non-treated (c) Non-treated (d) Non-treated
(c) VIGOs (d) Non-NIY/VIGOs(b) NIYs(a) All Tekes-startups
t+1
t+2
t+3
t+4
t+5
t+6
t+7
t+8
t+9
t+10 t+1tt
t+1
t+2
t+3
t+4
t+5
t+6
t+7
t+8
t+9
t+10
t
t+1
t+2
t+3
t+4
t+5
t+6
t+7
t+8
t+9
t+10
t
t+1
t+2
t+3
t+4
t+5
t+6
t+7
t+8
t+9
t+10
t
t+1
t+2
t+3
t+4
t+5
t+6
t+7
t+8
t+9
t+10
t
t t
t+2
t+3
t+4
t+5
t+6
t+7
t+8
t+9
t+10 t+1
t+2
t+3
t+4
t+5
t+6
t+7
t+8
t+9
t+10 t+1
t+2
t+3
t+4
t+5
t+6
t+7
t+8
t+9
t+10
100
80
60
40
100
80
60
40
100
80
60
40
100
80
60
40
100
80
60
40
100
80
60
40
100
80
60
40
100
80
60
40
FIGURE 17. The percentage of firms in existence after the first treatment year. Data sources: Statistics Finland, Suomen Asiakastieto Oy and Tekes
56
in the range of 83–94%; this rate is slightly higher than in the non-treated group’s 80–92%. The 5-year survival rates are 73–83% for the treated group and 70–83% for the non-treated group. In the NIYs, the 3-year survival rates vary in the range of 87–97%, and the 5-year sur-vival rates in the range of 81–93%. In the non-treated group, the rates vary in the range of 90–97% (3-year) and 74–91% (5-year), respectively. In the VIGOs, the 3-year survival rates vary in the range of 82–100%, and 5-year survival rates in the range of 83–86%. In the non-treated group, the rates are between 77–100% (3-year) and 83–86% (5-year), respectively. In the non-NIYs/VIGOs, the 3-year survival rates vary in the range of 78–95%, and the 5-year survival rates in the range of 69–83%. In the non-treated group, the rates vary in the range of 78–89% (3-year) and 66–80% (5-year), respectively.
DIFFERENCES IN THE DEGREE OF DIGITALISATION
Utilising digital technology is one potential way to rap-idly expand business. For instance, selling products on-line makes it possible to reach a world-wide customer base. In the following, we compare the utilisation of digitalisation of the treated and non-treated startups
based on the data provided by the Vainu.io Softaware Oy (Vainu). Vainu is a Finnish startup firm that has con-structed a database of the usage of internet technology of all active firms in Finland. It has calculated three in-dexes of digitalisation. First, a total index summarises the digital positions of firms by using tens of variables in calculations. Second, a social media index covers the utilisation of Facebook, Twitter, and others in doing business. Third, a content marketing index depicts the usage of analytics and marketing tools (such as Google Analytics) in business operations.
Figure 18 summarises the results of the digital ori-entation of the treated and non-treated startups. As a general observation, we can see that the treated start-ups score on average higher than the non-treated start-ups in all dimensions measured. In all treated groups, the social media index gets the highest scores of the three indexes. Moreover, it is the index in which the difference between the treated and non-treated firms is the largest in all four comparisons. Comparing the treated groups, the NIYs score the highest index val-ues in all three dimensions and the non-NIYs/VIGOs the lowest. The differences in all index scores between the treated and non-treated startups are also the larg-est in the case of the NIYs and the lowest in the case of non-NIYs/VIGOs.
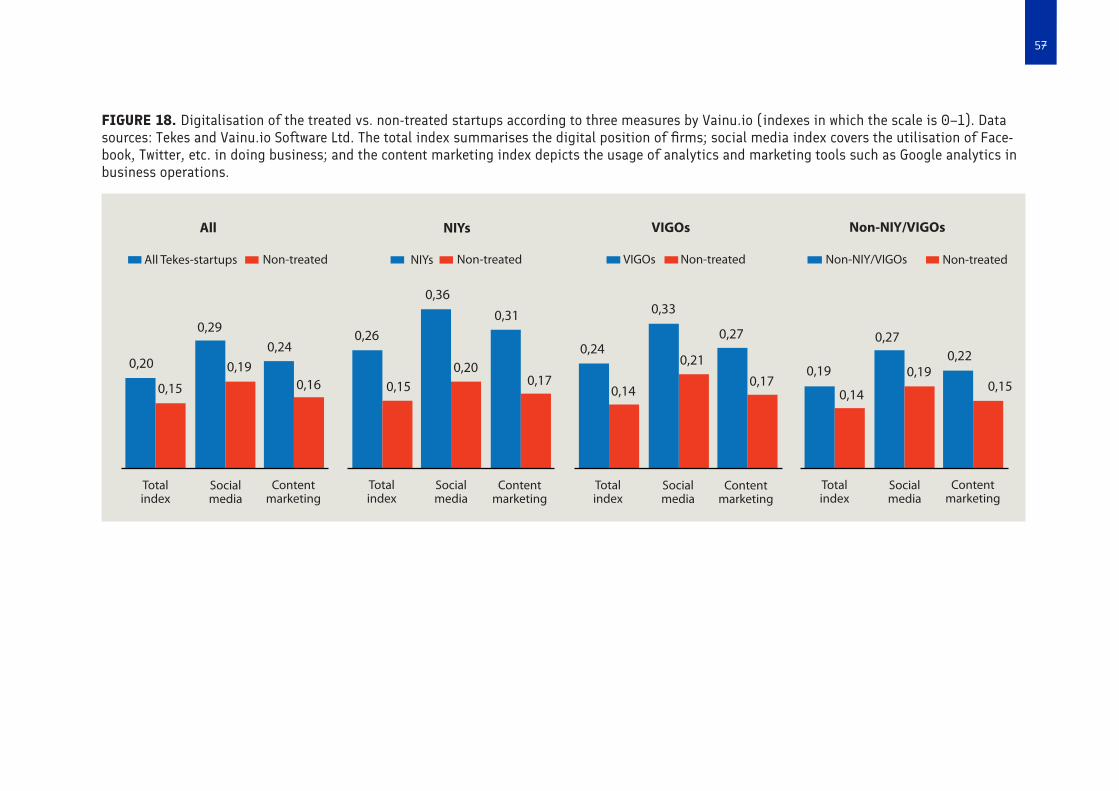
57
FIGURE 18. Digitalisation of the treated vs. non-treated startups according to three measures by Vainu.io (indexes in which the scale is 0–1). Data sources: Tekes and Vainu.io Software Ltd. The total index summarises the digital position of firms; social media index covers the utilisation of Face-book, Twitter, etc. in doing business; and the content marketing index depicts the usage of analytics and marketing tools such as Google analytics in business operations.
VIGOs
VIGOs
Non-NIY/VIGOs
Non-NIY/VIGOs
NIYs
NIYs
All
0,20
0,15 0,16 0,15 0,17 0,17 0,150,14
0,19 0,190,14
0,200,24
0,21
0,270,22
0,27
0,330,31
0,240,26
0,36
0,29
0,19
Non-treated Non-treated Non-treated Non-treatedAll Tekes-startups
Totalindex
Totalindex
Totalindex
Totalindex
Socialmedia
Socialmedia
Socialmedia
Socialmedia
Contentmarketing
Contentmarketing
Contentmarketing
Contentmarketing
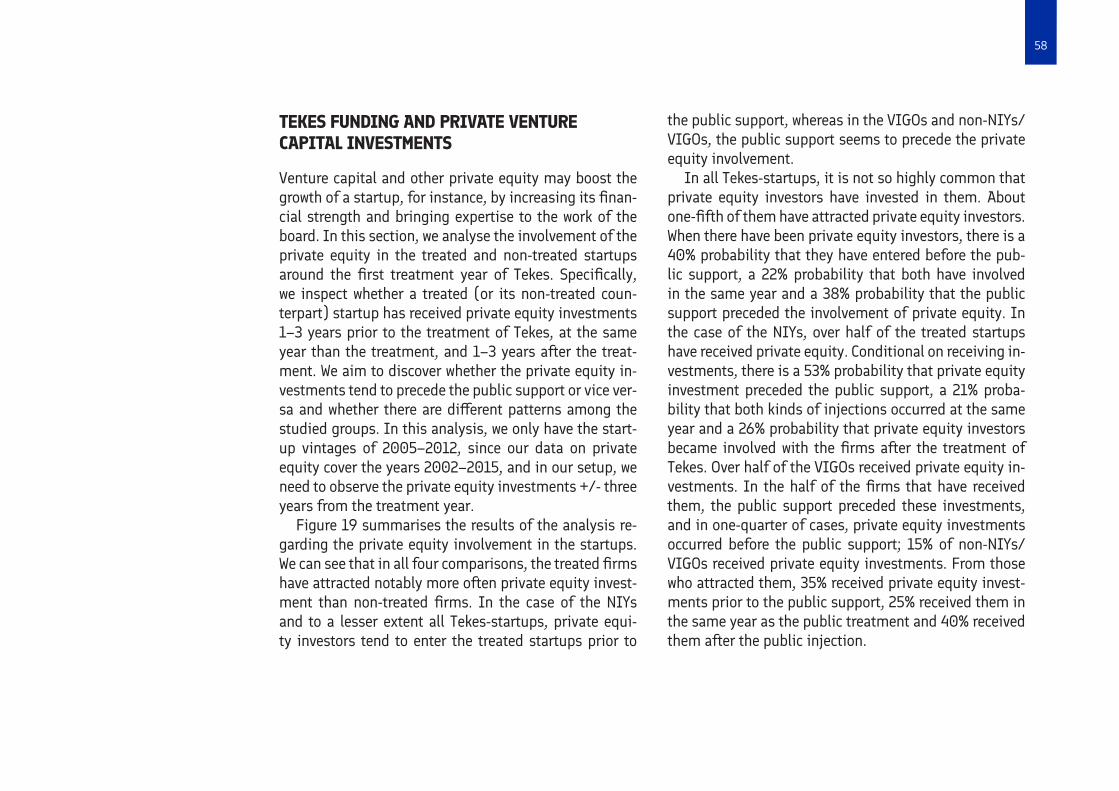
58
TEKES FUNDING AND PRIVATE VENTURE CAPITAL INVESTMENTS
Venture capital and other private equity may boost the growth of a startup, for instance, by increasing its finan-cial strength and bringing expertise to the work of the board. In this section, we analyse the involvement of the private equity in the treated and non-treated startups around the first treatment year of Tekes. Specifically, we inspect whether a treated (or its non-treated coun-terpart) startup has received private equity investments 1–3 years prior to the treatment of Tekes, at the same year than the treatment, and 1–3 years after the treat-ment. We aim to discover whether the private equity in-vestments tend to precede the public support or vice ver-sa and whether there are different patterns among the studied groups. In this analysis, we only have the start-up vintages of 2005–2012, since our data on private equity cover the years 2002–2015, and in our setup, we need to observe the private equity investments +/- three years from the treatment year.
Figure 19 summarises the results of the analysis re-garding the private equity involvement in the startups. We can see that in all four comparisons, the treated firms have attracted notably more often private equity invest-ment than non-treated firms. In the case of the NIYs and to a lesser extent all Tekes-startups, private equi-ty investors tend to enter the treated startups prior to
the public support, whereas in the VIGOs and non-NIYs/VIGOs, the public support seems to precede the private equity involvement.
In all Tekes-startups, it is not so highly common that private equity investors have invested in them. About one-fifth of them have attracted private equity investors. When there have been private equity investors, there is a 40% probability that they have entered before the pub-lic support, a 22% probability that both have involved in the same year and a 38% probability that the public support preceded the involvement of private equity. In the case of the NIYs, over half of the treated startups have received private equity. Conditional on receiving in-vestments, there is a 53% probability that private equity investment preceded the public support, a 21% proba-bility that both kinds of injections occurred at the same year and a 26% probability that private equity investors became involved with the firms after the treatment of Tekes. Over half of the VIGOs received private equity in-vestments. In the half of the firms that have received them, the public support preceded these investments, and in one-quarter of cases, private equity investments occurred before the public support; 15% of non-NIYs/VIGOs received private equity investments. From those who attracted them, 35% received private equity invest-ments prior to the public support, 25% received them in the same year as the public treatment and 40% received them after the public injection.
59
FIGURE 19. The first private equity involvement in the treated vs. non-treated startups regarding the first treatment year. Data sources: Crunchbase Inc., Finnish Venture Capital Association (FVCA) and Tekes
VIGOs
VIGOs
Non-NIY/VIGOs
Non-NIY/VIGOs
NIYs
NIYs
All
Non-treated Non-treated Non-treated Non-treatedAll Tekes-startups
Previous3. years
Previous3. years
Previous3. years
Previous3. years
Sameyear
Sameyear
Sameyear
Sameyear
Fallowing3. years
Fallowing3. years
Fallowing3. years
Fallowing3. years
No VC+/- 3. y.
No VC+/- 3. y.
No VC+/- 3. y.
No VC+/- 3. y.
8,7
78,7
99,8 99,4
48,7
10,8 13,3 14,0 14,0
27,2 28,0
44,0
100 99,5
85,1
8,04,70,10,1 0,60 0 0 0 0 00,1
6,03,80,45,2
0
60
CONCLUDING REMARKS FROM THE ECONOMETRIC ANALYSIS
Startups funded by Tekes tend to grow more rapidly in terms of employment and turnover than their non-treat-ed counterparts. With respect to the growth of labour productivity, the differences between the treated and non-treated startups are less clear and seem to occur lat-er than when looking at differences in employment and turnover development. We also observed more disper-sion in the growth distributions in the treated startups than in the non-treated startups. We take this observa-tion as an indication that Tekes takes risks in their fund-ing decisions; it supports the view that public support has been allocated to projects in which social returns may exceed private returns.
Startups funded by Tekes do not have significantly higher survival ratios than their non-funded counter-parts. For instance, in all Tekes-startups, the 5-year sur-vival ratio varies based on the vintage in the range of
73–83% and in the non-treated startups in the range of 70–83%. In addition to higher dispersion of growth dis-tributions, this outcome also hints that Tekes funding decisions are not based on emphasizing low-risk proj-ects that could receive funding also directly from finan-cial markets.
Furthermore, we have found that Tekes-startups use more widely digital technology in their businesses than their non-treated counterparts. The NIYs have in this re-spect the highest scores both in terms of utilizing social media and content marketing.
About one-fifth of all Tekes-startups and half of NIYs and VIGOs have received private equity investments around the 3-year period regarding the first treatment year by Tekes. In the case of NIYs, private equity in-vestors tended to be in the startup before it received its initial funding from Tekes. In the VIGOs and non-NIYs/VIGOs, it was more likely that Tekes funding preceded the involvement of private equity investments.
61
EVIDENCE FROM THE SURVEYS
SUMMARY OF MAIN FINDINGS
Analysis of startup companies that have engaged with Tekes, and companies that participated in Tekes’ Young Innovative Companies (NIY) programme that responded to the impact assessment surveys revealed the following:
• The greatest percentage of startup respondents attributed positive impact on their strategic exper-tise, product offerings, and on their investments in research, development or innovation.
• The greatest percentage of NIY programme respondents attributed positive impact on their ability to sell into new markets, and their ability to acquire new international customers.
• Tekes impacts companies to a greater degree that have: – received both financial and non-financial support from Tekes or through NIY, – used Tekes’ non-financial support services to a greater degree, – received €500 thousand or more in funding from Tekes, or through NIY – have clear and ambitious growth plans, – derive 75% or more of their annual revenues from international markets, – have completed the NIY programme, or are still in the programme.
• Survey results from 2017 indicate that Tekes’ NIY programme is having greater impact on companies’ capabilities than it did in 2013, likely due to programme changes that have been implemented within that timespan.
62
APPROACH AND METHODOLOGY
Tekes works with thousands of young, fledgling com-panies, referred to as ‘startup’ companies, to help them grow and succeed, through provision of both financial (grants and loans) and non-financial (e.g., mentoring, and connections with investors) support. Of these start-ups, Tekes selects the highest performing, most inno-vative companies to participate in its Young Innovative Companies (NIY) programme. The NIY programme of-fers financial and non-financial support that is focused on boosting the international reach of these selected companies (e.g., their ability to enter into new geograph-ical markets, acquire new international customers, etc.), thereby enhancing their competitiveness on a global scale. The high-performing, high-end NIY programme is geared towards companies that have already invest-ed in research and development (R&D), have developed products, have a domestic marketplace presence, are ex-tending themselves to international markets, and are re-ceiving money from Tekes to make this happen. Startups that may aspire to the NIY programme are less devel-oped and are more focused on using funds from Tekes for internal improvements, such as hiring personnel, in-vesting in R&D, and creating new products or processes, as opposed to immediately positioning themselves as strong competitors in the (global) marketplace. Due to their more intensive engagement with Tekes, NIY partic-ipants tend to attribute greater positive impact to Tekes than startup companies.
Through a unique methodology developed by The Evidence Network Inc. (TEN) that is consistent with the Tekes logic model, we assessed the impact of Tekes and its NIY programme on companies’ shorter-term capabil-ities, and longer-term performance, which is achieved through the financial and non-financial support offered by Tekes to clients. We created impact assessment sur-veys – one for startups and one for NIY programme par-ticipants − containing carefully selected measures of company capabilities and company performance that best align with Tekes’ goals for its clients. Impact on companies’ capabilities is the short-term, direct impact, of Tekes and its NIY programme. This impact on com-panies’ capabilities leads to longer-term, indirect im-pact, on the performance of companies. In September 2017, we administered impact assessment surveys to 2,432 startups, and to 242 NIY programme participants. Of these, 992 startups, and 99 NIY programme partic-ipants responded, yielding response rates of 41% for both groups. It is important to note that the following results capture data only from the subset of companies that responded to the surveys.
“Great support for Finnish companies to build inter-national business.” – NIY Participant

63
PROFILE OF SURVEY RESPONDENT COMPANIES
Profiles of the companies that responded to the sur-veys were created, and Table 7 displays a comparison of selected demographics and selected performance measures of startups with NIY programme participants. When considering the demographics in Table 7, we can see that compared to startups, the majority of NIY pro-gramme participants are older (were founded in 2010 or earlier), larger (have more than 10 full-time staff), generate annual revenues of €1 million or more, oper-ate in the information and communications technolo-gies (ICT) sector, and are more solidly entrenched in the international marketplace (derive 50% or more of their annual revenues from international markets).
Table 7 also shows us that the majority of startups and NIY programme participants share the following similar attributes: they first engaged with Tekes or participat-ed in the NIY programme in more recent years (2013 or later), received only financial support from Tekes, are privately owned, business-to-business (B2B) compa-nies, have clear and ambitious growth plans, revenues are one of their most important sources of financing, and they have entered into new European markets since first engagement with Tekes, or participation in the NIY programme.
When considering the performance measures in Table 7, we can see that a greater proportion of NIY partici-pants are experiencing substantive positive changes to
their performance, as compared to startups, for all list-ed performance measures, except for investments in R&D. Since the majority of startups are less developed companies, they do not yet have the capacity for large changes in many of their longer-term performance mea-sures, especially those relating to internationalisation (e.g., annual revenues from international markets, and new international customers), and are instead more fo-cused on internal improvements (e.g., investments in R&D, and employment). NIY participants are more es-tablished and have a stronger foothold in the market-place, as compared to startups, and are therefore better equipped to make changes to their longer-term perfor-mance. Further, since the NIY programme focuses on bolstering the international presence of its clients, we expect to see greater changes than startups in those performance measures that pertain to internationali-sation.
Table 7 also shows us that NIY programme partici-pants are attributing higher levels of positive impact to Tekes on their ability to make positive changes to their performance, as compared to startups, for all measures in Table 7, again, except for R&D investments. More in-tense engagement of Tekes with its NIY clients explains this difference. However, it is important to note those startup companies that are making changes to their per-formance are attributing Tekes with positive impact on their ability to do so, which reinforces Tekes’ integral role in their development.
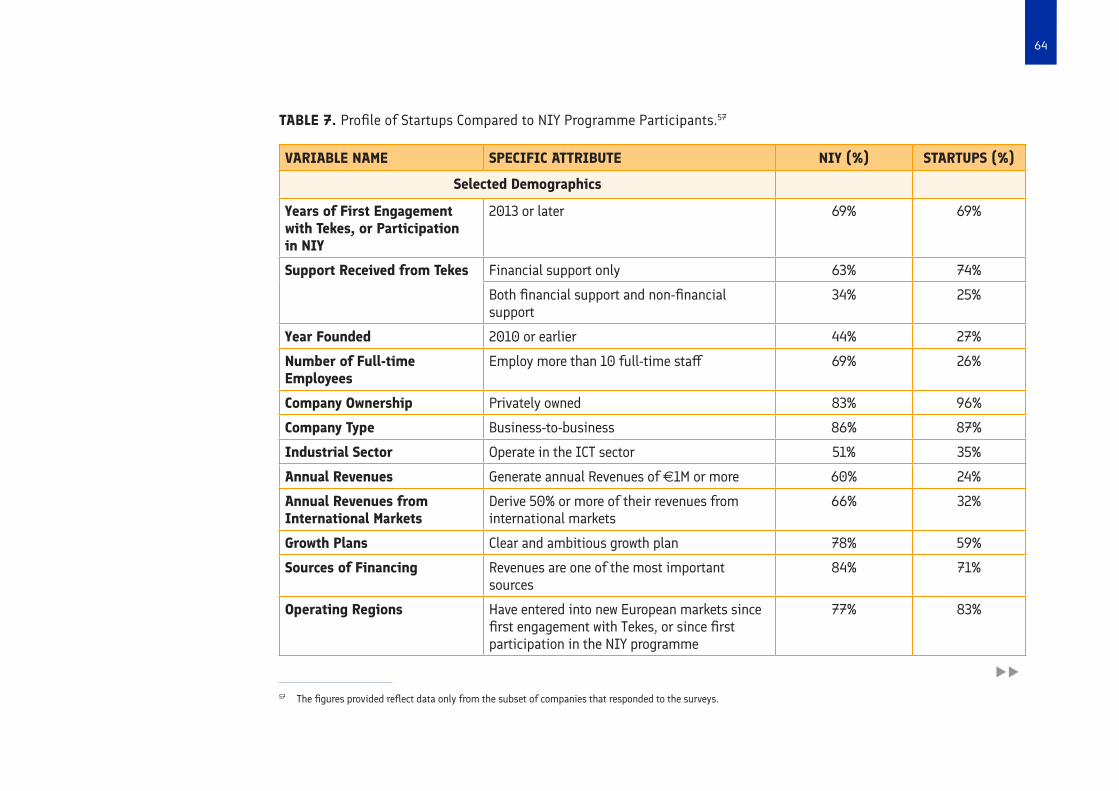
64
TABLE 7. Profile of Startups Compared to NIY Programme Participants.57
VARIABLE NAME SPECIFIC ATTRIBUTE NIY (%) STARTUPS (%)
Selected Demographics
Years of First Engagement with Tekes, or Participation in NIY
2013 or later 69% 69%
Support Received from Tekes Financial support only 63% 74%
Both financial support and non-financial support
34% 25%
Year Founded 2010 or earlier 44% 27%
Number of Full-time Employees
Employ more than 10 full-time staff 69% 26%
Company Ownership Privately owned 83% 96%
Company Type Business-to-business 86% 87%
Industrial Sector Operate in the ICT sector 51% 35%
Annual Revenues Generate annual Revenues of e1M or more 60% 24%
Annual Revenues from International Markets
Derive 50% or more of their revenues from international markets
66% 32%
Growth Plans Clear and ambitious growth plan 78% 59%
Sources of Financing Revenues are one of the most important sources
84% 71%
Operating Regions Have entered into new European markets since first engagement with Tekes, or since first participation in the NIY programme
77% 83%
uu
57 The figures provided reflect data only from the subset of companies that responded to the surveys.
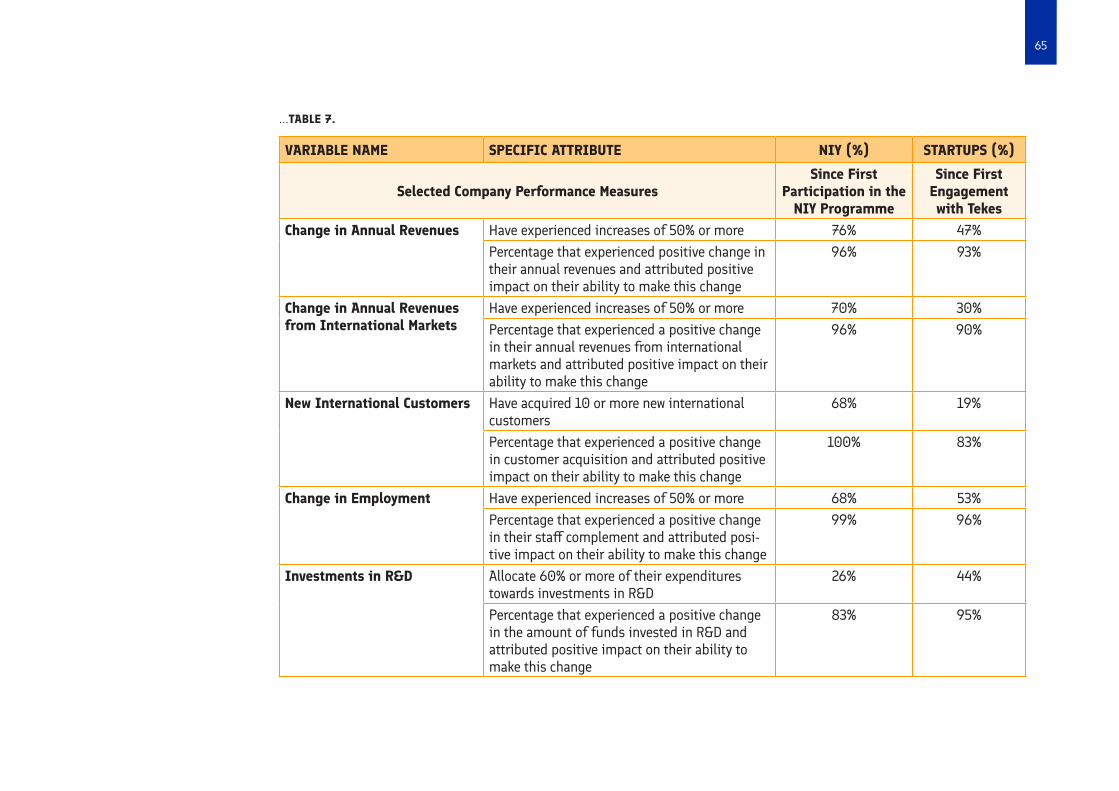
65
VARIABLE NAME SPECIFIC ATTRIBUTE NIY (%) STARTUPS (%)
Selected Company Performance MeasuresSince First
Participation in the NIY Programme
Since First Engagement with Tekes
Change in Annual Revenues Have experienced increases of 50% or more 76% 47%Percentage that experienced positive change in their annual revenues and attributed positive impact on their ability to make this change
96% 93%
Change in Annual Revenues from International Markets
Have experienced increases of 50% or more 70% 30%Percentage that experienced a positive change in their annual revenues from international markets and attributed positive impact on their ability to make this change
96% 90%
New International Customers Have acquired 10 or more new international customers
68% 19%
Percentage that experienced a positive change in customer acquisition and attributed positive impact on their ability to make this change
100% 83%
Change in Employment Have experienced increases of 50% or more 68% 53%Percentage that experienced a positive change in their staff complement and attributed posi-tive impact on their ability to make this change
99% 96%
Investments in R&D Allocate 60% or more of their expenditures towards investments in R&D
26% 44%
Percentage that experienced a positive change in the amount of funds invested in R&D and attributed positive impact on their ability to make this change
83% 95%
...TABLE 7.
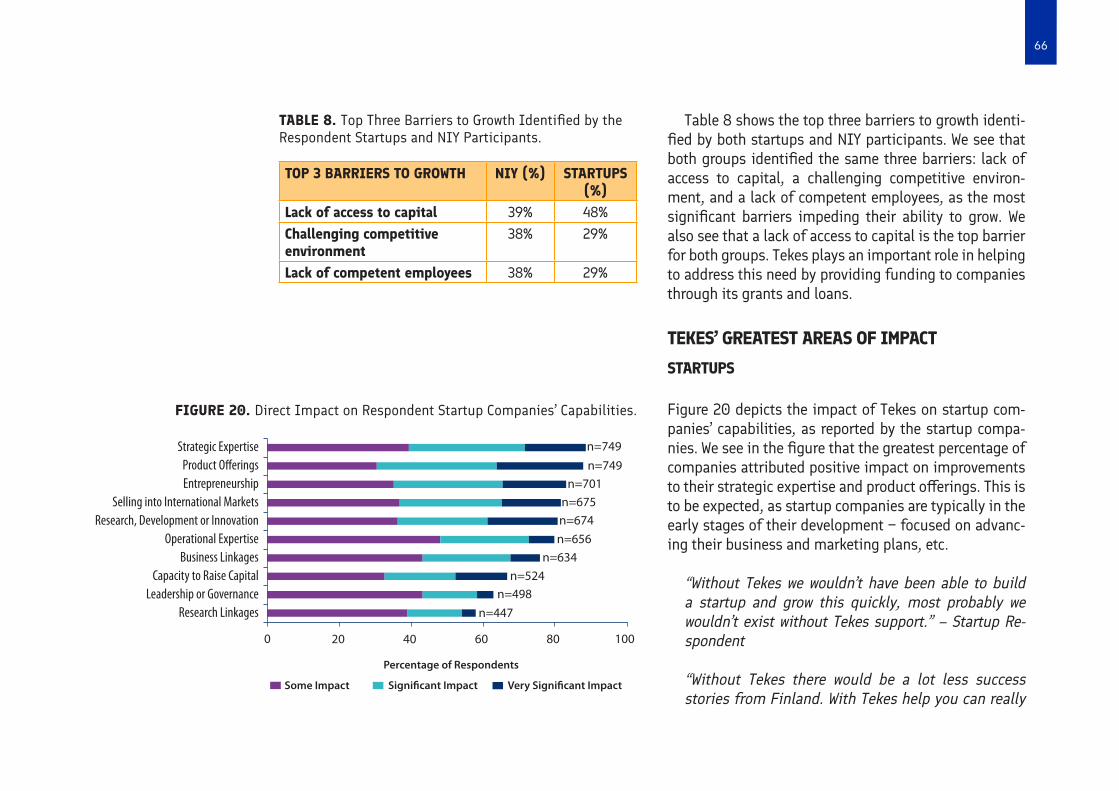
66
TOP 3 BARRIERS TO GROWTH NIY (%) STARTUPS (%)
Lack of access to capital 39% 48%Challenging competitive environment
38% 29%
Lack of competent employees 38% 29%
Table 8 shows the top three barriers to growth identi-fied by both startups and NIY participants. We see that both groups identified the same three barriers: lack of access to capital, a challenging competitive environ-ment, and a lack of competent employees, as the most significant barriers impeding their ability to grow. We also see that a lack of access to capital is the top barrier for both groups. Tekes plays an important role in helping to address this need by providing funding to companies through its grants and loans.
TEKES’ GREATEST AREAS OF IMPACT
STARTUPS
Figure 20 depicts the impact of Tekes on startup com-panies’ capabilities, as reported by the startup compa-nies. We see in the figure that the greatest percentage of companies attributed positive impact on improvements to their strategic expertise and product offerings. This is to be expected, as startup companies are typically in the early stages of their development − focused on advanc-ing their business and marketing plans, etc.
“Without Tekes we wouldn’t have been able to build a startup and grow this quickly, most probably we wouldn’t exist without Tekes support.” – Startup Re-spondent
“Without Tekes there would be a lot less success stories from Finland. With Tekes help you can really
TABLE 8. Top Three Barriers to Growth Identified by the Respondent Startups and NIY Participants.
FIGURE 20. Direct Impact on Respondent Startup Companies’ Capabilities.
Some Impact
Percentage of Respondents
0 20 40 60 80
n=749
n=749
n=701
n=675
n=674
n=656
n=634
n=524
n=498
n=447
100
Significant Impact Very Significant Impact
Strategic ExpertiseProduct OfferingsEntrepreneurship
Selling into International MarketsResearch, Development or Innovation
Operational ExpertiseBusiness Linkages
Capacity to Raise CapitalLeadership or Governance
Research Linkages
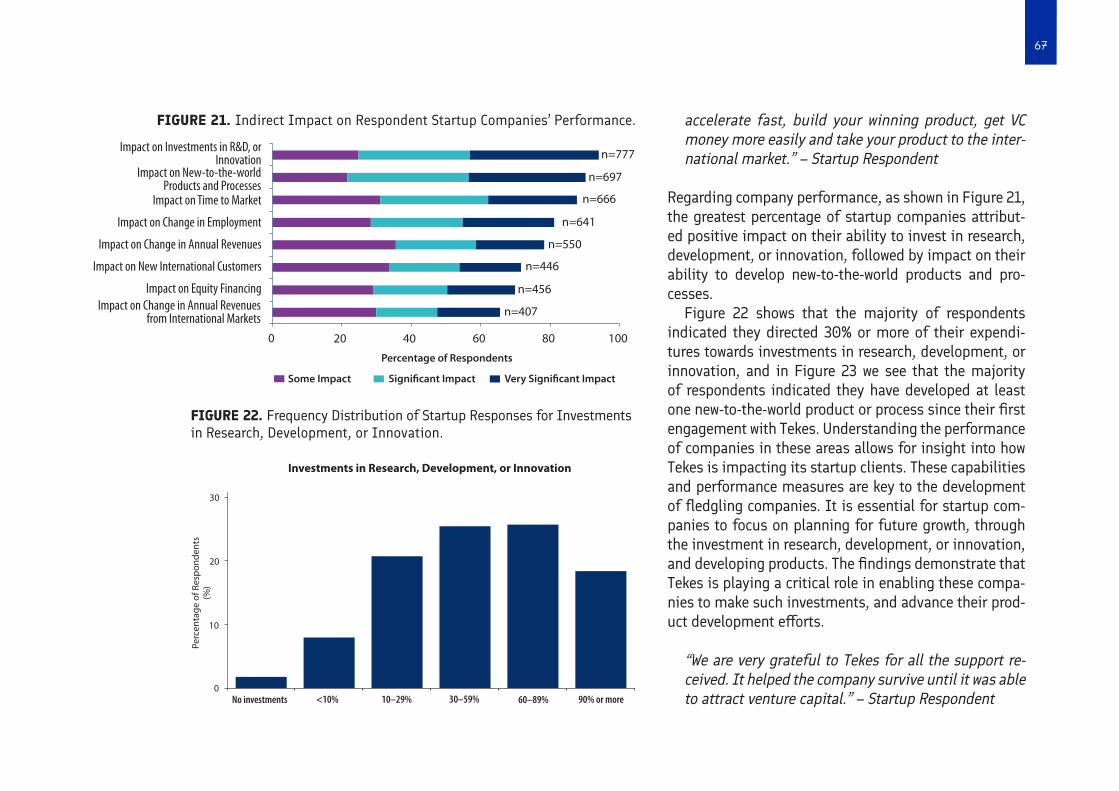
67
FIGURE 21. Indirect Impact on Respondent Startup Companies’ Performance.
Some Impact
Percentage of Respondents
0 20 40 60 80 100
Significant Impact Very Significant Impact
n=777
n=697
n=666
n=641
n=550
n=446
n=456
n=407
Impact on Investments in R&D, or Innovation
Impact on Time to Market
Impact on Change in Employment
Impact on Change in Annual Revenues
Impact on New International Customers
Impact on Equity Financing
Impact on New-to-the-world Products and Processes
Impact on Change in Annual Revenuesfrom International Markets
accelerate fast, build your winning product, get VC money more easily and take your product to the inter-national market.” – Startup Respondent
Regarding company performance, as shown in Figure 21, the greatest percentage of startup companies attribut-ed positive impact on their ability to invest in research, development, or innovation, followed by impact on their ability to develop new-to-the-world products and pro-cesses.
Figure 22 shows that the majority of respondents indicated they directed 30% or more of their expendi-tures towards investments in research, development, or innovation, and in Figure 23 we see that the majority of respondents indicated they have developed at least one new-to-the-world product or process since their first engagement with Tekes. Understanding the performance of companies in these areas allows for insight into how Tekes is impacting its startup clients. These capabilities and performance measures are key to the development of fledgling companies. It is essential for startup com-panies to focus on planning for future growth, through the investment in research, development, or innovation, and developing products. The findings demonstrate that Tekes is playing a critical role in enabling these compa-nies to make such investments, and advance their prod-uct development efforts.
“We are very grateful to Tekes for all the support re-ceived. It helped the company survive until it was able to attract venture capital.” – Startup Respondent
FIGURE 22. Frequency Distribution of Startup Responses for Investments in Research, Development, or Innovation.
<10%No investments
Investments in Research, Development, or Innovation
0
10
Perc
enta
ge o
f Res
pon
den
ts
(%)
20
30
10–29% 30–59% 60–89% 90% or more
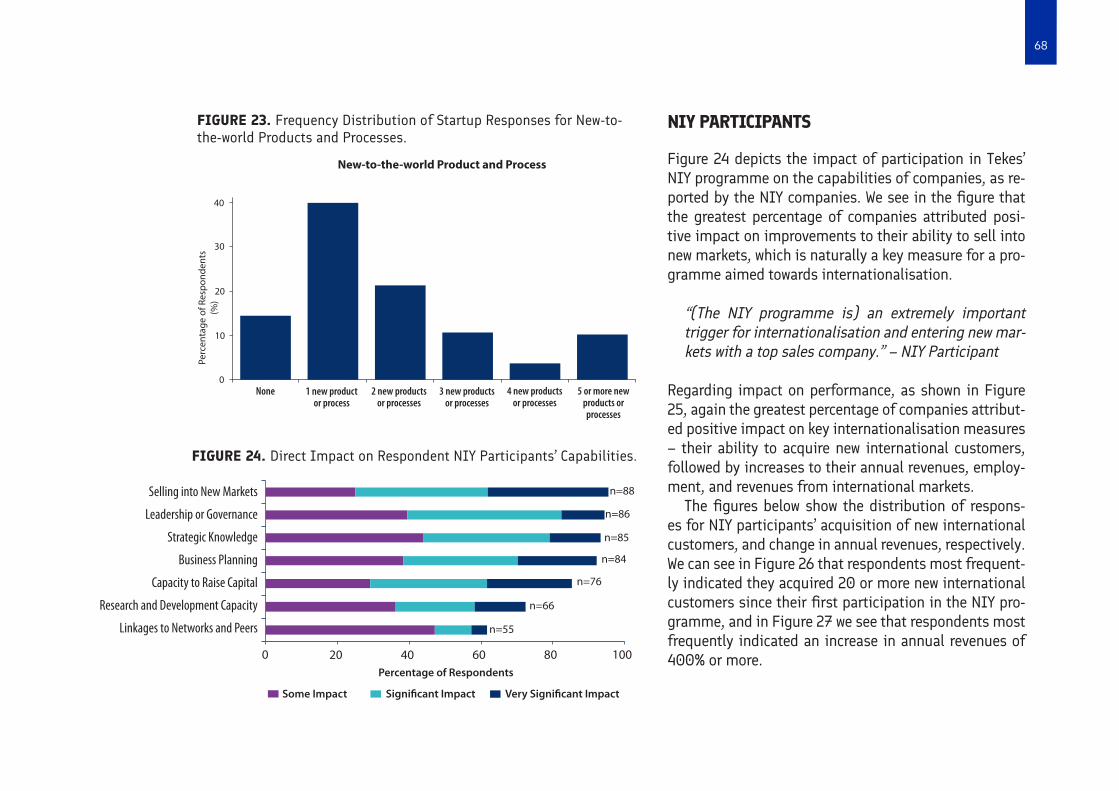
68
NIY PARTICIPANTS
Figure 24 depicts the impact of participation in Tekes’ NIY programme on the capabilities of companies, as re-ported by the NIY companies. We see in the figure that the greatest percentage of companies attributed posi-tive impact on improvements to their ability to sell into new markets, which is naturally a key measure for a pro-gramme aimed towards internationalisation.
“(The NIY programme is) an extremely important trigger for internationalisation and entering new mar-kets with a top sales company.” – NIY Participant
Regarding impact on performance, as shown in Figure 25, again the greatest percentage of companies attribut-ed positive impact on key internationalisation measures – their ability to acquire new international customers, followed by increases to their annual revenues, employ-ment, and revenues from international markets.
The figures below show the distribution of respons-es for NIY participants’ acquisition of new international customers, and change in annual revenues, respectively. We can see in Figure 26 that respondents most frequent-ly indicated they acquired 20 or more new international customers since their first participation in the NIY pro-gramme, and in Figure 27 we see that respondents most frequently indicated an increase in annual revenues of 400% or more.
0
10
Perc
enta
ge o
f Res
pond
ents
(%
)
20
30
40
None 1 new productor process
New-to-the-world Product and Process
2 new productsor processes
3 new productsor processes
4 new productsor processes
5 or more new products orprocesses
Some Impact
Percentage of Respondents
0 20 40 60 80 100
Significant Impact Very Significant Impact
Selling into New Markets
Leadership or Governance
Strategic Knowledge
Business Planning
Capacity to Raise Capital
Research and Development Capacity
Linkages to Networks and Peers
n=88
n=86
n=85
n=84
n=76
n=66
n=55
FIGURE 23. Frequency Distribution of Startup Responses for New-to-the-world Products and Processes.
FIGURE 24. Direct Impact on Respondent NIY Participants’ Capabilities.
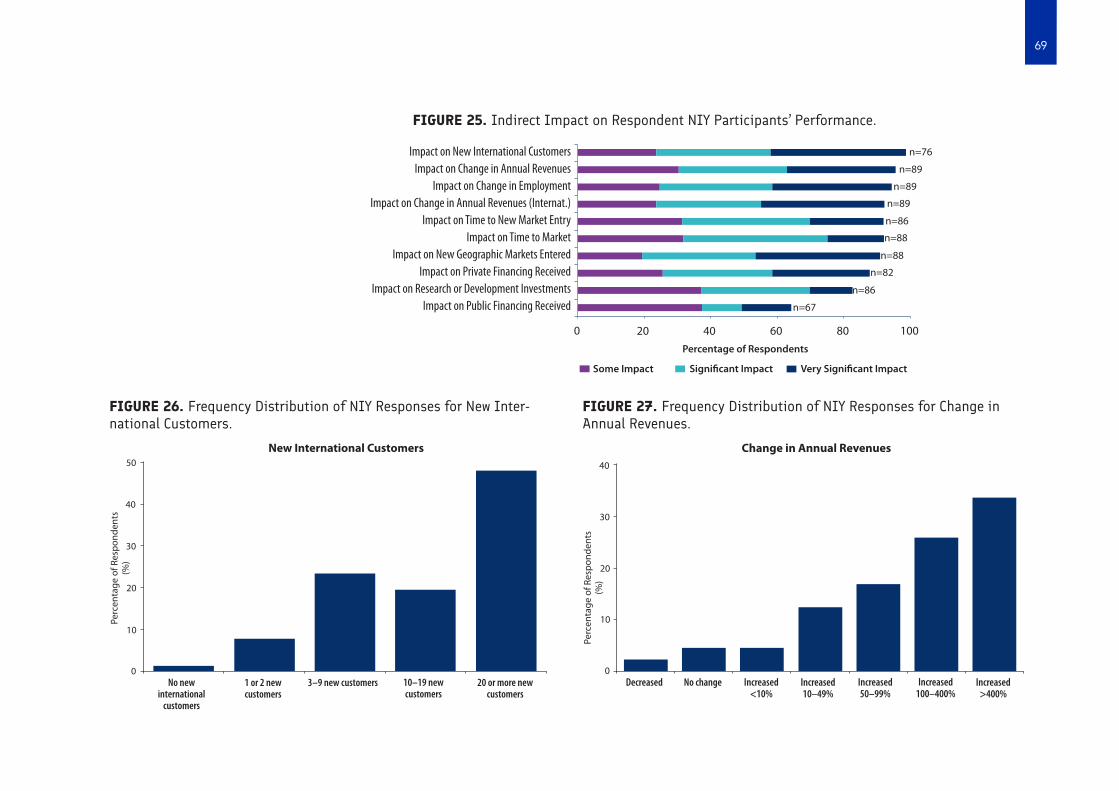
69
FIGURE 25. Indirect Impact on Respondent NIY Participants’ Performance.
Some Impact
Percentage of Respondents
0 20 40 60 80 100
Significant Impact Very Significant Impact
Impact on New International CustomersImpact on Change in Annual Revenues
Impact on Change in EmploymentImpact on Change in Annual Revenues (Internat.)
Impact on Time to New Market EntryImpact on Time to Market
Impact on New Geographic Markets EnteredImpact on Private Financing Received
Impact on Research or Development InvestmentsImpact on Public Financing Received
n=86
n=86
n=67
n=88
n=88
n=82
n=89
n=89
n=89
n=76
0
10
Perc
enta
ge o
f Res
pon
den
ts
(%)
20
30
40
50
1 or 2 newcustomers
No newinternational
customers
New International Customers
3–9 new customers 10–19 newcustomers
20 or more newcustomers
0
10
Perc
enta
ge o
f Res
pon
den
ts
(%)
20
30
40
No change
Change in Annual Revenues
Decreased Increased10–49%
Increased50–99%
Increased100–400%
Increased>400%
Increased<10%
FIGURE 26. Frequency Distribution of NIY Responses for New Inter-national Customers.
FIGURE 27. Frequency Distribution of NIY Responses for Change in Annual Revenues.
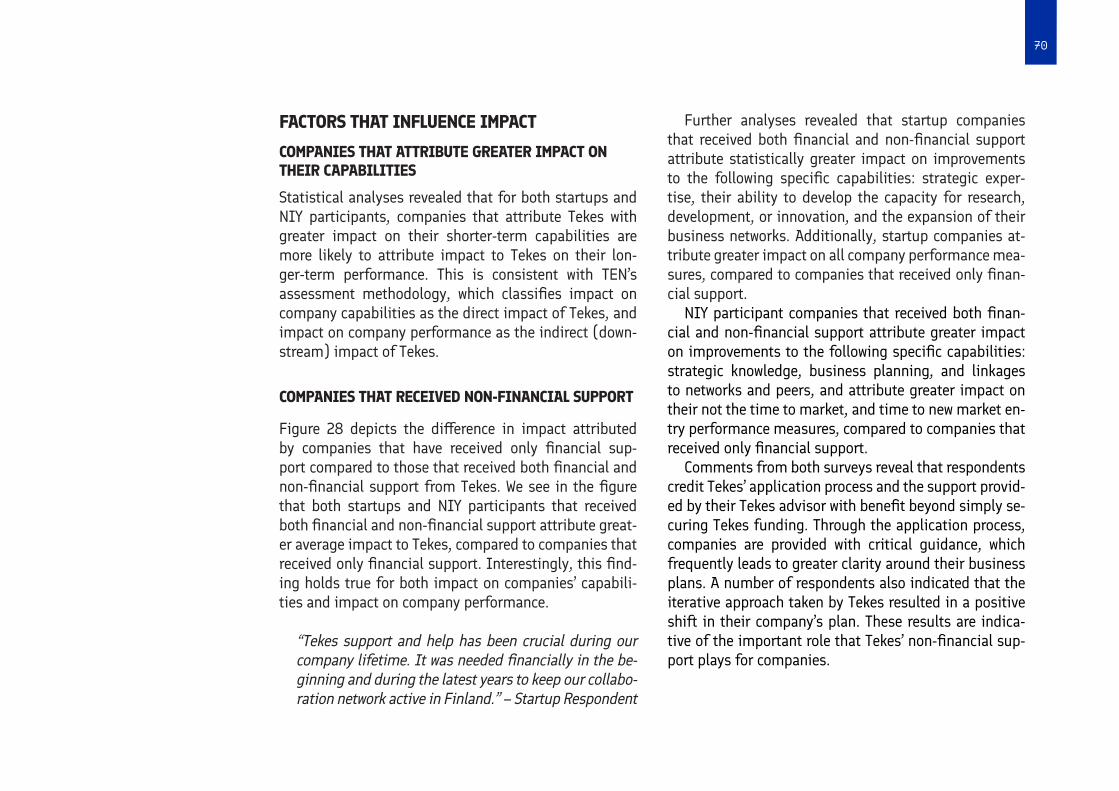
70
FACTORS THAT INFLUENCE IMPACT
COMPANIES THAT ATTRIBUTE GREATER IMPACT ON THEIR CAPABILITIES
Statistical analyses revealed that for both startups and NIY participants, companies that attribute Tekes with greater impact on their shorter-term capabilities are more likely to attribute impact to Tekes on their lon-ger-term performance. This is consistent with TEN’s assessment methodology, which classifies impact on company capabilities as the direct impact of Tekes, and impact on company performance as the indirect (down-stream) impact of Tekes.
COMPANIES THAT RECEIVED NON-FINANCIAL SUPPORT
Figure 28 depicts the difference in impact attributed by companies that have received only financial sup-port compared to those that received both financial and non-financial support from Tekes. We see in the figure that both startups and NIY participants that received both financial and non-financial support attribute great-er average impact to Tekes, compared to companies that received only financial support. Interestingly, this find-ing holds true for both impact on companies’ capabili-ties and impact on company performance.
“Tekes support and help has been crucial during our company lifetime. It was needed financially in the be-ginning and during the latest years to keep our collabo-ration network active in Finland.” – Startup Respondent
Further analyses revealed that startup companies that received both financial and non-financial support attribute statistically greater impact on improvements to the following specific capabilities: strategic exper-tise, their ability to develop the capacity for research, development, or innovation, and the expansion of their business networks. Additionally, startup companies at-tribute greater impact on all company performance mea-sures, compared to companies that received only finan-cial support.
NIY participant companies that received both finan-cial and non-financial support attribute greater impact on improvements to the following specific capabilities: strategic knowledge, business planning, and linkages to networks and peers, and attribute greater impact on their not the time to market, and time to new market en-try performance measures, compared to companies that received only financial support.
Comments from both surveys reveal that respondents credit Tekes’ application process and the support provid-ed by their Tekes advisor with benefit beyond simply se-curing Tekes funding. Through the application process, companies are provided with critical guidance, which frequently leads to greater clarity around their business plans. A number of respondents also indicated that the iterative approach taken by Tekes resulted in a positive shift in their company’s plan. These results are indica-tive of the important role that Tekes’ non-financial sup-port plays for companies.

71
Further analyses show the general trend of an in-crease in average attributed impact with greater degree of use of three of Tekes’ key non-financial support ser-vices: mentoring, connections with investors, and con-nections with business advisors or board of directors’ members. Startups and NIY participants that used Te-
kes’ non-financial support services to a greater degree attribute greater average impact to Tekes on improve-ments to their capabilities and performance. Addition-ally, startups and NIY participants attributed greater impact on their performance, compared to their capa-bilities. While these results are suggestive, they are not compelling. In the experience of The Evidence Network, there is an opportunity for Tekes to enhance its impact by engendering greater use of non-financial services, as we typically find stronger association between inten-sity of use of non-financial services and impact.
COMPANIES THAT RECEIVED MORE FINANCIAL SUPPORT
As shown in Figure 29, companies that received €500 thousand or more in financial support directly from Te-kes, or through its NIY programme, attribute greater average impact on their capabilities and performance. Further statistical analyses revealed that startup com-panies that received greater financial support through Tekes attributed greater impact on their ability to: cre-ate jobs, increase annual revenues derived from interna-tional markets, develop new-to-the-world products and processes, acquire new international customers, and raise equity financing. Additionally, NIY participants that received greater financial support through the NIY programme attribute greater impact on their ability to acquire new international customers.
Wei
ghte
d A
vera
ge Im
pac
t*A
ttrib
uted
to T
ekes
5
6
6.1
6.5
Differences significant at the 95% confidence level
Differences significant at the 99% confidence level
Differences significant at the 99% confidence level Differences significant at
the 99% confidence level
6.8
6.2
7.37.1
5.6
NIY NIYStartups Startups
PerformanceCapabilities
5.8
7
8
*Impact is measured on a scale of 0 to 10 using the following weights: 'Negative impact' 0, No impact' 2.5, 'Some impact' 5.0, 'Significant impact' 7.5, 'Very significant impact' 10.0.
The values reported in the chart are averages that were calculated across all respondents.
NIY: Only Financial Support (n=62)Startups: Only Financial Support (n=722)
NIY: Both Financial and Non-financial Support (n=33)Startups: Both Financial and Non-financial Support (n=244)
FIGURE 28. Average Impact Attributed by Respondent Startups and NIY Participants According to Type of Support.
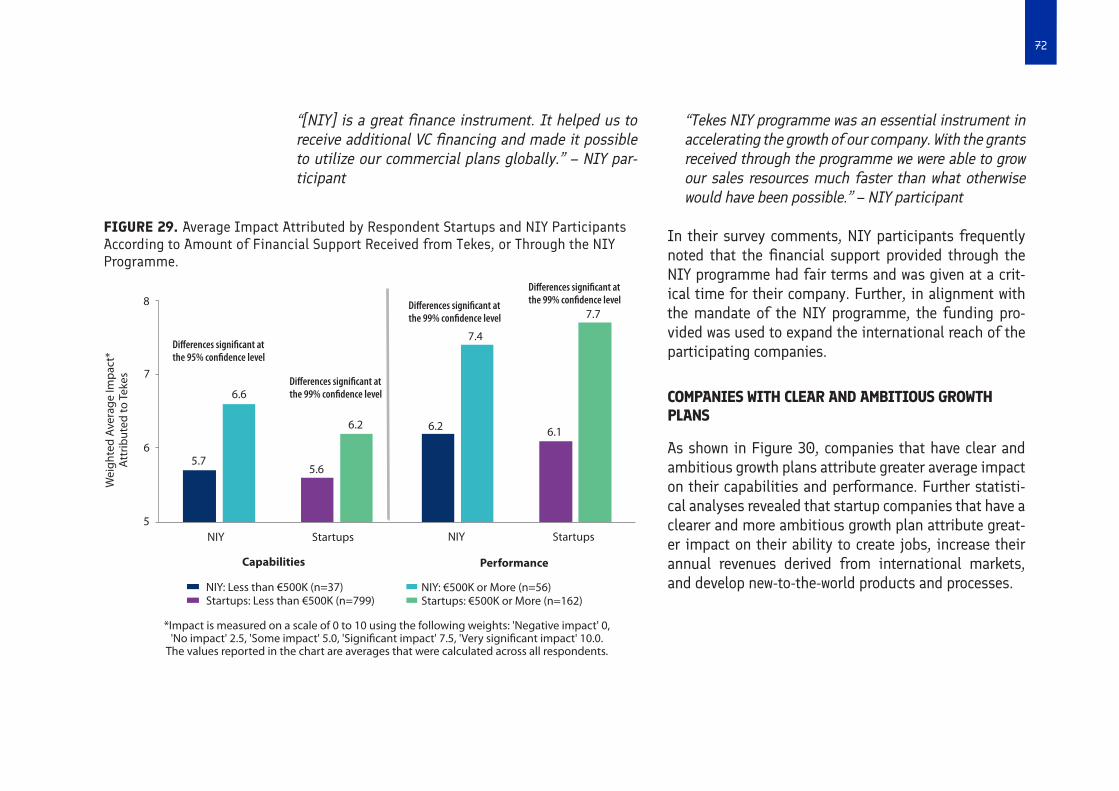
72
“[NIY] is a great finance instrument. It helped us to receive additional VC financing and made it possible to utilize our commercial plans globally.” – NIY par-ticipant
“Tekes NIY programme was an essential instrument in accelerating the growth of our company. With the grants received through the programme we were able to grow our sales resources much faster than what otherwise would have been possible.” – NIY participant
In their survey comments, NIY participants frequently noted that the financial support provided through the NIY programme had fair terms and was given at a crit-ical time for their company. Further, in alignment with the mandate of the NIY programme, the funding pro-vided was used to expand the international reach of the participating companies.
COMPANIES WITH CLEAR AND AMBITIOUS GROWTH PLANS
As shown in Figure 30, companies that have clear and ambitious growth plans attribute greater average impact on their capabilities and performance. Further statisti-cal analyses revealed that startup companies that have a clearer and more ambitious growth plan attribute great-er impact on their ability to create jobs, increase their annual revenues derived from international markets, and develop new-to-the-world products and processes.
Wei
ghte
d A
vera
ge Im
pac
t*A
ttrib
uted
to T
ekes
NIY NIYStartups Startups
PerformanceCapabilities
Differences significant atthe 95% confidence level
Differences significant at the 99% confidence level
Differences significant atthe 99% confidence level
Differences significant atthe 99% confidence level
7.7
7.4
6.16.26.2
6.6
5.65.7
5
6
7
8
*Impact is measured on a scale of 0 to 10 using the following weights: 'Negative impact' 0, 'No impact' 2.5, 'Some impact' 5.0, 'Significant impact' 7.5, 'Very significant impact' 10.0.
The values reported in the chart are averages that were calculated across all respondents.
NIY: €500K or More (n=56)Startups: €500K or More (n=162)
NIY: Less than €500K (n=37)Startups: Less than €500K (n=799)
FIGURE 29. Average Impact Attributed by Respondent Startups and NIY Participants According to Amount of Financial Support Received from Tekes, or Through the NIY Programme.
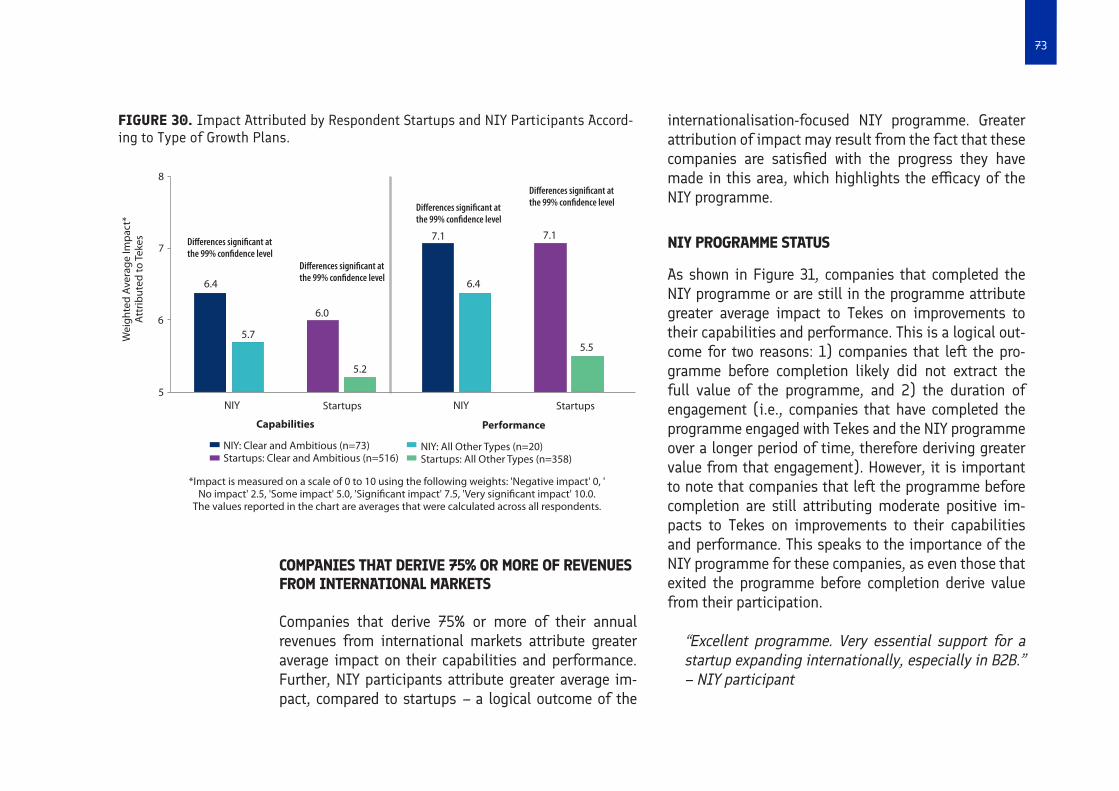
73
COMPANIES THAT DERIVE 75% OR MORE OF REVENUES FROM INTERNATIONAL MARKETS
Companies that derive 75% or more of their annual revenues from international markets attribute greater average impact on their capabilities and performance. Further, NIY participants attribute greater average im-pact, compared to startups – a logical outcome of the
FIGURE 30. Impact Attributed by Respondent Startups and NIY Participants Accord-ing to Type of Growth Plans.
internationalisation-focused NIY programme. Greater attribution of impact may result from the fact that these companies are satisfied with the progress they have made in this area, which highlights the efficacy of the NIY programme.
NIY PROGRAMME STATUS
As shown in Figure 31, companies that completed the NIY programme or are still in the programme attribute greater average impact to Tekes on improvements to their capabilities and performance. This is a logical out-come for two reasons: 1) companies that left the pro-gramme before completion likely did not extract the full value of the programme, and 2) the duration of engagement (i.e., companies that have completed the programme engaged with Tekes and the NIY programme over a longer period of time, therefore deriving greater value from that engagement). However, it is important to note that companies that left the programme before completion are still attributing moderate positive im-pacts to Tekes on improvements to their capabilities and performance. This speaks to the importance of the NIY programme for these companies, as even those that exited the programme before completion derive value from their participation.
“Excellent programme. Very essential support for a startup expanding internationally, especially in B2B.” – NIY participant
W
eigh
ted
Ave
rage
Imp
act*
Att
ribut
ed to
Tek
es Differences significant atthe 99% confidence level
Differences significant at the 99% confidence level
Differences significant atthe 99% confidence level
Differences significant atthe 99% confidence level
NIY NIYStartups Startups
PerformanceCapabilities
5
6
7
8
*Impact is measured on a scale of 0 to 10 using the following weights: 'Negative impact' 0, 'No impact' 2.5, 'Some impact' 5.0, 'Significant impact' 7.5, 'Very significant impact' 10.0.
The values reported in the chart are averages that were calculated across all respondents.
NIY: All Other Types (n=20)Startups: All Other Types (n=358)
NIY: Clear and Ambitious (n=73)Startups: Clear and Ambitious (n=516)
6.4 6.4
7.1 7.1
6.0
5.7
5.2
5.5
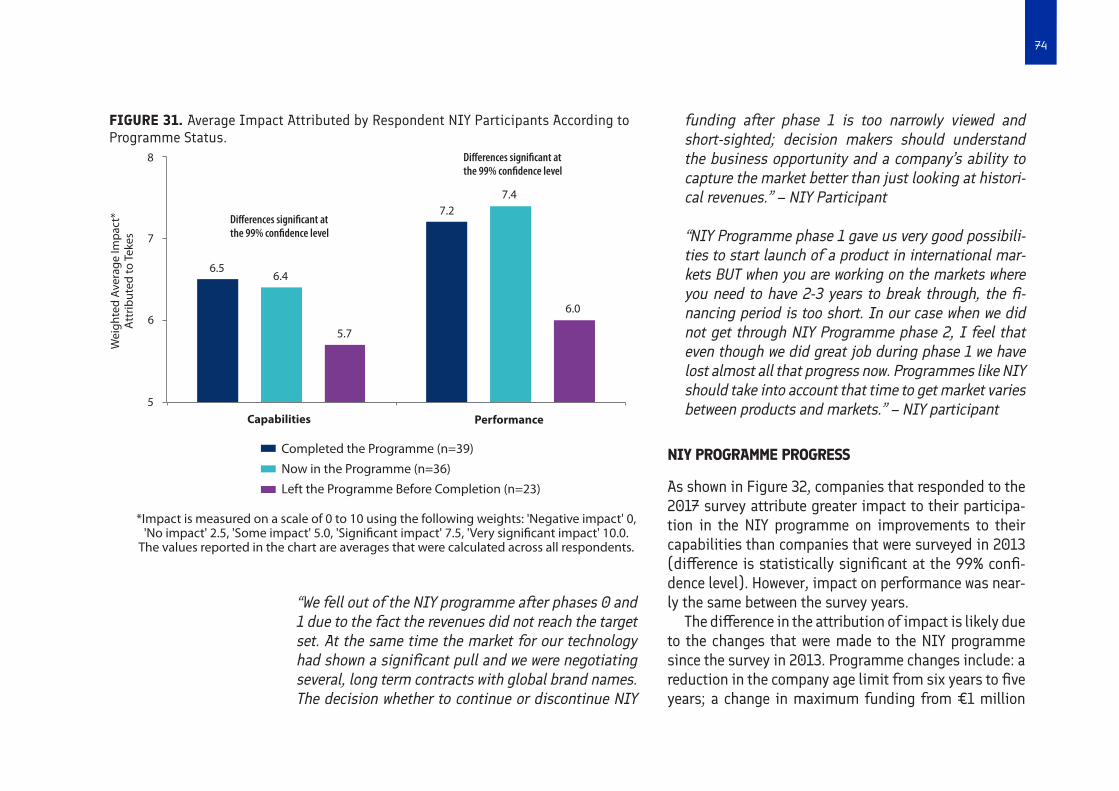
74
“We fell out of the NIY programme after phases 0 and 1 due to the fact the revenues did not reach the target set. At the same time the market for our technology had shown a significant pull and we were negotiating several, long term contracts with global brand names. The decision whether to continue or discontinue NIY
funding after phase 1 is too narrowly viewed and short-sighted; decision makers should understand the business opportunity and a company’s ability to capture the market better than just looking at histori-cal revenues.” – NIY Participant
“NIY Programme phase 1 gave us very good possibili-ties to start launch of a product in international mar-kets BUT when you are working on the markets where you need to have 2-3 years to break through, the fi-nancing period is too short. In our case when we did not get through NIY Programme phase 2, I feel that even though we did great job during phase 1 we have lost almost all that progress now. Programmes like NIY should take into account that time to get market varies between products and markets.” – NIY participant
NIY PROGRAMME PROGRESS
As shown in Figure 32, companies that responded to the 2017 survey attribute greater impact to their participa-tion in the NIY programme on improvements to their capabilities than companies that were surveyed in 2013 (difference is statistically significant at the 99% confi-dence level). However, impact on performance was near-ly the same between the survey years.
The difference in the attribution of impact is likely due to the changes that were made to the NIY programme since the survey in 2013. Programme changes include: a reduction in the company age limit from six years to five years; a change in maximum funding from €1 million
FIGURE 31. Average Impact Attributed by Respondent NIY Participants According to Programme Status.
Wei
ghte
d A
vera
ge Im
pac
t*A
ttrib
uted
to T
ekes
PerformanceCapabilities
Differences significant at the 99% confidence level
Differences significant atthe 99% confidence level
7.47.2
6.0
6.56.4
5.7
5
6
7
8
*Impact is measured on a scale of 0 to 10 using the following weights: 'Negative impact' 0, 'No impact' 2.5, 'Some impact' 5.0, 'Significant impact' 7.5, 'Very significant impact' 10.0.
The values reported in the chart are averages that were calculated across all respondents.
Completed the Programme (n=39)
Now in the Programme (n=36)
Left the Programme Before Completion (n=23)
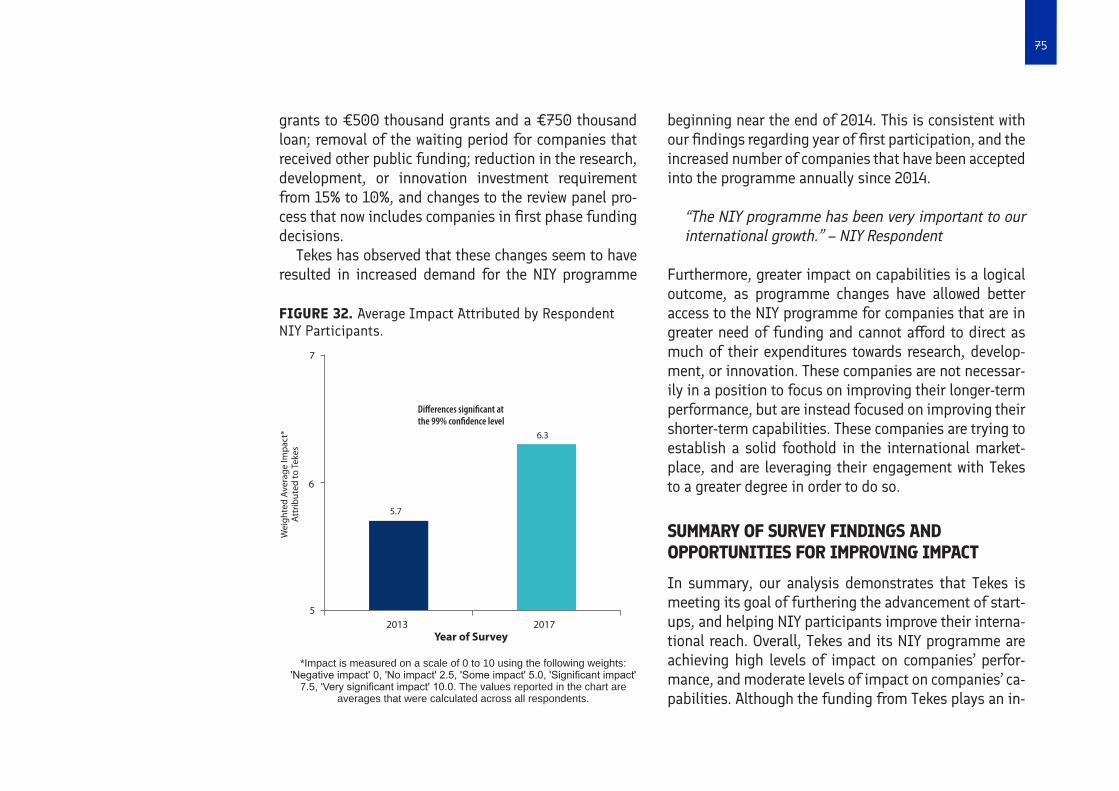
75
grants to €500 thousand grants and a €750 thousand loan; removal of the waiting period for companies that received other public funding; reduction in the research, development, or innovation investment requirement from 15% to 10%, and changes to the review panel pro-cess that now includes companies in first phase funding decisions.
Tekes has observed that these changes seem to have resulted in increased demand for the NIY programme
beginning near the end of 2014. This is consistent with our findings regarding year of first participation, and the increased number of companies that have been accepted into the programme annually since 2014.
“The NIY programme has been very important to our international growth.” – NIY Respondent
Furthermore, greater impact on capabilities is a logical outcome, as programme changes have allowed better access to the NIY programme for companies that are in greater need of funding and cannot afford to direct as much of their expenditures towards research, develop-ment, or innovation. These companies are not necessar-ily in a position to focus on improving their longer-term performance, but are instead focused on improving their shorter-term capabilities. These companies are trying to establish a solid foothold in the international market-place, and are leveraging their engagement with Tekes to a greater degree in order to do so.
SUMMARY OF SURVEY FINDINGS AND OPPORTUNITIES FOR IMPROVING IMPACT
In summary, our analysis demonstrates that Tekes is meeting its goal of furthering the advancement of start-ups, and helping NIY participants improve their interna-tional reach. Overall, Tekes and its NIY programme are achieving high levels of impact on companies’ perfor-mance, and moderate levels of impact on companies’ ca-pabilities. Although the funding from Tekes plays an in-
Wei
ghte
d A
vera
ge Im
pac
t*A
ttrib
uted
to T
ekes
5
6
7
Differences significant at the 99% confidence level
6.3
2013Year of Survey
2017
5.7
*Impact is measured on a scale of 0 to 10 using the following weights: 'Negative impact' 0, 'No impact' 2.5, 'Some impact' 5.0, 'Significant impact'
7.5, 'Very significant impact' 10.0. The values reported in the chart areaverages that were calculated across all respondents.
FIGURE 32. Average Impact Attributed by Respondent NIY Participants.

76
tegral role in the advancement of these companies, our findings clearly demonstrate that Tekes’ non-financial support services are of great importance to companies, and lead to higher attributed impact.
In the following, we highlight some opportunities for improving the impact based on our survey findings.
NON-FINANCIAL SUPPORT
Most startups and NIY programme participants received only financial support from Tekes, or through the NIY programme. However, those that used the non-financial support services to a greater degree attribute higher av-erage impact to Tekes on improvements to their capabil-ities and performance. But, most companies only used Tekes’ key non-financial support offerings − mentoring, connections with investors, and connections with busi-ness advisors or board of directors’ members − to a low degree, or did not use them at all. Therefore, an opportu-nity exists for Tekes to increase its impact by strength-ening these offerings and by encouraging companies to use the mentoring and connections support services to a greater degree.
Further, respondents highlighted an opportunity for Tekes to provide greater support to startup companies once they are in a more innovative and internationally focused space, such as guidance with marketing efforts, and business development advice. Startup respondents also indicated an interest in connecting with individu-als that possess the technical expertise necessary to as-sist them with commercialising their product offerings.
While it may not be appropriate for the present advisor group to provide this additional support, an opportuni-ty exists for Tekes to source this expertise externally by linking startup companies with industry experts. NIY re-spondents indicated an opportunity for Tekes to provide greater support to NIY participants by finding qualified staff both at home and abroad, knowledge about how to market internationally, and overcoming international barriers in general.
APPLICATION REVIEW PROCESS
A substantial proportion of startups and NIY partici-pants found Tekes’ rigorous application review process to be valuable. Specifically, 53% of startups indicate they have derived ‘very high’, or ‘high’ value from the process, and 39% derived ‘some’ value. For NIY partic-ipants, 52% indicate they have derived ‘very high’, or ‘high’ value from the process, and 41% derived ‘some’ value.
However, in the case of both startups and NIY par-ticipants, relatively few companies (14% in both cases) indicated they derived ‘very high’ value from Tekes’ ap-plication review process, highlighting an opportunity to shift more of the companies that are deriving ‘high’ value to deriving ‘very high’ value. Similarly, Tekes has the opportunity to shift more of the companies that are deriving ‘some’ value to deriving ‘high’ value. Further, 7% indicated ‘no value’, for both startups and NIY, and for startups 2% indicated that the process was ‘detrimen-tal’. Overall, an examination of Tekes’ application review
77
process may be warranted, to implement improvements that will increase the value of the process for companies. Improvements may include more clearly communicat-ing the application requirements. Greater clarity around the expectations of the applications will reduce delays in the process, which are currently caused by companies misunderstanding the requirements and having to re-work their applications.
NIY respondents indicated that the feedback provided by the Expert Panel during the application process was useful for their company, however an opportunity exists for the panel to provide feedback that is more specifical-ly targeted to the product or operations of the compa-ny in question. The companies participating in the NIY programme are young and highly motivated, as such they request actionable and detailed feedback. This may require the panels to be comprised of deep and experi-enced subject matter experts.
“Especially the expert panel review was very good, it confirmed our own thoughts and putting your mes-sage into 10 minutes was a good exercise.” – NIY par-ticipant
“Pitching to investor panel as part of the NIY pro-gramme was very valuable. It was a good reason to refresh our financial deck and review the pitch. Feed-back from experts was very useful and made a dif-ference. Most importantly though there are very few situations for a startup where you can pitch without pressure.” – NIY participant
‘“Expert Panel is not a well working concept as the participants use mainly gut feel to make decisions without knowing the substance. Generic VC knowledge in Finland is not at sufficient level in order to make decision on deep tech startups or anything extra ordi-nary.” – NIY participant
‘“[Expert panel] Seemed to be a bit more suitable for “traditional” companies with steady growth.” – NIY participant
“Expert Panel is good concept for validating the case by 3rd party views. However, the feedback value should not be rated too high. Companies in the NIY and fund-ing rounds in general got through a similar number of “gates” with deeper discussion.” – NIY participant
“There were not enough people in the panels with de-tailed knowledge of the market and market dynamics. The expertise of the panellists was too general, but of course they were smart people with some very good overall tips.” – NIY participant
FOCUS ON BOLSTERING IMPACT ON CAPABILITIES
The vast majority of startup companies that have ex-perienced growth in annual revenues, annual revenues derived from international markets, acquisition of new international customers, and employment attribute pos-itive impact to Tekes on this growth. This tells us that Tekes plays an important role in the performance of
78
growing companies. However, only a modest proportion of startup companies are growing substantively in these areas. Even though modest growth is expected by these less developed companies, this nonetheless points to an opportunity for Tekes to focus on tailoring their current service offerings to be more conducive to influencing startup companies’ capabilities related to these perfor-mance measures (e.g., selling into international mar-kets, and business linkages). As mentioned previous-ly, impact on companies’ performance is a longer-term outcome of the direct impact Tekes has on companies’ shorter-term capabilities, and statistical analyses re-vealed that greater impact on companies’ capabilities is a predictor of impact on companies’ performance.
SOURCING CAPITAL
Despite the financial support provided through the NIY programme, the top barrier to growth indicated by NIY participant companies is a lack of access to capital. Further, we see that the majority of companies (84%) indicate that revenues are their most important source of funds, which may limit the growth trajectory of these companies. This illustrates a need to improve compa-nies’ ability to secure financing from other sources. Ad-ditionally, most companies did not take advantage of Tekes’ investor connections support, and low proportions of companies attribute impact to the NIY programme on their capacity to raise capital, and on their ability to at-tract and secure both private and public financing. These findings present opportunities for Tekes to examine its
current method of fostering investor connections, and to tailor elements of its NIY programme more specifically towards garnering external financial support for partici-pating companies.
NIY EXPERIENCES & SPILL-OVERS − EVIDENCE FROM INTERVIEWS
SUMMARY OF MAIN FINDINGS
• Companies value the flexibility of NIY funding • Cases illustrate the importance of entrepreneur-
ial and business model spil-overs over technology spillovers for startups
• Cases highlight the need to look beyond individual startups to fully understand Tekes role
• Further information on Tekes spill-over impacts is needed
For this study, we interviewed 12 startups that have par-ticipated in Tekes NIY programme. The companies were identified according to two dimensions: companies that are or are not NIY champions; and companies that are or are not VIGO participants. These dimensions formed four categories, and at least two companies of each cat-egory were interviewed. Seven of the 12 chosen startups were NIY champions, and eight of the startups had par-ticipated in the VIGO programme.
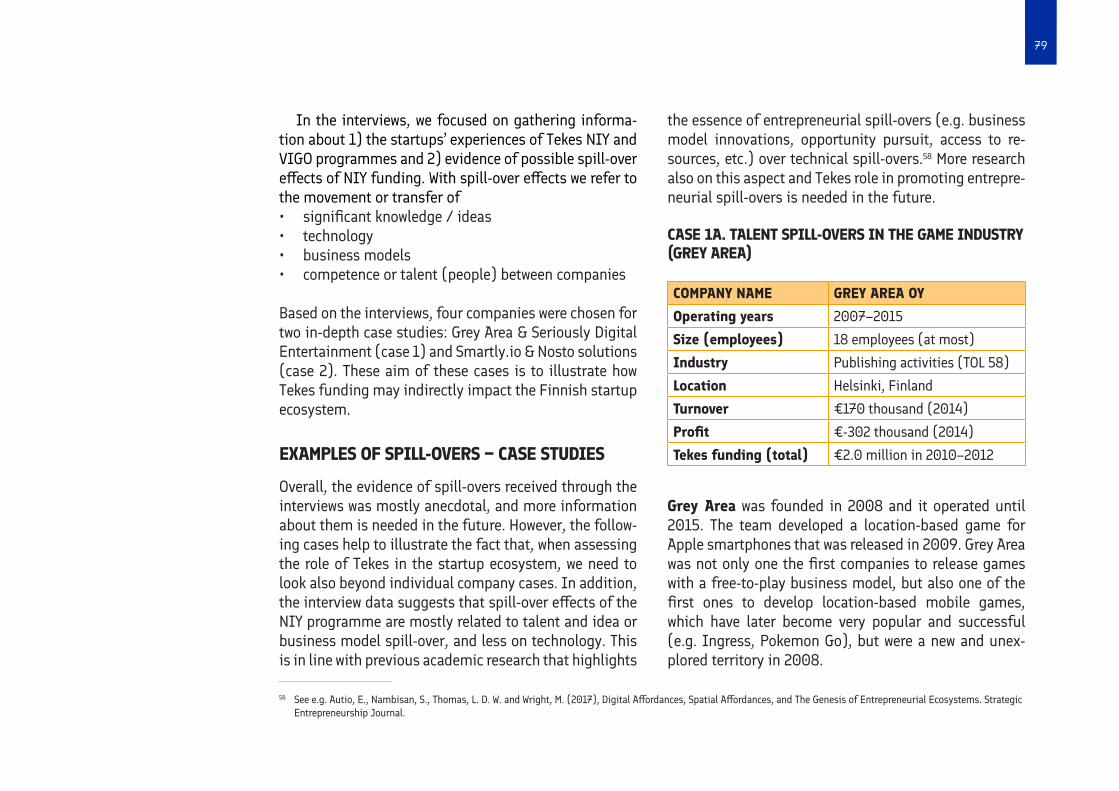
79
In the interviews, we focused on gathering informa-tion about 1) the startups’ experiences of Tekes NIY and VIGO programmes and 2) evidence of possible spill-over effects of NIY funding. With spill-over effects we refer to the movement or transfer of • significant knowledge / ideas• technology• business models• competence or talent (people) between companies
Based on the interviews, four companies were chosen for two in-depth case studies: Grey Area & Seriously Digital Entertainment (case 1) and Smartly.io & Nosto solutions (case 2). These aim of these cases is to illustrate how Tekes funding may indirectly impact the Finnish startup ecosystem.
EXAMPLES OF SPILL-OVERS − CASE STUDIES
Overall, the evidence of spill-overs received through the interviews was mostly anecdotal, and more information about them is needed in the future. However, the follow-ing cases help to illustrate the fact that, when assessing the role of Tekes in the startup ecosystem, we need to look also beyond individual company cases. In addition, the interview data suggests that spill-over effects of the NIY programme are mostly related to talent and idea or business model spill-over, and less on technology. This is in line with previous academic research that highlights
the essence of entrepreneurial spill-overs (e.g. business model innovations, opportunity pursuit, access to re-sources, etc.) over technical spill-overs.58 More research also on this aspect and Tekes role in promoting entrepre-neurial spill-overs is needed in the future.
COMPANY NAME GREY AREA OY
Operating years 2007–2015
Size (employees) 18 employees (at most)
Industry Publishing activities (TOL 58)
Location Helsinki, Finland
Turnover €170 thousand (2014)
Profit €-302 thousand (2014)
Tekes funding (total) €2.0 million in 2010–2012
Grey Area was founded in 2008 and it operated until 2015. The team developed a location-based game for Apple smartphones that was released in 2009. Grey Area was not only one the first companies to release games with a free-to-play business model, but also one of the first ones to develop location-based mobile games, which have later become very popular and successful (e.g. Ingress, Pokemon Go), but were a new and unex-plored territory in 2008.
CASE 1A. TALENT SPILL-OVERS IN THE GAME INDUSTRY (GREY AREA)
58 See e.g. Autio, E., Nambisan, S., Thomas, L. D. W. and Wright, M. (2017), Digital Affordances, Spatial Affordances, and The Genesis of Entrepreneurial Ecosystems. Strategic Entrepreneurship Journal.
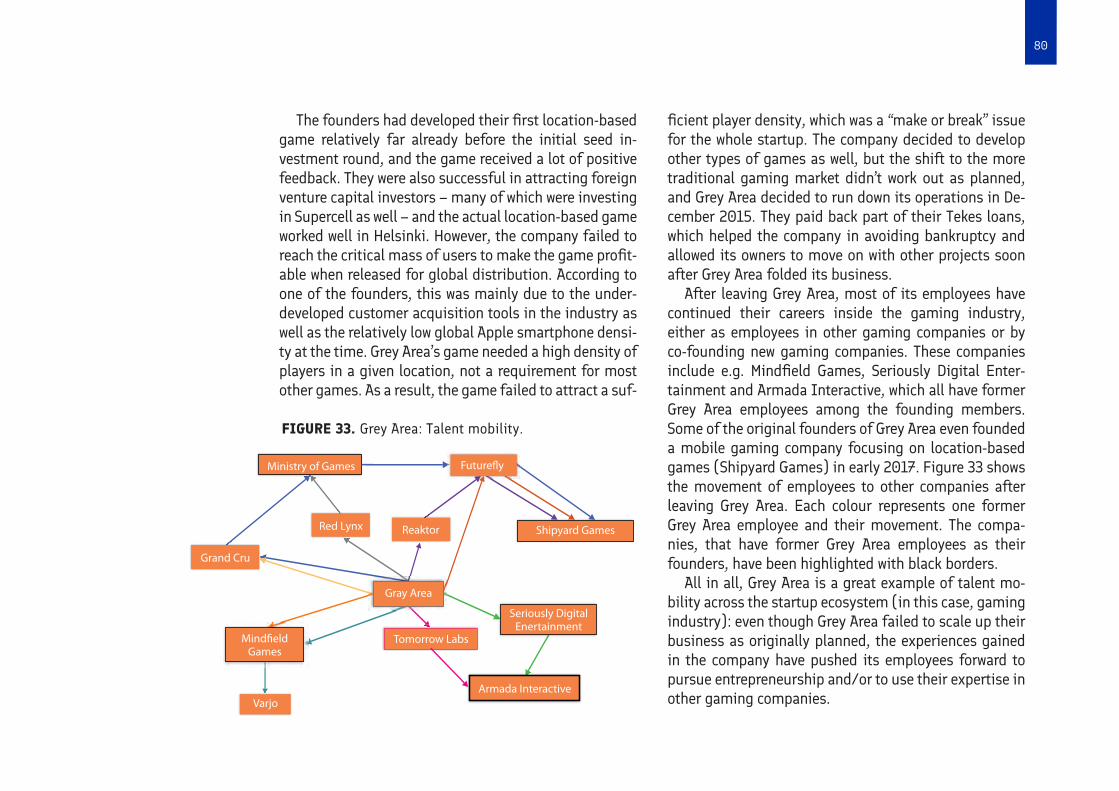
80
The founders had developed their first location-based game relatively far already before the initial seed in-vestment round, and the game received a lot of positive feedback. They were also successful in attracting foreign venture capital investors – many of which were investing in Supercell as well – and the actual location-based game worked well in Helsinki. However, the company failed to reach the critical mass of users to make the game profit-able when released for global distribution. According to one of the founders, this was mainly due to the under-developed customer acquisition tools in the industry as well as the relatively low global Apple smartphone densi-ty at the time. Grey Area’s game needed a high density of players in a given location, not a requirement for most other games. As a result, the game failed to attract a suf-
ficient player density, which was a “make or break” issue for the whole startup. The company decided to develop other types of games as well, but the shift to the more traditional gaming market didn’t work out as planned, and Grey Area decided to run down its operations in De-cember 2015. They paid back part of their Tekes loans, which helped the company in avoiding bankruptcy and allowed its owners to move on with other projects soon after Grey Area folded its business.
After leaving Grey Area, most of its employees have continued their careers inside the gaming industry, either as employees in other gaming companies or by co-founding new gaming companies. These companies include e.g. Mindfield Games, Seriously Digital Enter-tainment and Armada Interactive, which all have former Grey Area employees among the founding members. Some of the original founders of Grey Area even founded a mobile gaming company focusing on location-based games (Shipyard Games) in early 2017. Figure 33 shows the movement of employees to other companies after leaving Grey Area. Each colour represents one former Grey Area employee and their movement. The compa-nies, that have former Grey Area employees as their founders, have been highlighted with black borders.
All in all, Grey Area is a great example of talent mo-bility across the startup ecosystem (in this case, gaming industry): even though Grey Area failed to scale up their business as originally planned, the experiences gained in the company have pushed its employees forward to pursue entrepreneurship and/or to use their expertise in other gaming companies.
Ministry of Games
Seriously DigitalEnertainment
Armada Interactive
Tomorrow Labs
Gray Area
MindfieldGames
Grand Cru
Shipyard GamesRed Lynx Reaktor
Varjo
Futurefly
FIGURE 33. Grey Area: Talent mobility.
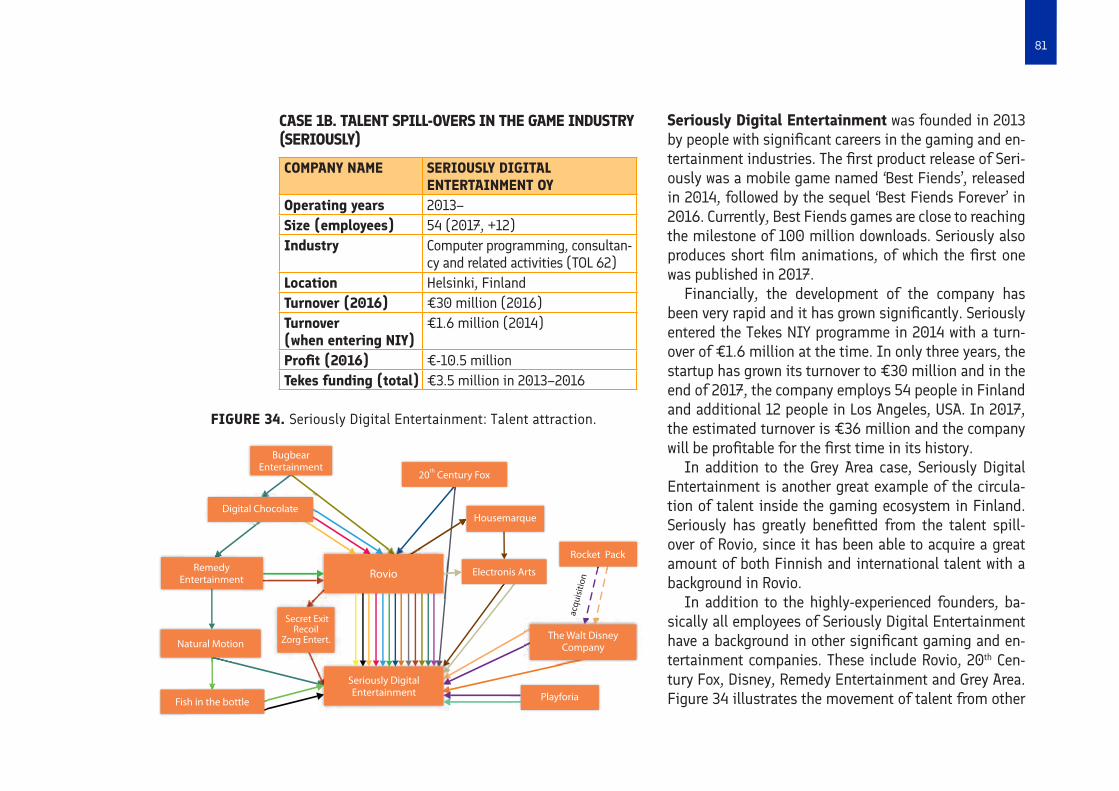
81
Seriously Digital Entertainment was founded in 2013 by people with significant careers in the gaming and en-tertainment industries. The first product release of Seri-ously was a mobile game named ‘Best Fiends’, released in 2014, followed by the sequel ‘Best Fiends Forever’ in 2016. Currently, Best Fiends games are close to reaching the milestone of 100 million downloads. Seriously also produces short film animations, of which the first one was published in 2017.
Financially, the development of the company has been very rapid and it has grown significantly. Seriously entered the Tekes NIY programme in 2014 with a turn-over of €1.6 million at the time. In only three years, the startup has grown its turnover to €30 million and in the end of 2017, the company employs 54 people in Finland and additional 12 people in Los Angeles, USA. In 2017, the estimated turnover is €36 million and the company will be profitable for the first time in its history.
In addition to the Grey Area case, Seriously Digital Entertainment is another great example of the circula-tion of talent inside the gaming ecosystem in Finland. Seriously has greatly benefitted from the talent spill-over of Rovio, since it has been able to acquire a great amount of both Finnish and international talent with a background in Rovio.
In addition to the highly-experienced founders, ba-sically all employees of Seriously Digital Entertainment have a background in other significant gaming and en-tertainment companies. These include Rovio, 20th Cen-tury Fox, Disney, Remedy Entertainment and Grey Area. Figure 34 illustrates the movement of talent from other
CASE 1B. TALENT SPILL-OVERS IN THE GAME INDUSTRY (SERIOUSLY)
COMPANY NAME SERIOUSLY DIGITAL ENTERTAINMENT OY
Operating years 2013–Size (employees) 54 (2017, +12)Industry Computer programming, consultan-
cy and related activities (TOL 62)Location Helsinki, FinlandTurnover (2016) €30 million (2016)Turnover (when entering NIY)
€1.6 million (2014)
Profit (2016) €-10.5 millionTekes funding (total) €3.5 million in 2013–2016
FIGURE 34. Seriously Digital Entertainment: Talent attraction.
Rovio
Housemarque
th20 Century Fox
Electronis Arts
Playforia
The Walt DisneyCompany
Seriously DigitalEntertainment
Secret ExitRecoil
Zorg Entert.
RemedyEntertainment
BugbearEntertainment
Natural Motion
Rocket Pack
acqu
isiti
on
Fish in the bottle
Digital Chocolate
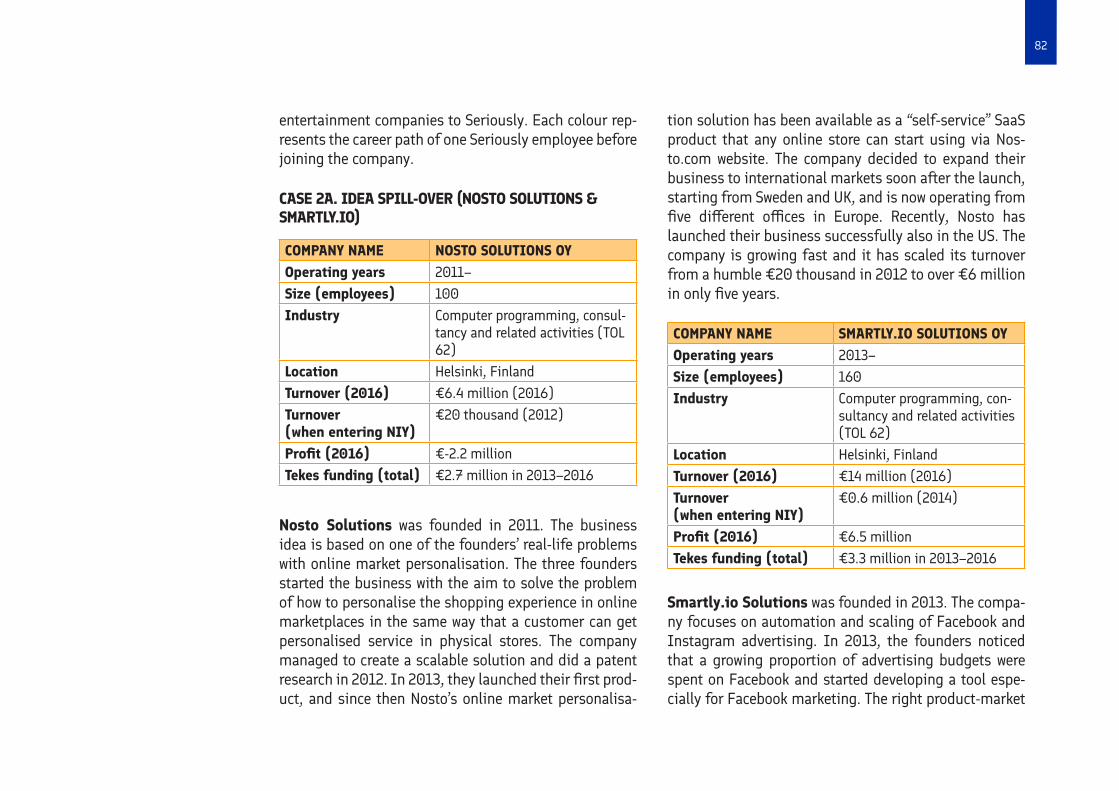
82
CASE 2A. IDEA SPILL-OVER (NOSTO SOLUTIONS & SMARTLY.IO)
COMPANY NAME NOSTO SOLUTIONS OYOperating years 2011–Size (employees) 100Industry Computer programming, consul-
tancy and related activities (TOL 62)
Location Helsinki, FinlandTurnover (2016) €6.4 million (2016)Turnover (when entering NIY)
€20 thousand (2012)
Profit (2016) €-2.2 millionTekes funding (total) €2.7 million in 2013–2016
entertainment companies to Seriously. Each colour rep-resents the career path of one Seriously employee before joining the company.
Nosto Solutions was founded in 2011. The business idea is based on one of the founders’ real-life problems with online market personalisation. The three founders started the business with the aim to solve the problem of how to personalise the shopping experience in online marketplaces in the same way that a customer can get personalised service in physical stores. The company managed to create a scalable solution and did a patent research in 2012. In 2013, they launched their first prod-uct, and since then Nosto’s online market personalisa-
tion solution has been available as a “self-service” SaaS product that any online store can start using via Nos-to.com website. The company decided to expand their business to international markets soon after the launch, starting from Sweden and UK, and is now operating from five different offices in Europe. Recently, Nosto has launched their business successfully also in the US. The company is growing fast and it has scaled its turnover from a humble €20 thousand in 2012 to over €6 million in only five years.
COMPANY NAME SMARTLY.IO SOLUTIONS OYOperating years 2013–Size (employees) 160Industry Computer programming, con-
sultancy and related activities (TOL 62)
Location Helsinki, FinlandTurnover (2016) €14 million (2016)Turnover (when entering NIY)
€0.6 million (2014)
Profit (2016) €6.5 millionTekes funding (total) €3.3 million in 2013–2016
Smartly.io Solutions was founded in 2013. The compa-ny focuses on automation and scaling of Facebook and Instagram advertising. In 2013, the founders noticed that a growing proportion of advertising budgets were spent on Facebook and started developing a tool espe-cially for Facebook marketing. The right product-market
83
fit was found in late 2013 and the Facebook was so inter-ested in the business idea, that they accepted Smartly.io to their partnership programme, which was an import-ant milestone for the company. Commercial operations started in 2014 and the company has grown rapidly and internationally ever since. Smartly.io became profitable already a year later, in 2015, and it has grown truly glob-al: its operations are running 24/5 world-wide and 99% of its turnover comes from outside of Finland.
The core of Nosto’s business is a service of personal-izing the shopping experience in online shopping. A few years back, Facebook launched a new type of market slot (called ‘product carousel’), which was very similar to Nos-to’s feature for websites for product recommendations. Smartly.io was coincidently founded around the same time, and while its core business idea is based on auto-mated Facebook advertising, it felt natural for the two companies to seek possibilities for co-operation. Both companies were in NIY programme at the same time and had the same investor behind them. The mutual investor was a natural link between the two companies and made the establishment of collaboration even easier.
During 2014–2015, Smartly.io and Nosto formed a technological partnership and started collaborating closely in order to build a solution that would lever-age Nosto’s patented recommendation technology in Facebook Ads. The new product was launched success-fully and provided promising results and served as a proof-of-concept for Nosto. After some time, Smartly.io started focusing more on their core business and
Nosto continued to develop the solution directly with Facebook, becoming a second official Facebook Partner in Finland. The product is now an integral part of Nos-to’s offering. Both companies learned a lot from the col-laboration and have continued supporting each other in various ways.
SUMMARY OF COMPANY EXPERIENCES OF THE NIY PROGRAMME
In general, the 12 companies interviewed regard NIY programme very important. Most of the positive feed-back was related to the amount and flexibility of the NIY funding. The fairly large amount of NIY funding avail-able for each company has been especially important for those companies that operate in industries where closing one sales deal can take up to a year or two (e.g. health & medicine, construction). Many of the inter-viewed companies also mentioned the fact that, while there are many different R&D instruments available, NIY is the only instrument that can be used directly to com-mercialisation and scaling up the business (also inter-nationally) with only a very few restrictions.
Besides the very important and obvious direct financ-ing that the Tekes NIY programme is providing, many of the interviewees also mentioned another important, yet a less direct benefit of the NIY funding. It seems that receiving Tekes funding serves as a kind of proof-of-con-cept or “sanity check” for other, external investors. Tekes is an institution that is gaining reputation also among

84
international investors, and knowing that a startup has passed the requirements for Tekes funding makes it easier for other, private sector investors to invest in the startup as well. Some of the companies mentioned, that foreign investors may set Tekes funding as a pre-req-uisite for the investment. On the other hand, a startup which has not received Tekes funding, may appear un-
feasible from an investor point of view. This means that Tekes has a great responsibility to ensure consistent and well-informed funding decisions.
In addition, most of the company interviewees felt that the actual Tekes NIY funding process with its man-datory reporting requirements helped their companies in crystallizing their strategy and business plans.
85
This section presents findings related to the following evaluation questions: What is the size and role of ac-celerators market in Finland? What is a performance of VIGOs when compared other relevant accelerators? How to (define and) benchmark accelerators?
FINNISH ACCELERATOR MARKET AND THE VIGO PROGRAMME
SUMMARY OF MAIN FINDINGS
Mapping of Finnish accelerator market and inter-views with VIGO founders and other experts suggest that:• There is a need to better understand different ac-
celerator models and their roles in the ecosystem; many new models focusing on corporate accelera-tion / venturing
• Only few Finnish accelerators fit the accelerator definition
• VIGO accelerators have various trajectories and have adopted different business models
• Most VIGO founders are still active in the field, VIGO role in attraction seems limited but not in-significant
• Views on VIGO programme vary from very criti-cal to positive. Overall VIGO programme is seen to have catalysed and shape up the Finnish ear-ly-stage venture − despite some flaws in design
Business support provided by accelerators is typical-ly targeted at startups with skilled and established teams, a solid business idea and a strong (internation-al) growth expectation. The objective is to help startups to accelerate their growth and scale their business idea within a given (typically short) timeframe. This is done by supporting the startups both financially – usually by investing in the startup – but also by offering them in-tensive mentoring and contacts with experienced found-ers, investors and other relevant professionals as well as through (often) programmed events and peer support from other startups participating in the acceleration pro-gramme. Some accelerators also offer the participants a physical space to work in for the programme period.59
4 TEKES IMPACT ON ACCELERATOR MARKET
59 Miller, P. & Bound, K. (2011) ‘The Startup Factories: The rise of accelerator programmes to support new technology ventures’. Nesta.
86
As described in chapter 2, there has been a significant development in the Finnish venture support ecosystem, and new types of models are constantly emerging. In this context, the term accelerator has been used broad-ly and has referred to many different types of ventures support programmes. In the next sections, we will focus more closely on accelerators (as defined below) by ana-lysing the development of VIGO accelerators and other accelerator programmes.
DEFINING ACCELERATORS AND APPROACH FOR MAPPING
ACCELERATOR CRITERIA
Although there is no official definition for accelerators, and the term has been adopted by various kinds of pro-grammes and concepts, a relatively widely adopted defi-nition developed by Miller & Bound (2011) defines accel-erators according to the following criteria:a) An application process that is open to all, yet highly
competitive.b) Provision of pre-seed investment, usually in ex-
change for equity.c) A focus on small teams not individual founders.d) Time-limited support comprising programmed
events and intensive mentoring.e) Cohorts or ‘classes’ of startups rather than individual
companies. 60
For most startups, funding is just one of the import-ant reason to apply for an accelerator. As well, valuable features of accelerators also include the business and product advice, as well as the connections that the start-ups can use to establish regarding future investments. In addition, startups that have been selected to partici-pate in an accelerator are often labelled as ‘validated’ or ‘promising’ startups in the eyes of the media, investors, and potential clients, which may help them further on their way to becoming successful businesses in the long run. Accelerator programmes also put the startups un-der positive pressure and force some discipline by set-ting deadlines on the timeframe of the programme.
Finally, since accelerators are often organised to host a small group of startups at the same time – sometimes referred to as a ‘class’ or a ‘cohort’, all the founders al-most automatically get a peer support group by partici-pating in a business accelerator programme.61 In short, accelerators can boost entrepreneurial competence development among startups through knowledge spill-overs, developing firms’ abilities to organise effective-ly for entrepreneurial opportunity pursuit and scale-up through disruptive business model innovation.
From the investors point of view, accelerator pro-grammes filter and further develop (or ‘de-risk’) po-tential startups to attract investment, bring knowledge about new technologies, and offer possibilities to con-nect with other investors. On one hand, the business concepts of the participating startups have been pre-val-
60 Miller, P. & Bound, K. (2011)61 Miller, P. & Bound, K. (2011)
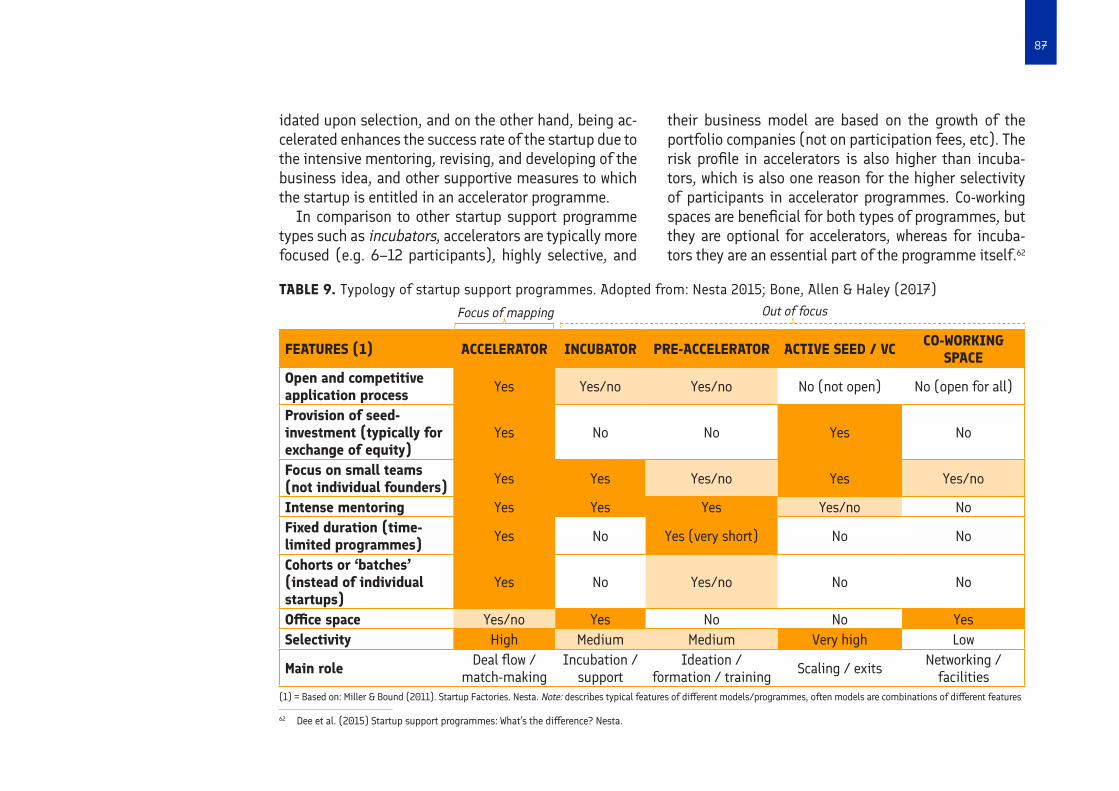
87
idated upon selection, and on the other hand, being ac-celerated enhances the success rate of the startup due to the intensive mentoring, revising, and developing of the business idea, and other supportive measures to which the startup is entitled in an accelerator programme.
In comparison to other startup support programme types such as incubators, accelerators are typically more focused (e.g. 6–12 participants), highly selective, and
their business model are based on the growth of the portfolio companies (not on participation fees, etc). The risk profile in accelerators is also higher than incuba-tors, which is also one reason for the higher selectivity of participants in accelerator programmes. Co-working spaces are beneficial for both types of programmes, but they are optional for accelerators, whereas for incuba-tors they are an essential part of the programme itself.62
FEATURES (1) ACCELERATOR INCUBATOR PRE-ACCELERATOR ACTIVE SEED / VC CO-WORKING SPACE
Open and competitive application process Yes Yes/no Yes/no No (not open) No (open for all)
Provision of seed- investment (typically for exchange of equity)
Yes No No Yes No
Focus on small teams (not individual founders) Yes Yes Yes/no Yes Yes/no
Intense mentoring Yes Yes Yes Yes/no NoFixed duration (time- limited programmes) Yes No Yes (very short) No No
Cohorts or ‘batches’ (instead of individual startups)
Yes No Yes/no No No
Office space Yes/no Yes No No YesSelectivity High Medium Medium Very high Low
Main role Deal flow / match-making
Incubation / support
Ideation / formation / training Scaling / exits Networking /
facilities(1) = Based on: Miller & Bound (2011). Startup Factories. Nesta. Note: describes typical features of different models/programmes, often models are combinations of different features
Focus of mapping Out of focus
TABLE 9. Typology of startup support programmes. Adopted from: Nesta 2015; Bone, Allen & Haley (2017)
62 Dee et al. (2015) Startup support programmes: What’s the difference? Nesta.
88
A typology of different startup support programmes and their characteristics is presented in Table 10. The typol-ogy should be considered as representing exemplars since many accelerators and other programmes combine different types of elements.
DIFFERENT ACCELERATOR MODELS
There are many different types of models which still fit the relatively narrow accelerator definition above. In fact, it should be kept in mind that accelerators:• are not a homogeneous group• have different purposes and roles in the ecosystem• have different types of business models• are often startups themselves (looking for the best
or most fitting business model)
Below, we have briefly described three different acceler-ator models based on previous literature.63
• Deal-flow accelerator – ”Traditional US-type accelerator” (e.g. Y-Combina-tor, Techstars)
– Funding from investors, aims to identify promis-ing investment opportunities (deal flow)
– Typically provide seed funding in exchange for eq-uity
– Highly selective; often supported by pre-accelera-tor ’screening’ programmes
• Matchmaker accelerator / ecosystem builder – Aims to connect startups with potential customers (build ecosystem)
– Often set up and/or sponsored by a large corpora-tion to develop new solutions and services
– Operated in-house or (often) by an external ser-vice provided
– Typically don’t provide funding (at least for all) for participants, but add value by helping them to connect with potential reference customers
• Welfare / impact accelerator – Often set up and/or sponsored by government /regional agencies
– Aims to stimulate entrepreneurial activity and fos-ter economic growth in a specific region / industry
– Different business models (equity, fees, public grants, etc.); some may focus on impact investing (‘impact accelerator’)
Another typology is provided in a report by Nesta in 2014. It highlights that accelerators are created for different reasons and therefore have different missions. Whereas venture-backed accelerators typically exist to provide better deal flow for investors, a government-backed accelerator may aim, for example, to support local eco-nomic development. A corporate-sponsored accelera-tor, in turn, may be established to help develop an eco-system around a core technology. Impact accelerators
63 Adopted from: Clarysse, B., Wright, M., & Hove, J. Van. (2015). A Look Inside Accelerators. Building Businesses. Nesta.; Nesta (2014) Startup Accelerator Programmes: a practical guide. Nesta.; and Pauwels, C. et al (2016). Understanding a new generation incubation model: The accelerator. Technovation, 50-51; 13-24.
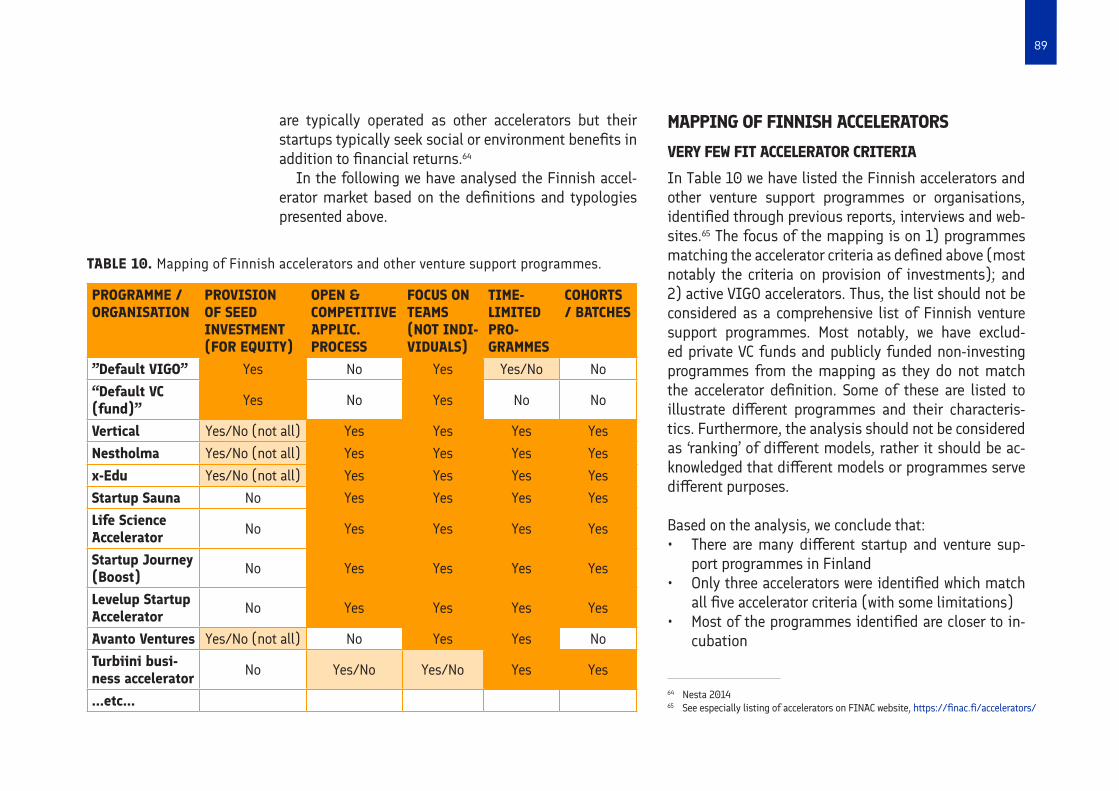
89
are typically operated as other accelerators but their startups typically seek social or environment benefits in addition to financial returns.64
In the following we have analysed the Finnish accel-erator market based on the definitions and typologies presented above.
MAPPING OF FINNISH ACCELERATORS
VERY FEW FIT ACCELERATOR CRITERIA
In Table 10 we have listed the Finnish accelerators and other venture support programmes or organisations, identified through previous reports, interviews and web-sites.65 The focus of the mapping is on 1) programmes matching the accelerator criteria as defined above (most notably the criteria on provision of investments); and 2) active VIGO accelerators. Thus, the list should not be considered as a comprehensive list of Finnish venture support programmes. Most notably, we have exclud-ed private VC funds and publicly funded non-investing programmes from the mapping as they do not match the accelerator definition. Some of these are listed to illustrate different programmes and their characteris-tics. Furthermore, the analysis should not be considered as ‘ranking’ of different models, rather it should be ac-knowledged that different models or programmes serve different purposes.
Based on the analysis, we conclude that:• There are many different startup and venture sup-
port programmes in Finland• Only three accelerators were identified which match
all five accelerator criteria (with some limitations)• Most of the programmes identified are closer to in-
cubation
PROGRAMME / ORGANISATION
PROVISION OF SEED INVESTMENT (FOR EQUITY)
OPEN & COMPETITIVE APPLIC. PROCESS
FOCUS ON TEAMS (NOT INDI-VIDUALS)
TIME- LIMITED PRO-GRAMMES
COHORTS / BATCHES
”Default VIGO” Yes No Yes Yes/No No“Default VC (fund)” Yes No Yes No No
Vertical Yes/No (not all) Yes Yes Yes YesNestholma Yes/No (not all) Yes Yes Yes Yesx-Edu Yes/No (not all) Yes Yes Yes YesStartup Sauna No Yes Yes Yes YesLife Science Accelerator No Yes Yes Yes Yes
Startup Journey (Boost) No Yes Yes Yes Yes
Levelup Startup Accelerator No Yes Yes Yes Yes
Avanto Ventures Yes/No (not all) No Yes Yes NoTurbiini busi-ness accelerator No Yes/No Yes/No Yes Yes
...etc...64 Nesta 2014 65 See especially listing of accelerators on FINAC website, https://finac.fi/accelerators/
TABLE 10. Mapping of Finnish accelerators and other venture support programmes.
90
• VIGO accelerators (in their current form) do not match the accelerator definition and are better con-sidered as VC funds
• More programmes / models match the criteria if in-vestment criteria is excluded
NO PURE DEAL-FLOW ACCELERATORS
Looking at the programmes more closely and analysing their types and roles according to the three different ac-celerator models as defined by Clarysse et al (2015), we find that:• There are no pure deal-flow accelerators, although
many programmes have some elements of deal-flow accelerator (investors screening teams and accelera-tor connecting startups with VCs)
• All three accelerators matching all the five accel-erator criteria (Nestholma, Vertical, x-Edu) can be considered as match-maker accelerators or eco-system builders that operate closely with corpora-tions and startups. Their business model is currently largely based on sponsoring or fees from large cor-porations and not yet on profits or exits. It should also be noted that many of the more recently estab-lished accelerators and other (Nestholma, Vertical, x-Edu, Pivot 5, Avanto Ventures, etc.) have decided to focus (at least partly) on corporate acceleration and derive most of their profits from corporations.
• Depending on definitions, there are various wel-fare / impact accelerators. Most of them (e.g. Life
Science Accelerator, Startup Journey, Levelup Start-up Accelerator) fit other accelerator criteria other than provision of investment, and are publicly fund-ed to stimulate entrepreneurial activity in a specific region / industry. A good example is the Life Science Accelerator, which is funded by public actors (City of Turku, EU structural funds) level to support Finnish life science startups. Like the Life Science Accelera-tor, also these programmes often link startups with other VCs and investors.
• Accelerators have adopted different business mod-els, and are constantly exploring for the most rele-vant and feasible business models
TRAJECTORIES OF VIGO ACCELERATORS
As argued above, VIGO accelerators (especially in their current form) do not fit the accelerator criteria. Instead, they have adopted different trajectories and business models, which are described briefly in this section.
Most currently active VIGO accelerators operate with the VC fund model. This, in short, means that they in-vest into relatively many early stage startups in return of equity. Their business model is similar to other VC com-panies and based on exits and profits generated by the portfolio companies. However, even VIGOs in this group have different characteristics. For example, Cleantech Invest managed a listed investment company, Gorilla Ventures operates as an angel fund. There are in total six ‘VIGO funds’, all of them now also Tekes VC clients.
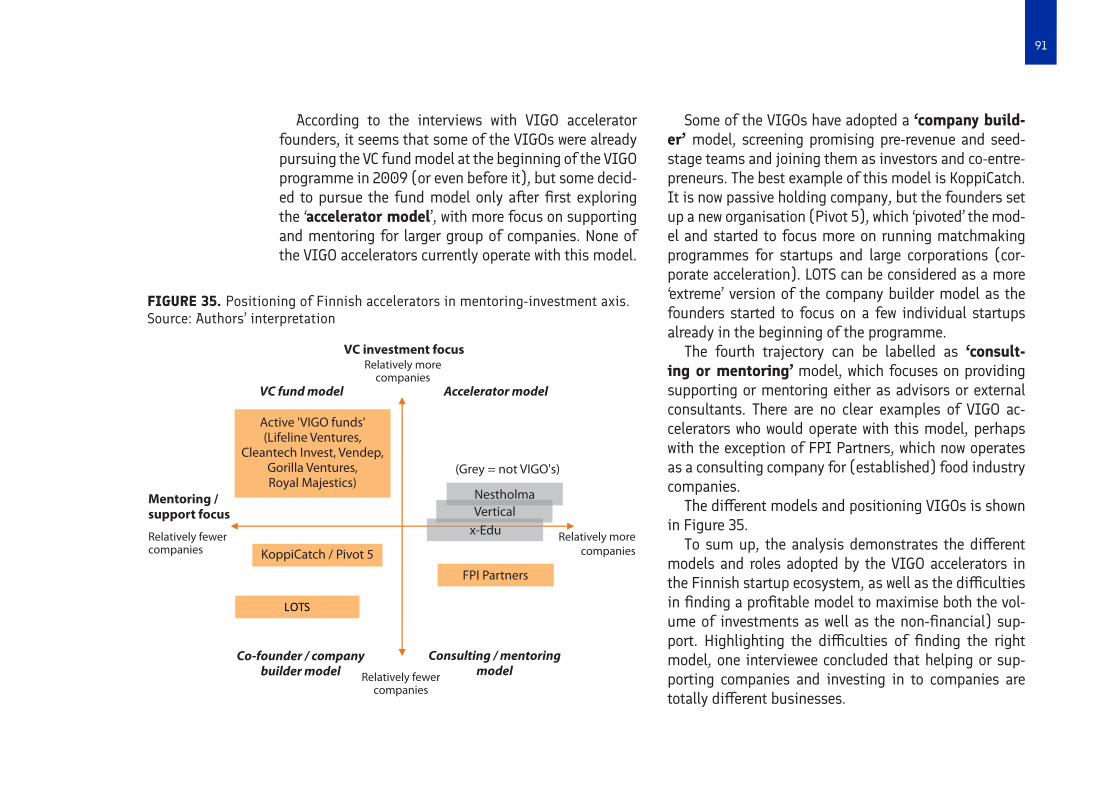
91
According to the interviews with VIGO accelerator founders, it seems that some of the VIGOs were already pursuing the VC fund model at the beginning of the VIGO programme in 2009 (or even before it), but some decid-ed to pursue the fund model only after first exploring the ‘accelerator model’, with more focus on supporting and mentoring for larger group of companies. None of the VIGO accelerators currently operate with this model.
Some of the VIGOs have adopted a ‘company build-er’ model, screening promising pre-revenue and seed-stage teams and joining them as investors and co-entre-preneurs. The best example of this model is KoppiCatch. It is now passive holding company, but the founders set up a new organisation (Pivot 5), which ‘pivoted’ the mod-el and started to focus more on running matchmaking programmes for startups and large corporations (cor-porate acceleration). LOTS can be considered as a more ‘extreme’ version of the company builder model as the founders started to focus on a few individual startups already in the beginning of the programme.
The fourth trajectory can be labelled as ‘consult-ing or mentoring’ model, which focuses on providing supporting or mentoring either as advisors or external consultants. There are no clear examples of VIGO ac-celerators who would operate with this model, perhaps with the exception of FPI Partners, which now operates as a consulting company for (established) food industry companies.
The different models and positioning VIGOs is shown in Figure 35.
To sum up, the analysis demonstrates the different models and roles adopted by the VIGO accelerators in the Finnish startup ecosystem, as well as the difficulties in finding a profitable model to maximise both the vol-ume of investments as well as the non-financial) sup-port. Highlighting the difficulties of finding the right model, one interviewee concluded that helping or sup-porting companies and investing in to companies are totally different businesses.
Active 'VIGO funds'(Lifeline Ventures,
Cleantech Invest, Vendep, Gorilla Ventures, Royal Majestics)
VC investment focus
Accelerator model
(Grey = not VIGO's)
Relatively more companies
FPI Partners
Consulting / mentoringmodel
Co-founder / companybuilder model Relatively fewer
companies
KoppiCatch / Pivot 5Relatively fewercompanies
VC fund model
Relatively more companies
Nestholma
Mentoring / support focus
x-Edu Vertical
FIGURE 35. Positioning of Finnish accelerators in mentoring-investment axis. Source: Authors’ interpretation
92
IMPACT OF VIGO PROGRAMME ON THE FINNISH ACCELERATOR MARKET
The main purpose of the VIGO programme was to attract experienced investor/accelerator teams and help to ca-talyse the Finnish early stage VC field. In this evaluation we addressed this issue by analysing the current status of the VIGO founders (through interviews, LinkedIn and other online sources), and whether they are still active in the accelerator market. We also interviewed VIGO founders to find out whether VIGO programme had con-tributed to their (or their colleagues’) decision to enter the field. Finally, on the basis of interviews with VIGO founders and other experts, we summarise some over-all lessons from the VIGO programme and its impact on Finnish venture support ecosystem.
MOST VIGO FOUNDERS STILL ACTIVE
For the analysis of the VIGO founders’ current activity, we identified 23 founders for the 14 VIGO accelerators (see Table 11). The analysis of the VIGO founders’ cur-rent activity reveals that:• 19/23 (over 80%) of the founders are still active in
the VC / accelerator market • 15 are involved with the same VIGOs accelerator• 4 are involved other VC funds or accelerators• Of the 4 founders that are no longer active in the VC
/ accelerator market, 3 are entrepreneurs or directors at SMEs and one works as a researcher
The analysis is limited by the fact that its partly based on secondary sources (e.g. LinkedIn information) and not all founders were interviewed. There is also no re-liable information available on the level of activity of the founders (e.g. number of investments made). It should also be noted that many founders have multiple positions and roles (e.g. as mentors, board members, co-founders, etc.). Furthermore, the analysis excludes the other partners at the VIGO accelerators, which joined the VIGOs later on. The total impact of the VIGO on the Finnish accelerator market thus extends beyond the original founders.
The interviews with 8 VIGO accelerator founders sug-gest that most of the accelerator founders were already active in the VC / accelerator market before the VIGO programme started, and only some were attracted to the market by the VIGO programme. However, many of them agree that VIGO helped to ‘nudge’ them towards a cer-tain direction and/or helped to make the decision more permanent.
”VIGO had no role in our decision to enter the field. We would have done the same things without it.” − VIGO founder (translation by authors)
“VIGO made us to do things and think them through. Without VIGO there would not have been the import-ant lessons. It helped us to find our own product-mar-ket fit”. − VIGO founder (translation by authors)
93
“The most significant impact was the emergence of new seed-stage investment activities and new full-time teams for supporting growth companies.” − VIGO founder (translation by authors)
VIEWS ON VIGO PROGRAMME’S IMPACT AND LESSONS
In general, the views of the VIGO founders and other stakeholders on the impact of the VIGO programme vary from very critical to positive. On average, the interview-ees agree that VIGO programme helped to attract new investors and shape the accelerator ecosystem despite some flaws and weaknesses in the programme design. According to one interviewee, the VIGO programme had negative impact on the ecosystem by distracting its nat-ural development.
The VIGO concept design and some of its flaws have been discussed more in the previous evaluations66 and was not the subject of this evaluation. However, for the discussion regarding Tekes future role in the ecosys-tem, the following findings from interviews can be sum-marised:• The VIGO programme had good level of ambition
and it targeted real gaps at the right time in the eco-system (lack of early stage VC investments)
• The (time-limited) experimentation was seen as a good approach
• According to the accelerator managers, better inte-gration and knowledge exchange with accelerators
& other players especially on company selection would have improved the programme relevance and impact
• It is important to recognise the difficulties in com-bining investing with mentoring and finding a profit-able “accelerator” model
• Lack of specific “accelerator model” enabled the emergence of different models − but on the other hand, made it difficult for the accelerators to find a profitable business model
• There seems to have been different perceptions of the main goals of the VIGO programme among all stakeholders. This suggest that the objectives were unclear and/or they were not communicated clearly enough.
• “Circulating” money through startups (NIY funding used for VIGO accelerator fees) is seen as a mistake as it resulted into misunderstandings between com-panies, accelerators and public stakeholder. Some of these issues were later addressed, but it appears that they already had an impact on the programme brand.
• Many interviewees regard Tekes VC as a better model, although some constraints (especially limitations on investing into foreign startup) are seen to weaken its impact. It should also be noted that the Tekes VC instrument is suitable for VC fund models, not for accelerator models (differences explained above)
66 See Autio et al. (2013); Luukkonen (2010).
94
”The programme was nevertheless [despite issues with management fees] very good and it helped to shape up the ecosystem the way it would not have de-veloped without it.” − VIGO founder (translation by authors)
“The programme had a bad reputation among start-ups in general due to management fees. The good brand outside startups was based on Supercell suc-cess.” − VIGO founder (translation by authors)
“The original idea was very good but the implementa-tion failed.” − VC expert
“The VIGO accelerators have not been able to run prof-itable accelerator business but as a side effect there have been also positive things [VIGO funds]”. − VC expert
To sum up, the analysis suggests that the VIGO pro-gramme − despite its apparent and widely acknowledged flaws − has had a clear (although limited) role in catalys-ing the Finnish accelerator market / early stage VC field. It seems that the positive outcomes are largely a result of active entrepreneurs’ own activities, not a direct result of the programme. However, VIGO programme provided valuable learnings and experiences of different models for these individuals and had some role in attracting them to the field.
PERFORMANCE OF THE VIGO ACCELERATORS
SUMMARY OF MAIN FINDINGS
• Most VIGO accelerators still active, but variety in current status
• Limitations to analyse and compare performance• Development of portfolio companies expectedly
mixed, but include examples of high growth firms and exits
This section will analyse the impact of the VIGO pro-gramme on the Finnish startup ecosystem. It aims to provide answers to the evaluation question What is the performance of VIGO accelerators when compared to other relevant accelerators?
APPROACH AND FRAMEWORK
As described in Chapter 2, the mid-term evaluation of the VIGO programme concluded that future evaluations should assess whether the programme has succeeded in (1) “speeding up the growth and internationalisation of early-stage ventures in Finland”, and (2) in creating “a self-sustaining, vibrant field of new venture accelerators
95
in Finland”. This section aims to add new information on both questions. The approach is based on three separate analyses:• Analysis of the survival and activity of the VIGO ac-
celerators in comparison to others• Analysis of VIGO portfolio companies’ development
(contributing to the econometric analysis in Chap-ter 3)
The approach is constrained by the availability of data as well as available resources in the project. Especially the following limitations should be taken into account:• First, defining accelerator performance and rele-
vant indicators − even on a general level − is not a straightforward task and there are no official indi-cators for benchmarking accelerators (see more in Annex report 2).
• Second, as the mapping of accelerators reveals, VIGO accelerators do not meet the common accel-erator definition criteria, and there are overall very few (if any) comparable accelerators in Finland (see mapping above).
• Third, VIGO accelerators are a very heterogeneous group in terms of business models and targeted in-dustries, markets and startups, and therefore com-parisons between different VIGOs are
• Fourth, there is no official (accelerator-level) data available and collecting comparable data from the accelerators (of which some do not anymore exist) proved out to be as difficult as expected
Despite these limitations, the following findings will give some indication on the performance of the VIGO accel-erators. Suggestions on how to benchmark accelerators in the future is presented in a separate report drafted by The Evidence Network (see Annex report 2).
SURVIVAL AND ACTIVITY OF THE VIGO ACCELERATORS
The aim of the VIGO programme was to attract new expe-riences investors to the Finnish accelerator / VC market. The original goal was that eventually these teams would set up new early stage VC funds. Therefore, especially given the difficulty of the VC / accelerator business in general, the first indication of VIGO accelerators’ (po-tential) performance is the survival rate and activity of the VIGO accelerators and their founder teams.
A closer look at the current status of the 14 VIGO ac-celerators (Table 11) established during the VIGO pro-gramme period (2009-2/2016) reveals that:• 10/14 are still active in 12/2017, of these
– 7 operate more or less with the same model and/or organisation
– 3 are active but operate with different organisation and/or business model
• Of the 4 accelerators which are no longer active: – 2 are passive holding companies – 2 no longer exist or there is no information avail-able
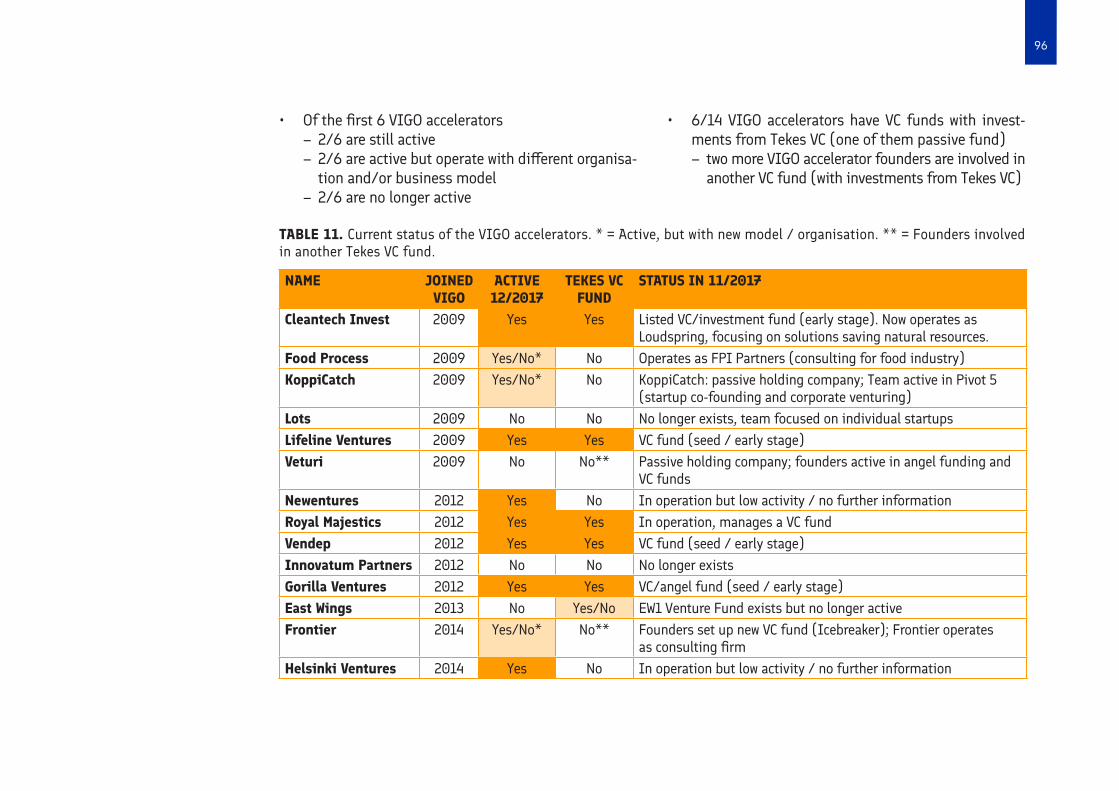
96
• Of the first 6 VIGO accelerators – 2/6 are still active – 2/6 are active but operate with different organisa-tion and/or business model
– 2/6 are no longer active
• 6/14 VIGO accelerators have VC funds with invest-ments from Tekes VC (one of them passive fund) – two more VIGO accelerator founders are involved in another VC fund (with investments from Tekes VC)
NAME JOINED VIGO
ACTIVE 12/2017
TEKES VC FUND
STATUS IN 11/2017
Cleantech Invest 2009 Yes Yes Listed VC/investment fund (early stage). Now operates as Loudspring, focusing on solutions saving natural resources.
Food Process 2009 Yes/No* No Operates as FPI Partners (consulting for food industry)KoppiCatch 2009 Yes/No* No KoppiCatch: passive holding company; Team active in Pivot 5
(startup co-founding and corporate venturing)Lots 2009 No No No longer exists, team focused on individual startupsLifeline Ventures 2009 Yes Yes VC fund (seed / early stage)Veturi 2009 No No** Passive holding company; founders active in angel funding and
VC fundsNewentures 2012 Yes No In operation but low activity / no further informationRoyal Majestics 2012 Yes Yes In operation, manages a VC fundVendep 2012 Yes Yes VC fund (seed / early stage)Innovatum Partners 2012 No No No longer existsGorilla Ventures 2012 Yes Yes VC/angel fund (seed / early stage)East Wings 2013 No Yes/No EW1 Venture Fund exists but no longer activeFrontier 2014 Yes/No* No** Founders set up new VC fund (Icebreaker); Frontier operates
as consulting firmHelsinki Ventures 2014 Yes No In operation but low activity / no further information
TABLE 11. Current status of the VIGO accelerators. * = Active, but with new model / organisation. ** = Founders involved in another Tekes VC fund.
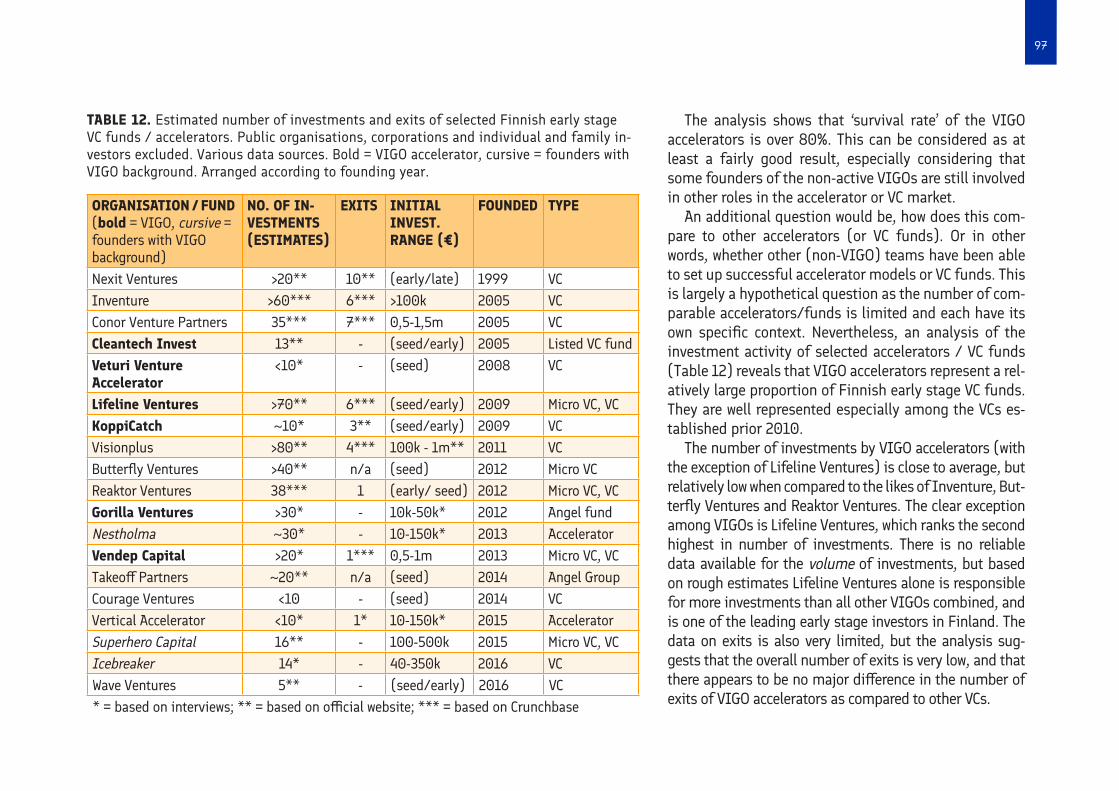
97
The analysis shows that ‘survival rate’ of the VIGO accelerators is over 80%. This can be considered as at least a fairly good result, especially considering that some founders of the non-active VIGOs are still involved in other roles in the accelerator or VC market.
An additional question would be, how does this com-pare to other accelerators (or VC funds). Or in other words, whether other (non-VIGO) teams have been able to set up successful accelerator models or VC funds. This is largely a hypothetical question as the number of com-parable accelerators/funds is limited and each have its own specific context. Nevertheless, an analysis of the investment activity of selected accelerators / VC funds (Table 12) reveals that VIGO accelerators represent a rel-atively large proportion of Finnish early stage VC funds. They are well represented especially among the VCs es-tablished prior 2010.
The number of investments by VIGO accelerators (with the exception of Lifeline Ventures) is close to average, but relatively low when compared to the likes of Inventure, But-terfly Ventures and Reaktor Ventures. The clear exception among VIGOs is Lifeline Ventures, which ranks the second highest in number of investments. There is no reliable data available for the volume of investments, but based on rough estimates Lifeline Ventures alone is responsible for more investments than all other VIGOs combined, and is one of the leading early stage investors in Finland. The data on exits is also very limited, but the analysis sug-gests that the overall number of exits is very low, and that there appears to be no major difference in the number of exits of VIGO accelerators as compared to other VCs.
ORGANISATION / FUND(bold = VIGO, cursive = founders with VIGO background)
NO. OF IN-VESTMENTS (ESTIMATES)
EXITS INITIAL INVEST. RANGE (€)
FOUNDED TYPE
Nexit Ventures >20** 10** (early/late) 1999 VCInventure >60*** 6*** >100k 2005 VCConor Venture Partners 35*** 7*** 0,5-1,5m 2005 VCCleantech Invest 13** - (seed/early) 2005 Listed VC fundVeturi Venture Accelerator
<10* - (seed) 2008 VC
Lifeline Ventures >70** 6*** (seed/early) 2009 Micro VC, VCKoppiCatch ~10* 3** (seed/early) 2009 VCVisionplus >80** 4*** 100k - 1m** 2011 VCButterfly Ventures >40** n/a (seed) 2012 Micro VCReaktor Ventures 38*** 1 (early/ seed) 2012 Micro VC, VCGorilla Ventures >30* - 10k-50k* 2012 Angel fundNestholma ~30* - 10-150k* 2013 AcceleratorVendep Capital >20* 1*** 0,5-1m 2013 Micro VC, VCTakeoff Partners ~20** n/a (seed) 2014 Angel GroupCourage Ventures <10 - (seed) 2014 VCVertical Accelerator <10* 1* 10-150k* 2015 AcceleratorSuperhero Capital 16** - 100-500k 2015 Micro VC, VCIcebreaker 14* - 40-350k 2016 VCWave Ventures 5** - (seed/early) 2016 VC* = based on interviews; ** = based on official website; *** = based on Crunchbase
TABLE 12. Estimated number of investments and exits of selected Finnish early stage VC funds / accelerators. Public organisations, corporations and individual and family in-vestors excluded. Various data sources. Bold = VIGO accelerator, cursive = founders with VIGO background. Arranged according to founding year.
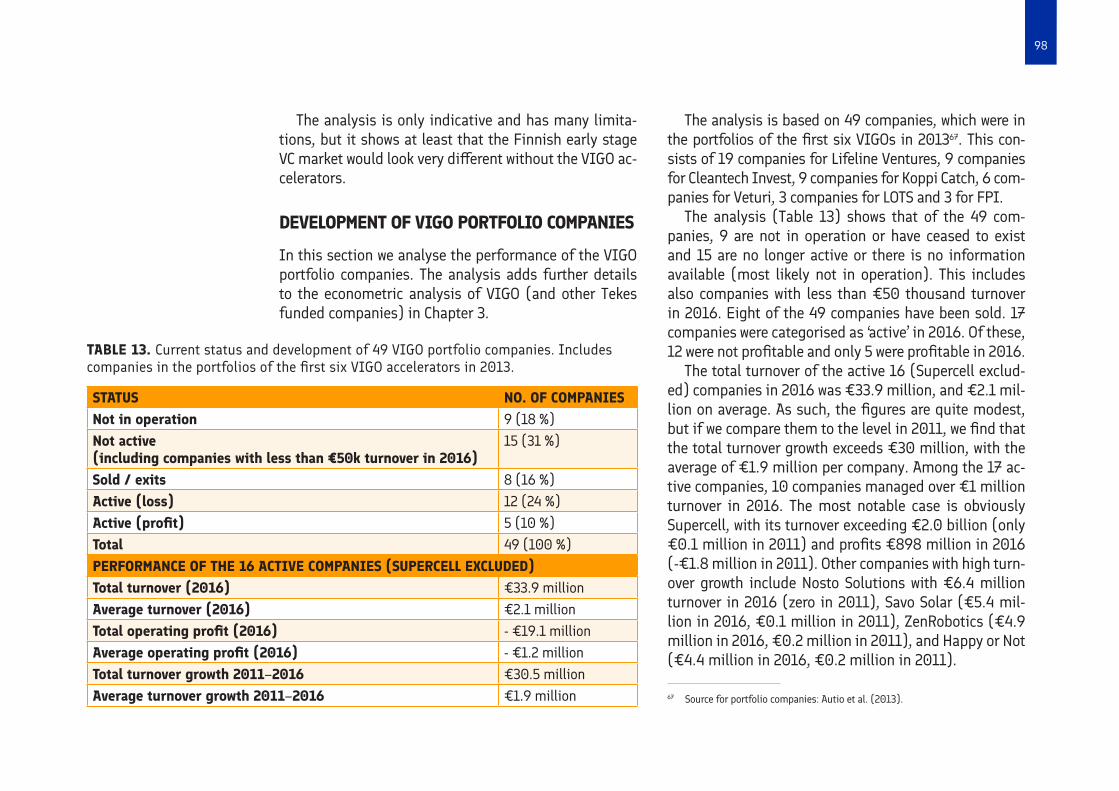
98
The analysis is only indicative and has many limita-tions, but it shows at least that the Finnish early stage VC market would look very different without the VIGO ac-celerators.
DEVELOPMENT OF VIGO PORTFOLIO COMPANIES
In this section we analyse the performance of the VIGO portfolio companies. The analysis adds further details to the econometric analysis of VIGO (and other Tekes funded companies) in Chapter 3.
The analysis is based on 49 companies, which were in the portfolios of the first six VIGOs in 201367. This con-sists of 19 companies for Lifeline Ventures, 9 companies for Cleantech Invest, 9 companies for Koppi Catch, 6 com-panies for Veturi, 3 companies for LOTS and 3 for FPI.
The analysis (Table 13) shows that of the 49 com-panies, 9 are not in operation or have ceased to exist and 15 are no longer active or there is no information available (most likely not in operation). This includes also companies with less than €50 thousand turnover in 2016. Eight of the 49 companies have been sold. 17 companies were categorised as ‘active’ in 2016. Of these, 12 were not profitable and only 5 were profitable in 2016.
The total turnover of the active 16 (Supercell exclud-ed) companies in 2016 was €33.9 million, and €2.1 mil-lion on average. As such, the figures are quite modest, but if we compare them to the level in 2011, we find that the total turnover growth exceeds €30 million, with the average of €1.9 million per company. Among the 17 ac-tive companies, 10 companies managed over €1 million turnover in 2016. The most notable case is obviously Supercell, with its turnover exceeding €2.0 billion (only €0.1 million in 2011) and profits €898 million in 2016 (-€1.8 million in 2011). Other companies with high turn-over growth include Nosto Solutions with €6.4 million turnover in 2016 (zero in 2011), Savo Solar (€5.4 mil-lion in 2016, €0.1 million in 2011), ZenRobotics (€4.9 million in 2016, €0.2 million in 2011), and Happy or Not (€4.4 million in 2016, €0.2 million in 2011).
STATUS NO. OF COMPANIESNot in operation 9 (18 %)Not active (including companies with less than €50k turnover in 2016)
15 (31 %)
Sold / exits 8 (16 %)Active (loss) 12 (24 %)Active (profit) 5 (10 %)Total 49 (100 %)PERFORMANCE OF THE 16 ACTIVE COMPANIES (SUPERCELL EXCLUDED) Total turnover (2016) €33.9 millionAverage turnover (2016) €2.1 millionTotal operating profit (2016) - €19.1 millionAverage operating profit (2016) - €1.2 millionTotal turnover growth 2011–2016 €30.5 millionAverage turnover growth 2011–2016 €1.9 million
TABLE 13. Current status and development of 49 VIGO portfolio companies. Includes companies in the portfolios of the first six VIGO accelerators in 2013.
67 Source for portfolio companies: Autio et al. (2013).
99
The total operating profit of the 16 active companies (Supercell excluded) was -€19.1 million (-€1.2 million on average) in 2016. As mentioned above, only 5 of these companies were profitable in 2016, and even for them the profits were quite modest (excluding Supercell) with only one managing profits of more than €100 thousand. The low profitability is quite expected and indicates that many companies are still in the “valley of death”, and it would be too early to make conclusions over their per-formance. As an example, all the 8 companies sold had negative profits by the time of the acquisition.
To sum up, although on average the performance of the VIGO portfolio companies (of the first six VIGO ac-celerators) has been quite modest, there are also several success stories or companies with high potential includ-ed. This can be considered as a sign of (desired) risk taking by VIGOs.
HOW TO BENCHMARK ACCELERATORS?
Due to the limitations elaborated above, benchmark-ing VIGO accelerators with other accelerators or venture support models proved out to be expectedly difficult. To provide some guidelines on benchmarking accelerators (and other venture support programmes) we drafted a separate report (see Annex report 2) which discusses the issues with accelerator benchmarking in more detail, building on an accelerator logic model (Figure 36).
An accelerator logic model serves as an accelerator’s “roadmap” of how its activities are expected to lead to improved venture performance. It is structured to de-
scribe, in a logical sequence, an accelerator’s purpose, the inputs (resources) that are available to carry out its mandate, the activities and services offered, and the ex-pected impacts on its client companies. In this respect, the logic model can be used as a narrative to describe the accelerator ‘from purpose to impact’.
Reading from left to right, the accelerator programme logic model identifies the broad purposes of accelera-tors and the situations they address. It provides a series of ‘if-then’ or ‘cause-effect’ relationships that lead to ex-pected impacts. For example, if the inputs are available, then activities and programmes can be mobilised, and if suitable activities and programmes are mobilised and offered to ventures, then impacts may be expected.
Working backwards, the logic model illustrates how different types of impact (outcomes) are achieved. The achievement of ultimate, long-term, or socio-economic impact depends on the achievement of impacts on ven-tures’ performance, which in turn depends on the achieve-ment of impacts on ventures’ resources and capabilities. For an accelerator, which seeks to improve venture firms performance in terms of growth, overall valuation, etc. as well as to stimulate economic prosperity in its region (its purpose and desired long-term impact), it does so by facilitating improvements in improving companies’ capabilities, enabling them to perform at a higher level than would otherwise be possible.
The purpose or mandate describes the raison d’être of accelerator programmes. The primary focus of ac-celerator programmes is to accelerate and support the development of high potential startup companies and
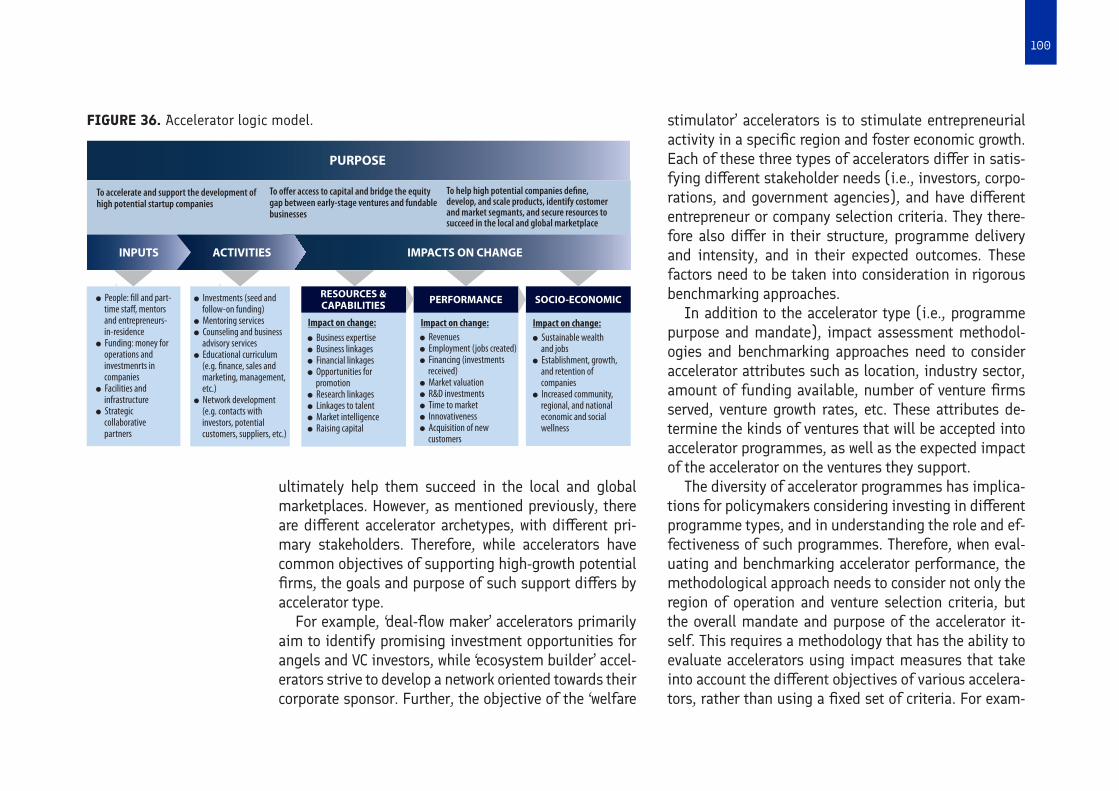
100
ultimately help them succeed in the local and global marketplaces. However, as mentioned previously, there are different accelerator archetypes, with different pri-mary stakeholders. Therefore, while accelerators have common objectives of supporting high-growth potential firms, the goals and purpose of such support differs by accelerator type.
For example, ‘deal-flow maker’ accelerators primarily aim to identify promising investment opportunities for angels and VC investors, while ‘ecosystem builder’ accel-erators strive to develop a network oriented towards their corporate sponsor. Further, the objective of the ‘welfare
l Business expertisel Business linkagesl Financial linkagesl Opportunities for promotionl Research linkagesl Linkages to talentl Market intelligencel Raising capital
l People: fill and part- time staff, mentors and entrepreneurs- in-residencel Funding: money for operations and investmenrts in companiesl Facilities and infrastructurel Strategic collaborative partners
l Investments (seed and follow-on funding)l Mentoring servicesl Counseling and business advisory servicesl Educational curriculum (e.g. finance, sales and marketing, management, etc.)l Network development (e.g. contacts with investors, potential customers, suppliers, etc.)
l Sustainable wealth and jobsl Establishment, growth, and retention of companiesl Increased community, regional, and national economic and social wellness
l Revenuesl Employment (jobs created)l Financing (investments received)l Market valuationl R&D investmentsl Time to marketl Innovativenessl Acquisition of new customers
RESOURCES &CAPABILITIES PERFORMANCE
PURPOSE
ACTIVITIESINPUTS
SOCIO-ECONOMIC
Impact on change:
To accelerate and support the development ofhigh potential startup companies
To offer access to capital and bridge the equitygap between early-stage ventures and fundablebusinesses
To help high potential companies define,develop, and scale products, identify costomerand market segmants, and secure resources tosucceed in the local and global marketplace
Impact on change: Impact on change:
IMPACTS ON CHANGE
FIGURE 36. Accelerator logic model. stimulator’ accelerators is to stimulate entrepreneurial activity in a specific region and foster economic growth. Each of these three types of accelerators differ in satis-fying different stakeholder needs (i.e., investors, corpo-rations, and government agencies), and have different entrepreneur or company selection criteria. They there-fore also differ in their structure, programme delivery and intensity, and in their expected outcomes. These factors need to be taken into consideration in rigorous benchmarking approaches.
In addition to the accelerator type (i.e., programme purpose and mandate), impact assessment methodol-ogies and benchmarking approaches need to consider accelerator attributes such as location, industry sector, amount of funding available, number of venture firms served, venture growth rates, etc. These attributes de-termine the kinds of ventures that will be accepted into accelerator programmes, as well as the expected impact of the accelerator on the ventures they support.
The diversity of accelerator programmes has implica-tions for policymakers considering investing in different programme types, and in understanding the role and ef-fectiveness of such programmes. Therefore, when eval-uating and benchmarking accelerator performance, the methodological approach needs to consider not only the region of operation and venture selection criteria, but the overall mandate and purpose of the accelerator it-self. This requires a methodology that has the ability to evaluate accelerators using impact measures that take into account the different objectives of various accelera-tors, rather than using a fixed set of criteria. For exam-
101
ple, it would be expected that ‘deal-flow maker’ acceler-ators would focus on impacting their ventures’ ability to access financing as well as increasing firms’ investments received, while ‘welfare stimulator’ accelerators may be expected to improve business expertise and increase overall employment (job creation). Further, it is essen-tial to differentiate between improvements to venture performance that are a consequence of accelerator sup-port services and funding, and improvements to venture performance that would have occurred in the absence of the accelerator. This distinction is crucial and has impli-cations on the approach used to assess the impact and rank accelerator programme performance.
The challenge for public policymakers is to determine whether accelerators are indeed beneficial to entrepre-
neurial outcomes, and if an accelerator programme is the most cost effective solution for a particular case. The accelerator programme must provide support that is effective in promoting and fostering entrepreneurial ac-tivity and outcomes, not just simply sustaining low-per-forming ventures.
As accelerator programmes are being developed, the accelerator logic model framework, which highlights ac-celerators’ purpose and key design parameters, should serve to define suitable success metrics in achieving certain objectives. Focusing on guiding the selection, development, and ongoing use of credible impact mea-sures, the use of an accelerator logic model framework, in combination with different approaches, enables effec-tive programme assessment and ranking.
102
The conclusions of the evaluation are grouped into three sections. The first section presents conclusions regard-ing the development of Finnish startup ecosystem and Tekes’ role in it. The second section presents conclu-sions regarding the impact of Tekes on startups, focus-ing particularly on the startup funding and Tekes NIY programme. The third section describes conclusions re-garding Tekes’ impact on the Finnish accelerator market, focusing mainly on the lessons from VIGO programme.
TEKES’ ROLE IN THE STARTUP ECOSYSTEMTHERE HAS BEEN A SIGNIFICANT POSITIVE DEVELOPMENT IN THE FINNISH STARTUP ECOSYSTEM
These developments include, among others the following:• Both the quality and quantity of startups is increas-
ing. Especially the emergence of 2nd and 3rd round startups (of more experienced entrepreneurs) is im-portant. However, the relatively low number of high profile exits and trade sales is seen as a bottleneck.
• Entrepreneurship has become more popular and an attractive career option for the young. This, large-ly a global trend, is seen as a key driver in boost-ing the Finnish startup ecosystem. This is especially positive trend in Finland, where the main gaps have traditionally been (and apparently still are) in the ‘stand-up’ stage.
• Diverse ‘support ecosystem’ of different public and private venture support models (such as regional in-cubators, university programmes, accelerators, plat-forms, co-working spaces and startup communities etc.) has emerged and is rapidly evolving. Especially the active role of ‘grassroots development’, driven by entrepreneurs and students, should be acknowledged.
• Early stage VC investments have increased and Fin-land has become more attractive for foreign VC in-vestments. This trend, complemented by the emer-gence of new types of funding sources and platforms, suggest that the availability of private seed / ear-ly-stage VC funding is no longer a major bottleneck at the ecosystem level. However, the size of the eco-system is still relatively small and funding gaps in later stages are seen as a bottleneck.
5 CONCLUSIONS AND RECOMMENDATIONS
103
• Corporations have started to become active players in the ecosystem (introducing and adopting lean startup approaches, corporate venturing models, etc). This, also largely a global trend, is seen to have important broader implications for the renewal of Finnish industries.
TEKES HAS PLAYED AN ACTIVE AND IMPORTANT ROLE IN THE STARTUP ECOSYSTEM DEVELOPMENT
Finnish startup ecosystem would have developed even without Tekes, albeit to a lesser extent. Tekes role in catalysing and shaping the startup ecosystem should not be neglected, and in some industries (e.g. games industry), its role has been vital. Tekes has had an im-portant role in laying the foundations for the develop-ment of new products, services and business models through its R&D funding for young companies. It has also had an important role in boosting the scaling up of the most promising Finnish startups through the NIY programme. VIGO programme (and now Tekes VC) has shaped the Finnish early stage venture support market.
THE NEED AND RATIONALE FOR TEKES INTERVENTION IN THE STARTUP ECOSYSTEM HAS CHANGED
Despite the recent trends and significant development of the ecosystem, Tekes remains an important ‘feeder’ and its main activities are highly relevant tools to sup-port the startup ecosystem also in the near future.
There is room for some improvements and adjust-ments in its future role. On a general level, Tekes (and policies in general) should maintain its role as a ‘feeder’ instead of a ‘leader’ in the ecosystem. In addition, there could be an opportunity for strengthening the ‘facilita-tor’ role in the future.
TEKES IMPACT ON STARTUPSTEKES FUNDING HAS HAD A CLEAR POSITIVE IMPACT ON STARTUP GROWTH
The econometric analyses show that Tekes funding boosts startups’ growth when compared to similar non-treated startups. Evidence suggests that there is impact beyond ‘selection effect’, i.e., that it is not simply that Tekes is able to pick better companies to fund but also that its funding has some positive causal effect on startup performance.
According to the econometric analyses, there is high-er growth of employment and turnover of Tekes-funded startups (versus non-treated counterparts on the basis of a matching exercise combined with a difference-in-dif-ferences regression). Labour productivity impacts seem positive but are less clear and come with considerable lag.
The analysis also shows that the survival rates of Tekes startups and counterparts are largely similar, al-though the Tekes startups have higher dispersion of growth outcomes (vs non-treated counterparts), which is consistent with desired risk-taking by Tekes.
104
TEKES FUNDING HAS COMPLEMENTED PRIVATE VC FUNDING
The econometric analyses also reveal that private VC funding tends to precede entry into the NIY programme (however, the converse is likely for Business Angel in-vestments) and vice versa in the case of other Tekes startup funding. This finding, in line with previous stud-ies, suggest that Tekes funding complements private VC funding.
The evidence from company interviews suggests that Tekes funding serves as a kind of proof-of-concept or “sanity check” for external investors, some of them us-ing Tekes funding as a mandatory requirement for their investments. This also gives Tekes a great responsibility of making consistent and well-informed decisions.
TEKES FUNDING HAS BOOSTED STARTUPS’ CAPABILITIES AND GROWTH
Findings from the surveys to Tekes startups and NIY participants suggest that Tekes funding has had sig-nificant positive impact on startups’ capabilities and performance. Or in other words, the findings show that Tekes funding has helped the companies develop their capabilities, resulting into improved performance and growth.
NIY programme participants attribute the most im-pact on their ability in getting into international markets and capacity to raise capital. Other startups attribute greatest impact on their improved R&D activities and product/service offerings.
LESS SIGNIFICANT IMPACT ON NETWORKING AND LINKAGES
The survey findings indicate that the impact on compa-nies’ networks and linkages have been less significant than on other capabilities. This suggest that there is an opportunity to further improve the impact on network-ing and linkages with different forms of non-financial support.
INCREASED IMPACT WITH NON-FINANCIAL SUPPORT
According to the survey findings, most startups and NIY programme participants received only financial support from Tekes. However, those that used the non-financial support services (e.g. mentoring, advisory or networking services) to a greater degree attribute higher average impact to Tekes on improvements to their capabilities and performance. However, most companies only used non-financial support offerings to a low degree, or did not use them at all. Therefore, an opportunity exists for Tekes to increase its impact by strengthening these offer-ings and by encouraging companies to use the mentoring and connections support services to a greater degree.
105
Startup respondents also indicated an interest in be-ing afforded greater access to the technical expertise necessary to commercialise their product offerings. In company interviews, the newly established NIY Found-ers Network, where NIY participants can share their ex-periences with their peers, received encouraging feed-back.
NIY FLEXIBILITY WELL-SUITED TO COMMERCIALISATION AND SCALING UP...
Interviews with NIY programme participants, as well as survey feedback, suggest that the scope and flexibility of the NIY funding are very good. NIY funding was praised especially for its suitability to commercialisation and scaling up the business internationally. The companies, in general, also seem to value the NIY funding process and the mandatory ‘milestones’ which help in crystallis-ing goals and business plans.
...BUT ROOM FOR EVEN FURTHER FLEXIBILITY TO INCREASE IMPACT
Although there is no broad evidence that the NIY pro-gramme would provide the startups ‘excessive’ resourc-es, the issue was raised in some of the interviews and it is something that should be monitored closely − es-pecially given that a certain resource scarcity is often
seen as an important breeding ground for startups and new innovations and ‘premature scaling’ as an important cause of startups failure. Further improving the abili-ty to reallocate the funding, and allow rapid ‘pivoting’, would help to avoid this pitfall, and also improve the impact of the funding by better targeting of resourc-es. Another issue is related to the age limit (formerly 6 years, currently maximum 5 years at the beginning of the participation) of NIY participation. This may attract some companies to apply for NIY programme too early, and thus increase the probability of premature scaling or ‘doing right things at the wrong time’. The age limit is based on EU regulation.
DESPITE GOOD RESULTS, BROADENING THE NIY SCOPE NOT FEASIBLE
Based on our understanding, and the reasoning above, it would be ill-advised to broaden the NIY programme to include more startups, as it is an instrument which works only for the most promising startups at a certain stage of their life-cycle. It appears that currently there simply would not be enough promising startups for the NIY programme to be extended. It seems that increasing the number of companies would mean that lower quali-ty startups would be accepted, i.e., the programme can probably only grow as the population of aspiring start-ups in Finland grow in years to come.

106
ROLE OF ENTREPRENEURIAL SPILL-OVERS IMPORTANT, MORE INFORMATION NEEDED
The importance of spill-over effects (for example the transfer of technology, knowledge and skilled workforce between companies) as the rationale for public business support is often highlighted.
The case studies on NIY participants illustrate the role of ‘entrepreneurial recycling’ and highlight the need to look beyond individual startups to better understand the role of Tekes activities in the startup ecosystem. The lack of ‘tech spill-overs’ in interview data is in line with previous research highlighting the importance of spill-overs related to business model and scale-up compe-tences in the startup ecosystem. However, the evidence is only anecdotal and more information is needed.
TEKES IMPACT ON THE ACCELERATOR MARKETFINNISH ‘ACCELERATOR MARKET’ IS DIVERSE AND HETEROGENEOUS, CORPORATE VENTURING IMPORTANT TREND − NO MAJOR INTERVENTIONS NEEDED
A diverse venture support ecosystem has emerged in the past ten years in Finland. The term accelerator has been used broadly to refer to many different types of models. An analysis of the different models reveals that there are only a few programmes or models which match the com-
monly adopted definition for accelerators. Especially the criteria of ‘investment provision’ is often not met. The lack of ‘US-type deal-flow accelerators’, it seems, is at least partly explained by the fact that the Finnish start-up ecosystem is still maturing and there simply is not enough deal-flow to support a wider network of (deal-flow) accelerators. Instead, the Finnish accelerators typ-ically operate as match-makers or ecosystem builders, linking startups with corporations and public reference clients.
Overall, any policies regarding accelerators should ac-knowledge that the accelerators are not a homogeneous group; have different roles and purposes in the ecosys-tem; operate with different business models; and are of-ten startups themselves, i.e. looking for the most fitting business model. The evidence from interviews suggest that the lack of knowledge as well as common language has led to some misconceptions on the role of acceler-ators in the startup ecosystem (including VIGOs, which have adopted different models and roles as described in Chapter 4).
A notable trend from the Tekes perspective is the in-creased activity of corporations and emergence of cor-porate venturing models.
All in all, the analysis suggests that the accelerator / early stage VC market is developing and there is no rationale for new major public interventions. However, further knowledge transfer and facilitation would help to develop the ecosystem.
107
VIGO HAD A ROLE IN CATALYSING THE ACCELERATOR MARKET − DESPITE LIMITATIONS IN THE PROGRAMME DESIGN
The interviews and analysis of VIGO founders suggest that the VIGO programme − despite its apparent and widely acknowledged flaws − has had a clear (although limited) role in catalysing the Finnish accelerator / early stage VC market. It seems that the positive outcomes are largely a result of active entrepreneurs’ own activi-ties, and the role of the VIGO programme was limited but not insignificant. The programme provided valuable learnings and experiences of different models for the VIGO founders and had some role in attracting them to the field.
Currently, many of the VIGO-originated VC funds are invested in by the Tekes VC. The success of Tekes VC is too early to assess here, but interviews suggest that the model works reasonably well, although it receives some criticism elaborated in the report.
VIGO ACCELERATORS HAVE CONTRIBUTED TO THE EMERGENCE OF HIGH GROWTH VENTURES
Despite some limitations, the analysis of the VIGO ac-celerators’ portfolio companies suggest that VIGO accel-erators have contributed to the emergence of new high-growth companies in Finland − although with mixed results. Overall, the relatively high survival rate of the founder teams, number of VC funds established and some success stories of portfolio startups suggest that the performance is positive but varies significantly.
The summary of main findings and conclusions is presented in Table 14.
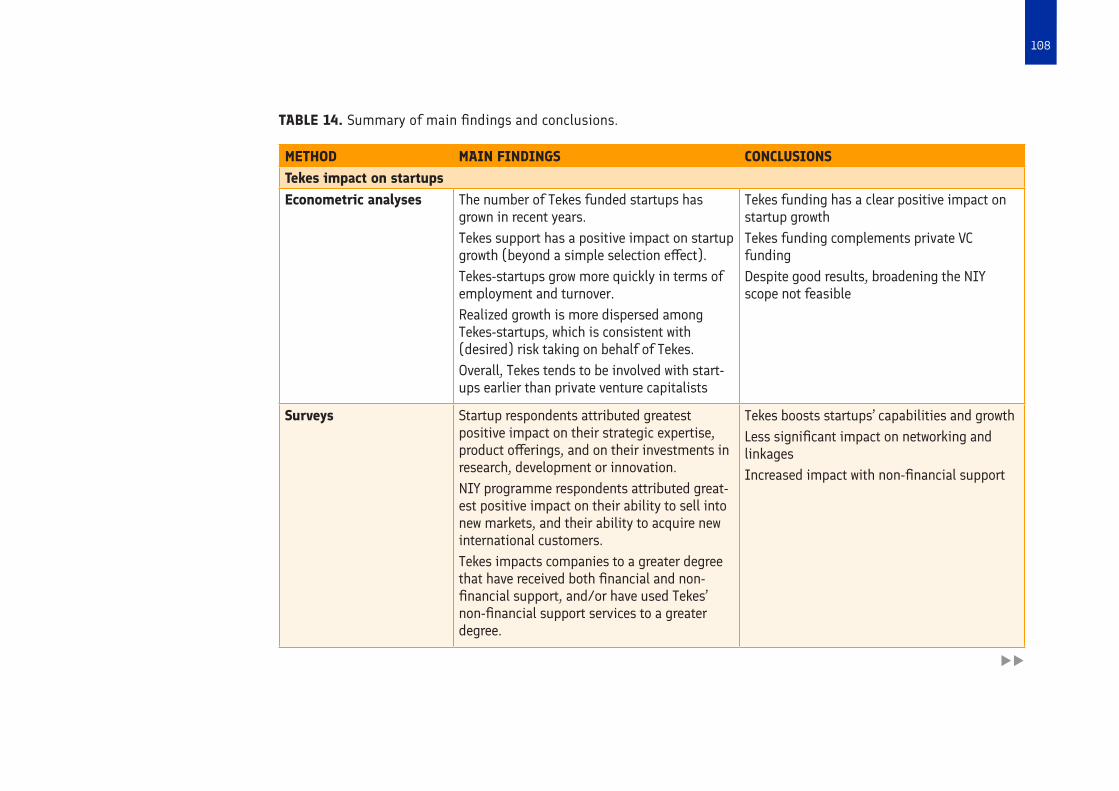
108
TABLE 14. Summary of main findings and conclusions.
METHOD MAIN FINDINGS CONCLUSIONSTekes impact on startupsEconometric analyses The number of Tekes funded startups has
grown in recent years. Tekes support has a positive impact on startup growth (beyond a simple selection effect). Tekes-startups grow more quickly in terms of employment and turnover. Realized growth is more dispersed among Tekes-startups, which is consistent with (desired) risk taking on behalf of Tekes.Overall, Tekes tends to be involved with start-ups earlier than private venture capitalists
Tekes funding has a clear positive impact on startup growthTekes funding complements private VC fundingDespite good results, broadening the NIY scope not feasible
Surveys Startup respondents attributed greatest positive impact on their strategic expertise, product offerings, and on their investments in research, development or innovation.NIY programme respondents attributed great-est positive impact on their ability to sell into new markets, and their ability to acquire new international customers.Tekes impacts companies to a greater degree that have received both financial and non- financial support, and/or have used Tekes’ non-financial support services to a greater degree.
Tekes boosts startups’ capabilities and growth Less significant impact on networking and linkagesIncreased impact with non-financial support
uu
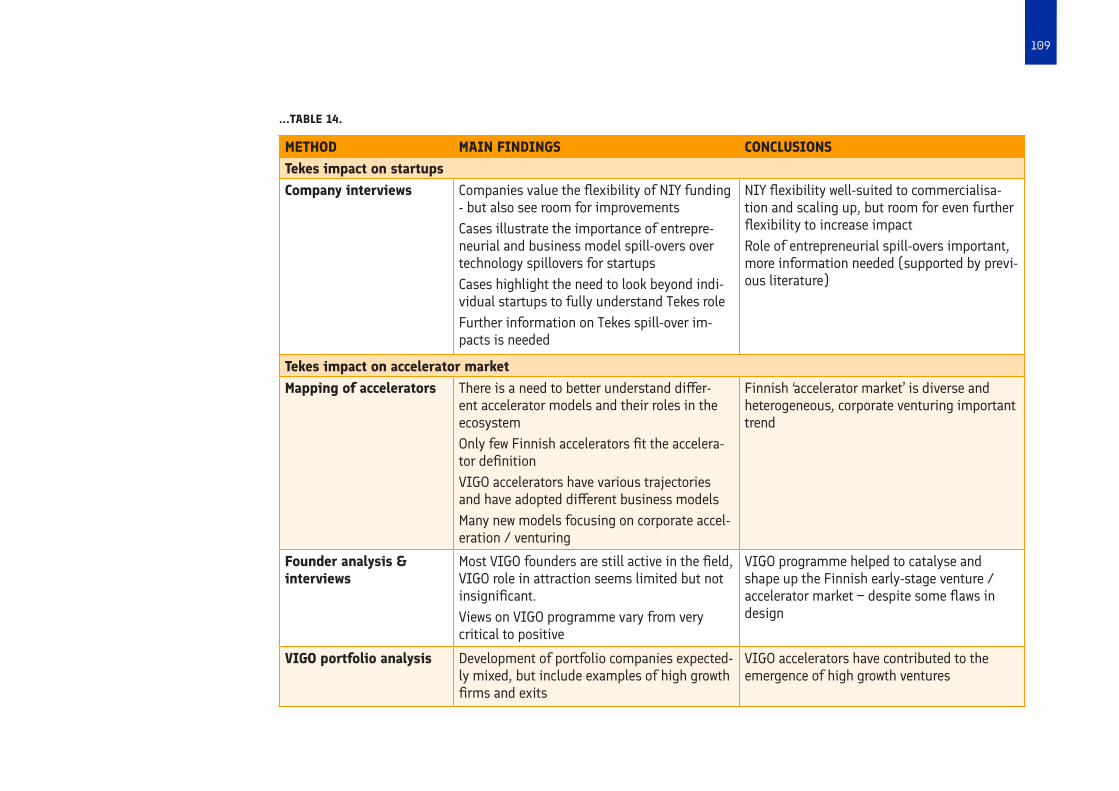
109
METHOD MAIN FINDINGS CONCLUSIONSTekes impact on startupsCompany interviews Companies value the flexibility of NIY funding
- but also see room for improvementsCases illustrate the importance of entrepre-neurial and business model spill-overs over technology spillovers for startupsCases highlight the need to look beyond indi-vidual startups to fully understand Tekes role Further information on Tekes spill-over im-pacts is needed
NIY flexibility well-suited to commercialisa-tion and scaling up, but room for even further flexibility to increase impact Role of entrepreneurial spill-overs important, more information needed (supported by previ-ous literature)
Tekes impact on accelerator marketMapping of accelerators There is a need to better understand differ-
ent accelerator models and their roles in the ecosystem Only few Finnish accelerators fit the accelera-tor definitionVIGO accelerators have various trajectories and have adopted different business modelsMany new models focusing on corporate accel-eration / venturing
Finnish ‘accelerator market’ is diverse and heterogeneous, corporate venturing important trend
Founder analysis & interviews
Most VIGO founders are still active in the field, VIGO role in attraction seems limited but not insignificant.Views on VIGO programme vary from very critical to positive
VIGO programme helped to catalyse and shape up the Finnish early-stage venture / accelerator market − despite some flaws in design
VIGO portfolio analysis Development of portfolio companies expected-ly mixed, but include examples of high growth firms and exits
VIGO accelerators have contributed to the emergence of high growth ventures
...TABLE 14.
110
RECOMMENDATIONS
Based on the evaluation, the following recommenda-tions are given for Tekes (and Business Finland) in order to further develop the Finnish startup ecosystem and to boost startup development.
RECOMMENDATION 1: MAINTAIN ‘FEEDER’ ROLE, ADOPT STRONGER ROLE AS ‘FACILITATOR’
Tekes should maintain its strong ‘feeder’ role in the startup ecosystem by providing funding and other sup-port for the most potential Finnish startups.
At the same time, Tekes (as part of Business Finland) should explore options for improving its role as a ‘fa-cilitator’ and better synchronising its startup activities with other ecosystem actors such as accelerators, VCs and startup communities. In practice, this may include for example• Increasing knowledge sharing and communication
with other actors, e.g. by experimenting ‘Accelerator Days’ concept or establishing an ‘Ecosystem Manag-er’ position in the new Business Finland organisation
• Making the ecosystem more transparent and facili-tate knowledge flows, e.g. by setting up a database of venture support actors and by collecting data on Finnish startups
• Facilitating policy level discussion on startups eco-system bottlenecks and gaps (for example on at-tracting and retaining startup teams and talent)
• Facilitating the linkages of Finnish startup ecosys-tem to leading startup ecosystems and hotspots (e.g. ‘exporting’ Finnish ecosystem to key events abroad)
• Carefully planning and aligning all new initiatives and actions with other ecosystem actors
To support the ecosystem development Tekes should also consider utilising more challenge-driven approach-es and aligning its startup activities with societal chal-lenges. Although there is no strong evidence for this ap-proach, it could not only help Tekes improve its societal impact and contribution to solving societal challenges, but also help providing some direction and priorities for other actors in the ecosystem. In practice this could, for example, mean allocating larger share of the startup funding through challenge competitions or other chal-lenge-driven funding instruments.
RECOMMENDATION 2: MORE ATTENTION TO LINKAGES AND SPILL-OVER EFFECTS
In order to improve its broader economic and social im-pact, and in line with the first recommendation, Tekes (and Business Finland) should put more attention on directly promoting the spill-over effects of its funding services (i.e. promoting the transfer of knowledge, tech-nologies, talent, etc. in the startup ecosystem). In prac-tice this would mean for example:• Fostering companies’ capabilities related to network-
ing and linkages to peers, corporations, industry ex-perts, etc., e.g. through the NIY Founders Forum
111
concept, or by maintaining (providing access to) a database of different experts and startup service providers.
• Experimenting approaches to further develop corpo-rate venturing and collaboration with startups, and synchronising Tekes startup activities with Tekes SME and corporate activities and new Business Fin-land programmes.
• Highlighting the role of spill-overs in the new Busi-ness Finland strategy and implementation, as well as in communications and marketing
• Encouraging companies to open innovation and knowledge sharing in funding criteria
• Exploring options for supporting re-startup of am-bitious founder teams (whose previous startup may have failed)
• Developing, in collaboration with researchers and other experts, approaches and tools for measuring spill-overs of Tekes funding
RECOMMENDATION 3: FINE-TUNE EXISTING PRODUCTS AND SERVICES − AND KEEP EXPLORING NEW ONES
Tekes’ main instruments for startups seem to be working reasonably well. However, there is some room for further adjustments and improvements. These include for ex-ample:• Better utilisation of non-financial support instru-
ments, in collaboration with other service providers (see recommendation 2)
• Further improve the NIY flexibility and adaptability to ‘pivoting’ and rapid changes in plans
• Exploring opportunities for creating new ‘scaling in-strument’ (regardless of age), building on the expe-riences and good practices
• Continue ‘lobbying’ EU regulation to allow NIY fund-ing for older companies
• Review possible bottlenecks for ‘born global compa-nies’ to access NIY funding
• Strengthening industry specific approaches in se-lected priority areas (e.g. stronger industry expertise in NIY expert panel)
Finally, taking into account the complexity and un-predictability of the startup ecosystem development, Tekes should keep exploring and experimenting new kinds of products and services for startups. Specific em-phasis should be in supporting the ‘stand-phase’. This could mean for example developing services to support re-startup or corporate venturing. Another opportunity could be exploring − in collaboration with MEE, cities and other stakeholders − the introduction of ‘regulatory sandboxes’ to support the piloting of disruptive busi-ness models and concepts.
112
RECOMMENDATION 4: EXPLORE MORE MARKET-DRIVEN SELECTION PROCESSES
Acknowledging Tekes’ important ‘gate-keeping’ role in the startup ecosystem and the importance of company selection in Tekes impact model, Tekes should explore and experiment more market-driven selection process-es. This could mean for example:• Strengthening the NIY expert panel review process,
e.g. by extending the expert pool with (internation-al) industry experts and/or utilising crowd-sourcing tools
• Exploring the opportunities of using artificial intelli-gence for making funding decisions
• Putting more weight on private investor involvement in startups when making the funding decisions
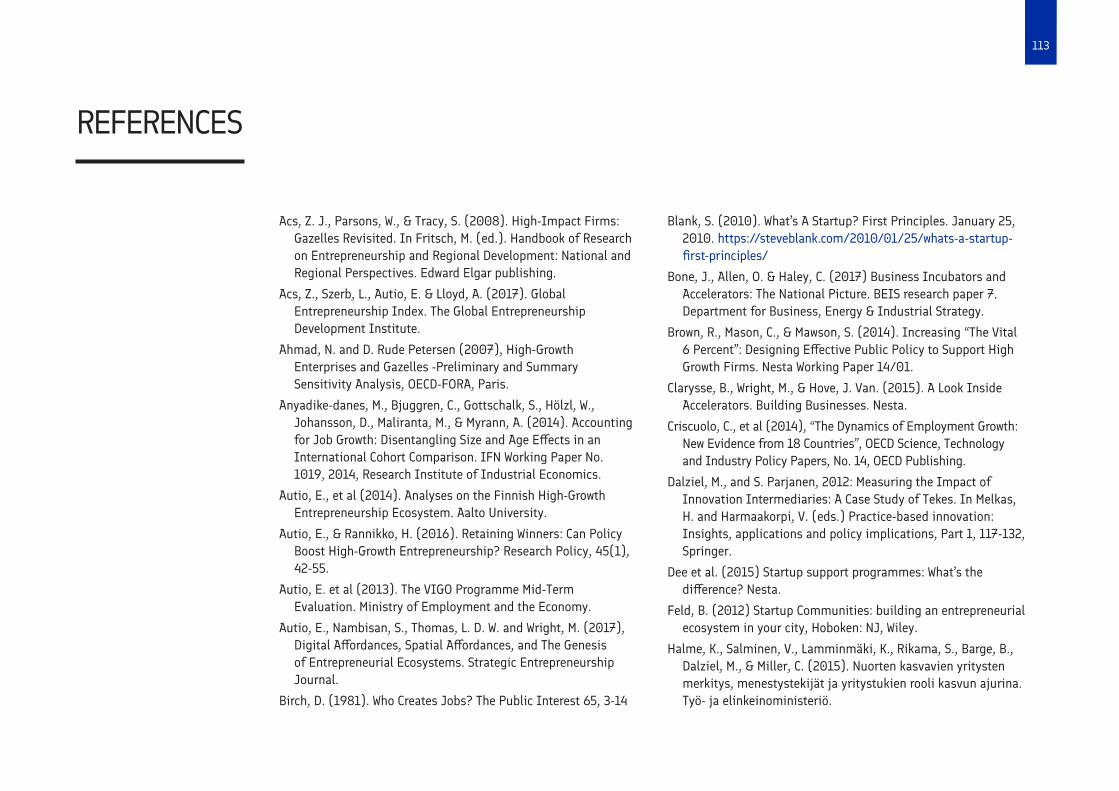
113
Acs, Z. J., Parsons, W., & Tracy, S. (2008). High-Impact Firms: Gazelles Revisited. In Fritsch, M. (ed.). Handbook of Research on Entrepreneurship and Regional Development: National and Regional Perspectives. Edward Elgar publishing.
Acs, Z., Szerb, L., Autio, E. & Lloyd, A. (2017). Global Entrepreneurship Index. The Global Entrepreneurship Development Institute.
Ahmad, N. and D. Rude Petersen (2007), High-Growth Enterprises and Gazelles -Preliminary and Summary Sensitivity Analysis, OECD-FORA, Paris.
Anyadike-danes, M., Bjuggren, C., Gottschalk, S., Hölzl, W., Johansson, D., Maliranta, M., & Myrann, A. (2014). Accounting for Job Growth: Disentangling Size and Age Effects in an International Cohort Comparison. IFN Working Paper No. 1019, 2014, Research Institute of Industrial Economics.
Autio, E., et al (2014). Analyses on the Finnish High-Growth Entrepreneurship Ecosystem. Aalto University.
Autio, E., & Rannikko, H. (2016). Retaining Winners: Can Policy Boost High-Growth Entrepreneurship? Research Policy, 45(1), 42-55.
Autio, E. et al (2013). The VIGO Programme Mid-Term Evaluation. Ministry of Employment and the Economy.
Autio, E., Nambisan, S., Thomas, L. D. W. and Wright, M. (2017), Digital Affordances, Spatial Affordances, and The Genesis of Entrepreneurial Ecosystems. Strategic Entrepreneurship Journal.
Birch, D. (1981). Who Creates Jobs? The Public Interest 65, 3-14
REFERENCES
Blank, S. (2010). What’s A Startup? First Principles. January 25, 2010. https://steveblank.com/2010/01/25/whats-a-startup-first-principles/
Bone, J., Allen, O. & Haley, C. (2017) Business Incubators and Accelerators: The National Picture. BEIS research paper 7. Department for Business, Energy & Industrial Strategy.
Brown, R., Mason, C., & Mawson, S. (2014). Increasing “The Vital 6 Percent”: Designing Effective Public Policy to Support High Growth Firms. Nesta Working Paper 14/01.
Clarysse, B., Wright, M., & Hove, J. Van. (2015). A Look Inside Accelerators. Building Businesses. Nesta.
Criscuolo, C., et al (2014), “The Dynamics of Employment Growth: New Evidence from 18 Countries”, OECD Science, Technology and Industry Policy Papers, No. 14, OECD Publishing.
Dalziel, M., and S. Parjanen, 2012: Measuring the Impact of Innovation Intermediaries: A Case Study of Tekes. In Melkas, H. and Harmaakorpi, V. (eds.) Practice-based innovation: Insights, applications and policy implications, Part 1, 117-132, Springer.
Dee et al. (2015) Startup support programmes: What’s the difference? Nesta.
Feld, B. (2012) Startup Communities: building an entrepreneurial ecosystem in your city, Hoboken: NJ, Wiley.
Halme, K., Salminen, V., Lamminmäki, K., Rikama, S., Barge, B., Dalziel, M., & Miller, C. (2015). Nuorten kasvavien yritysten merkitys, menestystekijät ja yritystukien rooli kasvun ajurina. Työ- ja elinkeinoministeriö.

114
Holly, K. (2013). Seven Reasons Why Startups Won’t Save The Economy. September 20, 2013, Forbes. Available at: https://www.forbes.com/sites/krisztinaholly/2013/09/20/seven-reasons-why-startups-wont-save-the-economy/#3d6ab2c15ec0
Iacus, S., King, G. & Porro, G. (2011). Multivariate Matching Methods That are Monotonic Imbalance Bounding. Journal of the American Statistical Association, 106, 493, 345-361.
Iacus, S., King, G. & Porro, G. (2012). Causal Inference without Balance Checking: Coarsened Exact Matching. Political Analysis, 20(1), 1-24.
Isenberg, D. J. (2010). The big idea: How to start an entrepreneurial revolution. Harvard Business Review, 88(6).
Koski, H., & Pajarinen, M. (2013). The role of business subsidies in job creation of startups, gazelles and incumbents. Small Business Economics, 41(1), 195-214.
Kotiranta, A., Pajarinen, M., & Rouvinen, P. (2017). Characteristics and development of Finnish startups funded by Tekes in 2005–2015.ETLA Reports, forthcoming.
Lahtinen, H. et al. (2016). Startup-yritysten kasvun ajurit ja pullonkaulat. Valtioneuvoston selvitys- ja tutkimustoiminnan julkaisusarja 30/2016, Valtioneuvoston kanslia.
Lerner, J. (2009). Boulevard of Broken Dreams: Why Public Efforts to Boost Entrepreneurship and Venture Capital Have Failed - and What to Do About It. Princetown University Press, New Jersey.
Luukkonen, T. (2010). The Effectiveness of the Finnish Pre-seed and Seed Policy Schemes to Promote Innovative High-growth Entrepreneurial Ventures. Etla Discussion Paper 1221, Etla.
Mason, C., & Brown, R. (2014). Entrepreneurial Ecosystems and Growth Oriented Entrepreneurship. Background paper prepared for the workshop organised by the OECD LEED Programme and the Dutch Ministry of Economic Affairs on Entrepreneurial Ecosystems and Growth Oriented Entrepreneurship. OECD.
Miller, P. & Bound, K. (2011) ‘The Startup Factories: The rise of accelerator programmes to support new technology ventures’. Nesta.
Naukkarinen, J. (2014) Katsaus yrityskiihdyttämöihin Suomessa ja maailmalla. Lappeenrannan teknillinen yliopisto.
Nesta (2014) Startup Accelerator Programmes: a practical guide. Nesta
Nestpick (2017). Startup Cities Index. https://www.nestpick.com/best-cities-for-startup-employees/
OECD (2013). An International Benchmarking Analysis of Public Programmes for High-Growth Firms. OECD.
Pajarinen, M., & Rouvinen, P. (2009). Esitutkimus kasvuyrittäjyyden ja kasvuyrityspolitiikan kansantaloudellisesta merkityksestä.
Pajarinen, M., Rouvinen, P., & Ylhäinen, I. (2016). Kasvun nälkä – Pääomasijoitetut yritykset muutosagentteina. Helsinki: Taloustieto Oy (julkaisijat: Tekes ja FVCA).
Patel, N. (2015). 90% Of Startups Fail: Here’s What You Need To Know About The 10%. Forbes, Jan 16, 2015. Available at: https://www.forbes.com/sites/neilpatel/2015/01/16/90-of-startups-will-fail-heres-what-you-need-to-know-about-the-10/#5616be786679
Pauwels, C. et al (2016). Understanding a new generation incubation model: The accelerator. Technovation, 50-51; 13-24.
Ruohonen, J. (2007). VICTA - Virtual ICT Accelerator. Technology Review 219/2007, Tekes.
Startup Commons (n/a). Startup Development Phases. http://www.startupcommons.org/startup-development-phases.html
Startup Genome (2017). The Global Startup Ecosystem Ranking 2017. Startup Genome.

115
Startup Foundation (n/a). http://www.startup-saatio.fi/
Strangler, D. (2017). Growing Helsinki’s Startup Ecosystem. June 2017, Startup Genome.
Tekes (n/a). Tekes funding for startup companies. https://www.tekes.fi/en/funding/startup/
TEM (2009). Työ- ja elinkeinoministeriön päätös yrityskiihdyttämöohjelmasta. TEM, 20.3.2009.
The Global Entrepreneurship Development Institute (GEDI). https://thegedi.org/
VIGO (n/a). VIGO Venture Accelerators. Driving Fast Growth of High Potential Startups. Presentation at www.vigo.fi
Ylhäinen, I., Rouvinen, P. & Kuusi, T. (2016). Katsaus yksityisen t&k-toiminnan ja sen julkisen rahoituksen vaikuttavuuteen. Valtioneuvoston selvitys- ja tutkimustoiminnan julkaisusarja 57/2016.
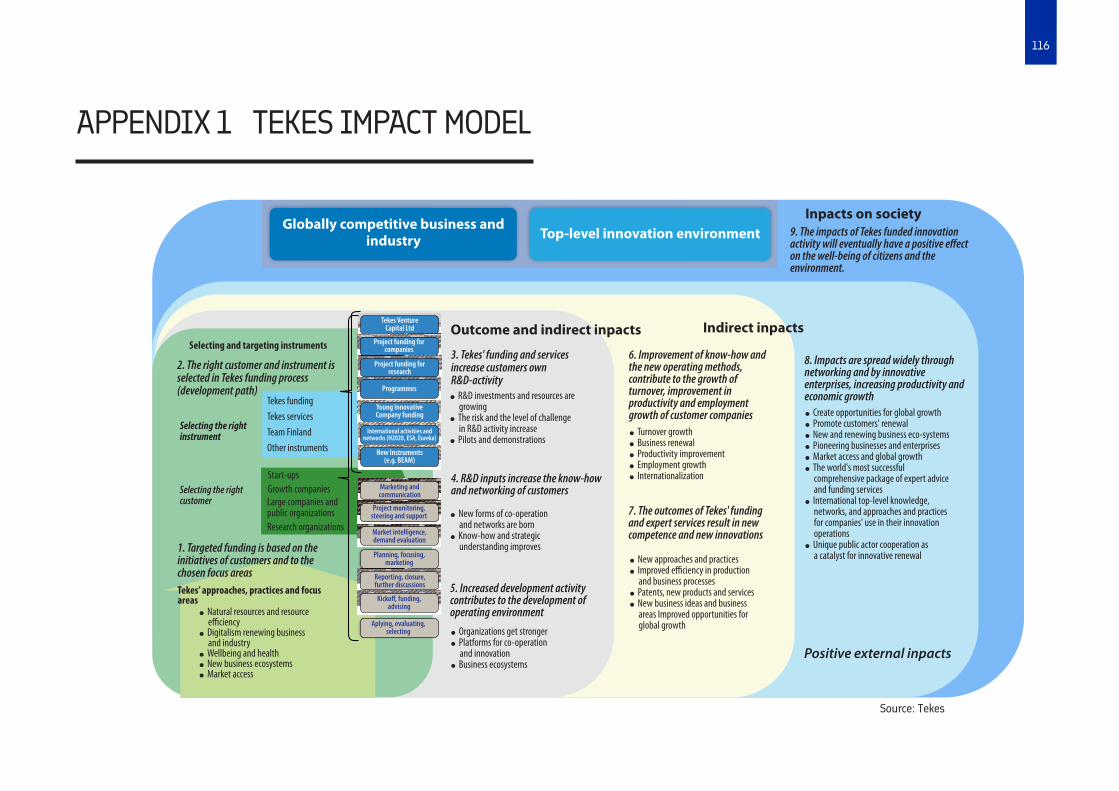
116
APPENDIX 1 TEKES IMPACT MODEL
Globally competitive business andindustry Top-level innovation environment
Inpacts on society
Indirect inpacts Outcome and indirect inpacts
Positive external inpacts
Selecting and targeting instruments
Tekes’ approaches, practices and focusareas
9. The impacts of Tekes funded innovation activity will eventually have a positive effect on the well-being of citizens and the environment.
8. Impacts are spread widely throughnetworking and by innovative enterprises, increasing productivity and economic growthl Create opportunities for global growthl Promote customers' renewall New and renewing business eco-systemsl Pioneering businesses and enterprisesl Market access and global growthl The world's most successful comprehensive package of expert advice and funding servicesl International top-level knowledge, networks, and approaches and practices for companies' use in their innovation operationsl Unique public actor cooperation as a catalyst for innovative renewal
l New approaches and practicesl Improved efficiency in production and business processesl Patents, new products and servicesl New business ideas and business areas Improved opportunities for global growth
l Turnover growthl Business renewall Productivity improvementl Employment growthl Internationalization
5. Increased development activitycontributes to the development ofoperating environment
l New forms of co-operation and networks are bornl Know-how and strategic understanding improves
3. Tekes' funding and servicesincrease customers own R&D-activity
6. Improvement of know-how and the new operating methods, contribute to the growth of turnover, improvement in productivity and employment growth of customer companies
7. The outcomes of Tekes' funding and expert services result in new competence and new innovations
4. R&D inputs increase the know-how and networking of customers
l Organizations get stronger l Platforms for co-operation and innovationl Business ecosystems
l R&D investments and resources are growingl The risk and the level of challenge in R&D activity increasel Pilots and demonstrations
1. Targeted funding is based on theinitiatives of customers and to thechosen focus areas
2. The right customer and instrument isselected in Tekes funding process (development path)
Selecting the rightinstrument
Tekes funding
Tekes services
Team Finland
Other instruments
Start-upsGrowth companiesSelecting the right
customer Large companies and public organizationsResearch organizations
l Natural resources and resource efficiencyl Digitalism renewing business and industryl Wellbeing and healthl New business ecosystemsl Market access
International activities andnetworks (H2020, ESA, Eureka)
Aplying, evaluating,selecting
Tekes VentureCapital Ltd
Project funding forcompanies
Project funding forresearch
Programmes
Young InnovativeCompany funding
New Instruments (e.g. BEAM)
Marketing andcommunication
Project monitoring,steering and support
Market intelligence,demand evaluation
Planning, focusing,marketing
Reporting, closure,further discussions
Kickoff, funding, advising
Source: Tekes
117
APPENDIX 2 LIST OF INTERVIEWS
EXPERT INTERVIEWS & WORKSHOP PARTICIPATIONS
Esko Raunio, Tekes VCHanna Halme, Turku Life Science AcceleratorInka Mero, Pivot 5Jaakko Salminen, FIBANJP Virtanen, Avanto VenturesJukka Häyrynen, TekesKeith Bonnici, TeollisuussijoitusLasse Lehtinen, IcebreakerMarit Tuominen, FINAC / Profict PartnersMarko Saapunki, FPI PartnersMoaffak Ahmed, Superhero CapitalNiko Lindholm, xEduTarja Teppo, Cleantech InvestPetri Lehmuskoski, Gorilla VenturesPia Santavirta, FVCARisto Rautakorpi, Gorilla VenturesSakari Pihlava, VendepTopi Järvinen, NestholmaTuija Ypyä, Työ- ja elinkeinoministeriö
COMPANY INTERVIEWS
Frosmo OyGrey Area OyLeanpark OyMedisapiens OyNetmedi OyNosto Solutions OyOneMind Dogs OyPelago MFG OySeriously Digital Entertainment OySmartly.io Solutions OyZenRobotics OyZoined Oy