StartUp P&L Model
76
-
Upload
elena-mirica -
Category
Documents
-
view
229 -
download
4
description
excel
Transcript of StartUp P&L Model


This tool is designed to organize financials and perform basic calculations for a start up company.
1. Set product fundamentals, calendar periods, fixed assets, loans, and other parameters.
2. Set product volumes.
3. Set overhead items.
4. Set Paid in Capital and other assets.
5. Review P&L
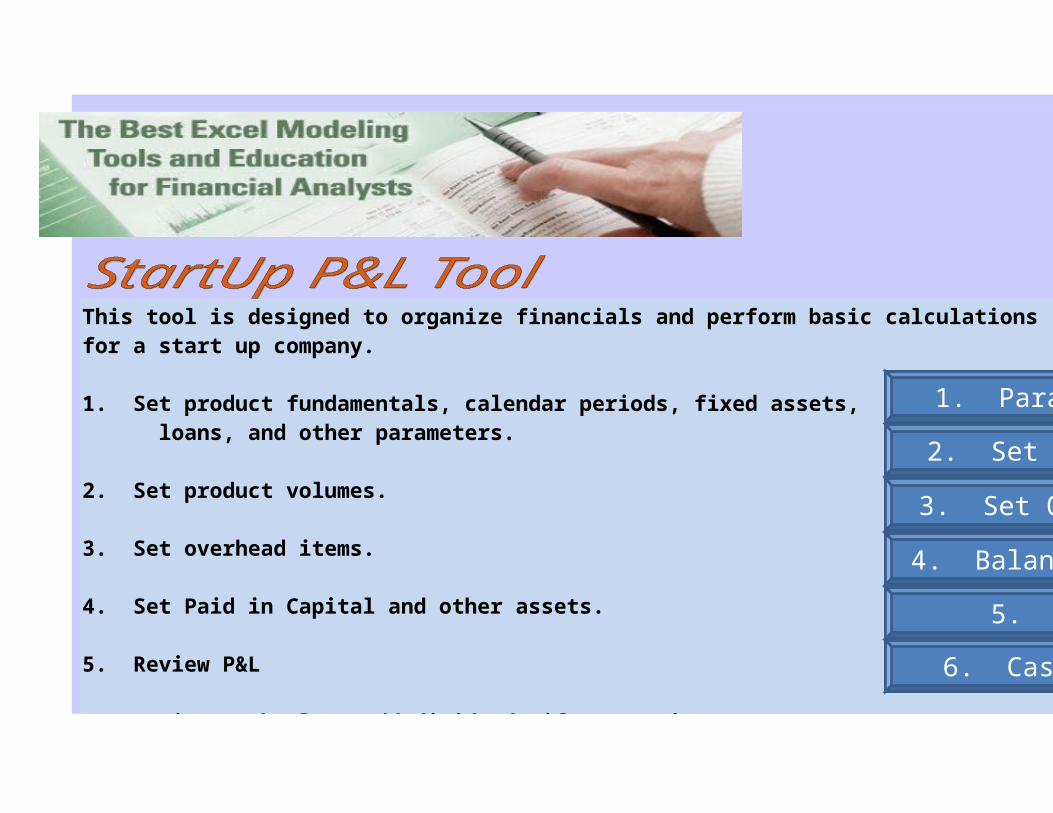
6. Review Cash Flow (add dividends if appropriate)
Pages are protected without a password, for use as templates.
Special features: o Profit After Tax is automatically transferred to Retained Earnings.o Cash from the Cash Flow page is used to keep the Balance Sheet balanced.
1. Parameters
2. Set Volumes
3. Set Overhead
4. Balance Sheet
5. P&L
6. Cash Flow
For more tools like this, or to learn to createthem, visit our web site by clicking this logo.
This tool is designed to organize financials and perform basic calculations for a start up company.
1. Set product fundamentals, calendar periods, fixed assets, loans, and other parameters.
2. Set product volumes.
3. Set overhead items.
4. Set Paid in Capital and other assets.
5. Review P&L
6. Review Cash Flow (add dividends if appropriate)
Pages are protected without a password, for use as templates.
Special features: o Profit After Tax is automatically transferred to Retained Earnings.o Cash from the Cash Flow page is used to keep the Balance Sheet balanced.
1. Parameters
2. Set Volumes
3. Set Overhead
4. Balance Sheet
5. P&L
6. Cash Flow

Detail P&L 2009 Jan Feb Mar Apr May
Revenue 350 354 357 361 364
Direct Material 100 101 102 103 104
Direct Labor 40 40 41 41 42
Direct Factory O/H 55 56 56 57 57
Depreciation - - - 833 833
Cost of Goods Sold 195 197 199 1,034 1,036
Gross Profit 155 157 158 (674) (672)
Gross Margin % 44.3% 44.3% 44.3% -186.8% -184.5%
G&A - - - - -
M&S - - - - -
R&D - - - - -
Interest 833 833 833 833 833
Other - - - - -
Corporate Overhead 833 833 833 833 833
Net Profit (678) (677) (675) (1,507) (1,505)
Net Profit % -193.8% -191.5% -189.1% -417.9% -413.3%
Tax (234) (233) (233) (520) (519)
Net Profit After Tax (444) (443) (442) (987) (986)
NPAT % -126.9% -125.4% -123.9% -273.7% -270.7%
Q1 Q2 Q3 Q4 Q1 Revenue by Quarter 1,061 1,093 1,126 1,160 1,231
Gross by Quarter 470 (2,016) (2,001) (1,986) (1,955)
% 44.3% -184.5% -177.8% -171.3% -158.8%
Net by Quarter (2,030) (4,516) (4,501) (4,486) (4,455)
% -191.4% -413.3% -399.9% -386.8% -361.8%
NPAT by Quarter (1,330) (2,958) (2,948) (2,939) (2,918)
% -125.4% -270.7% -261.9% -253.3% -237.0%
To Control
2009 2010 2011 2012 2013Revenue by Year 4,439 5,153 5,636 6,351 7,156
Gross by Year (5,534) (7,718) (7,504) (7,187) (6,831)
% -124.7% -149.8% -133.1% -113.2% -95.4%
Net by Year (15,534) (17,718) (17,504) (17,187) (13,081)
% -350.0% -343.8% -310.6% -270.6% -182.8%
NPAT by Year (10,175) (11,605) (11,465) (11,258) (8,568)
% -229.2% -225.2% -203.4% -177.3% -119.7%
2009 Jun Jul Aug Sep Oct Nov Dec
368 372 375 379 383 387 390
105 106 107 108 109 110 112
42 42 43 43 44 44 45
58 58 59 60 60 61 61
833 833 833 833 833 833 833
1,038 1,040 1,042 1,044 1,047 1,049 1,051
(670) (669) (667) (665) (664) (662) (660)
-182.3% -180.0% -177.8% -175.6% -173.4% -171.3% -169.1%
- - - - - - -
- - - - - - -
- - - - - - -
833 833 833 833 833 833 833
- - - - - - -
833 833 833 833 833 833 833
(1,504) (1,502) (1,500) (1,499) (1,497) (1,495) (1,494)
-408.8% -404.3% -399.9% -395.5% -391.1% -386.8% -382.5%
(519) (518) (518) (517) (517) (516) (515)
(985) (984) (983) (982) (981) (980) (978)
-267.8% -264.8% -261.9% -259.0% -256.2% -253.4% -250.6%
Q2 Q3 Q4 Q1 Q2 Q3 Q4 1,269 1,307 1,347 1,347 1,387 1,429 1,473
(1,938) (1,921) (1,904) (1,904) (1,886) (1,867) (1,848)
-152.8% -147.0% -141.4% -141.4% -135.9% -130.6% -125.5%
(4,438) (4,421) (4,404) (4,404) (4,386) (4,367) (4,348)
-349.9% -338.3% -327.0% -327.0% -316.1% -305.5% -295.2%
(2,907) (2,896) (2,884) (2,884) (2,873) (2,860) (2,848)
-229.2% -221.6% -214.2% -214.2% -207.0% -200.1% -193.4%
DO NOT ENTER INFORMATION ON THIS SHEET. It is calculated from the Para, COGS, and OH worksheets, plus depreciation based on Fixed Assets and Interest based on Notes Payable of the Balance Sheet.DO NOT ENTER INFORMATION ON THIS SHEET. It is calculated from the Para, COGS, and OH worksheets, plus depreciation based on Fixed Assets and Interest based on Notes Payable of the Balance Sheet.
DO NOT ENTER INFORMATION ON THIS SHEET. It is calculated from the Para, COGS, and OH worksheets, plus depreciation based on Fixed Assets and Interest based on Notes Payable of the Balance Sheet.DO NOT ENTER INFORMATION ON THIS SHEET. It is calculated from the Para, COGS, and OH worksheets, plus depreciation based on Fixed Assets and Interest based on Notes Payable of the Balance Sheet.
2010 Jan Feb Mar Apr May Jun Jul
394 398 402 406 410 415 419
113 114 115 116 117 118 120
45 46 46 46 47 47 48
62 63 63 64 64 65 66
833 833 833 833 833 833 833
1,053 1,055 1,057 1,060 1,062 1,064 1,067
(659) (657) (655) (653) (652) (650) (648)
-167.0% -164.9% -162.8% -160.8% -158.8% -156.8% -154.8%
- - - - - - -
- - - - - - -
- - - - - - -
833 833 833 833 833 833 833
- - - - - - -
833 833 833 833 833 833 833
(1,492) (1,490) (1,488) (1,487) (1,485) (1,483) (1,481)
-378.3% -374.1% -370.0% -365.9% -361.8% -357.8% -353.8%
(515) (514) (514) (513) (512) (512) (511)
(977) (976) (975) (974) (973) (971) (970)
-247.8% -245.1% -242.3% -239.7% -237.0% -234.4% -231.8%
Q1 Q2 Q3 Q4 Q1 Q2 Q3 1,517 1,563 1,611 1,660 1,710 1,762 1,815
(1,828) (1,808) (1,787) (1,765) (1,743) (1,720) (1,696)
-120.5% -115.6% -110.9% -106.4% -101.9% -97.6% -93.5%
(4,328) (4,308) (4,287) (4,265) (4,243) (2,970) (2,946)
-285.2% -275.5% -266.1% -257.0% -248.1% -168.6% -162.3%
(2,835) (2,822) (2,808) (2,794) (2,779) (1,945) (1,930)
-186.8% -180.5% -174.3% -168.3% -162.5% -110.4% -106.3%
DO NOT ENTER INFORMATION ON THIS SHEET. It is calculated from the Para, COGS, and OH worksheets, plus depreciation based on Fixed Assets and Interest based on Notes Payable of the Balance Sheet.DO NOT ENTER INFORMATION ON THIS SHEET. It is calculated from the Para, COGS, and OH worksheets, plus depreciation based on Fixed Assets and Interest based on Notes Payable of the Balance Sheet.
DO NOT ENTER INFORMATION ON THIS SHEET. It is calculated from the Para, COGS, and OH worksheets, plus depreciation based on Fixed Assets and Interest based on Notes Payable of the Balance Sheet.DO NOT ENTER INFORMATION ON THIS SHEET. It is calculated from the Para, COGS, and OH worksheets, plus depreciation based on Fixed Assets and Interest based on Notes Payable of the Balance Sheet.
2010 2011 Aug Sep Oct Nov Dec Jan Feb
423 427 431 436 440 444 449
121 122 123 124 126 127 128
48 49 49 50 50 51 51
66 67 68 68 69 70 71
833 833 833 833 833 833 833
1,069 1,071 1,074 1,076 1,078 1,081 1,083
(646) (644) (642) (640) (638) (637) (635)
-152.8% -150.8% -148.9% -147.0% -145.1% -143.2% -141.4%
- - - - - - -
- - - - - - -
- - - - - - -
833 833 833 833 833 833 833
- - - - - - -
833 833 833 833 833 833 833
(1,479) (1,478) (1,476) (1,474) (1,472) (1,470) (1,468)
-349.9% -346.0% -342.1% -338.3% -334.5% -330.7% -327.0%
(510) (510) (509) (508) (508) (507) (506)
(969) (968) (967) (965) (964) (963) (961)
-229.2% -226.6% -224.1% -221.6% -219.1% -216.6% -214.2%
Q4 1,870
(1,672)
-89.4%
(2,922)
-156.2%
(1,914)
-102.3%
2011 Mar Apr May Jun Jul Aug Sep
453 458 462 467 472 476 481
130 131 132 133 135 136 137
52 52 53 53 54 54 55
71 72 73 73 74 75 76
833 833 833 833 833 833 833
1,086 1,088 1,091 1,094 1,096 1,099 1,101
(633) (631) (629) (626) (624) (622) (620)
-139.5% -137.7% -135.9% -134.1% -132.4% -130.6% -128.9%
- - - - - - -
- - - - - - -
- - - - - - -
833 833 833 833 833 833 833
- - - - - - -
833 833 833 833 833 833 833
(1,466) (1,464) (1,462) (1,460) (1,458) (1,456) (1,454)
-323.4% -319.7% -316.1% -312.5% -309.0% -305.5% -302.0%
(506) (505) (504) (504) (503) (502) (501)
(960) (959) (958) (956) (955) (953) (952)
-211.8% -209.4% -207.1% -204.7% -202.4% -200.1% -197.8%
2011 2012 Oct Nov Dec Jan Feb Mar Apr
486 491 496 501 506 511 516
139 140 142 143 145 146 147
56 56 57 57 58 58 59
76 77 78 79 79 80 81
833 833 833 833 833 833 833
1,104 1,107 1,110 1,112 1,115 1,118 1,121
(618) (616) (614) (612) (609) (607) (605)
-127.2% -125.5% -123.8% -122.1% -120.5% -118.8% -117.2%
- - - - - - -
- - - - - - -
- - - - - - -
833 833 833 833 833 833 833
- - - - - - -
833 833 833 833 833 833 833
(1,451) (1,449) (1,447) (1,445) (1,443) (1,440) (1,438)
-298.6% -295.2% -291.9% -288.5% -285.2% -282.0% -278.7%
(501) (500) (499) (498) (498) (497) (496)
(951) (949) (948) (946) (945) (943) (942)
-195.6% -193.4% -191.2% -189.0% -186.8% -184.7% -182.6%
2012 May Jun Jul Aug Sep Oct Nov
521 526 532 537 542 548 553
149 150 152 153 155 156 158
60 60 61 61 62 63 63
82 83 84 84 85 86 87
833 833 833 833 833 833 833
1,124 1,127 1,129 1,132 1,135 1,138 1,142
(603) (600) (598) (596) (593) (591) (588)
-115.6% -114.0% -112.5% -110.9% -109.4% -107.9% -106.4%
- - - - - - -
- - - - - - -
- - - - - - -
833 833 833 833 833 833 833
- - - - - - -
833 833 833 833 833 833 833
(1,436) (1,434) (1,431) (1,429) (1,427) (1,424) (1,422)
-275.5% -272.4% -269.2% -266.1% -263.1% -260.0% -257.0%
(495) (495) (494) (493) (492) (491) (490)
(941) (939) (937) (936) (934) (933) (931)
-180.5% -178.4% -176.4% -174.3% -172.3% -170.3% -168.3%
2012 2013 Dec Jan Feb Mar Apr May Jun
559 564 570 576 581 587 593
160 161 163 164 166 168 169
64 64 65 66 66 67 68
88 89 90 90 91 92 93
833 833 833 833 833 833 833
1,145 1,148 1,151 1,154 1,157 1,160 1,164
(586) (583) (581) (578) (576) (573) (571)
-104.9% -103.4% -101.9% -100.5% -99.1% -97.6% -96.2%
- - - - - - -
- - - - - - -
- - - - - - -
833 833 833 833 417 417 417
- - - - - - -
833 833 833 833 417 417 417
(1,419) (1,417) (1,414) (1,412) (993) (990) (987)
-254.0% -251.1% -248.2% -245.3% -170.7% -168.6% -166.5%
(490) (489) (488) (487) (342) (342) (341)
(930) (928) (926) (925) (650) (648) (647)
-166.4% -164.5% -162.5% -160.6% -111.8% -110.4% -109.0%
2013 Jul Aug Sep Oct Nov Dec
599 605 611 617 623 630
171 173 175 176 178 180
68 69 70 71 71 72
94 95 96 97 98 99
833 833 833 833 833 833
1,167 1,170 1,174 1,177 1,181 1,184
(568) (565) (563) (560) (557) (555)
-94.8% -93.5% -92.1% -90.7% -89.4% -88.1%
- - - - - -
- - - - - -
- - - - - -
417 417 417 417 417 417
- - - - - -
417 417 417 417 417 417
(985) (982) (979) (977) (974) (971)
-164.4% -162.3% -160.3% -158.3% -156.3% -154.3%
(340) (339) (338) (337) (336) (335)
(645) (643) (642) (640) (638) (636)
-107.7% -106.3% -105.0% -103.7% -102.3% -101.0%
Detail Balance Sheet Prior 2009Y/E Q1 Q2 Q3 Q4
Cash - (2,059) (3,739) (4,210) (4,672)
Accounts Receivable - 573 590 608 626
Inventories - 284 1,492 1,501 1,510
Other Current - - - - -
Total Current - (1,203) (1,657) (2,101) (2,536)
Fixed Assets - 100,000 100,000 100,000 100,000
Less: Accum Deprec - - 2,500 5,000 7,500
Net Fixed Assets - 100,000 97,500 95,000 92,500
Total Assets - 98,797 95,843 92,899 89,964
Accounts Payable - 127 131 135 139
Other Current Lia - - - - -
Total Current Lia - 127 131 135 139
Notes Payable - 100,000 100,000 100,000 100,000
Other Long Term - - - - -
Total Liabilities - 100,127 100,131 100,135 100,139
Paid In Capital - - - - -
Retained Earnings - (1,330) (4,288) (7,236) (10,175)
Total Equity - (1,330) (4,288) (7,236) (10,175)
Total Lia & Equity - 98,797 95,843 92,899 89,964
Prior 2009 2010 2011 2012Cash - (4,672) (6,410) (7,958) (9,344)
Accounts Receivable - 626 727 795 896
Inventories - 1,510 1,560 1,594 1,644
Other Current - - - - -
Total Current - (2,536) (4,123) (5,568) (6,804)
To Control
Fixed Assets - 100,000 100,000 100,000 100,000
Less: Accum Deprec - 7,500 17,500 27,500 37,500
Net Fixed Assets - 92,500 82,500 72,500 62,500
Total Assets - 89,964 78,377 66,932 55,696
Accounts Payable - 139 157 177 199
Other Current Lia - - - - -
Total Current Lia - 139 157 177 199
Notes Payable - 100,000 100,000 100,000 100,000
Other Long Term - - - - -
Total Liabilities - 100,000 100,000 100,000 100,000
Paid In Capital - - - - -
Retained Earnings - (10,175) (21,780) (33,245) (44,503)
Total Equity - (10,175) (21,780) (33,245) (44,503)
Total Lia & Equity - 89,825 78,220 66,755 55,497
2010 2011Q1 Q2 Q3 Q4 Q1 Q2 Q3
(5,143) (5,576) (5,999) (6,410) (6,790) (7,191) (7,580)
665 685 706 727 727 749 772
1,529 1,539 1,550 1,560 1,560 1,571 1,582
- - - - - - -
(2,949) (3,352) (3,743) (4,123) (4,503) (4,871) (5,226)
100,000 100,000 100,000 100,000 100,000 100,000 100,000
10,000 12,500 15,000 17,500 20,000 22,500 25,000
90,000 87,500 85,000 82,500 80,000 77,500 75,000
87,051 84,148 81,257 78,377 75,497 72,629 69,774
143 148 152 157 162 166 172
- - - - - - -
143 148 152 157 162 166 172
100,000 100,000 100,000 100,000 100,000 100,000 100,000
- - - - - - -
100,143 100,148 100,152 100,157 100,162 100,166 100,172
- - - - - - -
(13,093) (16,000) (18,896) (21,780) (24,664) (27,537) (30,397)
(13,093) (16,000) (18,896) (21,780) (24,664) (27,537) (30,397)
87,051 84,148 81,257 78,377 75,497 72,629 69,774
2013 (58,056)
1,010
1,700
-
(55,346)
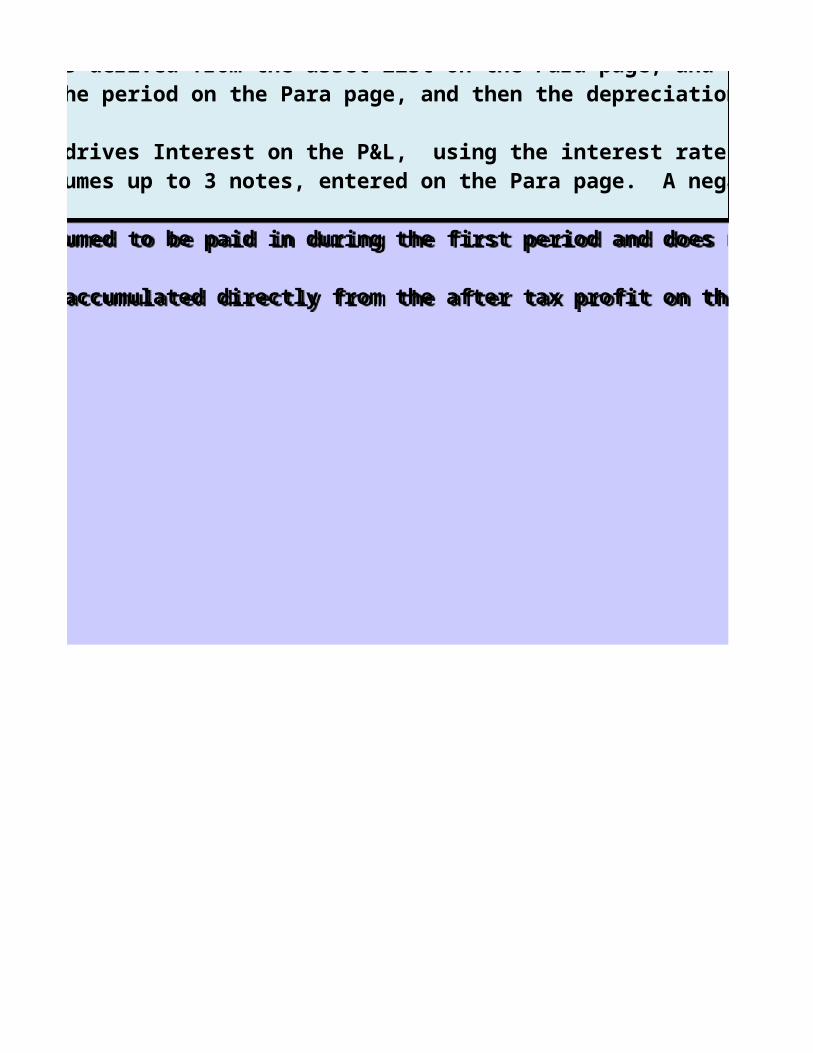
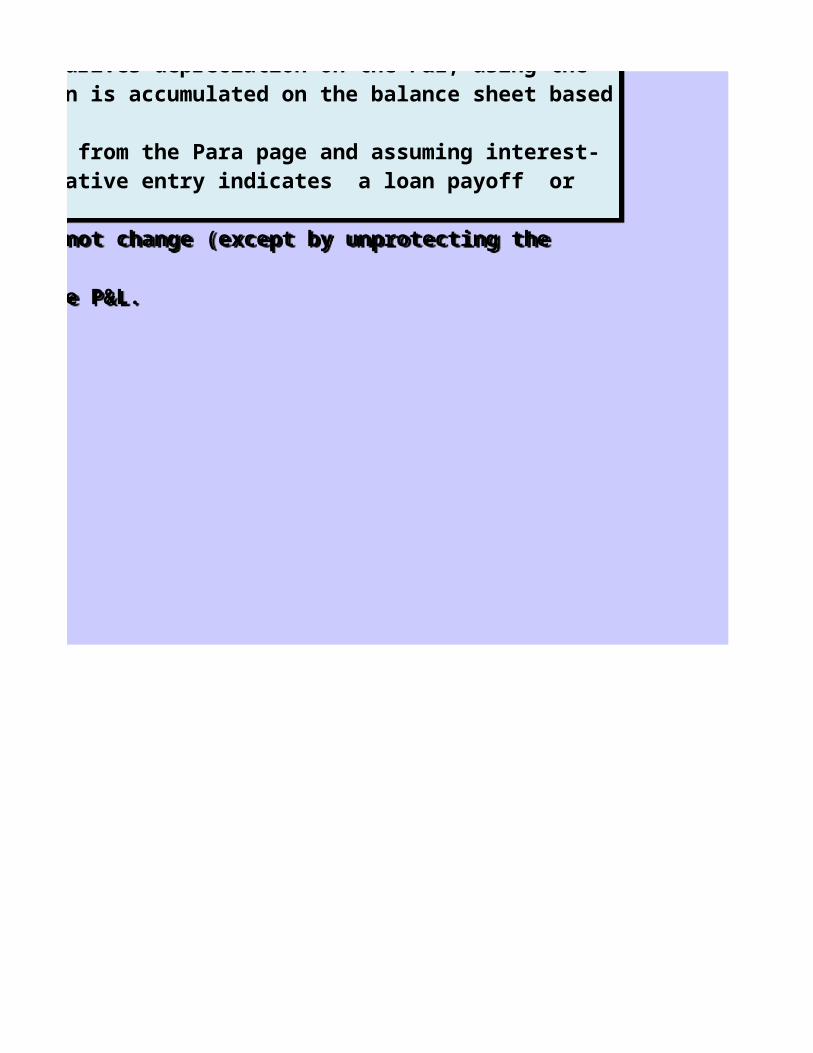
ENTER quarterly amounts for each UNSHADED ITEM. Shaded lines are calculated or drawn from other sheets. 1. Cash is derived directly from the cash flow page.2. Accounts Receivable is calculated using ratio to revenue , Inventory Accounts using a ratio to COGS, and Payable using a ratio to material cost, per settings on the Para page. 3. Fixed Assets, above, is derived from the asset list on the Para page, and drives depreciation on the P&L, using the straight line method and the period on the Para page, and then the depreciation is accumulated on the balance sheet based on the P&L entries.4. Notes Payable, above, drives Interest on the P&L, using the interest rate from the Para page and assuming interest-only loans. This model assumes up to 3 notes, entered on the Para page. A negative entry indicates a loan payoff or pay down.5. Paid in Capital is assumed to be paid in during the first period and does not change (except by unprotecting the sheet).6. Retained earnings are accumulated directly from the after tax profit on the P&L.
ENTER quarterly amounts for each UNSHADED ITEM. Shaded lines are calculated or drawn from other sheets. 1. Cash is derived directly from the cash flow page.2. Accounts Receivable is calculated using ratio to revenue , Inventory Accounts using a ratio to COGS, and Payable using a ratio to material cost, per settings on the Para page. 3. Fixed Assets, above, is derived from the asset list on the Para page, and drives depreciation on the P&L, using the straight line method and the period on the Para page, and then the depreciation is accumulated on the balance sheet based on the P&L entries.4. Notes Payable, above, drives Interest on the P&L, using the interest rate from the Para page and assuming interest-only loans. This model assumes up to 3 notes, entered on the Para page. A negative entry indicates a loan payoff or pay down.5. Paid in Capital is assumed to be paid in during the first period and does not change (except by unprotecting the sheet).6. Retained earnings are accumulated directly from the after tax profit on the P&L.
100,000
47,500
52,500
(2,846)
224
-
224
50,000
-
50,000
-
(53,071)
(53,071)
(3,071)
ENTER quarterly amounts for each UNSHADED ITEM. Shaded lines are calculated or drawn from other sheets. 1. Cash is derived directly from the cash flow page.2. Accounts Receivable is calculated using ratio to revenue , Inventory Accounts using a ratio to COGS, and Payable using a ratio to material cost, per settings on the Para page. 3. Fixed Assets, above, is derived from the asset list on the Para page, and drives depreciation on the P&L, using the straight line method and the period on the Para page, and then the depreciation is accumulated on the balance sheet based on the P&L entries.4. Notes Payable, above, drives Interest on the P&L, using the interest rate from the Para page and assuming interest-only loans. This model assumes up to 3 notes, entered on the Para page. A negative entry indicates a loan payoff or pay down.5. Paid in Capital is assumed to be paid in during the first period and does not change (except by unprotecting the sheet).6. Retained earnings are accumulated directly from the after tax profit on the P&L.
ENTER quarterly amounts for each UNSHADED ITEM. Shaded lines are calculated or drawn from other sheets. 1. Cash is derived directly from the cash flow page.2. Accounts Receivable is calculated using ratio to revenue , Inventory Accounts using a ratio to COGS, and Payable using a ratio to material cost, per settings on the Para page. 3. Fixed Assets, above, is derived from the asset list on the Para page, and drives depreciation on the P&L, using the straight line method and the period on the Para page, and then the depreciation is accumulated on the balance sheet based on the P&L entries.4. Notes Payable, above, drives Interest on the P&L, using the interest rate from the Para page and assuming interest-only loans. This model assumes up to 3 notes, entered on the Para page. A negative entry indicates a loan payoff or pay down.5. Paid in Capital is assumed to be paid in during the first period and does not change (except by unprotecting the sheet).6. Retained earnings are accumulated directly from the after tax profit on the P&L.
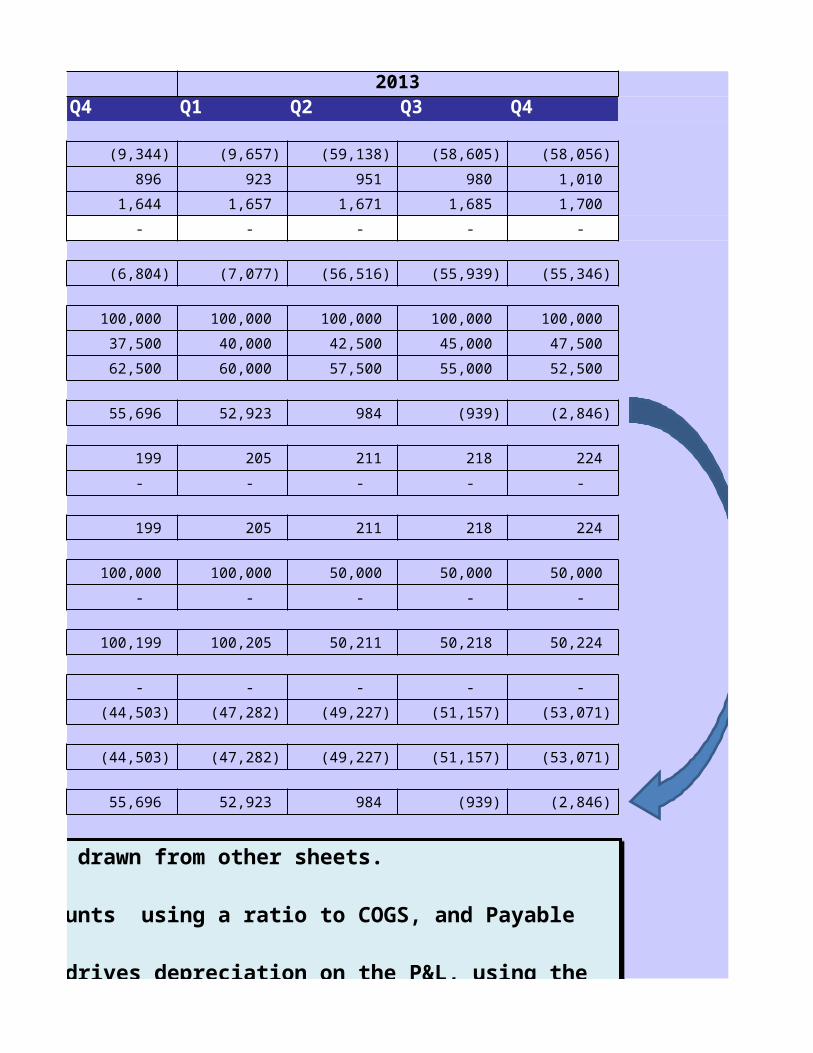
2011 2012 2013Q4 Q1 Q2 Q3 Q4 Q1 Q2
(7,958) (8,323) (8,676) (9,017) (9,344) (9,657) (59,138)
795 819 844 870 896 923 951
1,594 1,606 1,618 1,631 1,644 1,657 1,671
- - - - - - -
(5,568) (5,898) (6,214) (6,516) (6,804) (7,077) (56,516)
100,000 100,000 100,000 100,000 100,000 100,000 100,000
27,500 30,000 32,500 35,000 37,500 40,000 42,500
72,500 70,000 67,500 65,000 62,500 60,000 57,500
66,932 64,102 61,286 58,484 55,696 52,923 984
177 182 188 193 199 205 211
- - - - - - -
177 182 188 193 199 205 211
100,000 100,000 100,000 100,000 100,000 100,000 50,000
- - - - - - -
100,177 100,182 100,188 100,193 100,199 100,205 50,211
- - - - - - -
(33,245) (36,080) (38,902) (41,709) (44,503) (47,282) (49,227)
(33,245) (36,080) (38,902) (41,709) (44,503) (47,282) (49,227)
66,932 64,102 61,286 58,484 55,696 52,923 984
ENTER quarterly amounts for each UNSHADED ITEM. Shaded lines are calculated or drawn from other sheets. 1. Cash is derived directly from the cash flow page.2. Accounts Receivable is calculated using ratio to revenue , Inventory Accounts using a ratio to COGS, and Payable using a ratio to material cost, per settings on the Para page. 3. Fixed Assets, above, is derived from the asset list on the Para page, and drives depreciation on the P&L, using the straight line method and the period on the Para page, and then the depreciation is accumulated on the balance sheet based on the P&L entries.4. Notes Payable, above, drives Interest on the P&L, using the interest rate from the Para page and assuming interest-only loans. This model assumes up to 3 notes, entered on the Para page. A negative entry indicates a loan payoff or pay down.5. Paid in Capital is assumed to be paid in during the first period and does not change (except by unprotecting the sheet).6. Retained earnings are accumulated directly from the after tax profit on the P&L.
ENTER quarterly amounts for each UNSHADED ITEM. Shaded lines are calculated or drawn from other sheets. 1. Cash is derived directly from the cash flow page.2. Accounts Receivable is calculated using ratio to revenue , Inventory Accounts using a ratio to COGS, and Payable using a ratio to material cost, per settings on the Para page. 3. Fixed Assets, above, is derived from the asset list on the Para page, and drives depreciation on the P&L, using the straight line method and the period on the Para page, and then the depreciation is accumulated on the balance sheet based on the P&L entries.4. Notes Payable, above, drives Interest on the P&L, using the interest rate from the Para page and assuming interest-only loans. This model assumes up to 3 notes, entered on the Para page. A negative entry indicates a loan payoff or pay down.5. Paid in Capital is assumed to be paid in during the first period and does not change (except by unprotecting the sheet).6. Retained earnings are accumulated directly from the after tax profit on the P&L.
ENTER quarterly amounts for each UNSHADED ITEM. Shaded lines are calculated or drawn from other sheets. 1. Cash is derived directly from the cash flow page.2. Accounts Receivable is calculated using ratio to revenue , Inventory Accounts using a ratio to COGS, and Payable using a ratio to material cost, per settings on the Para page. 3. Fixed Assets, above, is derived from the asset list on the Para page, and drives depreciation on the P&L, using the straight line method and the period on the Para page, and then the depreciation is accumulated on the balance sheet based on the P&L entries.4. Notes Payable, above, drives Interest on the P&L, using the interest rate from the Para page and assuming interest-only loans. This model assumes up to 3 notes, entered on the Para page. A negative entry indicates a loan payoff or pay down.5. Paid in Capital is assumed to be paid in during the first period and does not change (except by unprotecting the sheet).6. Retained earnings are accumulated directly from the after tax profit on the P&L.
ENTER quarterly amounts for each UNSHADED ITEM. Shaded lines are calculated or drawn from other sheets. 1. Cash is derived directly from the cash flow page.2. Accounts Receivable is calculated using ratio to revenue , Inventory Accounts using a ratio to COGS, and Payable using a ratio to material cost, per settings on the Para page. 3. Fixed Assets, above, is derived from the asset list on the Para page, and drives depreciation on the P&L, using the straight line method and the period on the Para page, and then the depreciation is accumulated on the balance sheet based on the P&L entries.4. Notes Payable, above, drives Interest on the P&L, using the interest rate from the Para page and assuming interest-only loans. This model assumes up to 3 notes, entered on the Para page. A negative entry indicates a loan payoff or pay down.5. Paid in Capital is assumed to be paid in during the first period and does not change (except by unprotecting the sheet).6. Retained earnings are accumulated directly from the after tax profit on the P&L.
2013Q3 Q4
(58,605) (58,056)
980 1,010
1,685 1,700
- -
(55,939) (55,346)
100,000 100,000
45,000 47,500
55,000 52,500
(939) (2,846)
218 224
- -
218 224
50,000 50,000
- -
50,218 50,224
- -
(51,157) (53,071)
(51,157) (53,071)
(939) (2,846)
ENTER quarterly amounts for each UNSHADED ITEM. Shaded lines are calculated or drawn from other sheets. 1. Cash is derived directly from the cash flow page.2. Accounts Receivable is calculated using ratio to revenue , Inventory Accounts using a ratio to COGS, and Payable using a ratio to material cost, per settings on the Para page. 3. Fixed Assets, above, is derived from the asset list on the Para page, and drives depreciation on the P&L, using the straight line method and the period on the Para page, and then the depreciation is accumulated on the balance sheet based on the P&L entries.4. Notes Payable, above, drives Interest on the P&L, using the interest rate from the Para page and assuming interest-only loans. This model assumes up to 3 notes, entered on the Para page. A negative entry indicates a loan payoff or pay down.5. Paid in Capital is assumed to be paid in during the first period and does not change (except by unprotecting the sheet).6. Retained earnings are accumulated directly from the after tax profit on the P&L.
ENTER quarterly amounts for each UNSHADED ITEM. Shaded lines are calculated or drawn from other sheets. 1. Cash is derived directly from the cash flow page.2. Accounts Receivable is calculated using ratio to revenue , Inventory Accounts using a ratio to COGS, and Payable using a ratio to material cost, per settings on the Para page. 3. Fixed Assets, above, is derived from the asset list on the Para page, and drives depreciation on the P&L, using the straight line method and the period on the Para page, and then the depreciation is accumulated on the balance sheet based on the P&L entries.4. Notes Payable, above, drives Interest on the P&L, using the interest rate from the Para page and assuming interest-only loans. This model assumes up to 3 notes, entered on the Para page. A negative entry indicates a loan payoff or pay down.5. Paid in Capital is assumed to be paid in during the first period and does not change (except by unprotecting the sheet).6. Retained earnings are accumulated directly from the after tax profit on the P&L.
ENTER quarterly amounts for each UNSHADED ITEM. Shaded lines are calculated or drawn from other sheets. 1. Cash is derived directly from the cash flow page.2. Accounts Receivable is calculated using ratio to revenue , Inventory Accounts using a ratio to COGS, and Payable using a ratio to material cost, per settings on the Para page. 3. Fixed Assets, above, is derived from the asset list on the Para page, and drives depreciation on the P&L, using the straight line method and the period on the Para page, and then the depreciation is accumulated on the balance sheet based on the P&L entries.4. Notes Payable, above, drives Interest on the P&L, using the interest rate from the Para page and assuming interest-only loans. This model assumes up to 3 notes, entered on the Para page. A negative entry indicates a loan payoff or pay down.5. Paid in Capital is assumed to be paid in during the first period and does not change (except by unprotecting the sheet).6. Retained earnings are accumulated directly from the after tax profit on the P&L.
ENTER quarterly amounts for each UNSHADED ITEM. Shaded lines are calculated or drawn from other sheets. 1. Cash is derived directly from the cash flow page.2. Accounts Receivable is calculated using ratio to revenue , Inventory Accounts using a ratio to COGS, and Payable using a ratio to material cost, per settings on the Para page. 3. Fixed Assets, above, is derived from the asset list on the Para page, and drives depreciation on the P&L, using the straight line method and the period on the Para page, and then the depreciation is accumulated on the balance sheet based on the P&L entries.4. Notes Payable, above, drives Interest on the P&L, using the interest rate from the Para page and assuming interest-only loans. This model assumes up to 3 notes, entered on the Para page. A negative entry indicates a loan payoff or pay down.5. Paid in Capital is assumed to be paid in during the first period and does not change (except by unprotecting the sheet).6. Retained earnings are accumulated directly from the after tax profit on the P&L.
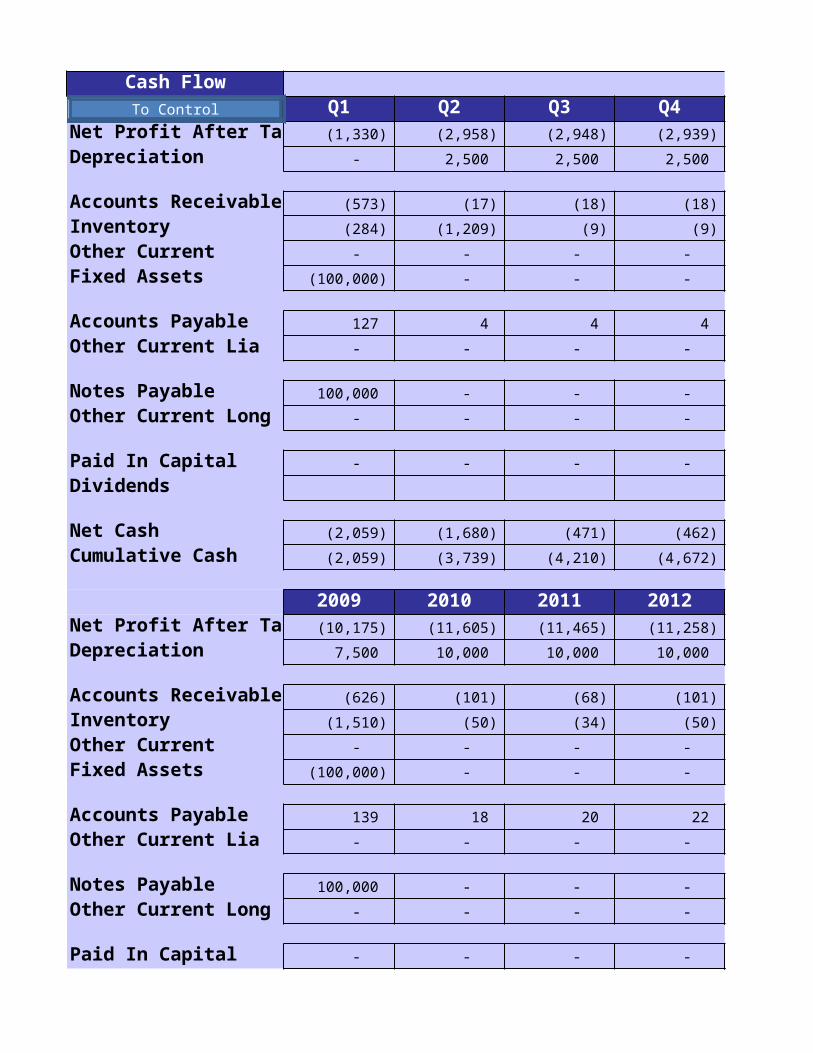
Cash Flow Q1 Q2 Q3 Q4 Q1
Net Profit After Tax (1,330) (2,958) (2,948) (2,939) (2,918)
Depreciation - 2,500 2,500 2,500 2,500
Accounts Receivable (573) (17) (18) (18) (39)
Inventory (284) (1,209) (9) (9) (19)
Other Current - - - - -
Fixed Assets (100,000) - - - -
Accounts Payable 127 4 4 4 4
Other Current Lia - - - - -
Notes Payable 100,000 - - - -
Other Current Long Ter - - - - -
Paid In Capital - - - - -
Dividends
Net Cash (2,059) (1,680) (471) (462) (471)
Cumulative Cash (2,059) (3,739) (4,210) (4,672) (5,143)
2009 2010 2011 2012 2013Net Profit After Tax (10,175) (11,605) (11,465) (11,258) (8,568)
Depreciation 7,500 10,000 10,000 10,000 10,000
Accounts Receivable (626) (101) (68) (101) (114)
Inventory (1,510) (50) (34) (50) (56)
Other Current - - - - -
Fixed Assets (100,000) - - - -
Accounts Payable 139 18 20 22 25
Other Current Lia - - - - -
Notes Payable 100,000 - - - (50,000)
Other Current Long Ter - - - - -
Paid In Capital - - - - -
Dividends - - - - -
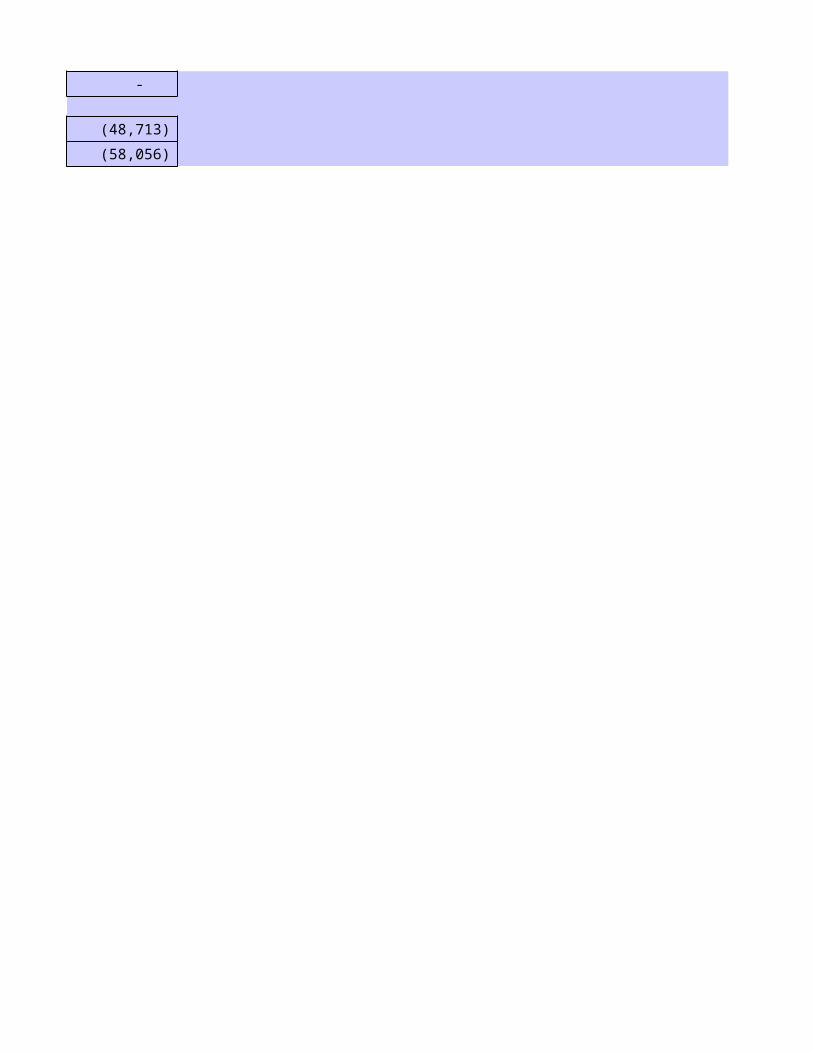
Net Cash (4,672) (1,738) (1,547) (1,386) (48,713)
To Control
Cumulative Cash (4,672) (6,410) (7,958) (9,344) (58,056)
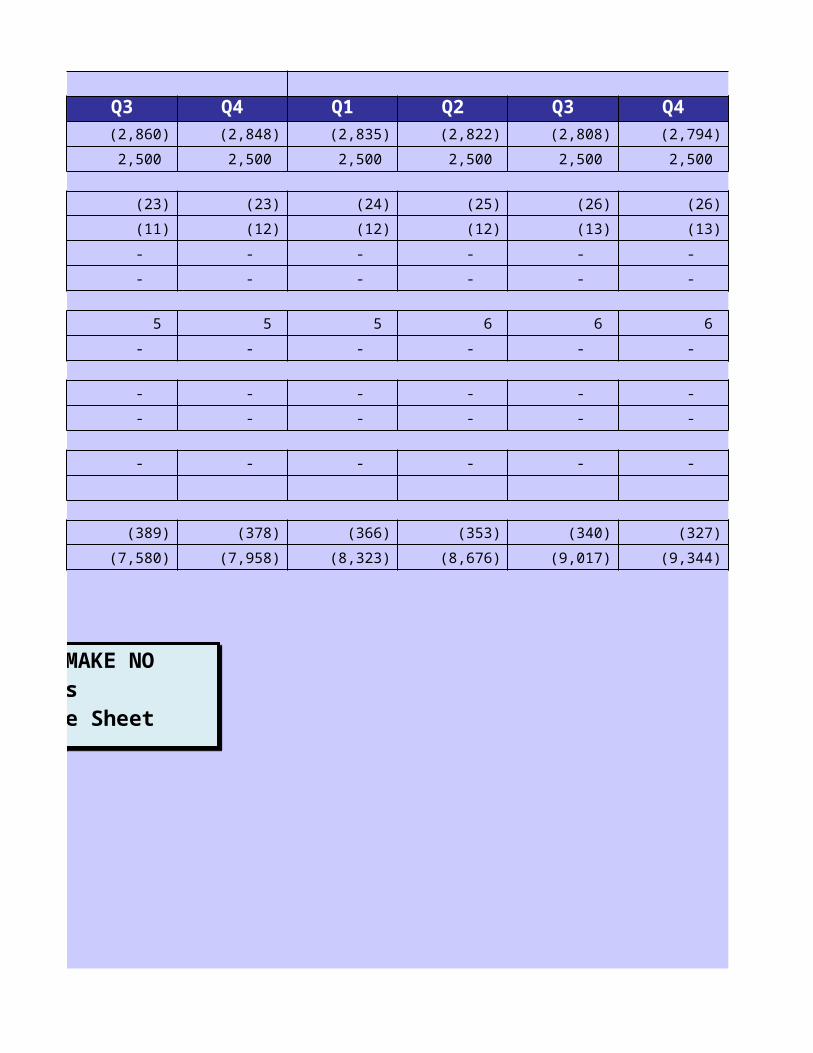
Q2 Q3 Q4 Q1 Q2 Q3 Q4 (2,907) (2,896) (2,884) (2,884) (2,873) (2,860) (2,848)
2,500 2,500 2,500 2,500 2,500 2,500 2,500
(20) (21) (21) - (22) (23) (23)
(10) (10) (11) - (11) (11) (12)
- - - - - - -
- - - - - - -
4 4 5 5 5 5 5
- - - - - - -
- - - - - - -
- - - - - - -
- - - - - - -
(433) (422) (412) (380) (401) (389) (378)
(5,576) (5,999) (6,410) (6,790) (7,191) (7,580) (7,958)
Enter planned dividends (if any). MAKE NO OTHER ENTRIES ON THIS SHEET. It is calculated from the P&L and Balance Sheet worksheets.
Enter planned dividends (if any). MAKE NO OTHER ENTRIES ON THIS SHEET. It is calculated from the P&L and Balance Sheet worksheets.

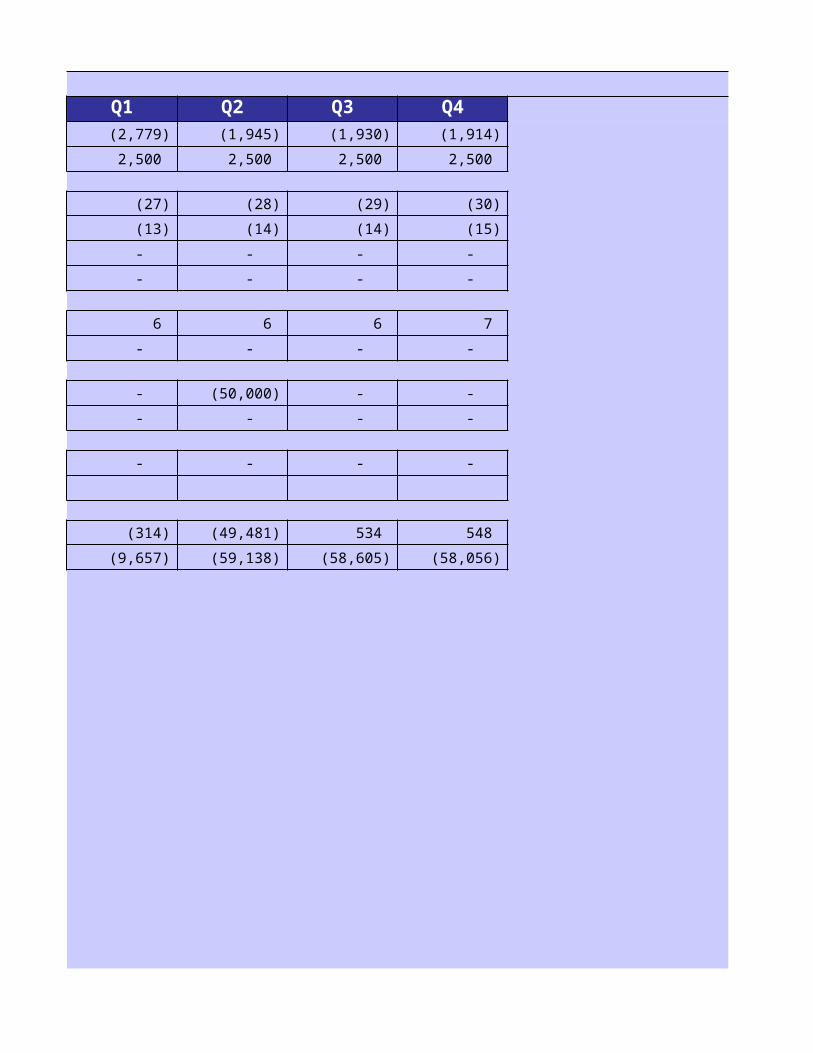
Q1 Q2 Q3 Q4 Q1 Q2 Q3 (2,835) (2,822) (2,808) (2,794) (2,779) (1,945) (1,930)
2,500 2,500 2,500 2,500 2,500 2,500 2,500
(24) (25) (26) (26) (27) (28) (29)
(12) (12) (13) (13) (13) (14) (14)
- - - - - - -
- - - - - - -
5 6 6 6 6 6 6
- - - - - - -
- - - - - (50,000) -
- - - - - - -
- - - - - - -
(366) (353) (340) (327) (314) (49,481) 534
(8,323) (8,676) (9,017) (9,344) (9,657) (59,138) (58,605)
Q4 (1,914)
2,500
(30)
(15)
-
-
7
-
-
-
-
548
(58,056)

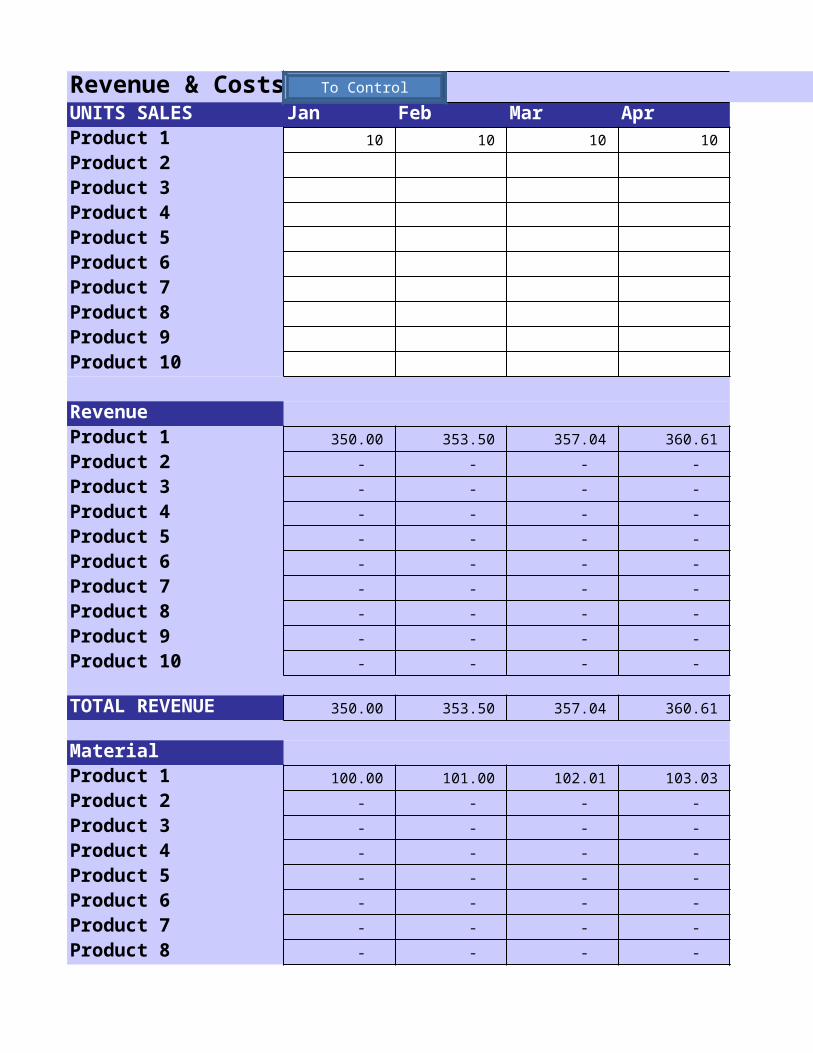
Revenue & Costs 2009UNITS SALES Jan Feb Mar Apr MayProduct 1 10 10 10 10 10
Product 2Product 3Product 4Product 5Product 6Product 7Product 8Product 9Product 10
RevenueProduct 1 350.00 353.50 357.04 360.61 364.21
Product 2 - - - - -
Product 3 - - - - -
Product 4 - - - - -
Product 5 - - - - -
Product 6 - - - - -
Product 7 - - - - -
Product 8 - - - - -
Product 9 - - - - -
Product 10 - - - - -
TOTAL REVENUE 350.00 353.50 357.04 360.61 364.21
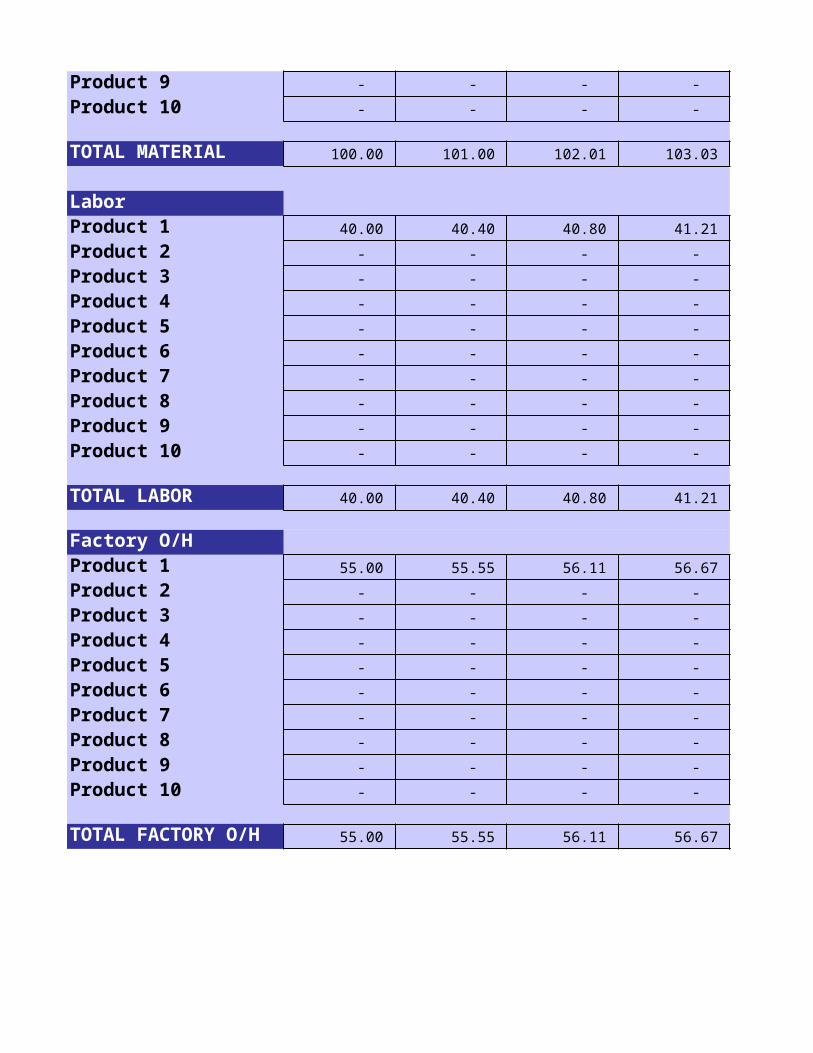
MaterialProduct 1 100.00 101.00 102.01 103.03 104.06
Product 2 - - - - -
Product 3 - - - - -
Product 4 - - - - -
Product 5 - - - - -
Product 6 - - - - -
Product 7 - - - - -
Product 8 - - - - -
Product 9 - - - - -
Product 10 - - - - -
To Control

TOTAL MATERIAL 100.00 101.00 102.01 103.03 104.06
LaborProduct 1 40.00 40.40 40.80 41.21 41.62
Product 2 - - - - -
Product 3 - - - - -
Product 4 - - - - -
Product 5 - - - - -
Product 6 - - - - -
Product 7 - - - - -
Product 8 - - - - -
Product 9 - - - - -
Product 10 - - - - -
TOTAL LABOR 40.00 40.40 40.80 41.21 41.62
Factory O/HProduct 1 55.00 55.55 56.11 56.67 57.23
Product 2 - - - - -
Product 3 - - - - -
Product 4 - - - - -
Product 5 - - - - -
Product 6 - - - - -
Product 7 - - - - -
Product 8 - - - - -
Product 9 - - - - -
Product 10 - - - - -
TOTAL FACTORY O/H 55.00 55.55 56.11 56.67 57.23

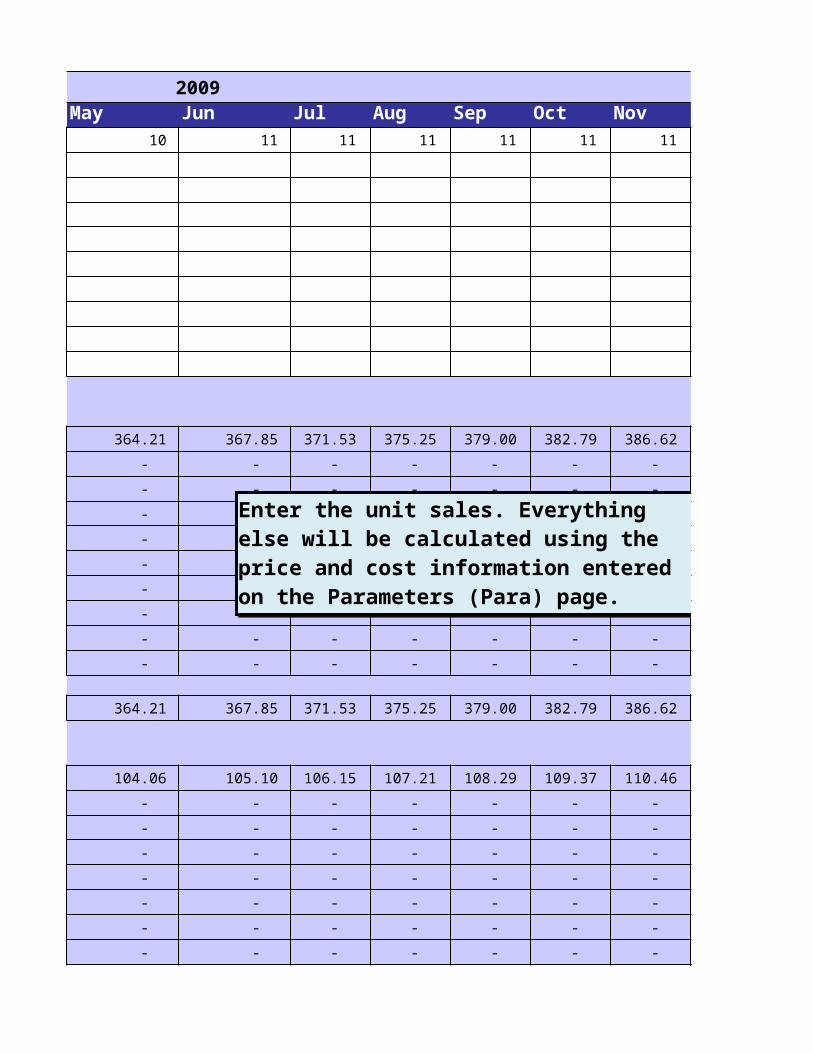
2009 2010Jun Jul Aug Sep Oct Nov Dec Jan Feb 11 11 11 11 11 11 11 11 11
367.85 371.53 375.25 379.00 382.79 386.62 390.48 394.39 398.33
- - - - - - - - -
- - - - - - - - -
- - - - - - - - -
- - - - - - - - -
- - - - - - - - -
- - - - - - - - -
- - - - - - - - -
- - - - - - - - -
- - - - - - - - -
367.85 371.53 375.25 379.00 382.79 386.62 390.48 394.39 398.33
105.10 106.15 107.21 108.29 109.37 110.46 111.57 112.68 113.81
- - - - - - - - -
- - - - - - - - -
- - - - - - - - -
- - - - - - - - -
- - - - - - - - -
- - - - - - - - -
- - - - - - - - -
- - - - - - - - -
- - - - - - - - -
Enter the unit sales. Everything else will be calculated using the price and cost information entered on the Parameters (Para) page.
Enter the unit sales. Everything else will be calculated using the price and cost information entered on the Parameters (Para) page.

105.10 106.15 107.21 108.29 109.37 110.46 111.57 112.68 113.81
42.04 42.46 42.89 43.31 43.75 44.18 44.63 45.07 45.52
- - - - - - - - -
- - - - - - - - -
- - - - - - - - -
- - - - - - - - -
- - - - - - - - -
- - - - - - - - -
- - - - - - - - -
- - - - - - - - -
- - - - - - - - -
42.04 42.46 42.89 43.31 43.75 44.18 44.63 45.07 45.52
57.81 58.38 58.97 59.56 60.15 60.75 61.36 61.98 62.60
- - - - - - - - -
- - - - - - - - -
- - - - - - - - -
- - - - - - - - -
- - - - - - - - -
- - - - - - - - -
- - - - - - - - -
- - - - - - - - -
- - - - - - - - -
57.81 58.38 58.97 59.56 60.15 60.75 61.36 61.98 62.60

2010Mar Apr May Jun Jul Aug Sep Oct Nov 11 12 12 12 12 12 12 12 12
402.32 406.34 410.40 414.51 418.65 422.84 427.07 431.34 435.65
- - - - - - - - -
- - - - - - - - -
- - - - - - - - -
- - - - - - - - -
- - - - - - - - -
- - - - - - - - -
- - - - - - - - -
- - - - - - - - -
- - - - - - - - -
402.32 406.34 410.40 414.51 418.65 422.84 427.07 431.34 435.65
114.95 116.10 117.26 118.43 119.61 120.81 122.02 123.24 124.47
- - - - - - - - -
- - - - - - - - -
- - - - - - - - -
- - - - - - - - -
- - - - - - - - -
- - - - - - - - -
- - - - - - - - -
- - - - - - - - -
- - - - - - - - -

114.95 116.10 117.26 118.43 119.61 120.81 122.02 123.24 124.47
45.98 46.44 46.90 47.37 47.85 48.32 48.81 49.30 49.79
- - - - - - - - -
- - - - - - - - -
- - - - - - - - -
- - - - - - - - -
- - - - - - - - -
- - - - - - - - -
- - - - - - - - -
- - - - - - - - -
- - - - - - - - -
45.98 46.44 46.90 47.37 47.85 48.32 48.81 49.30 49.79
63.22 63.85 64.49 65.14 65.79 66.45 67.11 67.78 68.46
- - - - - - - - -
- - - - - - - - -
- - - - - - - - -
- - - - - - - - -
- - - - - - - - -
- - - - - - - - -
- - - - - - - - -
- - - - - - - - -
- - - - - - - - -
63.22 63.85 64.49 65.14 65.79 66.45 67.11 67.78 68.46

2010 2011Dec Jan Feb Mar Apr May Jun Jul Aug 13 13 13 13 13 13 13 13 14
440.01 444.41 448.85 453.34 457.87 462.45 467.08 471.75 476.46
- - - - - - - - -
- - - - - - - - -
- - - - - - - - -
- - - - - - - - -
- - - - - - - - -
- - - - - - - - -
- - - - - - - - -
- - - - - - - - -
- - - - - - - - -
440.01 444.41 448.85 453.34 457.87 462.45 467.08 471.75 476.46
125.72 126.97 128.24 129.53 130.82 132.13 133.45 134.78 136.13
- - - - - - - - -
- - - - - - - - -
- - - - - - - - -
- - - - - - - - -
- - - - - - - - -
- - - - - - - - -
- - - - - - - - -
- - - - - - - - -
- - - - - - - - -
125.72 126.97 128.24 129.53 130.82 132.13 133.45 134.78 136.13
50.29 50.79 51.30 51.81 52.33 52.85 53.38 53.91 54.45
- - - - - - - - -
- - - - - - - - -
- - - - - - - - -
- - - - - - - - -
- - - - - - - - -
- - - - - - - - -
- - - - - - - - -
- - - - - - - - -
- - - - - - - - -
50.29 50.79 51.30 51.81 52.33 52.85 53.38 53.91 54.45
69.14 69.84 70.53 71.24 71.95 72.67 73.40 74.13 74.87
- - - - - - - - -
- - - - - - - - -
- - - - - - - - -
- - - - - - - - -
- - - - - - - - -
- - - - - - - - -
- - - - - - - - -
- - - - - - - - -
- - - - - - - - -
69.14 69.84 70.53 71.24 71.95 72.67 73.40 74.13 74.87
2011 2012Sep Oct Nov Dec Jan Feb Mar Apr May 14 14 14 14 14 14 15 15 15
481.23 486.04 490.90 495.81 500.77 505.78 510.83 515.94 521.10
- - - - - - - - -
- - - - - - - - -
- - - - - - - - -
- - - - - - - - -
- - - - - - - - -
- - - - - - - - -
- - - - - - - - -
- - - - - - - - -
- - - - - - - - -
481.23 486.04 490.90 495.81 500.77 505.78 510.83 515.94 521.10
137.49 138.87 140.26 141.66 143.08 144.51 145.95 147.41 148.89
- - - - - - - - -
- - - - - - - - -
- - - - - - - - -
- - - - - - - - -
- - - - - - - - -
- - - - - - - - -
- - - - - - - - -
- - - - - - - - -
- - - - - - - - -
137.49 138.87 140.26 141.66 143.08 144.51 145.95 147.41 148.89
55.00 55.55 56.10 56.66 57.23 57.80 58.38 58.96 59.55
- - - - - - - - -
- - - - - - - - -
- - - - - - - - -
- - - - - - - - -
- - - - - - - - -
- - - - - - - - -
- - - - - - - - -
- - - - - - - - -
- - - - - - - - -
55.00 55.55 56.10 56.66 57.23 57.80 58.38 58.96 59.55
75.62 76.38 77.14 77.91 78.69 79.48 80.27 81.08 81.89
- - - - - - - - -
- - - - - - - - -
- - - - - - - - -
- - - - - - - - -
- - - - - - - - -
- - - - - - - - -
- - - - - - - - -
- - - - - - - - -
- - - - - - - - -
75.62 76.38 77.14 77.91 78.69 79.48 80.27 81.08 81.89
2012 2013Jun Jul Aug Sep Oct Nov Dec Jan Feb 15 15 15 15 16 16 16 16 16
526.31 531.58 536.89 542.26 547.68 553.16 558.69 564.28 569.92
- - - - - - - - -
- - - - - - - - -
- - - - - - - - -
- - - - - - - - -
- - - - - - - - -
- - - - - - - - -
- - - - - - - - -
- - - - - - - - -
- - - - - - - - -
526.31 531.58 536.89 542.26 547.68 553.16 558.69 564.28 569.92
150.38 151.88 153.40 154.93 156.48 158.05 159.63 161.22 162.83
- - - - - - - - -
- - - - - - - - -
- - - - - - - - -
- - - - - - - - -
- - - - - - - - -
- - - - - - - - -
- - - - - - - - -
- - - - - - - - -
- - - - - - - - -
150.38 151.88 153.40 154.93 156.48 158.05 159.63 161.22 162.83
60.15 60.75 61.36 61.97 62.59 63.22 63.85 64.49 65.13
- - - - - - - - -
- - - - - - - - -
- - - - - - - - -
- - - - - - - - -
- - - - - - - - -
- - - - - - - - -
- - - - - - - - -
- - - - - - - - -
- - - - - - - - -
60.15 60.75 61.36 61.97 62.59 63.22 63.85 64.49 65.13
82.71 83.53 84.37 85.21 86.06 86.93 87.79 88.67 89.56
- - - - - - - - -
- - - - - - - - -
- - - - - - - - -
- - - - - - - - -
- - - - - - - - -
- - - - - - - - -
- - - - - - - - -
- - - - - - - - -
- - - - - - - - -
82.71 83.53 84.37 85.21 86.06 86.93 87.79 88.67 89.56
2013Mar Apr May Jun Jul Aug Sep Oct Nov 16 17 17 17 17 17 17 18 18
575.62 581.38 587.19 593.06 598.99 604.98 611.03 617.14 623.32
- - - - - - - - -
- - - - - - - - -
- - - - - - - - -
- - - - - - - - -
- - - - - - - - -
- - - - - - - - -
- - - - - - - - -
- - - - - - - - -
- - - - - - - - -
575.62 581.38 587.19 593.06 598.99 604.98 611.03 617.14 623.32
164.46 166.11 167.77 169.45 171.14 172.85 174.58 176.33 178.09
- - - - - - - - -
- - - - - - - - -
- - - - - - - - -
- - - - - - - - -
- - - - - - - - -
- - - - - - - - -
- - - - - - - - -
- - - - - - - - -
- - - - - - - - -
164.46 166.11 167.77 169.45 171.14 172.85 174.58 176.33 178.09
65.79 66.44 67.11 67.78 68.46 69.14 69.83 70.53 71.24
- - - - - - - - -
- - - - - - - - -
- - - - - - - - -
- - - - - - - - -
- - - - - - - - -
- - - - - - - - -
- - - - - - - - -
- - - - - - - - -
- - - - - - - - -
65.79 66.44 67.11 67.78 68.46 69.14 69.83 70.53 71.24
90.45 91.36 92.27 93.20 94.13 95.07 96.02 96.98 97.95
- - - - - - - - -
- - - - - - - - -
- - - - - - - - -
- - - - - - - - -
- - - - - - - - -
- - - - - - - - -
- - - - - - - - -
- - - - - - - - -
- - - - - - - - -
90.45 91.36 92.27 93.20 94.13 95.07 96.02 96.98 97.95

2013Dec 18
629.55
-
-
-
-
-
-
-
-
-
629.55
179.87
-
-
-
-
-
-
-
-
-

179.87
71.95
-
-
-
-
-
-
-
-
-
71.95
98.93
-
-
-
-
-
-
-
-
-
98.93

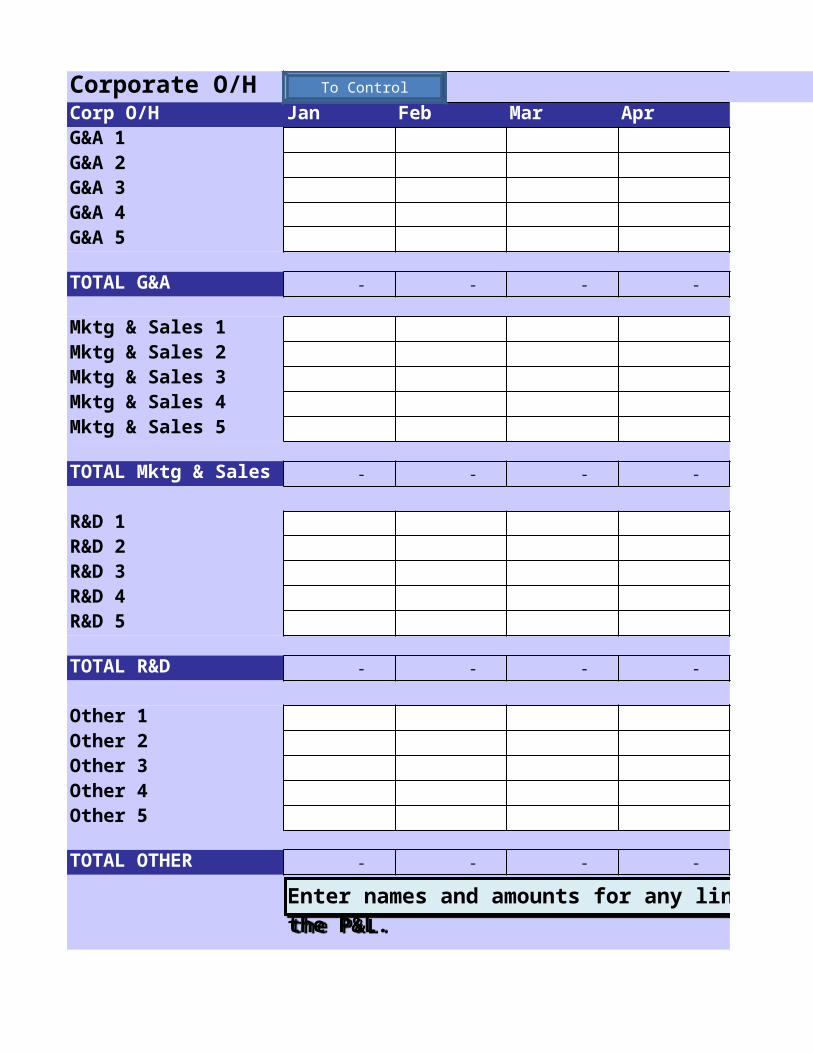
Corporate O/H 2009Corp O/H Jan Feb Mar Apr MayG&A 1G&A 2G&A 3G&A 4G&A 5
TOTAL G&A - - - - -
Mktg & Sales 1Mktg & Sales 2Mktg & Sales 3Mktg & Sales 4Mktg & Sales 5
TOTAL Mktg & Sales - - - - -
R&D 1R&D 2R&D 3R&D 4R&D 5
TOTAL R&D - - - - -
Other 1Other 2Other 3Other 4Other 5
TOTAL OTHER - - - - -
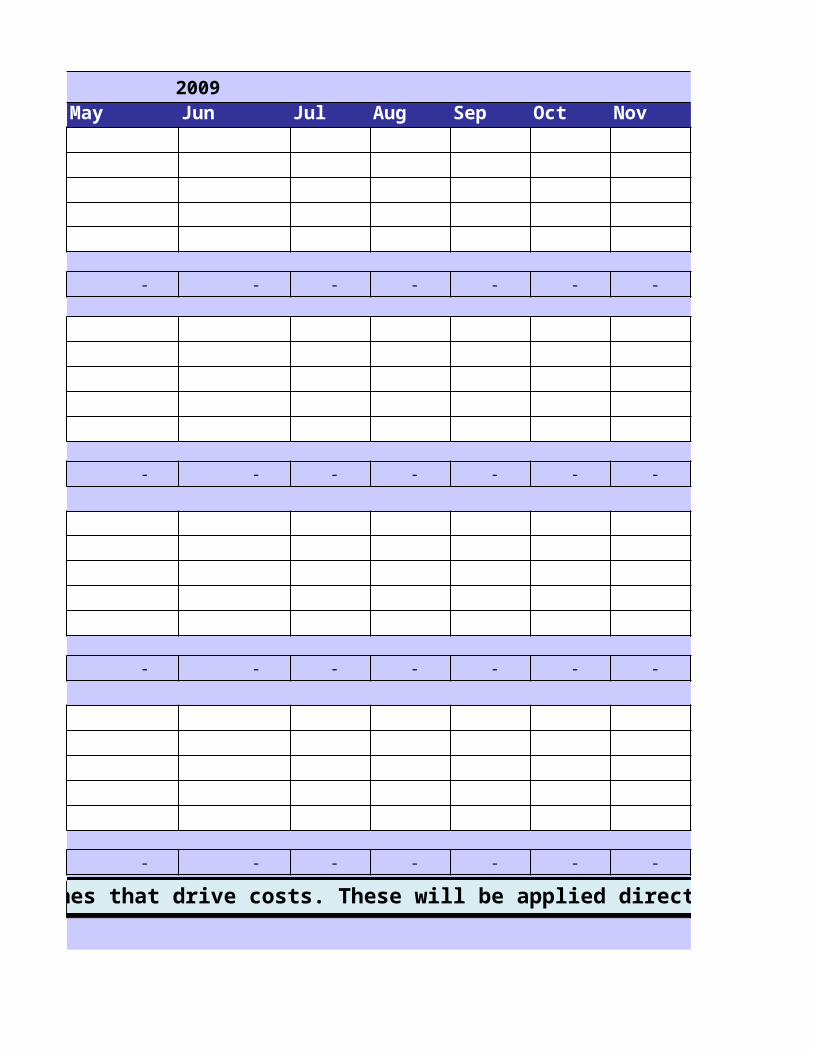
Enter names and amounts for any lines that drive costs. These will be applied directly to the P&L.Enter names and amounts for any lines that drive costs. These will be applied directly to the P&L.
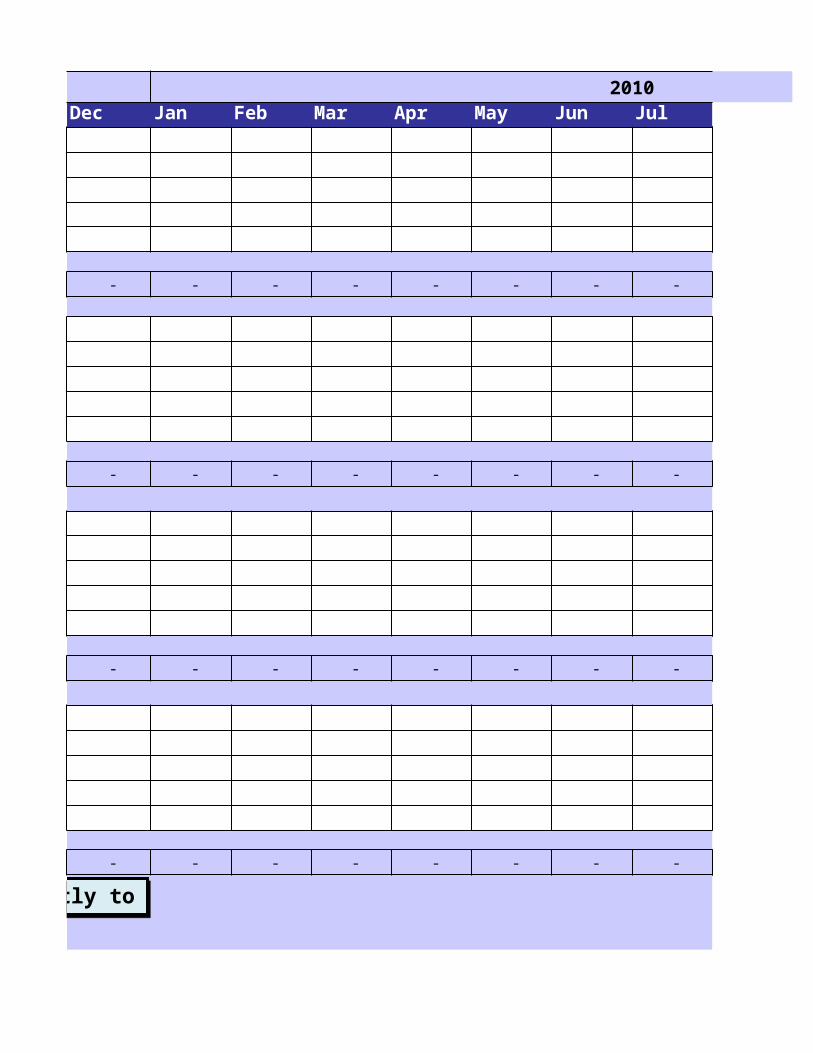
To Control
2009 2010Jun Jul Aug Sep Oct Nov Dec Jan Feb
- - - - - - - - -
- - - - - - - - -
- - - - - - - - -
- - - - - - - - -
Enter names and amounts for any lines that drive costs. These will be applied directly to the P&L.Enter names and amounts for any lines that drive costs. These will be applied directly to the P&L.
2010Mar Apr May Jun Jul Aug Sep Oct Nov
- - - - - - - - -
- - - - - - - - -
- - - - - - - - -
- - - - - - - - -
2010 2011Dec Jan Feb Mar Apr May Jun Jul Aug
- - - - - - - - -
- - - - - - - - -
- - - - - - - - -
- - - - - - - - -
2011 2012Sep Oct Nov Dec Jan Feb Mar Apr May
- - - - - - - - -
- - - - - - - - -
- - - - - - - - -
- - - - - - - - -
2012 2013Jun Jul Aug Sep Oct Nov Dec Jan Feb
- - - - - - - - -
- - - - - - - - -
- - - - - - - - -
- - - - - - - - -
2013Mar Apr May Jun Jul Aug Sep Oct Nov
- - - - - - - - -
- - - - - - - - -
- - - - - - - - -
- - - - - - - - -
2013Dec
-
-
-
-
Parameters
Products by Unit Material - Total Product Cost
Unit Price TOTAL Product 1 35.00 5.00 2.00 10.00
Product 2 -
Product 3 -
Product 4 -
Product 5 -
Product 6 -
Product 7 -
Product 8 -
Product 9 -
Product 10 -
First Year 2009
First Month 1.00
69.00
Tax Rate 34.5%
Ratios to Annual Revenue 27.00
A/R 0.14 (Indicates 49.275 days to collect receivables)
Ratio to Annual COGS 24.00
Inventory 0.12 (Indicates 43.8 Days of Supply)
Ratio to Annual Materials 21.00
A/P 0.11 (Indicates 38.325 days to pay vendors)
Interest on Notes 10%
Depreciation Years 10
(Straight Line)
Item Unit Cost
Units per Product
To Control
Unit Labor Factory Fixed Asset Purchases Investment 4.00 5.50 Asset 1 100,000.00
Asset 2Asset 3Asset 4Asset 5Asset 6Asset 7Asset 8Asset 9Asset 10
Bank Loans Investment Loan 1 100,000.00
Loan 2 (50,000.00)
Loan 3Loan 4
Enter the parameters on this page to set the product names, unit prices, unit costs, periods, and tax rate to be used in the financial statements and asset investments and dates.
Enter ratios to drive Balance Sheet A/R, Inventory, and A/P.
Enter the Interest Rate to drive Interest and the Depreciation Years to drive Depreciation on the P&L, using information from the Balance Sheet to complete the calculations.
Enter Assets and loans to be calculated on the Balance Sheet.
Date 1
21
21
21
21
21
21
21
21
21
Date 1
18
21
21
Enter the parameters on this page to set the product names, unit prices, unit costs, periods, and tax rate to be used in the financial statements and asset investments and dates.
Enter ratios to drive Balance Sheet A/R, Inventory, and A/P.
Enter the Interest Rate to drive Interest and the Depreciation Years to drive Depreciation on the P&L, using information from the Balance Sheet to complete the calculations.
Enter Assets and loans to be calculated on the Balance Sheet.
Mos
Jan Q1 2009
Feb Q2 2009
Mar Q3 2009
Apr Q4 2009
May Q1 2010
Jun Q2 2010
Jul Q3 2010
Aug Q4 2010
Sep Q1 2011
Oct Q2 2011
Nov Q3 2011
Dec Q4 2011
Jan Q1 2012
Feb Q2 2012
Mar Q3 2012
Apr Q4 2012
May Q1 2013
Jun Q2 2013
Jul Q3 2013
Aug Q4 2013