Stars and Galaxies - elysciencecenter.comelysciencecenter.com/yahoo_site_admin/assets/docs/... ·...
32
0 816 Ssections 1 Observing the Universe 2 Evolution of Stars Lab Star Cluster Age 3 Galaxies and the Milky Way 4 Cosmology Lab Expansion of the Universe Colliding Galaxies These two spiral galaxies, known as “the mice,” have been colliding for about 160 million years. Eventually, they will merge into one giant, elliptical galaxy. In your Science Journal, write a paragraph about what you know about the Sun as a star. Science Journal Stars and Galaxies Goddard Space Flight Center/NASA
Transcript of Stars and Galaxies - elysciencecenter.comelysciencecenter.com/yahoo_site_admin/assets/docs/... ·...

0816
Ssections
1 Observing the Universe
2 Evolution of StarsLab Star Cluster Age
3 Galaxies and the Milky Way
4 CosmologyLab Expansion of the Universe
Colliding GalaxiesThese two spiral galaxies, known as “the mice,”have been colliding for about 160 millionyears. Eventually, they will merge into onegiant, elliptical galaxy.
In your Science Journal, write aparagraph about what you know about the Sun as a star.Science Journal
Stars and Galaxies
Goddard Space Flight Center/NASA

817817
Cosmology Make thefollowing Foldable to helpidentify what you know, what
you want to know, and what you learned aboutstars, galaxies, and cosmology.
Fold a vertical sheetof paper from side toside. Make the frontedge about �
12
� inchlonger than the backedge.
Turn lengthwiseand fold into thirds.
Unfold and cut only the top layeralong both folds to make three tabs.Label each tab as shown.
Questioning Before you read the chapter, writewhat you know about cosmology under the lefttab of your Foldable, and write questions aboutwhat you’d like to know under the center tab.After you read the chapter, list what you learnedunder the right tab.
STEP 3
STEP 2
STEP 1
Stars in the SkyHave you ever looked up at the night sky andbeen amazed at the number of stars youcould see? But if you live in a well lightedarea, you may not have seen very many starsat all. In this lab, you will explore a quick wayto estimate how many stars you can see indifferent parts of the sky.
1. Ask an adult to help you locate an areanear your home suitable for star gazingwhere there are not very many lights.
2. Hold a cardboard tube up to one eye andlook through it at one area of the sky.
3. Count the number of stars you can seeeasily through the tube.
4. Look at three other areas of the sky inthe same way and count those stars. Trylooking to the south, west, straight up,and in a random direction.
5. Compare your data with those of two orthree other students.
6. Think Critically In your Science Journal,report whether a similar number ofstars were easily visible no matter whereyou looked or whether the number ofstars varied. Explain any similarities ordifferences noted by you or otherstudents.
Start-Up Activities
Preview this chapter’s contentand activities at gpescience.com
Know? Learned?Like toKnow?
Goddard Space Flight Center/NASA

818 CHAPTER 26 Stars and Galaxies
ConstellationsHave you ever watched clouds drift by on a summer day and
tried to find shapes and patterns in them? One might look like aship and another might resemble a rabbit or a bear. Long ago,people did much the same thing with stars. They named thesepatterns of stars after characters in stories, animals, or tools.Many of the names given to these star patterns by ancient cul-tures survive today and are called constellations. Astronomersuse these constellations to locate and name stars.
From Earth, the stars in a constellation appear relativelyclose to one another. You can see that some of the stars arebrighter than others, but you can’t see how far they are from youor from each other. Usually, they lie at greatly different distancesand just happen to line up and form a pattern.
In Figure 1, three constellations are shown with some oftheir brighter stars. The constellations visible in the evening skychange throughout the year.
Mythology In many cultures, Orion wasa great hunter who had two hunting dogs,
Canis Major (big dog) and Canis Minor (little dog). In anothermyth, two bears traveled around Earth’s north pole. The constel-lations Ursa Major and Ursa Minor (big and little bears) werenamed for them. Indeed, they do swing around the north pole.In fact, Polaris, the polestar, is in Ursa Minor. If you have seenthe Big Dipper you have seen most of Ursa Major, because thedipper is part of this constellation.
Observing the Universe
Figure 1 These three constella-tions contain some of the brighteststars visible from the northernhemisphere—Betelgeuse, Rigel,and Sirius.
Reading Guide
■ Describe a constellation as apattern of stars.
■ Compare and contrast types ofoptical telescopes.
■ Explain how a radio telescopediffers from an optical one.
You can observe different parts of theuniverse from your home.
Review Vocabularyelectromagnetic spectrum: theentire range of wavelengths ofelectromagnetic energy
New Vocabulary
• constellation
• refracting telescope
• reflecting telescope
• radio telescope
• light-year
• spectroscope
Orion
Rigel
Nebula
Betelgeuse
Canis Minor
Canis Major
Sirius

SECTION 1 Observing the Universe 819
Telescopes Constellations and the stars that make them upare visible with the unaided eye. However, to see other objects inspace, or to see some objects better, you need a telescope.Scientists and amateur astronomers use many different types oftelescopes. Optical telescopes are used to study objects in visiblelight, and radio telescopes are used to study objects in the radiowavelengths. What do you think would be used to study X rays?
Optical Telescopes There are two basic types of optical tel-escopes. One type uses only lenses to study light and the otheruses lenses and mirrors. Optical telescopes collect visible lightand produce magnified images of objects. Light is collected byan objective lens or mirror. Because starlight is so distant, thelight forms an image at the focus of the telescope. The focus iswhere light that is bent by the objective lens or reflected by theobjective mirror comes together. A second lens, the eyepiecelens, then magnifies the image. The distance from the objectiveto the focus is the focal length of the telescope. You can find themagnifying power (Mp) of a telescope by dividing the focallength of the objective ( fo) by the focal length of the eyepiece( fe).
Refracting Optical Telescopes A refracting telescope usesa convex lens, which is curved outward like the surface of a ball, asan objective, shown in Figure 2. When the lens curves outward onboth sides, it is a double convex lens. Light passes through theobjective lens. The eyepiece, which also can be a double convex lens,then magnifies the image. There is a limit to how large a refractingtelescope can be. Since the objective lens can be supported only atits edges, it could sag in the middle if it is too large. When a largertelescope is needed, a reflecting telescope is used.
What type of optical telescope uses a lens asan objective?
Mp � fo/fe
Figure 2 Two lenses are all that isneeded for a refracting telescope. The tubeand tripod aid in viewing.Identify the curvature of an objective lens.
Modeling a TelescopeProcedure1. Obtain two lenses of dif-
ferent focal length fromyour teacher.
2. Place double-sided tapearound the edge of one lens.
3. Place the lens along theshort side of a piece ofconstruction paper androll the paper around thelens to form a tube. Tapethe tube securely.
4. Repeat steps 2 and 3 withthe other lens.
5. Insert the small tube intothe large tube with thelenses on opposite ends.
6. Look through the eyepiecelens (small tube) and slideit in and out until you see aclear image.
Analysis1. Observe an object with and
without your telescope.Estimate how many timeslarger it appears throughthe telescope.
2. Obtain the focal lengths ofyour lenses from yourteacher. Calculate themagnifying power of yourtelescope using the equa-tion on this page. Comparethis value to your estimate.
Convex lens
Eyepiece lens
Focal point

820 CHAPTER 26 Stars and Galaxies
Reflecting Optical Telescopes A reflectingtelescope uses a mirror as an objective to reflect lightto the focus. Figure 3 shows how light passes throughthe open end of a reflecting telescope and strikes aconcave mirror at the base of the telescope. Often, asmaller mirror is used to reflect light into the eye-piece where it is magnified for viewing. However, invery large reflecting telescopes, the astronomer sitsinside the telescope and looks through the eyepiece atthe focus. Because mirrors can be supported fromunderneath a much larger telescope can be built.
Figure 3 Reflecting telescopes useconcave mirrors to gather light.
Use Equations
1. Find the magnifying power of a telescope with a focal length of 2,500 mm when using eye-pieces with focal lengths of 50 mm and 10 mm.
2. Find the magnifying power for a telescope with a focal length of 900 mm when using aneyepiece with a focal length of 12 mm.
For more practice problems, go to page 879 and visit Math Practice at .gpescience.com
THE MAGNIFYING POWER OF TELESCOPES If the focal lengths of a telescope’s objective and
eyepiece are known, the magnifying power can be calculated from the equation:
Mp � fo/feIn this equation, Mp is the magnifying power of the telescope, fo is the focal length of the
objective, and fe is the focal length of the eyepiece. Find the magnifying power of a telescope
with a focal length of 1200 mm using eyepieces of 20 mm and 6 mm.
known values and unknown values.
Identify the known values.
the focal length of the objective is 1,200 mm, this fo � 1,200 mm
the focal lengths of the eyepieces are 20 mm and 6 mm, this fe � 20 mm; 6 mm
Identify the unknown value
what is the magnifying power of the telescope Mp � ?
the problem
Substitute the known values into the equation for magnifying power:
Mp = 1,200 mm/20 mm � 60 Mp = 1,200 mm/6 mm � 200
Notice that the units cancel, and that magnifying power has no unit.
the answer
Does your answer seem reasonable? Do images look 60 times larger than the object when
using the 20 mm eyepiece and 200 times larger when using the 6 mm eyepiece?
CHECK
SOLVE
means
means
means
IDENTIFY
Focal point Eyepiece lens
Objective mirror
Flat mirror Focal length

SECTION 1 Observing the Universe 821
New Telescope Design The most recent innova-tions in optical telescopes involve active and adaptiveoptics. With active optics, a computer is used to correctchanges in temperature, mirror distortions, and badviewing conditions. Adaptive optics uses a laser to probethe atmosphere and relay information to a computerabout air turbulence. The computer then adjusts the tele-scope’s mirror thousands of times per second to lessenthe effects of atmospheric turbulence. The EuropeanSouthern Observatory’s Very Large Telescope in Chile, thelargest optical telescope in use, uses adaptive optics.
Radio Telescopes Radio waves, like visible light, are a formof electromagnetic energy emitted by stars and other objects inspace. Radio waves can be detected even during the day, whenthe Sun’s light makes it impossible to see the fainter visible lightfrom other stars. Radio waves pass freely through Earth’s atmos-phere, even on completely cloudy days.
A telescope that collects and amplifies radio waves is a radiotelescope. Because radio waves have long wavelengths, a radio tel-escope must be built with a very large objective, usually some formof dish antenna. Astronomers often build several radio telescopesclose together and connect them to form one large telescope. TheVLA (very large array), shown in Figure 4, is an example of this.
What type of telescope is used to study radiowaves?
Hubble Space Telescope Even using active and adaptiveoptics, the atmosphere limits what Earth-based telescopes canachieve. For this reason, astronomers use space telescopes, suchas the Hubble Space Telescope shown in Figure 5.
The clear images provided by Hubble arechanging scientists’ ideas about space. Oneobject viewed by Hubble is the massive galaxycluster Abell 2218, which is about 2 billionlight-years away. This cluster acts as a gravitylens that magnifies the light of even more dis-tant galaxies. Such large distances in space aremeasured in a unit called a light-year, the dis-tance that light travels in one year—about9.5 trillion km. Even though it may seem con-fusing, remember that a light-year measuresdistance, not time.
Topic: New TelescopeDesignVisit for Weblinks to information about thedevelopment of new telescopes.
Activity Write and illustrate aparagraph about one of the newdesigns being considered forEarth-based telescopes or Earth-orbital telescopes.
gpescience.com
Figure 4 27 dish antennae ofthe VLA are mounted on railroadtracks for rapid repositioning. The304-m dish antenna in Arecibo,Puerto Rico is shown in the inset.
Figure 5 The Hubble Space Telescope orbits Earth at analtitude of 610 km.
(t)NRAO/AUI/NSF, (b)NASA
822 CHAPTER 26 Stars and Galaxies
Self Check1. Define constellation.
2. Compare and contrast refractor telescopes andreflector telescopes.
3. Describe the objective of a radio telescope.
4. Explain how radio waves differ from visible light.
5. Think Critically Why do astronomers change eyepiecesrather than objectives when they wish to increase themagnifying power of a telescope?
SummaryConstellations
• Constellations are patterns of stars that areused today to name and locate stars.
Telescopes
• Refracting telescopes use lenses to collectlight and magnify the image.
• Reflecting telescopes use a mirror to collectlight and a lens to magnify the image.
• A radio telescope collects and amplifies radiowaves.
Spectroscopes
• A spectroscope disperses light into itsspectrum.
6. Use Numbers If the magnifying powers (Mp) of refract-ing and reflecting telescopes are 20 and 100, respectively,how much greater is the Mp of the reflecting telescope?
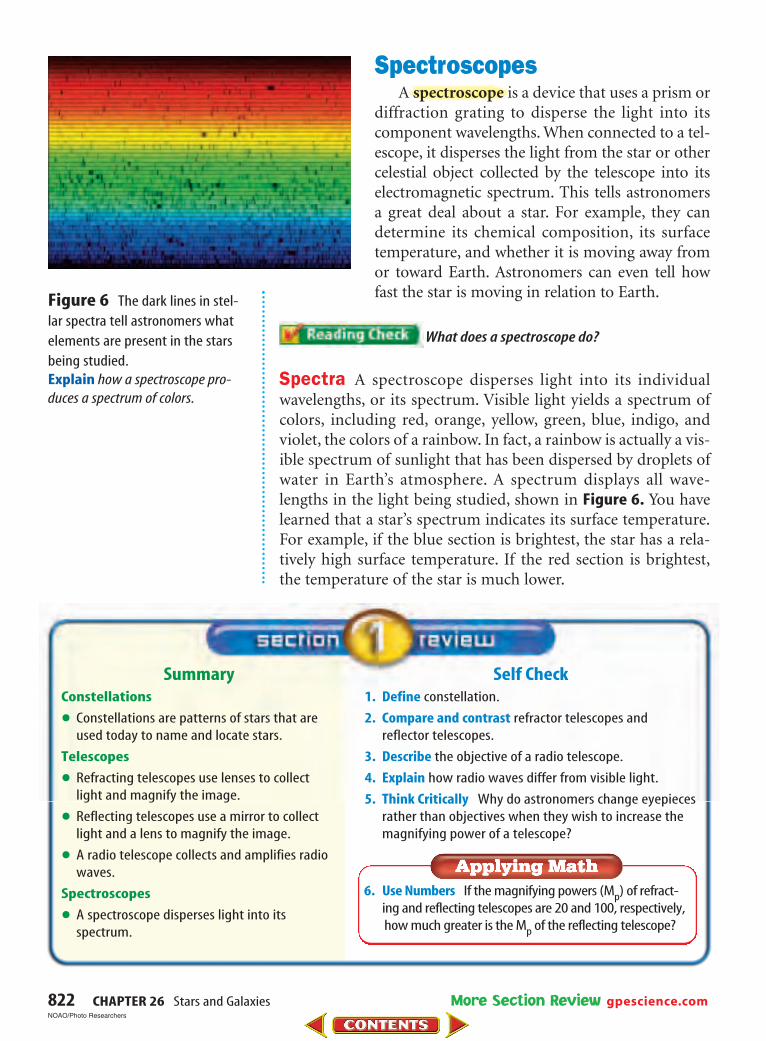
SpectroscopesA spectroscope is a device that uses a prism or
diffraction grating to disperse the light into itscomponent wavelengths. When connected to a tel-escope, it disperses the light from the star or othercelestial object collected by the telescope into itselectromagnetic spectrum. This tells astronomersa great deal about a star. For example, they candetermine its chemical composition, its surfacetemperature, and whether it is moving away fromor toward Earth. Astronomers can even tell howfast the star is moving in relation to Earth.
What does a spectroscope do?
Spectra A spectroscope disperses light into its individualwavelengths, or its spectrum. Visible light yields a spectrum ofcolors, including red, orange, yellow, green, blue, indigo, andviolet, the colors of a rainbow. In fact, a rainbow is actually a vis-ible spectrum of sunlight that has been dispersed by droplets ofwater in Earth’s atmosphere. A spectrum displays all wave-lengths in the light being studied, shown in Figure 6. You havelearned that a star’s spectrum indicates its surface temperature.For example, if the blue section is brightest, the star has a rela-tively high surface temperature. If the red section is brightest,the temperature of the star is much lower.
More Section Review gpescience.com
Figure 6 The dark lines in stel-lar spectra tell astronomers whatelements are present in the starsbeing studied.Explain how a spectroscope pro-duces a spectrum of colors.
NOAO/Photo Researchers

SECTION 2 Evolution of Stars 823
How do stars form?Star formation begins with condensation of a large cloud of
gas, ice, and dust called a nebula. These particles exert a gravita-tional force on each other, and the nebula contracts.Gravitational instability within the nebula causes it to break upinto smaller cloud fragments. As a cloud fragment condenses itstemperature increases. When the interior temperature reaches1 million K, the center of the cloud is called a protostar. Whenthe temperature reaches 10 million K, hydrogen fuses to formhelium and a star is born.
H-R Diagram In the early 1900s, EjnarHertzsprung and Henry Russell studiedthe relationship between absolute mag-nitude and temperature of stars. Theynoticed that higher-temperature starsradiate more energy and have higherabsolute magnitudes. As stars form, evenwhile they are still protostars, they canbe plotted on the Hertzsprung-Russell(H-R) diagram, like the one shown inFigure 7. About 90 percent of all starsfall on a line drawn from the upper leftto the lower right of the H-R diagram,called the main sequence. The other10 percent of stars fall elsewhere on thegraph and will be discussed later.
Evolution of StarsReading Guide
■ Explain how stars form.■ Classify the stages of stellar evo-
lution using a Hertzsprung-Russel(H-R) diagram.
■ Describe the Sun and explainhow it has and will evolve.
The Sun is the star that providesenergy for life on Earth.
Review Vocabularyabsolute magnitude: a measure ofthe amount of light given off by a star
New Vocabulary
• main sequence
• giant
• white dwarf
• solar mass
• photosphere
• sunspots
New Vocabulary
• main sequence
• giant
• white dwarf
• solar mass
• photosphere
• sunspots
Lum
inos
ity
( L )
1,000,000 L
25,000 10,000 6,000 3,000
10,000 L
100 L
1100
L
L
110,000
L
Supergiants
Giants
Main sequence
Sun
White dwarfs
O B A F G K M
Temperature (K)
Hertzsprung-Russell Diagram for Stars
Figure 7 The Sun is located inthe center of the main sequence onthis H-R diagram. It is cooler thanyoung stars like Vega and Sirius,but warmer than the giantBetelgeuse.

824 CHAPTER 26 Stars and Galaxies
How do stars change?A star like our Sun probably had a diameter about 100 times
its present size while a protostar. As a star continues to form, itshrinks and increases in density, raising its interior temperature.Once fusion begins and the star attains stellar equilibrium, it set-tles onto the main sequence. In general, stellar equilibrium is thebalance between outward pressure due to energy released infusion and inward pressure due to gravity. Once this state ofequilibrium is lost, the star enters the next stage of its life.
Main Sequence As long as the star’s gravity balances outwardpressures, the star remains on the main sequence. Stars arethought to spend most of their lives on the main sequence, whichexplains why this is the largest group on the H-R diagram. TheSun has been a main sequence star for about 5 billion years andwill continue in this stage for about another 5 billion years.
The Sun is classified as which type of star?
When its hydrogen fuel is depleted, a star loses its equilibriumand its main sequence status. What it becomes next is deter-mined by the total mass of the star. An average star like the Sunwill become a giant, then a white dwarf, and finally a black dwarf.Stars more massive than the Sun can become supergiants andend up as neutron stars or black holes. Stars much lower in massthan the Sun, like the red dwarf star Proxima Centauri, couldremain on the main sequence for 16 trillion years. Most stars onthe main sequence are red dwarfs, and they probably make upabout 80 percent of all stars in the universe.
Figure 8 Only part of the giantstar Antares is shown here. Supergiant stars, such as Betelgeuse, aretoo large to be shown at all.
Capella10 R
Vega4 R
Sirius A2 RArcturus
23 R
Sun1 R
Jupiter0.1 R
Sirius B0.01 R
Proxima Centauri0.03 R
White Dwarf
Barnard's Star0.07 R
Antares 300 RMira 80 R
Counting StarsProcedure1. Draw a grid of twenty
squares, with each squaremeasuring 5 cm on a side.The final grid will be 25 cmlong and 20 cm wide.
2. Randomly scatter aboutone tablespoon of whiterice over the grid.
3. Select three squares andcount the number of ricegrains that are either com-pletely within each squareor partly touching its rightside or bottom. Calculatethe average number ineach square.
4. Multiply the average by 20.
Analysis1. How many rice grains are
located within the grid?2. How does this process
model counting stars?

SECTION 2 Evolution of Stars 825
Giants and Dwarfs When hydrogen in a star’s core is usedup, its outward pressure is overcome by gravity. Its core con-tracts and increases in temperature. The outer layers expand andcool. In this late stage of its life cycle, an average star like our Sunis called a giant. In about five billion years, our Sun will becomea giant like the one shown in Figure 8.
The giant’s core continues to contract and become hotter.Eventually, the core uses up its helium and contracts even more.When temperature reaches 100 million K, helium fuses, formingcarbon. Now the star is enormous and its surface is much cooler.Its outer layers escape into space leaving behind the hot, densecore that continues to contract. At this final stage in an averagestar’s evolution, it is a white dwarf. A white dwarf, also shownin Figure 8, is about the size of Earth.
Supergiants, Neutron Stars, and Black Holes Starsthat are over eight times more massive than our Sun take a differ-ent course. Their cores reach temperatures high enough to causefusion that produces heavier and heavier elements. The starexpands into a supergiant, such as Betelgeuse shown in Figure 9.Eventually, iron accumulates in the core. Since iron does not fusereadily, there is no outward radiation of energy to counteract theinward pull of gravity. The core collapses violently, and the outerportion of the star explodes, producing a supernova.
A supernova is a gigantic explosion in which the tempera-ture in the collapsing core reaches 10 billion K and atomic nucleiare split into neutrons and protons. Protons merge with elec-trons to form neutrons, and the collapsing core becomes a neu-tron star. A typical neutron star is the size of a major city onEarth, but has a mass greater than the Sun’s.
Very massive stars, with masses greater than 25 times that ofthe Sun, face a different end. In this case, the final collapse of thecore continues past the neutron-star stage, forming a blackhole—an object so dense that nothing can escape its gravity if itgets too close.
Supernovas The heavy elements you are made offormed during supernova explosions. Type I supernovasform from hydrogen-poor, low mass stars that havepulled in matter from a nearby red giant star. Thisprocess, called carbon detonation, causes carbon fusionalmost everywhere inside the star and is thought todestroy the star completely. In contrast, Type II super-novas form from hydrogen-rich, high mass stars. Theyleave behind a collapsed core that can then condense fur-ther to form a neutron star or black hole.
Figure 9 Betelgeuse is locatedin the constellation of Orion. Itsdiameter is larger than the diame-ter of Jupiter’s orbit around theSun.Classify What kind of star isBetelgeuse?
NASA Goddard Space Flight Center
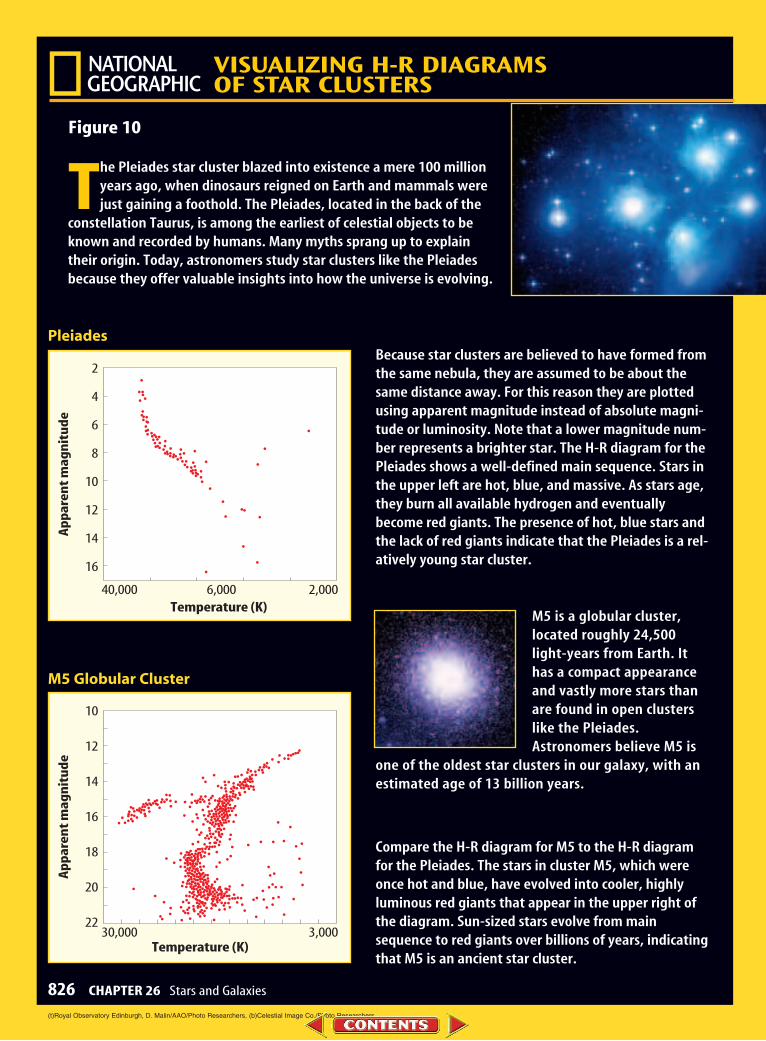
Figure 10
VISUALIZING H-R DIAGRAMS OF STAR CLUSTERS
826 CHAPTER 26 Stars and Galaxies
The Pleiades star cluster blazed into existence a mere 100 millionyears ago, when dinosaurs reigned on Earth and mammals werejust gaining a foothold. The Pleiades, located in the back of the
constellation Taurus, is among the earliest of celestial objects to beknown and recorded by humans. Many myths sprang up to explaintheir origin. Today, astronomers study star clusters like the Pleiadesbecause they offer valuable insights into how the universe is evolving.
Because star clusters are believed to have formed fromthe same nebula, they are assumed to be about thesame distance away. For this reason they are plottedusing apparent magnitude instead of absolute magni-tude or luminosity. Note that a lower magnitude num-ber represents a brighter star. The H-R diagram for thePleiades shows a well-defined main sequence. Stars inthe upper left are hot, blue, and massive. As stars age,they burn all available hydrogen and eventuallybecome red giants. The presence of hot, blue stars andthe lack of red giants indicate that the Pleiades is a rel-atively young star cluster.
M5 is a globular cluster,located roughly 24,500light-years from Earth. Ithas a compact appearanceand vastly more stars thanare found in open clusterslike the Pleiades.Astronomers believe M5 is
one of the oldest star clusters in our galaxy, with anestimated age of 13 billion years.
Compare the H-R diagram for M5 to the H-R diagramfor the Pleiades. The stars in cluster M5, which wereonce hot and blue, have evolved into cooler, highlyluminous red giants that appear in the upper right ofthe diagram. Sun-sized stars evolve from mainsequence to red giants over billions of years, indicatingthat M5 is an ancient star cluster.
2
4
6
8
10
12
14
16
40,000
Ap
par
ent
mag
nit
ud
e
Temperature (K)6,000 2,000
10
12
14
16
18
20
2230,000
Ap
par
ent
mag
nit
ud
e
Temperature (K)3,000
Pleiades
M5 Globular Cluster
(t)Royal Observatory Edinburgh, D. Malin/AAO/Photo Researchers, (b)Celestial Image Co./Photo Researchers
SECTION 2 Evolution of Stars 827
The Sun—A Main Sequence StarThe Sun is a middle-aged star and is plotted just about in the
middle of the main sequence on the H-R diagram. It is averagein size, temperature, and absolute magnitude. A solar mass issimply the mass of the Sun. For most stars, the relationshipbetween mass and luminosity can be approximated by
where L0 and M0 are the luminosity and mass of the Sun. TheH-R diagrams, shown in Figure 10, are used to compare veryyoung stars to very old stars.
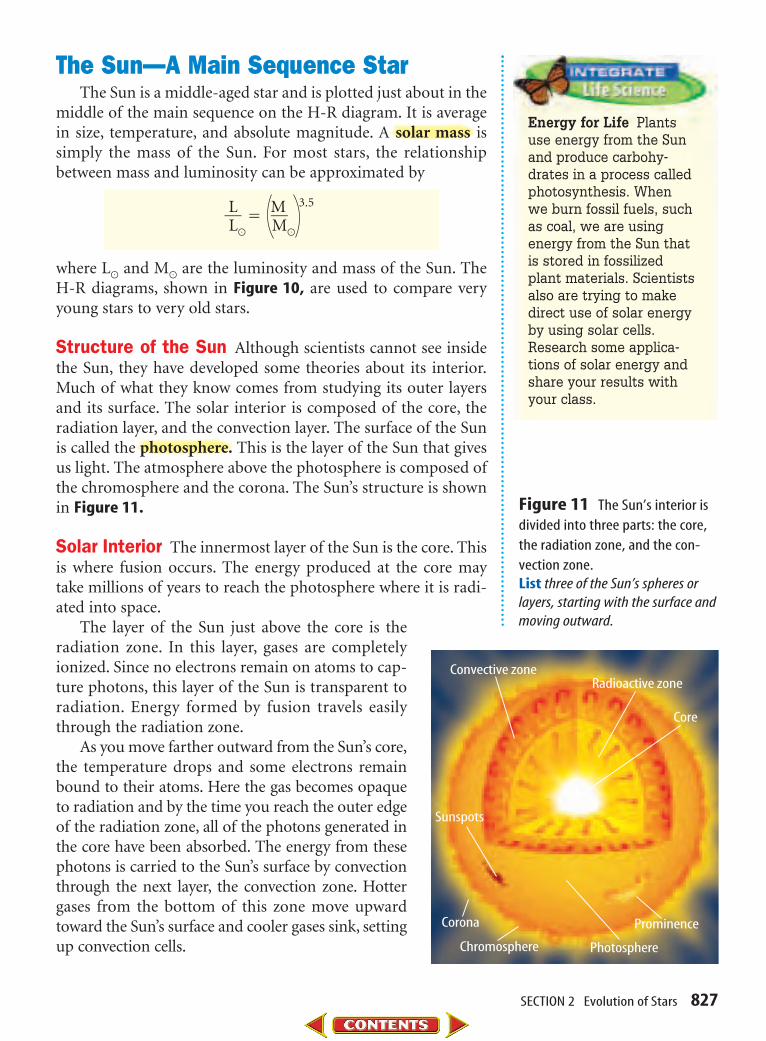
Structure of the Sun Although scientists cannot see insidethe Sun, they have developed some theories about its interior.Much of what they know comes from studying its outer layersand its surface. The solar interior is composed of the core, theradiation layer, and the convection layer. The surface of the Sunis called the photosphere. This is the layer of the Sun that givesus light. The atmosphere above the photosphere is composed ofthe chromosphere and the corona. The Sun’s structure is shownin Figure 11.
Solar Interior The innermost layer of the Sun is the core. Thisis where fusion occurs. The energy produced at the core maytake millions of years to reach the photosphere where it is radi-ated into space.
The layer of the Sun just above the core is theradiation zone. In this layer, gases are completelyionized. Since no electrons remain on atoms to cap-ture photons, this layer of the Sun is transparent toradiation. Energy formed by fusion travels easilythrough the radiation zone.
As you move farther outward from the Sun’s core,the temperature drops and some electrons remainbound to their atoms. Here the gas becomes opaqueto radiation and by the time you reach the outer edgeof the radiation zone, all of the photons generated inthe core have been absorbed. The energy from thesephotons is carried to the Sun’s surface by convectionthrough the next layer, the convection zone. Hottergases from the bottom of this zone move upwardtoward the Sun’s surface and cooler gases sink, settingup convection cells.
L�
M 3.5� �L0 M0
Energy for Life Plantsuse energy from the Sunand produce carbohy-drates in a process calledphotosynthesis. Whenwe burn fossil fuels, suchas coal, we are usingenergy from the Sun thatis stored in fossilizedplant materials. Scientistsalso are trying to makedirect use of solar energyby using solar cells.Research some applica-tions of solar energy andshare your results withyour class.
Chromosphere Photosphere
Sunspots
Corona
Convective zoneRadioactive zone
Core
Prominence
Figure 11 The Sun’s interior isdivided into three parts: the core,the radiation zone, and the con-vection zone.List three of the Sun’s spheres orlayers, starting with the surface andmoving outward.

828 CHAPTER 26 Stars and Galaxies
Photosphere The Sun’s photosphere, or surface, is at the topof the convection zone and has a mottled appearance, calledgranulation. This is caused by rising hot material and sinkingcooler material within the convection cells. Each granule shownin Figure 12 is about 1,000 km across and is a direct result ofconvection cells in the convection zone.
Sunspots Some areas of the Sun appear darker than others.These darker areas of the Sun’s photosphere, called sunspotsare cooler than surrounding areas. Scientists can observe themovement of individual sunspots as they move with the Sun’srotation. They show that the Sun doesn’t rotate as a solidbody—it rotates faster at its equator than at its poles.Sunspots near the equator take about 25 days to go aroundthe sun, but at about 60 degrees north or south latitude, theytake about 31 days. Figure 12 shows a closeup view of somesunspots.
What is a sunspot?
Sunspots aren’t permanent features of the Sun. They appearand disappear over periods of days, weeks, or months. Thenumber of sunspots changes in a fairly regular pattern called thesunspot, or solar activity, cycle. Periods of sunspot maximumoccur about every 11 years, with periods of sunspot minimumoccurring in between. At a sunspot minimum, sunspots appearat high latitudes. As the cycle progresses, they appear closer tothe Sun’s equator. By the next minimum, they again cluster athigh latitudes.
Prominences and Flares Intense magnetic fields associatedwith sunspots can cause huge arching columns of gas calledprominences to erupt, as shown in Figure 13. Convection inthe convection zone causes magnetized gases to flow upwardtoward the photosphere. Sometimes the magnetic field strengthis great enough that magnetic field lines shoot out from the sur-face near a pair of sunspots and cause a prominence of solarmaterial to loop from one spot to the other. Some prominencesblast material from the sun into space at speeds ranging from600 km/s to more than 1,000 km/s.
Gases near a sunspot sometimes brighten suddenly, shoot-ing gas outward at high speed in what are called solar flares.Temperatures within these flares can reach 100 million K.Particles produced in a flare possess so much energy that theSun’s magnetic field cannot hold them as it can hold promi-nences and they blast into space.
Figure 12 Sunspots, above, areoften 2,000 K cooler than the sur-rounding granules, shown below.
Figure 13 This prominence ofdense plasma appears suspendedin the Sun’s chromosphere as itloops back to the surface.
(b)Courtesy SOHO/Extreme Ultraviolet Imaging Telescope (EIT) Consortium/NASA, (others)NASA

SECTION 2 Evolution of Stars 829
Self Check1. Explain how stars form from nebulae.
2. Describe the different evolution stages of stars asshown on the H-R diagram.
3. Describe the structure of the Sun.
4. Explain the difference between Type I and Type IIsupernovas.
5. Think Critically What happens to stellar equilibrium tomake a main sequence star evolve into a giant star?
SummaryHow do stars form?
• Stars form from a large cloud of gas, ice, anddust. Once the temperature inside the nebulareaches 10 million K, fusion begins.
• The H-R diagram plots temperature v.absolute magnitude of stars.
How do stars change?
• Once fusion begins, a star develops stellar equi-librium and becomes a main sequence star.
• When the hydrogen fuel is depleted, a starloses stellar equilibrium and evolves into agiant, or a supergiant.
The Sun—A Main Sequence Star
• The Sun’s energy is produced by fusion.
• Sunspots are dark, cooler regions on the Sun’sphotosphere.
• Other solar features that can affect Earth areprominences, flares, and CMEs.
6. Use Percentages Eighty percent of all stars are reddwarfs. Out of a random sample of 2,000 stars in thegalaxy, about how many will plot on the H-R diagramas a red dwarf?
7. Use Numbers If the Sun will remain a main sequencestar for a total of 10 billion years and Proxima Centauriwill remain one for 16 trillion years, how many timeslonger will Proxima Centauri be a main sequence star?
CMEs Sometimes large bubbles of ionized gas are emittedfrom the Sun. These are known as CMEs (coronal mass ejec-tions). During sunspot minimums there is usually one CMEper week, but during a sunspot maximum, there are two tothree per day. When a CME is released in the direction of Earth,it appears as a halo around the Sun, as shown in Figure 14. Asit passes Earth, the planet is exposed to a sudden shock wave ofincreased solar wind. Earth’s atmosphere protects us, butoccurrences of auroras increase. When scientists note a CME,they post an alert to watch for auroras at lower latitudes thannormal.
Auroras take place when high-energy particles in CMEs andthe solar wind are carried past Earth’s magnetic field. This gen-erates large electric currents that flow toward Earth’s poles.These electric currents ionize gases in Earth’s atmosphere. Whenthese ions recombine with electrons and drop to a lower energylevel, they produce light. This light is called the aurora borealis,or northern lights, when it occurs in the northern hemisphere.In the southern hemisphere, it is called the aurora australis.CMEs present little danger to life on Earth, but some of thehighly charged solar wind material disrupts Earth’s magnetos-phere and interferes with orbiting satellites and radio signals.
More Section Review gpescience.com
Figure 14 CMEs like this onecan hurl a million tons of matterinto space each second. They candamage satellites and endangerastronauts.
SOHO/LASCO (ESA & NASA)

Stars are plotted on the H-R diagram based ontheir temperature and brightness. You candetermine the age of a cluster of stars by study-ing the H-R diagram of the stars within thecluster. Massive main sequence stars, locatedat the upper left of the diagram, evolve fasterthan stars farther down the main sequence.Stars in the lower right of the diagram evolvemore slowly. How could you use this idea tohelp determine the relative ages of star clustersfrom their H-R diagrams?
Real-World ProblemHow can the relative age of star clustersbe determined from H-R diagrams of eachcluster?
Goals■ Compare and contrast H-R diagrams of
several star clusters.■ Determine the relative ages of four star
clusters.
Materialsfour H-R diagrams of star clusters
Procedure1. Study the four H-R diagrams your teacher
gives you.
2. Note which types of stars remain on themain sequence and which stars have evolvedoff the main sequence.
3. Based on the evolution of the stars withineach star cluster, decide which cluster isyoungest and which is oldest. Also decide
the relative ages of the other two starclusters. HINT: The oldest cluster will havesome that have evolved to white dwarfs.
Conclude and Apply1. Compare and contrast H-R diagrams of
four star clusters.
2. Determine which star cluster was youngestand which was oldest.
3. Explain how you determined the ages ofthese two star clusters.
4. Determine the relative ages of the remain-ing two star clusters.
5. Explain how you determined the ages ofthese two star clusters.
Lum
inos
ity
sol
ar u
nits
100
1
O B A F G K MSpectral type
StArClusterAge
Explain to your friends how the relativeages of star clusters can be found bystudying H-R diagrams.
830 CHAPTER 26 Stars and Galaxies

SECTION 3 Galaxies and the Milky Way 831
GalaxiesOne reason to study astronomy is to learn about your place
in the universe. Long ago, people thought Earth was at the centerof the universe. You know this isn’t true, but do you know whereyou are in the universe?
You are on Earth, and Earth orbits the Sun. But the Sun orbitssomething also and it interacts with other objects in the universe.The Sun is one star among billions of stars in a galaxy. A galaxy isa large group of stars, gas, and dust held together by gravity,shown in Figure 15. Our galaxy, called the Milky Way, contains400 billion stars, by most recent estimates, including the Sun.Countless other galaxies exist throughout the universe—an esti-mated 40 billion galaxies can be seen. Each of these galaxies con-tains the same elements, forces, and types of energy as our galaxy.There are three major types of galaxies: spiral, elliptical, andirregular.
Spiral Galaxies Take another look at Figure 15. Notice thatspiral galaxies have spiral arms that wind outward from thegalaxy’s center. These spiral arms are made up of bright stars,dust, and gas. Our neighbor, the Andromeda galaxy, is visible tothe unaided eye as a fuzzy patch in the constellation Andromeda.It is a normal spiral galaxy with its arms starting close to center.Barred spirals are another type of galaxy that have spiral armsextending from a large central bar of stars, dust, and gas thatpasses through the center, or hub, of the galaxy. Astronomers arenot certain whether the Milky Way is normal or barred spiral.
Galaxies and the Milky WayReading Guide
■ Explain that the same naturallaws that apply in the Milky WayGalaxy also apply in other galaxies.
■ Compare the three main typesof galaxies.
■ Describe the Milky Way galaxyand the Sun’s position in it.
The Milky Way galaxy is your galaxyand you can see part of it stretchingacross the evening sky.
Review Vocabularyellipse: oblong, closed curve
New Vocabulary
• galaxy
• Milky Way
• Local Group
Figure 15 Spiral galaxy 4414.Galaxies often are millions of light-years apart.Explain what is meant by a millionlight-years.
NASA

832 CHAPTER 26 Stars and Galaxies
Elliptical Galaxies Astronomers once thought that spiralgalaxies were the most common galaxies because they are rela-tively large and easy to see. But as observations of the universebecame more detailed, it became clear that most galaxies areelliptical galaxies, and most of these are dwarf galaxies. They arejust too small and dim to be easily seen.
These galaxies are shaped like large, three-dimensionalellipses. Many are football-shaped, but others are spherical asshown in Figure 16. These giant elliptical galaxies can be over9 million light-years across and contain trillions of stars.However, most dwarf ellipticals are only about 3,000 light-yearsacross and contain fewer than a million stars.
Irregular Galaxies Most galaxies that aren’t elliptical or spi-ral are considered irregular galaxies. They take many differentshapes and contain 100 million to 10 billion stars, making themlarger than dwarf ellipticals but smaller than spirals. Irregulargalaxies are less common than spirals or ellipticals.
Two irregular galaxies called the Clouds of Magellan orbit theMilky Way. One of these, known as the Large Magellanic Cloud,is shown in Figure 17. Several other dwarf galaxies also areaffected by the Milky Way’s gravity. One of these, the ellipticalSagittarius dwarf, is being absorbed by the Milky Way. This dwarfgalaxy lies about 60,000 light-years from the center of the MilkyWay on the opposite side of the galaxy from us and 20,000 light-years below the galactic plane.
The Local Group Just as stars are grouped together withingalaxies, galaxies are grouped into clusters. Clusters of galaxiesare even grouped into superclusters. Our Milky Way galaxybelongs to a cluster called the Local Group. It is a relatively smallcluster containing about 45 galaxies of various types and sizes,most of which are dwarf elliptical galaxies. The largest galaxy inthe Local Group is the Andromeda galaxy, a spiral galaxy a little
larger than ours that lies about2.6 million light-years away. If theAndromeda galaxy and the MilkyWay galaxy continue to travelthrough space as they are, they maycollide in the distant future.
Figure 16 In ultraviolet light,this elliptical galaxy reveals a core of thousands of old, helium-burning stars.Identify the most common type ofgalaxies in the universe.
Figure 17 The irregular structure ofthe Large Magellanic Cloud might havebeen produced by interactions with theMilky Way galaxy.
(t)NASA, (b)JPL/NASA

SECTION 3 Galaxies and the Milky Way 833
How do galaxies form?Astronomers aren’t sure how galaxies originally formed. It is
thought that fluctuations in density of primordial matter in theuniverse began to form blobs of gas that would eventually forminto galaxies. These blobs might have had masses equivalent tothe mass of the dwarf galaxies. In fact, one idea is that the dwarfgalaxies may be remnants of these earlier blobs of matter.
Most astronomers now believe that the galaxies we see closerto us grew by absorbing or merging with other smaller objects.One bit of evidence that supports this idea is that more distantgalaxies tend to be much smaller than those closer to the MilkyWay. It makes sense to conclude that these smaller galaxies thatexisted long ago merged to make the larger, more organizedgalaxies of the universe today. Also, we have evidence that galax-ies do collide.
Colliding Galaxies In some galaxy clusters, the galaxies areconcentrated very close together. In the Virgo Cluster, for exam-ple, thousands of galaxies orbit within 10 million light-years ofeach other. Do these galaxies collide? If so, what happens tothem and to the stars within them? It seems that little happensto the individual stars within the galaxies. There is so muchopen space between the stars that the individual stars of the twogalaxies just move past each other.
What happens to individual stars in collidinggalaxies?
However, galaxy collisions have astrong effect on the overall structureand shape of the colliding galaxies.They may lose all of their spiral shape,if they had any.
It is thought that the two galaxiesshown in Figure 18 will eventuallycollide. The smaller galaxy on theright does not seem to have enoughenergy to escape the larger one to theleft. When galaxies interact by passingclose to each other or by colliding,there is a burst of star formation ineach. Their interstellar gas and dustclouds are shocked and squeezed,leading to star formation. This can bedetected by the blue light emitted byyoung, hot stars.
Figure 18 In about a billionyears, these two galaxies willmerge. Much of their spiral struc-tures probably will be lost.
NASA

834 CHAPTER 26
The Milky WayRecall that the Milky Way galaxy contains about 400 billion
stars, including our Sun. The Sun makes one complete orbitaround the center of the Milky Way in about 225 million years,traveling at a speed of 220 km/s. This means that since it formed,the Sun has made a little over 22 orbits of the Milky Way.
The Milky Way is usually classified as a normal spiral galaxy.However, recent evidence suggests that it might be a barred spi-ral. It is difficult to know for sure because astronomers can neversee our galaxy from the outside. You can’t see the normal spiralor barred shape of the Milky Way because the Sun and Earth arelocated within one of its spiral arms. However, you can see theMilky Way stretching across the sky as a faint band of light. All ofthe stars you can see belong to the Milky Way galaxy.
What type of galaxy is the Milky Way?
Evidence indicates that the Milky Way, like many galaxies,grows by absorbing other galaxies. It has been gobbling up theSagittarius dwarf elliptical galaxy for 2 billion years. If we couldsee infrared light, we could see stars and other material from thisgalaxy becoming part of our section of the Milky Way, as shownin Figure 19. Eventually, the Milky Way probably will absorb bothClouds of Magellan and several other dwarf galaxies.
Structure of the Milky Way The Milky Way galaxy, shownin Figure 20, measures about 100,000 light-years from one sideto the other. The Sun lies about 26,000 light-years from the galac-tic center on the edge of one of the spiral arms. The Milky Way’sdisk is about 1,000 light-years thick—it would take 1,000 years totravel from top to bottom even at the speed of light. The centralbulge of the Milky Way is about 10,000 light-years in diameter.
Figure 19 The swirls of redseen in this model are stars in theremnants of the Sagittarius dwarfelliptical galaxy.
Topic: The Milky WayGalaxyVisit for Weblinks to information about theMilky Way galaxy.
Activity Draw a model of theMilky Way galaxy showing itspossible barred structure. Includethe approximate location of theSun and information about theSagittarius dwarf galaxy.
gpescience.com
Figure 20 Star density isgreatest near the center of theMilky Way, with over 1,400 starsin every cubic light-year of space.The Sun is located about halfwayout on the Orion arm of the MilkyWay galaxy.Explain what is meant by a cubiclight-year.
Sun
Myron Jay Dorf/CORBIS

SECTION 3 Galaxies and the Milky Way 835
Self Check1. Compare and contrast the Milky Way galaxy to other
galaxies in the universe.
2. Describe the three main types of galaxies.
3. Draw the overall structure of the Milky Way galaxy andindicate where the Sun is located.
4. Describe the most common type of galaxy.
5. Think Critically How might the Sun be affected if theAndromeda galaxy and the Milky Way galaxy collide.
SummaryGalaxies
• A galaxy is a large group of stars, gas, anddust held together by gravity.
• The three main types of galaxies are elliptical,irregular, and spiral.
How do galaxies form?
• Astronomers believe that galaxies form byabsorbing or merging with smaller objects.
• Young, hot stars form when galaxies collide,but individual stars within each galaxy are notaffected much.
The Milky Way Galaxy
• The Milky Way galaxy contains about 400 billion stars and has a spiral shape.
• The Milky Way galaxy is about 100,000 light-years across and the Sun lies about 26,000light-years from its center.
• Supermassive black holes are thought to existin the centers of galaxies.
6. Use Numbers Assume there are 400 billion stars in theMilky Way galaxy, plus or minus 200 billion. Based onthis estimate, what is the range of the number of starsthat might exist in the Milky Way?
7. Use Percentages A dwarf elliptical galaxy has fewerthan 1 million stars and a small irregular galaxy con-tains 100 million stars. What percent of the number ofstars found in a small irregular galaxy are found in adwarf elliptical galaxy?
Spiral Arms The arms of a spiral galaxy look like pinwheelsthat begin near the galactic center and extend outward throughthe disk of the galaxy. These spiral arms contain both young starsand prestellar material, such as glowing nebulae. Young open starclusters are present too. This is the part of a spiral galaxy wherestars are forming. Astronomers do not yet fully understand whatcauses the spiral structure to form. They speculate that it mightbe caused by instabilities in the gas near the galactic bulge orgravitational effects of other galaxies that are or were nearby, ormight be just an extension of the shape of the galactic bulge,itself. They just don’t know.
Galaxy Center What strange objects lurk in the very densepopulation of stars at a galaxy’s core? Recent theories suggest thatextremely massive black holes might exist at the cores of galaxies.The problem is that this part of a galaxy is hidden from view bymaterial that exists in between the densely packed stars. The totalenergy emitted from an object called Sgr A* (saj-ay-star), locatedin the nucleus of the Milky Way, is equivalent to the energy thatwould be emitted by a million suns. The leading theory aboutthis object, shown in Figure 21, is that it is a supermassive blackhole, containing the mass of 3 million suns.
More Section Review gpescience.com
Figure 21 This bright radiosource captured by the VLA is indi-rect evidence of a black hole at thecenter of our galaxy.
National Center for Supercomputing Applications

Figure 22 This mapproduced by the WMAPteam has been called a“baby picture” of theuniverse. It is ovalbecause it is a projection,just as maps of Earth canbe projected as ovals.Infer why this map iscalled a “baby picture” ofthe universe.
836 CHAPTER 26 Stars and Galaxies
How did it begin?The study of the universe—how it began, how it evolves, and
what it is made of—is known as cosmology. Several models ofthe origin and evolution of the universe have been proposed.
One model, proposed in 1948, is called the steady state the-ory. In this theory, the universe has always existed and it alwayswill. As the universe expands, new matter is created. The densityof the universe remains the same or in steady state.
A second idea is called the oscillating model. In this model,the universe expanded rapidly, then slowed, and eventually con-tracted. This oscillating process continues back and forththrough time. Some scientists currently believe that enoughmatter exists to cause the universe to eventually contract.
CosmologyReading Guide
■ Describe the most acceptedtheory about the origin of theuniverse.
■ Define dark matter.■ Explain how dark energy may
cause the universe to expandforever.
Conditions that existed when theuniverse began led to the formationof galaxies like the Milky Way.
Review Vocabularyuniverse: the space that contains allknown matter and energy
New Vocabulary
• cosmology
• big bang theory
• dark matter
• dark energy
NASA

SECTION 4 Cosmology 837
The Big Bang TheoryThe most accepted theory of how the universe formed is
the big bang theory. It states that the universe started with a bigbang, or explosion, and has been expanding ever since. The bigbang is not like an explosion of matter into empty space; it is therapid expansion of space itself.
When did it begin? A NASA-related mission, called theWilkinson Microwave Anisotropy Probe (WMAP), produced amap of the oldest light in the universe. Based on the map, shownin Figure 22, and other data, the WMAP team proposed a morespecific age of the universe. Their findings indicate that the uni-verse began about 13.7 billion years ago with a big bang. Theteam believes its data are correct within a one percent margin oferror. They measured temperature variations over the entire uni-verse found in the cosmic microwave background radiation. Thisradiation is thought to have been produced about 400,000 yearsafter the big bang when temperatures became low enough foratoms to form. Bright areas of the map are thought to indicateplaces that collapsed, forming the galaxies that we see today.
When did the universe begin?
Expansion of the UniverseThe motion of stars within the Milky Way can be detected by
using the Doppler effect. For example, sound waves from a mov-ing source are compressed as the object approaches andstretched as it recedes. Doppler shifts occur in light as well assound. If a star approaches Earth, its wavelengths of light arecompressed, causing a blue shift. If a star moves away, its wave-lengths are stretched, causing a red shift. Using the Dopplershift, scientists found that some galaxies in the Local Group aremoving toward, some are moving away, and others are movingwith the Milky Way. A red shift is also seen inthe light from distant galaxies, but this isexplained differently.
Science as LiteratureMany famous scientistshave written about sci-ence for the general pub-lic. Among them arephysicists Albert Einsteinand George Gamow.More recently, physicistStephen Hawking wrote“A Brief History of Time,”which describes currenttheories of how the uni-verse began. Researchthe work of StevenHawking and his contri-butions to cosmology andwrite a brief biography.
Figure 23 The observer on the right experiencesa blue shift as wavelengths of light emitted by anapproaching object are compressed. The observeron the left experiences a red shift as wavelengthsare stretched.
Red shift Blue shift
Wavelengthappears longer.
Wavelengthappears shorter.
Bulb moves from 1 to 4
3
4
1
2
3 4411 2

838 CHAPTER 26 Stars and Galaxies
Hubble Red Shift The Doppler shift does not explain theshift in wavelength of light coming from distant galaxies. Thisshift is known as the Hubble red shift. It is caused by the stretch-ing of space itself as the universe expands. Light waves travelingthrough space lengthen as space expands. The fact that this redshift is seen in the light from all galaxies outside the Local Groupindicates that the entire universe is expanding.
What is the universe made of?The way in which galaxies like the Milky Way rotate and
move should depend on the amounts of mass they contain. Theproblem is that if only the visible or otherwise detectable mass(called regular matter) is counted, the Milky Way and othergalaxies shouldn’t be rotating, moving, and interacting withother galaxies the way they are. It appears that regular mattermakes up only a very small amount of the known universe.Much of the mass that must be present cannot be seen.However, its effect on other galaxies can be seen, shown inFigure 24. This unseen and little-understood matter that affectsgalaxies has been named dark matter.
Which type of matter is considered to make upthe least amount of the universe?
Figure 24 This Hubble viewlooks deep into space and timewhen the universe was morechaotic and oddly shaped galaxieswere common. Dark matter mighthave influenced galaxies to takethe classic spiral and ellipticalforms we see today.
NASA/ESA/S. Beckwith (STScI) and the HUDF Team

SECTION 4 Cosmology 839
Self Check1. Define cosmology.
2. Describe the big bang theory.
3. Explain how the expansion of space could cause a redshift in the light from distant galaxies.
4. Describe the Doppler effect.
5. Think Critically How could the presence of somerepulsing force cause the universe to expand forever?
SummaryHow did it begin?
• Cosmology is the study of how the universebegan and evolves.
• The big bang theory is the most acceptedtheory about the beginning of the universe.
• The universe is estimated to be 13.7 billionyears old.
Expansion of the Universe
• The Doppler effect indicates whether stars arecoming toward Earth or moving away.
• The Hubble red shift is caused by the expan-sion of space and the entire universe.
What is the universe made of?
• The universe might contain dark matter anddark energy.
6. Use Percentages The currently accepted age of theuniverse is 13.7 billion years plus or minus one percent.How much time does this one percent represent?
7. Use Percentages What percent of the universe’sage is the first 400,000 years?
Dark Matter Although scien-tists are uncertain about whatdark matter is, the concept helpsthem explain how the universemay have formed. Temperaturevariations, as shown on theWMAP map, could have ledto density fluctuations in theearly universe. As the universeexpanded, gravity from darkmatter pulled matter together inregions with higher density.Galaxies could have formed inthe denser regions and voidscould have formed elsewhere. This structure is seen whensections of the universe are mapped, as shown in Figure 25.
Dark Energy Data indicate that the expansion of the universeis accelerating. Explaining this acceleration is difficult. Onehypothesis is that a form of energy, called dark energy, might becausing the acceleration. When matter was closer together in theearly universe, gravity could easily overcome expansion causedby dark energy. Now, with matter farther apart, gravity is insuf-ficient to overcome it and expansion accelerates. This does notmean, however, that dark energy is related to dark matter.
More Section Review gpescience.com
Figure 25 These maps of sec-tions of the universe show areasdensely populated with galaxiesand other areas almost empty.Identify What are the almost-empty areas called?
The 2dF Galaxy Redshift Survey team

Model and InventModel and Invent
840 CHAPTER 26 Stars and Galaxies
Real-World ProblemYou have read that the universe is expanding. In fact, recent calcula-tions indicate that it is expanding more quickly now than it did in thepast. Astronomers are able to measure this expansion because itstretches the wavelengths of light coming from distant objects. Canyou make a model that demonstrates how this happens?
Make a Model1. Work in teams of two or more. Collect all needed materials.
2. Sketch an image on the balloon slightly inflated. Model the posi-tions of galaxy clusters by placing three or four dots at four differ-ent locations and different distances apart on the surface of theballoon. Mark the locations R (for reference), A, B, and C.
3. Make a table for data.
4. Check to see if the binder clip can hold air in the balloon longenough for you to make measurements and to draw on the balloon.
5. Obtain your teacher’s approval of your sketches and data tablebefore proceeding.
Test Your Model1. Slightly inflate your balloon so that it is not very big.
2. Use the binder clip to temporarily seal the balloon (or have yourpartner hold it closed). Do not tie it.
3. Measure the distance from your reference galaxy cluster (R) toeach of the other galaxy clusters and record these distances onyour data table.
Goals■ Model the stretching
of the wavelengths oflight caused by theexpansion of theuniverse.
■ Measure the amountof wavelength length-ening produced in themodel.
■ Measure increases indistances betweengalaxy clusters causedby the expansion of themodel.
Possible Materialsround balloonpermanent marker (black
or dark blue)medium-sized binder clip
(3 cm)
Safety Precautions
Expansi$n of the Universe
Data
Location
First Distance Second Distance Change in First � Second � Change in Measurement Measurement Distance Measurement Measurement �
A
B
C

4. Draw a wavy line from your reference galaxy cluster to each of the othergalaxy clusters marked to represent the wavelength (�) of light coming fromeach galaxy cluster. Measure and record the wavelength of each wavy line.
5. Inflate your balloon farther (be careful not to inflate it too much). Replace thebinder clip or tie the end shut.
6. Measure and record the distances from your reference galaxy cluster to each ofthe other galaxy clusters.
7. Measure and record the wavelength of each wavy line on your inflated model.
Analyze Your Data1. Calculate the change in distance and the change in wavelength for each galaxy
cluster and record it on your data table.
2. Analyze whether objects moved on your model or whether your entire modelexpanded.
Conclude and Apply1. Explain any changes in distance or wavelength noted.
2. Conclude whether the objects moved apartbecause of their individual motions or becausethe model expanded.
3. Infer how measurements on your model canbe related to measurements of the universe.
LAB 841
Enter the data from your model on a tablethat shows the data from all teams ofstudents.

StarsSara Teasdale
Alone in the night
On a dark hill
With pines around me
Spicy and still,
And a heaven full of stars
Over my head,
White and topaz
And misty red;
Myriads with beating
Hearts of fire
That aeons
Cannot vex or tire;
Up the dome of heaven
Like a great hill,
I watch them marching
Stately and still,
And I know that I
Am honored to be
Witness
Of so much majesty.
Respond to the Reading1. How does the author use personification
to make the stars in the poem seem alive?2. Tone refers to the overall mood of a liter-
ary work. Describe the tone of this poem.3. Linking Science and Writing The poet
refers to the color, age, energy source,and apparent movement of stars.Writea paragraph relating what you havelearned about these properties to howthey are mentioned in the poem.
On a clear, darknight, it is possible to
see as many as 1,500 stars with the unaidedeye.However, this number is far lower becauseof light pollution. Light from houses, shoppingareas, signs, and street lights floods the sky,making it difficult to see the stars. Insidemajor cities, fewer than 50 stars may be visi-ble in the night sky.
UnderstandingLiteratureImagery Imagery refers to how a literarywork invites the reader to see, hear, smell,touch, or taste something in his mind.Authors often use related images through-out a work, encouraging the reader to con-sider the subject using more than onesense.Of what specific senses does this poetmake the reader aware?
842 CHAPTER 26 Stars and Galaxies(l)Jim Ballard/Getty Images, (r)E.O. Hoppé/CORBIS

CHAPTER STUDY GUIDE 843
Use the Foldable that you made at the begin-ning of this chapter to help you review what you learnedabout cosmology.
Observing the Universe
1. Constellations are patterns of stars thatresemble things familiar to the observer.
2. Optical telescopes collect visible light andmagnify viewed objects.
3. A refracting telescope uses lenses to collectlight and magnify the image, and a reflect-ing telescope uses a mirror to collect lightand a lens to magnify the image.
4. A radio telescope collects and amplifiesradio waves.
Evolution of Stars
1. Stars form from a large cloud of gas, ice,and dust, called a nebula like the one shown here. When the temperature inside the contracting nebula reaches 10 million K,fusion begins, and a star is born.
2. Stars are classified as main sequencestars, giants, and white dwarfs on the H-Rdiagram.
3. When a star reaches stellar equilibrium itis considered a main sequence star. When thehydrogen fuel is depleted, a star loses equilib-rium and evolves into a giant or supergiant.
4. After losing its outer layers, a giant becomesa white dwarf. A supergiant can evolve intoa neutron star or a black hole.
5. The Sun’s energy is produced at its core bynuclear fusion.
Galaxies and theMilky Way
1. A galaxy is a large group of stars, gas,and dust held together by gravity. The Local Group of galaxies is a cluster that contains the Milky Way Galaxy.
2. The three main types of galaxies areelliptical, irregular, and spiral as shownhere.
3. Astronomers believe that galaxies form byabsorbing or merging with smaller objects.They continue to evolve by colliding ormerging with other galaxies.
4. The Milky Way galaxy is about 100,000light-years across and the Sun lies about26,000 light-years from its center.
Cosmology
1. The big bang theory is the most acceptedtheory of how the universe began.
2. The universe is 13.7 billion years old andappears to be expanding faster now than inthe past.
3. The Hubble red shift is caused by theexpansion of space, not the movement ofgalaxies.
Interactive Tutor gpescience.com(l)NASA, (r)JPL/NASA

Match the correct vocabulary word(s) with eachdefinition given below.
1. patterns of stars
2. an optical telescope that uses a mirror tocollect light
3. the distance light travels in one year
4. plotted from the upper left to the lowerright on the H-R diagram
5. star in which the core contracts and outerlayers expand and cool
6. layer of the Sun from which light is emitted
7. dark, cooler areas on the Sun’s photosphere
8. large group of stars, gas, and dust heldtogether by gravity
9. spiral galaxy that contains the solar system
10. study of the evolution of the universe
Choose the word or phrase that best answers thequestion.
11. Which telescope uses lenses to collect lightand form an image?A) adaptive C) reflectingB) radio D) refracting
12. Which form of energy are optical tele-scopes used to study?A) infrared radiationB) radio wavesC) visible lightD) X rays
13. Which magnifies the image in a telescope?A) eyepiece C) focusB) focal length D) objective
14. Which is the most common type of star inthe universe?A) giant C) red dwarfB) neutron D) white dwarf
15. Which forms from a star that is over 25times the mass of the Sun?A) black hole C) neutron starB) giant star D) white dwarf
16. Which is a feature of the Sun that canreach 100 million K?A) CME C) prominenceB) flare D) sunspot
Use the illustration below to answer question 17.
17. Which type of galaxy is most common?A) barred spiralB) dwarf ellipticalC) irregularD) spiral
18. Which is the most accepted theory of howthe universe formed?A) big bang C) oscillatingB) collision D) steady state
844 CHAPTER REVIEW
big bang theory p. 837constellation p. 818cosmology p. 836dark energy p. 839dark matter p. 838galaxy p. 831giant p. 825light-year p. 821Local Group p. 832main sequence p. 823
Milky Way p. 831photosphere p. 827radio telescope p. 821reflecting telescope p. 820refracting telescope p. 819solar mass p. 827spectroscope p. 822sunspots p. 828white dwarf p. 825
Vocabulary PuzzleMaker gpescience.comNASA

CHAPTER REVIEW 845
19. Which adds to the gravity of a galaxy, butcannot be seen or detected?A) dark energyB) dark matterC) regular energyD) regular matter
20. Make a table summarizing the absolutebrightness (magnitude) and temperaturesof stars on this H-R diagram.
21. Draw and label scale models of the followingstars: the Sun; Antares, 500 times largerthan the Sun; and Sirius B 0.01 times theSun’s diameter.
22. Draw and label a concept map showing thelife history of a star like the Sun.
23. Draw and label the parts in a reflectingtelescope.
24. Explain how energy created in the core ofthe Sun is eventually emitted from thephotosphere.
25. Compare and contrast elliptical, irregular, andspiral galaxies.
26. Discuss the benefits of using a radio telescope.
27. Explain why high sunspot activity on theSun can affect Earth’s magnetic field.
28. Explain how the Sun’s position in the MilkyWay affects how we perceive our galaxy.
Lum
inos
ity
( L )
1,000,000 L
25,000 10,000 6,000 3,000
10,000 L
100 L
1100
L
L
110,000
L
Supergiants
Giants
Main sequence
Sun
White dwarfs
O B A F G K M
Temperature (K)
Hertzsprung-Russell Diagram for Stars
Interpreting Graphics
29. Solve One-Step Equations Use the equationMp � fo/fe, to determine the magnify-ing power of a telescope in which thefocal lengths of the objective and eye-piece are 1500 mm and 9 mm,respectively.
Use the illustration below to answer question 30.
30. A solar storm that took place in 1859 iscalled “the perfect storm,” because of itsgreat power. The diagram shows therelative destructive power of some solarstorms. Using this diagram, calculateapproximately how much moredestructive was the solar storm of 1859than the one of 1989.
31. Calculate how long ago the light we seetoday left a star that is 25 light-yearsaway. Calculate the distance in km tothat star.
1989storm
1859storm
Severestorm
500 1,000 1,500 2,000
1,760
589
300
Relative Power of Solar Storms
nano-Teslas
More Chapter Review gpescience.com

1. What is used as an objective in a reflectingtelescope?
A. antenna
B. camera
C. lens
D. mirror
Use the photo below to answer question 2.
2. Which type of telescope is shown?
A. optical
B. radio
C. ultraviolet
D. X-ray
3. Which group contains most stars on the H-R diagram ?
A. giant
B. main sequence
C. supergiant
D. white dwarf
4. Which stage of stellar evolution occurswhen the outer layers escape, leavingbehind the hot core?
A. black hole
B. giant
C. main sequence
D. white dwarf
Use the illustration below to answer question 5.
5. What occurs inside a main sequence star?
A. Energy from fusion exceeds gravity.
B. Fusion shuts down.
C. Gravity exceeds energy from fusion.
D. It attains stellar equilibrium.
846 STANDARDIZED TEST PRACTICE
Concentrate Stay focused during the test and don’t rush, evenif you notice that other students are finishing the test early.
Record your answers on the answer sheet provided by your teacher or on a sheet of paper.
NASA

STANDARDIZED TEST PRACTICE 847
6. Which may be responsible for the acceler-ating expansion of the universe?
A. dark energy
B. dark matter
C. regular energy
D. regular matter
7. If the focal length of a telescope objectiveis 2,400 mm and the focal length of theeyepiece is 20 mm, what is the magnifyingpower of the telescope?
8. Use this equation, A = �r2. What is thearea in square meters of one of the four8.2-meter reflectors in the Very LargeTelescope?
Use the illustration below to answer question 9.
9. Describe the structure of the Sun’s interior.
10. What does a spectroscope do to starlightthat enables astronomers to determine thestar’s composition?
11. What does the H-R diagram show aboutthe stars plotted on it?
12. What are coronal mass ejections?
13. What is the Local Group?
14. How do astronomers think that galaxieslike the Milky Way formed?
15. What is cosmology?
16. Why have astronomers proposed the exis-tence of dark energy in the universe?
Use the photo below to help answer question 17.
17. PART A What are the evolutionary stages ofa star like the Sun?
PART B What are the evolutionary stages ofa star more than eight times themass of the Sun?
Convection zoneRadiation zone
Core
Standardized Test Practice gpescience.comDavid A. Hardy/Photo Researchers