Star Conference London October 5, 2010 - eems.it · 05 Oct 10 3 Group Structure EEMS Italia S.p.A....
31
Star Conference London October 5, 2010
Transcript of Star Conference London October 5, 2010 - eems.it · 05 Oct 10 3 Group Structure EEMS Italia S.p.A....

Star Conference
London
October 5, 2010

EEMS Key Notes
Not only semiconductor, but ……..
A fast growing Photovoltaic business
Fully recovered from loss of Qimonda
With a much stronger financial position
Back on fast growing track
Moving for leadership in PV

05 Oct 103
Group Structure
EEMS Italia S.p.A.
EEMS TechnologySuzhou Co Ltd.
(China)
EEMS Singapore Pte. Ltd
(Singapore)Solsonica S.p.A.
EEMS Asia EEMS Asia PtePte. Ltd. Ltd
(Singapore)(Singapore)
EEMS China Pte. Ltd.(Singapore)
100%
100%
100%
100% 100%
100%
Listed Co Semiconductor Photovoltaic Dormient Holding
EEMS SuzhouCo. Ltd.(China)

05 Oct 104
Shareholders
Mutti family
D’Antonio *
Management *
Market
Total
9.208.316
2.950.975
709.828
30.728.001
43.597.120
21.1
6.8
1.6
70.5
100.0
Nbr of shares %
* Mr. D’Antonio and others have exercised their warrants
option for a total of 1.094.275 shares and injecting in the
Company a total consideration of 1.356.901 €

5 Oct 105
• Anticipated the opportunities in the Photovoltaic business sometime in 2007
• Shut down the semiconductor operations in Italy in 2008 to improve our overall competitiveness
• Consolidated all our semiconductor business in our existing operations in China
• Invested about 50 M€ for our start up in the Photovoltaic business
• Won a major contract to supply Dram back end services to Qimonda
• Invested in China specifically for Qimonda and started to ramp to volume
• Qimonda became insolvent as a company in early 2009 and went outof business
• We became financially stressed by lack of planned cash flow to be generated in China by the Qimonda business
Lots of changes in the past two years

5 Oct 106
What did we do
• Started our negotiations with Bank Pool to restructure the debt
• Successfully acquired more Dram volume from an existing customer
• Successfully completed our debt restructuring in early 2010
• Managed to sell out our non Dram test operation in Singapore
• The proceeds were used to pay off about 36 % of the 74 M€ debt with Bank Pool
• As result, we are approaching a more affordable NFP of slightly above 40 M€
• In the mean time we did develop substantial Photovoltaic business and properly positioned our Solsonica brand

5 Oct 107
The two legs strategy - Executed
EEMS Italia S.p.A.
EEMS AsiaSemiconductors
SolsonicaPhotovoltaic
Revenues in US $ currency
High Capex
Moderate growth
Fully integrated
One of few
Revenues in € currency
Low Capex
Very high growth
Partially integrated
One of many

05 Oct 108
Business and Factories
EEMS Italia S.p.A.
EEMS AsiaSemiconductors
SolsonicaPhotovoltaic
FreeZone
23,000 SQM1179 People
Dram-Dimm
No FreeZone
43,000 SQM339 People
Dram
Headquarter
23,000 SQM269 People
Cells & Modules
EEMS Suzhou EEMS Tech Solsonica

05 Oct 109
Semiconductor

5 Oct 1010
Eems China – Financial Performance – M$
0
20
40
60
80
100
120
140
2005 2006 2007 2008 2009 1H10
M$
Revenues Ebitda
Revenues
Ebitda
Ebitda %
4.6 70
30
43
111
42
38
123
46
38
90
24
27
63
17
28
Source : Company data

5 Oct 1011
Eems China - Financials – M$
1H09 1H10 2Q09 2Q10 1Q10 2Q10
31.7 63.5 16.4 34.0 29.5 34.0
100% 107% 15%
1H09 1H10 2Q09 2Q10 1Q10 2Q10
6.3 17.5 3.3 8.9 8.6 8.9
178% 170% 3%
Ebitda Ebitda Ebitda
Yr on Yr Qtr on Qtr Sequential
Yr on Yr Qtr on Qtr Sequential
Revenues Revenues Revenues

5 Oct 1012
Dram – Market evolution – Value & Volume
0
5
10
15
20
25
30
35
40
2004 2005 2006 2007 2008 2009 2010 2011 2012 2013 2014
B$
0
5
10
15
20
25
30
35
2004 2005 2006 2007 2008 2009 2010 2011 2012 2013 2014
BU
- 28 19 50 18 -1 26 12 27 19 3
High volatility
Significant swings
No substantial growth
Continuous growth
Year on year > 20%
Need for 14BU capacity in
2014
(*) Our Suzhou factory has a capacity for about 300 MU/Yr
Market Value – B$ Market Volume - BU
Source : Gartner 2010

5 Oct 1013
Dram – EEMS China Versus Market - History
0
5
10
15
20
25
30
35
40
2005 2006 2007 2008 2009
B$
0
2
4
6
8
10
12
14
16
2005 2006 2007 2008 2009
BU
0
20
40
60
80
100
120
140
2005 2006 2007 2008 2009
M$
0
50
100
150
200
250
300
350
2005 2006 2007 2008 2009
MU
Market Value
EEMS China Revenues EEMS China Volume
Market Volume
Sometime anti cyclical
Following and exceeding market volume
2009 affected by Qimonda default
Source : Gartner 2010 and Company data

5 Oct 1014
Dram – Market Share – B Units
2008 2009 2010 2011 Rank 2010
Elite B Units 0.2 0.2 0.2 0.2
Elpida B Units 2.1 2.4 3.1 3.9 3
Etron B Units 0.2 0.2 0.2 0.2
Hynix B Units 3.1 3.3 4.0 4.5 2
Iss B Units 0.1 0.1 0.1 0.2
Micron B Units 1.0 1.4 2.0 2.3 4
Nanya B Units 0.7 0.8 0.9 1.1 5
Oki B Units 0.1 0.1 0.0 0.0
Powerchip B Units 0.6 0.4 0.8 1.1 6
Promos B Units 0.9 0.4 0.4 0.3
Qimonda B Units 1.5 0.1 0.0 0.0
Samsung B Units 3.3 3.8 5.1 6.0 1
Toshiba B Units 0.0 0.0 0.0 0.0
Winbond B Units 0.2 0.5 0.6 0.5
All Others B Units 0.2 0.2 0.2 0.2
Totale B Units 14.2 14.0 17.6 20.6 15.9 Top 6
90.3%
Source : Gartner 2010
Our current customers

5 Oct 1015
Dram – Top 6 Dram manufacturers by volume – Who is outsourcing ?
♦ Samsung
♦ Hynix
♦ Elpida
♦ Micron
♦ Nanya
♦ Powerchip
Total
EEMS estimated volume
EEMS estimated penetration %
1
2
3
4
5
6
5.1
4.0
3.1
2.0
.9
.8
15.9
.3
1.9
Rank BU
Estimated% Outsourcing
-
1.1
3.1
.5
.9
.8
6.4
.3
4.7
BU
Outsourced
In house
Captive subcontractors network
Source : Gartner 2010 and Company estimates
5 Oct 1016
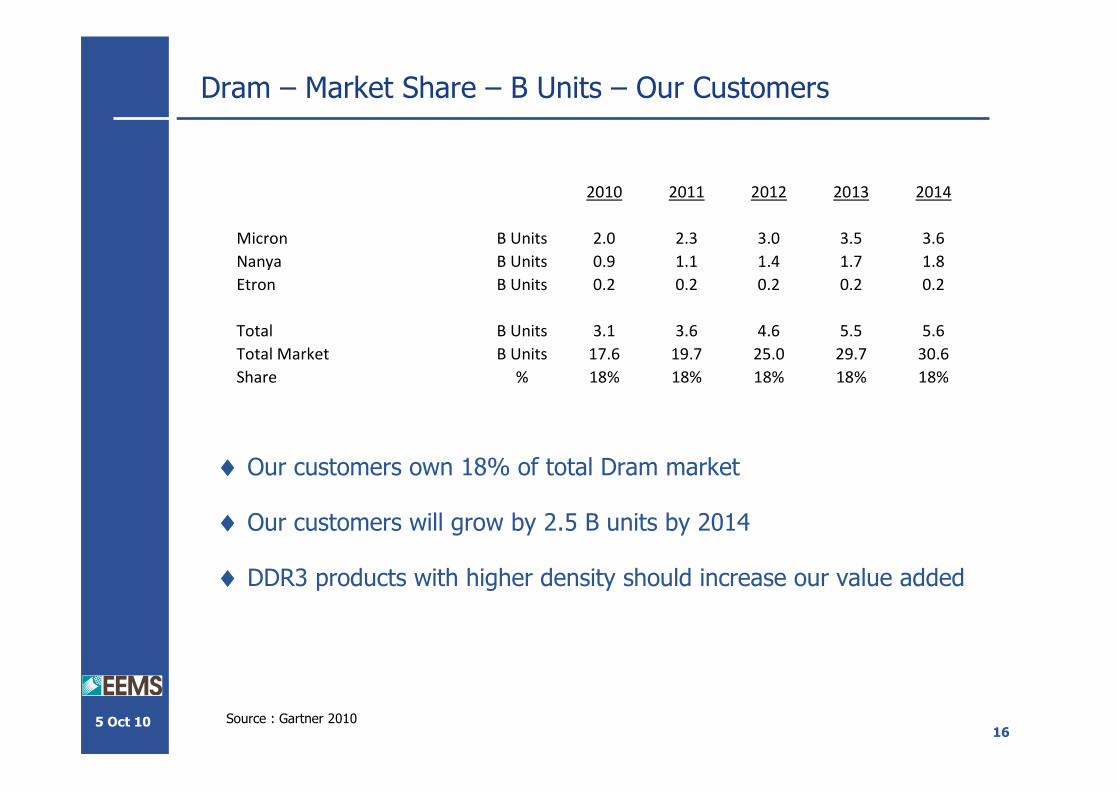
Dram – Market Share – B Units – Our Customers
Source : Gartner 2010
♦ Our customers own 18% of total Dram market
♦ Our customers will grow by 2.5 B units by 2014
♦ DDR3 products with higher density should increase our value added
2010 2011 2012 2013 2014
Micron B Units 2.0 2.3 3.0 3.5 3.6
Nanya B Units 0.9 1.1 1.4 1.7 1.8
Etron B Units 0.2 0.2 0.2 0.2 0.2
Total B Units 3.1 3.6 4.6 5.5 5.6
Total Market B Units 17.6 19.7 25.0 29.7 30.6
Share % 18% 18% 18% 18% 18%

5 Oct 1017
Dram – Market Share – B Units – Additional Potential Opportunities
♦ Two key Dram players make 40% of market
♦ Elpida is said to be planning a new wafer fab close to EEMS factories in China
♦ Hynix has already a wafer fab near by the EEMS factories and is considering to grow its outsourcing
Source : Gartner 2010
2010 2011 2012 2013 2014
Elpida B Units 3.1 3.9 5.0 5.9 6.1
Hynix B Units 4.0 4.5 5.8 6.8 7.0
Total B Units 7.0 8.5 10.8 12.8 13.2
Total Market B Units 17.6 19.7 25.0 29.7 30.6
Share % 40% 43% 43% 43% 43%

5 Oct 1018
Dram Business - Summary
Dram volume continuously and significantly growing
EEMS well positioned logistically in China
State of the art technology available
Already fully operational on DDR3 technology
Opportunity to increase capacity on marginal Capex
Generating Ebitda margin from 25% to 35%

5 Oct 1019
Photovoltaic

5 Oct 1020
BoomingBooming marketmarket
From Semiconductor to PV in Italy - Natural development
IndustrialIndustrial strenghtstrenght
♦ Strong industrial background
♦ Used to face high tech challenges
♦ Well established “silicon culture”
♦ Leveraging on EEMS existing assets
♦ Building on an educated work force
♦ Sky-rocketing demand
♦ High sun hours
♦ Increasing green awareness
♦ PV prices close to Grid parity
♦ Best feed in tariff in Europe

5 Oct 1021
PV business – Italian PV market: Trend
Cumulated PV power(MW)
# PVinstallations
Note: Data from GSE report
So far a fast growing market …
30,3687,678 63,742 ~130,000
Tot Power1,600 MW@ Sept 2010
Tot Installations100,200@ Sept 2010
408
1,057
2,200
80
2007 2008 2009 2010

5 Oct 1022
PV business – Italian PV market - Forecast
Cumulated PV power(MW)
Note: Estimates from EPIA
3,300
4,500
6,000
2,200
2010 2011 2012 2013
♦ The second worldwide PV market
♦ Among the most sunniest European Countries
♦ Among the first Countries to reach grid parity
… expected to grow even in the future

5 Oct 1023
PV business – Italian PV market - New opportunities
Note: Data from GSE Report
In addition:
♦ 56 Millions population
♦ 20 Millions houses
♦ 2 Millions firms
Rooftop installations
Total Available Market
100 GW (estimate)
… with a major opportunity in rooftop installations for residential and small business
Share of PVinstallations
5 Oct 1024
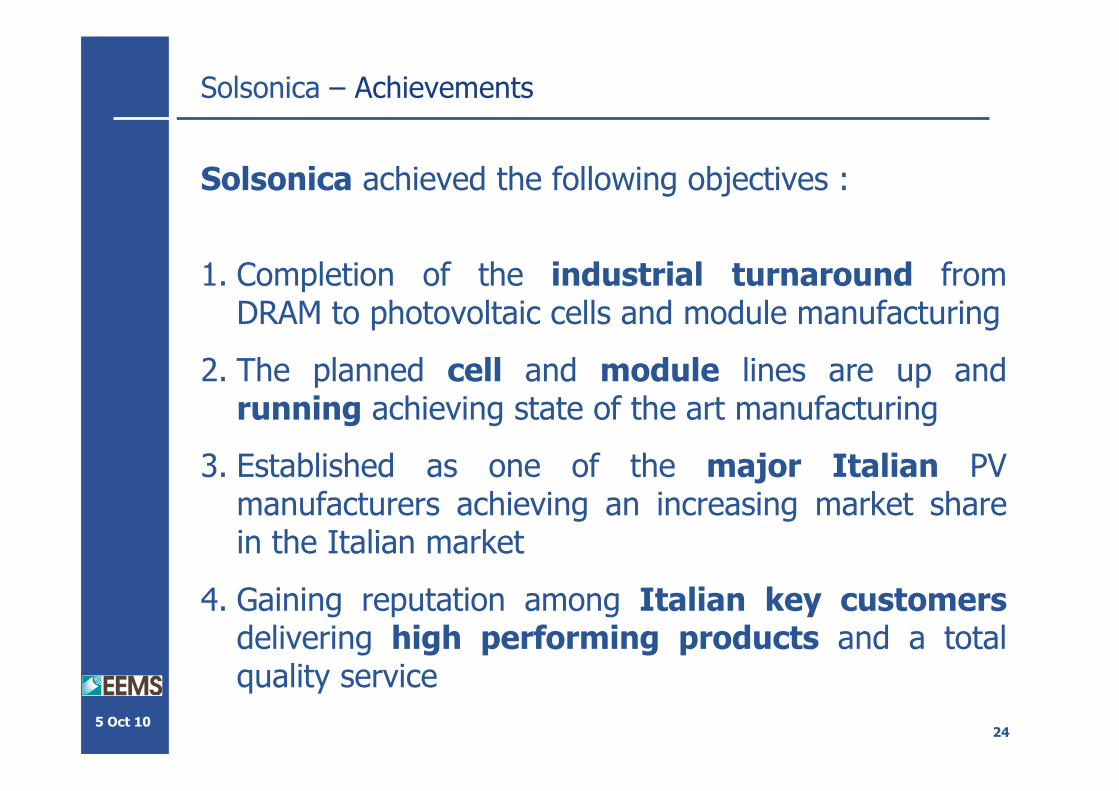
Solsonica – Achievements
Solsonica achieved the following objectives :
1. Completion of the industrial turnaround from DRAM to photovoltaic cells and module manufacturing
2. The planned cell and module lines are up and running achieving state of the art manufacturing
3. Established as one of the major Italian PV manufacturers achieving an increasing market share in the Italian market
4. Gaining reputation among Italian key customersdelivering high performing products and a total quality service
5 Oct 1025
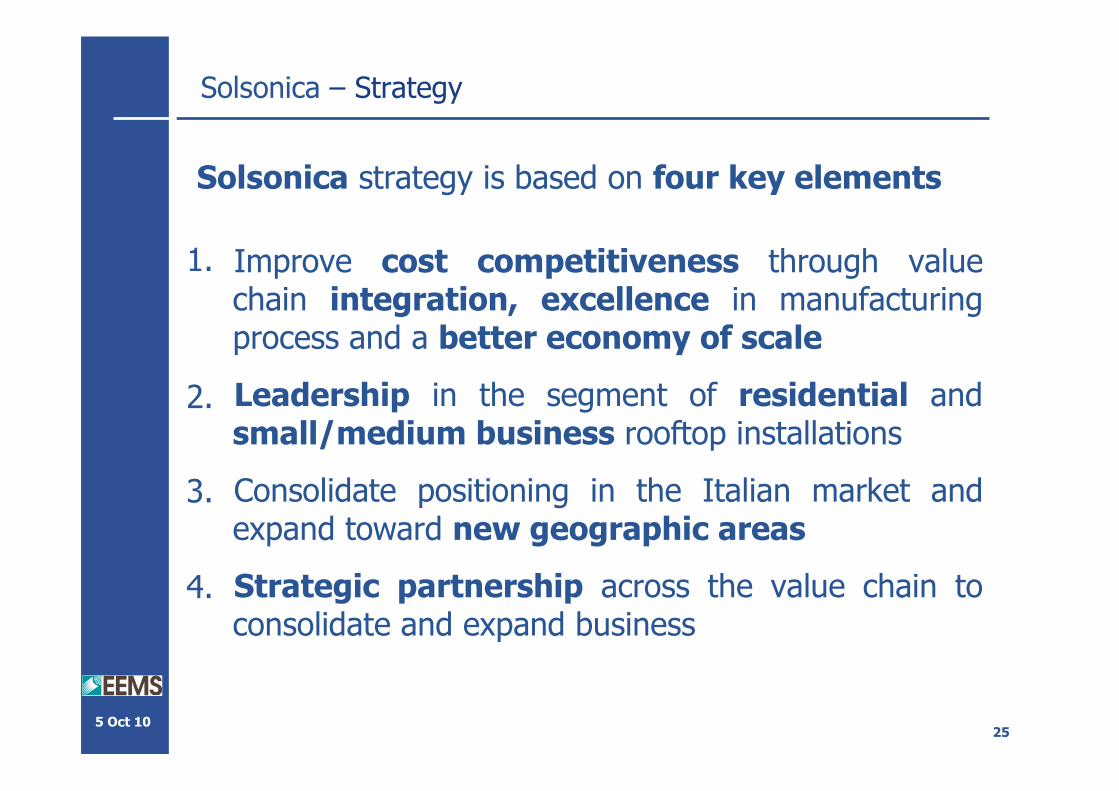
Solsonica – Strategy
Improve cost competitiveness through value chain integration, excellence in manufacturing process and a better economy of scale
Leadership in the segment of residential and small/medium business rooftop installations
Consolidate positioning in the Italian market and expand toward new geographic areas
Strategic partnership across the value chain to consolidate and expand business
1.
2.
3.
4.
Solsonica strategy is based on four key elements

5 Oct 1026
Solsonica – Our new vision
A complete and truly distinctive turn key system for residential customers and small industries based on:
• Guarantee the economic return
• Distinctive and performing product features
• Energy monitoring and after sales services
• Easy and industrialized installation
An aggressive approach to sales based on:
• The set up of a network model for sales and installations
• New location in Milan to be closer to the core market
• New managers hired with strong marketing expertise
• Strategic partnership to fuel the project pipeline
To become the Leader in PV solutions for residential and small businesses
5 Oct 1027
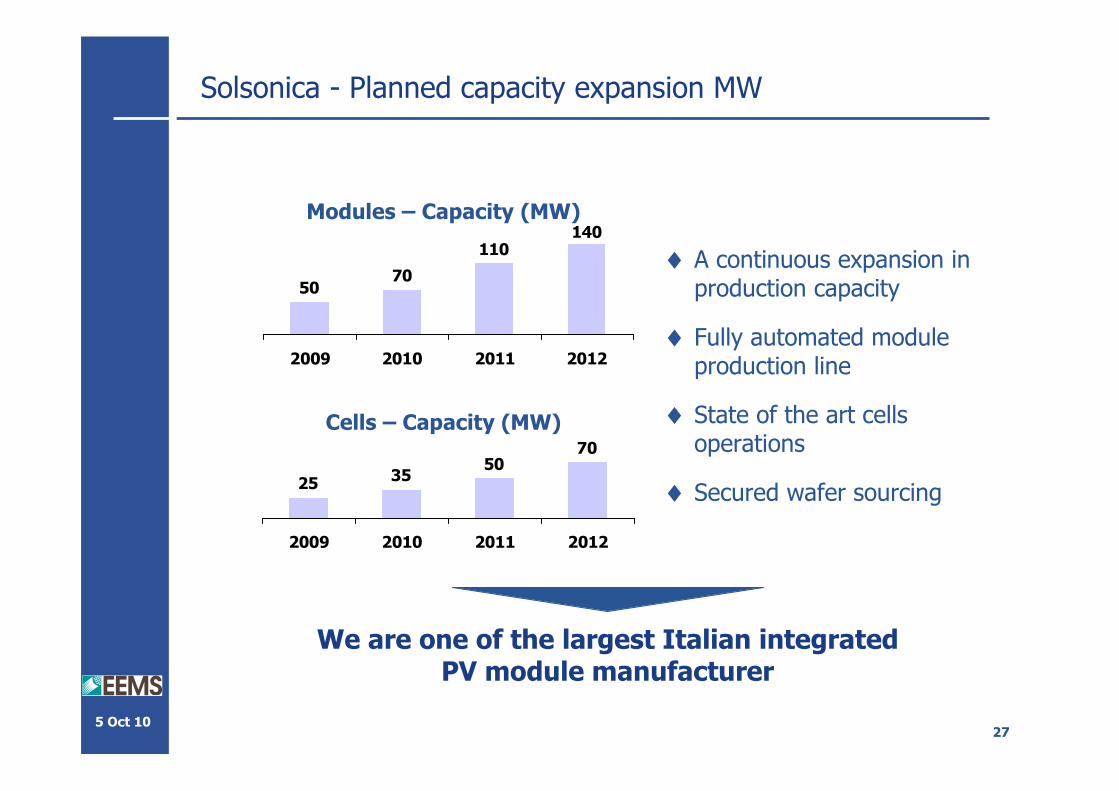
Solsonica - Planned capacity expansion MW
70
110140
50
2009 2010 2011 2012
Modules – Capacity (MW)
♦ A continuous expansion in production capacity
♦ Fully automated module production line
♦ State of the art cells operations
♦ Secured wafer sourcing35
5070
25
2009 2010 2011 2012
Cells – Capacity (MW)
We are one of the largest Italian integrated PV module manufacturer

5 Oct 1028
Solsonica - Financials M€
37
100
19
2008 2009 2010 E
Revenues (M€)
Continuous growth in revenues

5 Oct 1029
Solsonica - Summary
A path to grow ….
A market in constant expansion
New opportunities in rooftop installations
Extremely well positioned in the Italian market
An excellent product well perceived by the market
… and a vision to attain
Leadership in PV solutions to residential and small/medium enterprises

5 Oct 1030
Group Financial Projections

5 Oct 1031
EEMS Group (*) Consolidated - Projections M€
♦ Revenues
♦ Ebitda
♦ Ebit
♦ NFP
133.5
25.5
-14.5
80.9
99.5
25.3
3.8
86.8
200 - 210
41 - 43
5 - 7
41 - 43
2009Actual
20101st Half
2010 YearGuidance
♦ Hitting barrier of 200 M€ revenues
♦ Return to black
♦ Approaching to halve NFP
(*) Including 7 months of EEMS Test financials