Standards for Mathematics: Accelerated Math 7/8 · Standards for Mathematics: Accelerated Math 7/8...
19
1 | Page - (Rev. August 2017) Standards for Mathematics: Accelerated Math 7/8 The Accelerated Math 7/8 course is comprised of all of the CCRSM for Grade 7 and approximately half of the CCRSM for Grade 8. Instructional time devoted to mastery of Grade 7 standards should focus on the following four critical areas. 1. developing understanding of and applying proportional relationships; 2. developing understanding of operations with rational numbers and working with expressions and linear equations; 3. solving problems involving scale drawings and informal geometric constructions, and working with two- and three-dimensional shapes to solve problems involving area, surface area, and volume; and 4. drawing inferences about populations based on samples. 1) Students extend their understanding of ratios and develop understanding of proportionality to solve single- and multi-step problems. Students use their understanding of ratios and proportionality to solve a wide variety of percent problems, including those involving discounts, interest, taxes, tips, and percent increase or decrease. Students solve problems about scale drawings by relating corresponding lengths between the objects or by using the fact that relationships of lengths within an object are preserved in similar objects. Students graph proportional relationships and understand the unit rate informally as a measure of the steepness of the related line, called the slope. They distinguish proportional relationships from other relationships. 2) Students develop a unified understanding of number, recognizing fractions, decimals (that have a finite or a repeating decimal representation), and percents as different representations of rational numbers. Students extend addition, subtraction, multiplication, and division to all rational numbers, maintaining the properties of operations and the relationships between addition and subtraction, and multiplication and division. By applying these properties, and by viewing negative numbers in terms of everyday contexts (e.g., amounts owed or temperatures below zero), students explain and interpret the rules for adding, subtracting, multiplying, and dividing with negative numbers. They use the arithmetic of rational numbers as they formulate expressions and equations in one variable and use these equations to solve problems. 3) Students continue their work with area from Grade 6, solving problems involving the area and circumference of a circle and surface area of three-dimensional objects. In preparation for work on congruence and similarity in Grade 8 they reason about relationships among two- dimensional figures using scale drawings and informal geometric constructions, and they gain familiarity with the relationships between angles formed by intersecting lines. Students work with three-dimensional figures, relating them to two dimensional figures by examining cross-sections. They solve real-world and mathematical problems involving area, surface area, and volume of two- and three-dimensional objects composed of triangles, quadrilaterals, polygons, cubes and right prisms. 4) Students build on their previous work with single data distributions to compare two data distributions and address questions about differences between populations. They begin informal work with random sampling to generate data sets and learn about the importance of representative samples for drawing inferences.
Transcript of Standards for Mathematics: Accelerated Math 7/8 · Standards for Mathematics: Accelerated Math 7/8...

1 | P a g e - ( R e v . A u g u s t 2 0 1 7 )
Standards for Mathematics: Accelerated Math 7/8
The Accelerated Math 7/8 course is comprised of all of the CCRSM for Grade 7 and approximately half of the CCRSM for Grade 8. Instructional time devoted to mastery of Grade 7 standards should focus on the following four critical areas.
1. developing understanding of and applying proportional relationships; 2. developing understanding of operations with rational numbers and working with expressions and linear equations; 3. solving problems involving scale drawings and informal geometric constructions, and working with two- and three-dimensional shapes to
solve problems involving area, surface area, and volume; and 4. drawing inferences about populations based on samples.
1) Students extend their understanding of ratios and develop understanding of proportionality to solve single- and multi-step problems. Students use their understanding of ratios and proportionality to solve a wide variety of percent problems, including those involving discounts, interest, taxes, tips, and percent increase or decrease. Students solve problems about scale drawings by relating corresponding lengths between the objects or by using the fact that relationships of lengths within an object are preserved in similar objects. Students graph proportional relationships and understand the unit rate informally as a measure of the steepness of the related line, called the slope. They distinguish proportional relationships from other relationships.
2) Students develop a unified understanding of number, recognizing fractions, decimals (that have a finite or a repeating decimal representation), and percents as different representations of rational numbers. Students extend addition, subtraction, multiplication, and division to all rational numbers, maintaining the properties of operations and the relationships between addition and subtraction, and multiplication and division. By applying these properties, and by viewing negative numbers in terms of everyday contexts (e.g., amounts owed or temperatures below zero), students explain and interpret the rules for adding, subtracting, multiplying, and dividing with negative numbers. They use the arithmetic of rational numbers as they formulate expressions and equations in one variable and use these equations to solve problems.
3) Students continue their work with area from Grade 6, solving problems involving the area and circumference of a circle and surface area of three-dimensional objects. In preparation for work on congruence and similarity in Grade 8 they reason about relationships among two-dimensional figures using scale drawings and informal geometric constructions, and they gain familiarity with the relationships between angles formed by intersecting lines. Students work with three-dimensional figures, relating them to two dimensional figures by examining cross-sections. They solve real-world and mathematical problems involving area, surface area, and volume of two- and three-dimensional objects composed of triangles, quadrilaterals, polygons, cubes and right prisms.
4) Students build on their previous work with single data distributions to compare two data distributions and address questions about differences between populations. They begin informal work with random sampling to generate data sets and learn about the importance of representative samples for drawing inferences.

2 | P a g e - ( R e v . A u g u s t 2 0 1 7 )
Grade 7 Overview
Ratios and Proportional Relationships A. Analyze proportional relationships and use them to solve real-
world and mathematical problems. The Number System
A. Apply and extend previous understandings of operations with fractions to add, subtract, multiply, and divide rational numbers.
Expressions and Equations A. Use properties of operations to generate equivalent expressions. B. Solve real-life and mathematical problems using numerical and
algebraic expressions and equations. Geometry
A. Draw, construct and describe geometrical figures and describe the relationships between them.
B. Solve real-life and mathematical problems involving angle measure, area, surface area, and volume.
Statistics and Probability A. Use random sampling to draw inferences about a population. B. Draw informal comparative inferences about two populations. C. Investigate chance processes and develop, use, and evaluate
probability models.
STANDARDS FOR MATHEMATICAL PRACTICE
1. Make sense of problems and persevere in solving them. 2. Reason abstractly and quantitatively. 3. Construct viable arguments and critique the reasoning of others. 4. Model with mathematics. 5. Use appropriate tools strategically. 6. Attend to precision. 7. Look for and make use of structure. 8. Look for and express regularity in repeated reasoning.
3 | P a g e - ( R e v . A u g u s t 2 0 1 7 )
Ratios and Proportional Relationships 7.RP
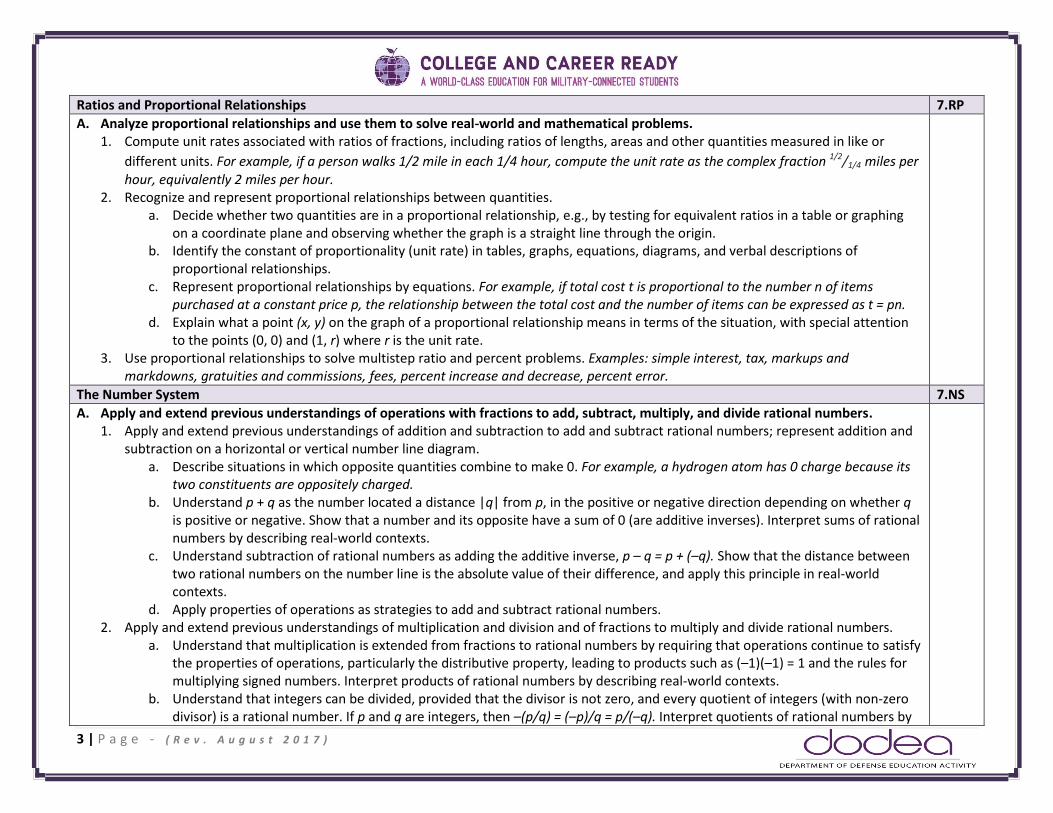
A. Analyze proportional relationships and use them to solve real-world and mathematical problems. 1. Compute unit rates associated with ratios of fractions, including ratios of lengths, areas and other quantities measured in like or
different units. For example, if a person walks 1/2 mile in each 1/4 hour, compute the unit rate as the complex fraction 1/2/1/4 miles per hour, equivalently 2 miles per hour.
2. Recognize and represent proportional relationships between quantities. a. Decide whether two quantities are in a proportional relationship, e.g., by testing for equivalent ratios in a table or graphing
on a coordinate plane and observing whether the graph is a straight line through the origin. b. Identify the constant of proportionality (unit rate) in tables, graphs, equations, diagrams, and verbal descriptions of
proportional relationships. c. Represent proportional relationships by equations. For example, if total cost t is proportional to the number n of items
purchased at a constant price p, the relationship between the total cost and the number of items can be expressed as t = pn. d. Explain what a point (x, y) on the graph of a proportional relationship means in terms of the situation, with special attention
to the points (0, 0) and (1, r) where r is the unit rate. 3. Use proportional relationships to solve multistep ratio and percent problems. Examples: simple interest, tax, markups and
markdowns, gratuities and commissions, fees, percent increase and decrease, percent error.
The Number System 7.NS
A. Apply and extend previous understandings of operations with fractions to add, subtract, multiply, and divide rational numbers. 1. Apply and extend previous understandings of addition and subtraction to add and subtract rational numbers; represent addition and
subtraction on a horizontal or vertical number line diagram. a. Describe situations in which opposite quantities combine to make 0. For example, a hydrogen atom has 0 charge because its
two constituents are oppositely charged. b. Understand p + q as the number located a distance |q| from p, in the positive or negative direction depending on whether q
is positive or negative. Show that a number and its opposite have a sum of 0 (are additive inverses). Interpret sums of rational numbers by describing real-world contexts.
c. Understand subtraction of rational numbers as adding the additive inverse, p – q = p + (–q). Show that the distance between two rational numbers on the number line is the absolute value of their difference, and apply this principle in real-world contexts.
d. Apply properties of operations as strategies to add and subtract rational numbers. 2. Apply and extend previous understandings of multiplication and division and of fractions to multiply and divide rational numbers.
a. Understand that multiplication is extended from fractions to rational numbers by requiring that operations continue to satisfy the properties of operations, particularly the distributive property, leading to products such as (–1)(–1) = 1 and the rules for multiplying signed numbers. Interpret products of rational numbers by describing real-world contexts.
b. Understand that integers can be divided, provided that the divisor is not zero, and every quotient of integers (with non-zero divisor) is a rational number. If p and q are integers, then –(p/q) = (–p)/q = p/(–q). Interpret quotients of rational numbers by

4 | P a g e - ( R e v . A u g u s t 2 0 1 7 )
describing real world contexts. c. Apply properties of operations as strategies to multiply and divide rational numbers. d. Convert a rational number to a decimal using long division; know that the decimal form of a rational number terminates in 0s
or eventually repeats. 3. Solve real-world and mathematical problems involving the four operations with rational numbers.1
Expressions and Equations 7.EE
A. Use properties of operations to generate equivalent expressions. 1. Apply properties of operations as strategies to add, subtract, factor, and expand linear expressions with rational coefficients. 2. Understand that rewriting an expression in different forms in a problem context can shed light on the problem and how the quantities
in it are related. For example, a + 0.05a = 1.05a means that “increase by 5%” is the same as “multiply by 1.05.” B. Solve real-life and mathematical problems using numerical and algebraic expressions and equations.
3. Solve multi-step real-life and mathematical problems posed with positive and negative rational numbers in any form (whole numbers, fractions, and decimals), using tools strategically. Apply properties of operations to calculate with numbers in any form; convert between forms as appropriate; and assess the reasonableness of answers using mental computation and estimation strategies. For example: If a woman making $25 an hour gets a 10% raise, she will make an additional 1/10 of her salary an hour, or $2.50, for a new salary of $27.50. If you want to place a towel bar 9 3/4 inches long in the center of a door that is 27 1/2 inches wide, you will need to place the bar about 9 inches from each edge; this estimate can be used as a check on the exact computation.
4. Use variables to represent quantities in a real-world or mathematical problem, and construct simple equations and inequalities to solve problems by reasoning about the quantities.
a. Solve word problems leading to equations of the form px + q = r and p(x + q) = r, where p, q, and r are specific rational numbers. Solve equations of these forms fluently. Compare an algebraic solution to an arithmetic solution, identifying the sequence of the operations used in each approach. For example, the perimeter of a rectangle is 54 cm. Its length is 6 cm. What is its width?
b. Solve word problems leading to inequalities of the form px + q > r or px + q < r, where p, q, and r are specific rational numbers. Graph the solution set of the inequality and interpret it in the context of the problem. For example: As a salesperson, you are paid $50 per week plus $3 per sale. This week you want your pay to be at least $100. Write an inequality for the number of sales you need to make, and describe the solutions.
1Computations with rational numbers extend the rules for manipulating fractions to complex fractions.
5 | P a g e - ( R e v . A u g u s t 2 0 1 7 )
Geometry 7.G
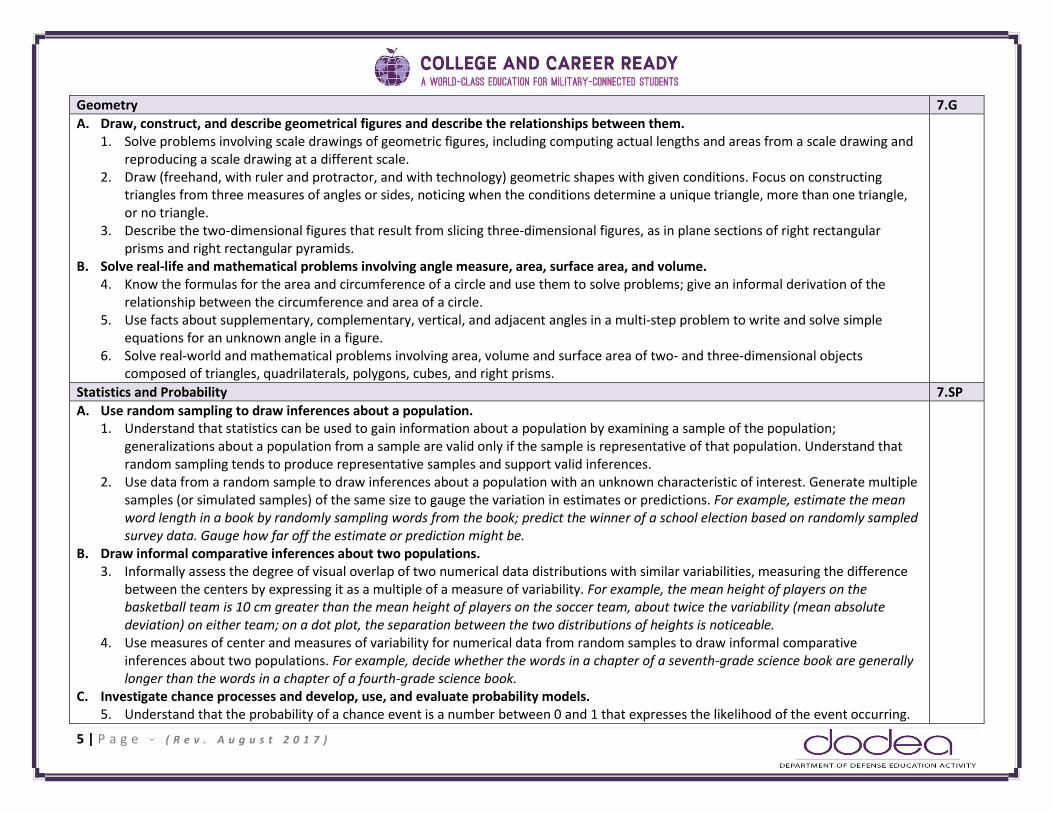
A. Draw, construct, and describe geometrical figures and describe the relationships between them. 1. Solve problems involving scale drawings of geometric figures, including computing actual lengths and areas from a scale drawing and
reproducing a scale drawing at a different scale. 2. Draw (freehand, with ruler and protractor, and with technology) geometric shapes with given conditions. Focus on constructing
triangles from three measures of angles or sides, noticing when the conditions determine a unique triangle, more than one triangle, or no triangle.
3. Describe the two-dimensional figures that result from slicing three-dimensional figures, as in plane sections of right rectangular prisms and right rectangular pyramids.
B. Solve real-life and mathematical problems involving angle measure, area, surface area, and volume. 4. Know the formulas for the area and circumference of a circle and use them to solve problems; give an informal derivation of the
relationship between the circumference and area of a circle. 5. Use facts about supplementary, complementary, vertical, and adjacent angles in a multi-step problem to write and solve simple
equations for an unknown angle in a figure. 6. Solve real-world and mathematical problems involving area, volume and surface area of two- and three-dimensional objects
composed of triangles, quadrilaterals, polygons, cubes, and right prisms.
Statistics and Probability 7.SP
A. Use random sampling to draw inferences about a population. 1. Understand that statistics can be used to gain information about a population by examining a sample of the population;
generalizations about a population from a sample are valid only if the sample is representative of that population. Understand that random sampling tends to produce representative samples and support valid inferences.
2. Use data from a random sample to draw inferences about a population with an unknown characteristic of interest. Generate multiple samples (or simulated samples) of the same size to gauge the variation in estimates or predictions. For example, estimate the mean word length in a book by randomly sampling words from the book; predict the winner of a school election based on randomly sampled survey data. Gauge how far off the estimate or prediction might be.
B. Draw informal comparative inferences about two populations. 3. Informally assess the degree of visual overlap of two numerical data distributions with similar variabilities, measuring the difference
between the centers by expressing it as a multiple of a measure of variability. For example, the mean height of players on the basketball team is 10 cm greater than the mean height of players on the soccer team, about twice the variability (mean absolute deviation) on either team; on a dot plot, the separation between the two distributions of heights is noticeable.
4. Use measures of center and measures of variability for numerical data from random samples to draw informal comparative inferences about two populations. For example, decide whether the words in a chapter of a seventh-grade science book are generally longer than the words in a chapter of a fourth-grade science book.
C. Investigate chance processes and develop, use, and evaluate probability models. 5. Understand that the probability of a chance event is a number between 0 and 1 that expresses the likelihood of the event occurring.
6 | P a g e - ( R e v . A u g u s t 2 0 1 7 )
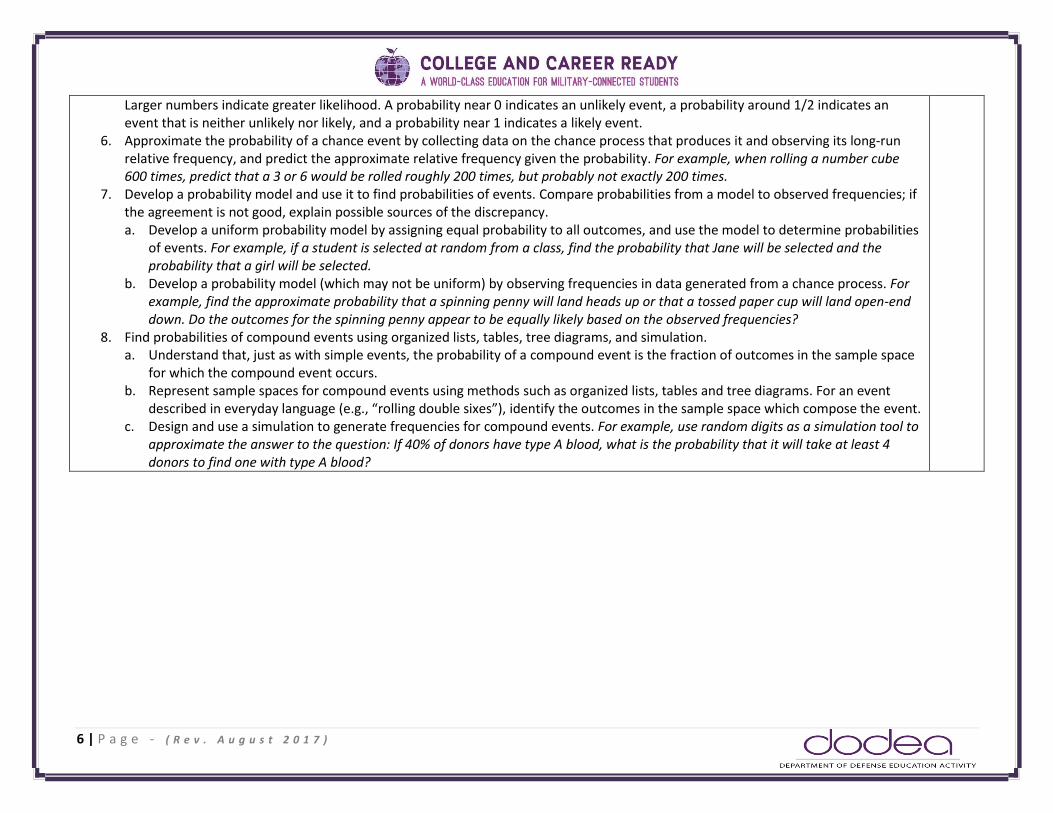
Larger numbers indicate greater likelihood. A probability near 0 indicates an unlikely event, a probability around 1/2 indicates an event that is neither unlikely nor likely, and a probability near 1 indicates a likely event.
6. Approximate the probability of a chance event by collecting data on the chance process that produces it and observing its long-run relative frequency, and predict the approximate relative frequency given the probability. For example, when rolling a number cube 600 times, predict that a 3 or 6 would be rolled roughly 200 times, but probably not exactly 200 times.
7. Develop a probability model and use it to find probabilities of events. Compare probabilities from a model to observed frequencies; if the agreement is not good, explain possible sources of the discrepancy. a. Develop a uniform probability model by assigning equal probability to all outcomes, and use the model to determine probabilities
of events. For example, if a student is selected at random from a class, find the probability that Jane will be selected and the probability that a girl will be selected.
b. Develop a probability model (which may not be uniform) by observing frequencies in data generated from a chance process. For example, find the approximate probability that a spinning penny will land heads up or that a tossed paper cup will land open-end down. Do the outcomes for the spinning penny appear to be equally likely based on the observed frequencies?
8. Find probabilities of compound events using organized lists, tables, tree diagrams, and simulation. a. Understand that, just as with simple events, the probability of a compound event is the fraction of outcomes in the sample space
for which the compound event occurs. b. Represent sample spaces for compound events using methods such as organized lists, tables and tree diagrams. For an event
described in everyday language (e.g., “rolling double sixes”), identify the outcomes in the sample space which compose the event. c. Design and use a simulation to generate frequencies for compound events. For example, use random digits as a simulation tool to
approximate the answer to the question: If 40% of donors have type A blood, what is the probability that it will take at least 4 donors to find one with type A blood?
7 | P a g e - ( R e v . A u g u s t 2 0 1 7 )
Standards for Mathematics: Accelerated Math 7/8
The Accelerated Math 7/8 course is comprised of all of the CCRSM for Grade 7 and approximately half of the CCRSM for Grade 8. Instructional time devoted to mastery of Grade 8 standards should focus on the following two critical areas.
1. formulating and reasoning about expressions and equations, and solving linear equations and systems of linear equations; 2. analyzing two- and three-dimensional space and figures using distance, angle, similarity, and congruence.
(1) Students use linear equations and systems of linear equations to represent, analyze, and solve a variety of problems. Students recognize
equations for proportions (y/x = m or y = mx) as special linear equations (y = mx + b), understanding that the constant of proportionality (m) is the slope, and the graphs are lines through the origin. They understand that the slope (m) of a line is a constant rate of change, so that if the input or x-coordinate changes by an amount A, the output or y-coordinate changes by the amount m·A.
Students strategically choose and efficiently implement procedures to solve linear equations in one variable, understanding that when they use the properties of equality and the concept of logical equivalence, they maintain the solutions of the original equation. Students solve systems of two linear equations in two variables and relate the systems to pairs of lines in the plane; these intersect, are parallel, or are the same line. Students use linear equations, systems of linear equations, linear functions, and their understanding of slope of a line to analyze situations and solve problems.
(2) Students use ideas about distance and angles, how they behave under translations, rotations, reflections, and dilations, and ideas about congruence and similarity to describe and analyze two-dimensional figures and to solve problems. Students show that the sum of the angles in a triangle is the angle formed by a straight line and that various configurations of lines give rise to similar triangles because of the angles created when a transversal cuts parallel lines. Students complete their work on volume by solving problems involving cones, cylinders, and spheres.

8 | P a g e - ( R e v . A u g u s t 2 0 1 7 )
Grade 8 Overview
The Number System A. Know that there are numbers that are not rational, and
approximate them by rational numbers. Expressions and Equations
A. Work with radicals and integer exponents. B. Understand the connections between proportional relationships,
lines, and linear equations. C. Analyze and solve linear equations and pairs of simultaneous
linear equations. Geometry
A. Understand congruence and similarity using physical models, transparencies, or geometry software.
B. Solve real-world and mathematical problems involving volume of cylinders, cones and spheres.
STANDARDS FOR MATHEMATICAL PRACTICE
1. Make sense of problems and persevere in solving them. 2. Reason abstractly and quantitatively. 3. Construct viable arguments and critique the reasoning of others. 4. Model with mathematics. 5. Use appropriate tools strategically. 6. Attend to precision. 7. Look for and make use of structure. 8. Look for and express regularity in repeated reasoning.

9 | P a g e - ( R e v . A u g u s t 2 0 1 7 )
The Number System 8.NS
A. Know that there are numbers that are not rational, and approximate them by rational numbers. 1. Know that numbers that are not rational are called irrational. Understand informally that every number has a decimal expansion; for
rational numbers show that the decimal expansion repeats eventually, and convert a decimal expansion which repeats eventually into a rational number.
2. Use rational approximations of irrational numbers to compare the size of irrational numbers, locate them approximately on a number
line diagram, and estimate the value of expressions (e.g., π2). For example, by truncating the decimal expansion of √2, show that √2 is between 1 and 2, then between 1.4 and 1.5, and explain how to continue on to get better approximations.
Expressions and Equations 8.EE
A. Work with radicals and integer exponents. 1. Know and apply the properties of integer exponents to generate equivalent numerical expressions.
For example, 32× 3-5 = 3-3 = 1/33 = 1/27.
2. Use square root and cube root symbols to represent solutions to equations of the form 𝑥2 = 𝑝 and 𝑥3 = 𝑝, where p is a positive
rational number. Evaluate square roots of small perfect squares and cube roots of small perfect cubes. Know that √2 is irrational. 3. Use numbers expressed in the form of a single digit times an integer power of 10 to estimate very large or very small quantities, and
to express how many times as much one is than the other. For example, estimate the population of the United States as 3 × 10⁸ and
the population of the world as 7 × 10⁹, and determine that the world population is more than 20 times larger. 4. Perform operations with numbers expressed in scientific notation, including problems where both decimal and scientific notation are
used. Use scientific notation and choose units of appropriate size for measurements of very large or very small quantities (e.g., use millimeters per year for seafloor spreading). Interpret scientific notation that has been generated by technology.
B. Understand the connections between proportional relationships, lines, and linear equations. 5. Graph proportional relationships, interpreting the unit rate as the slope of the graph. Compare two different proportional
relationships represented in different ways. For example, compare a distance-time graph to a distance-time equation to determine which of two moving objects has greater speed.
6. Use similar triangles to explain why the slope m is the same between any two distinct points on a non-vertical line in the coordinate plane; derive the equation y = mx for a line through the origin and the equation y = mx + b for a line intercepting the vertical axis at b.
C. Analyze and solve linear equations and pairs of simultaneous linear equations. 7. Solve linear equations in one variable.
a. Give examples of linear equations in one variable with one solution, infinitely many solutions, or no solutions. Show which of these possibilities is the case by successively transforming the given equation into simpler forms, until an equivalent equation of the form x = a, a = a, or a = b results (where a and b are different numbers).
b. Solve linear equations with rational number coefficients, including equations whose solutions require expanding expressions using the distributive property and collecting like terms.
8. Analyze and solve pairs of simultaneous linear equations.

10 | P a g e - ( R e v . A u g u s t 2 0 1 7 )
a. Understand that solutions to a system of two linear equations in two variables correspond to points of intersection of their graphs, because points of intersection satisfy both equations simultaneously.
b. Solve systems of two linear equations in two variables algebraically, and estimate solutions by graphing the equations. Solve simple cases by inspection. For example, 3x + 2y = 5 and 3x + 2y = 6 have no solution because 3x + 2y cannot simultaneously be 5 and 6.
c. Solve real-world and mathematical problems leading to two linear equations in two variables. For example, given coordinates for two pairs of points, determine whether the line through the first pair of points intersects the line through the second pair.
Geometry 8.G
A. Understand congruence and similarity using physical models, transparencies, or geometry software. 1. Verify experimentally the properties of rotations, reflections, and translations:
a. Lines are taken to lines, and line segments to line segments of the same length. b. Angles are taken to angles of the same measure. c. Parallel lines are taken to parallel lines.
2. Understand that a two-dimensional figure is congruent to another if the second can be obtained from the first by a sequence of rotations, reflections, and translations; given two congruent figures, describe a sequence that exhibits the congruence between them.
3. Describe the effect of dilations, translations, rotations, and reflections on two-dimensional figures using coordinates. 4. Understand that a two-dimensional figure is similar to another if the second can be obtained from the first by a sequence of rotations,
reflections, translations, and dilations; given two similar two-dimensional figures, describe a sequence that exhibits the similarity between them.
5. Use informal arguments to establish facts about the angle sum and exterior angle of triangles, about the angles created when parallel lines are cut by a transversal, and the angle-angle criterion for similarity of triangles. For example, arrange three copies of the same triangle so that the sum of the three angles appears to form a line, and give an argument in terms of transversals why this is so.
C. Solve real-world and mathematical problems involving volume of cylinders, cones, and spheres. 9. Know the formulas for the volumes of cones, cylinders, and spheres and use them to solve real-world and mathematical problems.

11 | P a g e - ( R e v . A u g u s t 2 0 1 7 )
Glossary Addition and subtraction within 5, 10, 20, 100, or 1000. Addition or subtraction of two whole numbers with whole number answers, and with sum or minuend in the range 0-5, 0-10, 0-20, or 0-100, respectively. Example: 8 + 2 = 10 is an addition within 10, 14 – 5 = 9 is a subtraction within 20, and 55 – 18 = 37 is a subtraction within 100.
Additive inverses. Two numbers whose sum is 0 are additive inverses of one another. Example: 3/4 and – 3/4 are additive inverses of one another because 3/4 + (– 3/4) = (– 3/4) + 3/4 = 0.
Associative property of addition. See Table 3 in this Glossary.
Associative property of multiplication. See Table 3 in this Glossary.
Bivariate data. Pairs of linked numerical observations. Example: a list of heights and weights for each player on a football team.
Box plot. A method of visually displaying a distribution of data values by using the median, quartiles, and extremes of the data set. A box shows the middle 50% of the data.1
Commutative property. See Table 3 in this Glossary.
Complex fraction. A fraction A/B where A and/or B are fractions (B nonzero).
Computation algorithm. A set of predefined steps applicable to a class of problems that gives the correct result in every case when the steps are carried out correctly. See also: computation strategy.
Computation strategy. Purposeful manipulations that may be chosen for specific problems, may not have a fixed order, and may be aimed at converting one problem into another. See also: computation algorithm.
Congruent. Two plane or solid figures are congruent if one can be obtained from the other by rigid motion (a sequence of rotations, reflections, and translations).
Counting on. A strategy for finding the number of objects in a group without having to count every member of the group. For example, if a stack of books is known to have 8 books and 3 more books are added to the top, it is not necessary to count the stack all over again. One can find the total by counting on—pointing to the top book and saying “eight,” following this with “nine, ten, eleven. There are eleven books now.”
Dot plot. See: line plot.
1Adapted from Wisconsin Department of Public Instruction, http://dpi.wi.gov/standards/mathglos.html, accessed March 2, 2010.

12 | P a g e - ( R e v . A u g u s t 2 0 1 7 )
Dilation. A transformation that moves each point along the ray through the point emanating from a fixed center, and multiplies distances from the center by a common scale factor.
Expanded form. A multi-digit number is expressed in expanded form when it is written as a sum of single-digit multiples of powers of ten. For example, 643 = 600 + 40 + 3.
Expected value. For a random variable, the weighted average of its possible values, with weights given by their respective probabilities.
First quartile. For a data set with median M, the first quartile is the median of the data values less than M. Example: For the data set {1, 3, 6, 7, 10, 12, 14, 15, 22, 120}, the first quartile is 6.2 See also: median, third quartile, interquartile range.
Fraction. A number expressible in the form a/b where a is a whole number and b is a positive whole number. (The word fraction in these standards always refers to a non-negative number.) See also: rational number.
Identity property of 0. See Table 3 in this Glossary.
Independently combined probability models. Two probability models are said to be combined independently if the probability of each ordered pair in the combined model equals the product of the original probabilities of the two individual outcomes in the ordered pair.
Integer. A number expressible in the form a or –a for some whole number a.
Interquartile Range. A measure of variation in a set of numerical data, the interquartile range is the distance between the first and third quartiles of the data set. Example: For the data set {1, 3, 6, 7, 10, 12, 14, 15, 22, 120}, the interquartile range is 15 – 6 = 9. See also: first quartile, third quartile.
Line plot. A method of visually displaying a distribution of data values where each data value is shown as a dot or mark above a number line. Also known as a dot plot.3
Mean. A measure of center in a set of numerical data, computed by adding the values in a list and then dividing by the number of values in the list.4 Example: For the data set {1, 3, 6, 7, 10, 12, 14, 15, 22, 120}, the mean is 21.
Mean absolute deviation. A measure of variation in a set of numerical data, computed by adding the distances between each data value and the mean, then dividing by the number of data values. Example: For the data set {2, 3, 6, 7, 10, 12, 14, 15, 22, 120}, the mean absolute deviation is 20.
2Many different methods for computing quartiles are in use. The method defined here is sometimes called the Moore and McCabe method. See Langford, E., “Quartiles in Elementary
Statistics,” Journal of Statistics Education Volume 14, Number 3 (2006). 3Adapted from Wisconsin Department of Public Instruction, op. cit.
4To be more precise, this defines the arithmetic mean.

13 | P a g e - ( R e v . A u g u s t 2 0 1 7 )
Median. A measure of center in a set of numerical data. The median of a list of values is the value appearing at the center of a sorted version of the list—or the mean of the two central values, if the list contains an even number of values. Example: For the data set {2, 3, 6, 7, 10, 12, 14, 15, 22, 90}, the median is 11.
Midline. In the graph of a trigonometric function, the horizontal line halfway between its maximum and minimum values.
Multiplication and division within 100. Multiplication or division of two whole numbers with whole number answers, and with product or dividend in the range 0-100. Example: 72 ÷ 8 = 9.
Multiplicative inverses. Two numbers whose product is 1 are multiplicative inverses of one another. Example: 3/4 and 4/3 are multiplicative inverses of one another because 3/4 × 4/3 = 4/3 × 3/4 = 1.
Number line diagram. A diagram of the number line used to represent numbers and support reasoning about them. In a number line diagram for measurement quantities, the interval from 0 to 1 on the diagram represents the unit of measure for the quantity.
Percent rate of change. A rate of change expressed as a percent. Example: if a population grows from 50 to 55 in a year, it grows by 5/50 = 10% per year.
Probability distribution. The set of possible values of a random variable with a probability assigned to each.
Properties of operations. See Table 3 in this Glossary.
Properties of equality. See Table 4 in this Glossary.
Properties of inequality. See Table 5 in this Glossary.
Properties of operations. See Table 3 in this Glossary.
Probability. A number between 0 and 1 used to quantify likelihood for processes that have uncertain outcomes (such as tossing a coin, selecting a person at random from a group of people, tossing a ball at a target, or testing for a medical condition).
Probability model. A probability model is used to assign probabilities to outcomes of a chance process by examining the nature of the process. The set of all outcomes is called the sample space, and their probabilities sum to 1. See also: uniform probability model.
Random variable. An assignment of a numerical value to each outcome in a sample space.
Rational expression. A quotient of two polynomials with a non-zero denominator.
Rational number. A number expressible in the form a/b or – a/b for some fraction a/b. The rational numbers include the integers.

14 | P a g e - ( R e v . A u g u s t 2 0 1 7 )
Rectilinear figure. A polygon all angles of which are right angles.
Rigid motion. A transformation of points in space consisting of a sequence of one or more translations, reflections, and/or rotations. Rigid motions are here assumed to preserve distances and angle measures.
Repeating decimal. The decimal form of a rational number. See also: terminating decimal.
Sample space. In a probability model for a random process, a list of the individual outcomes that are to be considered.
Scatter plot. A graph in the coordinate plane representing a set of bivariate data. For example, the heights and weights of a group of people could be displayed on a scatter plot.5
Similarity transformation. A rigid motion followed by a dilation.
Tape diagram. A drawing that looks like a segment of tape, used to illustrate number relationships. Also known as a strip diagram, bar model, fraction strip, or length model.
Terminating decimal. A decimal is called terminating if its repeating digit is 0.
Third quartile. For a data set with median M, the third quartile is the median of the data values greater than M. Example: For the data set {2, 3, 6, 7, 10, 12, 14, 15, 22, 120}, the third quartile is 15. See also: median, first quartile, interquartile range.
Transitivity principle for indirect measurement. If the length of object A is greater than the length of object B, and the length of object B is greater than the length of object C, then the length of object A is greater than the length of object C. This principle applies to measurement of other quantities as well.
Uniform probability model. A probability model which assigns equal probability to all outcomes. See also: probability model.
Vector. A quantity with magnitude and direction in the plane or in space, defined by an ordered pair or triple of real numbers.
Visual fraction model. A tape diagram, number line diagram, or area model.
Whole numbers. The numbers 0, 1, 2, 3, ….
5Adapted from Wisconsin Department of Public Instruction, op. cit.

15 | P a g e - ( R e v . A u g u s t 2 0 1 7 )
Table 1. Common Addition and Subtraction Situations 1
Result Unknown Change Unknown Start Unknown
Add to
Two bunnies sat on the grass. Three more
bunnies hopped there. How many bunnies
are on the grass now?
2 + 3 = ?
Two bunnies were sitting on the grass. Some
more bunnies hopped there. Then there were
five bunnies. How many bunnies hopped over
to the first two?
2 + ? = 5
Some bunnies were sitting on the grass.
Three more bunnies hopped there. Then there
were five bunnies. How many bunnies were
on the grass before?
? + 3 = 5
Take from
Five apples were on the table. I ate two
apples. How many apples are on the table
now?
5 – 2 = ?
Five apples were on the table. I ate some
apples. Then there were three apples. How
many apples did I eat?
5 – ? = 3
Some apples were on the table. I ate two
apples. Then there were three apples. How
many apples were on the table before?
? – 2 = 3
Put Together/
Take Apart3
Total Unknown Addend Unknown Both Addends Unknown2
Three red apples and two green apples are
on the table. How many apples are on the
table?
3 + 2 = ?
Five apples are on the table. Three are red
and the rest are green. How many apples are
green?
3 + ? = 5, 5 – 3 = ?
Grandma has five flowers. How many can she
put in her red vase and how many in her blue
vase?
5 = 0+ 5, 5 = 5+ 0
5 = 1+ 4, 5 = 4+ 1
5 = 2+ 3, 5 = 3+ 2
Compare4
Difference Unknown Bigger Unknown Smaller Unknown (“How many more?” version):
Lucy has two apples. Julie has five apples.
How many more apples does Julie have than
Lucy?
(“How many fewer?” version):
Lucy has two apples. Julie has five apples.
How many fewer apples does Lucy have than
Julie?
2 + ?= 5, 5 – 2 = ?
(Version with “more”):
Julie has three more apples than Lucy. Lucy has two
apples. How many apples does Julie have?
(Version with “fewer”):
Lucy has 3 fewer apples than Julie. Lucy has two
apples. How many apples does Julie have?
2 + 3 = ?, 3 + 2 = ?
(Version with “more”):
Julie has three more apples than Lucy. Julie has five
apples. How many apples does Lucy have?
(Version with “fewer”):
Lucy has 3 fewer apples than Julie. Julie has five
apples. How many apples does Lucy have?
5 – 3 = ?, ? + 3 = 5
1 Adapted from Box 2-4 of Mathematics Learning in Early Childhood, National Research Council (2009, pp.32,33) 2 These take apart situations can be used to show all the decompositions of a given number. The associated equations, which have the total on the left of the equal sign, help children understand that the = sign
does not always mean makes or results in but always does mean is the same number as. 3Either addend can be unknown, so there are three variations of these problem situations. Both Addends Unknown is a productive extension of this basic situation, especially for small numbers less than or equal
to 10. 4 For the Bigger Unknown or Smaller Unknown situations, one version directs the correct operation (the version using more for the bigger unknown and using less for the smaller unknown). The other versions
are more difficult.

16 | P a g e - ( R e v . A u g u s t 2 0 1 7 )
Table 2. Common Multiplication and Division Situations5
Unknown Product Group Size Unknown (“How
many in each group?” Division) Number of Groups Unknown
(“How many groups?” Division)
3 × 6 = ? 3 × ? = 18 and, 18 ÷ 3 = ? ? × 6 = 18, and 18 ÷ 6 = ?
Equal Groups
There are 3 bags with 6 plums in each
bag. How many plums are there in all?
Measurement example. You need 3
lengths of string, each 6 inches long. How
much string will you need altogether?
If 18 plums are shared equally into 3 bags,
then how many plums will be in each bag?
Measurement example. You have 18 inches of
string, which you will cut into 3 equal pieces.
How long will each piece of string be?
If 18 plums are to be packed 6 to a bag, then
how many bags are needed?
Measurement example. You have 18 inches
of string, which you will cut into pieces that are
6 inches long. How many pieces of string will
you have?
Arrays,6
area7
There are 3 rows of apples with 6 apples
in each row. How many apples are there?
Area example. What is the area of a 3 cm
by 6 cm rectangle?
If 18 apples are arranged into 3 equal rows,
how many apples will be in each row?
Area example. A rectangle has area 18
square centimeters. If one side is 3 cm long,
how long is a side next to it?
If 18 apples are arranged into equal rows of 6
apples, how many rows will there be?
Area example. A rectangle has area 18
square centimeters. If one side is 6 cm long,
how long is a side next to it?
Compare
A blue hat costs $6. A red hat costs 3 times
as much as the blue hat. How much does
the red hat cost?
Measurement example. A rubber band is 6
cm long. How long will the rubber band be
when it is stretched to be 3 times as long?
A red hat costs $18 and that is 3 times as
much as a blue hat costs. How much does a
blue hat cost?
Measurement example. A rubber band is
stretched to be 18 cm long and that is 3 times
as long as it was at first. How long was the
rubber band at first?
A red hat costs $18 and a blue hat costs $6.
How many times as much does the red hat
cost as the blue hat?
Measurement example. A rubber band was 6
cm long at first. Now it is stretched to be 18
cm long. How many times as long is the
rubber band now as it was at first?
General a × b = ? a × ? = p, and p ÷ a = ? ? × b = p, and p ÷ b = ?
5 The first examples in each cell are examples of discrete things. These are easier for students and should be given before the measurement examples.
6 The language in the array examples shows the easiest form of array problems. A harder form is to use the terms rows and columns: The apples in the grocery window are in 3 rows and 6
columns. How many apples are in there? Both forms are valuable. 7
Area involves arrays of squares that have been pushed together so that there are no gaps or overlaps, so array problems include these especially important measurement situations.

17 | P a g e - ( R e v . A u g u s t 2 0 1 7 )
Table 3. The Properties of Operations
Here a, b and c stand for arbitrary numbers in a given number system. The properties of operations apply to the rational number system, the real
number system, and the complex number system.
Associative property of addition (a + b) + c = a + (b + c)
Commutative property of addition a + b = b + a
Additive identity property of 0 a + 0 = 0 + a = a
Existence of additive inverses For every a there exists –a so that a + (–a) = (–a) + a = 0.
Associative property of multiplication (a × b) × c = a × (b × c)
Commutative property of multiplication a × b = b × a
Multiplicative identity property of 1 a × 1 = 1 × a = a
Existence of multiplicative inverses For every a ≠ 0 there exists 1/a so that a × 1/a = 1/a × a = 1.
Distributive property of multiplication over addition a × (b + c) = a × b + a × c

18 | P a g e - ( R e v . A u g u s t 2 0 1 7 )
Table 4. The Properties of Equality
Here a, b and c stand for arbitrary numbers in the rational, real, or complex number systems.
Reflexive property of equality a = a
Symmetric property of equality If a = b, then b = a.
Transitive property of equality If a = b and b = c, then a = c.
Addition property of equality If a = b, then a + c = b + c.
Subtraction property of equality If a = b, then a – c = b – c.
Multiplication property of equality If a = b, then a × c = b × c.
Division property of equality If a = b and c ≠ 0, then a ÷ c = b ÷ c.
Substitution property of equality If a = b, then b may be substituted for a in any expression containing a.

19 | P a g e - ( R e v . A u g u s t 2 0 1 7 )
Table 5. The Properties of Inequality
Here a, b and c stand for arbitrary numbers in the rational or real number systems.
Exactly one of the following is true: a < b, a = b, a > b.
If a > b and b > c then a > c.
If a > b, then b < a.
If a > b, then –a < –b.
If a > b, then a ± c > b ± c.
If a > b and c > 0, then a × c > b × c.
If a > b and c < 0, then a × c < b × c.
If a > b and c > 0, then a ÷ c > b ÷ c.
If a > b and c < 0, then a ÷ c < b ÷ c.