Standardized Precipitation Index
14
7/26/2018 NIDIS Drought and Water Assessment http://climate.colostate.edu/~drought/current_assessment.php 1/14 NIDIS Intermountain West Drought Early Warning System July 24, 2018 Precipitation The images above use daily precipitation statistics from NWS COOP, CoCoRaHS, and CoAgMet stations. From top to bottom, and left to right: most recent 7-days of accumulated precipitation in inches; current month-to-date accumulated precipitation in inches; last month's precipitation as a percent of average; water-year-to-date precipitation as a percent of average. Standardized Precipitation Index
Transcript of Standardized Precipitation Index

7/26/2018 NIDIS Drought and Water Assessment
http://climate.colostate.edu/~drought/current_assessment.php 1/14
NIDIS Intermountain West Drought Early Warning System
July 24, 2018
Precipitation
The images above use daily precipitation statistics from NWS COOP, CoCoRaHS, and CoAgMetstations. From top to bottom, and left to right: most recent 7-days of accumulated precipitation ininches; current month-to-date accumulated precipitation in inches; last month's precipitation as apercent of average; water-year-to-date precipitation as a percent of average.
Standardized Precipitation Index

7/26/2018 NIDIS Drought and Water Assessment
http://climate.colostate.edu/~drought/current_assessment.php 2/14
Standardized Precipitation Index standardizes precipitation accumulations for a specified timeperiod into percentile rankings. -1.0 to -1.5 is equivalent to a D1 to D2. -1.5 to -2.0 is equivalentto a D2 to D3. -2.0 and worse is equivalent to a D3 to D4. 30- and 60-day SPIs focus on short-term conditions while 6- and 9-month SPIs focus on long-term conditions. SPI data provided byHigh Plains Regional Climate Center.
Streamflow

7/26/2018 NIDIS Drought and Water Assessment
http://climate.colostate.edu/~drought/current_assessment.php 3/14

7/26/2018 NIDIS Drought and Water Assessment
http://climate.colostate.edu/~drought/current_assessment.php 4/14
The top left image shows 7-day averaged streamflows as a percentile ranking across the UCRB.The top right image shows 7-day averaged discharge over time at three key sites around theUCRB: The Colorado River at the CO-UT state line; the Green River at Green River, UT; and theSan Juan River near Bluff, UT. All streamflow data provided by United States Geological Survey.
Surface Water
The top left image shows VIC modeled soil moisture as a percentile ranking. The top right imageshows satellite-derived vegetation from the VegDRI product (which updates on Mondays).
7/26/2018 NIDIS Drought and Water Assessment
http://climate.colostate.edu/~drought/current_assessment.php 5/14
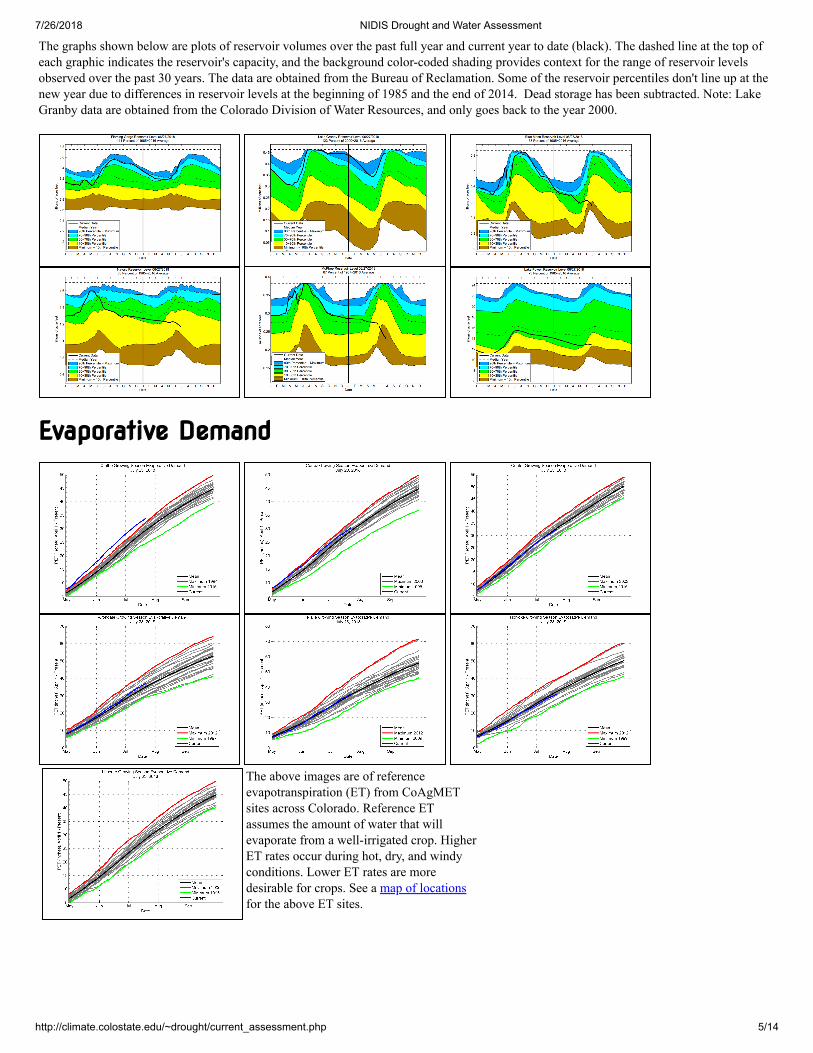
The graphs shown below are plots of reservoir volumes over the past full year and current year to date (black). The dashed line at the top ofeach graphic indicates the reservoir's capacity, and the background color-coded shading provides context for the range of reservoir levelsobserved over the past 30 years. The data are obtained from the Bureau of Reclamation. Some of the reservoir percentiles don't line up at thenew year due to differences in reservoir levels at the beginning of 1985 and the end of 2014. Dead storage has been subtracted. Note: LakeGranby data are obtained from the Colorado Division of Water Resources, and only goes back to the year 2000.
Evaporative Demand
The above images are of reference
evapotranspiration (ET) from CoAgMETsites across Colorado. Reference ETassumes the amount of water that willevaporate from a well-irrigated crop. HigherET rates occur during hot, dry, and windyconditions. Lower ET rates are moredesirable for crops. See a map of locationsfor the above ET sites.

7/26/2018 NIDIS Drought and Water Assessment
http://climate.colostate.edu/~drought/current_assessment.php 6/14
The above images are available courtesy of NOAA’s Evaporative Demand Drought Index(EDDI). Drought classification listed is a function of the depth of reference evapotranspirationaccumulated over a given period of record with respect to a climatology of 1981-2010. Thedrought categories displayed are in line with the US Drought Monitor's Percentile RankingScheme. Data used to generate these maps come from the North American Land DataAssimilation System Phase-2 (NLDAS-2) project, which assimilates observations of temperature,wind speed, radiation, and vapor pressure deficit. The date indicates the last day of the period ofrecord, and the week number indicates the window size for the period of record.
Temperature

7/26/2018 NIDIS Drought and Water Assessment
http://climate.colostate.edu/~drought/current_assessment.php 7/14
All images show temperature departures from average over different time periods (last 7 days ontop left; month-to-date on top right; last full month on bottom). Temperature departure mapsprovided by HPRCC ACIS.
Condition Monitoring and Impacts

7/26/2018 NIDIS Drought and Water Assessment
http://climate.colostate.edu/~drought/current_assessment.php 8/14
Map of current condition monitoring reports submitted to CoCoRaHS in the last week overlaid on thecurrent U.S. Drought Monitor depiction. Specific impacts reports from local experts listed below.
Highway 285 Observations
Driving south on 285 on Sunday, I observed that South Park seemed extremely dry. Grasses were yellow in mostspots with some brown patches scattered throughout. Grounds looked very dry and dusty. Crossing over the passinto the Arkansas Valley, conditions improved. This area is likely climatologically wetter and greener. But thenative grasses appeared taller as well, possibly benefiting from rains that were missing South Park. Most ofChaffee County didn't look too bad. Crossing over the pass into Saguache County and descending down into theSan Luis Valley, conditions appeared dry, but noticeably better than what I'd observed in South Park. Indeed, manyareas of the San Luis Valley are extremely dry, but I did see many herds grazing (i.e., there is still pasture for themto graze on) and irrigated alfalfa fields seemed in decent condition. Driving back north through the area onTuesday afternoon, there was little change in the San Luis Valley. However, South Park grasses had seemed toperk up a little bit from decent storms passing over both Monday and Tuesday. In Chaffee County, near Nathrop, awoman described the ditch outside her shop looking like a running river during the thunderstorm that had recentlypassed. But with my visit only 30 minutes later, it was mostly dry again. - Becky Bolinger
Notes from Southwest Drought Tour
* Hay currently costing about $220 a ton when it’s normally around $100.* One rancher’s herd is typically around 750 cattle. He’s sold 200 already and will likely sell off 200 more. Last time he culled the herd tothis level, it took him almost 10 years to fully recover. Because he has a special genetic breed that can survive the conditions and climate,he can’t just go buy more cattle from Texas or somewhere else.* Irrigated crops are struggling as well. We visited a crop, with a more senior water right, that got irrigated once at the beginning of theseason.* Wells are doing okay since the previous year was better. But creeks are dry. Downstream exchanges can’t happen, even if there is awater right and water upstream is available.* One instance, there is a creek that crosses into New Mexico. The Compact says that 50% of the flow measured at one spot must crossthe state line. Problem is, the creek dries up before the state line. So, how to deliver the water and meet the compact is a challenge.

7/26/2018 NIDIS Drought and Water Assessment
http://climate.colostate.edu/~drought/current_assessment.php 9/14
* Lots of comparisons to the 2002 drought. I think most here think this is the worst they’ve ever seen.* While visiting the burn scar, a plume of smoke started rising. Apparently, the area is at a high risk for reburn. Speculation was that asmoldering tree stump could have reignited with a gust of wind or lightning from scattered storms over the last couple of days could havecaused it.* A guy brought samples of what the runoff looks like downstream from the burn scar after a thunderstorm. One sample shows the sludgethat comes down the river. He also talked about watching the water over some of the worst burn areas. Water would bead up and rolldown the hill, looking like a ball bearing. Not infiltrating the soils at all.* Drought and fire have impacted the tourism/rec industry as well. A guy working for the Durango-Silverton Railroad talked. Because of thefire, they had to close for 40 days, which cost them an estimated 40,000 visitors and about $6 million in revenue. A woman who works forthe ski resorts also spoke of the struggles they’re facing. They had low numbers in the winter because of lack of snow. Then, when theywere hoping to ramp up their summer recreation activities, they had to close down because of the fires.
Kiowa County, FSA Report
The central part of the county has received some beneficial moisture this past week. A producer just north ofGalatea has registered 7 inches in a little over a week.
The far western portion of the county hasn’t received nearly as much. The Arlington area where you have the D4received only 2-7 tenths in the past two weeks. It is still very dry over there. The eastern portion of the county hasareas that are dry and haven’t been getting the rains.
It is very difficult to get a feeling as I live maybe .75 miles from the office. We have a NWS weather station in theback of the office. Sunday night at my house I got 7 tenths – here at the office 4 tenths. That is the story - spottyrains. It will absolutely dump buckets at one place and 1 mile from there – they get nothing.
Outlook

7/26/2018 NIDIS Drought and Water Assessment
http://climate.colostate.edu/~drought/current_assessment.php 10/14
The top two images show Climate Prediction Center's Precipitation and Temperature outlooks for8 - 14 days. The middle image shows the Weather Prediction Center's Quantitative PrecipitationForecast accumulation for seven days. The bottom left image shows the 3-month precipitationoutlook from Climate Prediction Center, and the bottom right image shows the Climate PredictionCenter's most recent release of the U.S. Seasonal Drought Outlook.
>

7/26/2018 NIDIS Drought and Water Assessment
http://climate.colostate.edu/~drought/current_assessment.php 11/14
Summary and Recommendations
Above is the most recent release of the U.S. Drought Monitor map for the UCRB region. Belowshows the proposed changes for this week, with supporting text.

7/26/2018 NIDIS Drought and Water Assessment
http://climate.colostate.edu/~drought/current_assessment.php 12/14
Summary: July 24, 2018
Hotter than normal weather prevailed over the last week across theIntermountain West during what's already a hot time of year. Temperatureswere 2-6 degrees above normal for much of the Upper Colorado River Basinand eastern Colorado. This came as a mix of hot/dry conditions and hot/humidconditions. The region saw at least some thunderstorm activity every day of theweek with the 22nd and 23rd being particularly active, and with southeastColorado seeing the heaviest totals. Much of southern and eastern Coloradoreceived 0.50-1.00" of precipitation, which is normal for this time of year, buttotals in some pockets were much heavier. This included some areas of extreme

7/26/2018 NIDIS Drought and Water Assessment
http://climate.colostate.edu/~drought/current_assessment.php 13/14
or exceptional drought. The moisture isn't a drought buster, but it does chipaway at the deficits. Over four inches of moisture was reported south ofColorado Springs on July 23rd; that'll take a large chunk of the area's wateryear 2018 deficit.
Meanwhile, in northwest Colorado and the central Rockies, the moisture frommonsoon season has yet to arrive. The Colorado Basin Drainage (west slopes)is the second warmest on record from April through June, and the 13th driestgoing back to the 1890s. This area had better (but not good) snowpack than theSan Juans and Sangre de Cristos further to the south, but current streamflowsand soil moisture models would suggest that much of this benefit has beenlost.
The Intermountain West's horrible fire season is either winding down or goingthrough a lull as giant fires such as Spring Creek, Dollar Ridge, 416, BadgerCreek, and Weston Pass fires are all at least 50% contained. All of these but the416 are at least 90% contained. The Indian Valley fire near Meeker has grownto 7,000 acres, and is only 10% contained.
With water demand high, reservoirs across the region have taken a large hit inJune and July. Good carryover storage from 2017 has helped, but even so,reservoir storage across the state of Colorado is now below normal. In general,reservoir storage declines to the south and west and goes up to the north andeast. Flaming Gorge and Lake Granby are both storing higher than averageamounts of water.
Recommendations
Improvements: It is recommended that D4 upgraded to D3in southeast PuebloCounty, southern Otero County, western Bent County, and southern KiowaCounty (please leave the far southwest tip of Kiowa in D4). Most of this areareceived over an inch of precipitation yesterday, and 0.25-1.00" in the sevendays prior. There is still lots of ground to be made up, but the last week made abig difference. The Rocky Ford CoAgMET station more than doubled itsprecipitation since the beginning of April in the last seven days. It was thesecond lowest on record (second only to 2002), but has moved up the rankingfive spots (1993-present).
It is recommended that D4 be upgraded to D3 in the southern Sangre de Cristosof Colorado. This would include southeast Costilla County, and southwest LasAnimas County. The area received 1.00-2.00" over the last week, which is notparticularly unusual for this time of year, but it was enough to bring SNOTELwater year to date precipitation percentiles back into D3 or D2-range.
It is recommended that D2 be upgraded to D1 in southern and central El PasoCounty. Strong thunderstorms rolled through this area yesterday bringing overthree inches to some locations. The area also received 0.25-1.00" ofprecipitation in the seven days prior.
A one category improvement is recommended for western Cheyenne County,northwest Kiowa County, and extreme eastern Lincoln County. This areamostly picked up over two inches of precipitation from thunderstorms over thepast week.

7/26/2018 NIDIS Drought and Water Assessment
http://climate.colostate.edu/~drought/current_assessment.php 14/14
Degradations. It is also recommended that far east Garfield and Rio BlancoCounty, eastern Eagle County, and southwest Summit County be downgradedto D2. This area has not received the beneficial moisture of monsoon seasonyet, and has been much warmer than average since April. SNOTEL water yearto date precipitation rankings are comparable with areas further south alreadyin extreme or exceptional drought. Streamflows are largely in the much belownormal range (10th percentile or worse), and have been for several weeks now.
In relation to the recommendation above, short-term SPIs and streamflowsindicate that Gunnison County, north Saguache County, and northeast HinsdaleCounty may be slipping into D3S territory. Some of the D2 expansion in thisarea is fairly new, so we can afford to wait at least another week or two beforegoing D3.