Standardized Micro-Scale Mixing Evaluation Guillermo González-Fernández Benjamin Yang.
15
Standardized Micro- Scale Mixing Evaluation Guillermo González- Fernández Benjamin Yang
-
Upload
joan-copeland -
Category
Documents
-
view
214 -
download
1
Transcript of Standardized Micro-Scale Mixing Evaluation Guillermo González-Fernández Benjamin Yang.

Standardized Micro-Scale Mixing Evaluation
Guillermo González-Fernández
Benjamin Yang

Outline
• Introduction and Motivation• Project Goal and Success Measure• Raw Images• Image enhancement• Edge detection• Evaluation• Results• Custom area mixing evaluation

Introduction and Motivation
• Micro scale mixing crucial to success of many fields
• No standardized comparison• Characteristics in microfluidics
– Low Reynolds number– Laminar Flow– Diffusion Limited
Image: A.D. Strook et al., “Chaotic Mixer for Microchannels,” Science, vol 295, pp. 647-651, 2002

Project Goal and Success Measure
• Evaluate the extent of mixing in standardized experimental images
• Success will be based on correlation to existing simulation results
Standard Y-channel Square-wave channel Compartment channel

Raw Images
A B
C DE F G

Image enhancement (I)
• Why image enhancement? Better edge detection• Study the images: histogram, 2D-DFT…
• Apply Matlab filters
• Design new filters: • Min, med, max
• Contraharmonic
• New gaussian filter (gaussian iterations)
• Gaussian
• Sobel
• Prewitt
• Laplacian
• Log
• Unsharp

Image enhancement (II)
Min Max Med
Contraharmonic Gaussian iterations

Image enhancement (III)
• Cascade different combinations of the filters
• Final image obtained by averaging best results :– Average-gaussian-average
– Average-gaussian-gaussian
– Average-gaussian iterations-gaussian
– Average-gaussian iterations-average

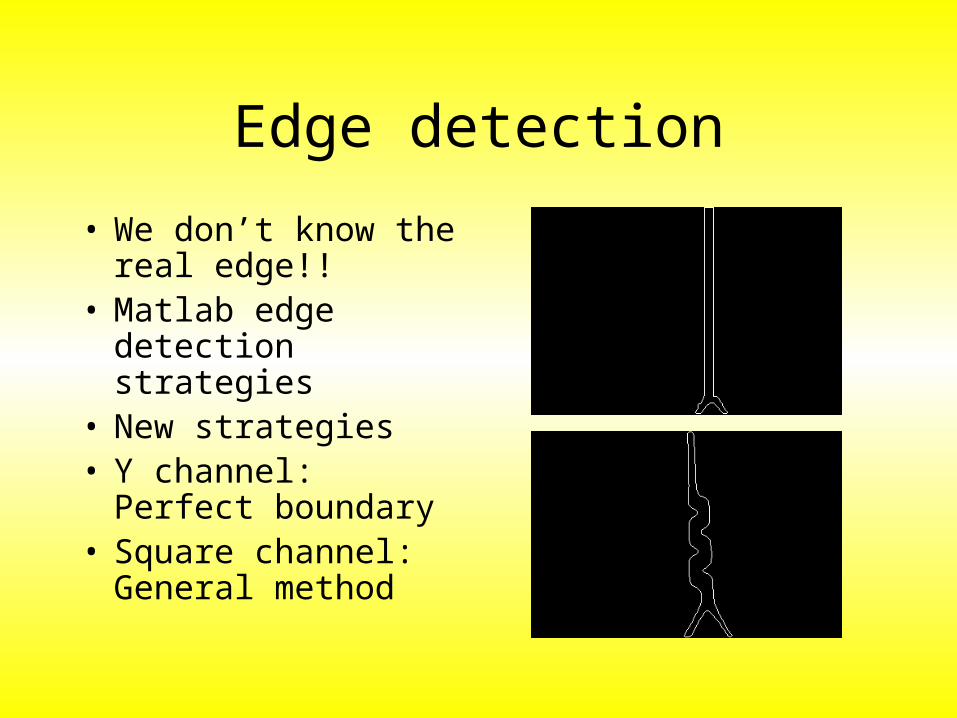
Edge detection
• We don’t know the real edge!!
• Matlab edge detection strategies
• New strategies • Y channel: Perfect
boundary • Square channel:
General method
Edge detection
• We don’t know the real edge!!
• Matlab edge detection strategies
• New strategies • Y channel: Perfect
boundary • Square channel:
General method
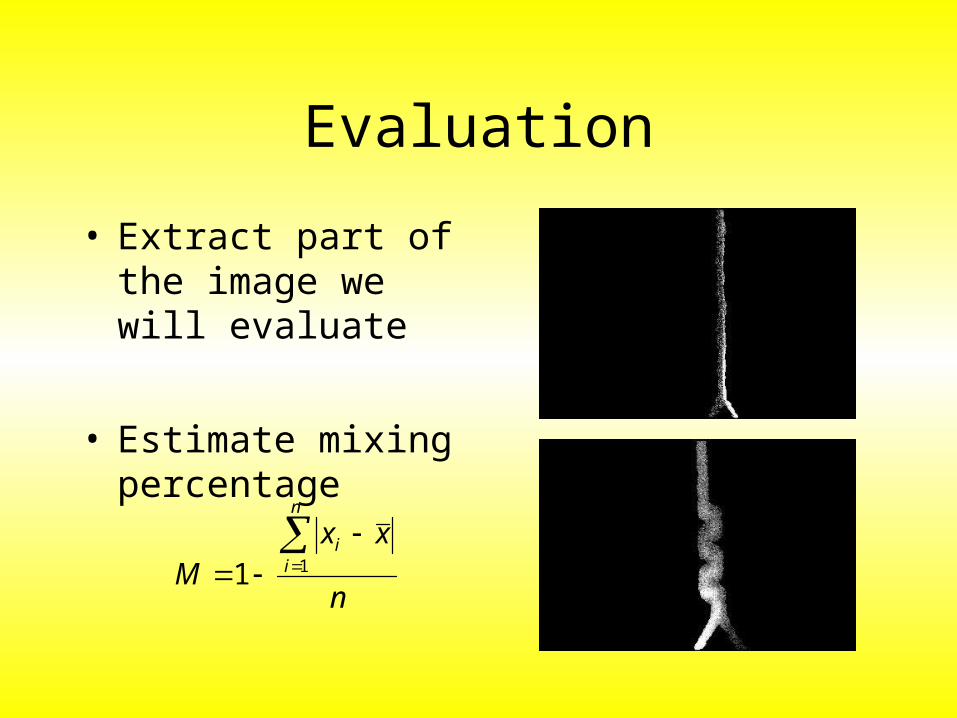
Evaluation
• Extract part of the image we will evaluate
• Estimate mixing percentage
n
xxM
n
ii
11

Results
0
0.1
0.2
0.3
0.4
0.5
0.6
0.7
0.8
0.9
1
0.001 0.01 0.1 1 10
Flow Rate, m/s
Ex
ten
t o
f M
ixin
g
0
100
200
300
400
500
600
700
800
900
1000
Pre
ssu
re D
rop
, P
a
standard
zigzag
serpentine
square wave
compartment

Custom area mixing evaluation
• User defines the image to evaluate
• User defines area (rectangle) to evaluate
• Obtain mixing efficiency

References• [1] Bertsch, S. Heimgartner, P. Cousseau, and P. Renoud. “Static micromixers
based on large-scale industrial mixer geometry”, Lab on a Chip, Vol 1, pp 56-60, 2001.• [2] A.D. Strook et al., “Chaotic Mixer for Microchannels,” Science, vol 295, pp.
647-651, 2002• [3] R. H. Liu, M. A. Stremler, K. V. Sharp, M. G. Olsen, J. G. Santiago, R. J.
Adrian, H Aref, and D. J. Beebe. "Passive mixing in a three-dimensional serpentine microchannel", J. of MEMS, Vol 9, No. 2, pp 190-196, 2000.
• [4] V. Mengeaud, J. Josserand, and H. H. Girault. “Mixing processes in a zigzag microchannel: finite element simulations and optical study”, Analytical Chemistry, Vol 74, pp 4279-4286, 2002.
• [5] R. Gonzalez, R. Woods. Digital Image Processing, 2nd Edition. Prentice Hall, Upper Saddle River, N.J, 2002.
• [6] Kai Kang, R. Chevray. “Visualization of fluid mixing in microchannels”, IEEE Computer Graphics and Applications, Vol 25, Issue 6, pp 16-20, 2005.
• [7] Leming Shi, Weida Tong, Zhenqiang Su, et al. “Microarry scanner calibration curves: characteristics and implications”, BMC Bioinformatics, Vol 6, pp. 1-14, 2005
• [8] Peter A. C. ‘t Hoen, Rolf Turk, Judith M. Boer, et al. “Intensity-based analysis of two color microarrays”, Nucleic Acids Research, Vol 32, No 4, pp. e41-e47, 2004

Questions?