Standard Reference Materials : Standard Reference Material ...
52
MIST PUBLICATIONS NIST SPECIAL PUBLICATION 260-145 U. S. DEPARTMENT OF COMMERCE/Technology Administration National Institute of Standards and Technology Standard Reference Materials Standard Reference Material 2538 for Polarization-Mode Dispersion (Non-Mode-Coupled) Paul A. Williams, Shelley M. Etzel, Jonathan D. Kofler, and Chin-Ming Wang at loo c 2- enai Institute of Siandards and Technology >©!ogy Administrariori, US. Deportment of Commerce
Transcript of Standard Reference Materials : Standard Reference Material ...

MIST
PUBLICATIONS
NIST SPECIAL PUBLICATION 260-145
U. S. DEPARTMENT OF COMMERCE/Technology Administration
National Institute of Standards and Technology
Standard Reference Materials
Standard Reference Material 2538for Polarization-Mode Dispersion
(Non-Mode-Coupled)
Paul A. Williams, Shelley M. Etzel,
Jonathan D. Kofler, and Chin-Ming Wang
atloo
c 2-
enai Institute of Siandards and Technology>©!ogy Administrariori, US. Deportment of Commerce


NIST Special Publication 260-145
Standard Reference Materials®
Standard Reference Material 2538 for
Polarization-Mode Dispersion (Non-Mode-Coupled)
Paul A. Williams, Shelley M. Etzel, and Jonathan D. Kofler
Optoelectronics Division
Electronics and Electrical Engineering Laboratory
National Institute of Standards and Technology
Boulder, CO 80305-3328
Chin-Ming Wang
Statistical Engineering Division
Information Technology Laboratory
National Institute of Standards and Technology
Boulder, CO 80305-3328
U.S. DEPARTMENT OF COMMERCE, Donald L. Evans, Secretary
TECHNOLOGY ADMINISTRATION, Phillip J. Bond, Under Secretary of Commerce for TechnologyNATIONAL INSTITUTE OF STANDARDS AND TECHNOLOGY, Arden L. Bement, Jr., Director
Issued July 2002

Certain commercial equipment, instruments, or materials are identified in this paper in
order to specify the experimental procedure adequately. Such identification is not intended
to imply recommendation or endorsement by the National Institute of Standards andTechnology, nor is it intended to imply that the materials or equipment identified are
necessarily the best available for the purpose.
National Institute of Standards and Technology Special Publication 260-145
Natl. Inst. Stand. Technol. Spec. Publ. 260-145, 44 pages (July 2002)
CODEN: NSPUE2
U.S. GOVERNMENT PRINTING OFFICEWASHINGTON: 2002
For sale by the Superintendent of Documents, U.S. Government Printing Office
Internet: bookstore.gpo.gov— Phone: (202) 512-1800 — Fax: (202) 512-2250
Mail: Stop SSOP, Washington, DC 20402-0001

Standard Reference Material 2538 for
Polarization-Mode Dispersion (Non-Mode-Coupled)
Contents
1 . Introduction 1
2. Artifact Description 3
3. Certification Value 5
4. Certifying Measurements 6
5. Uncertainty Analysis 8
5.1 "High-Accuracy" Value 8
5.2 Wavelength-Extrapolated Range 9
6. References 13
Appendix A: Sample Certificate (SRM 2538) 15
Appendix B: Fixed Analyzer Measurements and Uncertainty 23
B. 1 . Fixed Analyzer Measurement Description 23
B.2. Fixed Analyzer Measurement Uncertainty 24
Appendix C: Description ofNIST Jones Matrix Eigenanalysis Polarimeter 31
("Rotating-Wave-plate Stokes polarimeter for differential group delay
measurements of polarization-mode dispersion")
Appendix D: Birefringence of Quartz 41
iii

NIST Special Publication 260-145
Standard Reference Material 2538 for
Polarization-Mode Dispersion (Non-Mode-Coupied).
Paul A. Williams, Shelley M. Etzel, Jonathan D. Kofler
Optoelectronics Division
Electronics and Electrical Engineering Laboratory
National Institute ofStandards and Technology
Boulder, CO 80305
Chih-Ming Wang
Statistical Engineering Division
Information Technology Laboratory
National Institute ofStandards and Technology
Boulder, CO 80305
A temperature-controlled, single-mode-fiber-pigtailed quartz plate has been assembled as
an artifact standard for polarization-mode dispersion (non-mode-coupled). The design
parameters and performance of this device are discussed. The artifact, Standard
Reference Material SRM 2538, provides an environmentally stable value of wavelength-
averaged differential group delay (DGD) that is nominally 300 fs. This value is certified
for any wavelength span of 50 nm or greater that is contained in the 1250-1650 nmwindow. A slightly higher accuracy number is also provided for wavelength-averaged
DGD over the -1480-1570 nm window. Details of the certifying measurements and
associated uncertainties are given.
Keywords: birefringence, DGD, differential group delay, PMD, polarization-mode dispersion,
standard reference material, SRM
1. Introduction
In order to provide a stable artifact exhibiting non-mode-coupled polarization-mode dispersion,
the National Institute of Standards and Technology (NIST) has tested and certified Standard
Reference Material SRM 2538 "Polarization-Mode Dispersion (Non-Mode-Coupled)." This
document describes the artifact including its design and performance, and the measurementsystems and procedures used to certify the artifact. Uncertainty of the artifact is described in
detail based on uncertainties of the measurement techniques.
We begin this document with a few definitions:
Polarization-mode dispersion (PMD)PMD in an optical element comes about as the result of birefringence yielding different
propagation velocities for different polarization states. An element exhibiting PMD has "fast"
and "slow" polarization axes, along which the light has its fastest and slowest group velocities.
1

In the absence of polarization-dependent loss, these axes are orthogonal. In the simplest case of
PMD the orientation of these axes is independent of wavelength. This is true when there is no
coupling between the polarization modes. This is called the "non-mode-coupled" case. A simple
example of non-mode-coupled PMD is a single birefringent crystal. An example of a mode-
coupled device is one with several birefringent crystals in series with their optic axes non-
parallel. This latter device also has fast and slow polarization axes, but their orientation is a
function of wavelength.
Differential Group Delay (DGD)DGD is the difference in propagation delay between the fast and slow axes, and is the metric
used to describe the strength ofPMD. (However, "PMD" is sometimes used loosely to meanDGD or average DGD.) In this document, "PMD" will refer to the phenomenon and "DGD" will
refer to its magnitude.
Needfor PMD Artifact Standard
The problem with PMD in optical telecommunication systems is that it causes pulse broadening,
which leads to increased bit error rate. The PMD in fibers generally exhibits polarization mode-
coupling, while PMD in individual optical elements is more often non-mode-coupled. This work
arose out of the need to verify the performance ofPMD measurement equipment and techniques
on non-mode-coupled devices. In order to accomplish this, we built a device exhibiting
approximately 300 fs of non-mode-coupled DGD and have certified the wavelength averaged
DGD to an expanded uncertainty of less than 1.5 %. For calibrations of mode-coupled PMD,NIST already offers a Standard Reference Material (SRM 25 1 8).
Certification ofSRM 2538
Certified values of wavelength-averaged (mean) DGD of the artifact are provided to the
customer through the Standard Reference Material Certificate (Appendix A). A look-up table
provides certified values of mean DGD over any wavelength within the 1250 nm to 1650 nmwindow, subject to a 50 nm minimum span width requirement. These values have been
determined using the measurement technique of Jones Matrix Eigenanalysis (JME) [1] to
measure the mean DGD directly over a 1480 nm to 1570 nm range and then extrapolating this
value to other wavelength ranges using a knowledge of the group birefringence of quartz (the
birefringent material in SRM 2538). These extrapolated values are verified by using the Fixed
Analyzer (FA) technique (Appendix B) to measure mean DGD over the nominally 1250 nm to
1650 nm wavelength range. These
certified values are reported with an
uncertainty based on a worst-case estimate
so that one uncertainty value applies to all
mean DGD values reported within the
1250 nm 1650 nm window.
A "high-accuracy" value of mean DGDaveraged over the nominal wavelength
range of 1480 nm to 1570 nm is also
provided. Since this value is measured
directly by the JME technique with no I
Fig. 1. Schematic diagram of SRM 2538
showing pigtailed quartz plate.
2

need for wavelength extrapolation, it has the lowest uncertainty.
2. Artifact Description
SRJVI 2538 (the "artifact") is based on a single quartz plate pigtailed with single-mode fiber. The
quartz plate provides the non-mode-coupled PMD and is nominally 1 cm in length, cut with the
z-axis parallel to the exit and entrance faces. The fibers are pigtailed to the quartz plate through
collimating lenses with an air gap between the lenses and the quartz plate. The total length of the
pigtails is less than 2 m, and they are terminated in FC/APC style connectors (2.15 mm wide
key). The fiber leads are coiled and fastened inside the box with a bend radius of approximately
3.5 cm. The device is packaged with a thermoelectric cooler to maintain the quartz plate at a
temperature of nominally 45 °C. The crystal temperature can be monitored through an external
BNC style connector. The voltage on the BNC is proportional to the internal temperature in
kelvins with a coefficient of 10 mV/K. The relationship between the Kelvin and Celsius scales is
T(K) = T(°C) + 273.15 where T(K) is the temperature in kelvins and T(°C) is the temperature in
degrees Celsius. So, a reading of 3. 1 8 V would be 3 1 8 K or 45 °C. A diagram of the artifact is
shown in Fig. 1
.
The SRM 2538 artifacts are assembled by an external vendor (outside ofNIST). Table 1 lists the
important target specifications ofthe artifact. Adherence to these values is not certified by NIST;
these specifications are supplied merely to aid in the replication of similar artifacts. However,
many of these parameters are important to the stable operation of the device. Details are
described below.
Temperature Control
The temperature of the quartz plate is controlled to ±5 °C to reduce error due to the temperature
dependence of the birefringence of quartz. To assess the uncertainty induced by a ±5 °C
variation, we measured the temperature dependence of a typical SRM 2538 artifact. Assuming
linear behavior with temperature, we measured the mean DGD at two different temperatures.
With the artifact powered up, the internal temperature was 43.8 °C and the mean DGD over a
nominal 1480 nm to 1 570 nm range was 313.1 fs. With the power turned off for several hours,
the artifact temperature was 21.5 °C and the mean DGD was 314.8 fs. This gives a temperature
slope of 0.076 fs/°C. We find this number to be about twice as large as would be expected from
the temperature dependence of the retardance of quartz y = (\/AnL)d(AnL)/dT =
-0.0001232 °C"!
[2] (ris temperature, L is physical path length in the quartz, and An is the phase
birefringence). Of course, y refers to phase birefringence, and our measurement reports the
Table 1. Specifications of SRM 2538 artifact (adherence to these
specifications is not certified by NIST).
Parameter Specified value
Insertion loss
Internal temperature stability
Return loss
Storage temperature
Minimum internal fiber bend radius
<3dB±5 °C
>50dB15-30 °C
3.5 cm
3

temperature dependence of the group birefringence Ang . However, we don't expect that the
difference between dAng/dT and dAn/dT is large enough to cause this discrepancy. Rather, it is
likely explained by the presence of stress birefringence in the quartz plate, or fiber effects, etc.
With the empirical temperature dependence of the artifact, we see that variation of the
temperature within the qualified range (±5 °C) will not significantly affect the measured meanDGD (compared to the nominal 4 fs expanded uncertainty of the final certification). To ensure
proper operation of the device, it should be powered up for 1 hour before measurements are
made. Then, after 1 hour, the temperature monitor voltage should be checked to verify that the
temperature agrees with the target value (listed in the SRM certificate) to within the range
specified in Table 1
.
Multiple Reflection Suppression
Multiple reflections within the quartz plate
can affect the measured DGD of the device
(adding a ripple in wavelength). Tominimize this effect, the quartz plate has a
single-layer MgF2 anti-reflection coating
(centered at 1425 nm). The intensity
reflection coefficient was not measured, but
is estimated to be 1 to 2 % over the 1200 nmto 1 700 nm spectrum. In an effort to further
reduce multiple reflections, later generations
of the artifact were assembled with the
quartz plate both anti-reflection coated and
tilted by an angle of 4 to 5° with respect to
the incoming beam. This causes any multiply-reflected light traveling in the forward direction to
be deviated sufficiently to miss the output collimating lens (Fig. 2).
Return Loss
Return loss is sometimes considered to be a measure of the level of multiple reflections
occurring within the device. Unfortunately, this provides a poor estimate for SRM 2538 since
return loss measures reflections that go backward toward the source and DGD uncertainty comes
from multiple reflections that go forward away from the source. Return loss is kept low (via
FC/APC connectors, anti-reflection coatings, and the tilted quartz plate) to prevent light from
returning to the source, but a low return loss alone is not a guarantee against forward reflected
light.
Figure 2 Tilting the waveplate with respect
to the collimating lenses causes a forward-
reflected beam to miss collection in the
output collimating lens.
Storage Temperature
In order to verify the stability of the artifacts with storage temperature, each device was cycled
from 0 °C to 50 °C two to four times (1 hour ramp times and 1 hour dwell times at each
endpoint). The mean DGD was measured before and after cycling to verify that no significant
(outside the certified uncertainty) changes in mean DGD occurred. The difference in mean DGDbefore and after temperature cycling yielded no statistically significant difference for any of the
artifacts. To illustrate the long-term stability, Fig. 3 shows a control chart for one artifact
measured over approximately two years with no significant variation in measured mean DGD (in
4

spite of the temperature cycling indicated in the figure). The recommended storage temperature
of the device is 15 °C to 30 °C. However, as demonstrated, the artifact can experience
temperatures between 0 °C and 50 °C for short periods of time without harm to the certification.
318
316 -
- Measurement Date
Figure 3 Control chart for SRJVI 2538 artifact (SN001) showing stability well within the
expanded uncertainty (error bars). Vertical arrows indicate two separate dates when the
artifact was temperature cycled twice from 0 °C to 50 °C.
Internal Fiber Bend Radius
I
The fiber leads internal to the device have been assembled to minimize bend-induced
birefringence. The bend radius is kept greater than 3.5 cm (except for one 90° bend with a ~2 cmradius). Stray sources ofPMD such as fiber bend birefringence would increase the amount of
jpolarization-mode coupling in the device, allow the possibility of environmental instability, and
interfere with the assumption that the majority of the spectral dependence of the DGD was due to
the quartz plate. The fiber loops inside the artifact are secured to the case to prevent their motion
when the artifact is moved.
3. Certification Value
NIST certifies the artifact for wavelength-averaged DGD, (At)a ^ , also referred to here as
"mean DGD", where
Ax(k) is the instantaneous DGD at wavelength k, and ki and kj respectively represent the lower
and upper bounds of the wavelength range over which the DGD is averaged. For the certified
values reported in the SRM Certificate, this integral is approximated as a summation. Weprovide certification values ofmean DGD over the range 1250 nm to 1650 nm and a "high-
I
5

accuracy" value averaged from approximately 1480 nm to 1570 nm. The certification procedure
and associated uncertainties are described in detail in Sections 4 and 5.
4. Certifying MeasurementsMeasurement Details
The certified mean DGD values reported in the Certificate are based on measurements using the
Jones Matrix Eigenanalysis technique. The NIST JME system [3] is capable of measuring DGDover a wavelength range of approximately 1480 nm to 1570 nm. The estimate of mean DGDoutside this range is found by using the JME result of mean DGD over this measurable
wavelength range combined with an estimate of the dispersion of birefringence of quartz over the
extended wavelength range. This extrapolation is supported (validated) with measurements madeby the Fixed-Analyzer (FA) technique, sometimes called "Wavelength Scanning." The FAmethod is able to measure mean DGD over a 1250 nm to 1650 nm wavelength range and adds
confidence to the extrapolated JME results.
The JME method is a polarimetric technique to measure differential group delay. A brief
description follows. First, the Jones transfer matrix of the device under test is measured at two
adjacent wavelengths. This is done by launching three different linear polarization states of light
into the device under test and measuring the output Stokes vector for each launched state. This
information is sufficient to determine the Jones matrix of the device under test. The two Jones
matrices at adjacent wavelengths are then used to estimate the local optical frequency derivative
of the Jones transfer matrix. This is then used to give the wavelength-dependent DGD of the
device under test. This process is discussed in detail in Reference [1], and the NISTimplementation of this technique is described in Reference [3] (this paper is included here as
Appendix C).
The NIST JME system used in these measurements operates over a wavelength range of
approximately 1480 nm to 1570 nm (limited by the range of the tunable laser). In certifying the
artifacts, mean DGD is measured over this range by use of several different wavelength step
sizes. Step size AX, is chosen subject to the requirement that the PMD-induced polarization state
change is not large enough to cause aliasing. This is ensured by restricting the product ofmean
DGD and bandwidth such that AtAX<4 (At in ps and AX in nm) [4]. Several scans ofDGD are
made over the nominally 1480 nm to 1570 nm wavelength range, with step sizes ranging from
2.5 nm to 10 nm. The varied step sizes allow us to verify that we are not biasing our
measurement by aliasing (due to overly coarse sampling). Following Reference [5] we sampled
with interleaved data points (multiple scans with the same step size but offset in wavelength) to
average noise due to multiple reflections.
The mean DGD can be estimated outside of the wavelength range of the JME measurement if
two conditions are met:
(1) The group birefringence of quartz Ang(k) (defined in Appendix D) must be known over
the full wavelength range of interest.
(2) The PMD of the quartz plate dominates other sources ofPMD within the artifact.
Condition 1 is met by using literature values of phase birefringence for quartz (as described
later). Condition 2 is met since the extraneous sources ofPMD provide at most a few
6

femtoseconds ofDGD in comparison to the -300 fs due to the quartz plate. The following
description of the extrapolation of mean DGD to other wavelengths assumes that these two
conditions are met.
The mean DGD of this artifact (averaged over some wavelength range from A-i to Xi) can be
expressed as
jAftg(/l)4
- /lj c X2- X
xc
J/-^eff
where Ieff is the "characteristic length." This is merely the effective physical length of the quartz
crystal, slightly different from the actual physical length of the crystal due to any small degree of
mode-coupling, small birefringence values that may be in other elements of the artifact (fiber
leads, lenses etc.), stresses in the quartz itself, or the intentional waveplate tilt, c is the speed of
light in vacuum. The quantity Ltff/c is given (from Eq.(2)) to be
This quantity is independent of wavelength, and so the particular wavelength range for the
averages on the right-hand side of Eq.(3) is unimportant. So, we can also express this as
Substituting this expression for Left/c back into Eq.(2) gives
Eq. (5) demonstrates that the mean DGD over the wavelength range X\ to X2 can be expressed in
terms of the mean DGD measured over a different wavelength range Xa to X^, as long as the
average group birefringence is known over both wavelength ranges. Practically, this allows us to
carefully measure the mean DGD using the JME system over a range of Xa ~ 1480 nm to
~ 1570 nm, and then using published values of the birefringence of quartz to extrapolate that
value to any other wavelength range A,i to X2 , as long as we have birefringence data for quartz
over that range.
Our estimate ofAng comes from literature values of the phase birefringence An of quartz and is
described in detail in Appendix D. We used published estimates of An over a window from 900
nm to 2000 nm. However, we do not report certified values of mean DGD over this entire
wavelength range. We limit the wavelength range of certification to the region where we are able
7

to perform validating measures using the Fixed-Analyzer technique. This technique is described
in general in Reference [6]. Our FA system can measure (At) within the 1250 nm to 1650 nmwindow. Our particular implementation of this technique and uncertainty estimates are given in
Appendix B.
Wavelength Measurement Ranges
We report certified values of (Ax) for any averaging range within the 1250 nm to 1650 nmwindow, as long as the averaging span is at least 50 nm wide. If we denote the start and stop
wavelengths for the DGD average as X\ and X2, respectively, these constraints can be
summarized as
A2-^> 50nm,
1250nm^ <1600nm, (6)
1300 nm< A2<1650nm.
The 50 nm minimum span requirement arises due to multiple reflections that develop in some of
the artifacts. These reflections induce a periodic ripple in the DGD as a function of wavelength,
and the error in mean DGD due to these ripples tends toward zero as the wavelength range of the
DGD average is increased. We have found that averaging over at least a 50 nm span reduces this
uncertainty to a negligible level. The upper boundary on ^2 and the lower boundary on X\ comefrom the range of our FA measurement. We certify measurements of the mean DGD only over
wavelengths we were able to verify experimentally with our FA technique. Certified values of
mean DGD within this wavelength range are provided as a "look-up" table in the Certificate
(Appendix A).
We also certify a "high-accuracy" value of the mean DGD over the wavelength range of
approximately 1480 nm to 1570 nm. This value is measured using only the JME technique (with
no need for extrapolation. This simplification in measurement procedures allows for a lower
uncertainty).
5. Uncertainty Analysis
To simplify discussion of the uncertainty analysis, it is broken into two parts. First is the
uncertainty associated with the JME measurement ofmean DGD over the nominally 1480 nm to
1570 nm range. This constitutes the total uncertainty of the "high-accuracy" value. Second is a
description of the uncertainty of the mean DGD values that come from the wavelength
extrapolation of this "high-accuracy" value.
5.1 "High-Accuracy" Value
From Reference [3], we estimate the NIST JME system to yield a standard uncertainty of 1.7 fs
on artifacts of nominally 500 fs mean DGD. (The exact value in Reference [3] differs by -0.1 fs
due to a difference in fiber leads.) The uncertainty of the JME measurement is dominated by the
effect of birefringence in the system's fiber leads, but also includes a contribution due to random
uncertainly, which is slightly different for each artifact. As an example, JME measurements of
the mean DGD of a 312 fs artifact over the approximately 1480 nm to 1570 nm range yielded a
standard deviation of the mean (SDOM) of 0.22 fs. The combined standard uncertainty of this
measurement is the quadrature sum ofthese two values. The SRM Certificate report expanded
8

uncertainty (combined standard uncertainty multiplied by a coverage factor of k = 2 [7]). This
yields 3.4 fs with an approximate 95 % confidence interval, as illustrated in Table 2.
Table 2. Summary of measurement uncertainty for a particular 3 12 fs
artifact over the "high-accuracy" -1480 nm to 1570 nm wavelength range.
Uncertainty Source Standard Uncertainty (fs)
JME measurement system 1.7
Measurement repeatability (SDOM) 0.22
Combined standard uncertainty, Uc 1.7
Expanded uncertainty, U=2uc 3.4
5.2 Wavelength-Extrapolated Range
For an extended wavelength range estimate of (Ax), a propagation-of-uncertainty expression for
Eq.(5) yields
U((An% ) Xa _Xh ) U({Ar)
Xa _ Xb )
(7)
where U(x) represents the uncertainty of the value x. The first two uncertainty terms are,
respectively, the uncertainty of the mean of the estimated group birefringence Ang evaluated over
the extrapolated wavelength range X l to Xj, and this same uncertainty over the "narrow" range Xa
to Xb (approximately 1480 nm to 1570 nm) where the JME measurement was performed. These
two terms account for the uncertainty due to the extrapolation of the measured mean DGD values
to wavelength ranges not directly measured using the JME technique. The third term is the
uncertainty from the JME measurement ofmean DGD over the 1480 nm to 1570 nm range as
described in Section 5.1. For easy reference, the uncertainty components of Eq.(8) are given the
following names:
U 2((A t)
Ai_Xi ) = U 2
(A t, ext) « U 2(An
g , ext) + U 2(An
g , narrow) + U 2(At, narrow). ( 8 )
The "JME uncertainty", U(Ax, narrow), is the normalized uncertainty over the short-wavelength
average of At, as discussed in Section 5.1. A typical value for the 312 fs artifact is
(/(Ar.narrow) =(W^/"^""""']= 1.7fs. ( 9 )
V (AT) 1481.25-1568.25 /
We will now describe our estimate of the uncertainty of <Awg). As mentioned in Appendix D, the
estimate ofAng comes from the differentiation of a third-order polynomial fit to published values
of An (phase birefringence) for quartz. Therefore, the uncertainty ofAng must take into account
the uncertainty of the published An data as well as the uncertainty incurred by the curve-fitting
and extrapolation process.
9

Appendix D illustrates how published An values were used to generate Angvalues. In order to
allow for possible sample-to-sample variation of Ang , we derive an uncertainty based on the
variation of the literature values of An. The An(A.) values from [8] were fit to a third-order
polynomial using a least-squares technique. The residual differences between the Reference [8]
An(X) values predicted by this fit and the An(X) values reported in reference [9] were calculated.
This gave us a measure of the disagreement between An values from the two references. For the
900-2000 nm data range used, this residual value had a standard deviation of 0.00001 16. We also
verified this uncertainty experimentally in Appendix B of Reference [3]. This uncertainty was
used with the covariance matrix [10] of the fitted coefficients to An to give an uncertainty on the
polynomial coefficients from Eq. (D2). This was used with a propagation of uncertainty of the
expression for Ang (Eq. D3) to yield a wavelength-dependent uncertainty of Ang .
The uncertainty of the wavelength-averaged group birefringence (Awg >^_^ is based on a curve-
fit to individual Ang(k) values, and we must assume that the Ang values at different wavelengths
are correlated. The worst-case uncertainty would be for positive, perfect correlation in these
values. This would mean that the uncertainty of the wavelength-averaged group birefringence is
equal to the average of the uncertainty of the group birefringence at each wavelength
U((Ang ) A] _AJ = (U(An
g )) Ai_A2 . (10)
So, the uncertainty contributions for t/(A«g, extrapolated) and £/(A«g, narrow) are estimated by
averaging the individual uncertainty estimates ofAng(X) over the appropriate wavelength ranges.
Averaging over a broader wavelength range does not necessarily reduce the U(Ang) estimate.
As an example of the magnitudes of these various uncertainty components, a 312 fs artifact
yields the uncertainties
( U((Ang ) im25_l56&25 )
U(An narrow) = «Ar> 12715_16386 )j= 0.86fs (11)
'g 1 1481.25-1568.25 J
and
TT , X A //A \ { C/«AW^> 1271.5-1638.6 )U(An
g,ext) = «Ar> 12715_1638 6 )
8
^\^ng / 1271.5-1638.6 j
= 0.82fs. (12)
Because we report the mean DGD for so many possible wavelength ranges (Table 2 of the SRMCertificate, Appendix A), we take a simplifying approach to the uncertainty. We report one
worst-case uncertainty for (At), which is applicable to all possible wavelength ranges within the
constraints of Eqs.(6) ("one size fits all").
We arrived at this worst-case estimate as follows. The uncertainty of U(Ax,narrow) is as reported
in Section 5.1. The uncertainty of t/(zl«g, narrow) is the same as described above. The third
uncertainty component of Eq.(8), UiAn^exi), is the average of the group birefringence
uncertainty over the extrapolated wavelength range. In order to simplify the estimate of this last
term, we use the largest value of the (Ang) uncertainty that we found for a variety ofwavelength
ranges within the constraints of Eqs (6). Table D2 shows the (Ang) uncertainties incurred for
10

these ranges, with the worst-case being 0.000027 over the range 1450 nm to 1500 nm.
Normalizing this value to the mean group birefringence and multiplying by the mean DGD (from
Eq.(7)) over this wavelength range will give the worst-case value for U(Ang,ext). For our 312 fs
artifact example, the worst-case value for U(Ang,ext) turns out to be 0.89 fs, only slightly
different from the specific example of Eq. (12). This verifies that using one uncertainty value for
all the valid wavelength ranges is not significantly different from reporting each uncertainty
individually.
The quadrature sum ofthe three terms in Eq. (8) yields the uncertainty estimate for the meanDGD measurement over the extrapolated range. Since this requires an estimate ofmean DGDover a range containing wavelengths where no JME measurements were actually made, weperformed a validating Fixed Analyzer measurement over the specified wavelength range (to
verify our extrapolated estimate). We use the results of this comparison only to better estimate
the uncertainty on the JME measured result (not to modify the result itself). The total uncertainty
on the extrapolation then comes from the JME uncertainty of Eq. (8) added in quadrature with
the uncertainty of bias between the JME extrapolation and the FA measurements of the artifact
over the extrapolated range. This approach is based on the "BOB" solution to the two-method
problem described in [1 1] and requires the assumption that the true value ofmean DGD be
bounded by the JME and Fixed-Analyzer results. In the course of this work, we have evaluated
the most significant sources ofFA uncertainty and include a description in Appendix B for
completeness.
At least one validating FA measurement is made over the -1250 nm to 1650 nm wavelength
range. As described in Appendix B, this FA measurement yields the mean DGD over the entire
measurement range and the mean DGD over a 50 nm to 100 nm range at each end of the wide
scan. This yields three FA-based estimates of mean DGD. These are compared to extrapolations
of the JME-based measurement over the same three wavelength ranges. The uncertainty of bias
between the JME and FA measurements for an extrapolated wavelength range of approximately
1250 to 1650 nm, for all of the artifacts measured, is added in quadrature to the uncertainty
estimated from Eq. (8).
Then, we add, in quadrature, U(Ang,narrow), U(Ang,nanow), U(AT,narrow), and the bias estimate
from the comparative FA measurements. For the 312 fs artifact example, this yields an expanded
uncertainty ("A: = 2" coverage factor [7]) of 4.2 fs, as illustrated in Table 3.
Table 3. Summary of measurement uncertainty for a particular 312 fs artifact over any
extrapolated wavelength range (subject to constraints of Eqs. (6)).
Uncertainty Source Standard Uncertainty (fs)
"Narrow" wavelength range measurement, U(Ax, narrow) 1.7
A«g estimate ("Narrow" range), U(A«g ,narrow) 0.86
A«g estimate (extrapolated range), U(A«g ,
ext) 0.89
FA validation 0.12
Combined standard uncertainty, Uc 2AExpanded uncertainty, U=2uc 4.2
For each artifact certified, we perform many (-500) JME measurements ofDGD(^) over the
11

-1480 nm to 1570 nm range with the artifact moved, the leads manipulated, and the powerturned off for several hours and back on at least once between the measurement sets. In between
these measurements, each device is also temperature cycled from 0 °C to 50 °C at least twice (as
described in Section 2). These DGD results are averaged to arrive at the estimated mean DGDvalues.
Fig. 4 illustrates typical agreement between the two techniques. The difference in mean DGD at
each wavelength is plotted for nine SRJvl 2538 artifacts measured using JME (plus extrapolation)
and FA. The average of the discrepancy between the two measurements plus the "prediction
60-0^ (standard deviation of the mean of the discrepancy) for the -1250 nm to 1650 nmwavelength range yields the estimate of the uncertainty of bias. This turned out to be a small
value of 0.4 fs, which gives a standard uncertainty of 0.4 fs /Vl2 or 0.12 fs (assuming a
uniformly distributed error [7]). This quantity is negligible when added in quadrature with the
uncertainty result of Eq. (9). As shown in Table 3, our 3 12 fs example artifact yielded a
combined standard uncertainty for any wavelength range within the constraints of Eqs. (6) of
2. 1 fs. Doubling this value gives the expanded uncertainty of 4.2 fs, as would be reported in the
certificate with a "£ = 2" coverage factor [7], yielding an approximately 95 % confidence
interval.
/ s 2.0
1.5O
<DOS
1.0
0.5
iffe 0.0 0<>
-0.5<>
rag-1.0 o
> -1.5 o< -2.0
1240 1340 1440 1540 1640
Center wavelength (nm)
Figure 4. Difference between JME and Fixed Analyzer measurements ofmean DGD in 9
artifacts of SRM 2538. Open symbols represent data for each artifact. Filled circles are the
mean; error bar is one standard deviation.
12
6. References:
[I] B.L. Heffher, "Automated Measurement of Polarization Mode Dispersion Using Jones
Matrix Eigenanalysis," Photonics Technology Letters 4, 1066-1069 (1992).
[2] Shelley M. Etzel, A.H. Rose, and CM. Wang, "Dispersion of the temperature dependence of
the retardance in Si02 and MgF2," Applied Optics 39, 5796-5800 (2000).
[3] P.A. Williams, "Rotating Waveplate Stokes Polarimeter for Differential Group Delay
Measurements of Polarization-Mode Dispersion," Applied Optics 38, 6508-6515 (1999).
[4] Dennis Derickson, Ed., Fiber optic test and measurement, p. 504, Prentice Hall, New Jersey
(1998).
[5] P.A. Williams, "Mode-coupled artifact standard for polarization-mode dispersion: design,
assembly, and implementation," Applied Optics 38, 6498-6507 (1999).
[6] Dennis Derickson, Ed., Fiber optic test and measurement, p. 495, Prentice Hall, New Jersey
(1998).
[7] B.N. Taylor and C.E. Kuyatt, Eds.; "Guidelines for evaluating and expressing the uncertainty
ofN1ST measurement results," National Institute of Standards and Technology, Tech. Note
1297, 1994.
[8] John H. Shields and Joseph W. Ellis, "Dispersion of birefringence of quartz in the near
infrared," Journal of the Optical Society of America 46, 263-265 (1956).
[9] William L. Wolfe and George J. Zissis Eds, The Infrared Handbook (Environmental
Research Institute of Michigan, Ann Arbor, 1985), p. 7-57.
[10] F.A. Graybill and H.K. Iyer, Regression Analysis: Concepts and Applications, (Belmont,
CA: Wadsworth, 1994), p. 263.
[II] M.S. Levenson, D.L. Banks, K.R. Eberhardt, L.M. Gill, W.F.Guthrie, H.K. Liu, M.G.
Vangel, J.H. Yen, and N.F. Zhang, "An Approach to Combining Results From Multiple Methods
Motivated by the ISO GUM," Journal ofResearch ofthe National Institute ofStandards andTechnology 105, 571-579 (2000).
[12] P.A. Williams and CM. Wang, "Corrections to Fixed Analyzer Measurements of
Polarization Mode Dispersion," Journal ofLightwave Technology 16, 534-541 (1998).
[13] Sasada, H. and Yamada, K., "Calibration Lines ofHCN in the 1.5-um region," Applied
Optics 29, 3535-3547 (1990).
[14] Kinpui Chan, Hiromasa Ito, and Humio Inaba, "Absorption measurement of v2 + 2v3 band
of CH4 at 1.33 urn using an InGaAsP light emitting diode," Applied Optics 22, 3802-3804
(1983).
[15] J.D. Jackson, Classical Electrodynamics, (Wiley, New York, 1975), pp. 299-303.
13


(Certificate #f JVnalgsis
Standard Reference Material® 2538
Polarization-Mode Dispersion (Non-Mode-Coupled)
Serial No.:
This Standard Reference Material (SRM) is intended for use for the calibration of polarization-mode dispersion
(PMD) measurements on non-mode-coupled devices. Certified data apply only to the artifact with the serial number
shown above.
Expiration of Certification: The SRM will remain in certification indefinitely, provided the cleaning and storage
instructions are followed and the housing is not opened. A sudden increase in insertion loss or the sudden
appearance of ripples in the DGD spectrum are indications that something has changed in the device. If this occurs,
carefully clean the connectors, examining the fiber pigtails to be attached to the SRM, and repeat the measurement.
Scope of Use: This SRM has been characterized for wavelength-averaged differential group delay (mean DGD),and this certificate supplies certified values over any wavelength range subject to the wavelength constraints listed.
In principle, the artifact (SRM) is certified for measurement by all PMD measurement techniques that give
wavelength-averaged (mean) DGD over an allowed wavelength range. However, care must be taken as to how the
DGD is averaged over the measurement range. The certification contained in this document pertains to a
uniformly weighted wavelength average of DGD. For example, when low-coherence interferometry or the
Fourier-Transformed Fixed Analyzer measurement techniques are used, the spectral shape of the source can weight
the averaged DGD toward the wavelength where the source has the most power. Therefore, if these techniques are
used without wavelength normalization, the DGD over a wavelength range where the source intensity is low will be
weighted less than the DGD at a wavelength with high source intensity. The user should be aware of this whenmeasuring this artifact with such techniques in order to properly interpret uncertainty statements.
Certified Values and Uncertainties: The mean DGD measurements were performed using the NIST Jones Matrix
Eigenanalysis system [1], and verified with a Fixed Analyzer (Wavelength Scanning) measurement. This certificate
reports mean DGD averaged over any range of wavelength within the 1250 ran to 1650 ran window subject to a
50 ran minimum span width. These wavelength range constraints are summarized as
where ^ and X2 are, respectively, the minimum and maximum wavelengths of the averaging range. The certified
values of mean DGD are found in Table 1. Given a start wavelength Xtand a stop wavelength A,2, this table reports
the mean DGD of the artifact for averaging between these two wavelengths. Note that wavelengths are resolved
only to 5 ran as this is sufficient for the DGD resolution provided. To use the table, find the nearest start wavelength
(within 5 ran) on the top row and nearest stop wavelength (within 5 ran) on the left column. The intersection point
of the row and column defined by these two wavelengths gives the certified mean DGD over the selected
wavelength range. The associated uncertainty, given at the top of Table 1, represents a coverage factor of k=2,
yielding an approximate 95 % confidence interval.
The support aspects involved with the certification and issuance of this SRM were coordinated through the NISTStandard Reference Materials Group by J.W.L. Thomas.
X2-Xj > 50 ran
1250 ran < A., < 1600 ran
1300 ran <X2<1650nm
(1)
Gordon Day, Chief
Optoelectronics Division
Gaithersburg, MD 20899
Certificate Issue Date: 8 July 2002
SRM 2538
John Rumble, Jr., Chief
Measurement Services Division
Page 1 of 8

The research and development effort leading to this SRM included contributions from the following NISTpersonnel: S.M. Etzel, J.D. Kofler, and P.A. Williams (NIST Optoelectronics Division), and CM. Wang (NIST
Statistical Engineering Division). Questions regarding this device should be addressed to Paul Williams at
telephone (303) 497-3805 or email paul.williams(2)nist.gov.
INSTRUCTIONS FOR USE
The SRM 2538 unit is a pigtailed quartz plate with FC/APC style connectors (2.15 mm "wide key"). The
temperature of the quartz plate is actively controlled to ensure a stable mean DGD value. This unit requires an ACpower source ( 1 15 V, 60 Hz).
The SRM is a delicate optical instrument and should be handled carefully. Damage can easily occur if the device is
dropped or jarred. The housing should not be opened, and the optical connectors should be cleaned carefully before
each connection. When making connections to the SRM, use high quality FC/APC connectors (2.15 mm "wide
key"). The cleanliness of the connectors is important. Use a dust free and residue-free air source and a commercial
fiber endface cleaner before every connection. If such a cleaner is not available, then lens paper wetted with
reagent-grade isopropyl alcohol can be used to wipe the ferrule endface and the air source used to dry the connector.
When not in use, the device should be stored at a temperature from 15 °C to 30 °C in a clean, dry environment.
SRM 2538 Page 2 of 8

Table 1. Certified value ofmean DGD (fs) for SRM 2538 serial number averaged over
the wavelength range from "start wavelength" to "stop wavelength". Expanded uncertainty
(95 % confidence interval) for any value in this table is x.x fs.
12S0 1266 1260 1266 1270 1276 1280 1286 1290 1296
SRM 2538 Page 3 of 8

Table 1. (cont'd) Certified value of mean DGD (fs) for SRM 2538 serial number
averaged over the wavelength range from "start wavelength" to "stop wavelength".
Expanded uncertainty (95 % confidence interval) for any value in this table is x.x fs.
1390 139S 1410 1 416 1 420 1426 1 430
xxxx xxxx
SRM 2538 Page 4 of 8

Table 1. (cont'd) Certified value ofmean DGD (fs) for SRM 2538 serial number
averaged over the wavelength range from "start wavelength" to "stop wavelength".
Expanded uncertainty (95 % confidence interval) for any value in this table is x.x fs.
start wavelength(
146S 1470 1476 1480 149B 1600 1606 1610 1616 1620 1626 1630 1636 1 640 1646
SRM 2538 Page 5 of 8

Table 1. (cont'd) Certified value of mean DGD (fs) for SRM 2538 serial number_averaged over the wavelength range from "start wavelength" to "stop wavelength".
Expanded uncertainty (95 % confidence interval) for any value in this table is x.x fs.
SRM 2538 Page 6 of 8
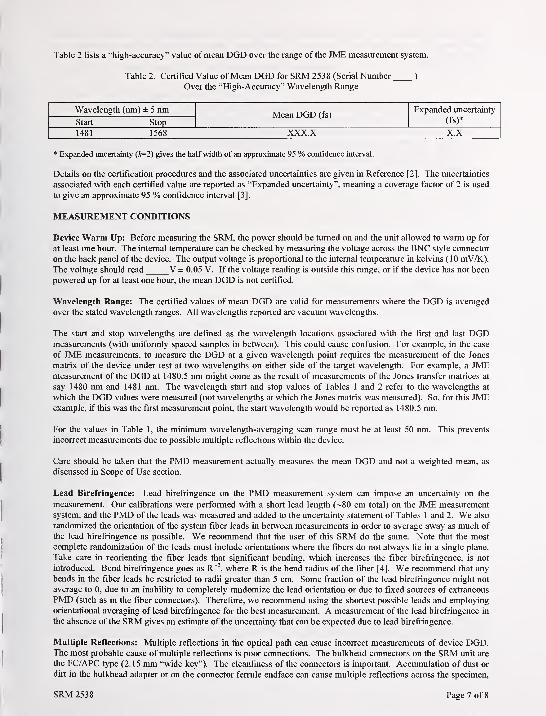
Table 2 lists a "high-accuracy" value of mean DGD over the range of the JME measurement system.
Table 2. Certified Value of Mean DGD for SRM 2538 (Serial Number )
Over the "High-Accuracy" Wavelength Range
Wavelength (nm) ± 5 nmMean DGD (fs)
Expanded uncertainty
Start Stop (fs)*
1481 1568 XXX.X X.X
* Expanded uncertainty (£=2) gives the half width of an approximate 95 % confidence interval.
Details on the certification procedures and the associated uncertainties are given in Reference [2]. The uncertainties
associated with each certified value are reported as "Expanded uncertainty", meaning a coverage factor of 2 is used
to give an approximate 95 % confidence interval [3].
MEASUREMENT CONDITIONS
Device Warm Up: Before measuring the SRM, the power should be turned on and the unit allowed to warm up for
at least one hour. The internal temperature can be checked by measuring the voltage across the BNC style connector
on the back panel of the device. The output voltage is proportional to the internal temperature in kelvins (10 mV/K).
The voltage should read _V ± 0.05 V. If the voltage reading is outside this range, or if the device has not been
powered up for at least one hour, the mean DGD is not certified.
Wavelength Range: The certified values of mean DGD are valid for measurements where the DGD is averaged
over the stated wavelength ranges. All wavelengths reported are vacuum wavelengths.
The start and stop wavelengths are defined as the wavelength locations associated with the first and last DGDmeasurements (with uniformly spaced samples in between). This could cause confusion. For example, in the case
of JME measurements, to measure the DGD at a given wavelength point requires the measurement of the Jones
matrix of the device under test at two wavelengths on either side of the target wavelength. For example, a JMEmeasurement of the DGD at 1480.5 nm might come as the result of measurements of the Jones transfer matrices at
say 1480 nm and 1481 nm. The wavelength start and stop values of Tables 1 and 2 refer to the wavelengths at
which the DGD values were measured (not wavelengths at which the Jones matrix was measured). So, for this JMEexample, if this was the first measurement point, the start wavelength would be reported as 1480.5 nm.
For the values in Table 1, the minimum wavelength-averaging scan range must be at least 50 nm. This prevents
incorrect measurements due to possible multiple reflections within the device.
Care should be taken that the PMD measurement actually measures the mean DGD and not a weighted mean, as
discussed in Scope ofUse section.
Lead Birefringence: Lead birefringence on the PMD measurement system can impose an uncertainty on the
measurement. Our calibrations were performed with a short lead length (-80 cm total) on the JME measurement
system, and the PMD of the leads was measured and added to the uncertainty statement of Tables 1 and 2. We also
randomized the orientation of the system fiber leads in between measurements in order to average away as much of
the lead birefringence as possible. We recommend that the user of this SRM do the same. Note that the most
complete randomization of the leads must include orientations where the fibers do not always lie in a single plane.
Take care in reorienting the fiber leads that significant bending, which increases the fiber birefringence, is not
introduced. Bend birefringence goes as R 2, where R is the bend radius of the fiber [4]. We recommend that any
bends in the fiber leads be restricted to radii greater than 5 cm. Some fraction of the lead birefringence might not
average to 0, due to an inability to completely randomize the lead orientation or due to fixed sources of extraneous
PMD (such as in the fiber connectors). Therefore, we recommend using the shortest possible leads and employing
orientational averaging of lead bhefringence for the best measurement. A measurement of the lead birefringence in
the absence of the SRM gives an estimate of the uncertainty that can be expected due to lead birefringence.
Multiple Reflections: Multiple reflections in the optical path can cause incorrect measurements of device DGD.The most probable cause of multiple reflections is poor connections. The bulkhead connectors on the SRM unit are
the FC/APC type (2.15 mm "wide key"). The cleanliness of the connectors is important. Accumulation of dust or
dirt in the bulkhead adapter or on the connector ferrule endface can cause multiple reflections across the specimen.
SRM 2538 Page 7 of 8

which will add a random (with wavelength and temperature) noise to the measurement. Other sources of reflection
in the measurement system are equally important. If the reflections cannot be reduced, multiple measurements can
be made at slightly different wavelength sampling points or temperatures in order to average out the effects of
multiple reflections.
REFERENCES
[1] Williams, P.A.; Rotating Waveplate Stokes Polarimeter for Differential Group Delay Measurements of
Polarization-Mode Dispersion, Applied Optics; 38, pp. 6508-6515 (1999).
[2] Williams, P.A.; Etzel, S.M.; Kofler, J.D.; Wang, CM.; Standard Reference Material 2538for Polarization-
Mode Dispersion (Non-Mode-Coupled); N1ST Special Publication 260-145 (2002).
[3] Taylor, B.N.; Kuyatt, C.E.; Eds.; Guidelines for Evaluating and Expressing the Uncertainty of N1STMeasurement Results; NIST Tech. Note 1297 (1994).
[4] Jeunhomme, Luc B.; Single-Mode Fiber Optics: Principles and Applications; (Mercel Dekker, Inc., NewYork, p. 74(1990).
Users of this SRM should ensure that the certificate in their possession is current. This can be accomplished by
contacting the SRM Program at: telephone (301) 975-6776; fax (301) 926-4751; e-mail [email protected]; or via
the internet http://www. nist. sov/srm .
SRM 2538 Page 8 of 8

Appendix B. Fixed Analyzer Measurements and Uncertainty
B.l Fixed Analyzer Measurement Description
As mentioned, part of the certification of mean DGD is performed outside the actual wavelength
measurement range of the JME technique. This is done based on published data of the
birefringence of quartz and is a reliable technique. However, to be conservative, we verify the
extrapolated mean DGD values by measuring them directly with a second technique - the Fixed
Analyzer (FA) technique [6]. In this technique, the spectral transmission through the device
under test (with a polarizer at the input and output of the device) gives a sinusoidal spectrum for
non-mode-coupled PMD. The spectral density of peaks and valleys (extrema) is proportional to
the mean DGD of the device over the wavelength range of measurement. In our implementation,
an optical spectrum analyzer (OSA) detects the light from a spectrally broad light source (four
edge-emitting light-emitting diodes coupled together to span a wavelength range from
approximately 1200 nm to 1700 nm) as it
is transmitted through a polarizer
(computer-controllable orientation), the
artifact, and an analyzer (Fig. Bl). The
spectral transmittance Io° is measured,
then the input polarizer is rotated by 90°
and the spectrum remeasured to yield Igo°.
The relative orientation of the polarizer
and analyzer with respect to each other is not critical and the 0° and 90° subscripts denote the
angular change in the input polarizer and not necessarily its orientation relative to the output
polarizer. The normalized transmission spectrum (difference over sum)
EELEDadjustable PMD OSApolarizer artifact -h
Figure Bl. Schematic of Fixed Analyzer
measurement; EELED is edge-emitting light-
emitting diode, OSA is optical spectrum analyzer.
(Bl)
removes the source spectrum. The spectral density of extrema (peaks and valleys) in the
normalized transmission spectrum is proportional to the mean DGD over the measured
wavelength range [6]. Extrema were isolated using a thresholding algorithm [12] with a 0.15
thresholding level (i.e., peaks and valley were counted only when their height or depth was at
least 15 % of the maximum extent of the data). The wavelength positions of extrema were
estimated by performing a second-order polynomial least-squares curve fit to Iaj^(X) in the
region of each extremum. The mean DGD was estimated as [6]
(tf.-lKA,(B2)
2(AF -AL )c
where Ne is the number of extrema, XF and A.L are the locations of the first and last extrema,
respectively, and c is the speed of light in vacuum.
FA measurements were made over three different wavelength spans in order to optimize the
temporal resolution ofmean DGD. The first scan was over the range from 1250 nm to 1650 nm.
This scan was sampled with 581 points and a 0.1 nm spectral resolution setting. From this range,
extrema were counted and the mean DGD over the range estimated from the wavelengths of the
23

minimum and maximum extrema (X? and Xi respectively). A more precise measurement wasmade by making two more scans. These scans were made over the first and last 50 nm of the full
scan range, with 581 sampled points and 0.1 nm spectral resolution. These "high resolution"
scans enabled better location of the wavelengths of the minimum and maximum extrema X? and
Al, respectively. Mean DGD could then be estimated from these three scans by using the
1250 nm to 1650 nm scan to provide the number of extrema Ne ; the low-wavelength scan
(1250 nm to 1300 nm) provided a high-resolution value for XF ; and the high-wavelength scan
(1600 nm to 1650 nm) provided a high-resolution value for X^. Then Ne , X¥ , and X^ were used in
Eq. (B2) to yield a high-resolution estimate of mean DGD over the nominally 1250 nm to
1650 nm wavelength range (the exact wavelength range is from X? to Xi).
The two 50 nm scans can also be used independently to yield estimates of mean DGD centered at
-1275 nm and 1625 nm. These, plus the "high resolution" estimate centered at -1450 nm give
three estimates of mean DGD. The three mean DGD estimates from these scans were then
compared to mean DGD estimates over the same wavelength ranges generated by extrapolating
the results of our JME-based measurements, as mentioned above.
B.2 Fixed Analyzer Measurement Uncertainty
Since the FA measurements were used only to validate the estimated mean DGD values from
JME measurements, it was not necessary to perform a full uncertainty analysis on the FAmeasurements. However, in order to increase our confidence in the measurements, we have
identified and quantified the major sources of uncertainty in our FA measurements.
A Fixed-Analyzer measurement ofmean DGD is a straightforward task when the device being
tested is non-mode-coupled. Since the measurement consists of measuring the spectral density of
extrema, the three necessary measurands are: identification of the positions of the peaks at the
extremes of the wavelength range, measurements of that wavelength range, and the number of
extrema in between.
False Peaks
Miscounting peaks is very unlikely since the spectral response is known to be sinusoidal for this
non-mode-coupled artifact. Noise levels are not sufficient to generate a false extremum. Toensure this, extrema are counted only if they meet a fractional height criterion [12]. For this
certification, a criterion of 0. 1 5 was used (no feature was considered to be an extremum unless
its height was greater than 15 % of the maximum vertical range of the spectral data). Since our
system noise was well below 1 5 %, no measurement uncertainty is attributed to miscounting
extrema.
Curve-Fitting Uncertainty
If the wavelengths of the extrema are not located accurately, an error can also arise. The peak (or
valley) location is identified by fitting a second-order polynomial to the data around the peak (or
valley). Error in this process could come from noise or distortion. The peak location error due to
random noise on the sinusoidal spectrum can be estimated from the curve-fit itself. The curve-
fitting was done through a least-squares method, and the covariance matrix was calculated from
the normal equations and used to yield an uncertainty estimate due to amplitude noise on the data
[10]. This value was measured to be typically less than 0.07 nm and so is a negligible
24

contribution to the uncertainty of the FA measurement. The possibility of amplitude distortion
was also considered, but since this would affect the sinusoidal data symmetrically, it will not
serve to shift the peak (or valley) location.
Relative Wavelength Accuracy ofthe Optical Spectrum Analyzer
Relative wavelength accuracy of the optical spectrum analyzer was measured using molecular
gas absorption cells of hydrogen cyanide (HCN) and methane (CH4) [13, 14]. Since the
important quantity is the wavelength difference between the two measured extrema, the absolute
wavelength accuracy of the optical spectrum analyzer is not important, but rather the linearity
(the relative accuracy in measuring the separation of two wavelengths). To calibrate the
wavelength linearity, light from an edge-emitting light-emitting diode (EELED) was transmitted
through gas cells ofHCN and CH4 in series and the throughput spectrum detected on an optical
spectrum analyzer (OSA). With the OSA centered at 1560 nm (50 nm span), the centers of three
lines of the P branch, P(l), P(22), and P(24) ofHCN were measured. The predicted center
wavelengths of these lines are A,pi = 1543.1 148 nm; A,P22 = 1559.814 nm; and
?iP24 = 1561.6344 nm [14]. Then, the OSA was centered at 1320 nm (50 nm span) and the center
of the R(6) line of CH4 was measured. The expected center wavelength of this line is
A,R6 =1318.319nm[13]. The OSA was turned off and then back on and the measurement
procedure repeated several times. The measurement was repeated again a day later.
The measurement procedure for this wavelength accuracy test is meant to simulate the procedure
used in measuring the extremum locations in the SRM 2538 artifacts. To estimate the worst-case
error in measuring the wavelength difference between extrema, we compiled the differences
between the HCN lines and the CH4 line for each scan. CH4 and HCN wavelengths were
compared only for data sets taken during the same scan set (i.e., absorption lines from HCN were
not compared to the CH4 line if the OSA was turned off between the measurements). Themeasured differences between the measured center wavelengths of the HCN P(l) and the CH4R(6) AXpiR6,Meas, between HCN P(22) and CH4 R(6) A?iP22R6,Meas, and between HCN P(24) and
CH4 R(6) AA,p24R6,MeaS? are compared to the predicted (true) difference values AA,piR6,True,
AXp22R6,Tme, and AA-P24R6,True- The discrepancy between measured and true difference values
represents the wavelength errors for the wavelength range measured. Fig. B2 illustrates the
wavelength errors measured. The worst-case disagreement was a 0.21 nm error between
measured wavelength difference and true wavelength difference that came between the HCNP(22) and CH4 R(6) lines.
Since typical measurements of the waveplate artifacts used extrema around 1250 nm and 1650
nm, the 1318 nm to 1560 nm differential wavelengths measured above were extrapolated to the
1250 nm to 1650 nm wavelength range. Ifwe assume a linear relationship between relative
wavelength error and absolute wavelength separation, the 0.21 nm worst-case error expands to
0.21x(1650-1250)/(1560-1318) = 0.35 nm. We take this to be the worst-case relative wavelength
error experienced in our measurements ofmean DGD using the FA measurement. Assuming a
uniform distribution of error, this value is converted to a "standard uncertainty" by dividing
by V3 [7]. We denote this value Ux = 0.20 nm.
The uncertainty this produces in the mean DGD measurement can be quantified ifwe define AXas the true wavelength separation between the extrema (at X? and X^) in the FA spectrum; then
25
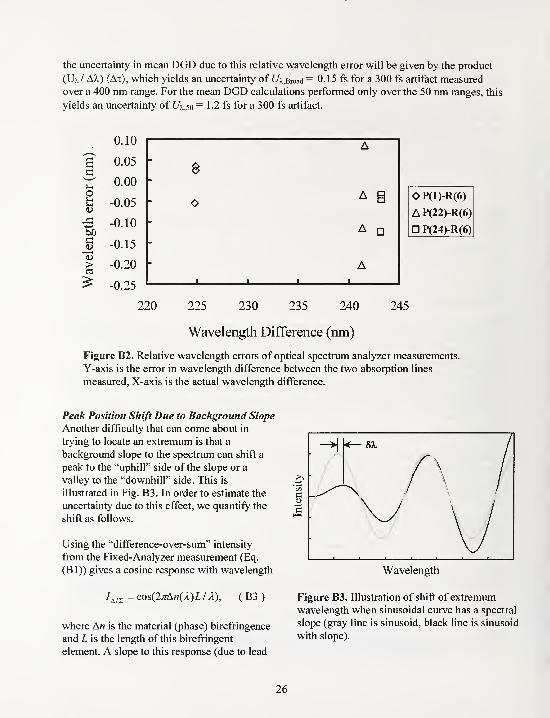
the uncertainty in mean DGD due to this relative wavelength error will be given by the product
(Ux/ AA.) (At), which yields an uncertainty of C4,Broad = 0.15 fs for a 300 fs artifact measured
over a 400 nm range. For the mean DGD calculations performed only over the 50 nm ranges, this
yields an uncertainty of Ux,so = 1.2 fs for a 300 fs artifact.
C
>C3
OP(l)-R(6)
AP(22)-R(6)
P(24)-R(6)
220 225 230 235 240 245
Wavelength Difference (nm)
Figure B2. Relative wavelength errors of optical spectrum analyzer measurements.
Y-axis is the error in wavelength difference between the two absorption lines
measured, X-axis is the actual wavelength difference.
Peak Position Shift Due to Background Slope
Another difficulty that can come about in
trying to locate an extremum is that a
background slope to the spectrum can shift a
peak to the "uphill" side of the slope or a
valley to the "downhill" side. This is
illustrated in Fig. B3. In order to estimate the
uncertainty due to this effect, we quantify the
shift as follows.
Using the "difference-over-sum" intensity
from the Fixed-Analyzer measurement (Eq.
(Bl)) gives a cosine response with wavelength
7A/S = cos(27rAn(A)L/A), ( B3 )
where An is the material (phase) birefringence
and L is the length of this birefringent
element. A slope to this response (due to lead
Wavelength
Figure B3. Illustration of shift of extremum
wavelength when sinusoidal curve has a spectral
slope (gray line is sinusoid, black line is sinusoid
with slope).
26
birefringence, or polarizer spectral dependence, etc.) would give the form
y = (aA + b) cos(27iAn(A)L / A). ( B4 )
An extremum occurs in the spectrum when the first derivative
dy InAnL ... InAnL— = a cos(—-—) - {aA + b) sin(—-—
)
dA A A
IkAyiL 2kL dAn
A' A dA
vanishes. Setting Eq. (B5) to zero and substituting the differential group delay
(B5)
AwgL
( dAn)LAt =—— = \An-A —
, (B6)c I dA J c
where Angis the group birefringence, yields the transcendental equation for extremum
wavelength
tjAs2
IkAAAtctan(2^A«Z/ls ), ( B7
)
where is the wavelength separation between two adjacent extrema and Xs is the wavelength
of one of these extrema. r| is the normalized spectral slope
aA + b
T) is defined such that n, = 0.2 would mean that the height oftwo adjacent peaks differ by 20 %.
For small Ax or large A-s, Eq. (B2) can be approximated as
AA x( B9)
2cAr
and Eq. (B7) becomes
— = -tan(2xAnL/As ). (BIO)
Restricting r\ to less than 0.5 will allow the small-angle approximation
— -pn --IkAuLI
A
s ,(Bll)
-2^Zs
--pn71
27

where p is an integer, given by
p = integer2AwI
(B13)
The shift in peak or valley wavelength as a function of slope comes from the difference between
the extremum position X,s having undergone the slope-induced shift, and the unshifted peak or
extremum location given by
so that
K*—, (B14)pit
2AnLri_ = 1 2AnL«
p"Tc"-rjp p"7r" (l-/;/ px~)
To estimate 8X, we first calculate typical values ofp. For an extremum at a wavelength of 1250
nm, and a mean DGD of 300 fs,p = 144; for an extremum at a wavelength of 1650 nm,/? = 109.
For r|<0.5 and /?>109, the large value ofp makes the quantity in parentheses in Eq. (B15)
approximately 1. Substituting Eq. (B13) into this large-/? approximation of Eq. (B15) and
approximating At ~ AnL /c (An « Ang) gives
81 ~ ~^——r . (B16)2Atctt
2
As an example, for A,s=1650 nm and At = 300 fs, the uncertainty due to a slope of n is given by
8k » (1.5 x 10"9m) r|. Using this estimate, we set a limit of rj < 0.2 for our measurements-data
sets are rejected if the measured FA spectrum shows extrema at the endpoints of the scan with
r|>0.2. This adds a wavelength uncertainty of up to 0.3 nm per extremum or a total uncertainty in
wavelength span of 0.6 nm. Dividing by (to get one standard uncertainty from the maximum
value of a uniform distribution) [7] gives the uncertainty due to spectral slope §AA.siope= 0.3 nm.
For a 300 fs artifact measured over an approximately 400 nm span, this uncertainty contributes
^siope = (0.3 nm/400 nm) x 300 fs = 0.23 fs.
Lead Birefringence
The expected DGD error due to lead birefringence in our FA system is on the order of a few
femtoseconds at most. However, due to the limit of the spectral width of our source, we cannot
reliably measure mean DGD values lower than 1 0 to 20 fs. So we cannot directly measure the
DGD error incurred due to lead birefringence by simply "shorting" the optical leads of the FAsystem and performing a mean DGD measurement. Instead, we estimate lead birefringence
effects by measuring an artifact of known mean DGD. First, we estimate the systematic bias in
DGD (that which does not go away by averaging multiple measurements with various lead
reorientations). We do this by performing multiple measurements of mean DGD of the artifact
with the system's fiber leads reoriented randomly between measurements. The average of these
measurements is compared to the known mean DGD of the artifact. The difference in the
measured mean and the true mean DGD will be considered to be the bias due to lead
28
birefringence. We used a reference fiber-pigtailed quartz plate whose mean DGD was accurately
measured by other means [3] to be 445.5 fs (over the wavelength range of the FA measurement).
We made eight FA measurements of mean DGD over the range of 1271 nm to 1639 nm. The
average of the measured mean DGD values was 445.9 fs. This small discrepancy of 0.4 fs could
easily be due to fiber lead birefringence. We assign an uncertainty due to the systematic bias due
to lead birefringence U\ead= 0.4 fs.
Repeatability
Repeated FA measurements show some variation. This could be due to several factors, including
lead birefringence. We estimate the uncertainty due to random errors by measuring the standard
deviation of multiple measurements. Since we did not make sufficient FA measurements on any
individual SRM 2538 artifact for a meaningful standard deviation estimate, we will instead use
the standard deviation of multiple measurements on the 445.5 fs artifact described above. Eight
FA measurements over the range 1271 nm to 1639 nm yielded a standard deviation of 0.81 fs.
Fixed Analyzer Uncertainty SummaryAs discussed above, the FA measurements were done as a validation of the certifying JMEmeasurements. So the uncertainty of the final values of the SRM 2538 artifacts do not contain
elements due to the estimated uncertainty of the FA technique. Nevertheless, we calculate an
estimate of the FA measurement uncertainty for completeness. The appreciable components of
uncertainty found are given in Table B 1 . Adding the terms in quadrature gives the combined
standard uncertainty, illustrating that the estimated uncertainty of the FA measurement is
dominated by random uncertainty (likely due to birefringence of the fiber leads in the FAmeasurement system). The expanded uncertainty ("A: = 2") for the FA measurement on a 300 fs
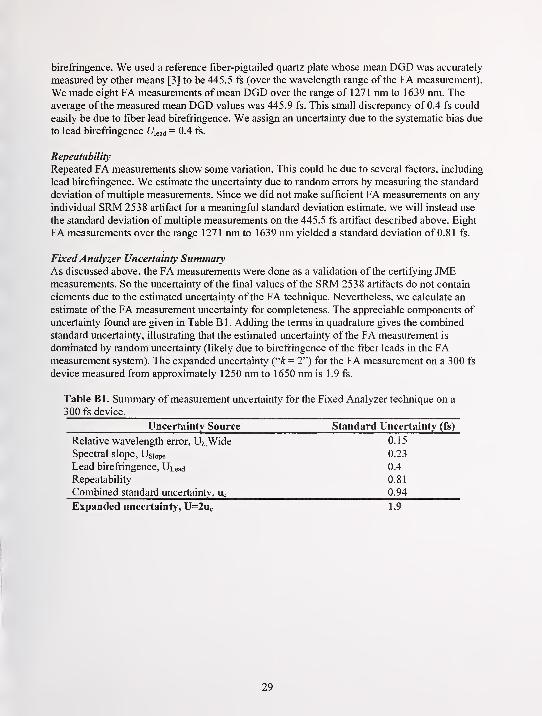
device measured from approximately 1250 nm to 1650 nm is 1.9 fs.
Table Bl. Summary of measurement uncertainty for the Fixed Analyzer technique on a
300 fs device.
Uncertainty Source Standard Uncertainty (fs)
Relative wavelength error, U^WideSpectral slope, USioPe
Lead birefringence, ULead
Repeatability
Combined standard uncertainty, Uc
0.15
0.23
0.4
0.81
0.94
Expanded uncertainty, U=2u c 1.9
29

30

Appendix C. Description ofNIST Jones Matrix Eigenanalysis Polarimeter
31

32

Rotating-wave-plate Stokes polarimeter for
differential group delay measurements of
polarization-mode dispersion
Paul A. Williams
We present a description and detailed uncertainty analysis of a polarization-mode dispersion (PMD)measurement system that uses the Jones matrix eigenanalysis measurement technique based on a
rotating-wave-plate Stokes polarimeter. The uncertainty of the system is 3.2 fs (—95% confidence
interval) and is due primarily to PMD in the fiber leads of the measurement system.
OCIS codes: 060.2270, 060.2300.
1. Introduction
We have assembled and tested a Jones matrixeigenanalysis (JME) measurement system for
polarization-mode dispersion (PMD) measurementsbased on a rotating-wave-plate technique. Thistechnique was used as the primary technique for cal-
ibrating a National Institute of Standards and Tech-nology (NIST) Standard Reference Material (SRM2518) for the generation of mode-coupled PMD. 1
Here, we calculate the uncertainty of the measure-ments.
2. Description of Apparatus
Our JME system is shown schematically in Fig. 1.
Light from a tunable laser diode is coupled into asingle-mode fiber and goes through a polarization
controller and then through the specimen. The po-
larization state of the exiting light is measured witha Stokes polarimeter. The unusual aspect of oursystem, which differentiates it from other JMEsystems,2" 4 is that the Stokes polarimeter is based ona rotating-wave-plate design that uses a single detec-
tor (as opposed to four in other designs). Our designwas chosen to minimize the possible errors in
multiple-detector systems such as the gain mismatchthat results from temperature gradients. Althoughmultiple-detector implementations can calibrate outstatic gain mismatches between detectors and peri-
P. A. Williams ([email protected]) is with the Optoelec-
tronics Division, National Institute of Standards and Technology,
MS 815.02, 325 Broadway, Boulder, Colorado 80303-3328.
Received 20 April 1999; revised manuscript received 12 July1999.
odically recalibrate to minimize the effects of transi-
tory gain mismatch due to thermal gradients, the
single-detector design is simpler in that it does not
require these calibrations. A personal computer is
used to control the system and to analyze the inten-
sity measurements.The tunable laser has a range of 1480-1570 nm
with a linewidth of less than 100 kHz. The free-
space polarization controller consists of X/4 and X/2
wave plates, followed by a polarizer. The waveplates are used to manipulate the polarization state
between the laser and the polarizer in order to opti-
mize the power throughput. The polarizerP1 has anextinction ratio of >40 dB from 1470 to 1570 nm.The orientations of the wave plates and the polarizer
are computer controllable (the polarizer's orienta-
tional resolution is 0.18°).
The Stokes polarimeter consists of a graded-index
lens that launches the light from the fiber onto a X/4waveplate (true zero-order polymer) spinning at 1450rpm (—24 Hz). The light is then incident upon a
Glan-Thompson analyzer P2 whose extinction axis
orientation is defined as horizontal. Exiting the an-
alyzer, the light is incident on a lens and focused onan InGaAs photodiode. The output of the photo-
diode is read by a lock-in amplifier and a digital volt-
meter (DVM). Measuring the dc, 2f, and 4fcomponents ofthis signal allows the calculation ofthe
Stokes vector of the light (see Appendix A for details
of the analysis).
The PMD ofthe test device is measured according
to the technique of Heffner.2 For a given test spec-
imen, the Stokes vector of the transmitted light is
measured at a particular wavelength for three dif-
6508 APPLIED OPTICS / Vol. 38, No. 31 / 1 November 1999

I unable
Laser -Q-[FT5}A
—
A-dIsk/2 k/4 P.
. : Y H
Polarization
Controller
Lock-In
Amplifier
Digital
Voltmeter
I
[Personal Computer)
Fig. 1. Schematic of the rotating-wave-plate Stokes polarimeter
for measuring DGD.
ferent launch polarization states (in our case, weuse P x to generate three linear states at 9 + 0°, 9 +45°, and 9 + 90° where 9 is an arbitrary reference
angle). From these three measured Stokes vec-
tors, the Jones transfer matrix of the test specimen(including the fiber leads) is calculated at the test
wavelength. Then, the wavelength is changed andthe process repeated giving a second Jones matrixat the new wavelength. Again following Heffner,
we calculate the differential group delay (DGD; or
AtJ as
At,,
arg(Pl/p2 )
(1)
where p x and p2 are the eigenvalues of the matrixproduct
T(oj + Ao))T_1
(o>), (2)
formed from the Jones transfer matrices T(w) andT'(o) + Aw) of the test device measured at the twooptical frequencies 00 and co + Aw.Here a couple of clarifying notes are appropriate.
A DGD measurement requires measurement of the
Jones matrix of the test specimen at two different
optical frequencies. We usually refer to this differ-
ence in terms of wavelength as the step size. If the
Jones matrices were measured at X x and X2 , then the
calculated DGD would be reported as the DGD at the
average ofthose two wavelengths. For example, if a
scan ofDGD versus wavelength involved measuringthe Jones matrices at 1500, 1502, 1504, and 1506 nm(a 2-nm step size), then it would yield DGD values at
1501, 1503, and 1505 nm. For clarity, we use the
term DGD to refer to the instantaneous group delay
between the two principal states of polarization at agiven wavelength. The term PMD is used to refer to
the mean of multiple DGD measurements over agiven wavelength range.
3. Uncertainty Analysis
The purpose of developing this JME measurementsystem was to provide accurate measurements of a
NIST SRM for characterizing mode-coupled PMD. 1
The SRM is a stack of —35 quartz wave plates
cemented together with random angular orienta-
tions and pigtailed with single-mode fiber. Uncer-tainties in the assembly of this device prevented usfrom calculating its theoretical PMD; therefore thecalibration of this device depends solely on the cal-
ibration of the JME system used to do the measure-ment.We estimated the measurement system's type A
(statistical) (Ref. 5) uncertainties from the standarddeviation of multiple measurements. We also com-pared this result with the quadrature sum of esti-
mated type A error sources.
Type B (nonstatistical) (Ref. 5) uncertainties,
however, cannot be directly measured with self-
consistency arguments (standard deviation, etc.).
To identify them, we used two approaches. First, wetested the system by measuring a single pigtailed
quartz plate (non-mode-coupled) with a known PMD.Second, we estimated the systematic uncertainties
from the known inaccuracies of the experimental
equipment.
The algorithm that derives PMD from the mea-sured intensities is a complicated expression that
does not lend itself to error analysis through simple
propagation of errors. The best way to estimate
PMD measurement uncertainty is through computersimulation. We wrote a program to generate the
wavelength-dependent Jones matrices that represent
a non-mode-coupled PMD element measured in the
presence of equipment inaccuracies (polarizer mis-
alignment, improper wave-plate retardance, etc.).
These Jones matrices were fed into the same algo-
rithms used by our JME system to calculate the mea-sured DGD, and then this value was compared withthe true theoretical value. The discrepancy is the
error due to the equipment inaccuracies. This sim-
ulated experiment was repeated multiple times withvarious fiber pigtail orientations and different theo-
retical DGD values. The difference between these
simulated DGD values (measured and true) gives anexpected uncertainty due to equipment inaccuracies.
Our simulations were run with DGD values uni-
formly distributed from 0 to 1 ps—the expected mea-surement range ofourJME system for measuring the
SRM artifacts.
In summarizing the uncertainties due to equip-
ment inaccuracies, we found that most resulting
measurement errors are random and that the sig-
nificant systematic ones are systematic only for
fixed measurement conditions. That is, if multiple
measurements are made with the input state of
polarization varied between measurement runs, all
significant error sources will be random with a
mean error of zero. We accomplished this bychanging the launch polarizer offset (9 as men-tioned above) before each DGD-versus-wavelengthrun. We also varied the launch polarization state
by changing the orientation of the fiber leads con-
necting the specimen. Six possible sources of ran-
dom error due to equipment inaccuracies wereidentified and are described below.
1 November 1999 / Vol. 38, No. 31 / APPLIED OPTICS 6509

A. Random Uncertainties
1. Polarizer Misalignment
We measured the Jones matrix of the test device bylaunching three states of polarization with relative
orientations of 0°, 45°, and 90°. Alignment errors of
the polarizers cause negligible uncertainty in the
measured DGD. As stated before, the 0°, 45°, and90° angles are only relative orientations with respect
to some arbitrary alignment. That means polarizer
orientations of 10°, 55°, and 100° would give identical
DGD values. It is only the relative offset betweenpolarizer orientations that might cause trouble (0°,
46°, and 90° for example). We found from simula-
tion that polarizer misalignments as large as ±2°
give worst-case DGD errors less than ±6 X 10~4 fs.
Since our expected alignment errors are on the order
of 0.18°, polarizer misalignment is a negligible error
source.
2. Lock-in Amplifier Phase Errors
Appendix A shows that the phase setting of the
lock-in amplifier can be important. The signal dis-
tribution between the sine and the cosine componentsat 4f is determined by the phase setting of the lock-in
amplifier. Phase errors at 4/"cause leakage betweenand S2 (horizontal and 45° linear states). This
corresponds to a rotation of the denned Poincare
sphere about its polar axis. This leakage has noeffect on DGD measurements, where the importantparameter is the relative travel of the polarization
state on the Poincare sphere as a function of wave-length. However, incorrectly identifying and S2
(C and D in Appendix A) does affect our measurementof degree of polarization (DOP). DOP is calculated
as
D0p3-^+5 +^, (3)
So
Since C and D are not used symmetrically in theStokes parameter definitions of Eqs. (A6), phase er-
rors at 4f cause us to misreport the DOP. This is
important because we use DOP measurements to en-
sure that the system is well behaved during the mea-surement (we know that the DOP should be close to
1.0 and be a constant independent of measurementparameters). We easily set the 4/" phase by launch-ing a linear polarization state into the Stokes polar-
imeter (a bulk polarizer is placed immediately in
front of the rotating wave plate at 90° with respect to
the analyzer Px in Fig. 1). This vertical linear state
has only a negative C component and no D compo-nent. We set the phase at 4f on the lock-in accord-ingly.
However, the phase setting at 2f directly affects themeasured DGD, but fortunately by a small amountand in a random way. Since there is no 2f cosine
term in Eqs. (A2)-(A5), errors in setting the phase at
2freduce the amplitude ofB. This distorts the Poin-care sphere by flattening it at the poles and can result
in a second-order error in measurement of arc length
on the sphere. We set the phase at 2f by launchinga nearly circular state into the Stokes polarimeterand then adjusting the phase to optimize the ampli-tude of the B component. Our repeatability in set-
ting phase is always less than 1°. So, we simulatedthe error in PMD measurements resulting from 1°
phase errors on both 2f and 4f measurements andfound the standard deviation to be 0.06 fs (for Aco step
sizes—see Eq. (2)—corresponding to 3 nm). Thusphase errors represent a negligible contribution to
the measurement uncertainty.
3. Stokes Polarimeter
The primary source of errors in the measurement of
the Stokes vector comes from imperfections in thequarter-wave retarder. The derivation of AppendixA assumes the retarder to be exactly quarter wave.If it is not, the result will be errors in the measuredStokes parameters. These errors are correctable if
the true retardance of the wave plate is known. Fora non-quarter-wave retarder, the true Stokes param-eters are given by
S0 =A- C/tan2(8/2),
51 - 2C/2 sin2(8/2),
52 = 2D12 sin2(5/2),
53= B/sin(8), (4)
where 8 is the true retardance of the nominallyquarter-wave plate. These equations reduce to Eqs.
(A6) when 8 = 90°. So, if the actual retardance of
the quarter-wave plate is known, the true Stokesparameters can still be obtained. A problem occurs
when there are unknown retardance variations in thequarter-wave plate.
The retardance of the wave plate is specified within1.2° (manufacturer's specification of spatial uniformi-
ty). Computer simulations show that a 1.2° retar-
dance error yields random measurement errors with astandard deviation of8 fs. Other errors in retardance
can result from a tilt between the wave plate and the
incident beam and the wavelength dependence of the
retardance. We measured the wavelength depen-dence of the quarter wave-plate retardance using the
NIST rotating-polarizer polarimeter.6 This wave-length dependence is used with Eqs. (4) for automatic
correction ofthe wavelength-dependent retardance er-
rors during the measurement.Another potential source of uncertainty comes
when the wave plate is tilted off axis. Wave-platetilt takes two forms: Wobble is tilt ofthe wave plate
in its mount with respect to the rotation axis, andaxis tilt is tilt of the mount (rotation axis) with re-
spect to the beam (Fig. 2). Pure wobble causes the
light to enter the wave plate at nonnormal incidence,
but with a constant angle of incidence with respect to
the fast and the slow axes ofthe plate during rotation.
This results in a systematic bias to the effective re-
tardance of the wave plate. On our setup, we mea-sured the wobble to be less than 0.4°. Thistranslates to an internal (to the wave plate) incidence
6510 APPLIED OPTICS / Vol. 38, No. 31 / 1 November 1999

Table 1. Estimated Random Uncertainties
Incident Beam
Cross section of hollow-shafted
motor for spinning wave plate
Fig. 2. Two possible types of wave-plate angular misalignment.
Standard
Error Source Uncertainty, fs
Wavelength uncertainty (3-nm step size) 3.6
Multiple reflections (0.2% per surface) 3.6
Retardance error in \/4 plate 8
Combined Standard Uncertainty 9.5
angle of 0.26°. This nonnormal incidence causes a
systematic error in the wave-plate retardance of
±0.001°. 7 This is orders ofmagnitude below the un-
certainty owing to wave-plate uniformity and is con-
sidered negligible. The effects of axis tilt are moredifficult to quantify. The source of errors is still the
same as with wobble—nonnormal incidence alters
the effective retardance ofthe wave plate. However,as the plate rotates, the effective retardance changes,
depending on whether the tilt is toward the fast or
the slow axis (or somewhere between). We did not
derive a closed-form expression to quantify this error,
which depends on the DGD of the device being mea-sured. Instead, we used computer simulation to
predict the possible range of errors resulting fromaxis tilt. We measured the axis tilt to be <0.4° (ex-
ternal angle). Our simulation used a conservative
estimate of 1° axis tilt, which gave a random error
with a worst-case value of <0.03 fs. This represents
a negligible error source.
4. Laser Wavelength
A significant source of uncertainty in the experimentcan be attributed to uncertainty in laser wavelength.
Using a wavemeter, we calibrated the wavelengtherror of the tunable laser (agreement between the
target wavelength and the actual wavelength).
Since we did not have a wavemeter available for real-
time monitoring of the actual laser wavelength, wetreated the wavelength uncertainty as an error
source. In the measurement of DGD, a critical pa-
rameter is the wavelength difference AX between ad-
jacent measurement points. This is because the
instantaneous DGD is given as |dS/dco|, the change in
Stokes vector for a given change in optical frequency.
An error in Ak therefore produces a proportional er-
ror in DGD. This error increases as the wavelengthstep size decreases. Our tunable laser exhibited a
wavelength uncertainty of ±0.008 nm (one standarddeviation). At, say, 8-nm step sizes, this represents
only a 0.1% error, but at 0.8-nm step sizes, it becomesa 1% error. Fortunately, this error can be reducedby averaging of data (or by real-time monitoring of
the laser wavelength with a wavemeter).Computer simulation supports these statements.
We ran simulations using worst-case wavelength er-
rors of three times the observed ±0.008-nm standarddeviation. For wavelength steps of 1 nm, randomPMD errors with standard deviation a = 12 fs oc-
curred, 2-nm step sizes yielded ct = 5.7 fs, and 3-nmsteps gave o- = 3.6 fs, for a nominal DGD of 0.5 ps.
5. Multiple Reflections
One error that could occur independent ofdeficiencies
in the measurement apparatus comes from multiple
reflections. If two reflections somewhere in the test
system occur with one on each side of the test speci-
men, then the effect will be a cavity with the test
device inside. This means that the measured PMDincludes coherently added PMD contributions fromthe multiple paths of the device. This type of phe-nomenon has been discussed in depth with regard to
measurements of optical retardation. 8 In the case of
PMD, the critical parameters are the same. Thehigher the quality factor Q of the cavity created bythe reflections, the larger the distortion of the mea-sured PMD. However, the saving fact is that themultiple delays with each reflection add coherently
and so are very sensitive to wavelength and cavity
length. Thus in PMD measurements, the effects of
multiple reflections may be averaged away by multi-
ple measurements either at slightly different temper-
atures (fractions of 1 °C should be enough) or at
wavelengths that are different by fractions of 1 nm.Computer simulation showed that a cavity with in-
tensity reflections of 0.2% (—27 dB) at each end anda true DGD of 0.5 ps generates a random DGD mea-surement error with a standard deviation of 3.6 fs.
6. Polarization Extinction Ratio
The two polarizers used in the system have extinction
ratios >40 dB. However, the extinction ratio of the
polarizers is not critical since the JME measurementcalculates the DGD only from the portion oflight that
is completely polarized. A poor extinction ratio ofP1
would reduce the degree of polarization through the
test device, but only the polarized part of the light is
used in the DGD measurement. Poor extinction byP2 would underreport the DOP of the light going
through the test device. But, low extinction ratios in
either P 1 or P2 do not directly affect the PMD accu-
racy. The only reason for high extinction ratios onthe polarizers is to optimize the optical throughputfor purposes of noise reduction.
7. Summary ofRandom Uncertainties
Table 1 lists the theoretical sources ofrandom uncer-
tainty (one standard deviation) and their combinedstandard uncertainty (quadrature addition) total of
9.5 fs. We directly measured the standard deviation
ofDGD measurements with a pigtailed quartz plate
(0.4464 ps). We made 50 scans over the range1480-1569 nm, giving a total of 1008 data points.
1 November 1999 / Vol. 38, No. 31 / APPLIED OPTICS 6511

Fig. 3. Schematic illustration that the distance AS between two
Stokes vectors (Sa and Sb ) is systematically biased by the presence
of random Stokes noise (of amplitude t]).
The measured sample standard deviation was 5.2 fs,
and the standard deviation of the mean was 0.20 fs.
This 5.2-fs experimental standard deviation is well
within our 9.5-fs estimate.
B. Systematic Uncertainties
1. Systematic Errors from Random Noise
It is possible for a random-noise source to,add a sys-
tematic bias to PMD measurements. This comesfrom the fact that DGD is a scalar quantity resulting
from a vector measurement. The JME measure-ment of DGD is equivalent to measurement of the
change in the output Stokes vector in response to a
change in the optical frequency ofthe source |AS/Ato|.Figure 3 shows the Stokes vectors (Sa and Sb) mea-sured at Xa and X6 ,
respectively. If the measuredStokes vectors are subject to some noise r\, they will
randomly describe a set of points within a circle of
radius r\ whose center is the location ofthe noise-free
Stokes vector. When measuring arc length on the
sphere, the average of multiple JME system mea-surements really averages the distance betweenpoints randomly located within circle a and points
randomly located within circle b. This operation
does not average to the distance between the circles'
centers (AS = |Sa - Sb |) but rather to somethinggreater than that. This seems counterintuitive, butconsider the case in which AS approaches 0; measur-ing AS then amounts to the average distance betweentwo points randomly chosen within a circle of radiust\. Clearly, this average distance is greater than 0;
thus we have a positive systematic bias. This nor-
malized error in measuring DGD in the presence of
noise can be approximated as
0 0.1 0.2 0.3 0.4 0.5 0.6
Noise Fraction, d
Fig. 4. Normalized systematic error d(ct) versus noise fraction a.
Solid curve is theoretical prediction from Eq. (5), and circles are
data points from two different quartz plates sampled at different
wavelength step sizes.
where the noise fraction a = T|/AS. This normalizedtheoretical bias is plotted as a function of a in Fig. 4(solid curve). The data points are experimental datafrom measurements of two quartz plates of PMD at
0.218 and 0.4464 ps. We varied a experimentally bysampling with various wavelength step sizes. AsFig. 4 shows, the systematic bias in the measure-ments agrees well with theory for small values of a.
To determine a for the experimental data, we knewthe target value of AS, and we used t] as the free
parameter. The points in Fig. 4 are scaled with m.=
0.015. These values agree fairly well with the esti-
mated T| values for our apparatus. We can estimate
T) as t|<j "t" T)x , where r\s is a direct measurement ofthe
random noise on the Stokes vector and t)x is the es-
timated noise due to the random wavelength varia-
tions. The expression r\s + r\ K yields a valuebetween 0.006 and 0.009. This discrepancy betweenpredicted and fitted values of in implies that there are
still other random-noise sources that we have notaccounted for.
This possible systematic error in measurementsmust be considered when the PMD-induced Stokesvector change is small with respect to the absolute
noise on the measurement. In our calibration mea-surements, this was not a factor since our measure-ments were carried out with step sizes between 2.7
and 8 nm (a < 0.009), which yields negligible system-
atic uncertainties. However, as can be seen fromFig. 4, the experimental data level off without reach-
ing zero at the smallest values of a. This effect,
which likely comes from some other source of error
d(a)
J»2ir
|»2
0 Jo
[(1 + a cos 6 - a cos <p)2 + (1 + a cos 0 - a cos <p)
2
]
1/2dedcp
12-it f»2ir
j Jo
(5)
d6d9
6512 APPLIED OPTICS / Vol. 38, No. 31 / 1 November 1999

Table 2. Summary of Measurement Uncertainty for JME Measurement System
Standard
Uncertainty Source Method Uncertainty, fs
Experimental random errors Measured standard deviation of the mean of repeated 0.20
independent measurements
Systematic bias due to random noise From random-noise estimates 1.0
Uncertainty of quartz artifact calibration Theoretical calculation 1.2
Combined standard uncertainty uc- [2uj
2]1/2
1.6
Expanded uncertainty U = 2uc 3.2
than was considered here, can be taken into account
by addition of a conservative +0.2% (~1 fs for our
~0.5-ps device) contribution to the uncertainty. Al-
though these systematic errors are practically negli-
gible for the current measurements, this bias
mechanism must be kept in mind because it limits
the minimum wavelength step that may be used in
measurements. For example, given the noise of this
system, a <0.25% systematic uncertainty require-
ment means that a 0.1-ps device must be measuredwith a step greater than 0.5 nm and that a 1-ps device
requires steps greater than 0.2 nm.
2. Comparison to Artifact
To calibrate our JME measurement system and iden-
tify systematic errors, we measured our well-
characterized pigtailed quartz plate (Appendix B).
As described above, 1008 measurements were madeover the wavelength range 1480-1569 nm with step
sizes between 2.7 and 8 nm. The average of the
measurements was 0.4465 ps with a sample standarddeviation of 5.2 fs. The difference between our mea-surement of the PMD of the quartz plate and the
0.4464-ps theoretical value is 0.1 fs, well within the
1.2 fs uncertainty of the quartz plate's theoretical
PMD.
3. Quality ofData
Since much ofthe uncertainty analysis ofthis systemrelies on assumptions about the uncertainties of the
measurement equipment, it is useful to have an in-
dependent means of judging if the data has beentaken under the assumed conditions. The measuredDOP was used for this purpose. Particular error
sources such as wave-plate retardance errors, lock-in
phase errors, Stokes noise, and dc measurement er-
rors cause the measured DOP to fluctuate around its
true value. For these error sources, the size ofDOPfluctuations can be an indication of the magnitude of
the measurement uncertainty. We have foundthrough simulation that for uncertainties within
ranges that support our error-analysis assumptions,
the DOP varies by as much as ±5% or so. So, to be
conservative, we measure DOP simultaneously withDGD and use only those DGD values that fluctuate
about the mean by less than 3%. Experimentally,
we find a mean DOP of 0.97 for measurements withour system. So we throw out DGD values that havean associated DOP outside of the range 0.94 <DOP < 1.0. As a test, we compared mean DGD
measurements made on the pigtailed quartz-plate
artifact with and without this DOP criteria and foundonly a 0.01-fs difference. This supports our assump-tions regarding equipment uncertainties and implies
that this DOP criteria was not necessary.
4. Conclusions
Table 2 lists the significant uncertainties (in femto-
seconds) that we have calculated for our measure-ment system for measurements on a ~0.5-ps device.
Adding the three uncertainties in quadrature andmultiplying by a coverage factor of 2 gives an ex-
panded uncertainty of 3.2 fs. For comparison, weare aware of one other published uncertainty analy-
sis for a polarization-state analyzer that uses the
Stokes vector arc analysis technique for DGD mea-surement.4
Appendix A: Operation of Stokes Polarimeter
The polarization state of the light is determined witha rotating-wave-plate Stokes polarimeter.9 As Fig.
1 shows, the Stokes polarimeter is simply a spinningquarter-wave plate in front of a fixed polarizer, fol-
lowed by a detector. Using a phase-sensitive lock-in
amplifier and a dc voltmeter allows the measurementof the dc, 2f, and 4f (both in-phase and quadraturecomponents). The four Stokes parameters can be
found from these components. At the detector, the
intensity as a function of wave-plate orientation 6
and the Stokes parameters of the incident light is9
7(8) = i (S0 + Si cos226 + S2 sin 26 cos 26
+ S3 sin 26), (Al)
where S0 is the first Stokes parameter ofthe incident
light, and so on. One can find the Stokes parame-ters by Fourier analyzing the transmitted intensity.
The dc signal is measured, with a DVM, as
1 f2ir
A = - 7(6)d6, (A2)17
^0
where 7(6) is the detected intensity when the waveplate has orientation 6. The 2f component is mea-sured with the lock-in amplifier to give
2 f2*
B = - 7(6)sin(26)d6. (A3)
1 November 1999 / Vol. 38, No. 31 / APPLIED OPTICS 6513

Collimating >
Lens
Fig. 5. Diagram of non-mode-coupled PMD test artifact. With
removable polarizers that can be inserted to make a wavelength-
scanning measurement independent of lead PMD.
The 4f components are
2 f2w
C = - /(6)cos(40)de, (A4)
2 f2^
D = - 7(e)sin(46)d6. (A5)17
Jo
The Stokes parameters are found by combination of
the measured values A, B, C, and D to give
S0 =A-C,
51 = 2C,
52= 2D,
53= B. (A6)
The resulting Stokes vector is then used along withthe two other Stokes vectors measured for different
orientations of the input polarizer to calculate theJones transfer matrix of the device under test. Thisprocedure is also included in Heffner's letter. 2
The advantage of the rotating-wave-plate methodof measuring the Stokes parameters is that all four
parameters are measured with the same detector.
This eliminates the errors that can result from afour-detector system with mismatched gains.
The dc levelA is measured with a DVM as opposedto the lock-in amplifier used for B, C, and D. Thismeans that errors in the absolute calibration betweenthe DVM and the lock-in could be important. How-ever, the dc level is used only in the calculation of
DOP and has no effect on measured DGD.
Appendix B: Quartz-Plate Reference Device
To assess the accuracy of the measurement system,we measured an artifact of known PMD and com-pared our measured result with the known value.
We did this by assembling a non-mode-coupled arti-
fact from a single quartz plate pigtailed with single-
mode fiber (Fig. 5). We measured the thickness andwedge of the quartz plate accurately and combinedthat information with group birefringence data to
calculate the expected DGD for propagation throughthe quartz plate. The uncertainty of the DGD oftheplate comes from uncertainties of the thickness and
index measurements, birefringence in the fiber pig-
tails, and multiple reflections off the endfaces of the
quartz.
We measured the thickness ofthe quartz plate witha coordinate-measurement machine. The plate's
thickness was 14.243 ± 0.002 mm (±0.014%), mea-sured at 20.2 ± 0.2 °C. Another factor in the uncer-
tainty is the effective thickness of the quartz plate.
Although we accurately know the thickness of the
plate, if the probe light enters the plate at a nonnor-
mal incidence, the optical path length wifl be differ-
ent. We measured the angle of incidence 9 for
He-Ne light at 632.8 nm to be 0.31°, which translates
to an internal angle of0.21°. Assuming this angle to
be the same as for light at the actual wavelength of
use (—1550 nm), we calculate the tilt-induced length
error to be +0.0001 - 0 mm, or <0.0007%, again
negligible in light of the absolute thickness uncer-
tainty of ±0.014%.We obtained the quartz bhefringence in two differ-
ent ways. First, comparison of the numbers fromthe literature 10-12 illustrates a discrepancy in the
quoted values (>0.18%). So, as a second approach,
we measured group birefringence ourselves. Thequoted journals report phase bhefringence as op-
posed to group birefringence. It is the group bire-
fringence that determines the DGD. The relation
between the two is 13
A^An,-^. (Bl)
We made the group birefringence measurement by a
wavelength scan of the quartz plate (Fig. 5). Weinserted polarizers between the graded-index lenses
of the fiber pigtails and the quartz plate to eliminate
birefringence due to the leads. The transmitted in-
tensity versus wavelength was recorded for the po-
larizers in a crossed orientation. The 90-nm scan
range (centered at 1525 nm) yielded multiple nulls
corresponding to the condition that the retardance
AnL/X of the quartz plate was an integer. For the
conditions described, those integers were near 77,
depending on the order ofnull. Therefore, as long as
our estimate ofAnL/X was better than 0.5 parts in 77
(0.65%), we would be able to determine the order
number of a given null unambiguously. Then, forc-
ing AnL/X to be equal to that integer gives a moreaccurate estimate of An. As stated, published val-
ues of An differed by 0.18%. Since this uncertainty
is significantly less than the required 0.65% (as are
the 0.014% thickness uncertainty and the 0.0005%wavelength uncertainty), we can identify the order of
each fringe. For example, using a literature value
Anlit
(X), for a particular null Xnull ,An
lit(Xnull)L/Xnull
=77.009. Our accuracy is good enough to say that the
true order of this null is 77 (not 76 or 78). We thencorrect for the least accurate parameter An
lit(X) so
that Ancorr(Xnull)L/Xnull = 77 exactly. Doing so over
the 90-nm wavelength range, we have improved the
accuracy of our An estimate by an order ofmagnitude
6514 APPLIED OPTICS / Vol. 38, No. 31 / 1 November 1999

so that it is limited by the length uncertainty of
0.014%.
The PMD of the quartz plate is AnL/c (where c is
the speed of light), and we found it to be equal to
0.4467 ps for a 89-nm scan centered at 1524.5 nm.The uncertainty on this number is due to the uncer-
tainty of L (0.014%) and An (±0.014%). Adding in
quadrature gives ±0.02% or 0.09 fs. The birefrin-
gence of the fiber leads themselves was measured (in
the absence of the quartz plate) to be approximately
1.2 fs. This is not an exact estimate of the error dueto lead birefringence since as the leads are reposi-
tioned, the PMD of the leads add to or subtract fromthe PMD of the device. Moving the leads betweenmeasurements averages the effect of lead birefrin-
gence, but not completely. Some birefringence is
likely to be in the graded-index lenses themselves,
and their orientation does not change when the leads
are moved. We therefore estimate the uncertainty
on the PMD of the artifact to be the quadrature sumof the 0.09-fs uncertainty of the quartz plate and the
1.2 fs ofthe leads, giving an overall 1.2-fs uncertainty
dominated by lead birefringence. We obtain an ap-
proximately 95% confidence interval by using a cov-
erage factor of 2. Therefore we estimate the PMD of
the pigtailed quartz plate to be 0.4467 ± 0.0024 ps at
1524.5 nm and 20.2 °C.
Our JME measurements ofthe quartz plate's PMDwere carried out at a temperature of 23.3 ±0.1 °C.
We therefore modify our estimate of the PMD to this
temperature. The thermal expansion of quartz, a =13.6 X 10~6/°C (Ref. 14) couples with the tempera-
ture dependence of the birefringence to give a tem-perature dependence to PMD. The temperaturedependence ofthe retardance of quartz at 1525 nm is
assumed equal to a value measured at 1535.59 nm, 15
7 = ( 1/AnL)d(AnL)/dT = -1.232 X 10 7°C.
Using 7, we estimate the PMD of the quartz plate to
be 0.4464 ± 0.0024 ps at 23.3 °C and 1524.5 nm.
References and Notes
1. P. A. Williams, "Mode-coupled artifact standard for
polarization-mode dispersion: design, assembly, and imple-
mentation," Appl. Opt. 38, 6498-6507 (1999).
2. B. L. Heffner, "Automated measurement of polarization modedispersion using Jones matrix eigenanalysis," IEEE Photon.
Technol. Lett. 4, 1066-1069 (1992).
3. See "Polarization-mode dispersion measurement for single-
mode optical fibers by Jones matrix eigenanalysis," Fiber Optic
Test Procedure (FOTP) 122 Telecommunications Industry As-
sociation, 2500 Wilson Blvd., Suite 300, Arlington, VA 22201
USA.4. D. J. Ives, "Calibration of a polarisation state analyser for
polarisation mode dispersion measurements," in Technical Di-
gest ofthe Fourth Optical Fibre Measurement Conference (Ted-
dington, UK, 1997), pp. 213-216. The exact form of the
Stokes polarimeter in this reference is unclear, however, a
detailed error analysis is carried out.
5. The terms type A and type B uncertainties refer to the ISO and
the NIST convention and denote uncertainties that are (A)
evaluated by statistical means and (B) evaluated by nonstatis-
tical means. For details, see B. N. Taylor and C. E. Kuyatt,
eds., "Guidelines for evaluating and expressing the uncer-
tainty of NIST measurement results," National Institute of
Standards and Technology, TechNote 1297 (National Institute
of Standards and Technology, Boulder, Colo., 1994).
6. P. A. Williams, A H. Rose, and C. M. Wang, "Rotating-
polarizer polarimeter for accurate retardance measurement,"
Appl. Opt. 36, 6466-6472 (1997).
7. P. D. Hale and G. W. Day, "Stability of birefringent linear
retarders (waveplates)," Appl. Opt. 27, 5146-5153 (1988).
8. K. B. Rochford, A. H. Rose, P. A. Williams, C. M. Wang, I. G.
Clarke, P. D. Hale, and G. W. Day, "Design and performance of
a stable linear retarder," Appl. Opt. 36, 6458-6465 (1997).
9. E. Collette, ed., Polarized Light: Fundamentals and Applica-
tions (Marcel Dekker Inc., New York, 1993), p. 103.
10. J. H. Shields and J. W. Ellis, "Dispersion of birefringence of
quartz in the near infrared," J. Opt. Soc. Am. 46, 263-265
(1956).
11. W. L. Wolfe and G. J. Zissis, eds., The Infrared Handbook(Environmental Research Institute of Michigan, Ann Arbor,
1985), pp. 7-57.
12. B. L. Heffher, "Attosecond-resolution measurement of polar-
ization mode dispersion in short sections of optical fiber," Opt.
Lett. 18, 2102-2104 (1993).
13. J. D. Jackson, Classical Electrodynamics (Wiley, New York,
1975), p. 302.
14. D. E. Gray, ed., American Institute of Physics Handbook(McGraw-Hill, New York, 1972), pp. 4-138.
15. A. H. Rose and S. M. Etzel, National Institute of Standards
and Technology, Boulder, Colo., 80303 (personal communica-
tion).
1 November 1999 / Vol. 38, No. 31 / APPLIED OPTICS 6515

Appendix D. Birefringence of Quartz
The wavelength dependent group birefringence Ang(k) of quartz is obtained from phase
birefringence An(X) values found in the literature [8, 9]. When discussing birefringence, it is
important to specify whether this is phase birefringence An or group birefringence Ang
. The two
are related as [15]
An = An-A—. (Dl)dX
Fig. Dl illustrates the differences in An and Ang for quartz over the wavelength range of interest.
In practice, the phase birefringence is used in cases where the relative phases of light traveling in
the two polarization eigenmodes is the parameter of interest. For example, the retardance 5 of a
single waveplate (thickness L) depends on the phase birefringence as 3=2nAnL/X. Group
birefringence is used when the parameter of interest is the difference in the velocity of energy
flow between two polarization eigenstates. For example, the PMD of a single quartz plate comes
from the difference in group velocity between the eigenstates, PMD = AngL/c.
0.0096
0.0094
g 0.0092awo 0.009a
1 0.0088
« 0.0086
0.0084
0.0082
1200 1300 1400 1500 1600 1700
Wavelength (nm)
Figure Dl. Spectral dependence of quartz phase (Aw) and group (Awg)
birefringence.
We estimate the group birefringence of quartz by differentiating a fit to published An(X) data for
crystal quartz [8, 9]. Only data in the wavelength range from 900 nm to 2000 nm were used for
the fit. A total of 30 data points were fit with a third-order polynomial, yielding the coefficients:
11910533.0a
° ~ 1265000000.0'
-150779.0Ql ~ 189750000.0'
41

31.02
137500.0'
and
_ -34.0a
' ~ 474375.0"
The coefficients are expressed in this fractional form to preserve their numerical precision. Thephase birefringence is then given by
An(A) = a0 + axA + a
2X
2 +a3A\ ( D2 )
where wavelength X is in units of micrometers (urn). Substituting Eq. (D2) into Eq. (Dl) gives
the expression for group birefringence,
Ang(A) = a
Q- a
2X2 - 2a
3A
3
, ( D3 )
(again, with A, in um). The uncertainty in Ang(k) depends on the uncertainty of the polynomial
coefficients, which comes from the covariance matrix of the fitted coefficients to An(k) [10] and
includes the uncertainty of the literature An(X) values. Wavelength-dependent values of group
birefringence of quartz and the associated uncertainty ofAng are given in Table Dl.
For the purpose of extrapolating mean DGD measurements to other wavelengths, we require
knowledge of the averaged value of Ang over the wavelength range of interest. The expression
for this comes from the integral of Eq. (D3),
<^g h,^ : = a0 -^(V+V2 +V)-4r(^+W2
2 +^ 2
)- (D4)A-2 ~ /tj 5 Z
The uncertainty associated with this estimate of wavelength-averaged Angdepends on the
uncertainty of the polynomial coefficients. Table D2 illustrates wavelength-averaged group
birefringence and the associated uncertainty U((Ang)) for quartz over a set of wavelength ranges.
42

Table Dl. Estimated group birefringence Ang(k) and associated uncertainty U(Ang(X)) for quartz
at the stated wavelength (not a wavelength-averaged value). This table can be used to estimate
A»g(A.) and £/(Aw
g(^))values for any wavelength from 1200 to 1700 nm with a 1 nm increment.
Values for wavelengths omitted from the table are equal to the values at the previous printed
wavelength.
Wavelength (nm) An 2(A,) U(Ang(A.))
1200 A AAA1 A0.00934 A AAAA 1 O0.000015
1244 A AAA1 A0.00934 A AAAA 1 A0.0000191 1/T"71267 0.00935 A AAAA 1 A0.000019
1265 A AAA1
C
0.00935 A AAAA1A0.000020
1257 A AAA1
C
0.00935 A AAAA1
1
0.000021
1305 A AAAO C0.00935 A AAAAT">0.000022i in1323 A AAA1
C
0.00935 A AAAA110.000023i ii n1337 A AAA') /T0.00936 A AAAAT)0.0000231 I/O134z A AAA1/T0.00936 A AAAA1/10.0000241 i/:i1362 A AAA1 £0.00936 A AAAA1
C
0.0000251 107136/ A AAA1/C0.00936 A AAAA1/C0.0000261 in i1391 A AAA1 "7
0.0093 /A AAAAI^0.000026
1422 A AAA1T0.00937 A AAAA1T0.000027
1436 A AAA1
O
0.00938 A AAAA1"70.00002 /
1 A 1
C
1476 A AAA1A0.00939 A AAAA110.000027Kin1 j 1
0
A AAA1A0.00939 A AAAA1/C0.000026
1511 A AAA A A0.00940 A AAAA1/C0.0000261 C A 11543 A AAA/1 10.00941 A AAAA1 £L0.0000261 C A11547 A AAA A 10.00941 A AAAA^> C0.000025
1572 0.00942 0.000025
1575 0.00942 0.000024
1599 0.00943 0.000024
1602 0.00943 0.000023
1625 0.00944 0.000023
1649 0.00945 0.000023
1672 0.00946 0.000023
1683 0.00946 0.000024
1694 0.00947 0.000024
1698 0.00947 0.000025
1700 0.00947 0.000025
43

Table D2. Estimated wavelength-averaged
group birefringence (Ang )^_^ and associated
uncertainty t/((A«g ) V/U )for quartz, averaged
over the range from Xi to X2
1 (nm) X2 (nm)
1200 1250 0.009341 0.000018
1200 1300 0.009343 0.000019
1200 1350 0.009347 0.000020
1200 1400 0.009350 0.000020
1200 1450 0.009355 0.000021
1200 1500 0.009360 0.000022
1200 1550 0.009366 0.000022
1200 1600 0.009372 0.000022
1200 1650 0.009379 0.000022
1250 1300 0.009346 0.000020
1250 1350 0.009350 0.000021
1250 1400 0.009354 0.000022
1250 1450 0.009358 0.000023
1250 1500 0.009364 0.000024
1250 1550 0.009370 0.000024
1250 1600 0.009376 0.000023
1250 1650 0.009384 0.000023
1300 1350 0.009353 0.000023
1300 1400 0.009358 0.000024
1300 1450 0.009363 0.000024
1300 1500 0.009368 0.000025
1300 1550 0.009374 0.000025
1300 1600 0.009381 0.000024
1300 1650 0.009389 0.000024
1350 1400 0.009362 0.000025
1350 1450 0.009367 0.000026
1350 1500 0.009373 0.000026
1350 1550 0.009380 0.000026
1350 1600 0.009387 0.000025
1350 1650 0.009395 0.000024
1400 1450 0.009373 0.000027
1400 1500 0.009379 0.000027
1400 1550 0.009386 0.000026
1400 1600 0.009393 0.000026
1400 1650 0.009402 0.000024
1450 1500 0.009385 0.000027
1450 1550 0.009392 0.000026
1450 1600 0.009400 0.000025
1450 1650 0.009409 0.000024
1500 1550 0.009400 0.000026
1500 1600 0.009408 0.000025
1500 1650 0.009417 0.000024
1550 1600 0.009416 0.000024
1550 1650 0.009426 0.000023
1600 1650 0.009435 0.000023
1480 1570 0.009400 0.000026
44