Standard Operating Procedure I - ywcmatsci.yale.edu MCC XPS SOP-basic.pdf · Version 1.0, June 2016...
42
Version 1.0, June 2016 Standard Operating Procedure I PHI 5000 VersaProbe II XPS/UPS (Basic XPS Measurement) Yale West Campus Materials Characterization Core ywcmatsci.yale.edu ESC II, Room E119E 810 West Campus Drive West Haven, CT 06516
Transcript of Standard Operating Procedure I - ywcmatsci.yale.edu MCC XPS SOP-basic.pdf · Version 1.0, June 2016...

Version 1.0, June 2016
Standard Operating Procedure I PHI 5000 VersaProbe II XPS/UPS
(Basic XPS Measurement)
Yale West Campus Materials Characterization Core ywcmatsci.yale.edu
ESC II, Room E119E 810 West Campus Drive West Haven, CT 06516

PHI 5000 VersaProbe II XPS
2
Yale West Campus Materials Characterization Core

PHI 5000 VersaProbe II XPS
3
Yale West Campus Materials Characterization Core
> Please FOLLOW the SOP strictly to keep the facility in good condition. Any explorations are strongly prohibited unless permitted by lab manager
> NEVER use your own USB drive on the XPS computer. Data can be retrieved from Yale data server
> NEVER surf the web on the XPS computer in order to minimize the risk of the computer being hacked
> Yale West Campus MCC facility users must acknowledge MCC in their publications that rely significantly on MCC resources. The general acknowledgement for SEM should read:
“The spectra were taken using the PHI VersaProbe II at Yale West Campus Materials Characterization Core (MCC)."
> The core reserves the right to use the data for core promotion

PHI 5000 VersaProbe II XPS
4
Yale West Campus Materials Characterization Core

PHI 5000 VersaProbe II XPS
5
Yale West Campus Materials Characterization Core
Table of Contents 1 Introduction ............................................................................................................................. 1
2 System Initial Status Check .................................................................................................... 2
3 Sample Preparation ................................................................................................................. 2
3.1 Sample holders ................................................................................................................. 3
3.2 Sample Mounting ............................................................................................................. 4
4 Create Sample ......................................................................................................................... 5
5 Transfer Sample ...................................................................................................................... 6
6 XPS Scan .............................................................................................................................. 14
7 Closing XPS Measurement ................................................................................................... 22
8 XPS Data Reduction ............................................................................................................. 26
8.1 Survey Data Reduction in MultiPak .............................................................................. 26
8.2 Multiplex (Region Scan) Data Reduction in MultiPak ................................................ 30
8.3 Multiplex Data Reduction in SmartSoft ...................................................................... 33
9 Some Analysis Concepts....................................................................................................... 34
10 Checklist after Experiment ................................................................................................... 35
11 Vacuum Loss Emergency Operation Procedure ................................................................... 36

PHI 5000 VersaProbe II XPS
6
Yale West Campus Materials Characterization Core

PHI 5000 VersaProbe II XPS
1
Yale WEST CAMPUS MATERIALS CHARACTERIZATION CORE
PHI 5000 VersaProbe II XPS/UPS Standard Operating Procedure (Basic XPS Meansurment)
1 Introduction 1) Features of this Instrument:
> Micro-area element composition and chemical state determination on material surfaces > Analysis of insulating samples with dual beam charge neutralization method > Depth profile analysis of structures and interfaces
2) Location
Materials Characterization Core Room E119 810 West Campus Dr West Haven, CT 06516
3) Primary Staff Contact
Min Li, director Tel: 203-737-8270 Email: [email protected] Office: ESC II, Room E119E
Zishan Wu, lab assistant [email protected] 203-824-5563 (cell) Office: ESC II
Yiren Zhong, lab assistant [email protected] 203-710-9820 (cell)
The Yale West Campus MCC Facilities are operated for the benefit of all researchers. If you encounter any problems with this facility, please contact the staff member listed above immediately. There is never a penalty for asking questions. If the equipment is not behaving exactly the way it should, contact a staff member.
Notice: Please follow strictly the SOP to keep the facility under good condition. We DO NOT recommend user explorations on program unless endorsed by core staff.

PHI 5000 VersaProbe II XPS
2
Yale WEST CAMPUS MATERIALS CHARACTERIZATION CORE
2 System Initial Status Check Notice: Before sample preparation and loading, the users are required to check the XPS system status following the steps listed below:
1) Check to see if the XPS instrument is ON, i.e., the green light highlighted by an arrow on the right side control rank is illuminated and there are pressure displays on the vacuum gauge reading: Warning: If you find that the XPS instrument is OFF, contact a MCC staff member for help.
2) Check if the XPS computer is ON. Start the computer if it is OFF. 3) Check the pressure reading of the Main Chamber Ion Gauge on the XPS control rack:
It should be in the range of low 10-7 Pa or high 10-8 Pa when the system is idle. Warning: If the pressure reading is above 8×10⁻⁶ Pa, contact a MCC staff member for help.
4) Sign in on the logbook and put down date, usage time, sample materials, Main Chamber and Intro Chamber initial pressure before sample loading, data collection modes used, and report any issues during measurement.
3 Sample Preparation Warnings:
> Always wear gloves for vacuum sample preparation! > The sample for XPS and UPS needs to be completely dried! If the pumping time
exceeds 1 hour, the sample has to be taken out for further treatment.

PHI 5000 VersaProbe II XPS
3
Yale WEST CAMPUS MATERIALS CHARACTERIZATION CORE
3.1 Sample holders 1) Select a 1 inch regular sample holder for as-is sample analysis
2) Choose 1 inch Heating Sample Holder with heater if in situ heating is required Temperature range: RT – 800 ºC
Warning: > Always use the vacuum only screwdrivers to adjust screws on the holder. The
screws can be easily damaged by using wrong size screwdrivers. Users are not allowed to fix sample holder, report to lab staff immediately.
> Keep Reading Heater Power below 75% when tune the PID control in HCControl program. Violation will lead to damage to the stage and sample holder. User’s account will be suspended and repair cost will be charged on PI’s account.
3) Choose 1 inch Heating/Cooling Sample Holder if in situ cooling and heating required Temperature range: -140 ºC – 600 ºC
Front face Back face
Thermocouple
Heating Front face
Heating area
Thermocouple
Heating Cold finger Front face
Heating area

PHI 5000 VersaProbe II XPS
4
Yale WEST CAMPUS MATERIALS CHARACTERIZATION CORE
4) Contact MCC staff member to run angle resolved (AR) XPS/UPS using AR sample holder
3.2 Sample Mounting
Warning: the maximum sample thickness is 5 mm above sample holder top surface
Notice: The minimal sample size should be 3 mm x 3 mm for XPS and 5 mm x 5 mm for UPS (UV beam size at stage is ~ 4 mm x 4 mm). 1) Non-powder samples:
a) Fix sample with copper clips or Mo cover on the sample holder (the sample can be heated in vacuum):
b) Fix sample using double sided Scotch tape (for XPS only) or carbon tape (for XPS/UPS). (sample cannot be heated in vacuum)
Warning: after sample mounting, shake the sample holder and turn it around to make sure the sample will not come off the holder.
2) Powder Samples: a) Choose Si wafer as support (the sample can be heated in vacuum):
> Add powder in solvents such as ethanol, isopropanol (IPA) or Dichloromethane (DCM) and mix the solution using ultrasonicator.
> Drip small amount of suspension onto a piece of Si wafer (3x3 mm2 ~ 5x5 mm2)
> Dry sample about 10 minutes under infrared lamp > Repeat above steps to have enough deposition on Si substrate > Mount sample on the holder using copper clips or Mo cover if heating is needed
in vacuum; b) Choose double sided tapes (sample cannot be heated in vacuum)
> Sprinkle powder on Scotch tapes (XPS only) or carbon conductive tapes (XPS/UPS), then cover the surface with weighing paper and firmly press the surface with spatula
Warning: carefully remove all loose particles from the sample holder: > Shake and tilt down the sample holder to make sure no additional particles
comes loose > Blow the sample surface with dry N2 inside fume hood
5 mm

PHI 5000 VersaProbe II XPS
5
Yale WEST CAMPUS MATERIALS CHARACTERIZATION CORE
4 Create Sample Notice: “Create Sample” is the first step of data analysis. It SHOULD ONLY be performed before loading the sample into Intro Chamber. The following steps should be taken to create sample (platen):
1) Open SmartSoft-VersaProbe program on desktop (if the program was closed) and click OK (no password required).
2) Click to enter the System window, then click the Sample Transfer on the right side to enter Sample Transfer tab.
3) Click button to open Create Platen (sample) window Warning: once a New Platen Name is created, NEVER change or CREATE new platen names in the middle of data collection. Violations may lead to hardware damages inside vacuum as all sampling positions are affiliated with the initial Platen Name.
4) Create a new platen name and hit OK, the Data Manager Properties window appears.
Make sure sample holder of 25 mm is chosen.

PHI 5000 VersaProbe II XPS
6
Yale WEST CAMPUS MATERIALS CHARACTERIZATION CORE
5) Click Directory and specify the data Acquisition Directory
5 Transfer Sample 1) Check the system status before sample loading:
> Check to ensure the transfer arm is fully retracted that the bullet on magnet touches the stopper ring on the transfer arm
> At the bottom right of the SmartSoft program window, check to confirm X-ray source
is OFF , Electron Neutralizer OFF and Ion gun OFF . Contact Core manager if not OFF.
> Confirm no sample holder inside the Intro Chamber or Main Chamber: only blank square boxes are shown in both chambers.
Stopper ring Magnet
Bullet

PHI 5000 VersaProbe II XPS
7
Yale WEST CAMPUS MATERIALS CHARACTERIZATION CORE
> In above system diagram, check if “V1” valve is closed (in red border) between Intro and Main Chambers. If not, contact MCC staff immediately.
> Check [LM1] building supply N2 pressure on the wall behind computer monitor and make sure it is set below ~ 3 psi. If the pressure is above 3 psi, decrease the pressure setting to 3 psi by turning the pressure regulator valve counterclockwise. Contact MCC staff if need assistance.
2) If the Intro Chamber is in vacuum, click in the Sample Transfer window
Regulator
Gauge

PHI 5000 VersaProbe II XPS
8
Yale WEST CAMPUS MATERIALS CHARACTERIZATION CORE
3) Wait until the Intro Chamber is vented, remove the Viton cover and slide the sample holder along the round groove on the bottom of the sample holder onto the transfer arm fork
4) Make sure the dent on sample holder aligns with and touch the screw on the transfer arm fork and check from side window flange if the holder stays flat on the fork:
5) Leave the top flange open, fully retract the transfer arm so that the bullet on magnet touches the stopper ring on the rod
6) Click button on the Transfer Sample window to take a picture on the samples:
Dent
Screw
Stopper ring Magnet
Bullet

PHI 5000 VersaProbe II XPS
9
Yale WEST CAMPUS MATERIALS CHARACTERIZATION CORE
7) Wait for several seconds, click the tab next to enter the Sample window. Check the sample holder photo and make sure the blue circle aligns well with the bottom rim of the sample holder. If not, contact lab manager.
8) Check carefully the sealing surface of the Viton cover and the groove and clean using
Kimwipes with isopropanol if dusts/particles can be seen and then put the cover back onto the top flange on the Intro Chamber
9) Click button on the Transfer Sample window and go back to Intro Chamber quickly to hold and press the Viton cover against the flange during Intro Chamber pumping! Warning: fail to follow above steps will cause the Intro Chamber leaking during pumping.

PHI 5000 VersaProbe II XPS
10
Yale WEST CAMPUS MATERIALS CHARACTERIZATION CORE
Note: slight rotating adjustments on the Viton cover may help to assure the Viton cover placed correctly on the flange.
10) Check Intro Chamber status right after pumping
> Click to enter the System window, monitor the pressure drop from Stage 1 pressure gauge (Pirani gauge) from atmosphere pressure to ~3.0E+000 Pa in 5 minutes and then Stage 2 pressure gauge (Cold Cathode gauge) starts at ~ 1E-002 Pa and drops continuously to 4.0E-004 Pa required for sample transfer to Main Chamber within ~15 minutes.
Warning: > The actual Intro Chamber pumping time will vary on different samples > It is strongly recommended to make sure user samples are DRY and UHV
(Ultra High Vacuum) compatible. If pumping time exceeds 60 minutes, the samples are required to be removed from Intro Chamber for further processing
11) Before sample transfer to Main Chamber, check the Cold Cathode pressure reading to make sure the Intro Chamber pressure reaches below 4.0E-004 Pa Warning: Sample transfer at high Intro Chamber pressure will introduce serious contaminations to Electron Energy Analyzer, X-ray, UV sources and sample stages.
PHI 5000 VersaProbe II XPS
11
Yale WEST CAMPUS MATERIALS CHARACTERIZATION CORE
12) Click in the Transfer Sample window to transfer sample from Intro Chamber to Main Chamber
Warning: NEVER stop the transfer process in the middle and force to close the SmartSoft program in Task Manager. Contact Core manager immediately if did by accident
13) Wait for the following three windows popped up in sequence:

PHI 5000 VersaProbe II XPS
12
Yale WEST CAMPUS MATERIALS CHARACTERIZATION CORE
14) DO NOT click OK when the last Task Information window above pops up. a) Follows the instruction in Task Information window to move FIRST the transfer
arm into the transfer position in Main Chamber and THEN click OK. b) The transfer positon means that the transfer arm forks slide smoothly into the round
groves on sample holder and the transfer arm magnet touches the sensor on the front stopper ring on transfer arm.
Notice: slight adjustment maybe needed to insert sample holder into the stage forks. Warning: Clicking OK first on above window before the transfer arm is moved into transfer position in Main Chamber will lead to serious mechanical damage to both stage and sample holder. User account will be suspended and repair cost will be charged on PI’s account.
15) Wait the following two windows popped up in sequence:
16) DO NOT click OK when the last Task Information window pops up. Follows the
instruction on Task Information window above to fully retract the transfer arm back to the Intro Chamber FIRST and THEN click OK Warning: Clicking OK first on above window before the transfer arm is retracted will lead to serious mechanical damage to both stage and sample holder. User account will be suspended and repair cost will be charged on PI’s account.
Sensor

PHI 5000 VersaProbe II XPS
13
Yale WEST CAMPUS MATERIALS CHARACTERIZATION CORE
17) After clicking OK Wait in the Task Information window, wait until the stage is driven to the center.

PHI 5000 VersaProbe II XPS
14
Yale WEST CAMPUS MATERIALS CHARACTERIZATION CORE
6 XPS Scan 1) Define analysis Position with the sample in Main Chamber
a) Click on top tab menu to enter Sample window b) Hover mouse cursor over the sample photo window on the left, scroll mouse wheel
to enlarge photo and find the sample to be analyzed
c) Right click mouse on intended analysis position and select Drive To Click on the dropdown menu, the Main Chamber Stage will move to selected position
d) Right click mouse on blue cross cursor select Create Point at Stage on the dropdown menu, an Active Position (ID: 1) will be created in the Position List Table below sample photo window
e) Type Position Name in the Name window above
Sensor
PHI 5000 VersaProbe II XPS
15
Yale WEST CAMPUS MATERIALS CHARACTERIZATION CORE
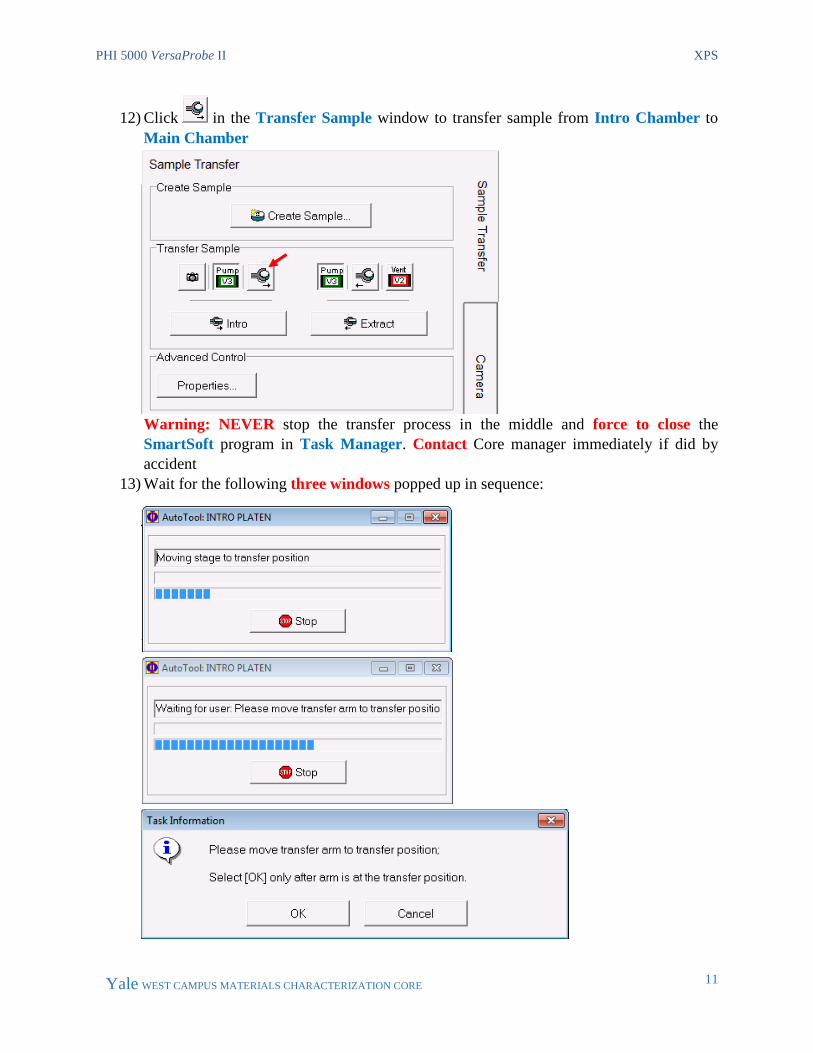
f) Click Stage tab on the right side of Sample window to enter Stage Parameters window and chane Z(mm) height from 5.0 to 12.0 (hit Enter and then hit tab on the right to move stage to entered height)
g) Hit button on top of SXI image window to start Z-Align
h) The following windows will pop up sequentially, wait until all windows disappear

PHI 5000 VersaProbe II XPS
16
Yale WEST CAMPUS MATERIALS CHARACTERIZATION CORE
i) Click above Position List Table to Update Position after Z-Align Warning: this step is critical, or the sample will stay at ~ 5 mm Z height instead of aligned Z height at ~ 17 mm
2) Click tab on top tab menu to enter XPS analysis window and click Spectrum tab on the right side. In Source window, choose FXS (Focused X-ray Source) and in Source Setting window choose 200u50W15kV (X-ray beam size: 200 µm, power: 50 W, and e-beam energy: 15 kV) Note: typically choose 200u50W15kV or smaller power X-ray beam 100u25W15kV if X-ray induced surface damage is a concern. DO NOT choose smaller power starting with smaller beam size of 50um or less which are for X-ray imaging or micro analysis only. The spectral S/N is very low with small X-ray power even after hours of scans.
3) Click on top left of Regions window to enlarge the XPS Regions (Spectrum) window:
4) Click on button on the XPS Regions window to open the Periodic Table, and click on
on the table to start a Spectral Survey (Su) Scan, then close the table.

PHI 5000 VersaProbe II XPS
17
Yale WEST CAMPUS MATERIALS CHARACTERIZATION CORE
5) In XPS Regions window, click to change Pass Energy to typically 187.850 eV, and to typically 0.8000 eV. Close the window.
Notice: for Survey scan, typically highest Pass Energy should be chosen to increase signal sensitivity and larger Step size for a quick scan.
6) Hit in Spectrum window to start Survey scan
7) Wait until the following windows to appear:

PHI 5000 VersaProbe II XPS
18
Yale WEST CAMPUS MATERIALS CHARACTERIZATION CORE
8) The Survey spectrum will appear in the Spectral Window. Notice:
> the data filename starts with Platen Name “Standard samples”, the serial number, spectra scan extension “spe”, and scan type Survey “Su1s”.
> the data files have been automatically saved into specified folder which can be opened in MultiPak program
9) Click above spectrum to start Peak ID
10) Click on top left of Regions window to enlarge the XPS Regions (Spectrum)
window, and click to open Import Elements window
11) Click button in the Import Elements window and hit Close.

PHI 5000 VersaProbe II XPS
19
Yale WEST CAMPUS MATERIALS CHARACTERIZATION CORE
12) The elements detected in Survey Scan are imported into the XPS Regions table as below.
Click to change Pass Energy to typically 23.500 eV, and to typically 0.0500 eV. Close the window. Notice: for Region scan, typically smaller Pass Energy (23.5 – 58.7 eV) and smaller Step size (0.05 – 0.25 eV), and 20 ms Time Per Step should be chosen to increase spectral energy resolution. Warning:
> Always keep in mind that both Signal Sensitivity and Energy Resolution should be considered for Region Scan.
> Set Pass Energy too small (< 23.5 eV) will only lower X-ray intensity/sensitivity and make spectrum noisy;
> Set Step size too small (<0.05 eV) will only increase scan time without too much improvement in energy resolution.
13) Hit in Spectrum window to start Region scan

PHI 5000 VersaProbe II XPS
20
Yale WEST CAMPUS MATERIALS CHARACTERIZATION CORE
14) Wait until the following windows to appear
15) The Region Scan spectra will appear in the Spectral Window following the sequence in Regions table. Notice:
> the data files have been automatically saved into specified folder which can be opened in MultiPak program.
> The Sweep times can be increased if the spectrum is noisy. > The Lower energy and Range can be adjusted to scan the interested regions only. > Pass Energy and Step size setup:
• Good resolution: Pass Energy: 23.5 - 58.7 eV; Step Size: 0.125 to 0.25 eV/step; 20 ms Time Per Step
• Superior resolution: Pass Energy 11.75 eV or lower. Step Size: 0.05 eV/step or lower; 20 ms Time Per Step
> Sweep & Cycle suggestions: • Sweep only to individual created elements or regions • Cycle to all created regions

PHI 5000 VersaProbe II XPS
21
Yale WEST CAMPUS MATERIALS CHARACTERIZATION CORE

PHI 5000 VersaProbe II XPS
22
Yale WEST CAMPUS MATERIALS CHARACTERIZATION CORE
7 Closing XPS Measurement 1) Checklist before Sample Extraction:
> Make sure UV source if used is turned off correctly
2) Click button on the Transfer Sample window, wait until the Intro pressure reaches below 4.0E-004 Pa on Cold Cathode gauge. Warning: Sample transfer at high Intro Chamber pressure will introduce serious contaminations to Electron Energy Analyzer, X-ray, UV sources and sample stages.
3) Make sure that the Intro Chamber pressure reaches below 4.0E-004 Pa and then click
to start Sample Extraction 4) Wait for the following three windows popped up in sequence:

PHI 5000 VersaProbe II XPS
23
Yale WEST CAMPUS MATERIALS CHARACTERIZATION CORE
5) DO NOT click OK when the last Task Information window above pops up. a) Follows the instruction in Task Information window to move FIRST the transfer
arm into the transfer position in Main Chamber and THEN click OK. b) The transfer positon means that the transfer arm forks slide smoothly into the round
groves on sample holder and the transfer arm magnet touches the sensor on the front stopper ring on transfer arm.
Notice: slight adjustment maybe needed to insert sample holder into the stage forks. Warning: Clicking OK first on above window before the transfer arm is moved into transfer position in Main Chamber will lead to serious mechanical damage to both stage and sample holder. User account will be suspended and repair cost will be charged on PI’s account
6) Wait the following two windows popped up in sequence:
Sensor

PHI 5000 VersaProbe II XPS
24
Yale WEST CAMPUS MATERIALS CHARACTERIZATION CORE
7) DO NOT click OK when the last Task Information window pops up. a) Follows the instruction on Task Information window above to fully retract the
transfer arm back to the Intro Chamber FIRST and THEN click OK to close Task Information window.
Warning: Clicking OK first on above window before the transfer arm is retracted will lead to serious mechanical damage to both stage and sample holder. User account will be suspended and repair cost will be charged on PI’s account.
8) The stage will automatically be moved to the transfer position, the Intro Gate Valve V1 will automatically be closed and the following prompt will appear.
9) Click in Sample Transfer window to vent the Intro Chamber
10) Hold the Intro Chamber Viton cover during venting, remove the sample and put the Viton cover back.
11) If there is no immediate user next, the user needs to pump the Intro Chamber back to vacuum: Warning: DO NOT leave the Intro Chamber in air, violation to this step will lead to user account suspension!
a) Click button on the Transfer Sample window and go back to Intro Chamber quickly to hold and press the Viton cover against the flange during Intro Chamber pumping!
b) Warning: fail to follow above steps will cause the Intro Chamber leaking during pumping.
c) Check closely to see the Intro pressure drops from ~ 1.6E+003 Pa to 0.0E+000 Pa and Cold Cathode gauge reads from ~ 2.1E-002 Pa to 3.0E-002 Pa Warning: DO NOT leave the XPS room until Cold Cathode gauge reads low E-002 Pa, which indicates no obvious leak in the Intro Chamber.

PHI 5000 VersaProbe II XPS
25
Yale WEST CAMPUS MATERIALS CHARACTERIZATION CORE

PHI 5000 VersaProbe II XPS
26
Yale WEST CAMPUS MATERIALS CHARACTERIZATION CORE
8 XPS Data Reduction 8.1 Survey Data Reduction in MultiPak
After collecting the survey spectra, open the MultiPak software to reduce the data. The MultiPak Spectrum window and Periodic Table will appear.
Menu Bar Upper Bar
Header
Active filename
Spectrum Window
Lower Toolbar
Region Bar
Status Bar

PHI 5000 VersaProbe II XPS
27
Yale WEST CAMPUS MATERIALS CHARACTERIZATION CORE
1) Click the Last button to open most recently acquired Survey spectrum or click the File button on the upper tool bar and choose the file from a dropdown menu.
> The filename is displayed in green, indicating that this data is “selected.” Any MultiPak functions activated will be performed on this data.
> The header (displayed only when Header in the View menu is checked) lists the file’s data acquisition parameters (date of acquisition, beam voltage of acquisition, etc.).
> The third line of the header will be updated with a processing history as data reduction routines are applied to the data.
2) Click the Peak ID button to identify and label the peaks in the spectrum. This will: > Perform an automatic charge correction based on the position of the C1s peak. > Search its database to identify and label the peaks. > Create a push button for each element in the Region bar at the bottom of the
Spectrum window.

PHI 5000 VersaProbe II XPS
28
Yale WEST CAMPUS MATERIALS CHARACTERIZATION CORE

PHI 5000 VersaProbe II XPS
29
Yale WEST CAMPUS MATERIALS CHARACTERIZATION CORE
3) Verify the accuracy of the labels using your experience and the Handbook of X-ray Photoelectron Spectroscopy. If mistakes were made, you can correct them with one or more of the software tools available.
> To remove a label, click on it and drag it outside the window using the left mouse button or turn OFF the element in the MultiPak Periodic Table by toggling it off with the left mouse button.
> To label a peak or element that was missed by the Auto PeakID routine, you can turn that element ON in the Periodic Table by clicking the button for it. This method will also create a pushbutton at the bottom of the Spectrum window for that new element.
> If you do not know the identity of an unlabeled peak, you can manually search through the database of labels.
> Using the middle or right mouse button, click on an open area of the spectrum. This will display a cursor and list ESCA transitions that occur at the current cursor location.
> While still holding down the mouse button, you can drag the cursor and search around the area of the unknown peak to see what elements occur in that energy range. Note: If you use the right mouse button for this operation, releasing the mouse button places the current label on the display at the location of the cursor. Note: If using the middle mouse button, when you release the mouse button, no labeling will take place. Note: When labeling peaks in this manner, no buttons for the associated elements will be created at the bottom of the window. If you want to add buttons for elements that were not identified by PeakID, you must create them by selecting the element from the Periodic Table.
4) Quantify Data in MultiPak. Quantification of ESCA spectra is most accurate when Peak Area measurements are used. In most situations, it is recommended that you use a Shirley Background Subtraction for making the area measurement.
> To view or change the end points that will be used to define the background subtraction for a specific elemental peak, click the button in the Region Bar at the bottom of the Spectrum window for that element and the software will automatically expand the region for that element’s default peak and display the cursors that are used for background subtraction. If it is necessary to adjust the cursors, click and drag the cursor using the left mouse button. While the cursor is being moved, a line depicting the background will be displayed to assist you in positioning the cursor.

PHI 5000 VersaProbe II XPS
30
Yale WEST CAMPUS MATERIALS CHARACTERIZATION CORE
8.2 Multiplex (Region Scan) Data Reduction in MultiPak After collecting the Multiplex spectra, open the MultiPak software to reduce the data. The
MultiPak Spectrum window and Periodic Table will appear. (For detailed information about the use of MultiPak, refer to the MultiPak Software Manual.)
1) Click the button (which will open the file most recently acquired) or click the File button on the upper tool bar to open the file of choice from a File selection menu.
> Initially, all the individual spectra will be displayed on one energy axis, and there will be a button for each element at the bottom of the Spectrum window (in the Region bar).
> To view the spectrum of an individual element, click the button that represents the element.
> The filename is displayed in green, indicating that this data is “selected.” Any MultiPak functions activated will be performed on this data.
> The header (displayed only when Header in the View menu is checked) lists the file’s data acquisition parameters (date of acquisition, beam voltage of acquisition, etc.).
> The third line of the header will be updated with a processing history as data reduction routines are applied to the data.
2) Quantify Data in MultiPak. Quantification of ESCA spectra is most accurate when Peak Area measurements are used. In most situations, it is recommended that you use a Shirley Background Subtraction for making the area measurement.
> To view or change the end points that will be used to define the background subtraction for a specific elemental peak, click the button in Region bar at the bottom of the Spectrum window for that element and the software will automatically expand the region for that element’s default peak and display the cursors that are used for background subtraction. If it is necessary to adjust the cursors, click and drag the cursor using the left mouse button. While the cursor is being moved, a line depicting the background will be displayed to assist you in positioning the cursor.
> Click the button to view the results of the atomic concentration calculation. > To print the AC Table, open the File pull-down list on the AC Summary
window and click Print 3) Chemical Information in MultiPak.
If the focus of the spectrum is to examine the peak shape and position of the spectra to obtain chemical shift information, there are several software tools in MultiPak to help you with that task. Before reducing the data in a spectrum, a smoothing routine may be applied to the data set to improve the accuracy of peak position and peak area measurements. A Savitzky-Golay Smooth routine is recommended because it retains the original shape of the data curve during the smoothing process. Depending on the size of the data steps in your data and the width of the peaks, a 5-, 7-, or 9- point smoothing

PHI 5000 VersaProbe II XPS
31
Yale WEST CAMPUS MATERIALS CHARACTERIZATION CORE
operation is typically used. To set up the preprogrammed Smooth button, which is displayed on the upper tool bar, click Data>Smooth/DerivativeSetup. The Smooth/Derivative setup options will be displayed below the spectrum. Using the left mouse button, select the Savitzky-Golay Smooth and the desired number of points to be used for smoothing. If you selected nine points, the Smooth button in the upper tool bar will read “SG9.” The smoothing functions operate on the displayed data. If all of the data regions are displayed, all of the regions will be smoothed. If you click the Smooth button a second time, the data will be smoothed twice.
4) Energy Scale Calibration in MultiPak. The first step in extracting chemical information from a peak is to correct the energy scale for any shifts that are due to charging. Typically, this is done by looking at the position of the C1s peak from the hydrocarbon that is present on the surface of most samples. If the C1s peak is not at approximately 284.8 eV, it should be adjusted using the Shift routine.
> To open the Shift routine, select Shift Setup from the Data pull-down list. > When a green cursor appears on the screen, position it with the left mouse button
on the center of the hydrocarbon portion of the C1s peak. Note: When you release the mouse button, the C1s will shift to 284.8eV (or the position defined for C1s in your MultiPak Periodic Table database). Note: If no carbon is present on the sample, a peak from a matrix element with a known chemistry and binding energy may be used in place of the C1s to correct the energy scale for charge-induced shifts. Note: The energy can be read by positioning the cursor on the peak and reading the value on the right side of the lower Spectral Shift tool bar.
5) Binding Energy Identification in MultiPak. The next step in extracting chemical information is to determine the binding energy of the peaks for each element. This can be done in several ways.
> With the peak displayed in the Spectrum window, position the cursor at the center of the peak, using the middle or right mouse button. The location of the cursor is displayed in terms of the binding energy and intensity at the right side of the lower tool bar in the Spectrum window.
> The FWHM/Area Tool may also be used to determine the binding energy of a peak.
> With the peak displayed in the Spectrum window, select the FWHM/Area function from the Tool pull-down list.
> The FWHM/Area Tool routine will automatically search for the most intense peak in the displayed data and display a list of information that describes the peak including its binding energy. A blue cursor is displayed where the software has determined the location of the peak to be. If you want to change this position, grab the cursor using the left mouse button and drag it to the desired location. When you have finished moving the cursor, the displayed information will be updated.
6) Curve Fit in MultiPak.

PHI 5000 VersaProbe II XPS
32
Yale WEST CAMPUS MATERIALS CHARACTERIZATION CORE
If the peak of interest contains more than one chemical state, it may be necessary to use the Curve Fit routine to determine the binding energy of each of the chemical states. To perform a curve fit, use the following steps:
> Make any necessary corrections to the energy scale using the Spectral Shift routine.
> Click the Curve Fit button in Upper Toolbar. > Deselect the Setup mode and adjust the energy cursors for background
subtraction. > Select a Gaussian-Lorentzian peak shape from pop-up Curve Fit Setup
window. (This peak shape is appropriate for most ESCA peaks.) > Define initial bands by pointing and clicking at the desired band position with the
right mouse button. Repeat to add more bands at separate peak positions. > Readjust the initial band estimates by entering numerical values in the Curve Fit
Setup menu, or drag the flags attached to the currently selected band, using the left mouse button.
> Click Fit to start the fitting routine. > Evaluate the resulting peak positions as shapes using your experience, reference
spectra, and database information. > Make any necessary adjustments to the band parameters and click Fit again. > When you are satisfied with the results, hit ViewSumm button on the MultiPak
Spectrum window to see the Summary information. The fitted curve data can also be exported in ASCII by hitting File menu in the Curve Fit Setup window.
> Click Exit to leave the Curve Fit routine. Note: The error (in red) follows the baseline evenly, indicating a good fit. Note: The Curve Fit Summary table contains peak position information that can be used to determine the identity of the chemical state and peak area information to quantify those chemical states. For a more detailed discussion of the Curve Fit software, refer to the MultiPak Software Manual.

PHI 5000 VersaProbe II XPS
33
Yale WEST CAMPUS MATERIALS CHARACTERIZATION CORE
8.3 Multiplex Data Reduction in SmartSoft 1) Spectral Display
> Use the Zoom to enlarge a region of interest and the Right-click Context menu; Fullscreen to revert back.
> Select the Show One. Use the Current Curve to view a single Region.
> Click the Fullscreen button for a full screen view of the Spectral Viewer.
Note: With Profile or Line or Map data displayed; use the Fullscreen Data/Tile button to enlarge the highlighted file’s Spectral or Profile Viewer.
2) Annotate the Spectral Viewer > Double-click within the viewer and type in text to annotate. Click outside the text
box to set the text. > To move the text, click and drag the text to the desired location. > To edit text, double-click over the text box, then edit. Right-click over the text for
more options (cut, copy, paste, delete, etc.). > Right-click over the viewer for additional options, including delete all annotation.
Click the Properties option to open the Graph Annotation Properties box. Use this box to select the text font, size, color, etc.
3) Data Reduction
> Use the 9 Point Savitsky-Golay Smooth to smooth the data.
> Use the Peak Identification to identify peaks
> Use the Energy Cursor to identify peaks
> Use the Element Cursor to identify peaks 4) Output the Data
> Click the button to Copy the selected viewer to the clipboard. This allows the data to be imported as a graphic into any Microsoft Office application (Word, PowerPoint, etc.).
> Click the button to Print the selected viewer to the default printer. NOTE: Annotation changes made to the viewer are not saved as part of the data file.

PHI 5000 VersaProbe II XPS
34
Yale WEST CAMPUS MATERIALS CHARACTERIZATION CORE
9 Some Analysis Concepts • High X-ray Power High sensitivity but poor spatial resolution (beam size is bad) • Low X-ray Power Low sensitivity but good spatial resolution (beam size is good) • High Pass energy High sensitivity but poor energy resolution (peak is FAT) • Low Pass energy Low sensitivity but good energy resolution (peak is THIN) • Big Step size Acquire time is short but peak shape (resolution) is bad • Small Step size Acquire time is long but peak shape (resolution) is good • High sensitivity Signal-to-Noise is better so total acquire time can be shorter • Low sensitivity Signal-to-Noise is worst so total acquire time needs to be longer • Sensitivity = Signal Intensity or counts

PHI 5000 VersaProbe II XPS
35
Yale WEST CAMPUS MATERIALS CHARACTERIZATION CORE
10 Checklist after Experiment 1) Sign out on the logbook and report any problems on instrument. 2) Leave SmartSoft and Watcher programs ON. 3) Do NOT plug personal USB flash drive into the instrument computer for data transfer.
Copy the data to the Core USB flash drive and use the workstation outside to transfer data. 4) Turn OFF computer monitor and the chamber light. 5) Remove sample from holder and clean it with clean wipes and IPA. 6) Store the specimen holder, tongs and other tools in the tool box.
PHI 5000 VersaProbe II XPS
36
Yale WEST CAMPUS MATERIALS CHARACTERIZATION CORE
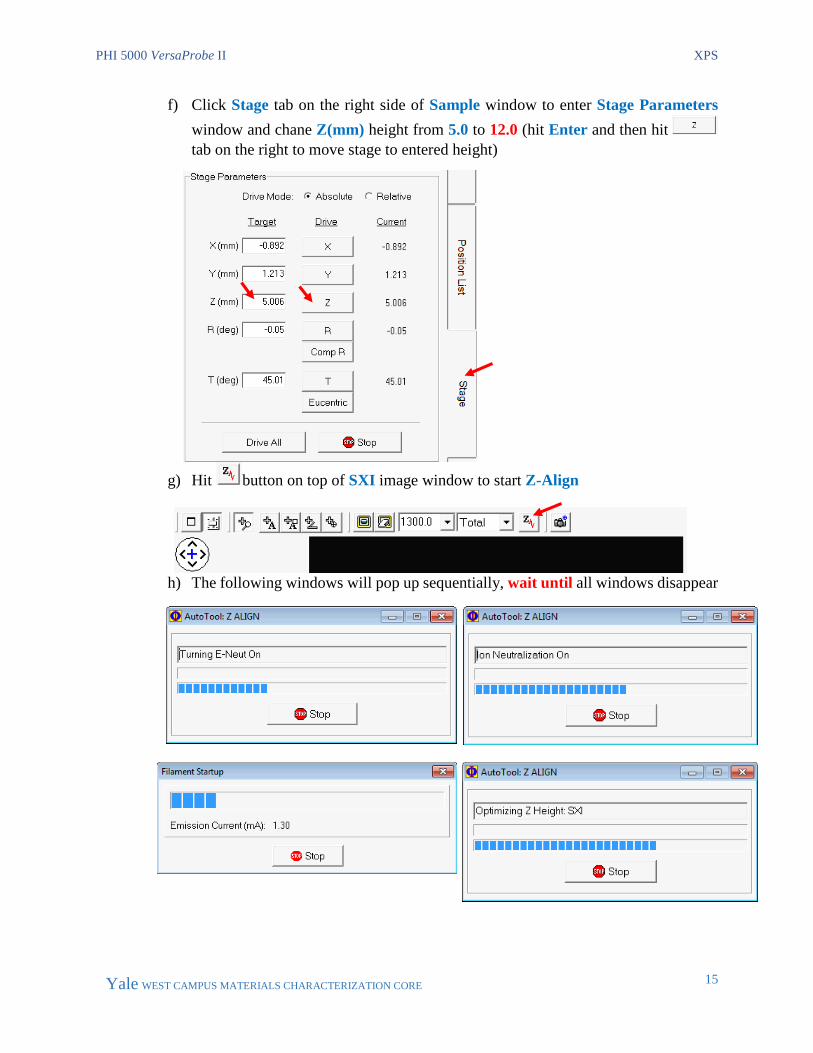
11 Vacuum Loss Emergency Operation Procedure Vacuum Loss:
Case 1: In Main Chamber, opened the UPS leak valve too quickly leading to pressure jump to low 10-3 Pa.
Steps to follow:
1) Close the UPS leak valve quickly and watch the pressure to drop back to 5 x 10⁻⁷ Pa 2) Contact Core stuff to initialize the stage if error message appears during stage movement 3) Leave note on the logbook
Case 2: In Main Chamber, when finishing UPS scan, closed UPS 1 and 2 valves first and left UPS leak valve open, leading to main chamber pressure drop to low 10-3 Pa.
Steps to follow:
1) Close the UPS leak valve quickly and watch the pressure to drop back to 5 x 10⁻⁷ Pa 2) Contact Core stuff to initialize the stage if error message appears during stage movement 3) Leave note on the logbook
Case 3: In Intro Chamber, the cover was NOT placed properly, leading to extra pumping time (> 10 minutes) for first stage rotary pump and failed for second stage pumping by turbo pump pressure staying ~10+1 Pa longer than 10 minutes.
which then either turns off the ion gauge and/or the ion pumps, but the Main Chamber pressure is still likely to be less than 1 × 10⁻² Pa.
Steps to follow:
1) Readjust the cover by pressing and slight turning and check if the pressure drops quickly, if NOT
2) Vent the intro chamber in SmartSoft and take the cover off. Check inner side gasket for any dents, particles, clean with wipes and IPO. Put the cover back, make sure the cover is placed properly and start pumping. If the pressure is still not dropping normally, contact Core stuff
3) Leave note on the logbook