Standard Methods for Open Hole Tension Testing of Textile ... · Tension Testing of Textile...
34
NASA Contractor Report198262 NASA-CR. 198262 • 19960012500 Standard Methods for Open Hole Tension Testing of Textile Composites M. A. PortanovaandJ. E. Masters LockheedMartin Engineeringand SciencesCompany, Hampton, Virginia Contract NAS1-19000 December1995 LIBRARY COPY i ii National Aeronautics and I SpaceAdministration JAN 3 11996. I • LangleyResearchCenter Hampton, Virginia 23681-0001 LANGLEY RESEARCH CENTER lIBRARY NASA . ,, HAMPTON, VIRGINIA https://ntrs.nasa.gov/search.jsp?R=19960012500 2018-06-13T14:24:29+00:00Z
Transcript of Standard Methods for Open Hole Tension Testing of Textile ... · Tension Testing of Textile...
NASA ContractorReport198262
NASA-CR. 198262
• 19960012500
Standard Methods for Open HoleTension Testing of Textile Composites
M. A. Portanovaand J. E.MastersLockheedMartin Engineeringand SciencesCompany,Hampton,Virginia
ContractNAS1-19000
December1995
LIBRARYCOPYi
ii
National Aeronautics and ISpaceAdministration JAN3 11996.I• LangleyResearchCenter
Hampton, Virginia 23681-0001 LANGLEYRESEARCHCENTERlIBRARYNASA.
,, HAMPTON,VIRGINIA
https://ntrs.nasa.gov/search.jsp?R=19960012500 2018-06-13T14:24:29+00:00Z


3 1176 01423 8191
Introduction
Textile composites are candidate materials for damage tolerant• designs because they offer through-the-thickness reinforcement
which aids in the prevention of damage progression. Textilecomposites have a less homogeneous nature than compositesconstructed from pre-preg tape. Consequently, standard testingmethods developed for tape composites may not be adequate tocharacterize these materials. Because of this concern, NASA'sAdvanced Composite Technology Program (ACT) funded researchersat the Boeing Defense & Space Group to investigate the effects ofspecimen geometry and loading mode on the measurement of thetextile composites' mechanical properties, Ref. [1].
This report evaluates the open hole tension test methods usedby Boeing and other investigators in the ACT program. The intentionis to develop a standard open hole tension test method that considersthe effects of hole size, hole size to specimen width ratio, specimenthickness, and the architectural variation in textile composite forms.Because no testing standards exist for textile composites, mostresearchers use guidelines established for the testing of tapecomposites. One aspect of this investigation is to determine if thesestandard testing methods are suitable for use on textile materials.
This investigation will compare the results of several researchprograms evaluating the material response of similar textilearchitectures. Test results from independent studies conducted atWest Virginia University (WVU), Lockheed Aeronautical Systems,and Boeing Defense and Space Group will be evaluated andcompared. Boeing conducted the only investigation explicitlydesigned to determine the effects of specimen thickness, width, andhole size on measurements of material properties. The results fromthe Boeing study will be the primary focus of this paper.


Description of Materials
• The primary contributor of test data to this report was BoeingDefense and Space Group in Philadelphia, PA. Supplemental data,
. obtained from Lockheed Aeronautical Systems in Marietta, GA. andWest Virginia University (WVU), is also presented. Most of the datawas derived from tests on two-dimensional (2-D) triaxial braids andthree-dimensional (3-D) interlocking weaves. Lockheed alsoevaluated a three dimensional braid. Some results for stitcheduniweaves, tested at Boeing, are also presented.
Boeing and WVU evaluated identical 2-D braided architectureswhile Lockheed's braids were slightly different. All of the 2-D and3-D fabric preforms were manufactured by an outside source andthen resin transfer molded (RTM) at Boeing or Lockheed facilities.The specifics of each test material are described in the followingsections. All of the fabrics were constructed using Hercules AS4fibers. The various resin systems employed were formulated to haveproperties similar to Hercules 3501-6. Each resin system is a low-cost brittle epoxy system with low viscosity at melt temperature,thereby lending themselves to the resin transfer molding process.
2-Dimensional Triaxial Braid Architectures
All of the 2-D fabric preforms were braided by FiberInnovations Inc., Norwood, MA. The Boeing and WVU materialsfeatured Shell RSL-1895 epoxy resin. Details of their manufacture,which was performed at Boeing, can be obtained from Ref. [2], "ResinTransfer Molding of Textile Composites".
Boeing compared four different braided architectures. Thespecifics of each are given in Table 1. In Tables 1 & 2, the followingnomenclature has been adopted to describe the iayup:
[0XXK/_+0XXK]Y% Axial
where XX indicates the yarn size, K indicates thousands and Yindicates the percentage of axial yarns in the preform. An
|
illustration of the 2-D braided architecture is given in Figure 1.
3

In Table 1, the three letters preceding the "[0XXK/+0XXK] Y%Axial" nomenclature are intended as abbreviations where "S" and "L"mean "Small" and "Large", respectively. For example, the SLL[030K/+706K]46% braid is deciphered as containing a small (6K)braider yarn, a large (46%) percent of axial yarns, and a large (70 °)braid angle.
Table 1. Boeing's 2-D Braided Composites Architectures.
Braid Code Axial Tow Braided % Axial Braid Unit Cell Unit CellSize Tow Size Tow Angle[°] Width linl Length [in]
SLL [030K/+706K]46% 30 K 6 K 46 +70 0.458 0.083
LLS [036K/+4515K]46% 36 K 15 K 46 +45 0.415 0.207
LLL [075K/+7015K]46% 75 K 15 K 46 +70 0.829 0.151LSS [06K/+4515K]12% 6K 15 K 12 +45 0.415 0.207
rn
UnitCell
i Height
AxialYarn _ BraidAngleUnitCellWidth
Figure 1. Illustration of a typical 2-D Triaxial Braid Configuration.
Lockheed's 2-D braids featured PR-500 epoxy resin. Theselaminates, which were manufactured at Lockheed's facility inMarietta, GA, utilized the two different triaxial braided architecturesdescribed in Table 2.
4

Table 2. Lockheed's 2-D Braided Composite Architectures.Braid Code Longitudinal Braided Tow % Axial Braid Angle
Tow Size Size Tow l*]
[O12K/+606K]33% 12K 6 K 33.3 +60[024K/+606K]50% 24K 6 K 50 +60
i
The Unit Cell
Textile composites have been shown to have a repeatinggeometrical pattern based on manufacturing parameters. Thisrepeating pattern is often called the "unit cell." It is defined as thesmallest section of architecture required to repeat the textile pattern.
One purpose of this investigation was to define a test specimengeometry that will ensure that representative volumes of materialare tested and that valid material properties are established.
Although some braid parameters, such as tow size and braidangle, may be explicitly defined, calculation of unit cell dimensionstend to be somewhat subjective. Unit cell dimensions are based onvarying interpretations of the textile architecture. For the purpose ofthis paper, the unit cell width is defined as two times the spacing ofthe axial tows. The unit cell length is calculated by multiplying thecotangent of the braid angle by half the unit cell width. Axial towspacing can be calculated by multiplying the braider mandreldiameter by rt, then dividing the result by the number of axial yarncarriers. An illustration of the unit cell width and length areprovided in Figure 1.
Unit cell dimensions vary between each of the braided materialforms. As shown in Table 1, the SLL [030K/+706K]46%, LLS[036K/+4515K]46%, and LSS [06K /+4515K]12% all had unit cells ofsimilar width but for the SLL [030K/+706K]46% material, the unit celllength was less that half that of the other architectures. The LLL[075K/_.+7015K]46% material's unit cell was approximately twice as
• wide as the other three architectures but it's length was shorter thanall but one of the braids. These various parameters are a result of
, the braiding process, tow size used, and braid angle.
5
3-Dimensional Architectures
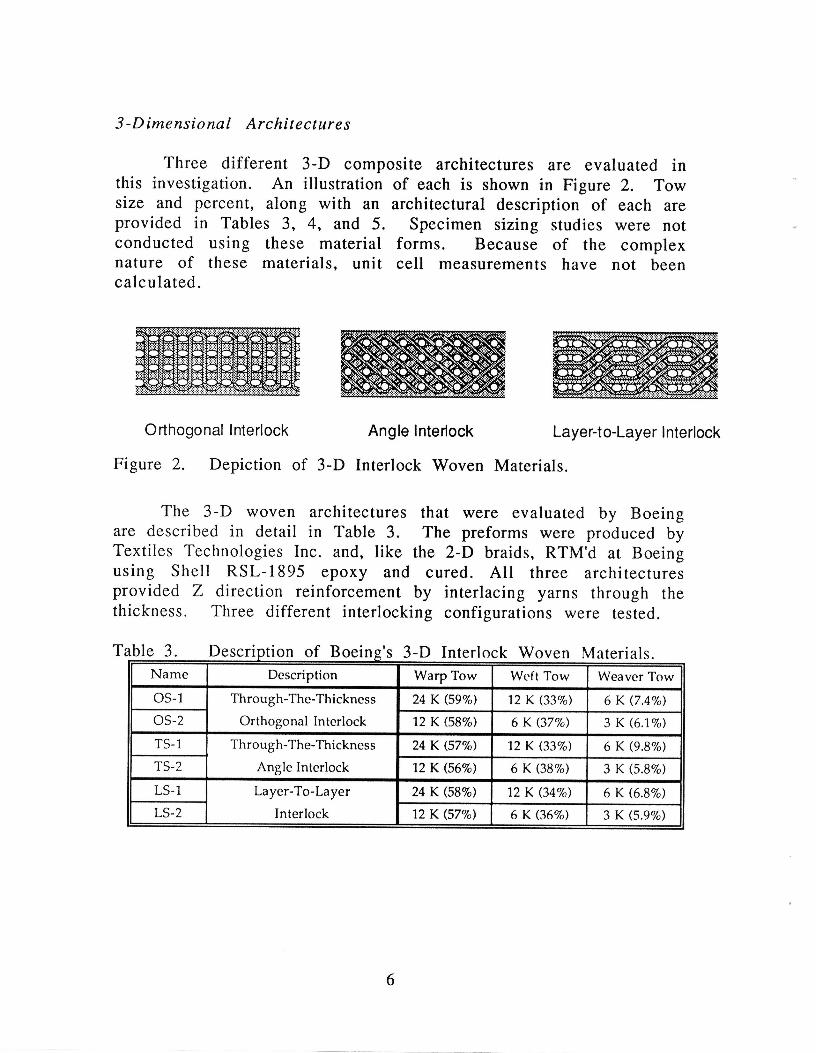
Three different 3-D composite architectures are evaluated inthis investigation. An illustration of each is shown in Figure 2. Towsize and percent, along with an architectural description of each areprovided in Tables 3, 4, and 5. Specimen sizing studies were notconducted using these material forms. Because of the complexnature of these materials, unit cell measurements have not beencalculated.
0 rthogonal Interlock Angle Interlock Layer-to-LayerInterlock
Figure 2. Depiction of 3-D Interlock Woven Materials.
The 3-D woven architectures that were evaluated by Boeingare described in detail in Table 3. The preforms were produced byTextiles Technologies Inc. and, like the 2-D braids, RTM'd at Boeingusing Shell RSL-1895 epoxy and cured. All three architecturesprovided Z direction reinforcement by interlacing yarns through thethickness. Three different interlocking configurations were tested.
Table 3. Description of Boein_'s 3-D Interlock Woven Materials.Name Description Warp Tow Weft Tow Weaver Tow
OS-1 Through-The-Thickness 24 K (59%) 12 K (33%) 6 K (7.4%)
OS-2 Orthogonal Interlock 12 K (58%) 6 K (37%) 3 K (6.1%)
TS-1 Through-The-Thickness 24 K (57%) 12 K (33%) 6 K (9.8%)
TS-2 Angle Interlock 12 K (56%) 6 K (38%) 3 K (5.8%)
LS-1 Layer-To-Layer 24 K (58%) 12 K (34%) 6 K (6.8%)
LS-2 Interlock 12 K (57%) 6 K (36%) 3 K (5.9%)
6

Lockheed looked at two different interlocking wovenconfigurations in tension. These are described in Table 4. Both
• provided true through the thickness reinforcement by interlacingyarns in the z direction. The preforms were produced by TextilesTechnologies Inc. and then RTM'd at Lockheed using PR-500 epoxy.
' Lockheed preforms were similar in design to those tested by Boeingbut were constructed with different size tows and a different percentof axial yarns. Thus, a direct comparison can not be made withBoeing's results.
Table 4. Lockheed's 3-D Woven Orthogonal Interlock CompositeArchitectures.
Name Description Warp Tow Weft Tow Weaver Tow
'ITr-2 Through-The-Thickness 12K (47.7%) 6 K (44.4%) 3 K (7.9%)
"ITI'-3 Orthogonal Interlock 6 K (46.1%) 6 K (46.5%) 3 K (7.4%)
LTL-1 Layer-to-Layer 6 K (45.7%) 6 K (46.1%) 3 K (8.2%)
LTL-2 OrthogonalInterlock 12K (46.3%) 6 K (45.6%) 3 K (8.1%)
LTL-3 6 K (46.3%) 6 K (46.7%) 3 K (7.0%)
Lockheed also produced and tested a series of threedimensional braids. Three braid configurations were evaluated. Thespecifics of each are described in Table 5. These 3-D fabrics werebraided by Atlantic Research Corp. and then RTM'd at Lockheedusing PR-500 epoxy resin.
Table 5. Lockheed's 3-D Braided Architectures.
Name Braid Angle Axial Tow Bias Tow"ITF-1 + 60 6 K (30.3%) 6 K (69.7%)
"ITl'-2 + 60 18K (56.3%) 6 K (43.7%)
"/Tr-3 +60 6 K (38.9%) 6 K (61.1%)
7

Stitched Uniweaves
Stitched uniweaves tested by Boeing were also evaluated. Theuniweave fabric was produced by Textile Technologies Inc. and thenRTM'd at Boeing. Stitching of the uniweaves was performed outsideBoeing by Cooper Composites. All of the materials tested were quasi-isotropic [+45/0/-45/9016s layup. Stitching media and density wasvaried. The specifics of each preform are described below in Table 6.An illustration of a typical stitched uniweave is shown in Figure 3.
0° Direction
Stitch /Spacing .--_
PitchSpacing
_90 °Direction
Figure 3. Depiction of Boeing's Stitched Uniweave.
Table 6. Description of Boeing's Stitched Uniweaves.
Name Stitch Material Pitch Spacing Stitch Spacing Stitch Tow Size
Stitches per inch [inl
SU-1 $2 Glass 8 0.125 3 K
SU-2 $2 Glass 8 0.125 6 K
SU-3 Kevlar 29 8 0.125 6 K
SU-4 Kevlar 29 4 0.250 6 K
SU-5 Kevlar 29 8 0.125 12 K
Test Specimen Configuration & Testing Methodology
Boeing's Open Hole Tension Test Matrix
• Although Boeing tested braided, woven, and stitched materials,they conducted specimen size experiments on the 2-D braidedmaterials only. The results of these sizing experiments were thenused to establish the test specimen dimensions for the 3-D weavesand stitched laminates.
The basic specimen used in this program is a straight sidedcoupon and is illustrated in Figure 4. Two specimen thickness, 1/8"and 1/4" were investigated. The specimen length was kept constantat 11.5 inches Various specimen widths and hole diameters wereevaluated. Width to diameter (W/D) ratios of 4, 6, and 8 were used.
The test matrix used by Boeing is given in Table 7. This testmatrix was chosen to optimize the information obtained from thelimited number of test specimens to allow the investigation ofthickness, hole diameter, and W/D ratio effects• Only the SLL[030K/+706K]46% and LLS [036K/+4515K]46% architectures have testresults available at a common hole size for each of the W/D ratiosevaluated. Consequently most of the analysis will be based on theresults from these two materials.
Boeing tested stitched uniweaves and 3-D weaves using a morelimited number of test specimens. Five different stitched uniweavesand six different 3-D weaves were tested to failure. Again, thestraight sided coupon described in Figure 4 was used.
All of the Boeing specimens were loaded in tension in a servo-hydraulic load frame using hydraulic grips. Load was induced at aconstant stroke rate of 0.05 inches per minute• Load cell :output andmachine stroke were recorded. No strain measurements were made.
9

_ +.003"
CL F 13-.ooo"
Width - L "
J._l II
11.5" -I
Figure 4. Boeing Straight Sided Tension Coupon.
Table 7. Boeing Test Matrix for Open Hole Tension Test Program.
Dimensions Material SystemsWidth Diameter W/D SLL SLL LLS LLS LLL LLL LSS LSS Others
lin] [in] 1/8" 1/4" 1/8" 1/4" 1/8" 1/4" t/8" 1/4" (1)
1.50 .375 4 3 3 3 3 3
1.50 .250 6 3 3 3 3 3
1.50 .188 8 3 3 3 3 3
2.25 .562 4 3 3 3 3 3 3 3 3
2.25 .375 6 3 3 3 3 3 3 3 3
2.25 .281 8 3 3 3 3 3 3 3 3
3.00 .750 4 3 3 3 3
3.00 .500 6 3 3 3 3
3.00 .375 8 3 3 3 3
27 27 27 27 9 9 9 9 99
(1) Five Stitched Uniweave and Six 3-D Woven Materials.
Other Data Evaluated
Investigators at West Virginia University (WVU) conducted anotch sensitivity study of textile composites using the same 2-Dtextile architecture used in Boeing's sizing effects study, Ref. [3]. Theobject of the WVU study was to examine the effect of notches on the2-D braided materials. The test matrix used in this study is given in .Table 8. Specimen width to hole diameter ratio was kept constantwith W/D = 4. Aluminum end tabs were bonded to the ends of thecoupons. An illustration of WVU test specimen is given in Figure 5.
10
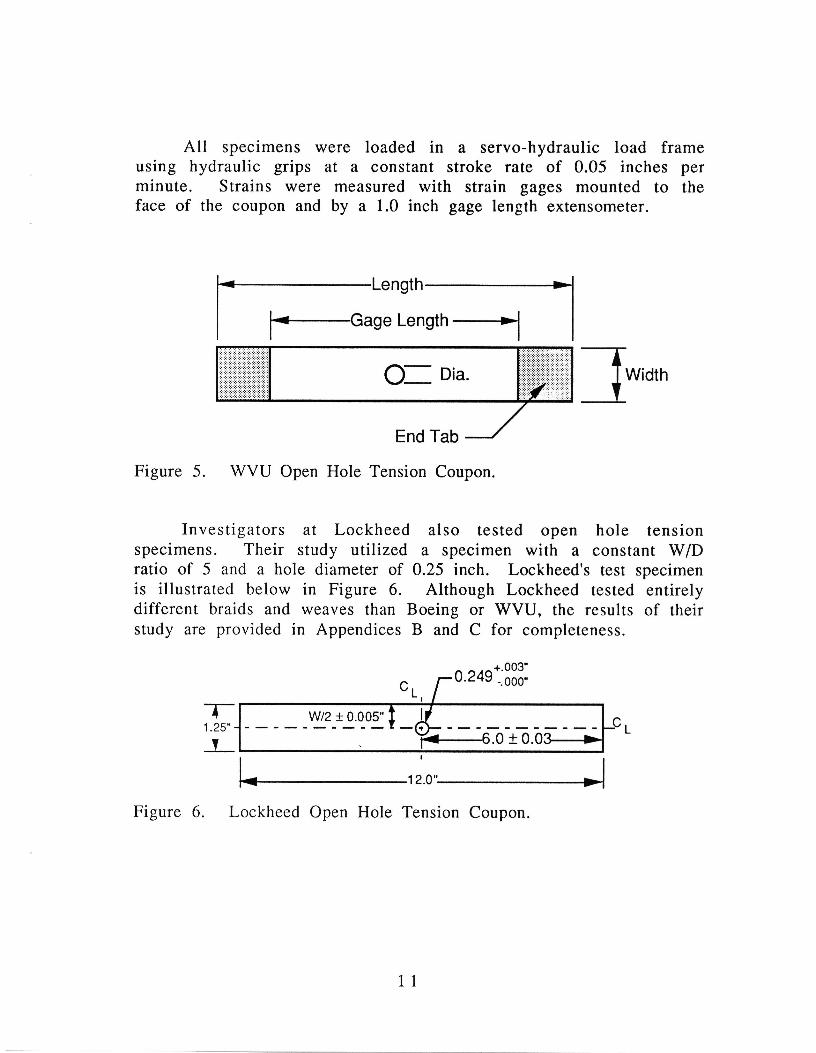
All specimens were loaded in a servo-hydraulic load frameusing hydraulic grips at a constant stroke rate of 0.05 inches perminute. Strains were measured with strain gages mounted to theface of the coupon and by a 1.0 inch gage length extensometer.
_ Length _1L... Gage Length "---_
O--Dia. !_ t--_Width
End Tab J
Figure 5. WVU Open Hole Tension Coupon.
Investigators at Lockheed also tested open hole tensionspecimens. Their study utilized a specimen with a constant W/Dratio of 5 and a hole diameter of 0.25 inch. Lockheed's test specimenis illustrated below in Figure 6. Although Lockheed tested entirelydifferent braids and weaves than Boeing or WVU, the results of theirstudy are provided in Appendices B and C for completeness.
. _+.003"
C /--0.249. ooo"L,
/ - -_+6.b LI
Figure 6. Lockheed Open Hole Tension Coupon.
11

Table 8. WVU Open Hole Tension Test Specimens.Specimen Specimen Hole Gage Number of
Width Length Diameter Length Specimens1.0 6.0 0.25 4 "12,152.0 11.0 0.50 8 54.0 12.0 1.0 9 5
*Number of Unnotched specimens
Data Reduction Method
Open hole tension strengths can be calculated using either thegross area or the net section area. Gross stress calculations can alsobe corrected for finite width effects. The corrected gross stress is themost readily used in design when size is large.
For an infinitely wide orthotropic plate with a hole (Figure 7),the stress at the edge of the hole is given by"
_,,(y =O)=K_S (l)
where: (_xx is the local stress in the loading direction,S is the remote stress, and
K_ = !+ _J2(q!_ l Ey - V.)+ Ex l G,y (2)
For the isotropic case where Ex/Er =1, this reduces to
A method of correcting gross stress for finite width was usedfor all data analysis presented in this paper. An isotropic finitewidth correction factor was obtained from Ref. [4]. This factor isdefined as the ratio of the stress concentration factor (SCF) in thefinite width coupon to the SCF for a hole in an infinite plate.
12
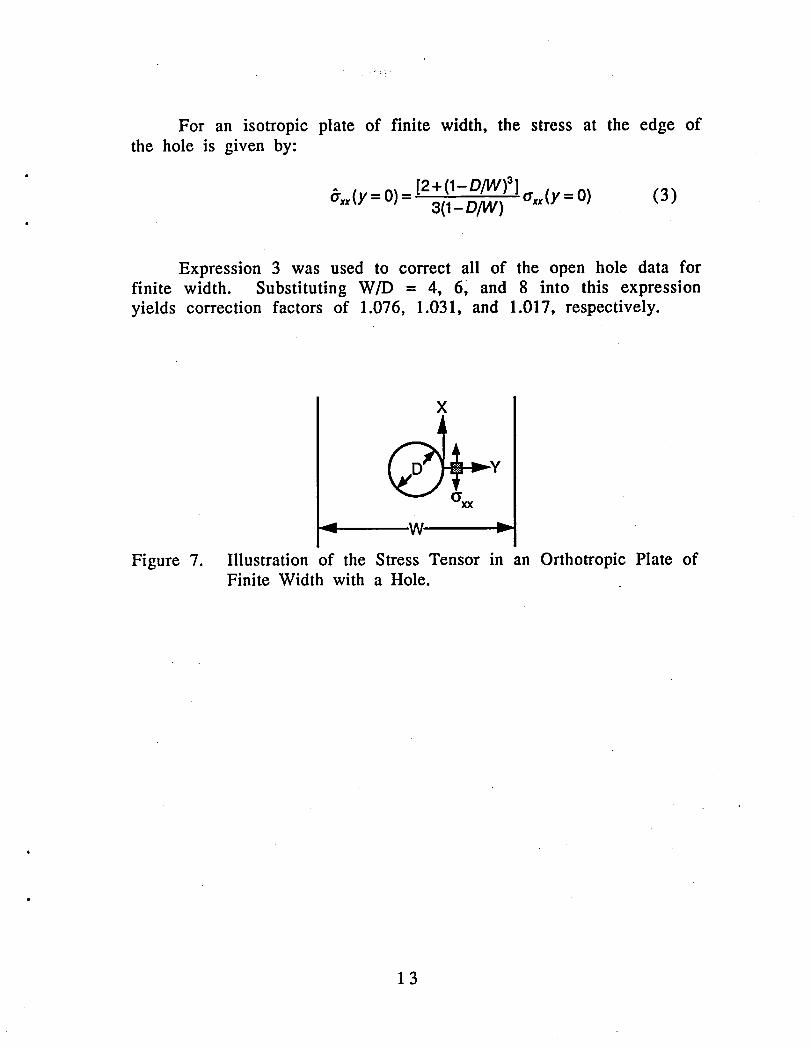
For an isotropic plate of finite width, the stress at the edge ofthe hole is given by:
axx(y= O)= [2+(1-O/W)3l _,,,tlY= O) (3)3(1-D/W)
Expression 3 was used to correct all of the open hole data forfinite width. Substituting W/D = 4, 6, and 8 into this expressionyields correction factors of 1.076, 1.031, and 1.017, respectively.
X
_V
Figure 7. Illustration of the Stress Tensor in an Orthotropic Plate ofFinite Width with a Hole.
13

Discussion of Results
Sizing effects have been investigated by comparing the openhole failure strengths of each of the four braided architectures listedin Table 1. Three parameters; specimen thickness, hole diameter, and --the ratio of width to hole diameter were investigated. The data usedwere generated by Boeing and are available in Appendix A.Comparisons of these results were made with Boeing's stitcheduniweaves, Lockheed's 2-D braids and 3-D weaves, and WVU's 3-Dweaves. Summaries of the test results for the stitched and 3-Dmaterials are given in Appendix B and C. Each of the values listed inthe appendices are the average of three tests. The percentcoefficients of variation (CoV%) for each set of test are also given.
Thickness Effects
Boeing's test matrix included both 1/8" and 1/4" nominalthickness 2-D braids. WVU tested the same 2-D braided architectureas Boeing, but only at the 1/8" thickness. No common width/holesize existed between the test matrices. Lockheeds 2-D Braids,although similar in thickness to the 1/8 braids tested at WVU andBoeing, were of a completely different architecture. Unfortunately, adirect comparison can not be made between Lockheed's and WVUtest results and those from Boeing.
Boeing's test matrix permitted an evaluation of thicknesseffects for two of the four braided architectures studied. Test resultsare available for the SLL [030K/+7 06K ]46 % and the LLS[036K/_.+4515K]46% architectures with a common hole diameter of0.375 inches (3/8") at each W/D ratio. In an attempt to investigate ifthickness has an effect on ultimate strength, average failure strengthhas been plotted against the W/D ratio for a constant hole diameterin Figures 8 and 9. Failure strength for both 1/8" and 1/4" thicknessare given. Each symbol is an average of three experiments. Onestandard deviation from the mean is indicated by the error bars.Linear curves are fit to the data using a least squares fit routine.Failure stress has been corrected for finite width and the W/D ratiosplotted are nominal values, o
14

k
120 .... i .... i .... I .... | .... i ....
100
Average 80FailureStressCorrectedforFinite Width,
Ksi 60
40--13--1/8"NominalThickness
20 -G 1/4"NominalThickness
SLL2-DBraidMaterial,0.375HoleDiameterI l I l | I I I , I . . . . l . . . • l | • I l a • • . . i
3 4 5 6 7 8 9
RatioofSpecimenWidthtoHoleDiameter
Figure 8. Effect of Specimen Thickness on Open Hole TensionStrength. SLL 2-D Braid with a 0.375 Diameter Hole.
Figure 8 is a plot of the average corrected failure strengthversus specimen width to hole diameter for the SLL [030K/--.+706K]46%
material. A lower average failure stress was obtained with thethicker specimens. Their strengths were as much as 17 ksi, or 24percent, lower. However, the scatter in the data, displayed by theerror bars, overlapped, in all cases. The standard deviationsmeasured for these data ranged from 4.5 to 9.3 ksi. Thus, the effectof thickness is small compared to the data scatter.
Figure 9, a plot of the average corrected failure strength versusspecimen width to hole diameter for the LLS [036K/+4515K]46%material, shows similar results. This material's failure strengthvaried by as much at 13 ksi, or 19 percent. The range of standard •deviations was from 1.1 to 5.8 ksi. Notice that at W/D = 6, one
• standard deviation from the mean was from 1.1 to just 2.1 ksi andthat the mean values were within 5 percent of each other. Again, the
, effect of thickness is small.
15

120
100-Average
FailureStress80-Correctedfor ,._
FiniteWidth........ _ .._Ksi .........60-
40-
-B.-1/8" NominalThickness20- -G_ 1/4"NominalThickness
LLS2-D BraidMaterial,0.375HoleDiameter0
3 4 5 6 7 8 9
Ratioof SpecimenWidthto HoleDiameter
Figure 9. Effect of Specimen Thickness on Open Hole TensionStrength. LLS 2-D Braid with a 0.375 Diameter Hole.
Hole Diameter Effects
The failure strength of conventional composite materials aregreatly influenced by the presence of a notch or hole. Compositematerials that have linear stress-strain relationships to failure tendto be very notch sensitive. Textile composites having a balancedarchitecture, such as those tested by Boeing and WVU, have a stress-strain behavior similar to that of a quasi-isotropic tape laminate.They tend to exhibit fairly linear response during loading untilfailure. Because of this similarity to tape laminates, it is suspectedthat textile composites may be fairly notch sensitive.
The effect of hole size on failure strength has been evaluatedusing the SLL [030K/+706K]46% and LLS [036K/+4515K]46%architectures. In order to limit the dependent variable to just holesize, failure stress has been averaged for each hole size and plottedindividually against the various W/D ratios in Figures 10 and 11.The results for each thickness have been plotted separately. Errorbars, displaying one standard deviation from the mean of the failure
16

strength are shown and logarithmic curves have been fit to the data.Failure stress was corrected for finite width and hole diameters
• plotted are nominal values.
Figure 10 is a plot of the SLL [030K/+706K]46% data for the• nominal 1/8 inch thick test coupons. Data from the Boeing and WVU
test programs are shown. Failure stress tends to decrease withincreasing hole size at all W/D ratios. This effect is most Significantin the WVU W/D = 4 data. The WVU data, which contains holes of upto 1 inch in diameter, have as much as a 34 ksi, or 65 percent,decrease in failure strength over the range of hole sizes tested. Thestandard deviations of these data ranged from 1.7 to 0.74 ksi. Thus,the hole diameter has a significant effect.
• 120 - , , , ,
Average 100-}" ""-_r.,__,:_
FailureStress80-CorrectedforFinite Width, " - .
Ksi 60- "-- ---- -.,... _
40- _Boeing Data,W/D = 4-o. BoeingData,W/D = 6.... BoeingData,W/D = 8
20- _ WVU Data, W/D = 4
SLL 2-D Braid Material, 1/8" Nominal Thickness0 , I , , = I • • • ' • ' , I , , ,
0.2 0.4 0.6 0.8HoleDiameter,inch
Figure 10. Effect of Hole Diameter on Open flole Tension Strength.SLL 2-D Braid at 1/8" Nominal Thickness.
Hole size appears to have much less effect on the Boeing testresults. At W/D = 4, the •Boeing data showed a 14 percent or 11 ksidifference between the minimum and maximum value in failurestrength over the range tested. At this W/D ratio, one standarddeviation in the test results ranged from 1.8 to 5.2 ksi. The W/D = 6
' data behaved in a similar fashion. These experiments resulted in a
17
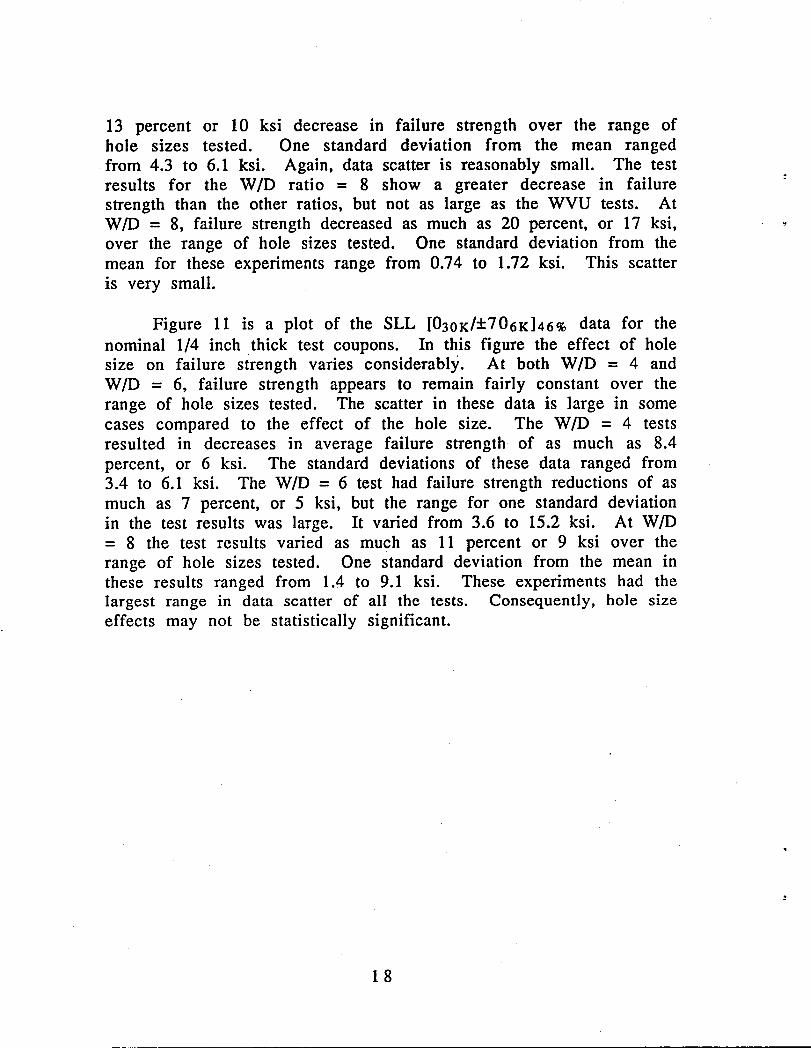
13 percent or 10 ksi decrease in failure strength over the range ofhole sizes tested. One standard deviation from the mean rangedfrom 4.3 to 6.1 ksi. Again, data scatter is reasonably small. The testresults for the W/D ratio = 8 show a greater decrease in failurestrength than the other ratios, but not as large as the WVU tests. AtW/D = 8, failure strength decreased as much as 20 percent, or 17 ksi,over the range of hole sizes tested. One standard deviation from themean for these experiments range from 0.74 to 1.72 ksi. This scatteris very small.
Figure 11 is a plot of the SLL [030K/+706K]46% data for thenominal 1/4 inch thick test coupons. In this figure the effect of holesize on failure strength varies considerably. At both W/D = 4 andW/D = 6, failure strength appears to remain fairly constant over therange of hole sizes tested. The scatter in these data is large in somecases compared to the effect of the hole size. The W/D = 4 testsresulted in decreases in average failure strength of as much as 8.4percent, or 6 ksi. The standard deviations of these data ranged from3.4 to 6.1 ksi. The W/D = 6 test had failure strength reductions of asmuch as 7 percent, or 5 ksi, but the range for one standard deviationin the test results was large. It varied from 3.6 to 15.2 ksi. At W/D= 8 the test results varied as much as 11 percent or 9 ksi over therange of hole sizes tested. One standard deviation from the mean inthese results ranged from 1.4 to 9.1 ksi. These experiments had thelargest range in data scatter of all the tests. Consequently, hole sizeeffects may not be statistically significant.
18

120 .... ,.... ..... ,.... ,.... ,.... ,....
• 100.
Average 80. -_ _.• FailureStress ;[,Correctedfor " 'J'Finite Width,
Ksi 60.
40. --a-BoeingData,W/D= 4-o- BoeingData,W/D= 6
20- --._-BoeingData,W/D= 8
. SLL2-DBraidMaterial,1/4"NominalThickness• • • • I • • • • I • • • • I • m I • | • • • • I • • • • I • • • •
0.1 0.2 0.3 0.4 0.5 0.6 0.7 0.8HoleDiameter,inch
Figure 11. Effect of Hole Diameter on Open Hole Tension Strength.SLL 2-D Braid at 1/4" Nominal Thickness.
Figure 12 is a plot of the LLS [036K/-t-4515K]46% test results forthe nominal 1/8 inch thick test specimens. Data from both Boeingand WVU are shown• As with the 118" thick SLL [030K/-1"706K]46%
material, failure strength appears to decrease with increasing holesize. The hole size effect is less evident in the WVU data in theseexperiments• Their failure strength decreased a maximum of 13 ksi,or 21 percent, over the range shown• The range for one standarddeviation from the test average was from 0.74 to 1.5 ksi.
Boeing's W/D = 4 data was similar to WVU's but showed alarger decrease in average strength. These experiments showed asmuch as a 24 percent, or 15 ksi, decrease in failure strength. Thedata's standard deviations ranging from 2.4 to 6.2 ksi. At W/D = 6there is little effect of hole size on this material form. Failurestrength decreased only 6.5 percent, or 4.7 ksi. The standarddeviations in these data were small; they ranged from 0.09 to 4.8 ksi.The W/D = 8 data have a decrease in failure strength of 16 percent,
• or 12 ksi. The range for one standard deviation in these data is from0.7 to 5.8 ksi.
19

AverageFailureStress _....CorrectedforFinite Width, i,,.._.;.." -, - "-
Ksi
•-a-BoeingData,W/D= 4-o- BoeingData,W/D= 6--A-BoeingData,W/D= 8•--=-WVUData, W/D=4
LLS1/8"NominalThickness0
0.2 0.4 0.6 0.8 1HoleDiameter,inch
Figure 12. Effect of Hole Diameter on Open Hole Tension Strength.LLS 2-D Braid at 1/8" Nominal Thickness.
The hole size response of the LLS [036K/_+4515K]46% materialwith a 1/4 inch nominal plate thickness is shown in Figure 13. Atthis plate thickness the W/D = 4 data had a decrease in failurestrength of up to 10 percent, or 6 ksi. The standard deviations in thedata ranged from 2.9 to 3.1 ksi. The W/D = 6 data were similar. Infact, the two curves fit to these data overlap. The W/D = 6 datashowed a maximum strength decreased of 10 ksi (15 percent). Therange for one standard deviation in these test results was from 1.6 to2.7. The W/D = 8 test results showed the greatest apparent effect ofhole size. Strength decreased up to 22 percent or 15 ksi over therange of hole sizes tested. The data's scatter ranged from 1.8 to 3.6ksi.
In general, the failure strength decreases somewhat with holesize. This is more pronounced at the smaller W/D ratios. The WVUdata suggested a similar response to hole size as Boeing's LLS[036K/+4515K]46% results. The SLL [030K/+706K]46% material appearsto be more adversely affected by the large, 1 inch diameter holetested at WVU. In most cases, the smaller hole sizes gave higherfailure strength with a smaller amounts of data scatter. Both "
20

- ..." . . ..
materials have similar unit cell sizes; thus, there was no opportunityto see the effect of unit cell size.
i
1
1Average
FailureStressCorrectedfor 4...
FiniteKsiWidth, "'_ ,__ _,_.,.._ _ ___ "_
-a-BoeingData,W/D=4-o- BoeingData,W/D= 6
20 ..A.BoeingData,W/D= 8
LLS1/4"NominalThickness00.1 0.2 0.3 0.4 0.5 0.6 0.7 0.8
HoleDiameter,inchFigure 13. Effect of Hole Diameter on Open Hole Tension Strength.
LLS 2-D Braid at 1/4" Nominal Thickness.
Specimen Width to Hole Size (W/D) Effects
The effect of specimen width to hole diameter is complicated.Stress risers, such as holes or notches have a pronounced effect onthe ultimate strength of a composite material. The study of themechanics of materials tells us that the effect of a hole or notch isrelated to its distance from. a free edge. In the open hole tensiontest, when the distance from the edge of the hole to the edge of thespecimen is small, the stress at the edge of the hole is large,compared to the remote stress. When the plate is wide compared tothe hole diameter, the net effect of the hole is reduced.
• As stated in the "Test Specimen Configuration & TestingMethodology" section, failure stress has been corrected using an
• isotropie finite width correction factor. In theory, if the finite width
21

correction factor is accurate, and there is no size effect, the correctedstress should be the same for all specimen configurations.
Figures 8 and 9 provide a measure of the effectiveness of thecorrection factors employed in this analysis. The figures plot theaverage corrected failure stresses vs. the W/D ratios for the 1/8" and --1/4" thick SLL [030K]+706K]46% and LLS [036K]+4515K]46% materials.The error bars shown in the figures represent one standard deviationin the data. Straight lines have been fit to the data through linearregression. If the width corrections were effective, the failurestrengths should be insensitive to the W/D ratio and the lines fit tothe corrected data should be horizontal.
The figures indicate, however, that the failure stress increaseswith increasing W/D ratio, even after being corrected for finitewidth. This trend is more apparent for the SLL [030K/_.+706K]46%laminates (Fig. 8) than in the LLS [036K]+4515K]46%laminates (Fig. 9).The latter material was less sensitive to changes in the W/D ratiothan the former. For example, the failure stress measured for the1/4" LLS [036K/+4515K]46% specimens, increased 3 ksi (4%) as theW/D ratio increased from 4 to 6 and only 2 ksi (3%) when the W/Dratio increased to 8.
The increases in SLL [030K]+_.706K]46% materials' average failurestress with increasing W/D ratios are, however, comparable to thescatter in the data. They were not much greater than one standarddeviation in the data. For example, the 1/4" SLL [030K]-----706K]46%
material showed a somewhat linear improvement in the averagefailure strength with increasing W/D ratio. Failure strengthincreased 6 ksi as the W/D ratio increased from 4 to 6; strengthincreased another 6 ksi as the ratio increased to 8. The standarddeviations in these data were 6.0 ksi, 9.3 ksi, and 9.1 ksi, for W/D =4, 6, and 8, respectively.
In general, the isotropic finite width correction factors wereeffective in accounting for the width effects in these tests.
22

Conclusions and Recommendations
The effects of three test specimen parameters, thickness, holediameter, and the ratio of specimen width to hole diameter, have
' been investigated by comparing the open hole strengths of fourbraided architectures. The data used to make these comparisons wasprimarily generated by Boeing. Direct comparisons of Boeing'sresults were made with experiments conducted at West VirginiaUniversity whenever possible. Indirect comparisons were made withtest results for other 2-D braids and 3-D weaves tested by Boeingand Lockheed.
In general, failure strength (corrected for width effects) wasfound to decrease with increasing plate thickness and increase withdecreasing hole size. A review of the data also indicated that theisotropic finite width correction factors were generally effective inaccounting for the width effects.
Of the two braids used for this evaluation, the SLL[030K/+706K]46% material •was less effected by thickness andgenerally had less data scatter. Both the SLL [030K]-----706K]46% and theLLS [036K/+4515K]46% materials were somewhat sensitive to holesize. Hole size effects were more significant at smaller W/D ratios,especially at the largest hole size. Both the SLL [030K/+706K]46% andLLS [036K/+4515K]46% materials were relatively insensitive to W/Dratio. Strength was typically less at the smallest W/D ratio but littleimprovement in strength was seen at ratios above W/D = 6. Thethicker specimens did exhibit a lower average failure strength, butthis was not necessarily a consequence of the test method.
For open hole tension testing of textile composites, the use ofstandard testing practices employed by industry, such as ASTMD5766 - Standard Test Method for Open Hole Tensile Strength ofPolymer Matrix Composite Laminates, should provide adequateresults for material comparisons studies.
23

References
1. Minguet, P., Fedro, M., Gunther, C., "rest Methods for TextileComposites" NASA CR 4609, July 1994.
2. Falcone, A., Dursch, H., Nelson, K., Avery, W., "Resin Transfer Moldingof Textile Composites," NASA CR191505,March1993.
3. Norman, T., Anglin, C., Gaskin, D., Patrick, M., "Effect of Open Hole onTensile Failure Properties of 2-D Triaxial Braided Textile Composites andTape Equivalents", NASA CR 4676, June 1995.
4. Peterson, R. E., "Stress ConcentrationFactors," Second edition John Wiley& Sons, Inc.,Publishers, New York,1974.
24
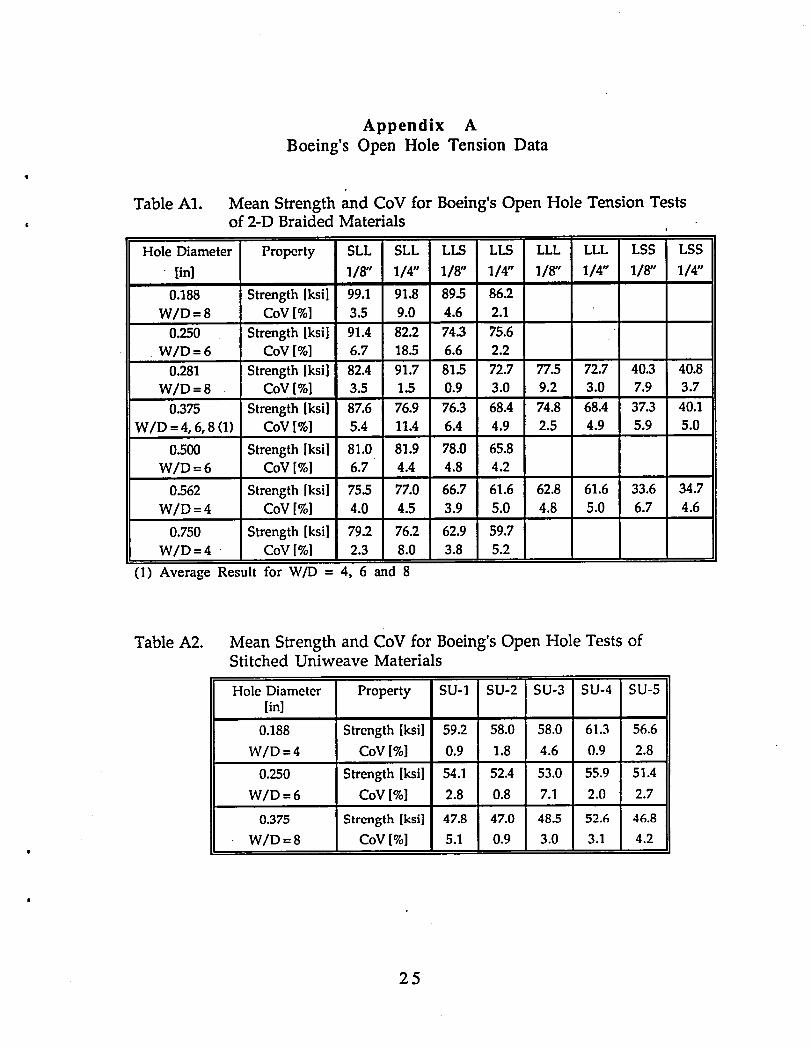
Appendix ABoeing's Open Hole Tension Data
Table A1. Mean Strength and CoV for Boeing's Open Hole Tension Tests, of 2-D Braided Materials m
Hole Diameter Property SLL SLL LLS LLS LLL LLL LSS LSS[in] 1/8" 1/4" 1/8" 1/4" 1/8" 1/4" 1/8" 1/4"
0.188 Strength[ksi] 99.1 91.8 89.5 86.2W/D =8 CoV[%] 3.5 9.0 4.6 2.1
0.250 Strength [ksi] 91.4 82.2 74.3 75.6W/D =6 CoV[%] 6.7 18.5 6.6 2.2
0.281 Strength [ksi] 82.4 91.7 81.5 72.7 77.5 72.7• 40.3 40.8W/D =8 CoV[%] 3.5 1.5 0.9 3.0 9.2 3.0 7.9 3.7
0.375 Strength [ksi] 87.6 76.9 76.3 68.4 74.8 68.4 37.3 40.1W/D =4, 6, 8 (1) CoV[%] 5.4 11.4 6.4 4.9 2.5 4.9 5.9 5.0
0.500 Strength lksi] 81.0 81.9 78.0 65.8W/D =6 CoV[%] 6.7 4.4 4.8 4.2
0.562 Strength [ksi] 75.5 77.0 66.7 61.6 62.8 61.6 33.6 34.7W/D =4 CoV [%] 4.0 4.5 3.9 5.0 4.8 5.0 6.7 4.6
0.750 Strength [ksi] 79.2 76.2 62.9 59.7W/D =4 CoV [%] 2.3 8.0 3.8 5.2
(l) Average Result for W/D = 4, 6 and 8
Table A2. Mean Strength and CoV for Boeing's Open Hole Tests ofStitched Uniweave Materials
Hole Diameter Property SU-1 SU-2 SU-3 SU-4 SU-5[in]
0.188 Strength [ksi] 59.2 58.0 58.0 61.3 56.6W/D =4 CoV[%] 0.9 1.8 4.6 0.9 2.8
0.250 Strength [ksi] 54.1 52.4 53.0 55.9 51.4W/D =6 CoV[%] 2.8 0.8 7.1 2.0 2.7
0.375 Strength [ksi] 47.8 47.0 48.5 52.6 46.8
W/D =8 CoV[%] 5.1 0.9 3.0 3.1 4.2
25

Appendix A: ContinuedBoeing's Open Hole Tension Data
Table A3. Mean Strengthand CoY for Boeing'sOpen Hole Tests of 3-DWoven Materials
Hole Diameter Property OS-1 OS-2 LS-1 LS-2 TS-1 TS-2[ln]
0.188 Strength [ksi] 117.5 80.0 126.5 80.9 109.3 92.6W/D =4 CoV[%] 0.9 12.1 0.3 17.1 2.7 5.0
0.250 Strength [ksi] 101.2 87.9 119.2 99.3 100.4 87.9W/D =6 CoV[%] 12.8 1.6 6.8 0.8 3.5 4.8
0.375 Strength [ksi] 97.7 72.9 87.1 90.3 92.2 78.2• W/D =8 CoV[%] 12.2 17.8 5.1 5.0 0.3 3.6
26

Appendix BLockheed's Open Hole Tension Data
Table B1. Summary of Lockheed's 3-D Weave Test Results
• Propert_¢ LTL-1 LTL-2 LTL-3Strength [ksi] 88.3 70.2 81.7
CoV [%] 6.0 0.3 7.1Fiber Volume Fraction, % 61.61 57.37 60.52Nominal Thickness, in 0.16 0.16 0.16
Table B2. Summary of Lockheed's 3-D, Through-The-ThicknessOrthogonal Weave Test Results
Property TTT-2 TTT-3Strength [ksi] 72.7 69.6
CoV [%] 5.7 3.4Fiber Volume Fraction, % 57.43 60.35Nominal Thickness, in 0.16 0.16
Table B3. Summary of Lockheed's 2-D Triaxial Braid Test Results
Material Vf Failure Stress, CoV, %ksi
[012K/+606K]33% 54.95 58.66 4.91[024K/__.606K]46% 58.94 69.19 2.22
Table B4. Summary of Lockheed's 3-D Braid Test Results
Material Vf Failure Stress, ksi CoV, %TTT-1 56.23 45.50 3.6TTT-2 57.70 66.30 7.2TTT-3 53.45 66.40 4.4
27

Appendix CWest Virginia University's Open Hole Tension Data
Table C1. Summary of West Virginia University's 2-D Braid Results _.
Strengths Normalized to 60% Fiber Volume Fraction
Net Failure Stress, ksi, (Std. Dev.)Material Unnotched 1" Notched 2" Notched 4" Notched
SLL [030K/-----706K]46% 108.1 (10.9) 106.3 (10.4) 99.6 (5.3) 64.8 (2.4)LLS [036K/+_4515K]46% 94.1 (4.2) 92.7 (10.3) 89.9 (6.8) 77.1 (5.5)LLL [075K/_+7015K]46%77.7 (13.6) 68.9 (14..3) 82.5 (7.3) 55.0 (1.1)LSS [06K/+4515K]_2% 50.7 (2.8) 51.9 (0.6) 42.6 (1.9) 38.3 (1.0)
28


Form ApprovedREPORTDOCUMENTATIONPAGE OMBNo.0704.0188
Pul:41creportingbum_mfor this€o_ledlond WormmionIs mtJmmedto wem0e 1 ho_ per _ _ _ _ _ _ _. _ _1_ _ _.g_hettng am¢lm_n_Unin__ €_la n_o amdco--rig 4rodn_kRvln0b'w€_ian o( _ 81ncloanmzMmmg_m_ng_ I_J_m ewin_m 0r anyO_W _aKl 0#th_€oll4_lonof Information.Inckxllngsugge4tionsIo6'mdud_; Ih4 btm_n,to WashingtonHeaK_uaru_ 84wiom.Dim:2oqneW IntonnallonO wWlonsand P,a:o_. 1215JellenmnOa_sH_nt]f. 8uho 1204, Adk_ton. VA 2_0Q.4302. amd Io the O/lmo o_ M_ and Budg4R.Papeh_xk ;:k;ducbon Pn)_4cl (07044)188). Was_ _ _
1. AGENCY USE ONLY (Leave blank) 2. REPORT DATE 3. REPORT TYPE AND DATES COVERED
December 1995 ContractorReport -4. TITLEANDSUBTITLE 5. FUNDINGNUMBERS
StandardMethods for Open Hole Tension Testing of Textile Composites Contract NASI-19000
WU 505-63-50-046. AUTHOR(S)
M. A. PortanovaandJ. E. Masters
7.PERFORMINGORGANIZATIONNAME(S)ANDADDRESS(ES) 8. PERFORMINGORGANIZATIONLockheedMartin Engineering& Sciences REPORTNUMBER144 Research DriveHampton, VA 23666
9. SPONSORING/MONITORING AGENCY NAME(S) AND ADDRESS(ES) 10. SPONSORING/MONITORING
National AeronauticsandSpaceAdministration AGENCYREPORTNUMBERLangley Research Center NASA CR-198262Hampton, VA 23681-0001
11. SUPPLEMENTARYNOTES
langley Technical Monitor. I. S. Ra]u
128.DISTRIBUTION/AVAILABILITYSTATEMENT 12b.DISTRIBUTIONCODE
Unclassified - UnlimitedSubject Category 24
13. ABSTRACT (Maximum 200 words)
Sizing effects have been investigated by comparing the open hole failure strengths of each of the four differentbraided architectures as a function of specimen thickness, hole diameter, and the ratio of specimen width to hole diameter.The data used to make these comparisons was primarily generated by Boeing. Direct comparisons of Boeing's results weremade with experiments conducted at West Virginia University whenever possible. Indirect comparisons were made withtest results for other 2-D braids and 3-D weaves tested by Boeing and Lockheed.
In general, failure strength was found to decrease with increasing plate thickness, increase with decreasing holesize, and decreasing with decreasing width to diameter ratio. The interpretation of the sensitive to each of thesegeometrical perameters was complicated by scatter in the test data. For open hole tension testing of textile composites, theuse of standard testing practices employed by industry, such as ASTM D5766 - Standard Test Method for Open HoleTensile Strength of Polymer Matrix Composite Laminates. should provide adequate results for material comparisonsstudies.
14. SUBJECT TERMS 15. NUMBER OF PAGES
29 ,.Open Hole Tension, Textile Composites, Specimen Geometry, Size Effects,Test Methods 16.PRICECODE
A03
17. SECURITY CLASSIFICATION 18. SECURITY CLASSIFICATION 19. SECURITY CLASSIFICATION 20. LIMITATION OF ABSTRACT .OFREPORT OFTHISPAGE OFABSTRACTUnclassified Unclassified
NSN7540-01-280-5500 StandardForm298(Rev.2-89)Prescribed by ANSI StcI.Z39-18298-102


;,,.I
I_lJI_I_ii_l_l_l_HI_3 1176 01423 8191