STANDARD DOCUMENT COVER SHEET
25
COVER SHEET P W - 1 2 1 S.E.C. Registration Number B A N K O F T H E P H I L I P P I N E I S L A N D S (Company's Full Name) A Y A L A N O R T H E X C H A N G E , T O W E R 1 A Y A L A A V E . C O R N E R S A L C E D O S T . L E G A S P I V I L L A G E , M A K A T I C I T Y Josenia Jessica Nemeño (632) 246-5902 Contact Person Company Telephone Number 0 3 3 1 1 7 - Q 0 4 2 5 Month Day FORM TYPE Month Day Fiscal Year Annual Meeting N/A Secondary License Type, If Applicable C F D Dept. Requiring this Doc. Amended Articles Number/Section Total Amount of Borrowings 12,484 Total No. of Stockholders Domestic Foreign To be accomplished by SEC Personnel concerned File Number LCU Document I.D. Cashier S T A M P S
Transcript of STANDARD DOCUMENT COVER SHEET

COVER SHEET
P W - 1 2 1
S.E.C. Registration Number
B A N K
O F
T H E
P H I L I P P I N E
I S L A N D S
(Company's Full Name)
A Y A L A
N O R T H
E X C H A N G E ,
T O W E R
1
A Y A L A
A V E . C O R N E R S A L C E D O S T .
L E G A S P I
V I L L A G E ,
M A K A T I
C I T Y
Josenia Jessica Nemeño
(632) 246-5902
Contact Person
Company Telephone Number
0 3
3 1
1 7 - Q
0 4
2 5
Month
Day
FORM TYPE
Month
Day
Fiscal Year
Annual Meeting
N/A
Secondary License Type, If Applicable
C F D
Dept. Requiring this Doc.
Amended Articles Number/Section
Total Amount of Borrowings
12,484
Total No. of Stockholders
Domestic
Foreign
To be accomplished by SEC Personnel concerned
File Number
LCU
Document I.D.
Cashier
S T A M P S

Page 1 of 23
STANDARD DOCUMENT COVER SHEET FOR SEC FILINGS
All documents should be submitted under a cover page which clearly identifies the company and
the specific document form as follows:
SEC Number PW-121 File Number
BANK OF THE PHILIPPINE ISLANDS AYALA NORTH EXCHANGE TOWER 1, AYALA AVE. CORNER SALCEDO ST.,
LEGASPI VILLAGE, MAKATI CITY, METRO MANILA (632) 246-5902
FISCAL YEAR ENDING DECEMBER 31 (indicate if anything above is new and the date it was changed)
SEC FORM 17–Q QUARTERLY REPORT AMENDMENT DESIGNATION (if applicable)
PERIOD-ENDED MARCH 31, 2019 (if a report, financial statement, GIS, or related amendment or show-cause filing)
NONE EACH ACTIVE SECONDARY LICENSE TYPE AND FILE NUMBER
(state “NONE” if that is the case)


Page 3 of 23
12. Indicate by check mark whether the registrant: (a) Has filed all reports required to be filed by Section 17 of the Code and SRC Rule 17 thereunder or Sections 11 of the RSA and RSA Rule 11(a)-1 thereunder, and Sections 26 and 141 of the Corporation Code of the Philippines during the preceding 12 months (or for such shorter period the registrant was required to file such reports) Yes [x] No [ ] (b) Has been subject to such filing requirements for the last 90 days Yes [x] No [ ]

Page 4 of 23
UNAUDITED AUDITED
MARCH 31, 2019 DECEMBER 31, 2018
Cash and Other Cash Items 30,866,566 43,535,901
Due from Bangko Sentral ng Pilipinas 240,965,227 225,906,630
Due from Other Banks 12,036,756 12,477,144
Interbank Loans Receivable and Securities
Purchased under Agreements to Resell 21,102,871 34,323,163
Financial Assets at Fair Value through Profit or Loss 28,405,357 16,721,273
Financial Assets at Fair Value through OCI 30,311,735 37,206,323
Financial Assets at Amortized Cost 299,209,400 287,570,984
Loans and Advances, net 1,349,020,162 1,354,895,821
Assets Held for Sale, net 3,411,166 3,363,158
Bank Premises, Furniture, Fixtures and Equipment, net 16,072,391 16,252,495
Investments in Subsidiaries and Associates, net 6,425,485 5,658,998
Assets Attributable to Insurance Operations 16,378,778 16,581,610
Deferred Income Tax Assets, net 8,370,233 8,535,578
Other Resources, net 22,021,813 22,199,024
TOTAL RESOURCES 2,084,597,942 2,085,228,103
Deposit Liabilities
Demand 257,914,223 256,279,413
Savings 873,470,976 883,650,416
Time 476,945,275 445,816,430
Sub-total 1,608,330,474 1,585,746,258
Derivative Financial Liabilities 3,060,288 3,890,829
Other Borrowed Funds* 138,766,304 166,901,167
Due to Bangko Sentral ng Pilipinas and Other Banks 3,233,682 3,987,619
Manager's Checks and Demand Drafts Outstanding 7,633,945 6,930,687
Accrued Taxes, Interest and Other Expenses 10,027,325 9,056,726
Liabilities Attributable to Insurance Operations 13,645,780 14,056,333
Deferred Credits and Other Liabilities 39,638,217 43,120,583
TOTAL LIABILITIES 1,824,336,014 1,833,690,201
CAPITAL FUNDS ATTRIBUTABLE TO THE EQUITY HOLDERS OF BPI
Share Capital 44,970,232 44,961,078
Share Premium 74,245,026 74,180,826
Reserves 3,944,317 4,095,256
Surplus 134,555,389 127,459,401
Accumulated Other Comprehensive Income/ (Loss) (607,478) (2,175,676)
257,107,486 248,520,885
NON-CONTROLLING INTERESTS 3,154,442 3,017,017
TOTAL CAPITAL FUNDS 260,261,927 251,537,902
TOTAL LIABILITIES AND CAPITAL FUNDS 2,084,597,942 2,085,228,103
LIABILITIES AND CAPITAL FUNDS
CONSOLIDATED STATEMENT OF CONDITION
MARCH 31, 2019 AND DECEMBER 31, 2018
(in Thousands of Pesos)
BANK OF THE PHILIPPINE ISLANDS
RESOURCES

Page 5 of 23
BANK OF THE PHILIPPINE ISLANDS
CONSOLIDATED STATEMENTS OF INCOME
For the Three Months Ended March 31, 2019 and 2018
(In Thousands of Pesos)
Unaudited Unaudited
2019 2018
INTEREST INCOME
On loans and advances 21,680,099 15,298,248
On FA at amortized cost 2,422,758 2,201,147
On FA at FV through OCI 171,427 61,384
On deposits with BSP and other banks 453,897 276,768
On FA at FV through profit or loss 91,261 63,870
24,819,442 17,901,418
INTEREST EXPENSE
On Deposits 6,946,817 5,048,209
On Bills Payable and other borrowings 1,819,355 392,318
8,766,172 5,440,527
NET INTEREST INCOME 16,053,270 12,460,891
IMPAIRMENT LOSSES 1,802,972 785,000
NET INTEREST INCOME AFTER IMPAIRMENT
LOSSES 14,250,298 11,675,891
OTHER INCOME
Fees and commissions 2,068,595 1,821,526
Income from foreign exchange trading 548,484 564,687
Trading gain (loss) on securities 491,748 491,960
Income attributable to insurance operations 351,532 382,257
Other operating income 3,271,175 2,728,876
6,731,534 5,989,306
OTHER EXPENSES
Compensation and fringe benefits 4,054,341 3,655,013
Occupancy and equipment-related expenses 4,321,972 2,862,635
Other operating expenses 3,691,592 3,229,663
12,067,905 9,747,311
INCOME BEFORE INCOME TAX 8,913,927 7,917,885
PROVISION FOR INCOME TAX
Current 1,976,736 1,565,612
Deferred 150,147 52,685
2,126,884 1,618,297
NET INCOME FOR THE PERIOD 6,787,043 6,299,587
Attributable to:
Equity holders of BPI 6,722,572 6,247,285
Non-controlling interest 64,471 52,302
6,787,043 6,299,587
Earnings per share:
Based on 4,506,944,439 outstanding shares as of March 31, 2019 P 1.49 P 1.58
and 3,943,786,798 outstanding shares in 2018
Earnings per share:
Based on 4,506,944,439 average shares for the period ending P 1.49 P 1.58
March 31, 2019 and 3,943,611,042 average shares in 2018

Page 6 of 23
BANK OF THE PHILIPPINE ISLANDS
CONSOLIDATED STATEMENT OF COMPREHENSIVE INCOME
For the Three Months Ended March 31, 2019 and 2018
(In Thousands of Pesos)
Unaudited Unaudited
2019 2018
NET INCOME BEFORE MINORITY INTEREST 6,787,043 6,299,587
Other Comprehensive Income
Items that may be reclassified subsequently to profit or loss
Net change in fair value reserve on FVOCI securities,
net of tax effect 821,379 (696,200)
Fair value reserve on investments of insurance subsidiaries,
net of tax effect 291,494 (184,436)
Share in other comprehensive income of associates 753,166 (702,501)
Currency translation differences 33,812 213,908
Items that will not be reclassified to profit or loss
Actuarial gains (losses) on defined benefit
plan, net of tax effect (8,475) (5,956)
Share in other comprehensive income gain (loss) of associates (15,670) 149,040
Total Other Comprehensive Income (Loss), net of tax effect 1,875,706 (1,226,145)
Total Comprehensive Income for the Year 8,662,748 5,073,442
Attributable to:
Equity holders of BPI 8,519,742 5,056,593
Non-Controlling Interest 143,006 16,849
8,662,748 5,073,442
Page 7 of 23 Page 7 of 21
Share Capital Share Premium Reserves Surplus
Accumulated Other
Comprehensive
Income (Loss) Total
Non-controlling
Interests Total Equity
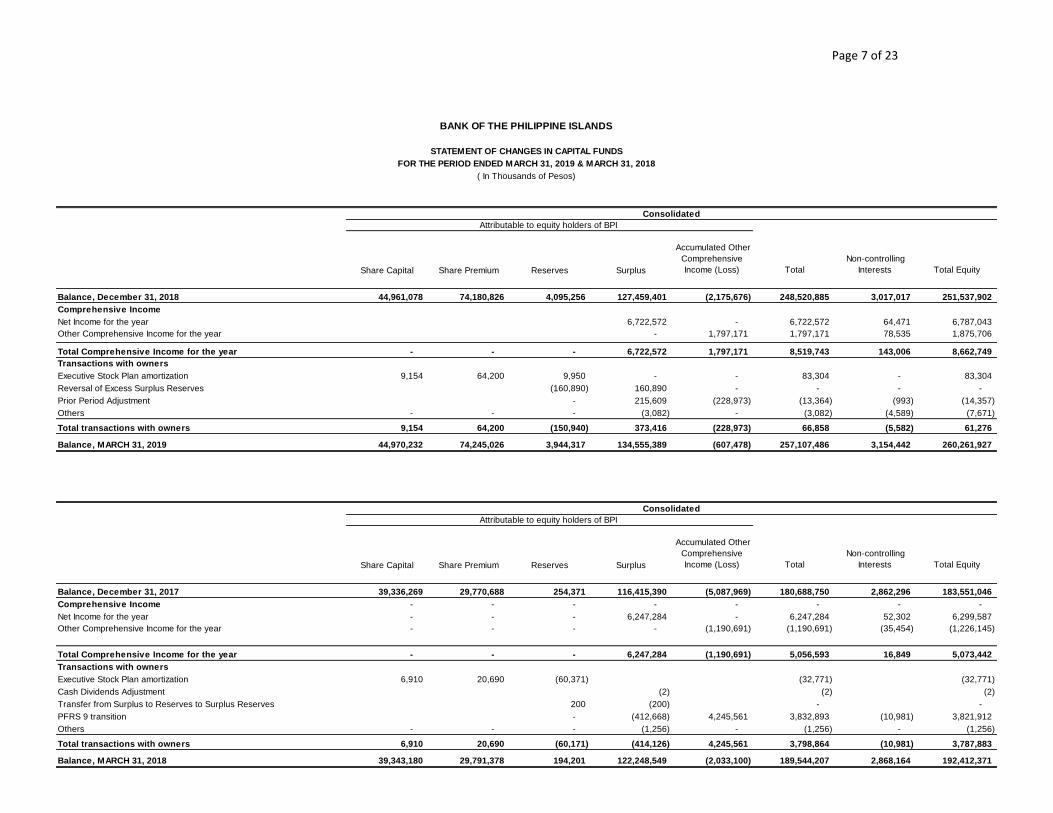
Balance, December 31, 2018 44,961,078 74,180,826 4,095,256 127,459,401 (2,175,676) 248,520,885 3,017,017 251,537,902
Comprehensive Income
Net Income for the year 6,722,572 - 6,722,572 64,471 6,787,043
Other Comprehensive Income for the year - 1,797,171 1,797,171 78,535 1,875,706
Total Comprehensive Income for the year - - - 6,722,572 1,797,171 8,519,743 143,006 8,662,749
Transactions with owners
Executive Stock Plan amortization 9,154 64,200 9,950 - - 83,304 - 83,304
Reversal of Excess Surplus Reserves (160,890) 160,890 - - - -
Prior Period Adjustment - 215,609 (228,973) (13,364) (993) (14,357)
Others - - - (3,082) - (3,082) (4,589) (7,671)
Total transactions with owners 9,154 64,200 (150,940) 373,416 (228,973) 66,858 (5,582) 61,276
Balance, MARCH 31, 2019 44,970,232 74,245,026 3,944,317 134,555,389 (607,478) 257,107,486 3,154,442 260,261,927
Share Capital Share Premium Reserves Surplus
Accumulated Other
Comprehensive
Income (Loss) Total
Non-controlling
Interests Total Equity
Balance, December 31, 2017 39,336,269 29,770,688 254,371 116,415,390 (5,087,969) 180,688,750 2,862,296 183,551,046
Comprehensive Income - - - - - - - -
Net Income for the year - - - 6,247,284 - 6,247,284 52,302 6,299,587
Other Comprehensive Income for the year - - - - (1,190,691) (1,190,691) (35,454) (1,226,145)
Total Comprehensive Income for the year - - - 6,247,284 (1,190,691) 5,056,593 16,849 5,073,442
Transactions with owners
Executive Stock Plan amortization 6,910 20,690 (60,371) (32,771) (32,771)
Cash Dividends Adjustment (2) (2) (2)
Transfer from Surplus to Reserves to Surplus Reserves 200 (200) - -
PFRS 9 transition - (412,668) 4,245,561 3,832,893 (10,981) 3,821,912
Others - - - (1,256) - (1,256) - (1,256)
Total transactions with owners 6,910 20,690 (60,171) (414,126) 4,245,561 3,798,864 (10,981) 3,787,883
Balance, MARCH 31, 2018 39,343,180 29,791,378 194,201 122,248,549 (2,033,100) 189,544,207 2,868,164 192,412,371
Consolidated
Attributable to equity holders of BPI
BANK OF THE PHILIPPINE ISLANDS
STATEMENT OF CHANGES IN CAPITAL FUNDS
FOR THE PERIOD ENDED MARCH 31, 2019 & MARCH 31, 2018
( In Thousands of Pesos)
Consolidated
Attributable to equity holders of BPI

Page 8 of 23 Page 8 of 21
2019 2018
CASH FLOW FROM OPERATING ACTIVITIES
Income before income tax 8,913,927 7,917,884
Adjustments for:
Impairment losses 1,802,972 785,000
Depreciation and amortization 1,309,057 1,113,098
Share in net income of associates (28,562) (260,363)
Share based compensation 9,950 (60,371)
Dividend income (13,672) (10,083)
Interest income (25,681,972) (18,536,564)
Interest expense 8,766,172 5,440,527
Operating income before changes in operating assets and liabilities (4,922,129) (3,610,872)
Changes in operating assets and liabilities
(Increase) decrease in:
Due from Bangko Sentral ng Pilipinas 0 0
Interbank loans receivable and securities purchased under agreements to resell 1,318,166 420,286
FA at Fair Value through Profit or Loss (12,423,853) (19,997,871)
Loans and advances 4,297,603 (7,683,024)
Assets held for sale (94,992) 120,741
Assets attributable to insurance operations 519,972 48,234
Other resources (116,872) (2,725,972)
Increase (decrease) in:
Deposit liabilities 22,585,123 24,981,563
Due to Bangko Sentral ng Pilipinas and other banks (753,937) 745,476
Manager's checks demand drafts outstanding 703,258 (876,793)
Accrued taxes, interest and other expenses 751,508 418,306
Liabilities attributable to insurance operations (410,553) (191,644)
Derivative f inancial instrument (64,569) (61,699)
Deferred credits and other liabilities (7,571,213) (2,032,065)
Net cash from (used in) operations 3,817,511 (10,445,333)
Income taxes paid (1,961,539) (1,558,065)
Interest paid (8,547,081) (5,093,429)
Interest received 26,273,290 18,742,312
Net cash from (used in) operating activities 19,582,181 1,645,485
CASH FLOWS FROM INVESTING ACTIVITIES
(Increase) decrease in:
FA at Fair Value through OCI 7,876,884 15,368,105
FA at Amortized Cost (12,480,861) 3,191,489
Bank, premises, furniture, f ixtures and equipment (859,038) (1,166,909)
Equity investments 240,433 6,933
Assets attributable to insurance operations (344,909) 77,312
Investment property,net (2,185) (4,593)
Proceeds from sale of investments 0 0
Dividends received 13,672 10,083
Net cash from (used in) investing activities (5,556,004) 17,482,420
CASH FLOWS FROM FINANCING ACTIVITIES
Cash Dividends 4,052,205 (3,545,471)
Collection on stock subscriptions 73,354 27,600
Increase (decrease) in bills payable (28,134,863) (18,596,916)
Net cash from (used in) f inancing activities (24,009,304) (22,114,787)
NET INCREASE (DECREASE) IN CASH
AND CASH EQUIVALENTS (9,983,127) (2,986,882)
CASH AND CASH EQUIVALENTS
January 1 313,269,796 322,129,415
March 31 303,286,669 319,142,533
BANK OF THE PHILIPPINE ISLANDS
CONSOLIDATED STATEMENTS OF CASH FLOWS
FOR THE THREE MONTHS ENDED MARCH 31, 2019 AND MARCH 31, 2018
(In Thousands of Pesos)

Page 9 of 23
BANK OF THE PHILIPPINE ISLANDS
Financial Indicators
As at March 31, 2019 and 2018
2019 2018
a) Liquidity Ratio * 54.5% 54.0%
b) Debt to Equity Ratio ** 54.0% 34.3%
c) Asset to Equity Ratio 810.8% 1010.0%
d) Interest Rate Coverage Ratio *** 216.6% 266.0%
e) Net Interest Margin on Average Earning Assets 3.4% 2.9%
f) Return on Average Equity 10.7% 13.5%
g) Return on Average Assets 1.3% 1.4%
h) Cost to Income Ratio 53.0% 52.8%
i) Cost to Assets Ratio 2.4% 2.1%
j) Capital to Assets Ratio 12.3% 9.9%
* Liquid Assets over Total Deposits
** Bills Payable and Unsecured Subordinated Debt over Total Equity ***
Net Income Before Income Tax add back Interest Expense and Depreciation and Amortization over Interest Expense

Page 10 of 23
NOTES TO FINANCIAL STATEMENTS MARCH 31, 2019
SEC REQUIREMENT DISCLOSURE
Disclosure that the issuer’s interim financial report is in compliance with generally accepted accounting principles
The Bank’s interim financial statements have been prepared in accordance with the Phil. Financial Reporting Standards (PFRS) which includes applicable PFRS, PAS (Phil. Accounting Standards) and interpretations approved by the FRSC (Financial Reporting Standards Council).
The following information, as a minimum, should be disclosed in the notes to financial statements, if material and if not disclosed elsewhere in the interim financial report:
A statement that the same accounting policies and methods of computation are followed in the interim financial statements as compared with the most recent annual financial statements or, if those policies or methods have been changed, a description of the nature and effect of the change.
The Bank’s interim financial statements have been prepared consistent with its most recent annual financial statements as of December 31, 2018 which was in accordance with the PFRS adopted by the SEC.
Explanatory comments about the seasonality or cyclicality of interim operations
Nothing to report
The nature and amount of items affecting assets, liabilities, equity, net income, or cash flows that are unusual because of their nature, size, or incidents
Nothing to report
The nature and amount of changes in estimates of amounts reported in prior interim periods of the current financial year or changes in estimates of amounts reported in prior financial years, if those changes have a material effect in the current interim period.
The mandatory effective date of PFRS 16, Leases, is for annual periods beginning January 1, 2019. The Bank is currently gathering inventory of its outstanding lease agreements to facilitate the calculation of adjustments in 2019. Financial Impact of PFRS 16 will be finalized upon completion of the said inventory, assessment/valuation and subsequent
Page 11 of 23
NOTES TO FINANCIAL STATEMENTS MARCH 31, 2019
SEC REQUIREMENT DISCLOSURE
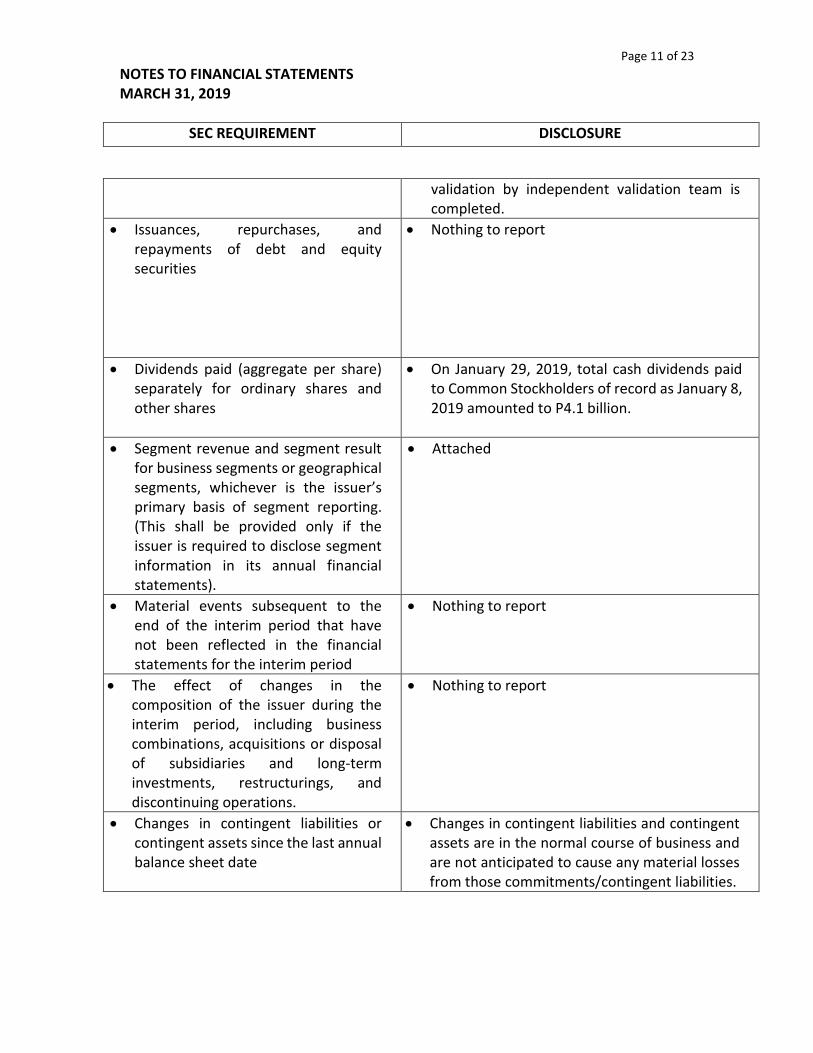
validation by independent validation team is completed.
Issuances, repurchases, and repayments of debt and equity securities
Nothing to report
Dividends paid (aggregate per share) separately for ordinary shares and other shares
On January 29, 2019, total cash dividends paid to Common Stockholders of record as January 8, 2019 amounted to P4.1 billion.
Segment revenue and segment result for business segments or geographical segments, whichever is the issuer’s primary basis of segment reporting. (This shall be provided only if the issuer is required to disclose segment information in its annual financial statements).
Attached
Material events subsequent to the end of the interim period that have not been reflected in the financial statements for the interim period
Nothing to report
The effect of changes in the composition of the issuer during the interim period, including business combinations, acquisitions or disposal of subsidiaries and long-term investments, restructurings, and discontinuing operations.
Nothing to report
Changes in contingent liabilities or contingent assets since the last annual balance sheet date
Changes in contingent liabilities and contingent assets are in the normal course of business and are not anticipated to cause any material losses from those commitments/contingent liabilities.

Page 12 of 23
NOTES TO FINANCIAL STATEMENTS MARCH 31, 2019
SEC REQUIREMENT DISCLOSURE
Existence of material contingencies and any other events or transactions that are material to an understanding of the current interim period.
Nothing to report
Assess the financial risk exposures of the company and its subsidiaries particularly on currency, interest, credit, market and liquidity risks. If any change thereof would materially affect the financial condition and results of operation of the company, provide a discussion in the report on the qualitative and quantitative impact of such risks and include a description of any enhancement in the company’s risk management policies to address the same;
The BPI Group monitors and measures financial risks according to three major classifications: credit, market and liquidity, and operational/IT risks. The Bank is exposed to these financial risks primarily through lending activities, trading and investment in bonds, currencies, financial derivatives and structured investment products, and engaging in operating activities, infrastructure and technology to support the Bank’s day-to-day business. The risks associated with these activities are closely monitored through the various key risk indicators (KRIs) and metrics, risk appetite and limits, and management triggers defined and set by the Board through its Risk Management Committee (RMC). The Bank’s Risk Management Office (RMO), led by the BPI Group Chief Risk Officer, supports the RMC in identifying, measuring, controlling, and reporting the Bank’s financial and non-financial risks at the Management and business line levels. BPI has since maintained its disciplined risk appetite by establishing and implementing prudent risk management policies and standards, concentrating on sovereign-issued and investment-grade securities, and by ensuring that controls are generally in place and working effectively, thus, exposing the Bank and its key subsidiaries to manageable credit, market, liquidity, and operational/IT risks which are within the RMC approved risk-appetite (BPI subsidiary Board-level RMCs, in the case of key BPI subsidiaries). Dedicated and skilled risk managers, including business risk and subsidiary risk officers, fully

Page 13 of 23
NOTES TO FINANCIAL STATEMENTS MARCH 31, 2019
SEC REQUIREMENT DISCLOSURE
support the Bank’s three lines-of-defense (3LoD) risk organization.
The persistent challenges observed in the global and local financial markets have resulted to more active risk management strategies in the Bank. Sensitivity analyses, forward-looking simulations and stress testing, daily risk monitoring and escalation procedures, regular risk MIS reporting and in-depth discussions involving Senior Management and the Board of Directors are measures to strengthen the effectiveness of the Bank’s enterprise risk management framework. Moreover, the levels of risk exposures and limits are continuously reviewed to reflect the Board’s overall risk appetite and strategy. The Bank closely monitors the risk exposures of both trading and non-trading portfolios. Assets in both on- and off-balance sheet trading portfolios are marked-to-market and the resulting gains and losses are recognized through profit or loss. Furthermore, starting January 2018, the Bank adopted the new accounting classification and measurement under PFRS 9 guidelines. The Bank also began recognizing credit losses upon initial recognition of the asset through the Expected Credit Loss (ECL) model.
Market risk exposures are measured using the historical simulation value-at-risk model complemented by several risk metrics such as Stop Loss and DV01. As of the first quarter of 2019, the Bank’s Value-at-Risk (VaR) is well within the RMC-approved limit.
The Bank conducts regular price stress tests that measure the potential impact of the adverse movements in interest rates on the Bank’s

Page 14 of 23
NOTES TO FINANCIAL STATEMENTS MARCH 31, 2019
SEC REQUIREMENT DISCLOSURE
trading and banking book and the corresponding impact on the Capital Adequacy Ratio. The results of the first quarter 2019 price stress test on both the trading and banking book revealed that the Bank’s post-shock CAR levels are well above the minimum regulatory requirement given adverse movements in risk factors.
Interest rate risk exposure arising from the core banking activities is measured by (a) earnings-at-risk (EaR), or the potential deterioration in net interest income over the next 12 months due to adverse movements in interest rates, and (b) balance sheet value-at-risk (BSVaR), or the impact on the economic value of the future cash flows in the banking book due to changes in interest rates. As of the first quarter of 2019, BPI Group’s BSVaR and EaR levels are well below the RMC-approved limits.
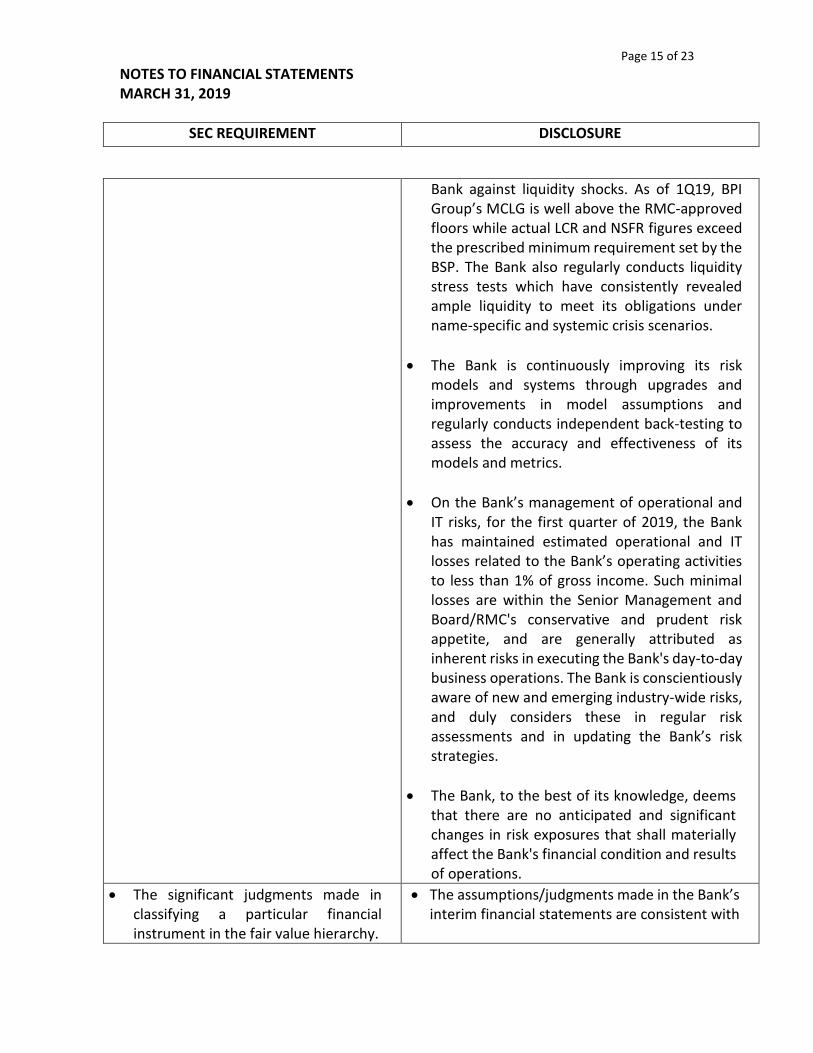
The Bank’s liquidity profile is measured and monitored through its internal metric, the Minimum Cumulative Liquidity Gap (MCLG) supplemented by liquidity risk monitoring tools, as well as through regulatory metrics, Liquidity Coverage Ratio (LCR) and Net Stable Funding Ratio (NSFR). The MCLG measures the smallest net cumulative cash inflow (if positively gapped) or the largest net cumulative cash outflow (if negatively gapped) over the next three months. The LCR promotes the short-term resilience of the Bank’s liquidity risk profile and requires the Bank to hold adequate level of high-quality liquid assets (HQLA) to cover net cash outflows in the next 30 days. NSFR, on the other hand, requires the Bank to maintain a stable funding profile so as to cover its assets over a horizon of one year. Moreover, both the LCR and NSFR are designed to strengthen the resilience of the
Page 15 of 23
NOTES TO FINANCIAL STATEMENTS MARCH 31, 2019
SEC REQUIREMENT DISCLOSURE
Bank against liquidity shocks. As of 1Q19, BPI Group’s MCLG is well above the RMC-approved floors while actual LCR and NSFR figures exceed the prescribed minimum requirement set by the BSP. The Bank also regularly conducts liquidity stress tests which have consistently revealed ample liquidity to meet its obligations under name-specific and systemic crisis scenarios.
The Bank is continuously improving its risk models and systems through upgrades and improvements in model assumptions and regularly conducts independent back-testing to assess the accuracy and effectiveness of its models and metrics.
On the Bank’s management of operational and IT risks, for the first quarter of 2019, the Bank has maintained estimated operational and IT losses related to the Bank’s operating activities to less than 1% of gross income. Such minimal losses are within the Senior Management and Board/RMC's conservative and prudent risk appetite, and are generally attributed as inherent risks in executing the Bank's day-to-day business operations. The Bank is conscientiously aware of new and emerging industry-wide risks, and duly considers these in regular risk assessments and in updating the Bank’s risk strategies.
The Bank, to the best of its knowledge, deems that there are no anticipated and significant changes in risk exposures that shall materially affect the Bank's financial condition and results of operations.
The significant judgments made in classifying a particular financial instrument in the fair value hierarchy.
The assumptions/judgments made in the Bank’s interim financial statements are consistent with

Page 16 of 23
NOTES TO FINANCIAL STATEMENTS MARCH 31, 2019
SEC REQUIREMENT DISCLOSURE
the most recent annual financial statements as of December 31, 2018.
A comparison of the fair values as of date of the recent interim financial report and as of date of the preceding interim period, and the amount of gain/loss recognized for each of the said periods
In accordance with PFRS 9, Financial Assets at Fair Value through Profit and Loss (FVPL) are marked to market as profit and loss. As such, these are reflected in Other Income – Trading gain (loss) on securities including realized gains (losses) from opportunistic sell down of inventory.
Financial Assets at Fair Value through Other Comprehensive Income (FVOCI) are marked to market against capital funds and reflected as Accumulated Other Comprehensive Income (Loss). The movements of these accounts are recognized as Other Comprehensive Income – Net Change in Fair Value Reserve for the banking books and Fair Value Reserve on investments of insurance subsidiaries.
The table below summarizes the carrying amount and fair value of Financial Assets at Amortized Cost, net:
Carrying Amount
Fair Value
March 31, 2019 (unaudited)
299,209 285,074
Dec 31, 2018 (audited)
287,571 258,652

Page 17 of 23
In P Mn
CONSUMER
BANKING
CORPORATE
BANKING
INVESTMENT
BANKING /
FINANCIAL
MARKETS
CORP / ELIM TOTAL
Net interest income 10,491 3,015 3,814 (1,267) 16,053
Impairment charge 844 965 (6) (0) 1,803
9,647 2,050 3,820 (1,267) 14,250
Fees and commission 1,785 371 142 (51) 2,247
Other income 1,624 695 1,375 1,218 4,912
GRT (189) (40) (51) (148) (428)
Other Income, net 3,220 1,027 1,466 1,019 6,732
Compensation and fringe
benefits3,302 573 249 (70) 4,054
Occupancy and equipment-
related expenses
2,084 535 69 1,634 4,322
Other operating expenses3,694 747 395 (1,144) 3,692
Total operating expenses 9,080 1,855 713 420 12,068
Operating profit 3,787 1,222 4,573 (668) 8,914
Share in net income of associates 159
Provision for Income Tax 2,127
Total Assets 500,049 1,126,420 422,126 36,003 2,084,598
Total Liabilities 1,108,948 563,659 132,757 18,972 1,824,336
Net interest income after impairment
charge
For the Three Months Ended March 31, 2019
BANK OF THE PHILIPPINE ISLANDS
SEGMENT REPORT

Page 18 of 23
Item 2. Management Discussion and Analysis of Financial Condition and Results of Operations
Financial Condition as of March 31, 2019 versus as of December 31, 2018
Total resources ended flat compared to 2018 year-end at P2.08 trillion. Loans and advances, net was likewise flat at P1.35 trillion. Notable upward and downward movements in the various resources for the first quarter of the year were as follows:
Due from Bangko Sentral ng Pilipinas at P240.97 billion, increased P15.06 billion, or 6.7%, due to higher volume of placement in BSP deposits;
Financial assets at fair value through profit or loss at P28.41 billion, increased P11.68 billion, or 69.9%, due to increases in government securities purchased and holdings of securities intended for trading;
Investments in subsidiaries and associates at P6.43 billion, increased P766.49 million, or 13.5%, largely due to higher equity income from insurance subsidiaries;
Interbank loans receivable and securities purchased under agreement to resell at P21.10 billion, decreased P13.22 billion, or 38.5%, due to lower volume of placement in Reverse Repurchase Agreements (RRP) and interbank term loans;
Cash and other cash items at P30.87 billion, decreased P12.67 billion, or 29.1%, on account of lower cash placement this period as compared to year end 2018;
Financial assets at fair value through OCI at P30.31 billion, decreased P6.89 billion, or 18.5%, due to decrease in the Bank's various holdings in hold to collect and sell debt securities;
Total liabilities decreased P9.35 billion, or 0.5%, primarily driven by the P28.13 billion, or 16.9%, decrease in other borrowed funds, at P138.77 billion, on account of lower repurchase agreement deposit substitutes and lower borrowings from foreign banks. Significant declines were also registered by the following:
Deferred credits and other liabilities at P39.64 billion, down P3.48 billion, or 8.1%, due to the decline in bills purchased contra account and accounts payable;
Derivative Financial Liabilities at P3.06 billion, down P830.54 million, or 21.3%, due to lower negative value on certain derivative positions;
Due to Bangko Sentral ng Pilipinas and other banks at P3.23 billion, lower by P753.94 million, or 18.9%, on account of lower tax collected for the Bureau of Internal Revenues (BIR).
These decreases in liabilities were partly tempered by the following: Total deposits at P1.61 trillion, increased P22.58 billion, or 1.4%, as the Bank’s time
deposits ended at P476.95 billion for the period, up P31.13 billion, or 7.0%. Accrued taxes, interest and other expenses at P10.03 billion, increased P970.60 million, or
10.7%, due to higher accrued interest payable and higher accruals for income taxes; Manager’s checks and demand drafts outstanding at P7.63 billion, increased P703.23
million, or 10.1%, on account of increased level of manager’s checks issued.

Page 19 of 23
Total Capital at P257.11 billion, increased P8.59 billion or 3.5%, from year-end 2018 because of the P7.10 billion increase in Surplus as a result of accumulated profits net of cash dividend payments. On the other hand, accumulated other comprehensive loss at (P607.48) million, decreased P1.57 billion, or 72.1%, on account of the increase in fluctuation reserves and higher unrealized gains on certain financial assets at fair value through other comprehensive income.
RESULTS OF OPERATIONS
For the Quarters ended March 31, 2019 and 2018
Net income for the first quarter of 2019 at P6.72 billion, up P475.29 million or 7.6%, from the profit earned in the same period of 2018. This was mainly due to the surge in total revenues of P4.33 billion, or 23.5%, to end at P22.78 billion. Other expenses and impairment losses dragged down the bottom line as both increased P2.32 billion, or 23.8%, and P1.02 billion, or 129.7%, respectively.
Net interest income at P16.05 billion, increased P3.59 billion, or 28.8%, on account of the P165.02 billion expansion in average asset base and 50-basis point increase in spreads.
Interest income, net of GRT stood at P24.82 billion, up P6.92 billion, or 38.6%, on the back of across-the-board increases in all interest income lines. Both higher average asset volume and asset yield boosted the performance in the following, unless otherwise specified:
Increase in interest income on loans and advances at P21.68 billion, up P6.38 billion, or 41.7%;
Increase in interest income on FA at amortized cost at P2.42 billion, up P221.61 million or 10.1%;
Increase in interest income on deposits with BSP and other banks at P453.90 million, up P177.13 million, or 64.0%, on higher asset yield offsetting the lower average volume;
Increase in interest income on FA at fair value through OCI at P171.43 million, up P110.04 million, or 179.3%;
Increase in interest income on FA at fair value through profit and loss at P91.26 million, up P27.39 million, or 42.9%, due to increase in average volume, partly tempered by the decline in yield.
Interest expense at P8.77 billion, increased P3.33 billion, or 61.1%, attributable to increases in both interest expense on deposits at P6.95 billion, up P1.90 billion, or 37.6%, and on bills payable and other borrowings at P1.82 billion, up P1.43 billion, or 363.7%, due to higher average volume and interest cost.
Other income, net of GRT at P6.73 billion, up P742.23 million, or 12.4%, higher than the P5.99 billion earned in the same period of 2018. Significant movements contributing to this increase are:
Other operating income at P3.27 billion, increased P542.30 million, or 19.9%, led by increases in income from assets sold, and credit card and rental businesses;
Fees and commissions at P2.07 billion, increased P247.07 million, or 13.6%, mainly from the higher transaction-based service charges;

Page 20 of 23
Income attributable to insurance operations at P351.53 million, decreased P30.73 million, or 8.0%, due to the lower income contribution of the Bank’s insurance subsidiaries;
Other expenses at P12.07 billion, grew P2.32 billion or 23.8%, due to higher spending in all categories as follows:
Occupancy and equipment-related expenses at P4.32 billion, up P1.46 billion, or 51.0%, on account of increased spending on technology infrastructure and higher premises rental and depreciation;
Other operating expenses at P3.69 billion, increased P461.93 million, or 14.3%, due to higher costs in communication, litigation, and transaction-servicing costs;
Compensation and Fringe Benefits at P4.05 billion, up P399.33 million, or 10.9% on the back of annual pay hikes and increased headcount.
Provision for income tax at P2.13 billion, increased P508.59 million or 31.4%, composed of the movements in:
Current income tax at P1.98 billion, increased P411.12 million, or 26.3%, on account of higher taxable income subject to regular corporate income tax;
Deferred income tax at P150.15 million versus last year’s P52.69 million, increased P97.46 million, or 185.0%, on higher write-offs.
Income attributable to non-controlling interest at P64.47 million, increased P12.17 million, or 23.3%, on the combined performance of the Bank’s insurance and leasing subsidiaries.
Total comprehensive income at P8.52 billion, increased P3.46 billion, or 68.5%, due to the increases in net income before minority interest of P487.46 million, or 7.7%, and total other comprehensive loss, net of tax effect of P3.10 billion, up 253.0%.
For Items that may be reclassified subsequently to profit and loss: Net change in fair value reserve on FVOCI securities, net of tax effect at P821.38 million,
increased P1.52 billion, or 218.0%, on account of higher market valuation of the Bank’s investment securities;
Share in other comprehensive income of associates at P753.17 million, increased P1.46 billion, or 207.2%, due to the upward market valuation of the investments of the bancassurance affiliate;
Fair value reserve on investments of insurance subsidiaries, net of tax effect at P291.49 million, increased P475.93 million, or 258.0%, as a result of higher market valuation of the insurance subsidiaries’ investment funds;
Currency translation differences at P33.81 million, down P180.10 million, or 84.2%, due to the weakening of the Philippine Peso against the Euro and Hong Kong Dollar Currencies;
For Items that will not be reclassified to profit and loss: Actuarial gains (losses) on defined benefit plan net of tax effect, at (P8.48) million,
increased P2.52 million, or 42.3%, on account of higher actuarial valuation of bank contribution on retirement fund;

Page 21 of 23
Share in other comprehensive gain/(loss) of associates at (P15.67) million, decreased P164.71 million, or 110.5%, impacted by the change in reserve liabilities of the bancassurance affiliate.
Income attributable to non-controlling interest at P143.01 million, increased P126.16 million, or 748.8%, due to higher market valuation of the insurance subsidiaries’ investment funds.
Key Performance Indicators
The following ratios, applied on a consolidated basis, are used to assess the performance of the Bank and its majority owned subsidiaries:
March 31, 2018 March 31, 2019
Return on Equity (%) 13.5 10.7
Return on Assets (%) 1.4 1.3
Net Interest Margin (%) 2.9 3.4
Operating Efficiency Ratio (%) 52.8 53.0
Capital Adequacy Ratio (%)-Basel III 13.6 16.6
Return on equity (ROE), the ratio of net income to average equity, was lower at 10.7%, compared to last year’s 13.5%, reflecting the impact of the dilution from the May 2018 SRO.
Return on assets (ROA), the ratio of net income to average assets, was slightly lower at 1.3%, versus 1.4% last year, due to the growth in average assets of 8.8% outpacing the growth in net income of 7.6%.
Net interest margin (NIM), net interest income divided by average interest bearing assets, at 3.4% was higher by 50 basis points than the first three months of 2018 on higher loan yields tempered by increasing cost of funds.
Operating efficiency (cost to income) ratio, the ratio of operating expenses to income, increased to 53.0% from 52.8% as the increase in operating expenses outpaced that of revenues. While the Bank’s core earnings demonstrated strong growth, the Bank has also continued to invest in its digitalization strategy and microfinance branch network.
Capital adequacy ratio (CAR), the ratio of total qualifying capital to total risk-weighted assets. The Bank’s CAR was higher at 16.6% versus last year’s 13.6%, owing to the impact of the May 2018 SRO. The Bank’s CAR is above the BSP’s minimum requirement of 10%. CET 1 ratio at 15.7%, was also higher than 12.7% last year, and above the minimum regulatory requirement.

Page 22 of 23
Material Events and Uncertainties The Bank has nothing to report on the following: 1. Any known trends or any known demands, commitments, events or uncertainties that will
result in or that are reasonably likely to result in the registrant’s liquidity increasing or decreasing in any material way.
2. Any events that will trigger direct or contingent financial obligation that is material to the company, including any default or acceleration of an obligation.
3. Other material off-balance sheet transactions, arrangements, obligations (including contingent obligations), and other relationships of the company with unconsolidated entities or other persons created during the reporting period other than those mentioned above.
4. Material commitments for capital expenditures. 5. Any known trends, events or uncertainties that have had or that are reasonably expected to
have a material favorable or unfavorable impact on net sales or revenues or income from continuing operations.
6. Events that will cause material change in the relationship between costs and revenues (such as known future increases in cost of labor or materials or price increases or inventory adjustments).
7. Any significant elements of income or loss that did not arise from the registrant’s continuing operations.
8. Any seasonal aspects that had a material effect on the financial condition or results of operations.