
Standard Bioassessment Procedures - University of...
14
Research Report 12-04 Standard Bioassessment Procedures for Evaluating Ecological Restoration in Southeastern Hardwood Bottomlands
Transcript of Standard Bioassessment Procedures - University of...

Research Report 12-04
Standard Bioassessment Proceduresfor Evaluating Ecological Restoration in Southeastern Hardwood Bottomlands

Acknowledgments
Information in this note was adapted from research conducted by Elizabeth A. Sum-mers (Former Graduate Student) and Matthew J. Gray, Department of Forestry, Wild-life and Fisheries at the University of Tennessee, Knoxville. Funding was provided by the U.S. Department of Agriculture (USDA) Natural Resources Conservation Ser-vice’s (NRCS) Agricultural Wildlife Conservation Center in Madison, Mississippi; The Nature Conservancy (TNC) in Tennessee; and the University of Tennessee Institute of Agriculture. Project assistance or manuscript editing was provided by P. Heard, E. Hackett, J. Rissler, M. Zeman, S. Brady, N. Melvin and M. Hansborough of NRCS; G. Hancock, M. Mobley and C. Bridges of TNC; D. Buehler; J. Fordyce; T. Roberts; seven NRCS district conservationists; 13 landowners; the Tennessee Department of Transportation; and the Tennessee Wildlife Resources Agency. Field sampling was as-sisted by L. Owens, L. Rucker, A. Colbin and F. Spilker, and J. Schmidhammer of the University of Tennessee provided statistical guidance.
Cover photo: Reference hardwood bottomland at the Hatchie National Wildlife Refuge, Haywood County, Tennessee.

Standard Bioassessment Procedures for Evaluating Ecological Restoration in Southeastern Hardwood BottomlandsMatthew J. Gray and Elizabeth A. SummersDepartment of Forestry, Wildlife and FisheriesUniversity of Tennessee
IntroductionHardwood bottomlands are forested floodplain wetlands adjacent to riverine sys-
tems that afford a number of ecosystem services, including flood control, groundwater recharge, carbon sequestration, and providing habitat for wildlife (Taylor et al. 1990, Hyberg and Riley 2009). Historically, these wetlands covered about 25 million acres in the conterminous United States, with the greatest coverage in the Southeast (Sharitz 1992). Coverage of hardwood bottomlands has decreased substantially since European settlement due to deforestation and draining for production agriculture (Tiner 1984). In the 1970s, the Clean Water Act established protection for hardwood bottomlands, and subsequent legislation created several conservation programs in the United States that provide funds to landowners to restore floodplain wetlands (Stanturf et al. 2001). The U.S. Department of Agriculture (USDA) Wetlands Reserve Program (WRP) is the largest conservation program that provides cost-share incentives for wetland resto-ration (King et al. 2006). As of January 2011, 2.3 million acres had been enrolled in the WRP (J. Groves, USDA Natural Resources Conservation Service [NRCS], per-sonal communication). Similarly, thousands of acres have been enrolled in the USDA Conservation Reserve Program for wetland restoration, and several state natural re-source agencies and nongovernment organizations participate in bottomland restora-tion (King and Keeland 1999). To date, no monitoring protocol has been developed for evaluating ecological restoration in hardwood bottomland ecosystems (NRCS 2010).
Bioassessment models are one tool that can be used by natural resource practitioners to evaluate the state of ecological restoration. A bioassessment model uses several bio-logical metrics to assign a site a numerical score, which is an indicator of overall eco-logical integrity and function (Karr 1981). Ecological integrity is defined as the ability of a site to support and maintain a balanced, adaptive community of organisms with a species composition and functional organization similar to undisturbed reference sites within a region (Karr and Dudley 1981). The process of developing a bioassessment model includes selection of sites along a disturbance or restoration gradient. Plant or animal assemblages are sampled at the sites, and biological metrics are chosen that

show a predictable and empirical response to restoration (Karr 1981). Each metric is assigned an individual score (i.e., a subindex), and subindices are summed to yield an overall index that can be used to compare state of ecological restoration among wet-lands of the same type (United States Environmental Protection Agency [EPA] 2002).
Our goal was to develop standard procedures for monitoring the state of ecological restoration in hardwood bottomlands in the southeastern United States. We developed bioassessment models by measuring the vegetation and bird communities at 17 resto-ration sites and four reference sites in western Tennessee, from March to August 2008. These sites were located in the Mississippi Alluvial Valley and Tennessee River Valley drainages, and they represented typical hardwood bottomlands in the southeastern United States (Summers 2010). We chose duration since enrollment in the WRP as the restoration/disturbance gradient, and identified six vegetation and three bird com-munity metrics that were strongly correlated with this gradient. These metrics were used to construct vegetation and bird bioassessment models. In practice, biologists measure these metrics in the field and compare measurements to reference values. Sites can be assigned to one of four restoration categories: early restoration, mid-restoration, late restoration and reference (or restored) condition. Below, we describe the proce-dures for using these models to monitor ecological restoration in hardwood bottom-lands. For more details, we refer readers to Summers (2010).
Bioassessment Model Components We developed bioassessment models for the vegetation and bird communities. We
recommend measuring both communities for the most comprehensive assessment of ecological restoration. Predictions of restoration state by vegetation and bird models were correlated (R2= 0.73) at our sites (Summers 2010); thus if the expertise, time or resources do not exist to measure both communities, one community could be mea-sured without losing substantial information. If one model is used, we recommend measuring the vegetation community, because sampling requires less expertise and time compared to measuring metrics in the bird model.
The vegetation bioassessment model includes density of logs, snags and overstory trees; basal area; and percent vertical cover of vegetation in two height strata (0 – 20 inches, 20 – 40 inches) measured using a profile board (Table 1). All vegetation met-rics were positively correlated with site age (i.e., the restoration gradient) except per-cent vertical cover, which was negatively related with site age. The bird bioassessment model contained density of bark feeding, branch nesting, and twig nesting species (Table 2). All bird metrics were positively related with site age. The restoration scores in Tables 1 and 2 were determined by calculating quartiles (i.e., 25th, 50th and 75th percentiles) from our field data, which resulted in an ordinal ranking of 1 – 3 or 1 – 4

for the scores depending on the metric. It is important to note that our models make predictions for conditions at typical
bottomland sites, and they assume a linear (not nonlinear) relationship between the metrics and site age. Certain disturbances (e.g., flooding from beaver dams, tornadoes) could result in high values for snag and log density, which indicate restored conditions using our models. Thus, our bioassessment models may not perform accurately at sites with disturbance that causes extensive tree mortality.
Field Sampling InstructionsFor both models, personnel should establish one permanent sampling plot at the ap-
proximate geometric center of the bottomland restoration site (Summers 2010). If the geometric center is not representative of site conditions, we recommend establishing the sampling plot at the approximate center of a representative portion of the site. Al-ternatively, more than one plot per site can be established at nonhomogeneous or large sites. Plots should be placed at least 275 yards apart if the bird community is measured to ensure that point count surveys are independent. Vegetation and bird community metrics should be averaged among plots at a site before assigning restoration scores us-ing Tables 1 and 2.
Vegetation metrics should be measured once between May and August. We recommend that the bird community is sampled at least four times between March and August, with at least one week between surveys. Sampling for both communities should be repeated every 2 – 4 years at the same plot to monitor the state of ecological restoration. Below are details on sampling procedures for both communities.
Vegetation — Vegetation sampling occurs in two concentric plots located around the approximate geometric center of the site (Figure 1). Count the number of overstory trees within a 0.1-acre circular plot (radius, r = 37 feet). Overstory trees are defined for our model as live woody plants that are greater than 4.6 feet in height with greater than 4.5 inches DBH. Next, count the number of snags and logs in a 7.8-acre circular plot (r = 330 ft). If Figure 1. Schematic of vegetation plots for measuring den-
sity of overstory trees, logs and snags, tree basal area, and percent vertical cover of vegetation. Plots are located at the approximate geometric center of the restoration site.

the site is smaller than 7.8 acres, count all snags and logs within the site and convert the field measurement to a 7.8-acre plot. We defined snags as dead standing trees with greater than 4.5 inches DBH. Logs were dead fallen trees with diameter greater than 4.5 inches measured at 4.5 feet from the base of the trunk. Next, measure basal area at plot center using a 10 BAF prism (Figure 1); total number of trees counted is multiplied by 10 to calculate basal area. Finally, percent vertical cover of vegetation is measured using a graduated checkered profile board (Figure 2). This profile board is divided into two height strata (low = 0 – 20 inches, mid-level = 20 – 40 inches); each stratum contains 30 2-by-2-inch alternately colored boxes (Figure 2). Percent vertical cover is measured separately for each stratum by placing the board at plot center and inspecting the board from a kneeling position at 33 feet in each of the four cardinal directions (Figure 1). Esimate percent vertical cover by counting the number of boxes per stratum that are covered greater than or equal to 50 percent by vegetation, then divide the number of covered boxes by 30 for each stratum. Percent vertical cover should be averaged among the four cardinal sampling locations for the low- and mid-level strata.
Avifauna — Bird community composition is measured using 10-minute, fixed-radius point count surveys extending from plot center to 165 feet (i.e., 1.95 acre plot, Ralph et al. 1993). Point counts should be performed between sunrise and five hours following sunrise on days with no rain and wind less than 7 mph (Ralph et al. 1993). After arriving to the site, stand at plot center for five minutes before beginning the bird survey. If vegetation measuring is planned also, perform the bird survey first. During the survey, do not move from plot center. All birds that are detected by sight or call less than or equal to 165 feet from plot center during the 10-minute point count survey are recorded to the species level. Birds that fly over plots are not included. To ensure birds beyond 165 feet are not included in the survey, we recommend using a rangefinder or tape measure to es-tablish reference distances from plot center. In our previous work (Summers 2010), we determined that bird detection was similar among bottomland restoration sites within 165 feet of plot center, thus uncorrected bird density estimates from the field can be used in our bioassessment models (i.e., correction for detectability is unnecessary).
Post-processing of the bird data is necessary to use the bird bioassessment model. All detected birds need to be assigned to a feeding and nesting guild following Appendix I
Figure 2. Checkered profile board used for measuring per-cent vertical cover of vegetation in 0 – 20 inches (low) and 20 – 40 inches (mid-level) height strata. There are 30 2-by-2-inch boxes per stratum.

(Summers 2010). If a detected bird is not in Appendix I, use DeGraaf and Chadwick (1984) or Ehrlich et al. (1988) for guild classification. Thereafter, sum the number of detected birds separately for the bark feeding, branch nesting and twig nesting guilds. Birds detected in other guilds are not needed for model predictions. If sampling oc-curred more than once, average the number of detected birds for each guild among sampling dates.
Metric Field Measurement Restoration ScoreLogs 0 1
1 – 2 23 – 21 3>21 4
Snags 0 11 – 2 2>2 3
Overstory trees 0 11 – 5 2>5 3
Basal area 0 11 – 30 231 – 60 3
>60 4Mid-level vertical cover (%) 93.9 – 100 1
80.5 – 93.8 247.6 – 80.4 3
0 – 47.5 4Low vertical cover (%) 98.3 – 100 1
85.1 – 98.2 2 0 – 85 3
Table 1. Metric scoring for the vegetation bioassessment model that predicts the state of ecological restoration in hardwood bottomlands.
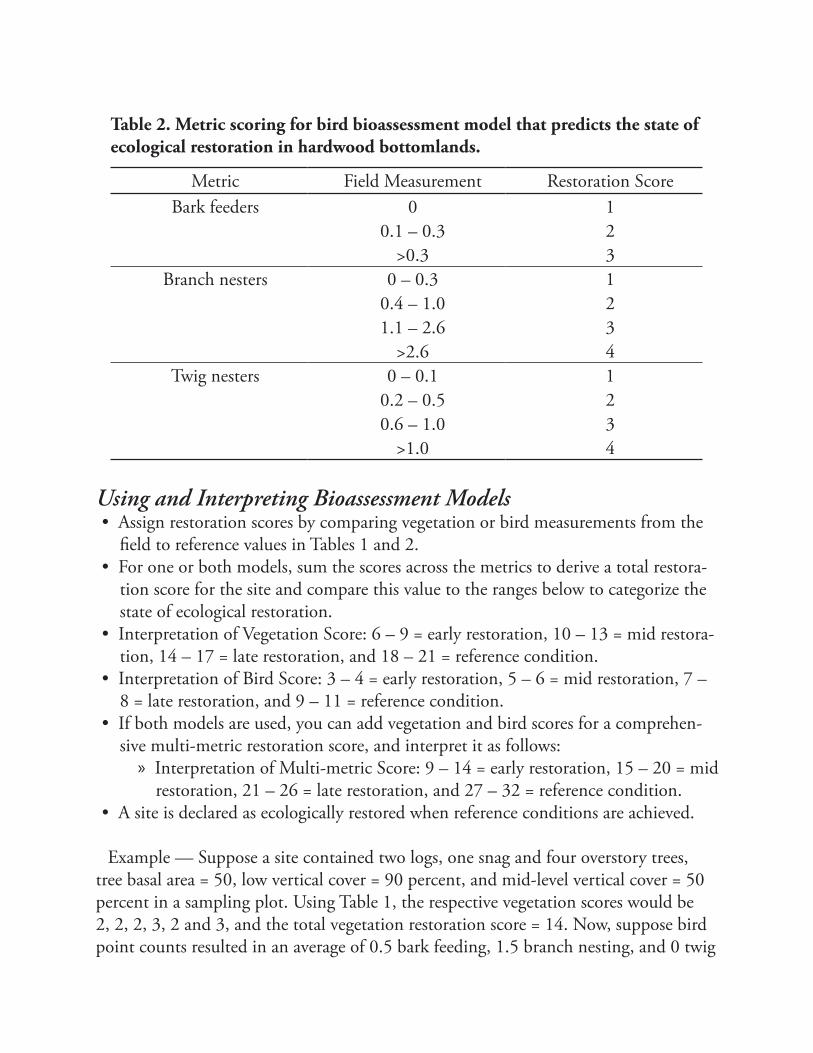
Using and Interpreting Bioassessment Models• Assign restoration scores by comparing vegetation or bird measurements from the
field to reference values in Tables 1 and 2.• For one or both models, sum the scores across the metrics to derive a total restora-
tion score for the site and compare this value to the ranges below to categorize the state of ecological restoration.
• Interpretation of Vegetation Score: 6 – 9 = early restoration, 10 – 13 = mid restora-tion, 14 – 17 = late restoration, and 18 – 21 = reference condition.
• Interpretation of Bird Score: 3 – 4 = early restoration, 5 – 6 = mid restoration, 7 – 8 = late restoration, and 9 – 11 = reference condition.
• If both models are used, you can add vegetation and bird scores for a comprehen-sive multi-metric restoration score, and interpret it as follows:
» Interpretation of Multi-metric Score: 9 – 14 = early restoration, 15 – 20 = mid restoration, 21 – 26 = late restoration, and 27 – 32 = reference condition.
• A site is declared as ecologically restored when reference conditions are achieved.
Example — Suppose a site contained two logs, one snag and four overstory trees, tree basal area = 50, low vertical cover = 90 percent, and mid-level vertical cover = 50 percent in a sampling plot. Using Table 1, the respective vegetation scores would be 2, 2, 2, 3, 2 and 3, and the total vegetation restoration score = 14. Now, suppose bird point counts resulted in an average of 0.5 bark feeding, 1.5 branch nesting, and 0 twig
Metric Field Measurement Restoration ScoreBark feeders 0 1
0.1 – 0.3 2>0.3 3
Branch nesters 0 – 0.3 10.4 – 1.0 21.1 – 2.6 3
>2.6 4Twig nesters 0 – 0.1 1
0.2 – 0.5 20.6 – 1.0 3
>1.0 4
Table 2. Metric scoring for bird bioassessment model that predicts the state of ecological restoration in hardwood bottomlands.

nesting species per plot. The respective bird scores would be 3, 3 and 1 for a total bird restoration score = 7 (Table 2). Thus, the combined multimetric score would be 21 (14 + 7), which indicates the site is in late restoration based on the ranges provided above.
ConclusionsWe present the first bioassessment models for use in monitoring ecological restora-
tion in hardwood bottomlands in the southeastern United States. Given that our mod-els were developed at 21 typical bottomland WRP sites across western Tennessee and that our restoration gradient followed a predictable successional gradient (Summers 2010), we anticipate that our models will produce robust predictions of ecological res-toration in the southeastern United States. Moreover, metrics in our vegetation model were based on forest structure (i.e., density and percent cover), which tend to vary less spatially than metrics related to plant composition. Similarly, the bird model con-tained metrics for abundance of community guilds, which are less variable than species composition. Despite these promising attributes, it is important that researchers test the performance of our models in other regions of the Southeast. Summers (2010) outlined an approach to validate our bioassessment models among regions. Given that our models were developed at typical bottomland sites, they may not accurately pre-dict restoration at sites that become invaded with exotic plant species or are exposed to atypical disturbance (e.g., excessive flooding from beavers, tornadoes).
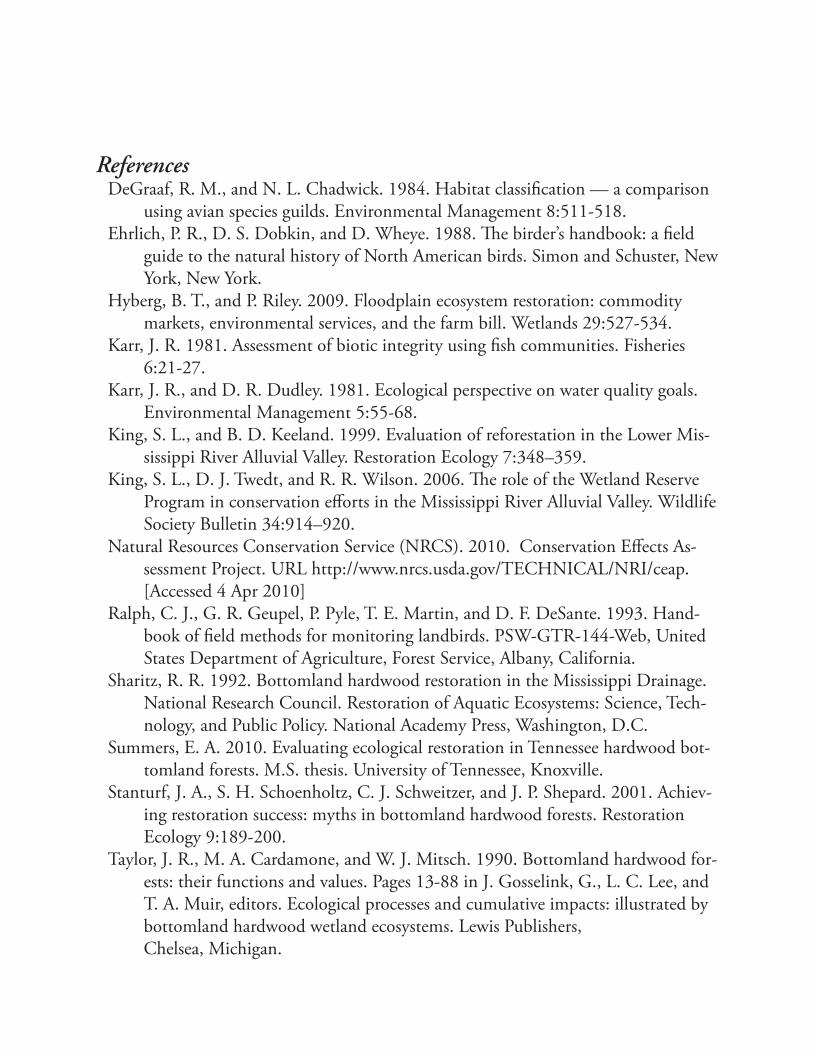
ReferencesDeGraaf, R. M., and N. L. Chadwick. 1984. Habitat classification — a comparison
using avian species guilds. Environmental Management 8:511-518.Ehrlich, P. R., D. S. Dobkin, and D. Wheye. 1988. The birder’s handbook: a field
guide to the natural history of North American birds. Simon and Schuster, New York, New York.
Hyberg, B. T., and P. Riley. 2009. Floodplain ecosystem restoration: commodity markets, environmental services, and the farm bill. Wetlands 29:527-534.
Karr, J. R. 1981. Assessment of biotic integrity using fish communities. Fisheries 6:21-27.
Karr, J. R., and D. R. Dudley. 1981. Ecological perspective on water quality goals. Environmental Management 5:55-68.
King, S. L., and B. D. Keeland. 1999. Evaluation of reforestation in the Lower Mis- sissippi River Alluvial Valley. Restoration Ecology 7:348–359.
King, S. L., D. J. Twedt, and R. R. Wilson. 2006. The role of the Wetland Reserve Program in conservation efforts in the Mississippi River Alluvial Valley. Wildlife Society Bulletin 34:914–920.
Natural Resources Conservation Service (NRCS). 2010. Conservation Effects As- sessment Project. URL http://www.nrcs.usda.gov/TECHNICAL/NRI/ceap. [Accessed 4 Apr 2010]
Ralph, C. J., G. R. Geupel, P. Pyle, T. E. Martin, and D. F. DeSante. 1993. Hand- book of field methods for monitoring landbirds. PSW-GTR-144-Web, United States Department of Agriculture, Forest Service, Albany, California.
Sharitz, R. R. 1992. Bottomland hardwood restoration in the Mississippi Drainage. National Research Council. Restoration of Aquatic Ecosystems: Science, Tech- nology, and Public Policy. National Academy Press, Washington, D.C.
Summers, E. A. 2010. Evaluating ecological restoration in Tennessee hardwood bot- tomland forests. M.S. thesis. University of Tennessee, Knoxville.
Stanturf, J. A., S. H. Schoenholtz, C. J. Schweitzer, and J. P. Shepard. 2001. Achiev- ing restoration success: myths in bottomland hardwood forests. Restoration Ecology 9:189-200.
Taylor, J. R., M. A. Cardamone, and W. J. Mitsch. 1990. Bottomland hardwood for- ests: their functions and values. Pages 13-88 in J. Gosselink, G., L. C. Lee, and T. A. Muir, editors. Ecological processes and cumulative impacts: illustrated by bottomland hardwood wetland ecosystems. Lewis Publishers, Chelsea, Michigan.

Tiner, R. W., Jr. 1984. Wetlands of the United States: current status and recent trends. U.S. Fish and Wildlife Service, Washington, D.C.
United States Environmental Protection Agency (EPA). 2002. Methods for evalu- ating wetland condition: introduction to wetland biological assessment. EPA- 822-R-02-014, United States Environmental Protection Agency, Office of Wa- ter, Washington, D.C.

Appendix I. Commonly detected bird nesting and feeding guilds in Tennessee hardwood bottomlands and the corresponding habitat-use guilds (Summers 2010).
Speciesa Scientific Name Nesting Guildb Foraging Guildc
Acadian flycatcher Empidonax virescens Twig airAmerican crow Corvus brachyrhynchos Branch groundAmerican goldfinch Carduelis tristis Twig groundAmerican redstart Setophaga ruticilla Branch canopyAmerican robin Turdus migratorius Branch groundbank swallow Riparia riparia Other airbarn swallow Hirundo rustica Other airblack and white warbler Mniotilta varia Ground canopyblue-gray gnatcatcher Polioptila caerulea Branch canopybrown-headed cowbird Molothrus ater Other groundblue grosbeak Passerina caerulea Shrub groundblue jay Cyanocitta cristata Branch groundblackpoll warbler Dendroica striata Branch canopybrown thrasher Toxostoma rufum Shrub groundblue-winged teal Anas discors Ground otherblue-winged warbler Vermivora pinus Ground canopyCarolina chickadee Parus carolinensis Cavity canopyCarolina wren Thryothorus ludovicianus Cavity groundchimney swift Chaetura pelagica Cavity aircliff swallow Hirundo spilodera Other aircommon grackle Quiscalus quiscula Branch groundcommon snipe Gallinago gallinago Ground groundcommon yellowthroat Geothlypis trichas Ground canopydickcissel Spiza americana Ground grounddowny woodpecker Picoides tridactylus Cavity barkeastern bluebird Sialia sialis Cavity aireastern kingbird Tyrannus tyrannus Branch aireastern meadowlark Sturnella magna Ground groundeastern phoebe Sayornis phoebe Cavity aireastern towhee Pipilo erythrophthalmus Ground groundeastern wood-pewee Contopus virens Twig airfish crow Corvus ossifragus Branch groundfield sparrow Spizella pusilla Ground groundfox sparrow Passerella iliaca Ground groundgreat blue heron Ardea herodias Branch othergreat-crested flycatcher Myiarchus crinitus Cavity air

Speciesa Scientific Name Nesting Guildb Foraging Guildc
golden-crowned kinglet Regulus satrapa Twig canopygray catbird Dumetella carolinensis Shrub ground
great egret Egretta alba Branch othergreen heron Butorides virescens Branch otherhairy woodpecker Picoides villosus Cavity barkhermit thrush Catharus guttatus Ground groundindigo bunting Passerina cyanea Ground canopykilldeer Charadrius vociferous Ground groundleast bittern Ixobrychus exilis Ground othermarsh wren Cistothorus palustris Ground groundMississippi kite Ictinia mississippiensis Branch airmourning dove Zenaida macroura Branch groundNashville warbler Vermivora ruficapilla Ground canopynorthern bobwhite Colinus virginianus Ground groundnorthern cardinal Cardinalis cardinalis Ground groundnorthern parula Parula americana Twig Canopynorthern waterthrush Seiurus noveboracensis Ground otherorchard oriole Icterus spurius Twig canopypalm warbler Dendroica palmarum Ground groundpileated woodpecker Dryocopus pileatus Cavity barkprairie warbler Dendroica discolor Shrub canopyprothonotary warbler Protonotaria citrea Cavity barkpurple martin Progne subsis Cavity airred-bellied woodpecker Melanerpes carolinus Cavity barkruby-crowned kinglet Regulus calendula Twig canopyred-eyed vireo Vireo olivaceus Shrub canopyred-shouldered hawk Buteo lineatus Branch groundruby-throated hummingbird Archilochus colubris Branch otherred-winged blackbird Agelaius phoeniceus Ground groundsavanna sparrow Passerculus sandwichensis Ground groundsong sparrow Melospiza melodia Ground groundsummer tanager Piranga rubra Branch canopyswamp sparrow Melospiza georgiana Shrub groundSwainson's thrush Catharus ustulatus Branch groundSwainson's warbler Limnothlypis swainsonii Shrub groundTennessee warbler Vermivora peregrina Ground canopytree swallow Tachycineta bicolor Cavity airtufted titmouse Baeolophus bicolor Cavity canopy
Appendix I (continued).

Speciesa Scientific Name Nesting Guildb Foraging Guildc
white-breasted nuthatch Sitta carolinensis Cavity barkwhite-eyed vireo Vireo griseus Shrub canopywillow flycatcher Empidonax traillii Shrub airwinter wren Troglodytes troglodytes Ground Groundwood duck Aix sponsa Cavity otherwood thrush Hylocichla mustelina Branch groundwhite-throated sparrow Zonotrichia albicollis Ground groundyellow-breasted chat Icteria virens Shrub canopyyellow-billed cuckoo Coccyzus americanus Shrub canopyyellow-bellied sapsucker Sphyrapicus varius Cavity barkyellow-crowned night heron Nyctanassa violacea Branch otheryellow-rumped warbler Dendroica coronata Branch canopyyellow-throated vireo Vireo flavifrons Twig canopyyellow-throated warbler Dendroica dominica Branch canopyyellow warbler Dendroica petechia Branch canopy
Appendix I (continued).
aSpecies detected in a 1.95 acre (54.7-yard radius) plot during a 10-minute point count survey.
bTwig = species primarily nests on tree twigs, branch = species primarily nests on tree branches, ground = species primarily nests on ground or in low herbaceous vegetation, shrub = species primarily nests in shrubs, vines or brambles, cavity = species primarily nests in tree cavities or crevices, and other = species belongs to a nesting guild which was not commonly detected during model development (DeGraaf and Chadwick 1984).
cAir = species primarily forages aerially, ground = species primarily forages on the ground, canopy = species primarily forages in the canopy, and other = species belongs to a foraging guild which was not commonly detected during model development (DeGraaf and Chadwick 1984).
12-0116 03/12 The University of Tennessee is an EEO/AA/Title VI/Title IX/Section 504/ADA/ADEA institution in the provision of its education and employment programs and services. All qualified applicants will receive equal con-
sideration for employment without regard to race, color, national origin, religion, sex, pregnancy, marital status, sexual orientation, gender identity, age, physical or mental disability, or covered veteran status.


