Standard Bank Africa Total Return Index (SBAFRITR Index ... · Standard Bank Africa Total Return...
17
1 Standard Bank Africa Total Return Index (SBAFRITR Index) Executive Summary The objective of the Standard Bank Africa Index (“SBAFRITR Index”) is to provide access to the broad stock market in Africa excluding South Africa. Twice a year, the SBAFRITR Index Selection Committee (the “Committee”) will identify companies that will make up the composition of the Index. Stocks in the Index will be selected from the equities listed in major stock exchanges outside Africa (the “International shares”) and which have exposure to Africa, and from equities listed in relevant stock exchanges in Africa (the “Local shares”). In addition, criteria related to market capitalization, liquidity and a quantitative optimisation methodology will be applied to determine the Index constituents and their respective weightings (as further discussed below). The Committee will also oversee the maintenance of the Index on a semi-annual basis and ensure that the rules continue to be applicable. Summary of SBAFRITR Index Methodology The Index is constructed on the basis of a set of rigid and transparent procedures and this can be categorised into the two main stages summarised below: Stock selection: The initial set of stocks comprising the International and Local shares undergo a filtering process whereby only shares with the geographical allocation of business, market capitalisation and liquidity that meet specific criteria (discussed below) are selected for further analysis. Broad allocation by the region and type of stocks: In the methodology of constructing the Index we pursue several goals: achieving the maximum liquidity, a fair representation of Africa by its local shares, emphasis on the Sub-Saharan region that is of particular interest to investors and broadest possible distribution of stocks among African countries. Given the fact that local shares in the Sub-Saharan region are the least liquid, the combined value of the selected shares in that region will determine the final value of the Index based on the pre-set weights of the North African local and International stocks as shown in the diagram below. Sub - Sahara local stocks North Africa local stocks International stocks Given liquidity. Set as 60% of local the part of the index 60% 40% Determined by the remaining 40% of the local part of the index Determined by allocation of 40% of the overal indexal to international shares
Transcript of Standard Bank Africa Total Return Index (SBAFRITR Index ... · Standard Bank Africa Total Return...
1
Standard Bank Africa Total Return Index (SBAFRITR Index)
Executive Summary
The objective of the Standard Bank Africa Index (“SBAFRITR Index”) is to provide access to the broad stock market in Africa excluding South Africa.
Twice a year, the SBAFRITR Index Selection Committee (the “Committee”) will identify companies that will make up the composition of the Index.
Stocks in the Index will be selected from the equities listed in major stock exchanges outside Africa (the “International shares”) and which have exposure to Africa, and from equities listed in relevant stock exchanges in Africa (the “Local shares”).
In addition, criteria related to market capitalization, liquidity and a quantitative optimisation methodology will be applied to determine the Index constituents and their respective weightings (as further discussed below).
The Committee will also oversee the maintenance of the Index on a semi-annual basis and ensure that the rules continue to be applicable.
Summary of SBAFRITR Index Methodology
The Index is constructed on the basis of a set of rigid and transparent procedures and this can be categorised into the two main stages summarised below:
Stock selection: The initial set of stocks comprising the International and Local shares undergo a filtering process whereby only shares with the geographical allocation of business, market capitalisation and liquidity that meet specific criteria (discussed below) are selected for further analysis.
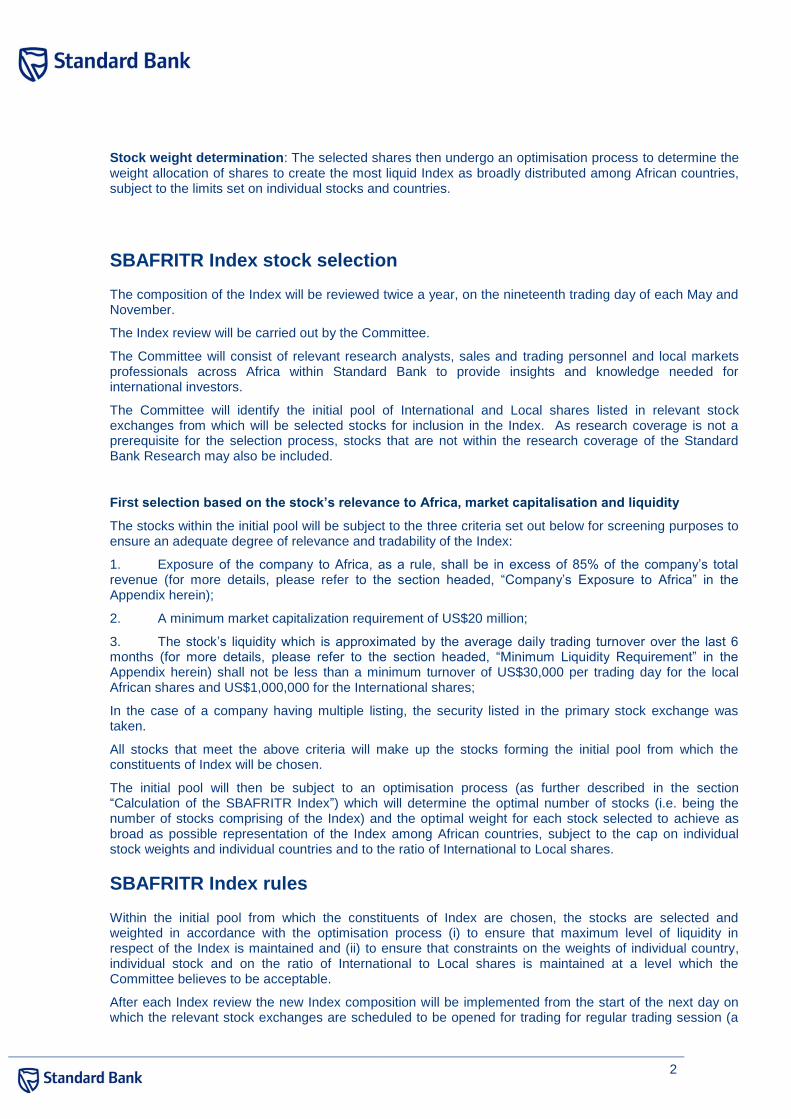
Broad allocation by the region and type of stocks: In the methodology of constructing the Index we pursue several goals: achieving the maximum liquidity, a fair representation of Africa by its local shares, emphasis on the Sub-Saharan region that is of particular interest to investors and broadest possible distribution of stocks among African countries. Given the fact that local shares in the Sub-Saharan region are the least liquid, the combined value of the selected shares in that region will determine the final value of the Index based on the pre-set weights of the North African local and International stocks as shown in the diagram below.
Sub - Sahara local stocks
North Africa local stocks
International stocks
Given liquidity. Set as 60% of local the
part of the index
60%
40%
Determined by the remaining 40% of the
local part of the index
Determined by allocation of 40% of the
overal indexal to international shares
2
Stock weight determination: The selected shares then undergo an optimisation process to determine the weight allocation of shares to create the most liquid Index as broadly distributed among African countries, subject to the limits set on individual stocks and countries.
SBAFRITR Index stock selection
The composition of the Index will be reviewed twice a year, on the nineteenth trading day of each May and November.
The Index review will be carried out by the Committee.
The Committee will consist of relevant research analysts, sales and trading personnel and local markets professionals across Africa within Standard Bank to provide insights and knowledge needed for international investors.
The Committee will identify the initial pool of International and Local shares listed in relevant stock exchanges from which will be selected stocks for inclusion in the Index. As research coverage is not a prerequisite for the selection process, stocks that are not within the research coverage of the Standard Bank Research may also be included.
First selection based on the stock’s relevance to Africa, market capitalisation and liquidity
The stocks within the initial pool will be subject to the three criteria set out below for screening purposes to ensure an adequate degree of relevance and tradability of the Index:
1. Exposure of the company to Africa, as a rule, shall be in excess of 85% of the company’s total revenue (for more details, please refer to the section headed, “Company’s Exposure to Africa” in the Appendix herein);
2. A minimum market capitalization requirement of US$20 million;
3. The stock’s liquidity which is approximated by the average daily trading turnover over the last 6 months (for more details, please refer to the section headed, “Minimum Liquidity Requirement” in the Appendix herein) shall not be less than a minimum turnover of US$30,000 per trading day for the local African shares and US$1,000,000 for the International shares;
In the case of a company having multiple listing, the security listed in the primary stock exchange was taken.
All stocks that meet the above criteria will make up the stocks forming the initial pool from which the constituents of Index will be chosen.
The initial pool will then be subject to an optimisation process (as further described in the section “Calculation of the SBAFRITR Index”) which will determine the optimal number of stocks (i.e. being the number of stocks comprising of the Index) and the optimal weight for each stock selected to achieve as broad as possible representation of the Index among African countries, subject to the cap on individual stock weights and individual countries and to the ratio of International to Local shares.
SBAFRITR Index rules
Within the initial pool from which the constituents of Index are chosen, the stocks are selected and weighted in accordance with the optimisation process (i) to ensure that maximum level of liquidity in respect of the Index is maintained and (ii) to ensure that constraints on the weights of individual country, individual stock and on the ratio of International to Local shares is maintained at a level which the Committee believes to be acceptable.
After each Index review the new Index composition will be implemented from the start of the next day on which the relevant stock exchanges are scheduled to be opened for trading for regular trading session (a
3
“Trading Day”) and up to the twentieth Trading Day thereafter. The Committee may at its discretion extend such period as explained more fully below.
The Index will be calculated daily on a price total return basis (described below in the section “Treatment of cash dividends”) and will be published on Bloomberg under the ticker SBAFRITR Index (US$).
In addition to the above function, the Committee will have the following responsibilities:
Ensuring the rules of the Index remain relevant following any structural changes to the market.
Extending the timeframe for implementing changes to the Index beyond the twentieth Trading Day period. This will be done in the event that a material increase in the liquidity/capacity of the Index is required in order to minimize market impact (i.e. the potential impact on the market price of the stocks (“Affected Stocks”) affected by such implementation and Committee’s re-weighting of such stocks). The Committee may in its discretion extend such timeframe if it believes it is necessary to maintain the price of the Affected Stocks within a range of the target weighted average price of such stock per day which it considers appropriate. Any such decision will be published in advance on the relevant Bloomberg page (SBAE <GO>).
The Committee may decide to make downward adjustments to the weighting of any constituent stock between review dates if it determines that there is a material deterioration to the liquidity levels of any stocks comprising of the Index. Moreover, the committee may exercise discretion on the treatment of non-standard corporate events (e.g. take-overs of constituents by co-constituents, spin-offs, etc) and to make any related re-weighting. Should either of these two events occur, the committee may, in its discretion, conduct an interim review to determine the composition of the Index by (i) reducing the weighting of the stock(s) affected by the occurrence of such event to zero until the next review date and leaving the weighting of each remaining constituent stocks unchanged or (ii) reducing such affected stock(s) to zero until the next review date and rebalancing the composition of the Index as it determines appropriate. Any such decision will be announced in advance on the relevant Bloomberg page.
The Committee may, at any time and in its sole discretion, make any adjustments, re-weighting or changes to the composition of the Index and take such other actions it considers necessary if it determines that a force majeure event has occurred in respect of the Index.
SBAFRITR Index composition
The Committee will apply the rules outlined in the above section to determine the composition of the Index. For more information refer to the Methodology, Calculations and Sources section.
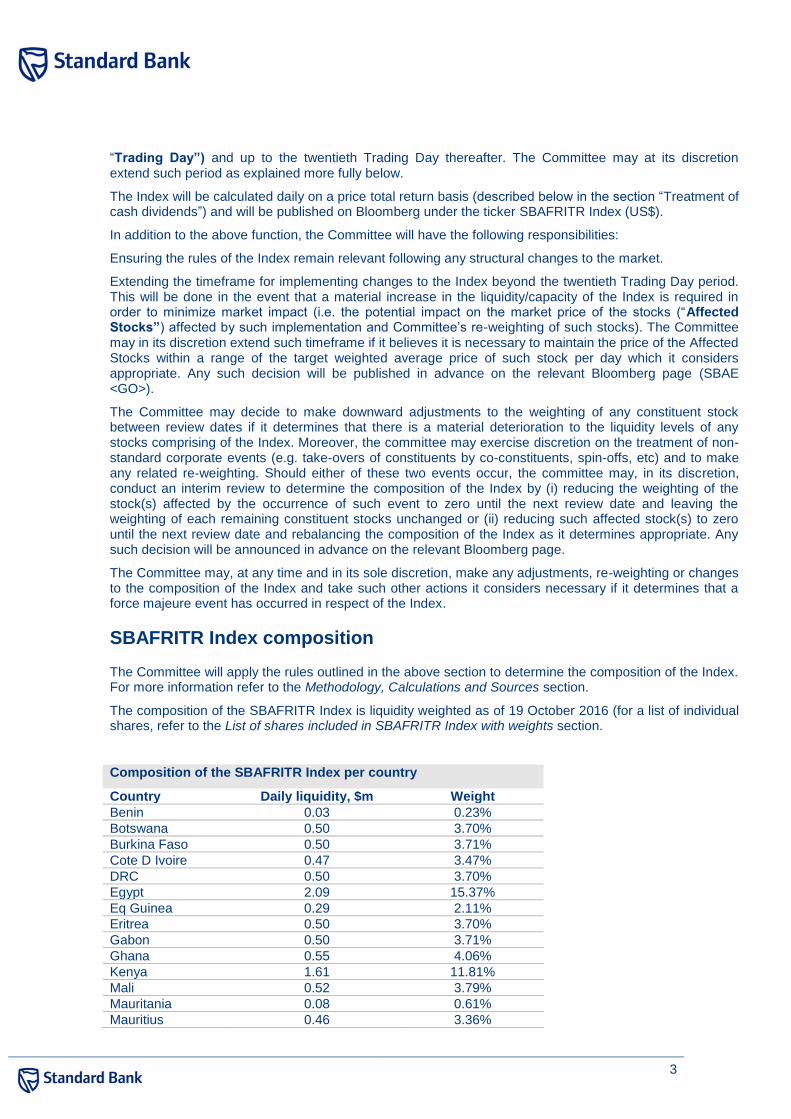
The composition of the SBAFRITR Index is liquidity weighted as of 19 October 2016 (for a list of individual shares, refer to the List of shares included in SBAFRITR Index with weights section.
Composition of the SBAFRITR Index per country
Country Daily liquidity, $m Weight
Benin 0.03 0.23%
Botswana 0.50 3.70%
Burkina Faso 0.50 3.71%
Cote D Ivoire 0.47 3.47%
DRC 0.50 3.70%
Egypt 2.09 15.37%
Eq Guinea 0.29 2.11%
Eritrea 0.50 3.70%
Gabon 0.50 3.71%
Ghana 0.55 4.06%
Kenya 1.61 11.81%
Mali 0.52 3.79%
Mauritania 0.08 0.61%
Mauritius 0.46 3.36%
4
Morocco 0.82 6.00%
Namibia 0.03 0.23%
Nigeria 1.89 13.87%
Senegal 0.50 3.71%
Tanzania 0.50 3.71%
Tunisia 0.41 3.00%
Zambia 0.56 4.15%
Zimbabwe 0.27 2.00%
Source: Bloomberg, Global Markets Research
Based on the liquidity numbers we are able to estimate the overall liquidity of the Index.
In particular, we calculate that a US$4.1m program trade across all the names in the Index would represent 30% of the average daily turnover of each stock.
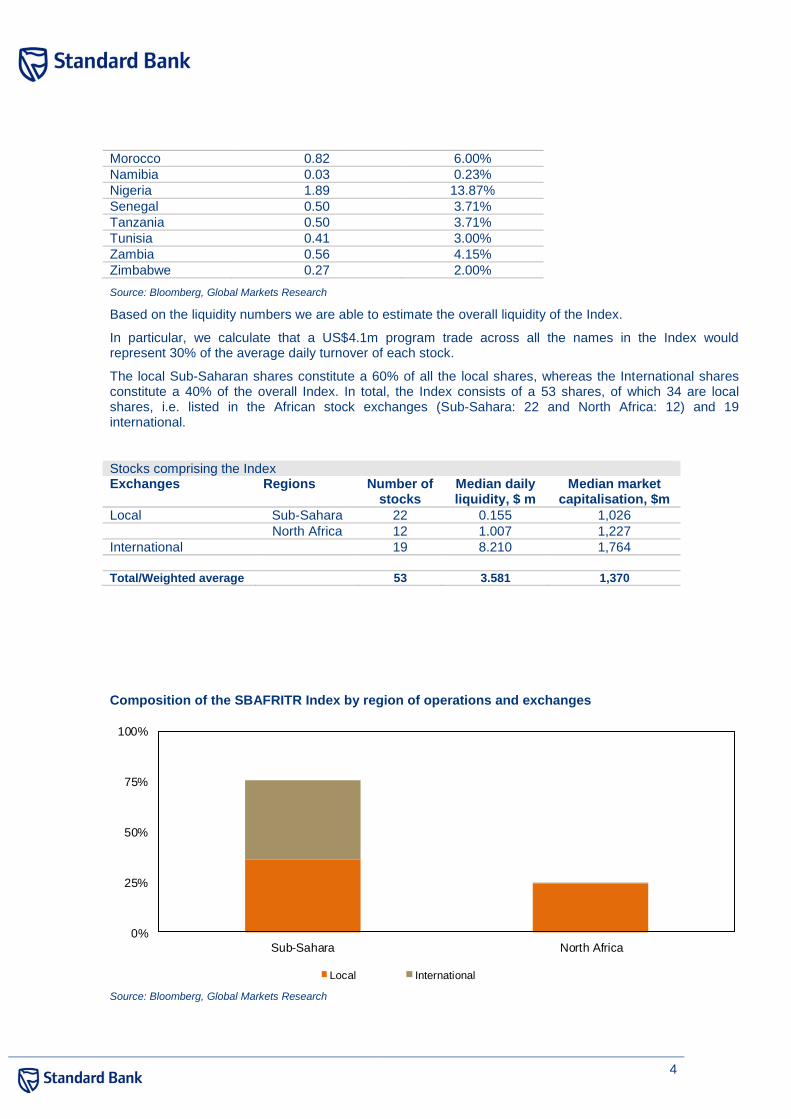
The local Sub-Saharan shares constitute a 60% of all the local shares, whereas the International shares constitute a 40% of the overall Index. In total, the Index consists of a 53 shares, of which 34 are local shares, i.e. listed in the African stock exchanges (Sub-Sahara: 22 and North Africa: 12) and 19 international.
Stocks comprising the Index Exchanges Regions Number of
stocks Median daily liquidity, $ m
Median market capitalisation, $m
Local Sub-Sahara 22 0.155 1,026
North Africa 12 1.007 1,227
International 19 8.210 1,764
Total/Weighted average 53 3.581 1,370
Composition of the SBAFRITR Index by region of operations and exchanges
Source: Bloomberg, Global Markets Research
0%
25%
50%
75%
100%
Sub-Sahara North Africa
Local International
5
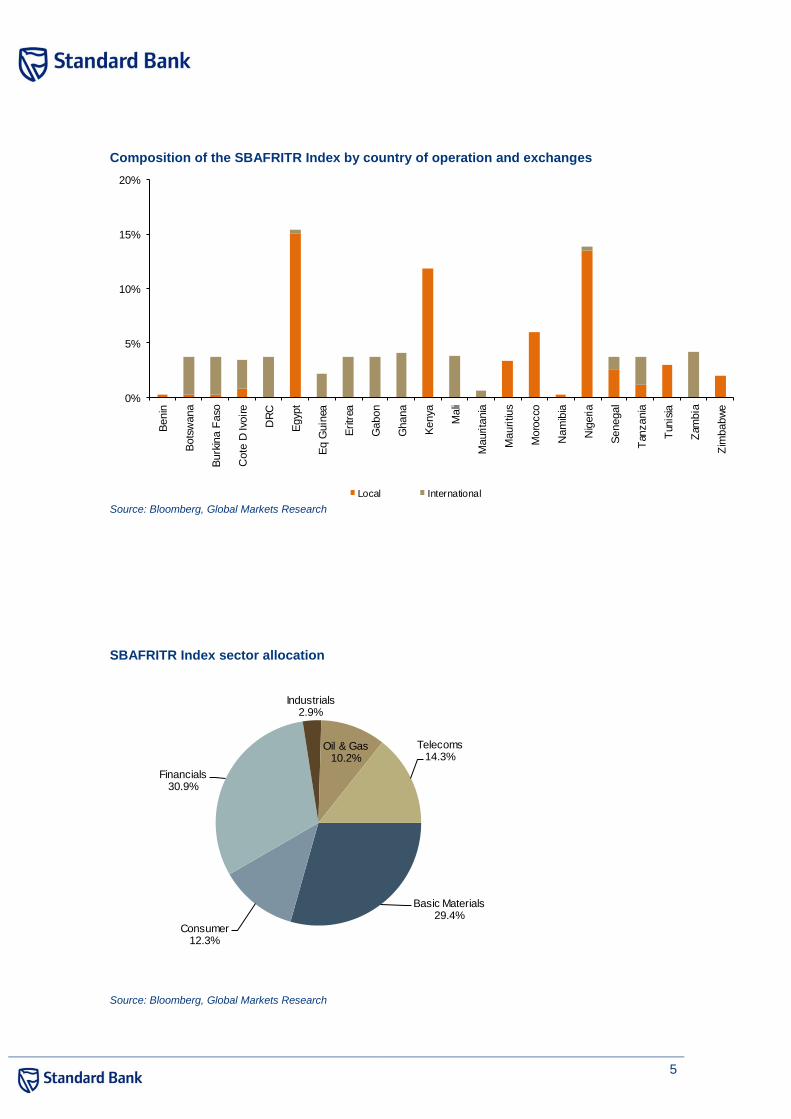
Composition of the SBAFRITR Index by country of operation and exchanges
Source: Bloomberg, Global Markets Research
SBAFRITR Index sector allocation
Source: Bloomberg, Global Markets Research
0%
5%
10%
15%
20%
Benin
Bots
wana
Burk
ina F
aso
Cote
D Ivo
ire
DR
C
Egyp
t
Eq G
uin
ea
Eritr
ea
Gabon
Ghana
Kenya
Mali
Maurita
nia
Mauritiu
s
Moro
cco
Nam
ibia
Nig
eria
Senegal
Tan
zania
Tun
isia
Zam
bia
Zim
babw
e
Local International
Basic Materials29.4%
Consumer12.3%
Financials30.9%
Industrials2.9%
Oil & Gas10.2%
Telecoms14.3%
6
The SBAFRITR Index is well diversified across different sectors. The Basic Materials and the Financials sectors are dominant which is reflective of the International shares, which tend to be involved in mining operations, and a large weighting of banking stocks on the local exchanges.
Top 10 shares in SBAFRITR Index Bloomberg ticker
Company name Sector Weight (as of Apr 18, 2016)
SAFCOM KN SAFARICOM LTD Telecommunications 5.00%
OPHR LN OPHIR ENERGY PLC Oil & Gas 5.00%
FM CN FIRST QUANTUM MINERALS LTD Basic Materials 4.76%
HRHO EY EFG-HERMES HOLDING SAE Financials 4.72%
EDV CN ENDEAVOUR MINING CORP Basic Materials 4.49%
GTHE EY GLOBAL TELECOM HOLDING Telecoms 4.41%
GUARANTY NL GUARANTY TRUST BANK Financials 4.21%
ZENITHBA NL ZENITH BANK PLC Financials 4.08%
NSU CN NEVSUN RESOURCES LTD Basic Materials 3.70%
TLW LN TULLOW OIL PLC Oil & Gas 3.52%
7
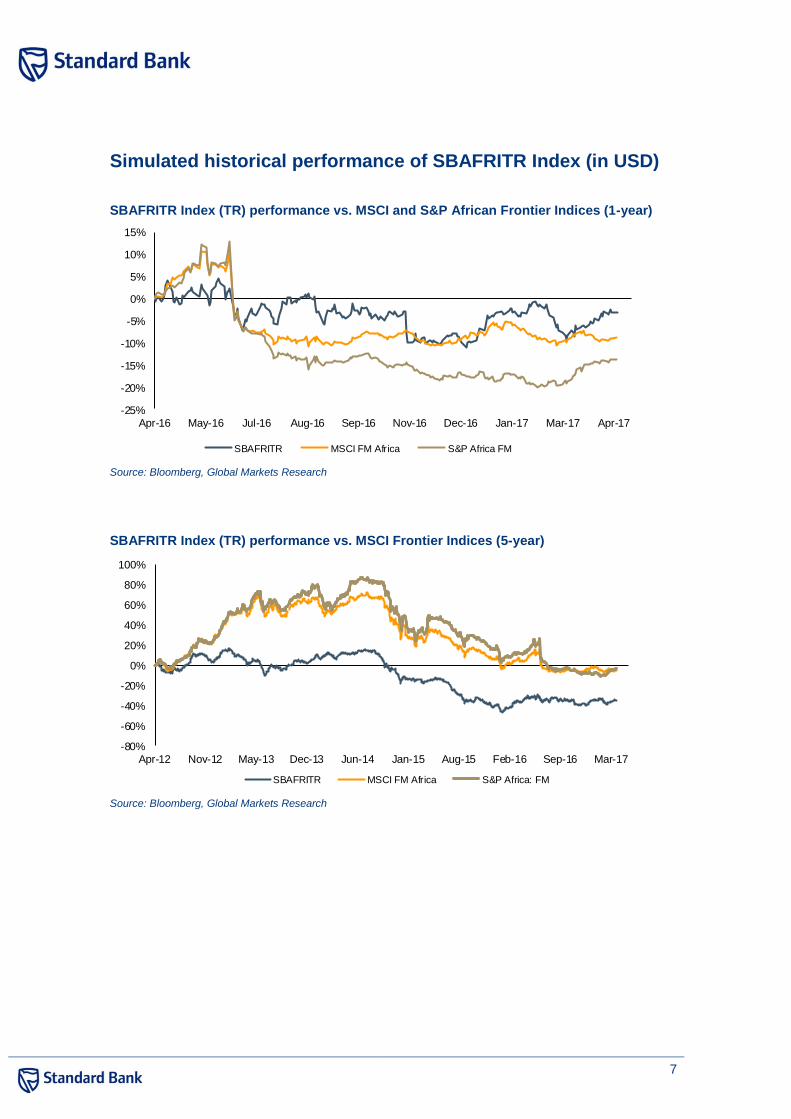
Simulated historical performance of SBAFRITR Index (in USD)
SBAFRITR Index (TR) performance vs. MSCI and S&P African Frontier Indices (1-year)
Source: Bloomberg, Global Markets Research
SBAFRITR Index (TR) performance vs. MSCI Frontier Indices (5-year)
Source: Bloomberg, Global Markets Research
-25%
-20%
-15%
-10%
-5%
0%
5%
10%
15%
Apr-16 May-16 Jul-16 Aug-16 Sep-16 Nov-16 Dec-16 Jan-17 Mar-17 Apr-17
SBAFRITR MSCI FM Africa S&P Africa FM
-80%
-60%
-40%
-20%
0%
20%
40%
60%
80%
100%
Apr-12 Nov-12 May-13 Dec-13 Jun-14 Jan-15 Aug-15 Feb-16 Sep-16 Mar-17
SBAFRITR MSCI FM Africa S&P Africa: FM
8
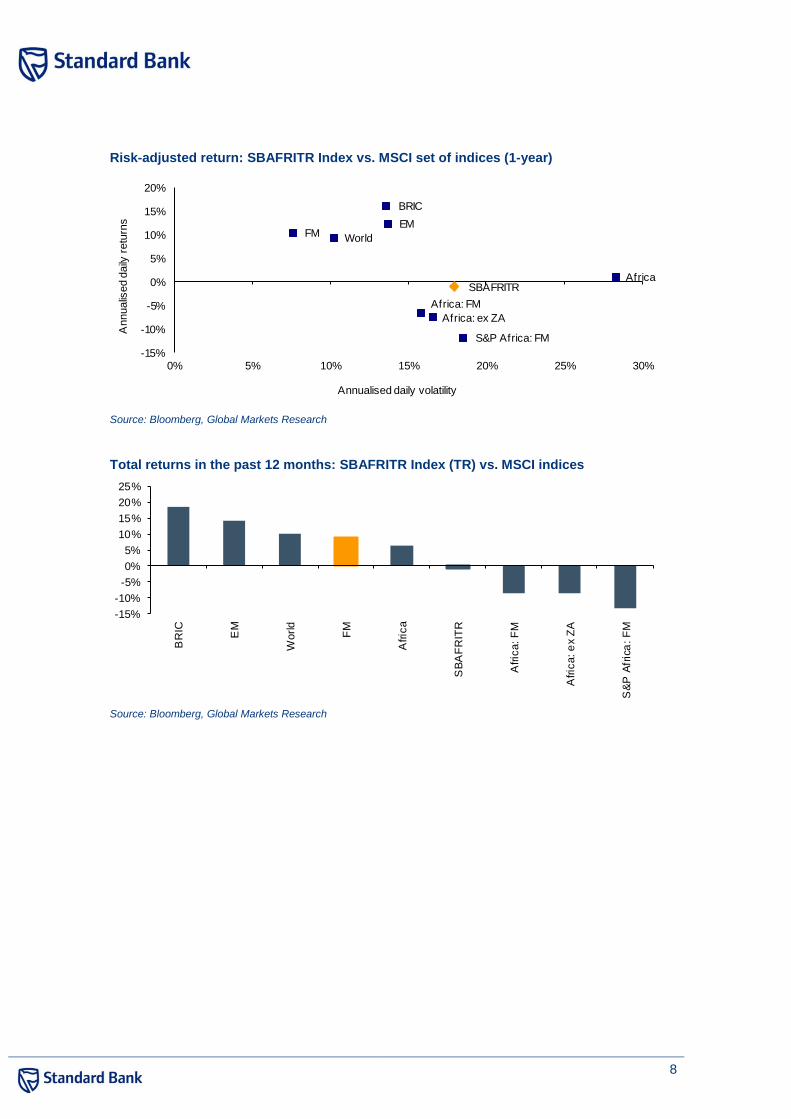
Risk-adjusted return: SBAFRITR Index vs. MSCI set of indices (1-year)
Source: Bloomberg, Global Markets Research
Total returns in the past 12 months: SBAFRITR Index (TR) vs. MSCI indices
Source: Bloomberg, Global Markets Research
SBAFRITR
World
EM
BRIC
FM
Africa
Africa: ex ZA
Africa: FM
S&P Africa: FM
-15%
-10%
-5%
0%
5%
10%
15%
20%
0% 5% 10% 15% 20% 25% 30%
Annualis
ed d
aily
retu
rns
Annualised daily volatility
-15%
-10%
-5%
0%
5%
10%
15%
20%
25%
BR
IC
EM
World
FM
Afric
a
SB
AF
RIT
R
Afric
a: F
M
Afric
a: e
x Z
A
S&
P A
fric
a: F
M
9
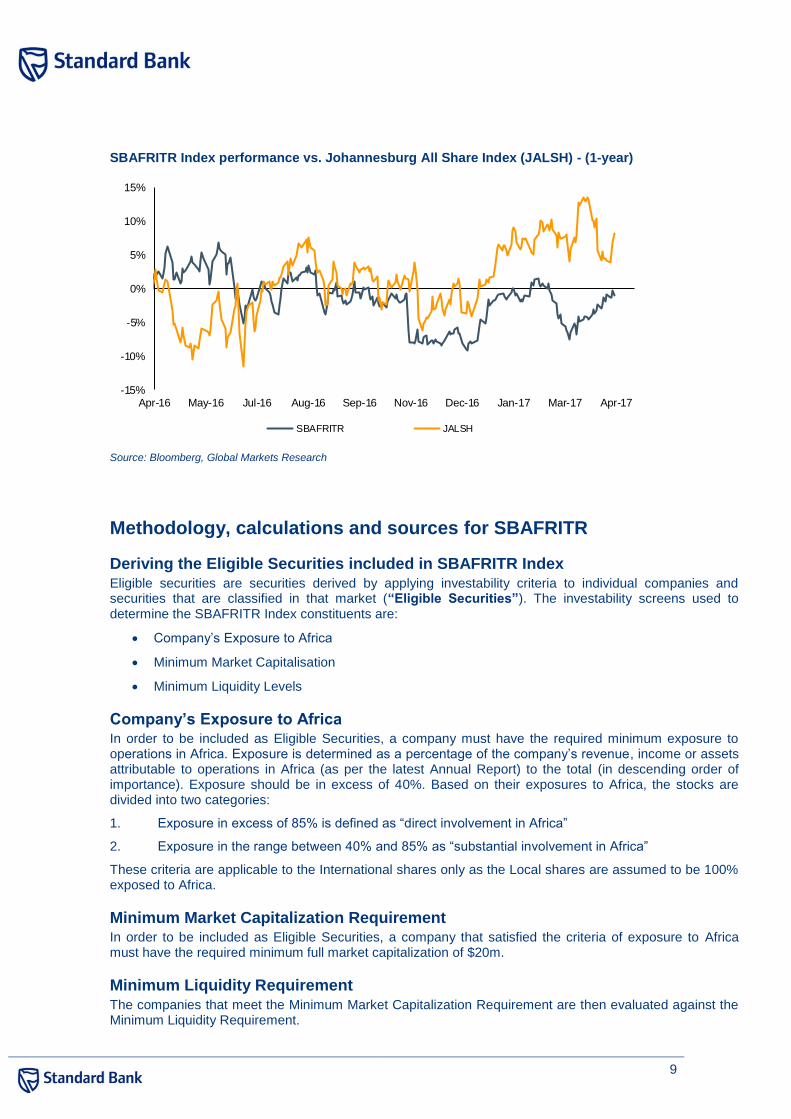
SBAFRITR Index performance vs. Johannesburg All Share Index (JALSH) - (1-year)
Source: Bloomberg, Global Markets Research
Methodology, calculations and sources for SBAFRITR
Deriving the Eligible Securities included in SBAFRITR Index
Eligible securities are securities derived by applying investability criteria to individual companies and securities that are classified in that market (“Eligible Securities”). The investability screens used to determine the SBAFRITR Index constituents are:
Company’s Exposure to Africa
Minimum Market Capitalisation
Minimum Liquidity Levels
Company’s Exposure to Africa In order to be included as Eligible Securities, a company must have the required minimum exposure to operations in Africa. Exposure is determined as a percentage of the company’s revenue, income or assets attributable to operations in Africa (as per the latest Annual Report) to the total (in descending order of importance). Exposure should be in excess of 40%. Based on their exposures to Africa, the stocks are divided into two categories:
1. Exposure in excess of 85% is defined as “direct involvement in Africa”
2. Exposure in the range between 40% and 85% as “substantial involvement in Africa”
These criteria are applicable to the International shares only as the Local shares are assumed to be 100% exposed to Africa.
Minimum Market Capitalization Requirement
In order to be included as Eligible Securities, a company that satisfied the criteria of exposure to Africa must have the required minimum full market capitalization of $20m.
Minimum Liquidity Requirement The companies that meet the Minimum Market Capitalization Requirement are then evaluated against the Minimum Liquidity Requirement.
-15%
-10%
-5%
0%
5%
10%
15%
Apr-16 May-16 Jul-16 Aug-16 Sep-16 Nov-16 Dec-16 Jan-17 Mar-17 Apr-17
SBAFRITR JALSH
10
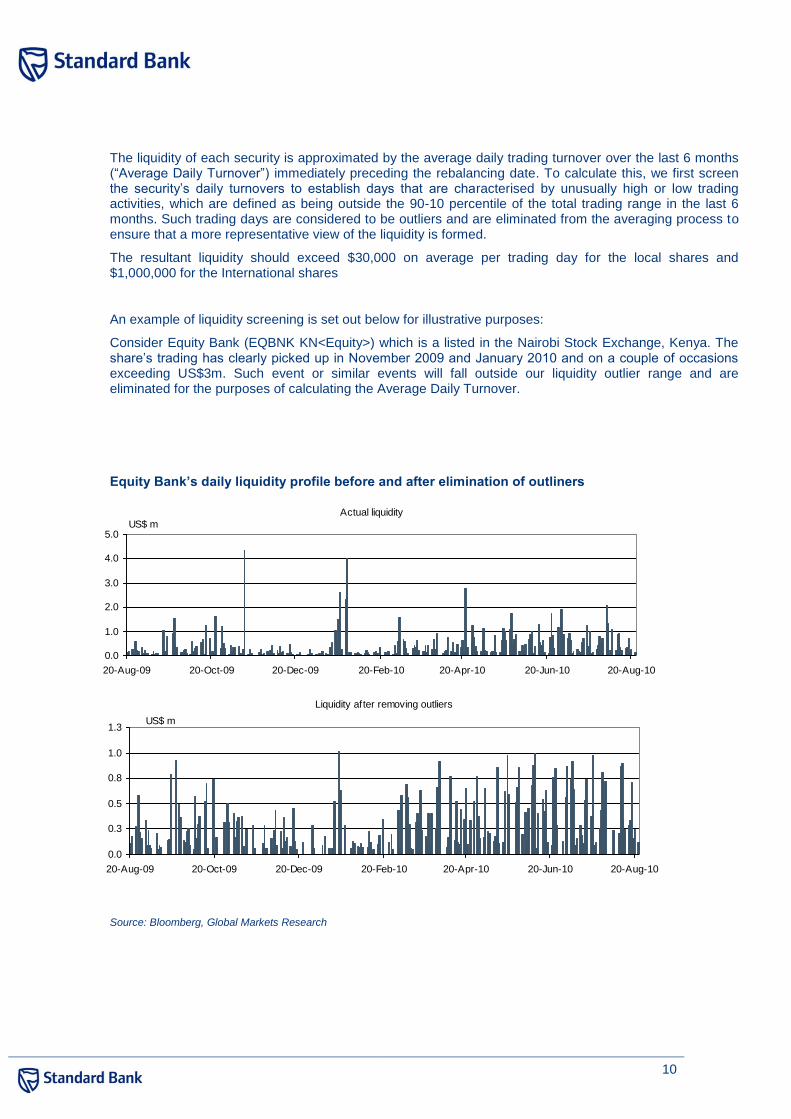
The liquidity of each security is approximated by the average daily trading turnover over the last 6 months (“Average Daily Turnover”) immediately preceding the rebalancing date. To calculate this, we first screen the security’s daily turnovers to establish days that are characterised by unusually high or low trading activities, which are defined as being outside the 90-10 percentile of the total trading range in the last 6 months. Such trading days are considered to be outliers and are eliminated from the averaging process to ensure that a more representative view of the liquidity is formed.
The resultant liquidity should exceed $30,000 on average per trading day for the local shares and $1,000,000 for the International shares
An example of liquidity screening is set out below for illustrative purposes:
Consider Equity Bank (EQBNK KN<Equity>) which is a listed in the Nairobi Stock Exchange, Kenya. The share’s trading has clearly picked up in November 2009 and January 2010 and on a couple of occasions exceeding US$3m. Such event or similar events will fall outside our liquidity outlier range and are eliminated for the purposes of calculating the Average Daily Turnover.
Equity Bank’s daily liquidity profile before and after elimination of outliners
Source: Bloomberg, Global Markets Research
Liquidity after removing outliers
0.0
0.3
0.5
0.8
1.0
1.3
20-Aug-09 20-Oct-09 20-Dec-09 20-Feb-10 20-Apr-10 20-Jun-10 20-Aug-10
US$ m
Actual liquidity
0.0
1.0
2.0
3.0
4.0
5.0
20-Aug-09 20-Oct-09 20-Dec-09 20-Feb-10 20-Apr-10 20-Jun-10 20-Aug-10
US$ m
11
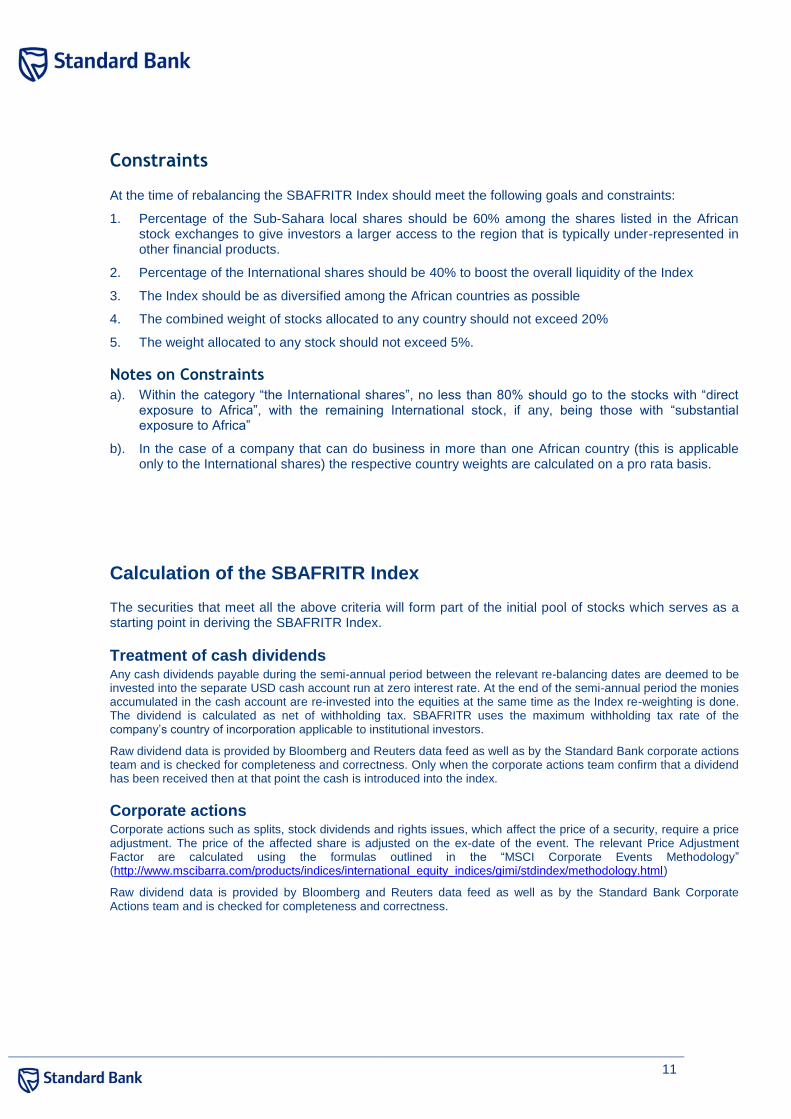
Constraints
At the time of rebalancing the SBAFRITR Index should meet the following goals and constraints:
1. Percentage of the Sub-Sahara local shares should be 60% among the shares listed in the African stock exchanges to give investors a larger access to the region that is typically under-represented in other financial products.
2. Percentage of the International shares should be 40% to boost the overall liquidity of the Index
3. The Index should be as diversified among the African countries as possible
4. The combined weight of stocks allocated to any country should not exceed 20%
5. The weight allocated to any stock should not exceed 5%.
Notes on Constraints
a). Within the category “the International shares”, no less than 80% should go to the stocks with “direct exposure to Africa”, with the remaining International stock, if any, being those with “substantial exposure to Africa”
b). In the case of a company that can do business in more than one African country (this is applicable only to the International shares) the respective country weights are calculated on a pro rata basis.
Calculation of the SBAFRITR Index
The securities that meet all the above criteria will form part of the initial pool of stocks which serves as a starting point in deriving the SBAFRITR Index.
Treatment of cash dividends Any cash dividends payable during the semi-annual period between the relevant re-balancing dates are deemed to be invested into the separate USD cash account run at zero interest rate. At the end of the semi-annual period the monies accumulated in the cash account are re-invested into the equities at the same time as the Index re-weighting is done. The dividend is calculated as net of withholding tax. SBAFRITR uses the maximum withholding tax rate of the company’s country of incorporation applicable to institutional investors.
Raw dividend data is provided by Bloomberg and Reuters data feed as well as by the Standard Bank corporate actions team and is checked for completeness and correctness. Only when the corporate actions team confirm that a dividend has been received then at that point the cash is introduced into the index.
Corporate actions Corporate actions such as splits, stock dividends and rights issues, which affect the price of a security, require a price adjustment. The price of the affected share is adjusted on the ex-date of the event. The relevant Price Adjustment Factor are calculated using the formulas outlined in the “MSCI Corporate Events Methodology” (http://www.mscibarra.com/products/indices/international_equity_indices/gimi/stdindex/methodology.html)
Raw dividend data is provided by Bloomberg and Reuters data feed as well as by the Standard Bank Corporate Actions team and is checked for completeness and correctness.
12
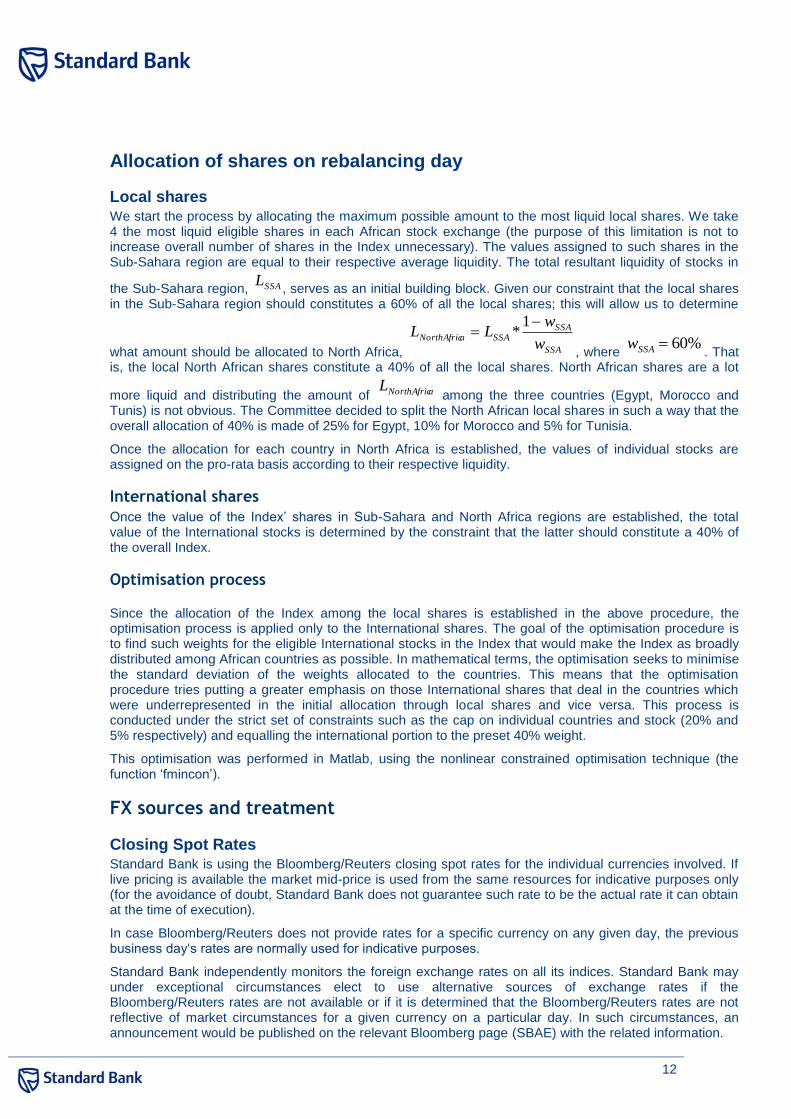
Allocation of shares on rebalancing day
Local shares We start the process by allocating the maximum possible amount to the most liquid local shares. We take 4 the most liquid eligible shares in each African stock exchange (the purpose of this limitation is not to increase overall number of shares in the Index unnecessary). The values assigned to such shares in the Sub-Sahara region are equal to their respective average liquidity. The total resultant liquidity of stocks in
the Sub-Sahara region, , serves as an initial building block. Given our constraint that the local shares in the Sub-Sahara region should constitutes a 60% of all the local shares; this will allow us to determine
what amount should be allocated to North Africa, , where %60SSAw
. That is, the local North African shares constitute a 40% of all the local shares. North African shares are a lot
more liquid and distributing the amount of aNorthAfricL among the three countries (Egypt, Morocco and
Tunis) is not obvious. The Committee decided to split the North African local shares in such a way that the overall allocation of 40% is made of 25% for Egypt, 10% for Morocco and 5% for Tunisia.
Once the allocation for each country in North Africa is established, the values of individual stocks are assigned on the pro-rata basis according to their respective liquidity.
International shares
Once the value of the Index’ shares in Sub-Sahara and North Africa regions are established, the total value of the International stocks is determined by the constraint that the latter should constitute a 40% of the overall Index.
Optimisation process
Since the allocation of the Index among the local shares is established in the above procedure, the optimisation process is applied only to the International shares. The goal of the optimisation procedure is to find such weights for the eligible International stocks in the Index that would make the Index as broadly distributed among African countries as possible. In mathematical terms, the optimisation seeks to minimise the standard deviation of the weights allocated to the countries. This means that the optimisation procedure tries putting a greater emphasis on those International shares that deal in the countries which were underrepresented in the initial allocation through local shares and vice versa. This process is conducted under the strict set of constraints such as the cap on individual countries and stock (20% and 5% respectively) and equalling the international portion to the preset 40% weight.
This optimisation was performed in Matlab, using the nonlinear constrained optimisation technique (the function ‘fmincon’).
FX sources and treatment
Closing Spot Rates Standard Bank is using the Bloomberg/Reuters closing spot rates for the individual currencies involved. If live pricing is available the market mid-price is used from the same resources for indicative purposes only (for the avoidance of doubt, Standard Bank does not guarantee such rate to be the actual rate it can obtain at the time of execution).
In case Bloomberg/Reuters does not provide rates for a specific currency on any given day, the previous business day‘s rates are normally used for indicative purposes.
Standard Bank independently monitors the foreign exchange rates on all its indices. Standard Bank may under exceptional circumstances elect to use alternative sources of exchange rates if the Bloomberg/Reuters rates are not available or if it is determined that the Bloomberg/Reuters rates are not reflective of market circumstances for a given currency on a particular day. In such circumstances, an announcement would be published on the relevant Bloomberg page (SBAE) with the related information.
SSAL
SSA
SSASSAaNorthAfric
w
wLL
1*
13
SBAFRITR Index maintenance
Index maintenance involves, amongst other things, conducting semi-annual reviews in the beginning of May and November of each year with the aim of determining the list of the most liquid securities and the inclusion of new Eligible Securities in the Index. During each review, new equity securities that are identified but were previously not available (i.e. new issuance or securities not meeting the investability screens on the previous review) may be evaluated for investability using the same investability screens.
These reviews are designed to ensure that the indices continue to be an accurate reflection of the evolving equity marketplace. This is achieved by a timely reflection of significant market driven changes that were not captured in the Index at the time of their actual occurrence but are significant enough to be reflected in the Index during a review (for example, new issuance or increased liquidity in respect of new or existing securities that results in such security satisfying the Minimum Market Capitalization and Minimum Liquidity Levels threshold). Only new investable companies which are regarded to be significant are considered for additions to the Index.
SBAFRITR Index calculation methodology
The Standard Bank Equity Indices measure the performance of a pool of equity securities over time. The SBAFRITR Indices are calculated using the idea of a weighted arithmetic average together with the concept of chain-linking. SBAFRITR Index is calculated in USD.
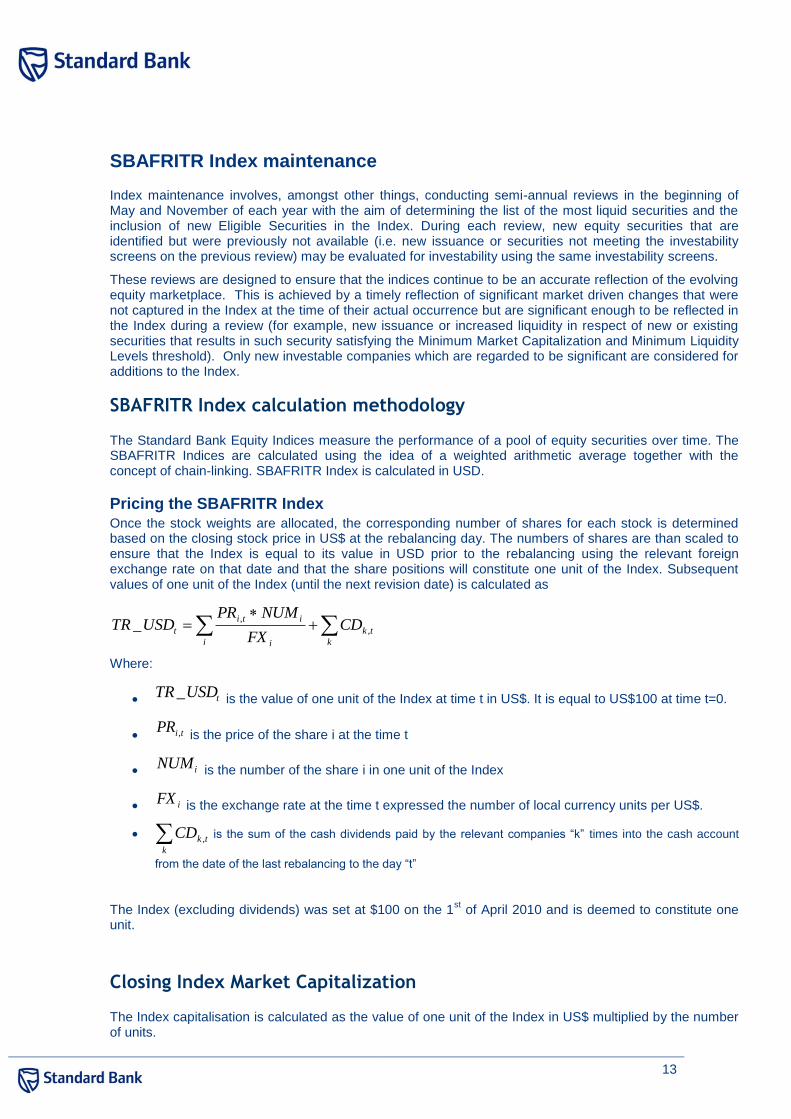
Pricing the SBAFRITR Index
Once the stock weights are allocated, the corresponding number of shares for each stock is determined based on the closing stock price in US$ at the rebalancing day. The numbers of shares are than scaled to ensure that the Index is equal to its value in USD prior to the rebalancing using the relevant foreign exchange rate on that date and that the share positions will constitute one unit of the Index. Subsequent values of one unit of the Index (until the next revision date) is calculated as
k
tk
i i
iti
t CDFX
NUMPRUSDTR ,
,_
Where:
tUSDTR _ is the value of one unit of the Index at time t in US$. It is equal to US$100 at time t=0.
tiPR , is the price of the share i at the time t
iNUM is the number of the share i in one unit of the Index
iFX is the exchange rate at the time t expressed the number of local currency units per US$.
k
tkCD , is the sum of the cash dividends paid by the relevant companies “k” times into the cash account
from the date of the last rebalancing to the day “t”
The Index (excluding dividends) was set at $100 on the 1st of April 2010 and is deemed to constitute one
unit.
Closing Index Market Capitalization
The Index capitalisation is calculated as the value of one unit of the Index in US$ multiplied by the number of units.
14
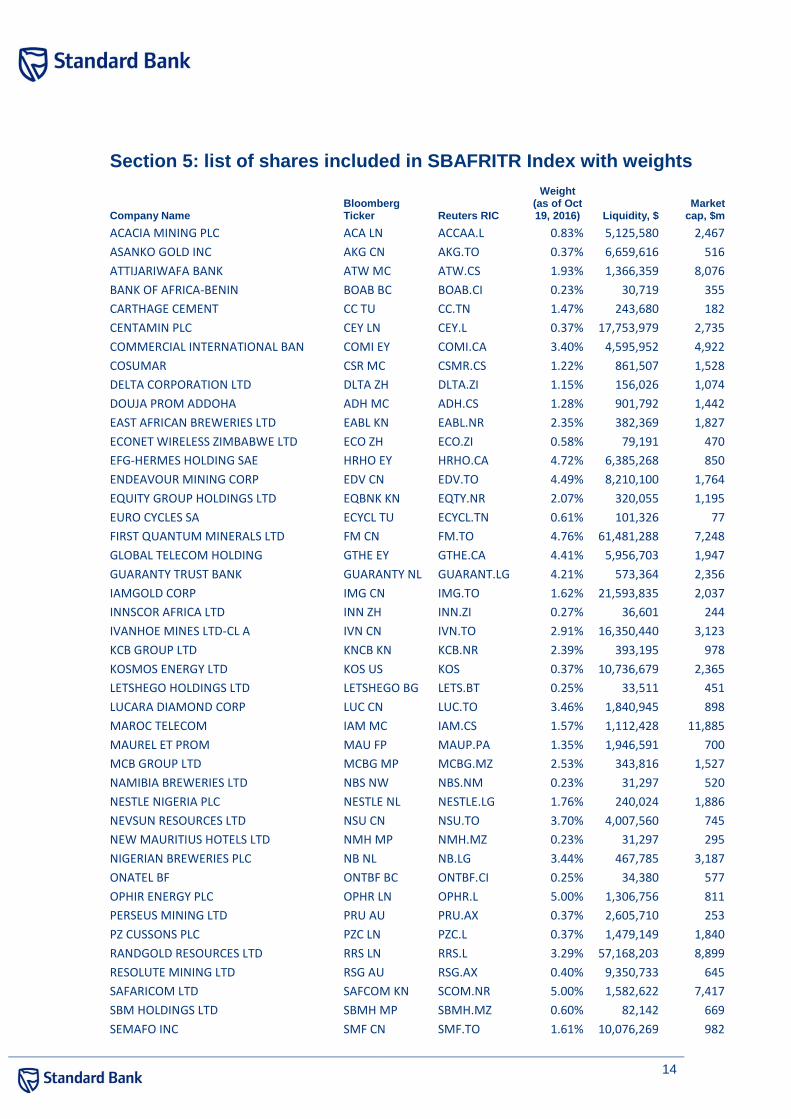
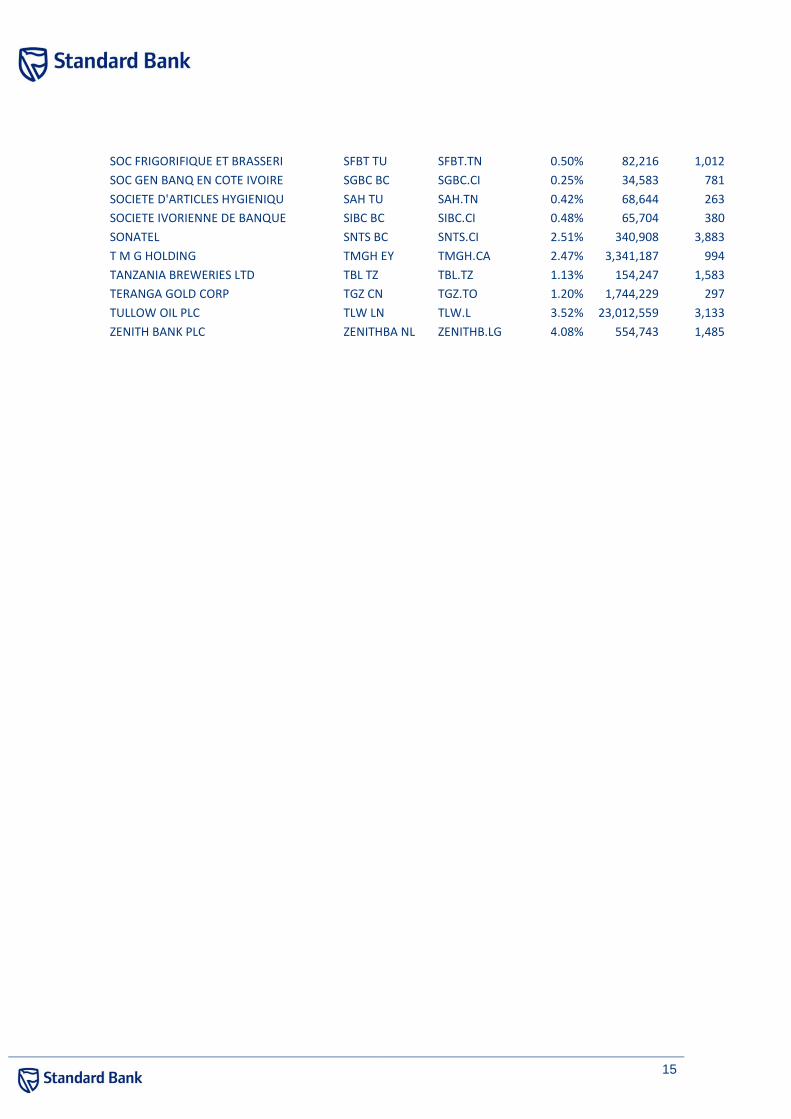
Section 5: list of shares included in SBAFRITR Index with weights
Company Name Bloomberg Ticker Reuters RIC
Weight (as of Oct 19, 2016) Liquidity, $
Market cap, $m
ACACIA MINING PLC ACA LN ACCAA.L 0.83% 5,125,580 2,467
ASANKO GOLD INC AKG CN AKG.TO 0.37% 6,659,616 516
ATTIJARIWAFA BANK ATW MC ATW.CS 1.93% 1,366,359 8,076
BANK OF AFRICA-BENIN BOAB BC BOAB.CI 0.23% 30,719 355
CARTHAGE CEMENT CC TU CC.TN 1.47% 243,680 182
CENTAMIN PLC CEY LN CEY.L 0.37% 17,753,979 2,735
COMMERCIAL INTERNATIONAL BAN COMI EY COMI.CA 3.40% 4,595,952 4,922
COSUMAR CSR MC CSMR.CS 1.22% 861,507 1,528
DELTA CORPORATION LTD DLTA ZH DLTA.ZI 1.15% 156,026 1,074
DOUJA PROM ADDOHA ADH MC ADH.CS 1.28% 901,792 1,442
EAST AFRICAN BREWERIES LTD EABL KN EABL.NR 2.35% 382,369 1,827
ECONET WIRELESS ZIMBABWE LTD ECO ZH ECO.ZI 0.58% 79,191 470
EFG-HERMES HOLDING SAE HRHO EY HRHO.CA 4.72% 6,385,268 850
ENDEAVOUR MINING CORP EDV CN EDV.TO 4.49% 8,210,100 1,764
EQUITY GROUP HOLDINGS LTD EQBNK KN EQTY.NR 2.07% 320,055 1,195
EURO CYCLES SA ECYCL TU ECYCL.TN 0.61% 101,326 77
FIRST QUANTUM MINERALS LTD FM CN FM.TO 4.76% 61,481,288 7,248
GLOBAL TELECOM HOLDING GTHE EY GTHE.CA 4.41% 5,956,703 1,947
GUARANTY TRUST BANK GUARANTY NL GUARANT.LG 4.21% 573,364 2,356
IAMGOLD CORP IMG CN IMG.TO 1.62% 21,593,835 2,037
INNSCOR AFRICA LTD INN ZH INN.ZI 0.27% 36,601 244
IVANHOE MINES LTD-CL A IVN CN IVN.TO 2.91% 16,350,440 3,123
KCB GROUP LTD KNCB KN KCB.NR 2.39% 393,195 978
KOSMOS ENERGY LTD KOS US KOS 0.37% 10,736,679 2,365
LETSHEGO HOLDINGS LTD LETSHEGO BG LETS.BT 0.25% 33,511 451
LUCARA DIAMOND CORP LUC CN LUC.TO 3.46% 1,840,945 898
MAROC TELECOM IAM MC IAM.CS 1.57% 1,112,428 11,885
MAUREL ET PROM MAU FP MAUP.PA 1.35% 1,946,591 700
MCB GROUP LTD MCBG MP MCBG.MZ 2.53% 343,816 1,527
NAMIBIA BREWERIES LTD NBS NW NBS.NM 0.23% 31,297 520
NESTLE NIGERIA PLC NESTLE NL NESTLE.LG 1.76% 240,024 1,886
NEVSUN RESOURCES LTD NSU CN NSU.TO 3.70% 4,007,560 745
NEW MAURITIUS HOTELS LTD NMH MP NMH.MZ 0.23% 31,297 295
NIGERIAN BREWERIES PLC NB NL NB.LG 3.44% 467,785 3,187
ONATEL BF ONTBF BC ONTBF.CI 0.25% 34,380 577
OPHIR ENERGY PLC OPHR LN OPHR.L 5.00% 1,306,756 811
PERSEUS MINING LTD PRU AU PRU.AX 0.37% 2,605,710 253
PZ CUSSONS PLC PZC LN PZC.L 0.37% 1,479,149 1,840
RANDGOLD RESOURCES LTD RRS LN RRS.L 3.29% 57,168,203 8,899
RESOLUTE MINING LTD RSG AU RSG.AX 0.40% 9,350,733 645
SAFARICOM LTD SAFCOM KN SCOM.NR 5.00% 1,582,622 7,417
SBM HOLDINGS LTD SBMH MP SBMH.MZ 0.60% 82,142 669
SEMAFO INC SMF CN SMF.TO 1.61% 10,076,269 982
15
SOC FRIGORIFIQUE ET BRASSERI SFBT TU SFBT.TN 0.50% 82,216 1,012
SOC GEN BANQ EN COTE IVOIRE SGBC BC SGBC.CI 0.25% 34,583 781
SOCIETE D'ARTICLES HYGIENIQU SAH TU SAH.TN 0.42% 68,644 263
SOCIETE IVORIENNE DE BANQUE SIBC BC SIBC.CI 0.48% 65,704 380
SONATEL SNTS BC SNTS.CI 2.51% 340,908 3,883
T M G HOLDING TMGH EY TMGH.CA 2.47% 3,341,187 994
TANZANIA BREWERIES LTD TBL TZ TBL.TZ 1.13% 154,247 1,583
TERANGA GOLD CORP TGZ CN TGZ.TO 1.20% 1,744,229 297
TULLOW OIL PLC TLW LN TLW.L 3.52% 23,012,559 3,133
ZENITH BANK PLC ZENITHBA NL ZENITHB.LG 4.08% 554,743 1,485
16
Disclaimer for SBAFRITR Index This document is provided on the express understanding that the information contained herein will be regarded and treated as strictly confidential. It is not to be delivered nor shall its contents be disclosed to anyone other than the entity to which it is being provided and its employees without the prior consent of the Standard Bank Plc (“SB Plc”). Moreover, it shall not be reproduced or used, in whole or in part, for any purpose other than for the consideration described herein, without the prior written consent of SB Plc.
The information contained in this presentation does not purport to be complete and is subject to change. This document does not constitute an offer, or the solicitation of an offer, for the sale or purchase of any investment or security. This is a commercial communication. If you are in any doubt about the contents of this document or the investment or security to which this document relates you should consult a person authorised under the Financial Services and Markets Act 2000 who specialises in advising on such investments or securities.
The information contained in this document may not be used to verify or correct other data, to create indices, risk models or analytics, or in connection with issuing, offering, sponsoring, managing or marketing any securities, portfolios, financial products or other investment vehicles based on, linked to, tracking or otherwise derived from any SB Plc’s product or data.
Historical data and analysis should not be taken as an indication or guarantee of any future performance, analysis, forecast or prediction.
This document relates to derivative products and you should not deal in such products unless you understand the nature and extent of your exposure to risk. African investments are subject to a high degree of risk, including those associated with less reliable financial information, higher costs, taxation, decreased liquidity, less stringent reporting, and foreign currency risks. Additional special risks particular to African investments include expropriation, political instability, economic impacts of armed conflict, civil war and severe social instability, less developed capital markets, lower market capitalization, lower trading volume, illiquidity, inflation, greater price fluctuations, uncertainty regarding the existence of trading markets, politically controlled access to trading markets, unsettled securities laws, and trade barriers. Investors should be willing to accept a high degree of volatility, times of decreased or no liquidity and the potential of significant loss. You further acknowledge that (i) due to the nature and composition of The Standard Bank SBAFRITR Index, you may be subject to greater concentration risk and systematic risk relating to the securities comprised in The Standard Bank SBAFRITR Index and (ii) the Sponsor may alter index methodology at is discretion in ways which may adversely affect the performance of The Standard Bank SBAFRITR Index.
SB Plc does not guarantee the accuracy, timeliness and/or the completeness of this document, SB Plc and its affiliates shall have no liability for any errors omissions, delays or interruptions in this document, The Standard Bank SBAFRITR Index or any data or estimate included therein, or for any reliance placed by any person on this document. SB PLC AND ITS AFFILIATES MAKE NO EXPRESS OR IMPLIED WARRANTIES, AND EXPRESSLY DISCLAIM ALL WARRANTIES OF ACCURACY, TIMELINESS, COMPLETENESS, NON-INFRINGEMENT MERCHANTABILITY AND FITNESS FOR A PARTICULAR PURPOSE OR USE WITH RESPECT TO THIS DOCUMENT, THE STANDARD BANK SBAFRITR INDEX OR ANY DATA OR ESTIMATE INCLUDED THEREIN. IN NO EVENT SHALL SB PLC OR ANY OF ITS AFFILIATES HAVE ANY LIABILITY FOR ANY DIRECT, INDIRECT, SPECIAL, PUNITIVE, OR CONSEQUENTIAL DAMAGES (INCLUDING LOST PROFITS), EVEN IF NOTIFIED OF THE POSSIBILITY OF SUCH DAMAGES WITH RESPECT TO THIS DOCUMENT, THE STANDARD BANK SBAFRITR INDEX AND ANY INFORMATION, DATA OR MATERIALS INCLUDED THEREIN.
Non-Reliance: You are acting for your own account, and will make your own independent decisions to enter into any transaction and as to whether that transaction is appropriate or proper for you based upon your own judgment and upon advice from such advisers as you deem necessary. You are not relying on any communication (written or oral) from SB Plc as investment advice or as a recommendation to enter into any transaction; it being understood that information and explanations related to the terms and conditions of a transaction shall not be considered investment advice or a recommendation to enter into that transaction. No communication (written or oral) received from SB Plc shall be deemed to be an assurance or guarantee as to the expected results of that transaction.
17
This presentation is not intended for the use of Retail Clients. This document must not be acted on or relied on by persons who are Retail Clients. Any investment or investment activity to which this document relates is only available to persons other than Retail Clients and will be engaged in only with such persons. SB Plc is authorised and regulated by the Financial Services Authority (“FSA”), entered in the FSA’s register (register number 124823) and has approved this document for distribution in the UK only to persons other than Retail Clients. Persons into whose possession this document comes are required by the SB Plc to inform them about and to observe any such restrictions. In the United States this communication is only approved for distribution to eligible contract participants as defined in the U.S. Commodity Exchange Act. You are to rely on your own independent appraisal of and investigations into all matters and things contemplated by this document.
Conflict of Interest: It is the policy of SB Plc to have robust controls and processes in place to manage conflicts of interest. However you should be aware that The SBAFRITR Index is managed by a team at SB Plc that includes personnel from sales and trading departments. Such sales and trading departments may trade, as principal, and hold long or short positions in some of the securities that make up The Standard Bank SBAFRITR Index. Therefore, the proprietary interests of those sales and trading departments may conflict with your interests. By accepting this document, you agree to be bound by the foregoing limitations.
The Standard Bank SBAFRITR Index is developed by and is the exclusive property of SB Plc and may not be replicated (in whole or in part) in any manner whatsoever without prior written permission of SB plc.
Any use of or access to products, services or information of SB Plc or its subsidiaries requires a license from SB Plc or its subsidiaries, as applicable. All SB Plc product names are properties of SB plc or its affiliate and SB plc or its affiliates will assert and strictly enforce all of its rights it has with respect to any trademarks, registered trademarks (or application of such trademark pending registration), or service marks, as the case may be, in the event of any unauthorised use of its product name(s). You further acknowledge that The Standard Bank SBAFRITR Index is not sponsored, endorsed, sold or promoted by any exchange or authority.
For full details of The SBAFRITR Index please refer to Bloomberg page SBAE. Kindly note that this presentation does not represent an offer of funding since any facility to be granted in terms of this presentation would be subject to Standard Bank Plc obtaining the requisite internal and external approvals. You acknowledge and agree that all copyright, database rights and other proprietary rights in the information available on this
site shall remain the property of SB Plc; The SBAFRITR Index is a trade mark of SB Plc. Standard Bank Plc, 20 Gresham Street, London EC2V 7JE Value Added Tax identification number 625861525.