STAKEHOLDERS’ PERCEPTIONS OF CLIMATE CHANGE AND …
44
STAKEHOLDERS’ PERCEPTIONS OF CLIMATE CHANGE AND ATTITUDES TOWARD RECOMMENDED GREENHOUSE GAS REDUCTION STRATEGIES IN CHATHAM COUNTY Grace Buie, Jack Cordes, Alex Crawford, Laura Diez, Emily Drake, Gunnar Nagle, Claire Nelson, and Francesca Peay In fulfillment of the requirements of ENEC 698 Course Instructor: Dr. Lama BouFajreldin University of North Carolina at Chapel Hill May 2017
Transcript of STAKEHOLDERS’ PERCEPTIONS OF CLIMATE CHANGE AND …

STAKEHOLDERS’ PERCEPTIONS OF CLIMATE CHANGE AND ATTITUDES TOWARD RECOMMENDED GREENHOUSE GAS REDUCTION
STRATEGIES IN CHATHAM COUNTY
Grace Buie, Jack Cordes, Alex Crawford, Laura Diez, Emily Drake, Gunnar Nagle, Claire Nelson, and Francesca Peay
In fulfillment of the requirements of ENEC 698 Course Instructor: Dr. Lama BouFajreldin
University of North Carolina at Chapel Hill
May 2017
i
TABLE OF CONTENTS
List of Tables .....................................................................................................................................ii List of Figures ....................................................................................................................................iii Executive Summary ...........................................................................................................................iv Introduction ........................................................................................................................................1 Literature Review ...............................................................................................................................3 Methods..............................................................................................................................................11 Results ................................................................................................................................................22 Conclusions and Recommendations ..................................................................................................31 References ..........................................................................................................................................35
ii
LIST OF TABLES
Table 1. Weighted Sample Distribution of Local Residents in Incorporated and Unincorporated
Areas of Chatham County ....................................................................................................19 Table 2. Distribution of Interviews by Stakeholder Group ................................................................20 Table 3. Attitudes of Participants of Chatham County’s Local Governments toward
Recommended GHG Reduction Strategies ..........................................................................23 Table 4. Attitudes of Participants of Chatham County’s Transportation Sector toward
Recommended GHG Reduction Strategies .........................................................................27 Table 5. Attitudes of Participants of Chatham County’s Livestock Farmers toward
Recommended GHG Reduction Strategies ..........................................................................29

iii
LIST OF FIGURES
Figure 1. Population Distribution in Chatham County ......................................................................12 Figure 2. Chatham County Population Pyramid ................................................................................13 Figure 3. Percent of Population over 65 Years ..................................................................................13 Figure 4. Ethnicity in Chatham County .............................................................................................14 Figure 5. Geographic Distribution of the Hispanic Population in Chatham County .........................14 Figure 6. Geographic Distribution of the Black Population in Chatham County ..............................15 Figure 7. Geographic Distribution of the White Population in Chatham County .............................15 Figure 8: 2010 and 2015 Greenhouse Gas Emissions from Chatham County’s Residential, Commercial, Industrial, Transportation, and Agricultural Sectors ....................................................17

iv
EXECUTIVE SUMMARY
In the Fall of 2016, a greenhouse gas emissions inventory for Chatham County was
developed by Joca and Kolosna (2016) from the Department of City and Regional Planning at
the University of North Carolina at Chapel Hill. This inventory looked at emissions from five
major sectors: county residents, local government, industry and commercial, agriculture, and
transportation. This inventory will be used by the Climate Change Advisory Board of Chatham
County along a series of climate change mitigation strategies recommended by the committee to
reduce greenhouse gas emissions in the county.
This study was conducted to try to gauge responses to the recommended climate change
mitigation strategies, and to explore perceptions of participants representing the five stakeholder
groups in relation to climate change. Semi-structured phone interviews were conducted with 11
participants representing these stakeholder groups. Results revealed that stakeholders’ definitions
of climate change varied considerably, from a global process affected by human
activities/emissions to an occurrence in nature that affects global temperatures. Some of the
participants believed that climate change had an effect on the global scale, but some were
unaware of climate change impacts on Chatham County or to what degree Chatham County was
contributing to climate change in terms of its greenhouse emissions.
As for attitudes toward recommended climate change mitigation strategies, this study
revealed common concerns among representatives of the county’s local governments regarding
these strategies. These concerns included that local governments do not have enough power to be
able to effectively implement carbon emission reduction strategies, and that the financial costs
and the time of implementation of the strategies were not worth their benefits, as climate change
was not thought to be an imminent threat to local municipalities in Chatham County. For the
v
participants representing the agricultural sector, the recommendations were generally found to be
vague, misleading, and irrelevant to current standard operating practices. For the participants
representing the transportation sector, density disparity was cited as a common reason against
implementing greenhouse gas emission reduction strategies as it would not be effective in areas
where the population is extremely spread out.
Findings from this study reflect the need to form recommendations with the input of the
relevant stakeholders. Our compiled interviews showed that stakeholder’s primary concerns were
cost and time efficiency. Stakeholders were much more responsive to recommendations that
decreased their cost and time of operation. Stakeholders also expressed a desire to have proof
that the recommendations are net carbon negative before they were willing to implement them.
Lastly, stakeholders felt that the recommendations needed to be more specific in terms of who
specifically needs to implement the strategies, more specific actions to take and what
enforcement mechanisms would be in place. In addition to those concerns, many of the
recommendations were already in place or were impossible to put in place due to legal
constrictions or impracticality. The relevant stakeholders’ opinions need to be considered in
order to form practical, feasible, and realistic recommendations.

1
INTRODUCTION
In the Fall of 2016, an inventory of greenhouse gas emissions for Chatham County was
developed by Joca and Kolosna (2016) from the Department of City and Regional Planning at
the University of North Carolina at Chapel Hill. This inventory looked at emissions from five
major sectors: Chatham County residents, local governments, industry and commercial,
agriculture, and transportation. This inventory will be used by the Climate Change Advisory
Board of Chatham County along a series of climate change mitigation strategies recommended
by the committee to reduce greenhouse gas emissions in the county.
Effective planning and implementation of climate change mitigation and adaptation
strategies, however, necessitates engaging a range of stakeholders; i.e. “people or groups who
influence or are influenced” (Carney et al., 2009, p. 4) by these strategies. Stakeholder
engagement is thought to: (a) “help maintain the policy relevance of the research, (b) to provide
legitimacy to the information gathered for the research, (c) give credibility to the research, and
(d) directly help inform policy” (Carney et al., 2009, p. 6). Within the context of climate change
mitigation, effective stakeholder engagement would be attained by acknowledging stakeholders’
attitudes toward climate change mitigation strategies and socio-cognitive factors that shape
people’s behaviors and ability to adapt to climate change (Grothmann & Patt, 2005).
This study is a stakeholder engagement exercise that made use of the “containment” or
“managerial” stakeholder engagement approach; in which stakeholder opinions were sought on
predefined strategies in a consultative manner (Few et al., 2007, p. 53). Specifically, this study
explored perceptions of climate change and attitudes towards recommended climate change
mitigation strategies among five Chatham County stakeholder groups; namely, the county
residents, local governments, industrial and commercial sector, agriculture sector, and

2
transportation sector. Hence, the objectives of this study were to explore:
1. stakeholder’s perceptions of climate change
2. stakeholder’s attitudes toward recommended GHG emissions reduction strategies
3. stakeholders’ perceived benefits and constraints for implementing these mitigation
strategies
While the “containment” or “managerial” method has been criticized for an issue such as climate
change in which it is not a high priority for stakeholders (Lorenzoni et al., 2007), it may be
beneficial to provide stakeholders with a set of options when few would be willing to actively
create strategies for a problem that seems so removed in time and space (Few et al., 2007).
The results of this study are anticipated to provide insights about the nature and quality of
the recommended strategies. Such information would guide the development of education and
outreach activities that would enhance stakeholder participation in the adoption of strategies that
would optimally reduce greenhouse gas emission in Chatham County.

3
LITERATURE REVIEW
Perceptions of Climate Change
Stakeholders hold varied perceptions, or understandings, of climate change existence,
causes, mitigation, and preparedness (Carney et. al, 2009). Our examination of the literature
revealed that such variations exist within and across stakeholder groups and are associated with
factors that cut across or are specific to these stakeholder groups. Explanation of perceptions of
climate change and their variations across and within the general public, and the agricultural,
commercial and industrial, and transportation sectors is presented below.
General Public
Hamilton and Keim (2009) showed that perceptions of climate change vary from region
to region. This variation is associated with regional variations in weather patterns. For example,
people in snow-prone areas, such as New Hampshire, that recently experienced less-snowy
winters have the highest level of concern about climate change, compared to other states such as
Alabama, Colorado, and Kentucky. There can be a wide disparity between what people in one
region believe versus what others in different regions believe based on what they are exposed to.
In addition to weather patterns, a large part of the inconsistencies in concerns about climate
change is due to the way climate change is framed. For many, climate change is labeled as a
“green” or “global” issue, which distances the problem from their perceived sphere of influence
(Hamilton & Keim, 2009).
Agriculture
Through the American Midwest Farmers survey, Arbuckle et al. (2013) showed that

4
climate change is believed to exist by 66% of farmers. These farmers perceived climate change
to be caused by human and natural causes equally (33%), natural causes mostly (25%), or
anthropogenic causes mostly (8%). The rest of the surveyed farmers were either uncertain about
the existence of climate change (31%) or did not even believe in the existence of climate change
(3.5%). The study also found that those who believed climate change is occurring were more
likely to attribute it to human actions and were more receptive to enacting mitigation. Farmers
who were unsure if climate change exists or completely rejected it were not as accepting of
climate change mitigation. Arbuckle et. al. (2015) suggested that farmers are more willing to
change farming practices to adapt to the negative consequences of climate change than to change
practices in order to mitigate their contributions to climate change. Arbuckle el al. (2015) also
showed that farmers who believe climate change is primarily caused by humans are more likely
to support policy that encourages farms to reduce their greenhouse gas emissions.
Variations in perceptions of climate change risks are associated with gender, political
orientation, and beliefs about climate change (Safi et al., 2012). Females are more likely to
perceive climate change risks, as are liberals and those who believe in climate change. Also,
sensitivity, which is “a measure of the extent to which a system can be harmed or benefit from a
given hazard”, and adaptivity, which is “a measure of the capacity of a system to respond to a
given environmental hazard through mitigation, coping, survival, adjustment, or adaptation”,
also have an impact, with more adaptive groups being less perceptive and more sensitive groups
being more perceptive of climate change risks (Safi et al., 2012, p. 1042).
Commercial and Industrial Sector
In the commercial industry sector, there is a consensus within the working class of
companies on the existence of climate change. However, among the upper executives of the
5
companies, climate change acceptance has been slow (Ford et al., 2009). For many companies,
this is because the effects of climate change do not directly affect them, and so accepting climate
change means accepting new regulations, which would most likely cost the company money. For
other, more proactive companies, such as those in the mining sector, climate change is perceived
to directly affect their business and will likely cost them money due to the consequences of the
effects, and so it is cheaper to enact mitigation strategies now, instead of later when lots of
damage has been done (Herweijer et al., 2009). This is why in these companies, workers and
executives alike have been much more open to learning about climate change and climate change
mitigation strategies.
Zuo et al. (2012) found that the building industry is not very concerned with climate
change unless their customers are concerned with climate change. This industry acknowledges
climate change; however, it does not feel obligated to help mitigate the effects unless there is a
demand for that. Although the construction industry will not proactively mitigate climate change
effects, it has ideas about how climate change could be mitigated. They recognize that cost and
time are major barriers for them; however, with regulations and customer demand of climate
change mitigation, they could potentially make a significant change (Morton et al., 2011). The
only instance in which they would make contribute to emissions mitigation, is if regulations were
put on new construction projects and they were forced to address climate change, or if their
customers requested to have carbon neutral buildings because they were concerned about it (Zuo
et al., 2012).
Ford et al. (2009) stated that the mining industry faces severe, expensive consequences
due to climate change if nothing is done to mitigate them. This industry’s perceptions of the
worth of climate change mitigation strategies is tied to how much money they will have to pay in

6
damages to infrastructure. It perceives that climate change is a dangerous and immediate threat
(Ford et al., 2009). If they did not face these severe consequences, then they would most likely
not be so inclined to accept climate change as something that needs to be addressed (and as
something that would most likely cost them money). The private insurance industry has also
been very accepting of climate change and very aggressive about climate change mitigation. The
private insurance industry is on the forefront of mitigating the effects of climate change because
it costs them billions of dollars to clean up messes made by climate change, like increased
hurricanes, rising sea levels, and weakened infrastructure (Herweijer et al., 2009).
Transportation
Collantes et. al. (2010) showed that the transportation sector is more likely to decrease
greenhouse emissions with an increase in cost of operations (increases in fuel price etc.), and not
with a decrease in the cost of greenhouse emission reduction practices as a result of incentives,
such as tax subsidies for hybrids, etc. Fürst and Oberhofer (2012) found that companies with a
more positive attitude toward sustainability are more likely to use sustainable transportation, and
among companies with similar views toward transportation, those with more resources available
are more likely to use sustainable transportation. While this study has its limitations for our
purposes, because it discusses transportation used by companies, and not the transportation
sector itself, it is important to acknowledge the connection between attitudes toward climate
change and willingness to adopt climate change strategies.
Attitudes and Barriers toward Climate Change Mitigation and Adaptation
Attitudes are defined “as the enduring positive or negative feeling about some person,
object, or issue” (Kollmuss & Agyeman, 2002, p. 252). A variety of factors could impact
7
attitudes and hinder engagement in climate change mitigation. Gardener (2009) stated that
attitudes toward climate change mitigation could be impacted by people’s negative reaction to
“top-down” changes. If people in a community feel that their local government is acting as an
agent to control their lifestyles without ostensible engagement on a community level, and it is
neglecting to balance governmental decisions with how activated the average citizen is, it will
produce changes that get overturned by the stronger force of retaliation (Gardener, 2009).
Kollmuss and Agyeman (2002) stated that positive attitudes, however, may not always
predict engagement in pro-environmental behavior; and increased economic cost, time, and
effort may hinder the adoption of such behaviors, despite elevated environmental awareness
(Kollmuss & Agyeman, 2002; citing Diekmann & Preisendoerfer,1992). Further illustrations of
these barriers are presented below.
Economic cost
Hoffman (2005) found that businesses’ voluntary reduction of their greenhouse gas
emissions is believed to be motivated by economic favorability and preparation for mandatory
future regulations on greenhouse gas limitations. Industries are looking at climate change as a
necessary acknowledgement for their businesses to be successful in the future, so “companies
that are adept at: (a) reducing their GHG emissions by altering products or processes, (b) trading
in emission credits so as to capitalize on this new commodity market, or (c) developing and
marketing new management skills or technologies that produce less greenhouse gases will find
advantage in the emerging climate change market transition” (Hoffman, 2005, p. 5). Ultimately,
Hoffman (2005) found that operational cost reductions must be justifiable by a business’
perception of either future legal issues with current practices, or the possibility of that company
moving into another new sector, such as renewable energy, by expanding their practices.
8
Time and Effort
Most groups see long-term planning as a very risky notion, and it is easy to see why. For
instance, in the Northern Ireland Environmental Link’s survey (2015), they found that no
sector—aside from infrastructure—said a need for climate change planning beyond a timescale
of twenty years was necessary. This paints a picture of deep-seated doubt, somewhat
understandably, but it is equally clear that the degree of change needed to adequately prepare for
even conservative outcomes of climate change over the next few decades is massive (Climate
Northern Island, 2015). In addition, even though infrastructure showed greater interest in long-
term planning, they too need greater justification before investment, which could have impact on
stakeholders’ perceptions of recommendations requiring in-depth infrastructure changes. Not
only do sources obviously need to be rigorous and scientific, but there also needs to be a strong
consensus across sources before plans are even drafted (Gardener, 2009).
Other Barriers
Several factors—other than economic cost, time and effort—were also shown to impact
engagement in climate change mitigation. Lorenzoni et al. (2007) found a set of individual and
social barriers to public’s engagement in climate change mitigation, despite awareness of climate
change. Individual barriers include “lack of knowledge, skepticism, distrust of information
sources, externalizing responsibility, climate change as a distant threat, priority of other
problems, reluctance to change lifestyles, fatalism, and “drop in the ocean” feeling” (Lorenzoni
et al., 2007, p. 449). On the other hand, social barriers include “lack of action by government,
business and industry, worry about ‘free-rider effect’, pressure of social norms and expectations,
and lack of enabling initiatives” (Lorenzoni et al, 2007, p. 449). Also, Betsill (2001) stated that
while the general public may believe in climate change, they may still not engage in climate

9
change mitigation if they do not see climate change as a local issue. Betsill (2001) suggested that
climate change must be framed as a local issue before it can be taken seriously and that linking
issues that are already in local agendas—such as air quality—to greenhouse gas emissions could
help.
Overcoming Barriers to Climate Change Mitigation
One way to overcome these barriers is to develop emission mitigation strategies that fit
communities’ needs. An inventory, and following report done in 2015, in Santa Barbara,
California reported that recommendations for greenhouse gas reductions were most effective
when suggestions were attractive responses to the needs and preferences of the population being
affected (Brotman et. al, 2015). The sectors individually investigated included: residential energy
use; commercial energy use; on-road transportation; oil and gas flares; organic waste; and
agriculture engines. Strategies the team used included retrofitting solar panels to residential and
commercial vehicles, encouraging carpooling, and providing discounts on greenhouse gas
reduction options. The recommendations were tailored to the culture of the county. For example,
the report noted that many community members already drive electric vehicles, so they were
looking to increase awareness of federal tax breaks to those community members not yet driving
electric vehicles. This report’s findings and conclusions emphasized the importance of
understanding the study site, because recommendations must be reasonable for those
stakeholders being affected.
However, tailoring recommendations to communities may not be enough to encourage
changes in behavior. Knowledge of climate change also helps enhance the rate at which
adaptation to climate change occurs. According to Fosu-Mensah, Vlek, and MacCarthy (2012),
the effect that climate change will have will depend drastically on how well-informed the people
10
are and, by extension, what adaptations and strategies they take to the new climate. On the other
hand, in this study, less than half of the farming community took steps to adapt to the changing
climate despite over 90 percent recognizing the changing climate because of various barriers that
prevented them from mitigation strategies, the most commonly cited being a lack of funds (Fosu-
Mensah et al., 2012). This suggests that factors like improved education increase the likelihood
of successful uptake in more eco-friendly policies. Other major factors that affect the degree to
which farmers take up adaptation strategies are farm size, how long they have had their farms,
education, access to market, and credit availability (Fusu-Mensah et al., 2012). If a farm has been
established by the same farmer or family for a longer time, they are more likely to be willing to
change their strategies (Fosu-Mensah et al., 2012).
Research Question
This review of the literature revealed that stakeholders’ perceptions of climate change
and attitudes toward climate change mitigation strategies are significant parameters that ought to
be accounted for the proper development and implementation of climate change mitigation
strategies. As such, this study aimed to explore Chatham County stakeholders’ perceptions of
climate change and attitudes toward recommended mitigation strategies, Hence, the research
question of this study was:
What are stakeholders’ perceptions of climate change and their attitudes towards recommended
GHG reduction strategies in Chatham County?
11
METHODS
Study Site
Chatham County: Geographical Location and Governance
Chatham County is located in central North Carolina. It consists of just over 700 square
miles of land between NC’s Triangle and Piedmont areas. Founded in 1771, the mostly rural
county has four incorporated towns and multiple unincorporated communities such as Moncure
and Gulf (Chatham County North Carolina, no date - a). Unincorporated communities are
located outside of municipalities without a designation as a city or town (NC League of
Municipalities, no date). Incorporated towns have local municipalities such as the four main
towns of Pittsboro, which is the county seat for Chatham County, Siler City, Goldston, and Cary.
The county is governed by an elected 5-member Board of Commissioners which have
general authority over county policies, while more specialized boards govern policies in general
and specific areas such as health, social services, and soil and water conservation. The Board of
Commissioners reside in a specific district and oversee daily county business such as appointing
the county attorney and county manager but most county programs, services, and infrastructure
are maintained by state or federal government (Chatham County North Carolina, no date - b).
Chatham County: Sociodemographic Characteristics
The total population of Chatham County is 72,243; with a predominantly rural population
(60.5% of total population), while only 39.5% live in urban areas (US Census Bureau, 2015).
The population is particularly concentrated around the four incorporated areas of Chatham
County: Siler City, Pittsboro, Cary, and Goldston. Population concentration also appears around
some unincorporated parts of the county, namely in Rural Chapel Hill, Governor’s Village,
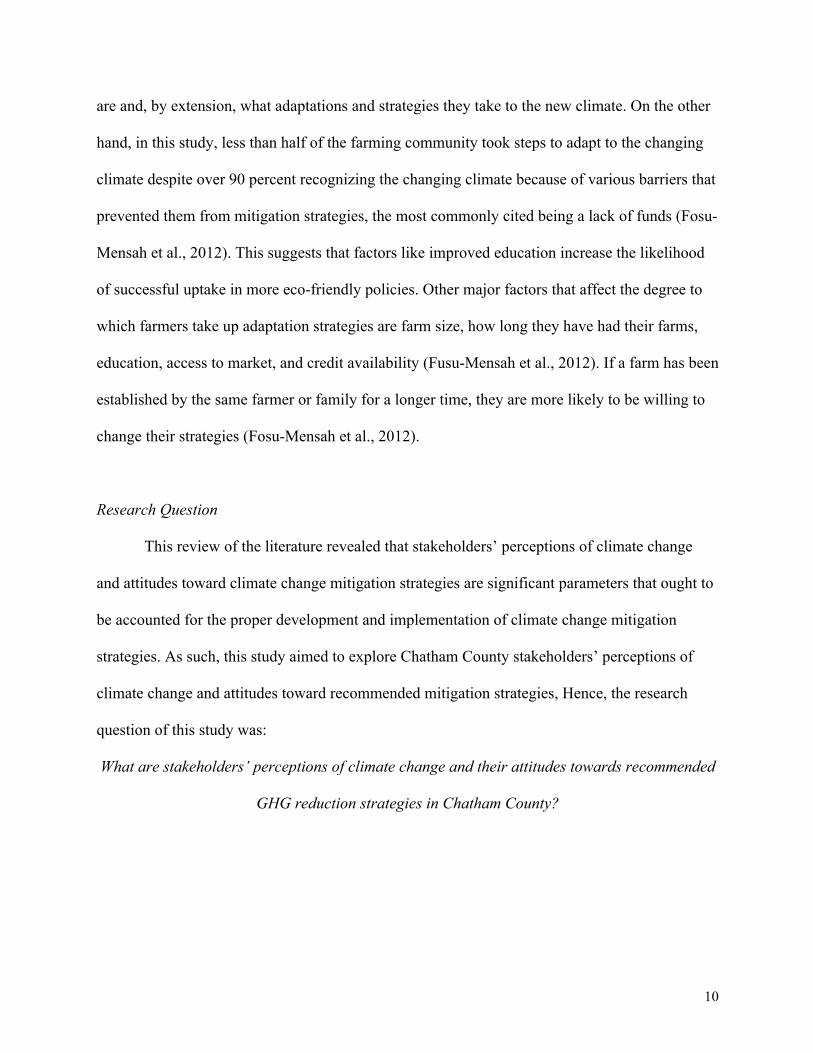
Fearrington Village, and Moncure (Figure1).
12
Figure 1. Population Distribution in Chatham County
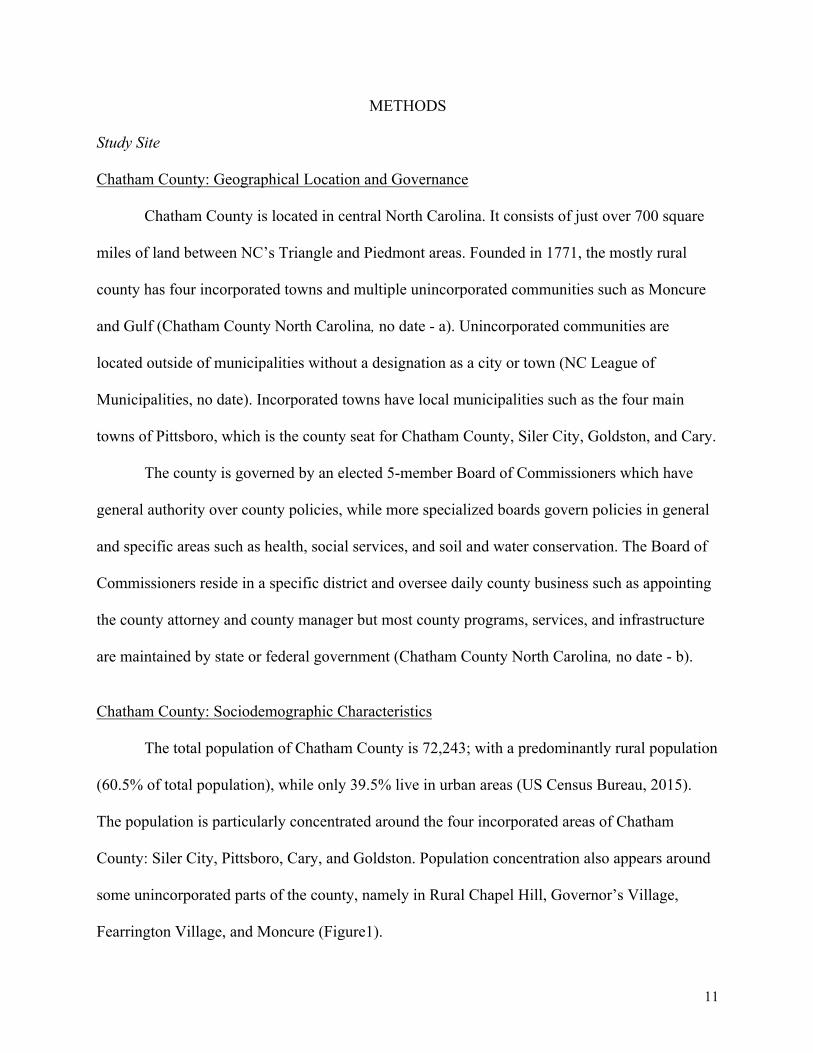
Chatham is an aging county. As of 2015, only 4.6% of the population was under the age
of five, while only 19.9% was under the age of 18. Meanwhile, 25% of the population was over
the age of 65, according to the US Census Bureau (2015) (Figure 2). The more densely populated
areas tend to have higher portions of people over 65 (Figure 3). There is an especially high
concentration of citizens over 65 in Fearrington Village due to retirement homes and assisted
living facilities. Perhaps due to the aging population and the longer lifespan of females, as of
2015, Chatham County was 52.1% female (US Census Bureau, 2015).
13
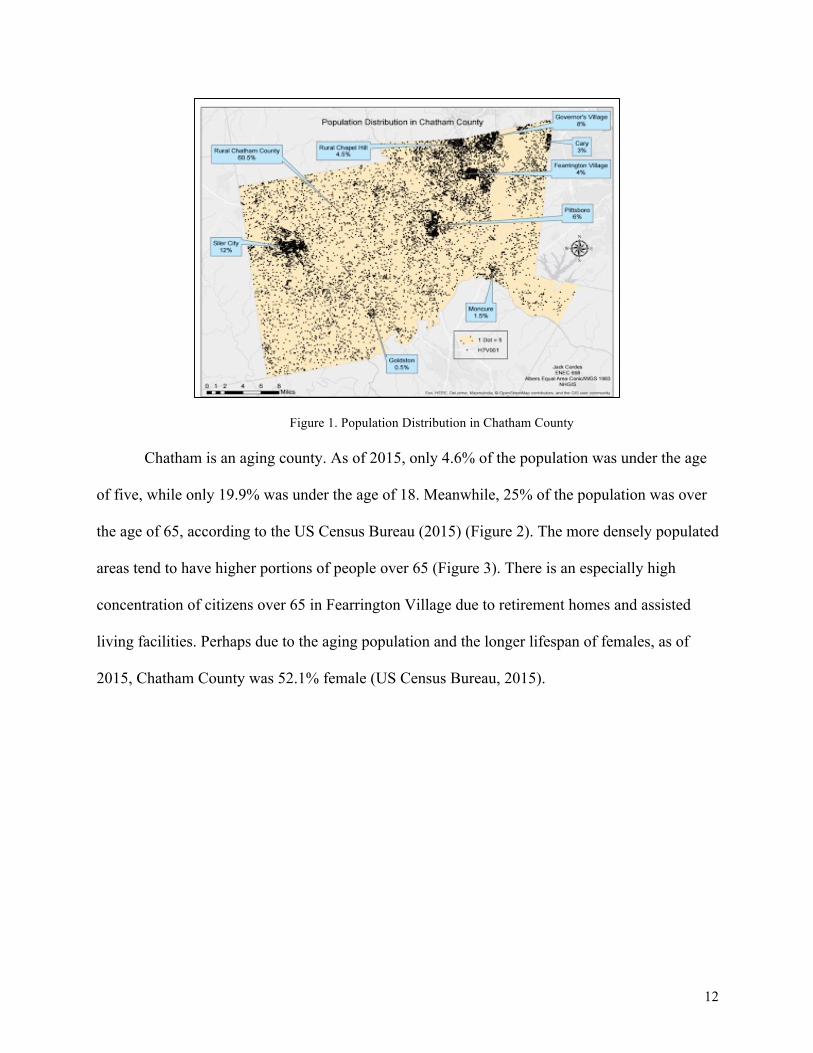
Figure 2. Chatham County Population Pyramid Figure 3. Percent of Population Over 65 Years
The household income of Chatham County is $56,642 per year, slightly higher than the
national average of $56,515 per year. Approximately 12% of the population is below the poverty
line, slightly below the national average of 13.5%. The percentage of the population above 25
with at least a high school education is at 86.5%, similar to the national average of 86.7%. Also,
36.8% percent of citizens have a bachelor’s degree or higher, which is higher than the national
average of 29.8% (US Census Bureau, 2015).
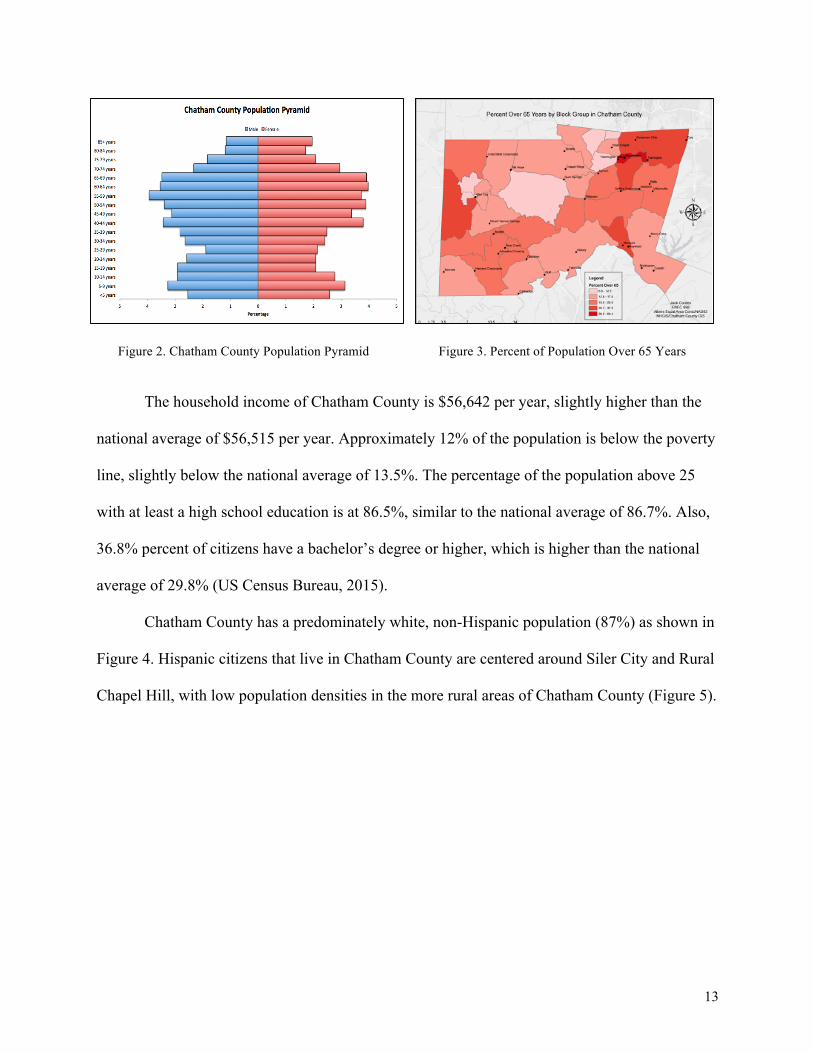
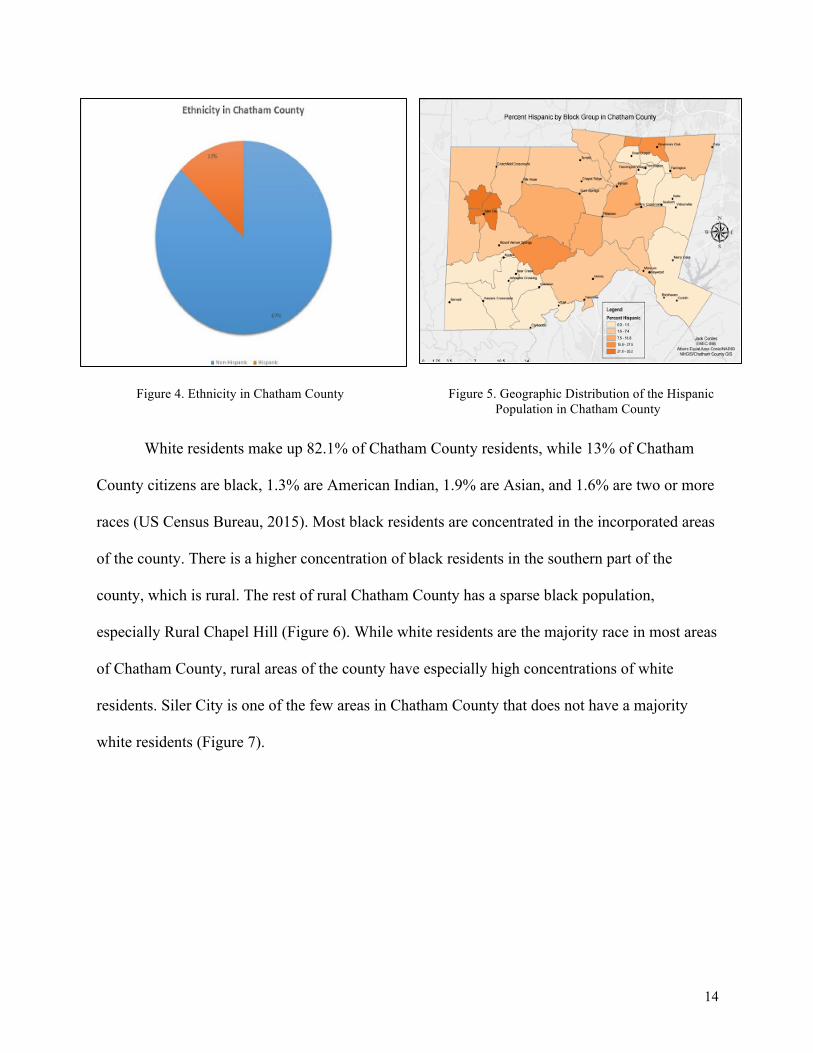
Chatham County has a predominately white, non-Hispanic population (87%) as shown in
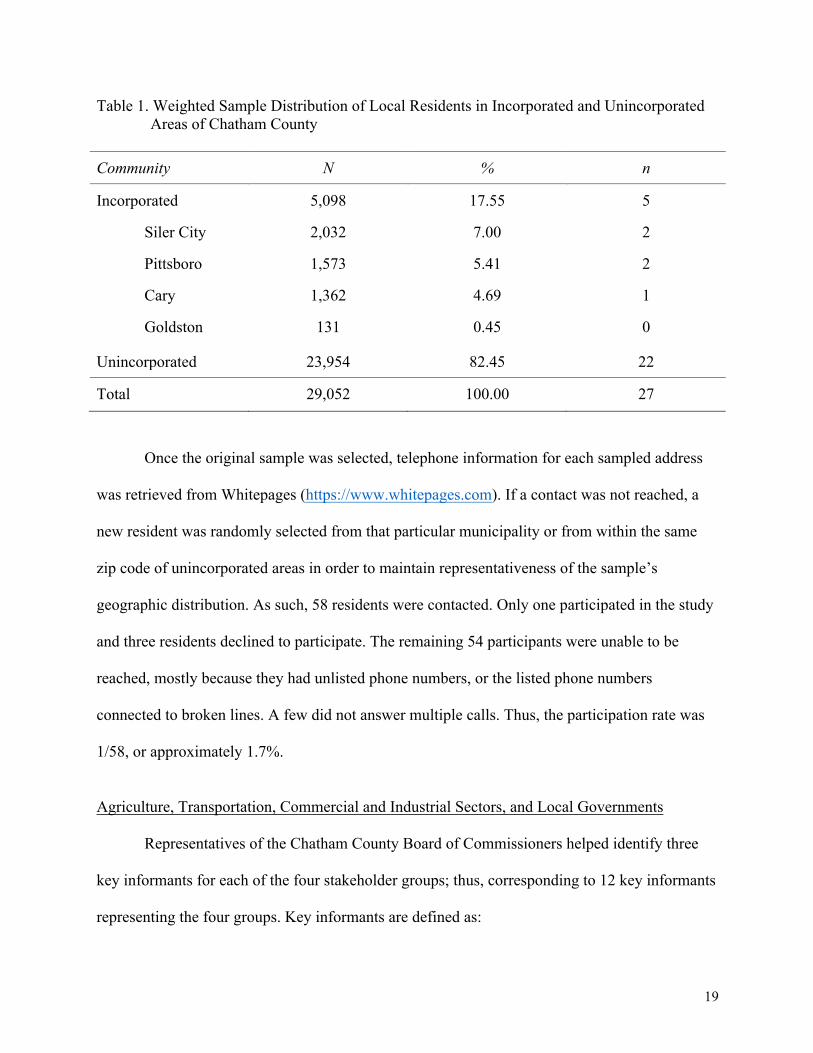
Figure 4. Hispanic citizens that live in Chatham County are centered around Siler City and Rural
Chapel Hill, with low population densities in the more rural areas of Chatham County (Figure 5).
14
Figure 4. Ethnicity in Chatham County Figure 5. Geographic Distribution of the Hispanic Population in Chatham County
White residents make up 82.1% of Chatham County residents, while 13% of Chatham
County citizens are black, 1.3% are American Indian, 1.9% are Asian, and 1.6% are two or more
races (US Census Bureau, 2015). Most black residents are concentrated in the incorporated areas
of the county. There is a higher concentration of black residents in the southern part of the
county, which is rural. The rest of rural Chatham County has a sparse black population,
especially Rural Chapel Hill (Figure 6). While white residents are the majority race in most areas
of Chatham County, rural areas of the county have especially high concentrations of white
residents. Siler City is one of the few areas in Chatham County that does not have a majority
white residents (Figure 7).

15
Figure 6. Geographic Distribution of the Black Population in Chatham County
Figure 7. Geographic Distribution of the White Population in Chatham County
Chatham County: Economic Profile
As of January 2017, the unemployment rate in Chatham County was 4% and in 2014,
14.4% of the population had incomes below the poverty level. Out of those employed, 43.2%
work within Chatham County, while 54.7% work outside the county and still live within North
Carolina. Only 2.1% work outside North Carolina (North Carolina Department of Commerce
[NCDC], 2017). The average travel time to a person’s work was 27.1 minutes in 2014, and
76.4% of workers drove alone to their place of work. Only 7.6% worked at home, and 10.7%
carpooled. The median household income in 2014 was $54,627, but the projected 2019 median
household income is $62,872. The 2014 estimated median worker earnings were $32,626
(NCDC, 2017).
Even though over half of Chatham County’s residents are employed outside its borders,
the county still supports itself with income from a variety of internal economic sectors. Industrial
activity condenses around the Pittsboro, Siler City, and Moncure areas of the county, and

16
includes timber, lumber, and wood products manufacturing, as well as firms dealing in plastics,
concrete and tile. Retirement communities such as Governor’s Village are also a growing
business in the county, made so by Chatham County’s growing aged population as well as its
proximity to state of the art medical facilities in nearby Chapel Hill and Durham (Chatham
County Economic Development Corporation, 2017).
Agriculture, however remains the county’s signature sector. Looking at agriculture
specifically, 111,778 acres out of the county’s total 436,696 acres is farmland, which is over
25%. Around one third of the farmland (36%) was used as pastureland as of 2012, and 23.9% as
cropland (USA, US Department of Agriculture [USDA], 2012). Out of crops, 18,400 acres of
hay were harvested while 600 acres of wheat were harvested. For livestock, 20,000,000 broilers
and 37,000 total cattle were produced in 2015 (USA, North Carolina Agricultural Statistics
[NCAS], 2012). As of 2012, “the number of farms in the county was 1,138, the total land in
farms was 111,778 acres, the average farm size was 98 acres, the average value of all farms and
buildings was $554,504,000, and the average total farm production expense was $131,931”
(NCAS, 2012). Moreover, the average net cash farm income of operation per farm was $15,659,
the average market value of products sold per farm was $144,032, and the total market value of
products sold was $163,909,000 (USDA, 2012). Livestock sales constituted 95% of the total
market value, and only 5% was due to crop sales (USDA, 2012).
Chatham County: Stakeholder Characteristics
Previous studies have defined stakeholders in myriad ways. For our study, it is important
to define what a stakeholder group is and identify how these groups feel about climate change
issues in Chatham County. Carney et al. (2009, p. 4) defines a stakeholder in regard to climate
change as “a person or group who influences or is influenced by the research” with particular

17
attention to the temporal aspects of involvement including engagement during the design, data
collection, and analysis stages. This level of stakeholder participation from start to end is termed
“engaged”, while simply using them for data collection is considered “nominal” (Carney et al.,
2009). Due to the nature of our study design and resource limitations, we will define our
stakeholder groups as nominal and parse out common themes regarding climate change and
greenhouse gas (GHG) emission mitigation through semi-structured interviews. While this
definition is quite broad, it is useful for considering the widely varying perspectives on climate
change and attitudes toward GHG emission reduction strategies.
The 2015 Chatham County Greenhouse Gas Emissions Inventory (Joca & Kolosna, 2016)
identified residents, local governments and the agricultural, transportation, commercial, and
industrial sectors as prime contributors to greenhouse gas emissions in Chatham County (Figure
8). As such, these stakeholder groups were considered instrumental for eliciting their perceptions
of climate change and attitudes towards recommended greenhouse emissions reduction
strategies.
Source: Adopted from Joca and Kolosna (2016)
Figure 8: 2010 and 2015 Greenhouse Gas Emissions from Chatham County’s Residential, Commercial, Industrial, Transportation, and Agricultural Sectors

18
Participant Sampling
Chatham County Residents
A list of 37,132 Chatham County addresses for the year 2014 was obtained from the
North Carolina Department of Information Technology’s Center for Geographic Information and
Analysis through NC One Map (2014; http://www.nconemap.com/). This dataset contains
locational information for every registered address in the state as well as information regarding
type of parcel and land use designation. The dataset is updated periodically every five years.
From this dataset, only addresses that were coded as “RES” (i.e. residents) were selected. These
addresses pertained to 29,052 housing units.
For this study, a sample of residents living in incorporated and unincorporated areas was
obtained to ensure representation of residents in both areas. The targeted sample size was 27
residents. This sample size was commensurate with Creswell’s (1998) recommendation that
suggested that the number of interviews in phenomenological studies – research exploring
people’s perceptions of a studied phenomenon – can range between 5 and 25 (Guest et al., 2006;
citing Creswell, 1998).
In order to ensure a geographic representation of the distribution of Chatham County
residents, a weighted sample of participants was randomly selected. First, the distribution of the
proportion of county residences in incorporated and unincorporated communities was delineated
and computed. Second, a random sample based on the distribution of the proportion of residents
within both communities was conducted using ArcGIS 10.4 (ESRI, Redlands, CA). The
distribution of sampled participants from incorporated and unincorporated areas is presented in
Table 1.
19
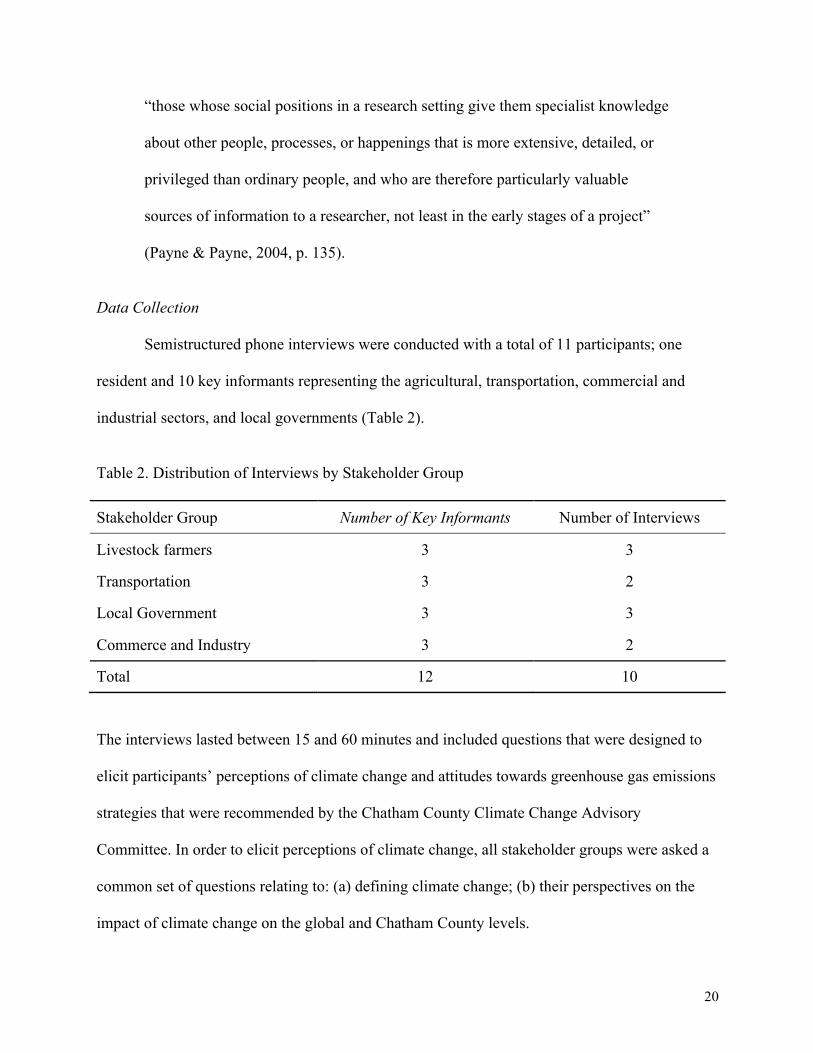
Table 1. Weighted Sample Distribution of Local Residents in Incorporated and Unincorporated Areas of Chatham County
Community N % n
Incorporated 5,098 17.55 5
Siler City 2,032 7.00 2
Pittsboro 1,573 5.41 2
Cary 1,362 4.69 1
Goldston 131 0.45 0
Unincorporated 23,954 82.45 22
Total 29,052 100.00 27
Once the original sample was selected, telephone information for each sampled address
was retrieved from Whitepages (https://www.whitepages.com). If a contact was not reached, a
new resident was randomly selected from that particular municipality or from within the same
zip code of unincorporated areas in order to maintain representativeness of the sample’s
geographic distribution. As such, 58 residents were contacted. Only one participated in the study
and three residents declined to participate. The remaining 54 participants were unable to be
reached, mostly because they had unlisted phone numbers, or the listed phone numbers
connected to broken lines. A few did not answer multiple calls. Thus, the participation rate was
1/58, or approximately 1.7%.
Agriculture, Transportation, Commercial and Industrial Sectors, and Local Governments
Representatives of the Chatham County Board of Commissioners helped identify three
key informants for each of the four stakeholder groups; thus, corresponding to 12 key informants
representing the four groups. Key informants are defined as:
20
“those whose social positions in a research setting give them specialist knowledge
about other people, processes, or happenings that is more extensive, detailed, or
privileged than ordinary people, and who are therefore particularly valuable
sources of information to a researcher, not least in the early stages of a project”
(Payne & Payne, 2004, p. 135).
Data Collection
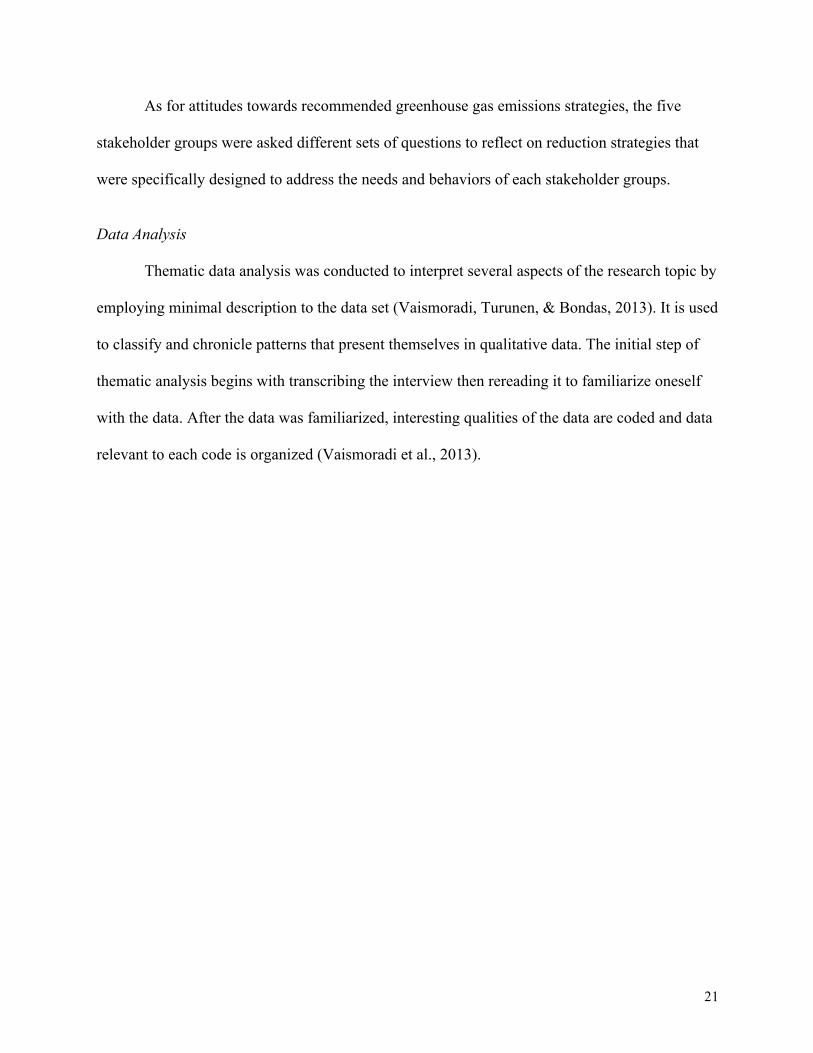
Semistructured phone interviews were conducted with a total of 11 participants; one
resident and 10 key informants representing the agricultural, transportation, commercial and
industrial sectors, and local governments (Table 2).
Table 2. Distribution of Interviews by Stakeholder Group
Stakeholder Group Number of Key Informants Number of Interviews
Livestock farmers 3 3
Transportation 3 2
Local Government 3 3
Commerce and Industry 3 2
Total 12 10
The interviews lasted between 15 and 60 minutes and included questions that were designed to
elicit participants’ perceptions of climate change and attitudes towards greenhouse gas emissions
strategies that were recommended by the Chatham County Climate Change Advisory
Committee. In order to elicit perceptions of climate change, all stakeholder groups were asked a
common set of questions relating to: (a) defining climate change; (b) their perspectives on the
impact of climate change on the global and Chatham County levels.
21
As for attitudes towards recommended greenhouse gas emissions strategies, the five
stakeholder groups were asked different sets of questions to reflect on reduction strategies that
were specifically designed to address the needs and behaviors of each stakeholder groups.
Data Analysis Thematic data analysis was conducted to interpret several aspects of the research topic by
employing minimal description to the data set (Vaismoradi, Turunen, & Bondas, 2013). It is used
to classify and chronicle patterns that present themselves in qualitative data. The initial step of
thematic analysis begins with transcribing the interview then rereading it to familiarize oneself
with the data. After the data was familiarized, interesting qualities of the data are coded and data
relevant to each code is organized (Vaismoradi et al., 2013).

22
RESULTS
Stakeholders’ Perceptions of Climate Change
Participants’ definitions of climate change varied considerably. Participants generally
thought of climate change as a global process that involves changes in weather patterns. Some
participants perceived this change to be systemic, natural and cyclical, or human made caused by
greenhouse gas emissions—such carbon dioxide—and fossil fuel burning.
Participants generally thought that climate change does exhibit global impacts, leading to
rising temperatures and sea levels, increased flooding, drought, and human conflict, in addition
to altered crop activity, as one participant said:
“my blueberries bloomed in February, and then the frost came, and last year we
had a late frost. That’s not unusual but having our berries blooming, the trees, I
think we lost a crop. Blueberries are not supposed to be blooming in February. It’s
not supposed to be 80 degrees at the end of February. It’s a great deal hotter, it’s
far less predictable than in the 40 years my husband’s been here.”
As for the perceived impacts of climate change on Chatham County, participants’ responses
varied, ranging from being unsure about the occurrence of impacts, to observing changes in
weather patterns and elevated temperatures that are leading to early blossoming of plants. Also,
when asked about their concerns about the impacts of climate change on health, financial
security, and local and global environments, participants conveyed varied responses. Regarding
health, some participants were concerned about the spread of diseases through ticks and
mosquitos. Other participants were: (a) not concerned because they thought that humans can
adapt to change, or simply they had not thought of the health impacts before, or (b) unsure
because they do not have much information about the health impacts of climate change.
23
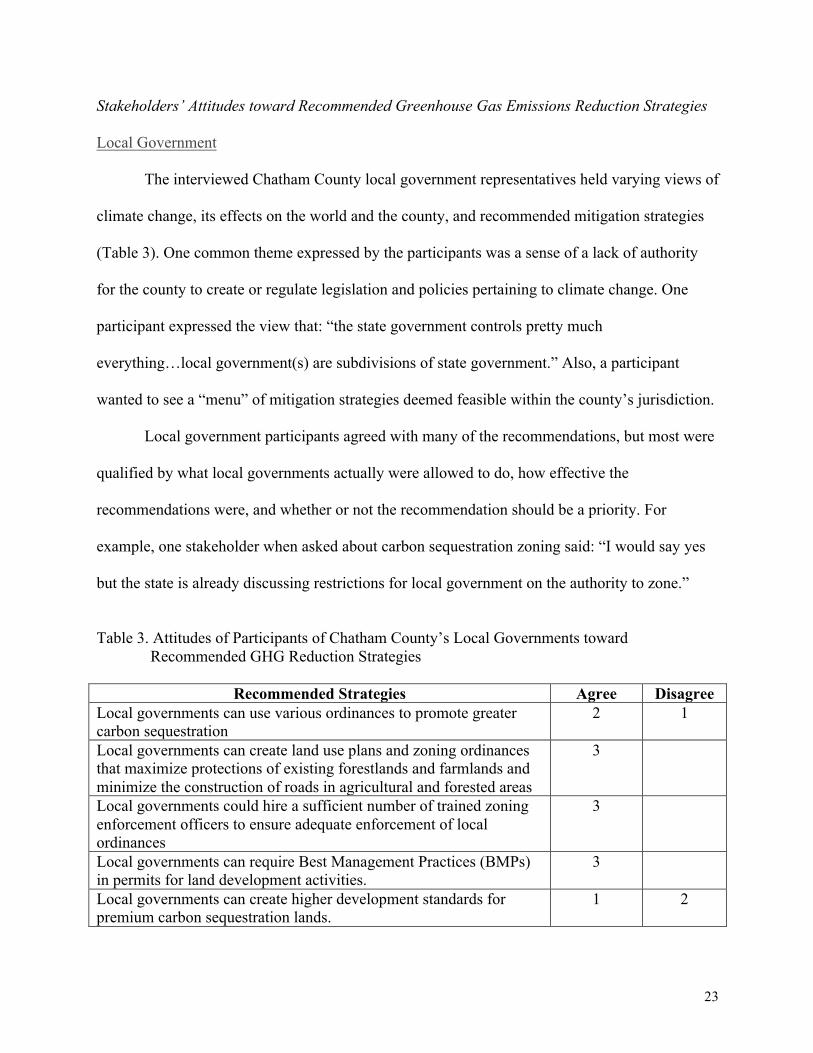
Stakeholders’ Attitudes toward Recommended Greenhouse Gas Emissions Reduction Strategies
Local Government
The interviewed Chatham County local government representatives held varying views of
climate change, its effects on the world and the county, and recommended mitigation strategies
(Table 3). One common theme expressed by the participants was a sense of a lack of authority
for the county to create or regulate legislation and policies pertaining to climate change. One
participant expressed the view that: “the state government controls pretty much
everything…local government(s) are subdivisions of state government.” Also, a participant
wanted to see a “menu” of mitigation strategies deemed feasible within the county’s jurisdiction.
Local government participants agreed with many of the recommendations, but most were
qualified by what local governments actually were allowed to do, how effective the
recommendations were, and whether or not the recommendation should be a priority. For
example, one stakeholder when asked about carbon sequestration zoning said: “I would say yes
but the state is already discussing restrictions for local government on the authority to zone.”
Table 3. Attitudes of Participants of Chatham County’s Local Governments toward
Recommended GHG Reduction Strategies
Recommended Strategies Agree Disagree Local governments can use various ordinances to promote greater carbon sequestration
2 1
Local governments can create land use plans and zoning ordinances that maximize protections of existing forestlands and farmlands and minimize the construction of roads in agricultural and forested areas
3
Local governments could hire a sufficient number of trained zoning enforcement officers to ensure adequate enforcement of local ordinances
3
Local governments can require Best Management Practices (BMPs) in permits for land development activities.
3
Local governments can create higher development standards for premium carbon sequestration lands.
1 2

24
Table 3. Attitudes of Participants of Chatham County’s Local Governments toward Recommended GHG Reduction Strategies (Continued)
Recommended Strategies Agree Disagree
Local governments can develop wider, forest stream management zones to protect from flooding.
2 1
Local governments can require development and construction bonds that promote use of “climate sensitive” forest management practices.
2 1
Local governments can include public lands planted with broadleaf trees to increase carbon sequestration
3
Local governments can provide greater “present use” taxation incentives to forestland owners who undertake greenhouse gas sequestration and mitigation efforts.
3
Local government can implement “Forest Stewardship” concepts for enhancing recreational options and protecting soil, water, and wildlife resources.
3
Local governments need to develop “compact regions” by extending infrastructure only in areas they wish to see developed.
3
Local governments need to switch to compressed natural gas engines for larger municipal vehicles
3
Local governments need to change fleet composition of their vehicles to include more hybrids and electric vehicles
3
Local governments need to create a Climate Change Mitigation/Adaptation Plan
3
Although the intent of most of the recommendations was agreed upon as a potential plan,
most of those were thought to be not important enough to spend taxpayer money on as climate
change was not thought to be an imminent threat to local municipalities in Chatham County.
Commercial and Industrial Stakeholders
Despite that the commercial and industrial sector did not have specific recommendations
outlined for them by the greenhouse gas emissions inventory or the Chatham County Climate
Change Advisory Committee, the two interviewed participants expressed opinions on Chatham
County’s overall climate change mitigation strategies. One participant mentioned that they felt
quite uninformed about climate change and the county’s strategies. However, the other
participant stated they were extremely disappointed with the county’s lack of tangible changes in

25
response to climate change, saying that: “the amount of alternative fuels is minuscule by the
county, the solar panels on government buildings are nonexistent.”
One participant thought that the county government is not actively expressing their
efforts; government buildings should have more solar panels, county budgets should allot funds
for hosting conferences, and county vehicles should run on alternative fuels if Chatham County
hopes to portray an image that will encourage constituents to also reduce their greenhouse gas
emissions. The participant also explained that in regards to the steps he takes to reduce emissions
by stating: “I do that not just to help the environment but to help my bill.”
Transportation
There were recurring concerns over the effectiveness of increasing transportation in the
more rural and less dense areas of Chatham County (Table 4). One participant failed to see the
connection between developing transit location sites in areas that do not have public
transportation and reducing carbon emissions. In response to the recommendation, the
stakeholder said: “the biggest thing we run into is getting people to the sites to load… the people
that we’re dealing with don’t have transportation [so they] can’t get to the sites.” The other
stakeholder believed that public transportation would only be cost-effective in dense areas with
higher ridership.
While the general reaction to more biking and walking trails was positive, there was
concern expressed over making sure they would be put to good use. Density was again cited as a
major factor in the effectiveness of walking and biking paths. One participant pointed out that:
“building a 20-mile long greenway out in the country, while beautiful, it’s not
really going to pull transportation trips off the road… you’re going to need to
focus on those short distance, high impact opportunities.”

26
Some areas in the municipalities, such as Moncure and the Briar Chapel areas, were suggested as
high enough density. The general reaction to increasing strategic locations of public facilities,
such as schools, to increase access to transit was positive. One participant suggested that
increasing walking and biking access to schools was even more important than increasing public
transportation access because students are more likely to walk or bike than to ride buses or use
other forms of public transportation.
For the recommendation about Flexible Zoning Standards that allow for more transit use,
both participants expressed confusion as there are no zoning standard limits to their knowledge
that would get in the way of public transit in Chatham County, saying: “I’m not aware of that so
I’ll say no comment on that one because they would need to- unless that’s something new that’s
coming up.”
One participant discussed the differences in development density between municipalities
and the county, citing zoning standards as a determining factor in development density, but not
as a factor in public transportation directly. This recommendation was considered too vague to
really be supported or opposed by both participants.
Mixed participant reactions to increasing the proliferation of hubs for charging electric
vehicles were observed. One participant supported it, especially if Chatham County Transit
begins to switch over to electric vehicles. The other participant was concerned that the county
would incur too many costs, suggesting that the county consider solutions like requiring
developers to include charging hubs. The stakeholder also expressed concern that the hubs could
become an obsolete technology.

27
Table 4. Attitudes of Participants of Chatham County’s Transportation Sector toward Recommended GHG Reduction Strategies
Recommended Strategy Agree Disagree
Develop transit location sites in areas that have no access to public transportation
1 1
Develop flexible zoning standards that allow for more transit use 1 1 There should be strategic locations of public facilities such as schools to increase access to transit
2
Proliferation of hubs for charging electric vehicles 1 1 Greater investment in bike lanes and walking trails in the community 2
Agriculture
All three interviewed participants were livestock farmers in Chatham County who
primarily raised grass-fed cattle. This may make it difficult to project their reactions to the
provided recommendations on the agricultural sector as a whole, but given that livestock, and
especially beef cattle production, is such a crucial industry in Chatham County, their opinions
should not be taken lightly.
On the whole, the response to the stated recommendations for manure management
vacillated between negative and confused (Table 5). Even the stakeholders who believed in the
negative impacts of climate change and felt strongly that they should do all they can to mitigate
them thought that the recommendations would not make a large impact on reducing agricultural
emissions. According to those interviewed, the majority of the recommendations were either
already practices for legislative or fiscal reasons, or were entirely inconsiderate of the practical
reality of running a livestock farm. For example, one participant explained in response to a
proposed recommendation “that again is a very poorly written question because we need to apply
manure at the proper stage for the crop that it is being applied to.”
The recommendations that involved a change in manure management tended to bewilder
28
the interviewees, while the notion of changing feed types unsettled them further. Specifically, all
of the farmers were concerned about how feed types or supplements could be used safely. Since
their cattle mainly grave at pasture on grass or hay, introducing supplements would be tricky.
The participants were unwilling to say that they would use the recommendations without
thoroughly understanding the effects of supplements on cattle. Concerns were raised about how
to make sure each cow got an appropriate dosage, or what effect it might have on the quality and
taste of the beef by the time it was brought to market. It was made clear that answers to questions
like these, as well as further incentives to change behavior, needed to be provided before
recommendations of this sort would be taken seriously.
Furthermore, all of the participants thought that many of the recommendations did not
have enough information. In regards to changing the feed type, one participant reacted by saying:
“I have no clue of what they mean. I need to know what feeds they’re saying are the culprit and
what feeds they’re recommending to replace [them] with.”
Expressing concern over the vagueness of the recommendations was a common
occurrence throughout all three interviews, and a few of the recommendations one participant
advised us were already part on the North Carolina law, making them superfluous and
unnecessary. One participant expressed the view that the recommendations seemed to have no
foundation in agricultural practices.
In addition to having qualms with the vagueness and lack of information about the
recommendations, the participants were also concerned about the financial viability of the
options. Options like reducing fuel costs through a reduction in fuel used by farmers’ tractors
were mentioned as being more attractive than practices that simply added to the costs of
operation like chopping hay and using feed supplements. The stakeholders believed that effective
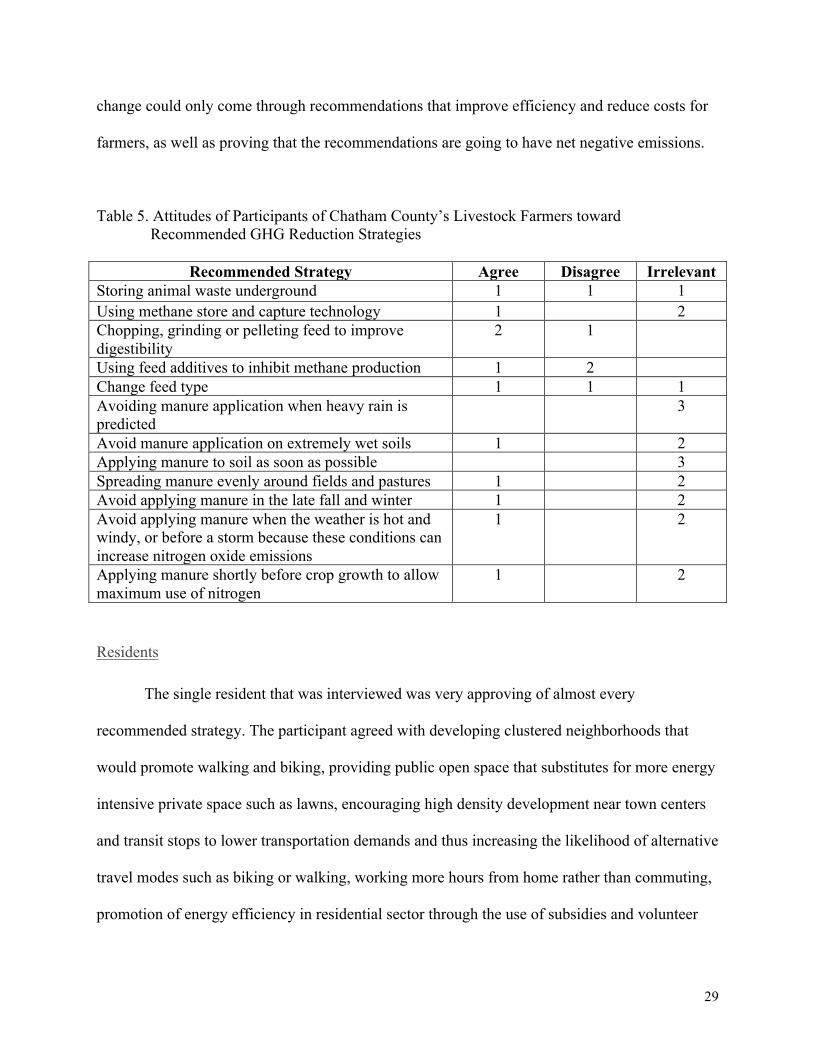
29
change could only come through recommendations that improve efficiency and reduce costs for
farmers, as well as proving that the recommendations are going to have net negative emissions.
Table 5. Attitudes of Participants of Chatham County’s Livestock Farmers toward Recommended GHG Reduction Strategies
Recommended Strategy Agree Disagree Irrelevant
Storing animal waste underground 1 1 1 Using methane store and capture technology 1 2 Chopping, grinding or pelleting feed to improve digestibility
2 1
Using feed additives to inhibit methane production 1 2 Change feed type 1 1 1 Avoiding manure application when heavy rain is predicted
3
Avoid manure application on extremely wet soils 1 2 Applying manure to soil as soon as possible 3 Spreading manure evenly around fields and pastures 1 2 Avoid applying manure in the late fall and winter 1 2 Avoid applying manure when the weather is hot and windy, or before a storm because these conditions can increase nitrogen oxide emissions
1 2
Applying manure shortly before crop growth to allow maximum use of nitrogen
1 2
Residents
The single resident that was interviewed was very approving of almost every
recommended strategy. The participant agreed with developing clustered neighborhoods that
would promote walking and biking, providing public open space that substitutes for more energy
intensive private space such as lawns, encouraging high density development near town centers
and transit stops to lower transportation demands and thus increasing the likelihood of alternative
travel modes such as biking or walking, working more hours from home rather than commuting,
promotion of energy efficiency in residential sector through the use of subsidies and volunteer

30
programs, and an increased use of hybrid/electric cars. The resident did not, however, agree with
the recommendation that would cluster homes together and convert private lawn space to public
parks or woodland area. The participant said:
“I think that people really spend a good part of their careers working towards
being able to afford their own little piece of heaven, their own property that they
can do with what they please.”
She referenced the American dream being something that historically most Americans work
towards, with a large yard being a key component.

31
CONCLUSIONS AND RECOMMENDATIONS
This study explored perceptions of climate change and attitudes towards recommended
greenhouse gas reduction strategies among representatives of five stakeholder groups in
Chatham County: residents, livestock farmers, local governments, commercial and industrial
sector, and the transportation sector. By exploring perceptions of climate change, this study
revealed that stakeholders’ definitions of climate change varied considerably, from a global
process affected by human activities/emissions to a natural occurrence that affects global
temperatures. Some of the participants thought that climate change has effects on the global
scale, but some were unaware of climate change impacts on Chatham County or the extent to
which Chatham County was contributing to climate change in terms of its greenhouse emissions.
These findings highlight the need to develop public outreach activities that would initiate
discussion with and among varied stakeholder groups regarding the causes and effects of climate
change at the local and global levels. There is a critical need to frame climate change as a local
issue in order to overcome stakeholders’ barriers to engagement in greenhouse gas emissions
reduction and climate change mitigation (Betsill, 2001).
As for attitudes towards recommended greenhouse reduction strategies in Chatham
County, this study showed that participants expressed support, or lack thereof, of several of those
strategies. Stakeholder’s primary concerns were cost and time efficiency. Stakeholders were
much more responsive to recommendations that decreased their cost and time of operation, and
expressed a desire to have proof that the recommendations are net carbon negative before they
were willing to implement them. Therefore, there is a need for increased knowledge of both the
causes and effects of climate change, as well as identifying the cost and benefits of the
recommended greenhouse gas reduction strategies. For participants representing the local

32
government, the following recommendations were the most promising:
(a) creating land use plans and zoning ordinances that maximize protections of
existing forestlands and farmlands and minimize the construction of roads in
agricultural and forested areas
(b) requiring Best Management Practices (BMPs) in permits for land development
activities
(c) hiring a sufficient number of trained zoning enforcement officers to ensure
adequate enforcement of local ordinances, including public lands planted with
broadleaf trees to increase carbon sequestration
(d) implementing “Forest Stewardship” concepts for enhancing recreational options
and protecting soil, water, and wildlife resources
(e) developing “compact regions” by extending infrastructure only in areas they wish
to see developed
(f) changing fleet composition of their vehicles to include more hybrids and electric
vehicles
(g) creating a climate change mitigation/adaptation plan.
In order to implement these strategies, research should be conducted to determine the source of
funding, the enforcement procedures for each strategy, and the personnel who would be in
charge of and held accountable for implementing the respective strategies.
As for the transportation sector, the most popular strategies were:
(a) strategic locations of public facilities, such as schools, to increase access to
transit, and
(b) greater investment in bike lanes and walking trails in the community.
33
For the transportation sector, the feasibility and practicality of changing the locations of public
facilities needs to be explored, as well as determining how useful bike trails and walking trails
are. Research can also be conducted to determine how to make public transit and bike/walking
trails more popular and useful.
For the agricultural sector, none of the recommended strategies had unanimously positive
reception, suggesting that further research needs to be conducted into the operating practices of
the agricultural world and how they can be adapted to greenhouse gas emission reduction and
climate change mitigation strategies. Regarding the general public, the only resident participant
agreed with developing clustered neighborhoods in order to promote walking and biking, but did
not, however, agree with the recommendation that would cluster homes together and convert
private lawn space to public parks or woodland area. It is important to account for the public’s
values and perceptions to develop these climate change mitigation strategies, as they will only be
successful if the public decides to follow the recommended practices.
Successful development and implementation of greenhouse gas emissions reduction and
climate change mitigation strategies need buy-in from stakeholders. Agrawal (2010) found that
civic institutions, which were defined as “membership organizations that function in a manner
analogous to companies and advance some common interest of their members; and cooperatives
which function more like partnership and help members pool resources for improved economic
outcomes” were the best facilitators of climate change mediation, due to their informal
opportunities to interact with communities (p. 20). In order to enhance stakeholders’ buy-in,
stakeholder engagement needs to be considerate of constraints that would hinder the adoption of
greenhouse gas emissions reduction and climate change mitigation. Thus, further research might
be needed to explore: (a) how standard agricultural operating procedures coincide with popular
34
greenhouse gas emissions mitigation strategies; (b) what domains a county government has
control over; and (c) the feasibility of the recommended climate change mitigation strategies.
In addition to exploring constraints, individual and communal benefits that each of the
strategies would have for reducing greenhouse gas emissions needs to be properly established to
get participation and cooperation from the stakeholders. For instance, (Agrawal, 2010, p. 3)
found that the most motivating factors for a community to comply and support guidelines to
mediate climate change were communal benefits, more so than individual benefits, likely
because community members can encourage and keep one another accountable for complacency.
In addition to the benefits, the costs of not adopting the climate change mitigation strategies also
need to be well established. Further research could be done to establish the costs and benefits of
each greenhouse gas emission reduction strategies.
35
REFERENCES
Arbuckle, J. G., Prokopy, L. S., Haigh, T., Hobbs, J., Knoot, T., Knutson, C., Loy, A., Saylor
Mase, A., McGuire, J., Wright Morton, L., Tyndall, J., Widhalm, M. (2013). Climate change beliefs, concerns, and attitudes toward adaptation and mitigation among farmers in the Midwestern United States. Climatic Change, 117(4), 943-950.
Arbuckle, J. G., Hobbs, J., Morton, L. W. (2015). Understanding farmer perspectives on climate change adaptation and mitigation. Environment and Behavior, 47(2), 205-234.
ArcGIS 10.4. ESRI. Redlands, CA
Betsill, M. M. (2001). Mitigating climate change in US cities: Opportunities and obstacles. Local Environment,6(4), 393-406.
Brotman, Alex, Brown, L., Squiers, C. (2015). Investigating the feasibility of greenhouse gas mitigation in Santa Barbara County. Bren School of Environmental Science and Management. http://www.esm.ucsb.edu/research/2015Group_Projects/documents/SBCOffsetsProjectBrief.pdf
Carney, S., Whitmarsh, L., Nicholson-Cole, S. A., & Shackley, S. (2009). A dynamic typology of stakeholder engagement within climate change research. Tyndall Center for Climate Change Research, Working Paper, 128. Retrieved from: https://www.researchgate.net/profile/Simon_Shackley/publication/236219048_A_Dynamic_Typology_of_Stakeholder_Engagement_Within_Climate_Change_Research/links/00b7d52cdf7a051df7000000/A-Dynamic-Typology-of-Stakeholder-Engagement-Within-Climate-Change-Research.pdf
Chatham County Economic Development Corporation. (2017). Current Primary Industries. Chatham County North Carolina County Government 101: The Fundamentals of Chatham County Government. Retrieved from http://www.chathamnc.org/about-us/county-government-101
Chatham County North Carolina. (n.d.a). Towns and Unincorporated Communities. Retrieved
from http://www.chathamnc.org/residents/towns-legislators-other-key-contacts/towns-unincorporated-communities.
Chatham County North Carolina. (n.d.b). Government. Retrieved from http://www.chathamnc.org/government
Climate Northern Island (2015). Planning for Climate Change Stakeholder Engagement Report. Ireland: Northern Ireland Environment Link. http://www.climatenorthernireland.org.uk/cmsfiles/Climate-NI-Planning-for-Climate-Change-in-Northern-Ireland_Stakeholder-Engagment-Report.pdf

36
Collantes, G., Gallagher, K. S., Lee, H., Morrow, R. W. (2010). Analysis of policies to reduce oil consumption and greenhouse-gas emissions from the US transportation sector. Energy Policy, 38(3), 1305-1320.
Creswell, J. (1998). Qualitative inquiry and research design: Choosing among five traditions. Thousand Oaks, CA: Sage.
Diekmann, A. & Preisendoerfer, P. (1992) Persoenliches umweltverhalten: Die Diskrepanz zwischen anspruch und wirklichkeit. Koelner Zeitschrift fuer Soziologie und Sozialpsychologie, 44, 226–251.
Few, R., Brown, K., & Tompkins, E. L. (2007). Public participation and climate change adaptation: avoiding the illusion of inclusion. Climate policy, 7(1), 46-59.
Ford, J. D., Pearce, T., Prno, J., Duerden, F., Ford, L. B., Beaumier, M., Smith, T. (2009). Perceptions of climate change risks in primary resource use industries: A survey of the Canadian mining sector. Regional Environmental Change,10(1), 65-81.
Fosu-Mensah, B.Y., Vlek, P.L.G., MacCarthy, D.S. (2012). Farmers’ perceptions and adaptation to climate change: A case study of Sekyedumase district in Ghana. Environment, Development, and Sustainability, 14, 495-505.
Fürst, E., Oberhofer, P. (2012). Sustainable development in the transport sector: Influencing environmental behaviour and performance. Business Strategy and the Environment, 22(6), 374-389.
Gardener, J., Dowd, A., Mason, C., Ashworth, P. (n.d.). A framework for stakeholder engagement on climate adaptation (Rep.). CSIRO. Retrieved from https://research.csiro.au/climate/wp-content/uploads/sites/54/2016/03/3_CAF_WorkingPaper03_pdf-Standard.pdf
Grothmann, T., Patt. A. (2005). Adaptive capacity and human cognition: The process of individual adaptation to climate change. Global Environmental Change, 15(3), 199-213.
Guest, G., Bunce, A., Johnson, L. (2006). How many interviews are enough? An experiment with data saturation and variability. Field Methods. 18, 59-82.
Hamilton, L. C., Keim, B. D. (2009). Regional variation in perceptions about climate change. International Journal of Climatology,29(15), 2348-2352.
Herweijer, C., Ranger, N., Ward, R. E. (2009). Adaptation to climate change: Threats and opportunities for the insurance industry. The Geneva Papers on Risk and Insurance – Issues and Practice,34(3), 360-380.
Hoffman, A. J. (2005). Climate change strategy: The business logic behind voluntary greenhouse gas reductions. California Management Review, 47(3), 21-46.
37
Joca, L., Kolosna, C. (2016). 2015 Greenhouse Gas Emissions Inventory for Chatham County, North Carolina. University of North Carolina at Chapel Hill, 13 pp.
Kollmuss, A., Agyeman, J. (2002). Mind the gap: Why do people act environmentally and what are the barriers to pro-environmental behavior? Environmental Education Research, 8(3), 239 – 260.
Lorenzoni, I., Nicholson-Cole, S., Whitmarsh, L. (2007). Barriers perceived to engaging with climate change among the UK public and their policy implications. Global environmental change, 17(3), 445-459.
Morton, T. A., Bretschneider, P., Coley, D., Kershaw, T. (2011). Building a better future: An exploration of beliefs about climate change and perceived need for adaptation within the building industry. Building and Environment,46(5), 1151-1158.
North Carolina Department of Commerce, ACCESSNC. (2017). County Profile Chatham County (NC). Retrieved from http://accessnc.nccommerce.com/DemoGraphicsReports/pdfs/countyProfile/NC/37037.pdf
North Carolina Department of Information Technology’s Center for Geographic Information and Analysis (2014). NC one map. http://data.nconemap.com/geoportal/catalog/main/home.page.
North Carolina League of Municipalities. (n.d). How NC Municipalities Work. https://www.nclm.org/resource-center/Pages/How-Municipalities-Work.aspx
Payne, G., Payne, J. (2004). Key concepts in social research. Retrieved from http://dx.doi.org.libproxy.lib.unc.edu/10.4135/9781849209397.n28
Saleh Safi, A., James Smith, W., & Liu, Z. (2012). Rural Nevada and climate change: vulnerability, beliefs, and risk perception. Risk Analysis, 32(6), 1041-1059.
US Census Bureau. (2015). Chatham County Population Estimates, July 1, 2015. Retrieved from https://www.census.gov/quickfacts/table/PST045215/00,37037
US Department of Agriculture, National Agricultural Statistics Service. (2012). Chatham County North Carolina. Retrieved from https://www.agcensus.usda.gov/Publications/2012/Online_Resources/County_Profiles/North_Carolina/cp37037.pdf
USA, NC Commerce, Labor and Economic Analysis Division. (2015). Top 25 Employers by NC County. Retrieved from http://accessnc.commerce.state.nc.us/docs/topEmployers/topEmp_37037.pdf
USA, North Carolina Agricultural Statistics. (2012). Chatham County. Retrieved from
38
http://www.ncagr.gov/stats/2016AgStat/Back50/ChathamCherokee.pdf
Vaismoradi, M., Turunen, H., Bondas, T. (2013). Content analysis and thematic analysis: Implications for conducting a qualitative descriptive study. Nursing and Health Sciences,15, 398–405.
Zuo, J., Read, B., Pullen, S., Shi, Q. (2012). Achieving carbon neutrality in commercial building developments – Perceptions of the construction industry. Habitat International,36(2), 278-286.