Stainless Steel as a Lightweight Automotive Material 03 SS as a Lightweight... · Stainless Steel...
17
Stainless Steel as a Lightweight Automotive Material Claes Magnusson R&D Coordinator, Volvo Cars Body Components, Olofström, Sweden Roger Andersson R&D-Forming & Materials, Swedish Tool & Die Technology, Luleå, Sweden ABSTRACT This paper describes a study of high strength stainless and carbon steels at Volvo Cars Body Components. It demonstrates the difference in formability and crash absorbing capability for a specific component. The austenitic stainless grades and the carbon steel Trip700 undergo a microstructure transformation during plastic deformation. This means that traditional forming limit curves index the formability to low for these types of materials. Instead, a forming limit dome height diagram should be used to index the formability for all type of materials. The crash impact absorbing capabilities was highest for the bumper that was made in high strength stainless steel since that material had the highest yield stress of all materials in this study. INTRODUCTION To day's car is a multi-material vehicle. There are several reasons for this. Weight is one key factor. Structural components and body panels are subjected to demands for decreased weight and several lightweight solutions can be found on our streets. The material choice strategy for the future is to not only decrease weight or make the car safer but is also anything that will help build a successful vehicle. If the material is successful in meeting very particular performance goals - noise, vibration, airflow, weight and, of course, cost - then it will be used. Still, the prime reason for using steel in the body structure of an automotive is its inherent capability to absorb impact energy in a crash situation [1-6]. This, in combination with the good formability and joining capability, makes these materials often a first choice for the designer of the body-in-white (BIW) structure. Materials are often described by properties such as yield- and tensile strength, elongation to fracture, anisotropy and Young’s modulus but shape is not a material property. A sheet metal component is a material made into a certain shape through a forming process. Depending on loading condition, a material-and-shape combination resists the applied load best. Components in a BIW structure should also be able to absorb or transmit impact energy in a crash situation. In axial tensile loading of components, the shape is not as important as the cross-sectional area since all sections with the same area will carry the same stress. The strength of a component that should be under axial loading is related to the mechanical properties of the material [7]. In bending and torsion, both material and shape are important parameters for the efficiency of the component to carry the applied load [8]. For bending, the elastic-plastic transition is a combination of shape and material properties. The strength of a beam under bending is related to the materials yield stress and Young’s modulus. The stiffness is correlated to the materials Young’s modulus and the shape of the component.
Transcript of Stainless Steel as a Lightweight Automotive Material 03 SS as a Lightweight... · Stainless Steel...
Stainless Steel as a Lightweight Automotive Material Claes Magnusson
R&D Coordinator, Volvo Cars Body Components, Olofström, Sweden
Roger Andersson R&D-Forming & Materials, Swedish Tool & Die Technology, Luleå, Sweden
ABSTRACT
This paper describes a study of high strength stainless and carbon steels at Volvo Cars Body Components. It demonstrates the difference in formability and crash absorbing capability for a specific component. The austenitic stainless grades and the carbon steel Trip700 undergo a microstructure transformation during plastic deformation. This means that traditional forming limit curves index the formability to low for these types of materials. Instead, a forming limit dome height diagram should be used to index the formability for all type of materials. The crash impact absorbing capabilities was highest for the bumper that was made in high strength stainless steel since that material had the highest yield stress of all materials in this study.
INTRODUCTION
To day's car is a multi-material vehicle. There are several reasons for this. Weight is one key factor. Structural components and body panels are subjected to demands for decreased weight and several lightweight solutions can be found on our streets. The material choice strategy for the future is to not only decrease weight or make the car safer but is also anything that will help build a successful vehicle. If the material is successful in meeting very particular performance goals - noise, vibration, airflow, weight and, of course, cost - then it will be used. Still, the prime reason for using steel in the body structure of an automotive is its inherent capability to absorb impact energy in a crash situation [1-6]. This, in combination with the good formability and joining capability, makes these materials often a first choice for the designer of the body-in-white (BIW) structure. Materials are often described by properties such as yield- and tensile strength, elongation to fracture, anisotropy and Young’s modulus but shape is not a material property. A sheet metal component is a material made into a certain shape through a forming process. Depending on loading condition, a material-and-shape combination resists the applied load best. Components in a BIW structure should also be able to absorb or transmit impact energy in a crash situation. In axial tensile loading of components, the shape is not as important as the cross-sectional area since all sections with the same area will carry the same stress. The strength of a component that should be under axial loading is related to the mechanical properties of the material [7]. In bending and torsion, both material and shape are important parameters for the efficiency of the component to carry the applied load [8]. For bending, the elastic-plastic transition is a combination of shape and material properties. The strength of a beam under bending is related to the materials yield stress and Young’s modulus. The stiffness is correlated to the materials Young’s modulus and the shape of the component.
Our interest in stainless steels comes from the materials excellent formability behaviour combined with high strength [9-11]. Due to this advantage, it is possible to design a component that is stiffer and has higher strength than conventionally cold-rolled carbon steels. A rear bumper to the Volvo Car model S80 was deep drawn to verify the formability and strength behaviour of different high strength steels. The bumpers were manufactured in the press line at Volvo Cars manufacturing plant in Olofström, Sweden. The formability was evaluated through experimental tests and in the stamping operation in the press. These components were subsequently evaluated experimentally for their energy absorbing capabilities through quasi-static impact tests. MATERIAL CHARACTERIZATION
Three carbon and two austenitic stainless steels were selected in this study. Two carbon steels had duplex microstructure while the third was a TRIP grade. The stainless steels were cold rolled and delivered from AvestaPolarit [12]. The stainless grades had an austenitic structure with lean composition and one was in fully annealed condition while the other was in temper rolled condition. Both the stainless grades and the TRIP grade of the carbon steels have a meta-stable microstructure, which means that the initial microstructure is able to change during plastic deformation. Uniaxial tensile tests were made to evaluate the mechanical and plastic properties of the materials. UNIAXIAL TENSILE TESTS
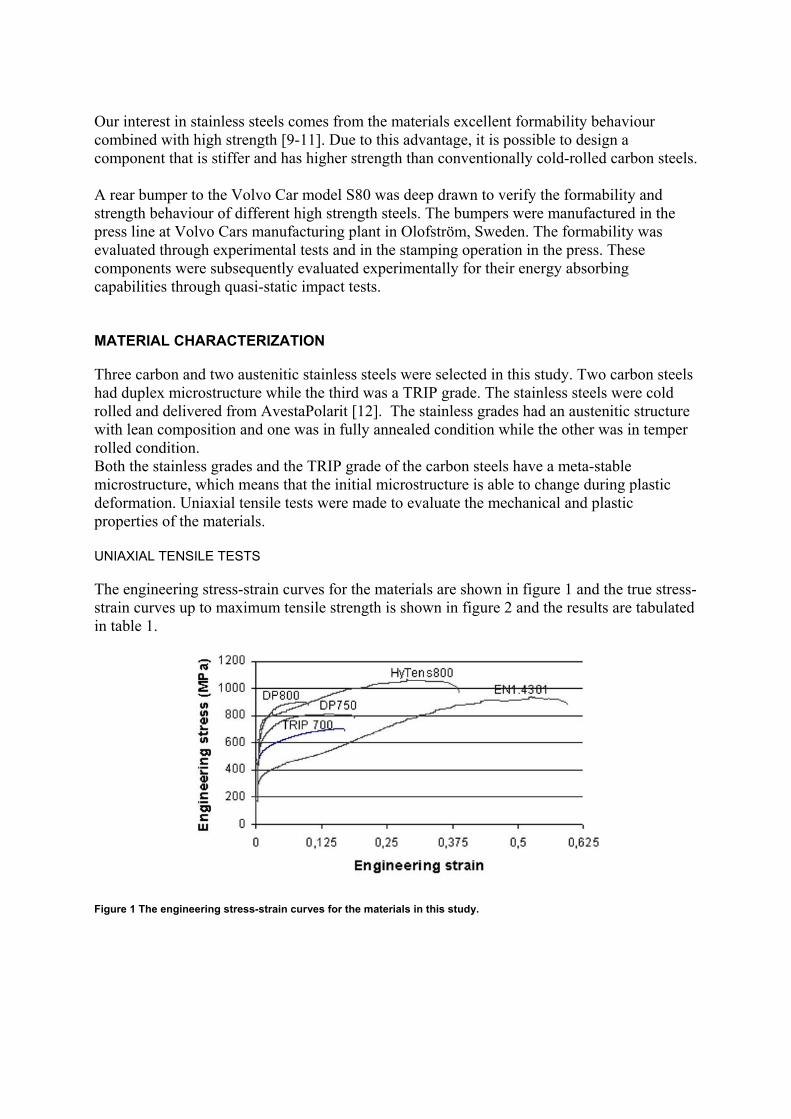
The engineering stress-strain curves for the materials are shown in figure 1 and the true stress-strain curves up to maximum tensile strength is shown in figure 2 and the results are tabulated in table 1.
Figure 1 The engineering stress-strain curves for the materials in this study.
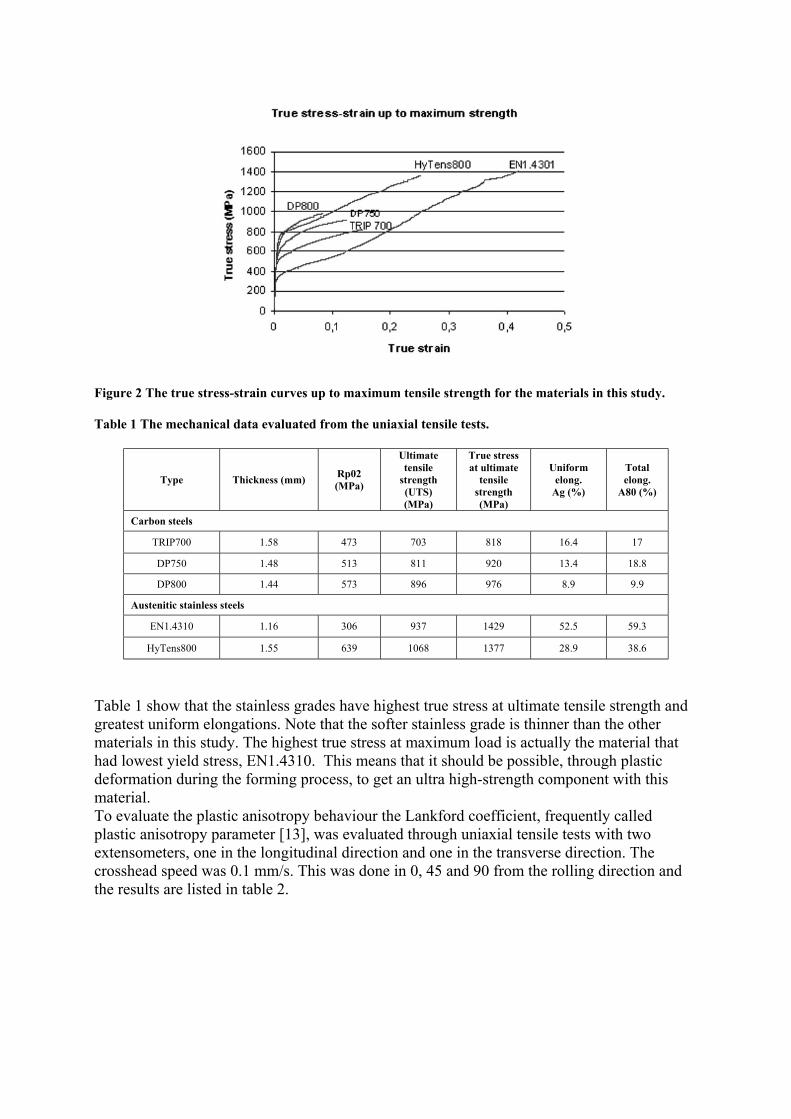
Figure 2 The true stress-strain curves up to maximum tensile strength for the materials in this study.
Table 1 The mechanical data evaluated from the uniaxial tensile tests.
Type Thickness (mm) Rp02 (MPa)
Ultimate tensile
strength (UTS) (MPa)
True stress at ultimate
tensile strength (MPa)
Uniform elong.
Ag (%)
Total elong.
A80 (%)
Carbon steels
TRIP700 1.58 473 703 818 16.4 17
DP750 1.48 513 811 920 13.4 18.8
DP800 1.44 573 896 976 8.9 9.9
Austenitic stainless steels
EN1.4310 1.16 306 937 1429 52.5 59.3
HyTens800 1.55 639 1068 1377 28.9 38.6
Table 1 show that the stainless grades have highest true stress at ultimate tensile strength and greatest uniform elongations. Note that the softer stainless grade is thinner than the other materials in this study. The highest true stress at maximum load is actually the material that had lowest yield stress, EN1.4310. This means that it should be possible, through plastic deformation during the forming process, to get an ultra high-strength component with this material. To evaluate the plastic anisotropy behaviour the Lankford coefficient, frequently called plastic anisotropy parameter [13], was evaluated through uniaxial tensile tests with two extensometers, one in the longitudinal direction and one in the transverse direction. The crosshead speed was 0.1 mm/s. This was done in 0, 45 and 90 from the rolling direction and the results are listed in table 2.
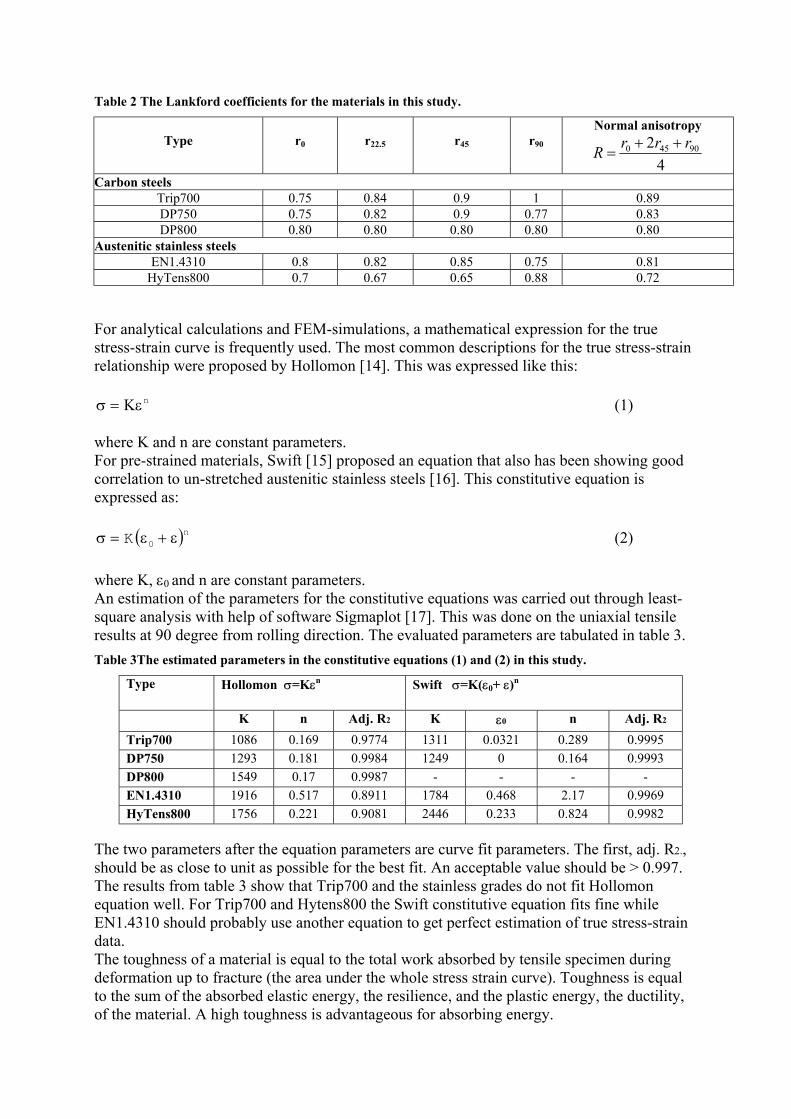
Table 2 The Lankford coefficients for the materials in this study.
Type
r0
r22.5
r45
r90
Normal anisotropy
42 90450 rrrR ++
=
Carbon steels Trip700 0.75 0.84 0.9 1 0.89 DP750 0.75 0.82 0.9 0.77 0.83 DP800 0.80 0.80 0.80 0.80 0.80
Austenitic stainless steels EN1.4310 0.8 0.82 0.85 0.75 0.81
HyTens800 0.7 0.67 0.65 0.88 0.72
)
For analytical calculations and FEM-simulations, a mathematical expression for the true stress-strain curve is frequently used. The most common descriptions for the true stress-strain relationship were proposed by Hollomon [14]. This was expressed like this:
nεΚ=σ (1) where K and n are constant parameters. For pre-strained materials, Swift [15] proposed an equation that also has been showing good correlation to un-stretched austenitic stainless steels [16]. This constitutive equation is expressed as:
( n0K ε+ε=σ (2)
where K, ε0 and n are constant parameters. An estimation of the parameters for the constitutive equations was carried out through least-square analysis with help of software Sigmaplot [17]. This was done on the uniaxial tensile results at 90 degree from rolling direction. The evaluated parameters are tabulated in table 3. Table 3The estimated parameters in the constitutive equations (1) and (2) in this study.
Type Hollomon σ=Kεn Swift σ=K(ε0+ ε)n
K n Adj. R2 K ε0 n Adj. R2 Trip700 1086 0.169 0.9774 1311 0.0321 0.289 0.9995 DP750 1293 0.181 0.9984 1249 0 0.164 0.9993 DP800 1549 0.17 0.9987 - - - - EN1.4310 1916 0.517 0.8911 1784 0.468 2.17 0.9969 HyTens800 1756 0.221 0.9081 2446 0.233 0.824 0.9982
The two parameters after the equation parameters are curve fit parameters. The first, adj. R2., should be as close to unit as possible for the best fit. An acceptable value should be > 0.997. The results from table 3 show that Trip700 and the stainless grades do not fit Hollomon equation well. For Trip700 and Hytens800 the Swift constitutive equation fits fine while EN1.4310 should probably use another equation to get perfect estimation of true stress-strain data. The toughness of a material is equal to the total work absorbed by tensile specimen during deformation up to fracture (the area under the whole stress strain curve). Toughness is equal to the sum of the absorbed elastic energy, the resilience, and the plastic energy, the ductility, of the material. A high toughness is advantageous for absorbing energy.
The toughness for the materials in this study is tabulated in table 4. Table 4 The toughness and resilience per volume unit for evaluated from the uniaxial tensile curves.
Type Toughness (J/m^3)
Carbon steels TRIP700 105 DP750 101 DP800 74
Stainless steels EN1.4310 364 HyTens80
0 269
Table 4 shows that the stainless grades have highest toughness and this is a sign that these materials should absorb most energy in an axial impact situation. FORMABILITY
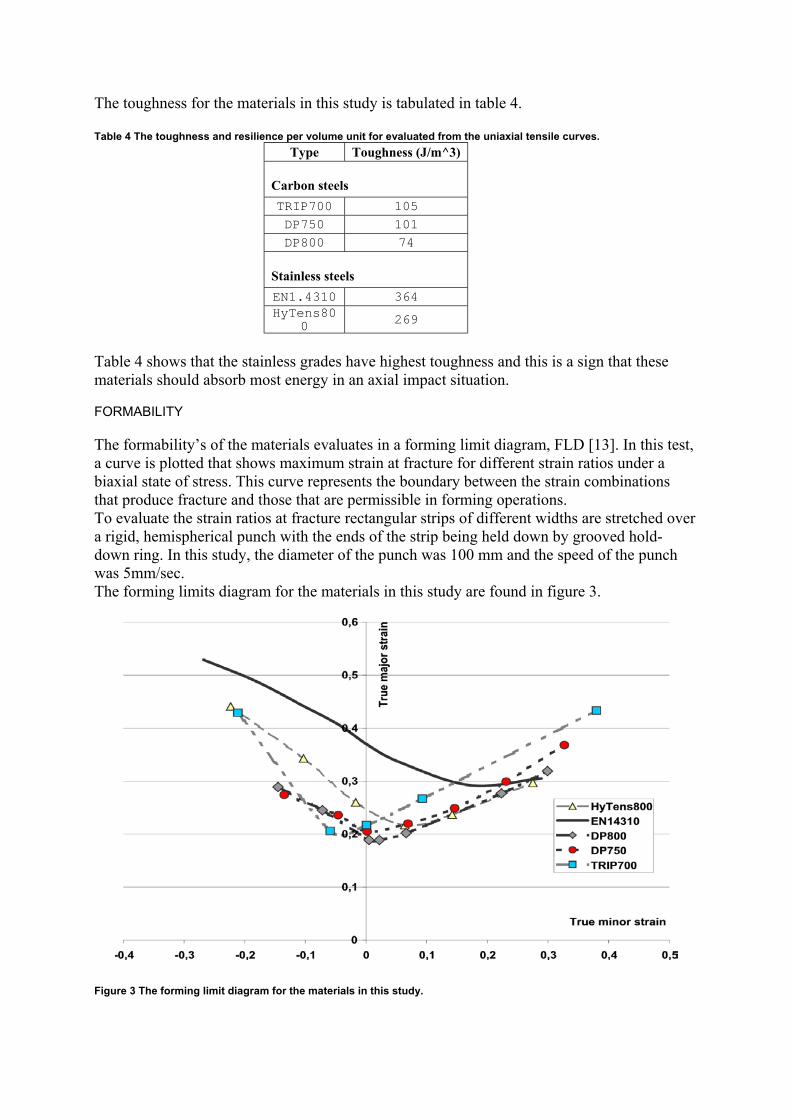
The formability’s of the materials evaluates in a forming limit diagram, FLD [13]. In this test, a curve is plotted that shows maximum strain at fracture for different strain ratios under a biaxial state of stress. This curve represents the boundary between the strain combinations that produce fracture and those that are permissible in forming operations. To evaluate the strain ratios at fracture rectangular strips of different widths are stretched over a rigid, hemispherical punch with the ends of the strip being held down by grooved hold-down ring. In this study, the diameter of the punch was 100 mm and the speed of the punch was 5mm/sec. The forming limits diagram for the materials in this study are found in figure 3.
Figure 3 The forming limit diagram for the materials in this study.
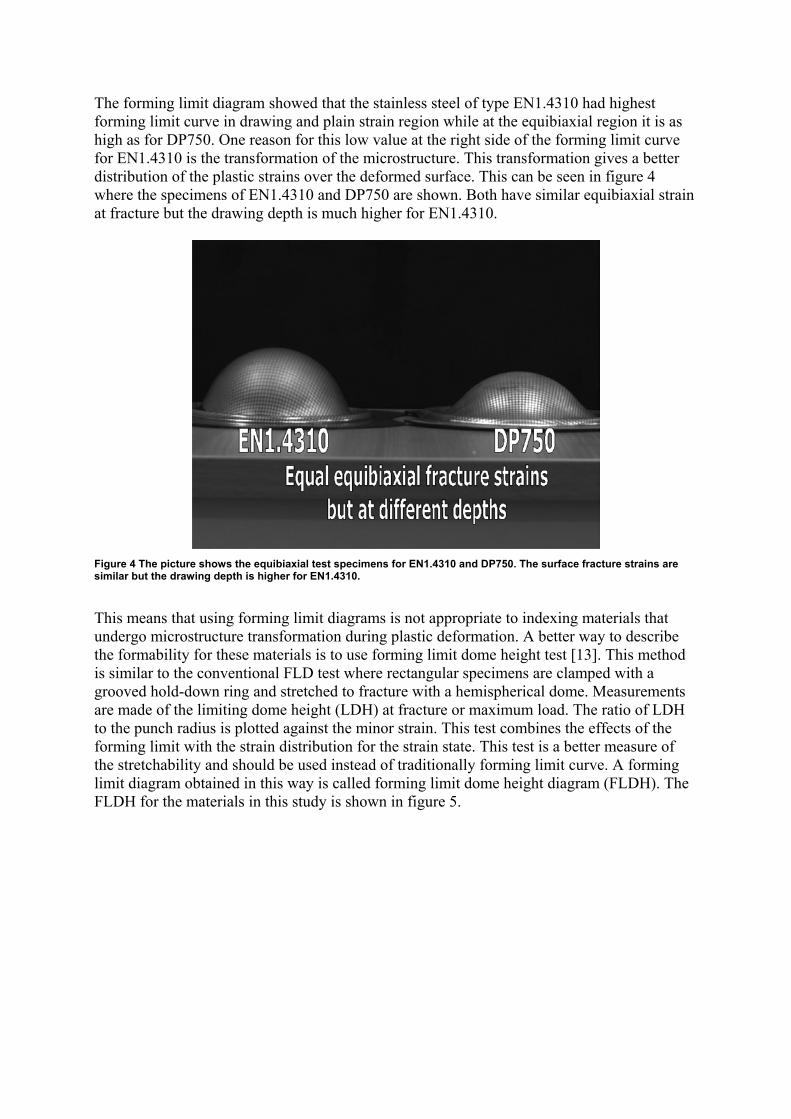
The forming limit diagram showed that the stainless steel of type EN1.4310 had highest forming limit curve in drawing and plain strain region while at the equibiaxial region it is as high as for DP750. One reason for this low value at the right side of the forming limit curve for EN1.4310 is the transformation of the microstructure. This transformation gives a better distribution of the plastic strains over the deformed surface. This can be seen in figure 4 where the specimens of EN1.4310 and DP750 are shown. Both have similar equibiaxial strain at fracture but the drawing depth is much higher for EN1.4310.
Figure 4 The picture shows the equibiaxial test specimens for EN1.4310 and DP750. The surface fracture strains are similar but the drawing depth is higher for EN1.4310.
This means that using forming limit diagrams is not appropriate to indexing materials that undergo microstructure transformation during plastic deformation. A better way to describe the formability for these materials is to use forming limit dome height test [13]. This method is similar to the conventional FLD test where rectangular specimens are clamped with a grooved hold-down ring and stretched to fracture with a hemispherical dome. Measurements are made of the limiting dome height (LDH) at fracture or maximum load. The ratio of LDH to the punch radius is plotted against the minor strain. This test combines the effects of the forming limit with the strain distribution for the strain state. This test is a better measure of the stretchability and should be used instead of traditionally forming limit curve. A forming limit diagram obtained in this way is called forming limit dome height diagram (FLDH). The FLDH for the materials in this study is shown in figure 5.
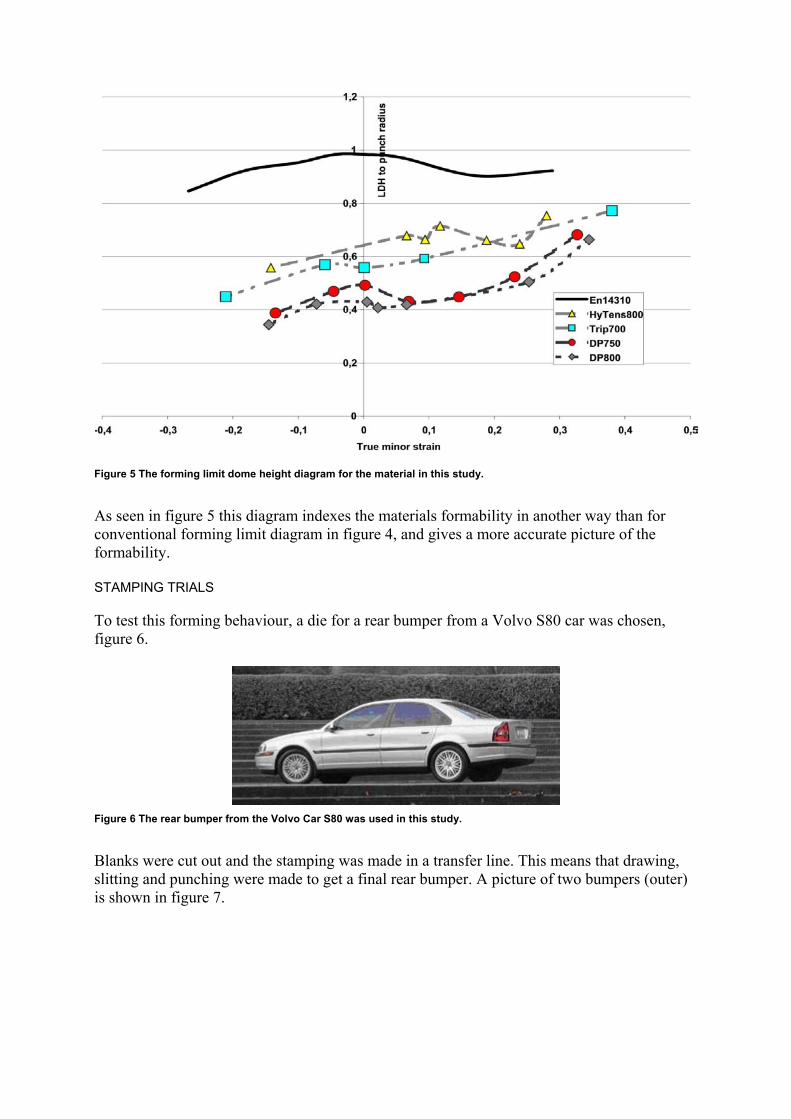
Figure 5 The forming limit dome height diagram for the material in this study.
As seen in figure 5 this diagram indexes the materials formability in another way than for conventional forming limit diagram in figure 4, and gives a more accurate picture of the formability. STAMPING TRIALS
To test this forming behaviour, a die for a rear bumper from a Volvo S80 car was chosen, figure 6.
Figure 6 The rear bumper from the Volvo Car S80 was used in this study.
Blanks were cut out and the stamping was made in a transfer line. This means that drawing, slitting and punching were made to get a final rear bumper. A picture of two bumpers (outer) is shown in figure 7.
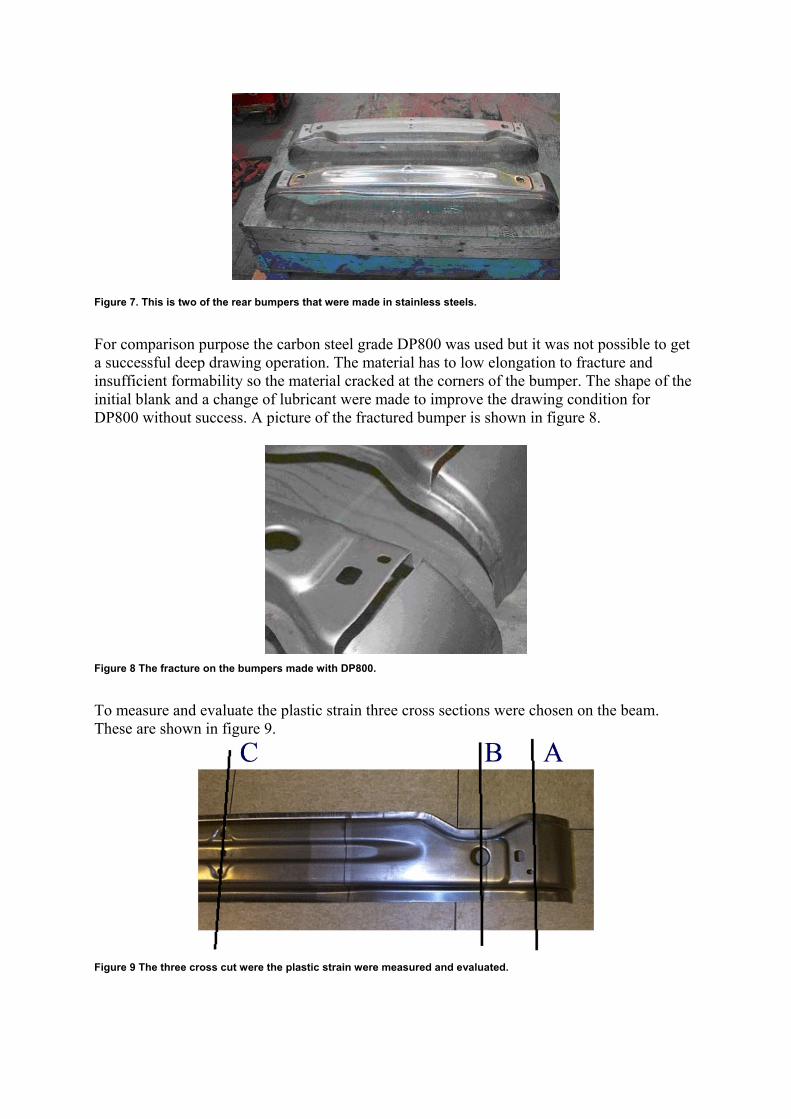
Figure 7. This is two of the rear bumpers that were made in stainless steels.
For comparison purpose the carbon steel grade DP800 was used but it was not possible to get a successful deep drawing operation. The material has to low elongation to fracture and insufficient formability so the material cracked at the corners of the bumper. The shape of the initial blank and a change of lubricant were made to improve the drawing condition for DP800 without success. A picture of the fractured bumper is shown in figure 8.
Figure 8 The fracture on the bumpers made with DP800.
To measure and evaluate the plastic strain three cross sections were chosen on the beam. These are shown in figure 9.
Figure 9 The three cross cut were the plastic strain were measured and evaluated.
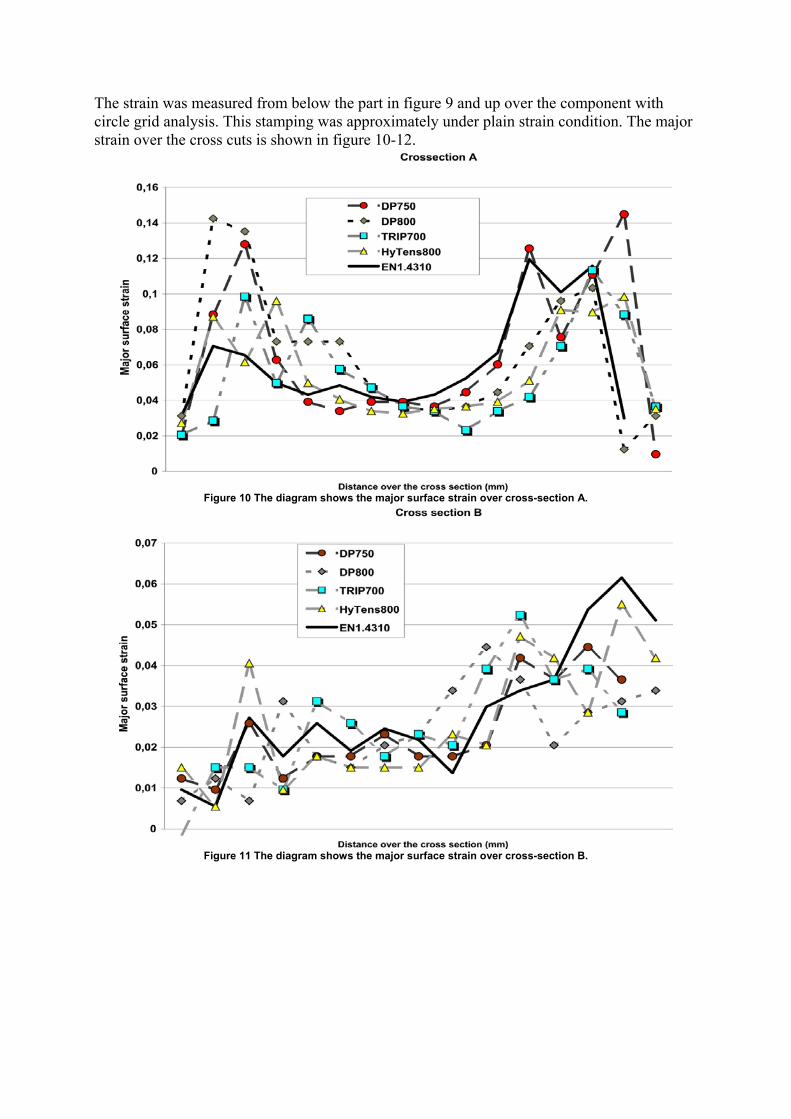
The strain was measured from below the part in figure 9 and up over the component with circle grid analysis. This stamping was approximately under plain strain condition. The major strain over the cross cuts is shown in figure 10-12.
Figure 10 The diagram shows the major surface strain over cross-section A.
Figure 11 The diagram shows the major surface strain over cross-section B.
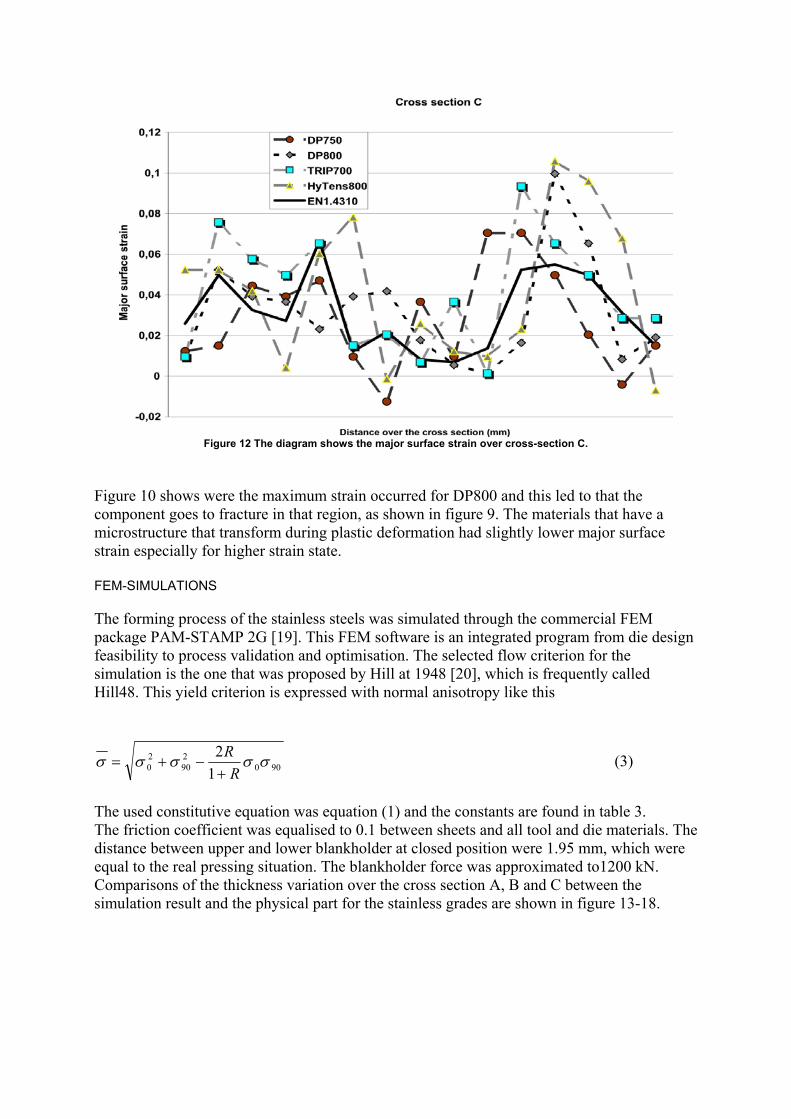
Figure 12 The diagram shows the major surface strain over cross-section C.
Figure 10 shows were the maximum strain occurred for DP800 and this led to that the component goes to fracture in that region, as shown in figure 9. The materials that have a microstructure that transform during plastic deformation had slightly lower major surface strain especially for higher strain state. FEM-SIMULATIONS
The forming process of the stainless steels was simulated through the commercial FEM package PAM-STAMP 2G [19]. This FEM software is an integrated program from die design feasibility to process validation and optimisation. The selected flow criterion for the simulation is the one that was proposed by Hill at 1948 [20], which is frequently called Hill48. This yield criterion is expressed with normal anisotropy like this
900290
20 1
2 σσσσσR
R+
−+= (3)
The used constitutive equation was equation (1) and the constants are found in table 3. The friction coefficient was equalised to 0.1 between sheets and all tool and die materials. The distance between upper and lower blankholder at closed position were 1.95 mm, which were equal to the real pressing situation. The blankholder force was approximated to1200 kN. Comparisons of the thickness variation over the cross section A, B and C between the simulation result and the physical part for the stainless grades are shown in figure 13-18.
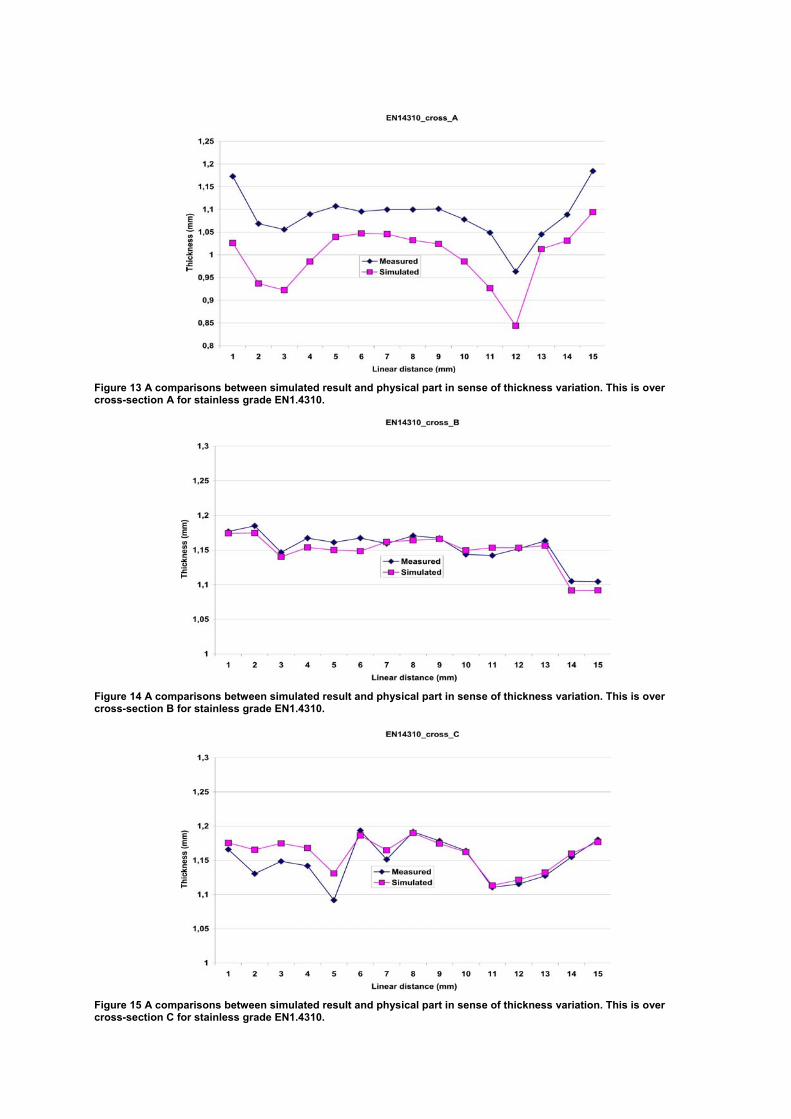
Figure 13 A comparisons between simulated result and physical part in sense of thickness variation. This is over cross-section A for stainless grade EN1.4310.
Figure 14 A comparisons between simulated result and physical part in sense of thickness variation. This is over cross-section B for stainless grade EN1.4310.
Figure 15 A comparisons between simulated result and physical part in sense of thickness variation. This is over cross-section C for stainless grade EN1.4310.
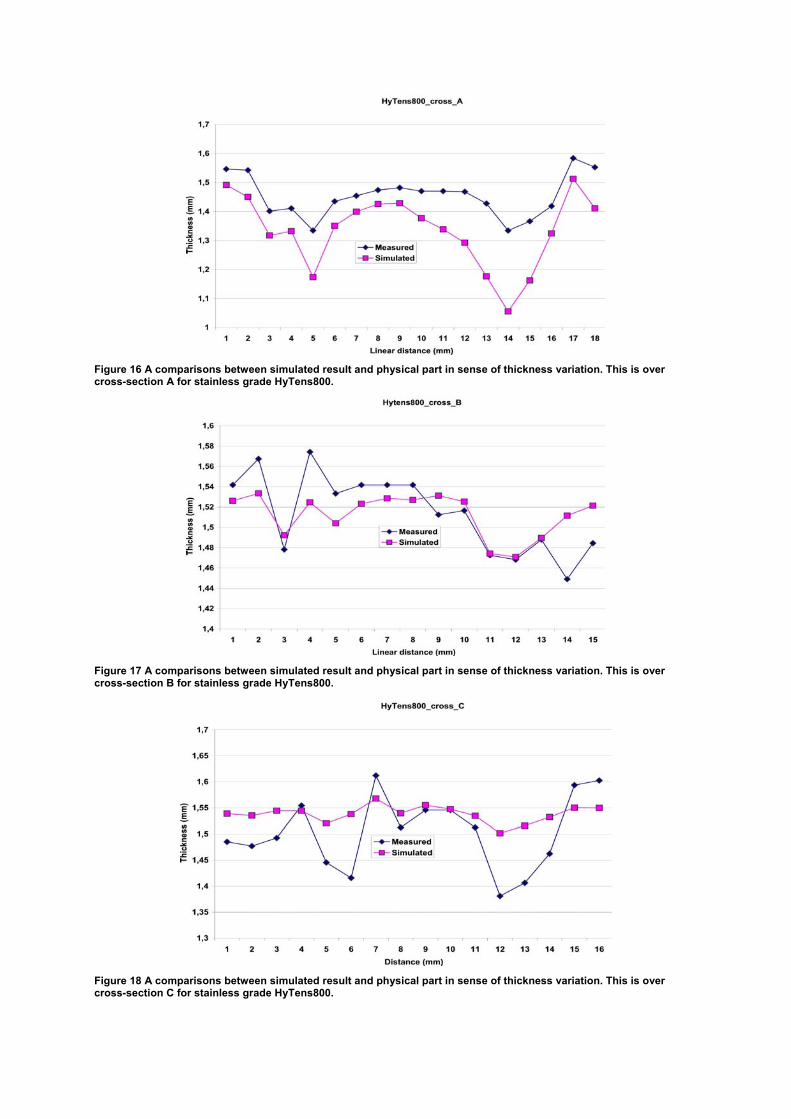
Figure 16 A comparisons between simulated result and physical part in sense of thickness variation. This is over cross-section A for stainless grade HyTens800.
Figure 17 A comparisons between simulated result and physical part in sense of thickness variation. This is over cross-section B for stainless grade HyTens800.
Figure 18 A comparisons between simulated result and physical part in sense of thickness variation. This is over cross-section C for stainless grade HyTens800.
For the stainless grade EN1.4310 the simulation result predict the shape of the thickness variation over the cross section very well. For cross-section A the true values is below the measured ones and the reason for this could be an overestimation of the friction coefficient in this region. The simulation result for the stainless grade HyTens 800 showed on larger deviation against the physical measurement then for EN1.4310 and one reason could be the starting microstructure for this grade. It actually starts with a certain amount of transformed martensite and this act as a catalyst for further transformations. QUASI-STATIC IMPACT TEST
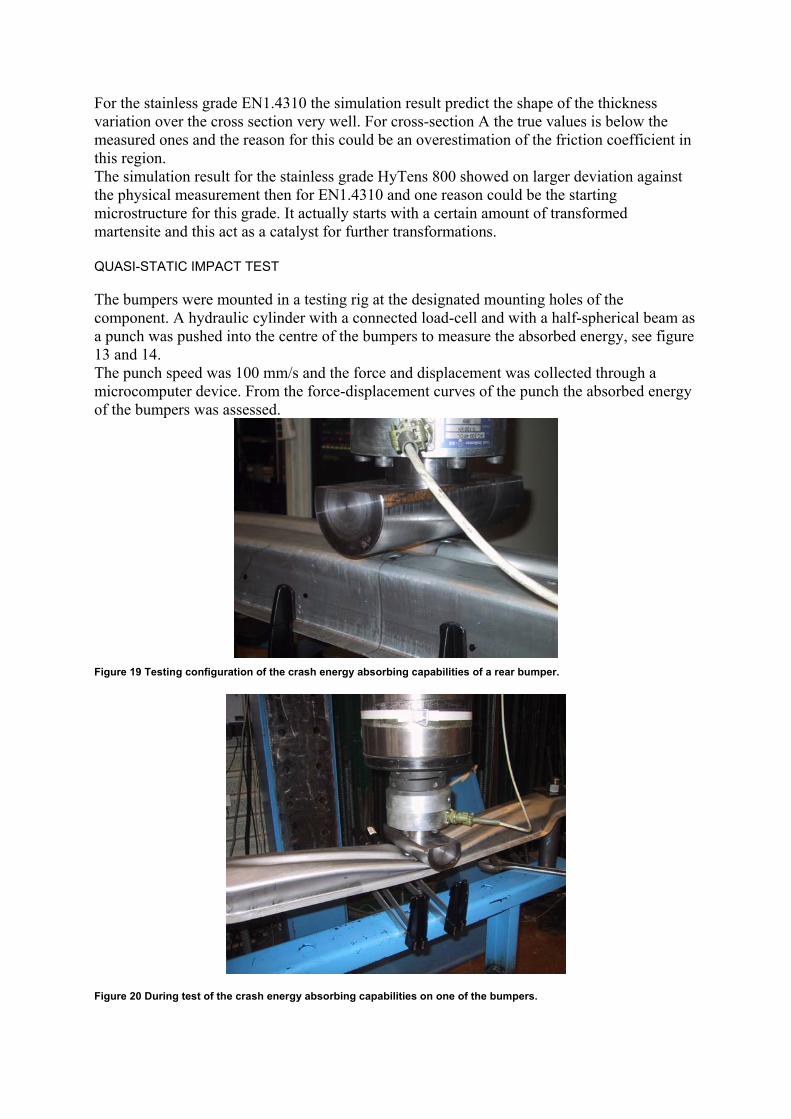
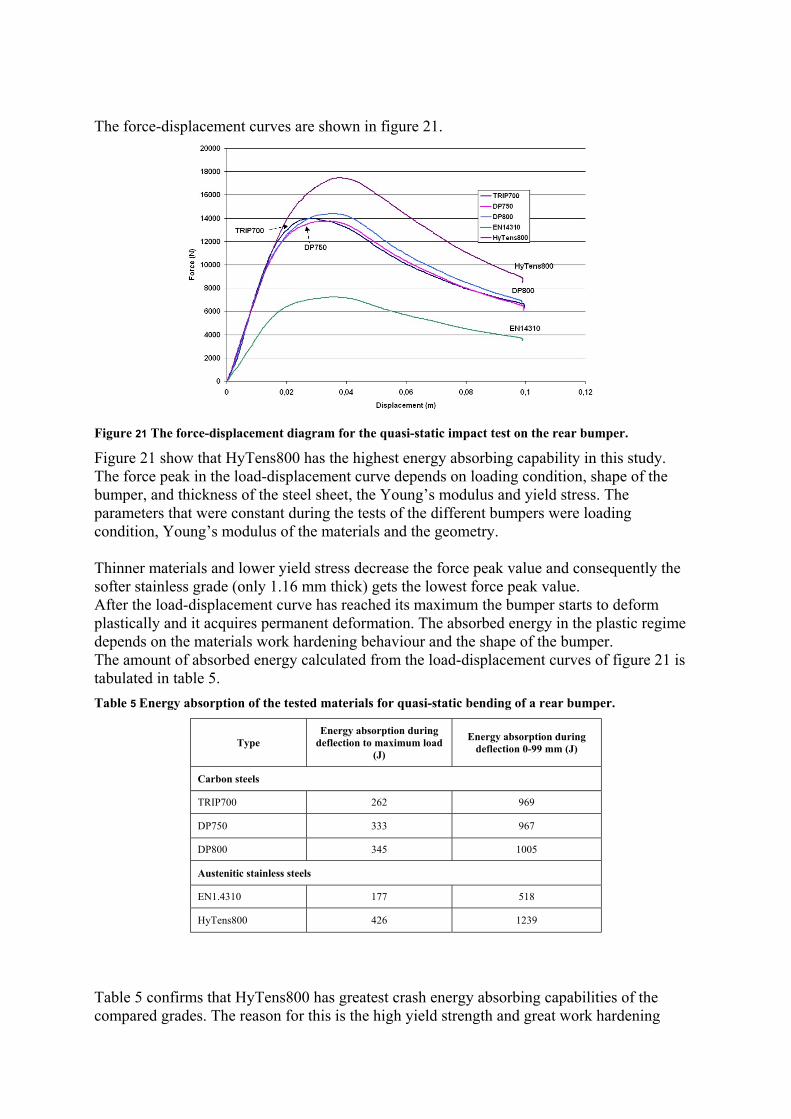
The bumpers were mounted in a testing rig at the designated mounting holes of the component. A hydraulic cylinder with a connected load-cell and with a half-spherical beam as a punch was pushed into the centre of the bumpers to measure the absorbed energy, see figure 13 and 14. The punch speed was 100 mm/s and the force and displacement was collected through a microcomputer device. From the force-displacement curves of the punch the absorbed energy of the bumpers was assessed.
Figure 19 Testing configuration of the crash energy absorbing capabilities of a rear bumper.
Figure 20 During test of the crash energy absorbing capabilities on one of the bumpers.
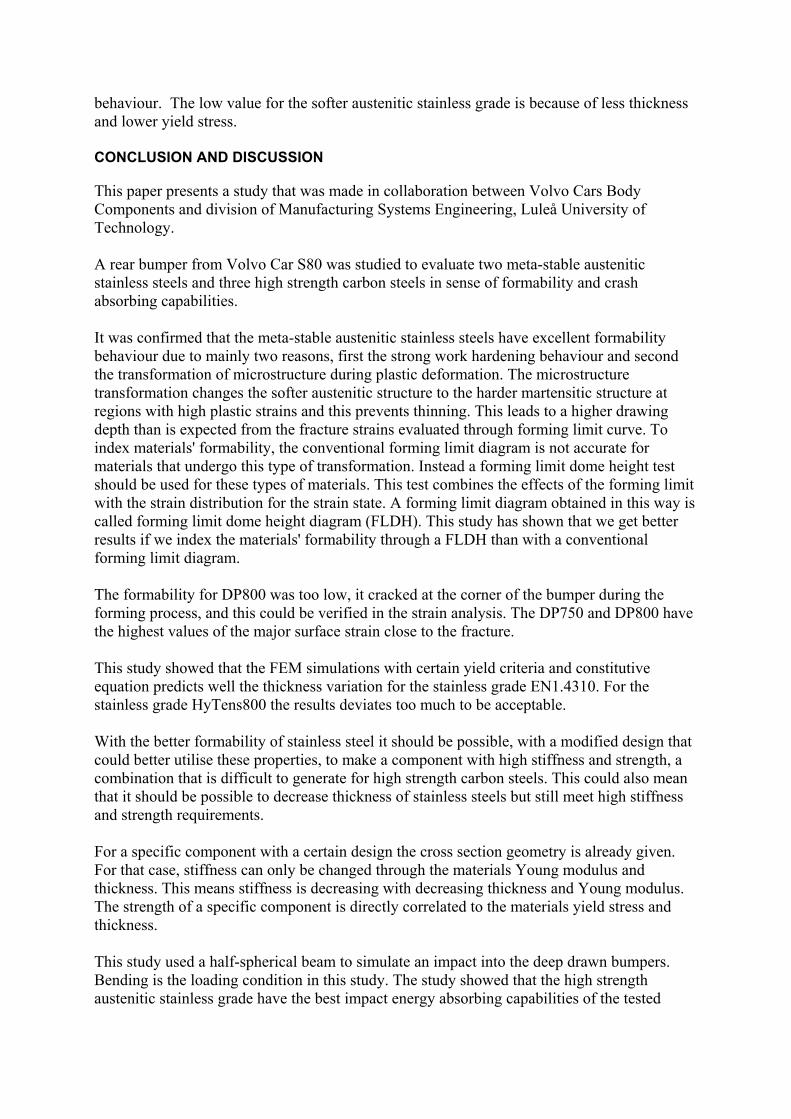
The force-displacement curves are shown in figure 21.
Figure 21 The force-displacement diagram for the quasi-static impact test on the rear bumper.
Figure 21 show that HyTens800 has the highest energy absorbing capability in this study. The force peak in the load-displacement curve depends on loading condition, shape of the bumper, and thickness of the steel sheet, the Young’s modulus and yield stress. The parameters that were constant during the tests of the different bumpers were loading condition, Young’s modulus of the materials and the geometry. Thinner materials and lower yield stress decrease the force peak value and consequently the softer stainless grade (only 1.16 mm thick) gets the lowest force peak value. After the load-displacement curve has reached its maximum the bumper starts to deform plastically and it acquires permanent deformation. The absorbed energy in the plastic regime depends on the materials work hardening behaviour and the shape of the bumper. The amount of absorbed energy calculated from the load-displacement curves of figure 21 is tabulated in table 5. Table 5 Energy absorption of the tested materials for quasi-static bending of a rear bumper.
Type Energy absorption during
deflection to maximum load (J)
Energy absorption during deflection 0-99 mm (J)
Carbon steels
TRIP700 262 969
DP750 333 967
DP800 345 1005
Austenitic stainless steels
EN1.4310 177 518
HyTens800 426 1239
Table 5 confirms that HyTens800 has greatest crash energy absorbing capabilities of the compared grades. The reason for this is the high yield strength and great work hardening
behaviour. The low value for the softer austenitic stainless grade is because of less thickness and lower yield stress. CONCLUSION AND DISCUSSION
This paper presents a study that was made in collaboration between Volvo Cars Body Components and division of Manufacturing Systems Engineering, Luleå University of Technology. A rear bumper from Volvo Car S80 was studied to evaluate two meta-stable austenitic stainless steels and three high strength carbon steels in sense of formability and crash absorbing capabilities. It was confirmed that the meta-stable austenitic stainless steels have excellent formability behaviour due to mainly two reasons, first the strong work hardening behaviour and second the transformation of microstructure during plastic deformation. The microstructure transformation changes the softer austenitic structure to the harder martensitic structure at regions with high plastic strains and this prevents thinning. This leads to a higher drawing depth than is expected from the fracture strains evaluated through forming limit curve. To index materials' formability, the conventional forming limit diagram is not accurate for materials that undergo this type of transformation. Instead a forming limit dome height test should be used for these types of materials. This test combines the effects of the forming limit with the strain distribution for the strain state. A forming limit diagram obtained in this way is called forming limit dome height diagram (FLDH). This study has shown that we get better results if we index the materials' formability through a FLDH than with a conventional forming limit diagram. The formability for DP800 was too low, it cracked at the corner of the bumper during the forming process, and this could be verified in the strain analysis. The DP750 and DP800 have the highest values of the major surface strain close to the fracture. This study showed that the FEM simulations with certain yield criteria and constitutive equation predicts well the thickness variation for the stainless grade EN1.4310. For the stainless grade HyTens800 the results deviates too much to be acceptable. With the better formability of stainless steel it should be possible, with a modified design that could better utilise these properties, to make a component with high stiffness and strength, a combination that is difficult to generate for high strength carbon steels. This could also mean that it should be possible to decrease thickness of stainless steels but still meet high stiffness and strength requirements. For a specific component with a certain design the cross section geometry is already given. For that case, stiffness can only be changed through the materials Young modulus and thickness. This means stiffness is decreasing with decreasing thickness and Young modulus. The strength of a specific component is directly correlated to the materials yield stress and thickness. This study used a half-spherical beam to simulate an impact into the deep drawn bumpers. Bending is the loading condition in this study. The study showed that the high strength austenitic stainless grade have the best impact energy absorbing capabilities of the tested

materials. The reason for this was the high yield stress combined with excellent work hardening behaviour. The variation of absorbed energy between the materials during the quasi-static point loading of the bumper was lower then in the uniaxial tensile tests. The reason for this is the shape of the tested component; absorbed energy in bending is a matter of both material and shape. If stainless steel should be a material for weight savings then it must take advantage of the better formability to make thinner components with complex cross sectional area, with the same or improved stiffness and strength. This could be a possible way for stainless steel to become a new alternative for UHSS, ultra high strength steels. ACKNOWLEDGMENTS
We want to thank: Johnny Ocklund and Arne Persson for all assistance during the pressing of the bumpers that were done at Volvo Cars Body Components manufacturing plant. Georg Danielsson at Testlab, Luleå University of Technology, Sweden for all help during the quasi-static impact tests. Per Thilderkvist at IUC, Olofström, Sweden for all helps with sheet metal preparation and strain measurement. Erik Schedin at AvestaPolarit with all help of acquisition of stainless steel sheets.
REFERENCES
1. http://www.es.anl.gov/htmls/assess.lweight.html (2002-12-03) 2. http://www.ai-online.com/ (2002-12-03) 3. http://www.daido.co.jp/english/products/applipro/auto/auto.html (2002-12-05) 4. Marsh, M. (2000) Development of AutoBody Sheet Materials for Crash Performance.
In: Proc. Of Conf. Materials and Structures for Energy Absorption, IMech, London May 9 2000.
5. Uenishi, A., Kuriyama, Y., Usuda, M. and Suehiro M. (1997) Improvements of crashworthiness by application of high strength steels for light weight auto bodies Proceedings of IBEC ´97, Auto Body Materials, Stuttgart Sept. 30 – Oct. 2 1997.
6. http://www.worldautosteel.org (2002-12-12) 7. Meyers, M. A. and Chawla, K. K. (1999) Mechanical Behaviour of Materials Upper
Saddle River, Prentice-Hall. ISBN 0-13-262817-1 8. Ashby, M. F. (2000) Materials Selection in Mechanical Design Butterworth-
Heinemann ISBN 0-7506-4357-9 9. Andersson, R., Magnusson, C. and Schedin, E. (2001) Using Stainless Steel for
Energy Absorbing Components in Automobiles Proc. Of Conf. The Second Global Symposium on Innovations in Materials Processing and Manufacturing: Sheet Materials, TMS, New Orleans February 11-15 2001. ISBN 0-87339-490-9
10. Andersson, R., Schedin, E. Magnusson, C. Ocklund, J. and Persson, A. (2002) Stainless steel components in automotives Proc. Of Conf. 4th EUROPEAN STAINLESS STEEL Science and Market Congress Cité des Sciences et de l’Industrie, La Villette, Paris June 10 – 13 2002.
11. Andersson, R., Schedin, E. Magnusson, C. Ocklund, J. and Persson, A. (2002) The applicability of stainless steels for crash absorbing components Proc. Of Conf International Body Engineering Conference & Engineering (IBEC), Paris July 8-11 2002.
12. http://www.avestapolarit.com (2002-12-13) 13. Wagoner R. H. and Chenot, J-L. (1997) Fundamentals of
Metal Forming John Wiley & Sons. ISBN 0-471-57004-4. 14. Hollomon, J.H. (1945) Trans. AIME 162, 268-274. 15. Swift, H. W. (1952) J. Mech. Phys. Solids (1), 1-25. 16. Andersson, R (1999) Effects of Composition and the Production Process on
Formability of Austenitic Stainless Steels Licentiate Thesis, Luleå University of Technology, Div. Materials Processing. ISSN: 1402-1757.
17. Sigmaplot® 4.0 for Windows, SPSS Inc 18. Mielnik, E. M. (1991) Metalworking Science and Engineering McGraw-Hill, Inc.
ISBN 0-07-041904-3. 19. http://www.esi-group.com/products/index.php (2003-02-25) 20. Hill, R (1948) A theory of the yielding and plastic flow of anisotropic metals Proc. Of
the Royal Soc. Of London, series A, 193, 281-287.