
Staff Paper - ageconsearch.umn.eduageconsearch.umn.edu/bitstream/11807/1/sp98-36.pdf · Staff Paper...
91
Staff Paper TOWARD AGRICULTURAL ENVIRONMENTAL MANAGEMENT: APPLYING LESSONS FROM CORPORATE ENVIRONMENTAL MANAGEMENT Sandra S. Batie and Agustin Arcenas Staff Paper No. 98-36 February 1998 Department of Agricultural Economics MICHIGAN STATE UNIVERSITY East Lansing, Michigan 48824 MSU is an Affirmative Action/Equal Opportunity Institution
Transcript of Staff Paper - ageconsearch.umn.eduageconsearch.umn.edu/bitstream/11807/1/sp98-36.pdf · Staff Paper...
Staff Paper
TOWARD AGRICULTURAL ENVIRONMENTALMANAGEMENT: APPLYING LESSONS FROM
CORPORATE ENVIRONMENTAL MANAGEMENT
Sandra S. Batie and Agustin Arcenas
Staff Paper No. 98-36 February 1998
Department of Agricultural EconomicsMICHIGAN STATE UNIVERSITY
East Lansing, Michigan 48824
MSU is an Affirmative Action/Equal Opportunity Institution
Copyright © 1998 by Sandra S. Batie and Agustin Arcenas . All rights reserved. Readers may makeverbatim copies of this document for non-commercial purposes by any means, provided that this copyrightnotice appears on all such copies.
Toward Agricultural Environmental Management:Applying Lessons From Corporate Environmental Management
Sandra S. Batie and Agustin [email protected]
91 pages

Toward Agricultural Environmental Management:Applying Lessons From Corporate Environmental Management*
Sandra S. Batie and Agustin Arcenas**
February 1998
* This staff paper draws heavily on the Final Report submitted in fulfillment of USDA, NRCS CooperativeAgreement, NRCS-68-3A75-6-33 formerly SCS68-3A75-4-205 by the same authors.
** Sandra S. Batie is the Elton R. Smith Professor in Food and Agricultural Policy, Department ofAgricultural Economics, Michigan State University, East Lansing, Michigan. Agustin Arcenas is aGraduate Research Assistant, Department of Agricultural Economics, Michigan State University, EastLansing, Michigan.
iv
Table of Contents
Executive Summary . . . . . . . . . . . . . . . . . . . . . . . . . . . . . . . . . . . . . . . . . . . . . . . . . . . . . . . . . . . . . . . . . . 1
Section I. Introduction . . . . . . . . . . . . . . . . . . . . . . . . . . . . . . . . . . . . . . . . . . . . . . . . . . . . . . . . . . . . . . . . 5
Section II. Lessons from the Experiences of Point Source Pollution Policy . . . . . . . . . . . . . . . . . . . . . . 8Criticisms of “Command and Control . . . . . . . . . . . . . . . . . . . . . . . . . . . . . . . . . . . . . . . . . . . . . . . . . 8Partnerships . . . . . . . . . . . . . . . . . . . . . . . . . . . . . . . . . . . . . . . . . . . . . . . . . . . . . . . . . . . . . . . . . . 10Business-led, Environmental Management . . . . . . . . . . . . . . . . . . . . . . . . . . . . . . . . . . . . . . . . . . . . 12
Private Codes and Ecolabeling . . . . . . . . . . . . . . . . . . . . . . . . . . . . . . . . . . . . . . . . . . . . . . . 15Lessons . . . . . . . . . . . . . . . . . . . . . . . . . . . . . . . . . . . . . . . . . . . . . . . . . . . . . . . . . . . . . . . . . . . . . 19
Section III. Applying the Corporate Environmental Management Lessons toAgricultural Environmental Management . . . . . . . . . . . . . . . . . . . . . . . . . . . . . . . . . . . . . . . . . . 21Farm Environmental Management Systems . . . . . . . . . . . . . . . . . . . . . . . . . . . . . . . . . . . . . . . . . . . 22
The Environmental Audit . . . . . . . . . . . . . . . . . . . . . . . . . . . . . . . . . . . . . . . . . . . . . . . . . . . 25Whole Farm Planning . . . . . . . . . . . . . . . . . . . . . . . . . . . . . . . . . . . . . . . . . . . . . . . . . . . . . 28Quality Control Indicators . . . . . . . . . . . . . . . . . . . . . . . . . . . . . . . . . . . . . . . . . . . . . . . . . . 30Documentation, Verification, and Enforcement . . . . . . . . . . . . . . . . . . . . . . . . . . . . . . . . . . 37
Section IV. Applying the Corporate Environmental Management Lessons to Agro-pollution Policy . . . . . . . . . . . . . . . . . . . . . . . . . . . . . . . . . . . . . . . . . . . . . . . . . . . . . . . . 40Policy to Encourage Agricultural Environmental Management . . . . . . . . . . . . . . . . . . . . . . . . . . . . . . 40
Objectives . . . . . . . . . . . . . . . . . . . . . . . . . . . . . . . . . . . . . . . . . . . . . . . . . . . . . . . . . . . . . 42Targeting . . . . . . . . . . . . . . . . . . . . . . . . . . . . . . . . . . . . . . . . . . . . . . . . . . . . . . . . . . . . . . 48Flexible Incentives . . . . . . . . . . . . . . . . . . . . . . . . . . . . . . . . . . . . . . . . . . . . . . . . . . . . . . . 51Tailoring . . . . . . . . . . . . . . . . . . . . . . . . . . . . . . . . . . . . . . . . . . . . . . . . . . . . . . . . . . . . . . . 56Monitoring, Evaluation, and Enforcement . . . . . . . . . . . . . . . . . . . . . . . . . . . . . . . . . . . . . . . 57
The Challenge . . . . . . . . . . . . . . . . . . . . . . . . . . . . . . . . . . . . . . . . . . . . . . . . . . . . . . . . . . . . . . . . 59The California Egg Quality Assurance Plan . . . . . . . . . . . . . . . . . . . . . . . . . . . . . . . . . . . . . 60The National Pork Producers Council’s Environmental Assurance Program . . . . . . . . . . . . . . 62
Section V. Summary and Conclusions . . . . . . . . . . . . . . . . . . . . . . . . . . . . . . . . . . . . . . . . . . . . . . . . . . 64
References . . . . . . . . . . . . . . . . . . . . . . . . . . . . . . . . . . . . . . . . . . . . . . . . . . . . . . . . . . . . . . . . . . . . . . . . 66
Appendix AInformation Requirements for Environmental Audits . . . . . . . . . . . . . . . . . . . . . . . . . . . . . . . . 73
Appendix BFactors Used in the PLANETOR Program . . . . . . . . . . . . . . . . . . . . . . . . . . . . . . . . . . . . . . . . . 74

v
List of Figures
Figure 1. Key Performance Areas for Corporate Environmental Management . . . . . . . . . . . . . . . . . . . . . . . . 16Figure 2. Key Performance Areas for Agricultural Environmental Management . . . . . . . . . . . . . . . . . . . . . . 26Figure 3. Changes in Soil Quality Affect Water Quality . . . . . . . . . . . . . . . . . . . . . . . . . . . . . . . . . . . . . . . . . 32Figure 4. Using Soil Quality Control Indicators . . . . . . . . . . . . . . . . . . . . . . . . . . . . . . . . . . . . . . . . . . . . . . . 34Figure 5. Mixed Policy Strategy With Threshold Performance Standards . . . . . . . . . . . . . . . . . . . . . . . . . . . . 55

vi
List of Tables
Table A. A Farm’s and a Firm’s Environmental Management Systems (EMS) . . . . . . . . . . . . . . . . . . . . . . . . . 3Table 1. Differences Between Regulation and Private Codes . . . . . . . . . . . . . . . . . . . . . . . . . . . . . . . . . . . . 18Table 2. A Farm’s and a Firm’s Environmental Management Systems (EMS) . . . . . . . . . . . . . . . . . . . . . . . . 23

vii
List of Textboxes
Textbox 1. Command and Control Strategies . . . . . . . . . . . . . . . . . . . . . . . . . . . . . . . . . . . . . . . . . . . . . . . . . 9Textbox 2. Expert-based Models: PLANETOR . . . . . . . . . . . . . . . . . . . . . . . . . . . . . . . . . . . . . . . . . . . . . . 36Textbox 3. Soil and Water Assessment Tool (SWAT) . . . . . . . . . . . . . . . . . . . . . . . . . . . . . . . . . . . . . . . . . 38Textbox 4. Eco-based Management . . . . . . . . . . . . . . . . . . . . . . . . . . . . . . . . . . . . . . . . . . . . . . . . . . . . . . . 43Textbox 5. Performance Standards: The Clean Water Act and the Coastal Zone Management Act
. . . . . . . . . . . . . . . . . . . . . . . . . . . . . . . . . . . . . . . . . . . . . . . . . . . . . . . . . . . . . . . . . . . . . . . . . . . 44Textbox 6. Right-to-Farm Legislation and Use of Threshold Performance Standards . . . . . . . . . . . . . . . . . . . . 56
1Some of this Executive Summary draws from Batie and Ervin (1997b).
1
Executive Summary1
Many business firms both in the U.S. and abroad are practicing corporate environmental management.
They are committed to improving the efficiency of material use, energy use and water use; to recycle; to make
safer products and processes and to reduce their overall impact on the environment.
In pursuing corporate environmental management, some businesses have found that the presumed
tradeoff between profits and environmental quality does not always apply. Instead, by innovating and redesigning
their products, processes, corporate culture, and organizational strategy, these firms have been able to improve
environmental performance and add to profits. These improved profits are sometimes referred to as “innovation
offsets” because they result from technological changes to reduce pollution which also reduce production costs
(and/or improve productivity) and thereby “offset” the costs of compliance. The necessary technological
innovation is pursued when firms take a dynamic investment perspective rather than presume a static tradeoff
between profits and environmental quality.
Many of these businesses are motivated by a variety of factors such as liability concerns, public image,
cost-savings, consumer demands, pressure group demands, and/or the desire to reduce uncertainty. Businesses so
motivated examine their whole production and distribution system with environmental audits, and they engage in
strategies to increase resource productivity, to reduce material requirements, to recycle, and to “mine” their
wastes for valuable products (Ayers and Ayers). Indeed, such environmental auditing and system redesign is
now so common that it has its own field of investigation--industrial ecology--that focuses on resource
productivity, materials cycle optimization, and waste minimization.
There are important relationships between environmental regulation and business environmental
performance. The first relationship to be understood is that, unless there are viable and robust markets for “green
products” (e.g., “pesticide-free” baby food or “dolphin-safe” tuna), then regulations, or liability, or the threat of
regulations and liability, are necessary to motivate companies to pursue environmental management. The second
2
relationship to be understood is that regulations have the potential to be cost-effective if they are flexible and
performance-based. That is, they need to specify what needs to be accomplished as measured by environmental
outcomes, but should not dictate how these outcomes are to be achieved if they are to be cost-effective (Russell
and Powell, 1996). Ideally, it should be clear that (a) the “polluting firm” does not have the right to pollute, (b)
there are clear, certain, enforceable performance standards, and that (c) the firm is free to select which
technologies or firm practices will be used to achieve those standards. Obviously, monitoring of outcomes and
accountability for failure to reach performance standards is an important feature of a flexible pollution prevention
policy.
Can the lessons from corporate environmental management be applied to agro-environmental problems?
Is there a role for flexible policy undergirded by performance standards in agriculture? Will farm-level innovation
offsets be achieved? The answer appears to be yes to all these questions, although there are gaps in information
necessary for ideal agro-environmental policy design and for agricultural efforts.
Fortunately, the dynamic to fill these information gaps is created by the very agro-environmental policies
that set clear environmental objectives and that grant flexibility to producers to meet these objectives. These
same policies will create a demand for the necessary management skills to operate dynamic and integrated
systems in decentralized markets and will stimulate research and technology development for environmental public
goods. Implementation of a flexible agro-environmental policy may be hampered by information and management
skill gaps. As a result, some proxies may need to be used for exact performance standards (e.g., phosphorous
saturation levels in soil in lieu of ambient water quality standards) until information gaps are closed. Nevertheless,
there appears to be considerable merit in designing a flexible environmental policy to encourage environmental
management. Such encouragement can include public, provision of research, technology, subsidies, education, and
technical assistance to improve management skills, to lessen the transition costs to new systems, and to accelerate
their adoption.
3
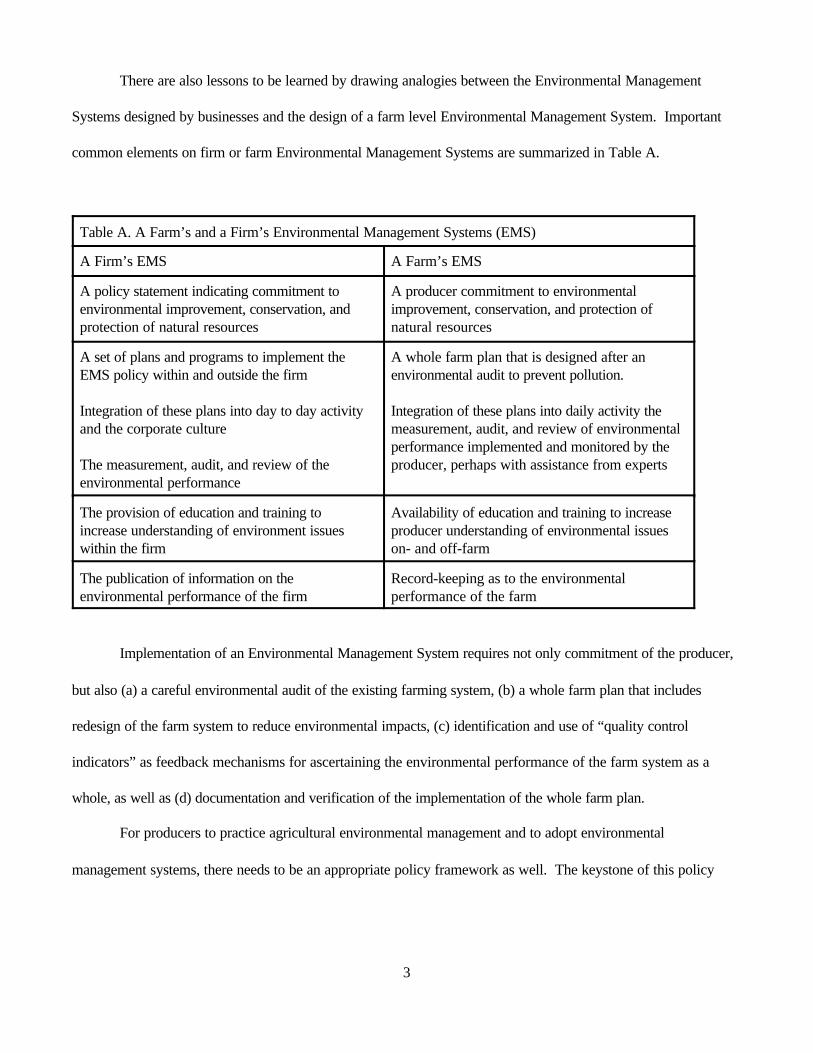
There are also lessons to be learned by drawing analogies between the Environmental Management
Systems designed by businesses and the design of a farm level Environmental Management System. Important
common elements on firm or farm Environmental Management Systems are summarized in Table A.
Table A. A Farm’s and a Firm’s Environmental Management Systems (EMS)
A Firm’s EMS A Farm’s EMS
A policy statement indicating commitment toenvironmental improvement, conservation, andprotection of natural resources
A producer commitment to environmentalimprovement, conservation, and protection ofnatural resources
A set of plans and programs to implement theEMS policy within and outside the firm
Integration of these plans into day to day activityand the corporate culture
The measurement, audit, and review of theenvironmental performance
A whole farm plan that is designed after anenvironmental audit to prevent pollution.
Integration of these plans into daily activity themeasurement, audit, and review of environmentalperformance implemented and monitored by theproducer, perhaps with assistance from experts
The provision of education and training toincrease understanding of environment issueswithin the firm
Availability of education and training to increaseproducer understanding of environmental issueson- and off-farm
The publication of information on theenvironmental performance of the firm
Record-keeping as to the environmentalperformance of the farm
Implementation of an Environmental Management System requires not only commitment of the producer,
but also (a) a careful environmental audit of the existing farming system, (b) a whole farm plan that includes
redesign of the farm system to reduce environmental impacts, (c) identification and use of “quality control
indicators” as feedback mechanisms for ascertaining the environmental performance of the farm system as a
whole, as well as (d) documentation and verification of the implementation of the whole farm plan.
For producers to practice agricultural environmental management and to adopt environmental
management systems, there needs to be an appropriate policy framework as well. The keystone of this policy
4
framework is the setting of clear, specific, measurable and enforceable performance standards. Such a policy
framework would be a change from past agro-environmental policy.
Unfortunately, performance standards are difficult to apply to agro-environmental problems. One reason
is there is a lack of clearly distinguished environmental objectives whose achievements can be linked to the
reduction of certain farm-source pollutants. Overcoming this missing component will require a political consensus
as to desired objectives. Another reason that performance standards are difficult to apply is a paucity of scientific
knowledge necessary to link farm-source pollutants to water quality and to the environmental objective.
Not surprisingly, at this early date in agro-environmental policy, there are not many existing examples of
farmer-led environmental management with all these components. After all, agro-environmental policy addressing
nonpoint pollution is relatively new and many difficulties remain stemming from lack of appropriate information.
Nevertheless, there are examples of both use of performance standards for agro-environmental problems and
farmer-led environmental management. An example of the former can be found in Florida’s legislation
influencing phosphorous pollution from dairy farms in the Lake Okeechobee. An example of the latter is the
California Egg Quality Assurance Program.
While much remains to be done to design and implement a necessary policy context and provide
appropriate information, and while such tasks involve many players the pursuit of agricultural environmental
management appears to be a promising approach to achieving agro-environmental goals, there is a pivotal role that
can be served by the Natural Resources Conservation Service (NRCS) of the United States Department of
Agriculture. Not only can NRCS provide leadership, assistance, and information to accelerate agricultural
environmental management, the NRCS can use the concept of agricultural environmental management to
prioritize its own efforts and to serve as a catalyst for others’ actions.
5
Section I. Introduction
Historically, U.S. federal efforts to prevent environmental degradation have focused on “point” sources of
pollution such as sewage treatment plants and factories. In recent years, however, there has been a shift in
federal policy toward the problem of nonpoint source pollution management. This shift reflects a recognition that
the desired pollution control will not be achieved if environmental management relies only on the control of the
point sources of environmental degradation.
Agriculture is the primary source of nonpoint source pollution in the nation. There is evidence that fifty to
seventy percent of water quality is affected by agro-environmental pollution (Shortle and Dunn, 1986). Nutrients
(e.g., nitrogen and phosphorous) and sediments--major pollutants associated with agricultural production--account
for the serious contamination of thirteen percent of rivers, and fifty-nine percent of lakes in the United States in
the last decade (Smith, et. al., 1987). There is also increasing concern about potential human pathogens from
animal manure pollution.
However, generalization about the nature, magnitude, and location of major agricultural nonpoint sources
is difficult. Agro-environmental problems are diverse, in part because U.S. agriculture is diverse. Agriculture
includes field crops, forages, livestock, vegetables, and fruit. The topography of the land varies from hilly to flat,
from upland to flood prone, from arid to humid, and from erosive to non-erosive. Management practices used to
produce commodities vary as well--from dryland to irrigated, from monocultures to rotations, from confined
livestock to free-range production, from single cropping to multiple cropping, from high chemical usage to organic,
and from precision technology to traditional technologies. It is no surprise, therefore, that agricultural pollutants
vary in their characteristics and their environmental impact according to locational, climatic, commodity, and
management factors. As a result, any damage from these agro-pollutants to the environment also vary with time
and with location, making assessments and solutions more complicated.
In the past, the principal approach in the reduction of agricultural pollution in the United States has
primarily been one of voluntary, case-by-case, adoption of conserving practices. Past policies have relied on
6
education, as well as on technical and financial assistance to encourage adoption of best management practices
and to compensate for land retirement (Batie and Ervin, 1997). Yet, it is increasingly recognized that this
voluntary approach, at least as applied in the past, has not achieved the desired level of nonpoint pollution
prevention or control (Batie and Ervin, 1997; National Research Council, 1993).
Thus, there is interest in identifying more effective agro-environmental policies. However, the diversity
found in agriculture means that a “one size fits all” agro-environmental policy will not be successful. Furthermore,
the regulatory--command and control policies used in point pollution are less likely to provide the model for future
agro-environmental nonpoint policies. Traditional command and control regulations are increasingly viewed as
outmoded; explorations are underway at the local, state and federal levels to design lower cost, more flexible
environmental policies for both point and nonpoint sources. Governments and firms are increasingly dissatisfied
with controlling pollution; more attention is directed at preventing pollution--by encouraging technological
innovations and redesigning product processes (Andrews, 1994).
Even if regulatory point source policy were viewed as the appropriate model for agro-environmental
pollution, there are reasons to believe it would not apply well to nonpoint sources. The rather predictable
characteristics of various industrial point source pollutant sources have made uniform regulation of polluters a
feasible strategy in reducing point pollution. In contrast, because nonpoint source pollution manifests itself
primarily in water and soil quality changes as a result of the dispersed emission of pollutants from various sources,
it is far less predictable, and it is inconsistent in it’s characteristics.
The policy challenge then is to devise an agro-environmental management strategy that addresses the
characteristics of diffused agro-pollutants, while possessing the efficacy of some point source pollution regulation,
but which embodies more flexible, lower-cost incentive-based approaches. This assignment is not an easy task,
but the body of knowledge with respect to agricultural nonpoint pollution is growing. In addition, lessons can be
drawn from point source pollution policy that can improve the design of nonpoint agro-environmental pollution
policy. It is now possible to garner insight into the criteria for and characteristics of an effective agro-
7
environmental pollution policy. These insights depend on understanding the unique characteristic of agro-
environmental pollution and the implications of these characteristics for agro-environmental policy design.
This report is organized in five sections. Section I is this introduction. Section II draws lessons for
nonpoint source, agro-environmental policy from the experiences of point source pollution policy. In this
exploration, the section notes the movement away from traditional regulatory approaches (i.e., so-called
“command and control” regulation) to more agency-business partnerships and to corporate environmental
management. Section III takes one of the lessons, the increase in corporate environmental management and
explores its agricultural “analog,” that is, agricultural environmental management. This section assumes,
counterfactually, that there are adequate policy incentives for agricultural environmental management. Section
IV, then, takes the lessons from the other section’s analysis and uses them to define the characteristics of
effective agro-environmental nonpoint policy that will result in agricultural environmental management within the
section. The California Egg Assurance Plan, is used to illustrate necessary components for farmer-led programs
to emerge and be cost-effective. Section V concludes with a summary and implications for state and federal
policies.
2This section is adapted from Batie, 1997.
8
Section II. Lessons from the Experiences of Point Source Pollution Policy2
There are important lessons to be drawn for nonpoint source, agro-environmental policy from point source
policy. Point source pollution policy appears to be undergoing a significant evolution, moving--albeit slowly--from
so-called “command and control” direct regulation to more flexible, cost-effective strategies. Policy also appears
to be changing--albeit modestly--from top-down regulatory approaches to more partnerships of business, citizens,
and agencies and more corporate environmental management (Andrews, 1994; Batie, 1997; Porter and van der
Linde, 1995a and 1995b).
Criticisms of “Command and Control”
Since the 1960s, federal legislation has been enacted which addresses nearly every aspect of the
environment from air pollution, hazardous waste management and pesticide use to wildlife protection. It is
common to characterize much of the traditional federal point-source pollution regulation as “command-and-
control” legislation, by which is meant top-down inflexible regulation that specifies both the actions to be taken and
the outcome to be achieved. (As Textbox 1 explains, the name “command and control” is a misleading term to
describe such legislation, although the use of the term is convenient and widely used.)
Despite broad recognition that federal environmental legislation has resulted in significantly cleaner air and
water, there has been criticism of it from many quarters. Many businesses complain that it can be stupefyingly
complex and sometimes contradictory, with single pollutants being addressed through many different statutes and
fragmented agencies. The end result is potentially inconsistent government regulation of a firm’s behavior,
accompanied by expensive and irritating bureaucratic compliance costs, in addition to actual pollution prevention or
cleanup costs.
National laws and regulations are frequently viewed by the regulated as inflexible and intolerant of less
expensive, creative ways to achieve compliance. Arguments are made, but often ignored, for the use of a

9
Characterizing traditional federal environmental laws as “command and control” is actually misleading for thefollowing reasons. First, federal legislation rarely states both the specific, quantified goals to be achieved andthe methods by which to obtain them. Rather, federal environmental law has created a hodgepodge offragmented, uncoordinated rules, goals, required technologies, and procedural requirements administeredthrough multiple agencies. Second, federal environmental legislation uses a one-by-one medium approach (air,water, solid waste, wilderness, endangered species) with little reflection on the interconnected, holistic nature ofecosystems; overlapping legislation and jurisdictions; or the possible impacts on business costs or economicperformance. Third, federal laws provide considerable flexibility for states to implement their own land use, airand water quality plans. For example, while states must meet and enforce minimum ambient air and waterquality standards, they have considerable latitude in the design of permits. Cross-state comparisons revealconsiderable differences in the required conditions for compliance, monitoring, and enforcement. See Russelland Powell (1996) for a more detailed discussion of these points.
Textbox 1. Command and Control Strategies
broader set of policy tools, including more reliance on economic incentives. Businesses complain that
environmental
groups have free recourse to the courts if they are dissatisfied with a firm’s compliance, even if regulatory
agencies are not. Many businesses want more economic benefit-cost analysis of proposed regulations as well as
greater compliance flexibility, but some opposition groups are fearful that benefit-cost analysis will be biased
toward protecting the status quo. That is, some opposition groups fear that the greater flexibility will equate with
more non-compliance. Considerable time and money is expended in controversies.
Diversity in implementation requirements among states also means that companies engaged in interstate
commerce must face numerous state regulations rather than just one federal Environmental Protection Agency
(EPA) authority. Some environmentalists believe such diversity has allowed some states to avoid the legislative
intent through lax enforcement. Criticism from all sides is that federal environmental legislation is not based on
actual risks. Instead, critics assert the legislation is focused too narrowly on minute cancer risks to adult human
health. Environmentalists want to see legislation better encompass broad risks such as children’s health, or
10
enhanced water quality for recreation, wildlife protection, and ecosystem resilience. Finally, many believe that
current policies rely too heavily on pollution cleanup rather than on its prevention. Few are satisfied with the
status quo in point pollution policy.
These criticisms do not equate, however, with a public desire to retreat from environmental goals. It is
clear that the public does not want to roll back the improvements in environmental quality achieved over the last
two decades (Batie and Ervin, 1997). Indeed, public opinion polls show a clear majority prefers existing or higher
standards for drinking water quality, wetlands conversion, and endangered species protection (USDA, NRCS,
1995).
Partnerships
For all these reasons, changes in environmental regulatory philosophy are emerging that have great
potential impact on businesses. One author refers to these changes as “civic environmentalism,” a more bottom-
up rather than top-down approach involving cooperation and partnerships between agencies, various levels of
government, environmental advocates, and businesses (John, 1994). It’s key characteristic is that parties try to
mediate differences so that costly political and judicial confrontations can be avoided.
Indeed, there is recognition that providing more flexibility for point polluters as well as appropriate
incentives can achieve environmental goals for point source pollution at lower costs. Such recognition has led the
EPA to experiment with new programs. In contrast to “command-and-control” policies, flexible policies usually
means the specifying of what environmental objectives are to be achieved (e.g., performance standards) , but not
how these objectives are to be achieved (e.g., design standards). For example, the EPA’s 1991 Pollution
Prevention Strategy pledges the agency to work toward changing its regulatory culture and encourages voluntary
actions by industry to reduce the need for EPA to take legal action. In 1994, EPA announced the Common Sense
Initiative (CSI) to allow industries and environmental groups to explore a means of improving the current
regulations, moving away from resource specific management to sector specific management (e.g., electronics
and petroleum refining).

3See Davies and Mazurek (1997) for a discussion of these programs, their intent, and the difficulties inachieving their goals.
4Performance based regulations are also referred to as outcome based regulations.
11
The EPA’s experiment with more flexible incentive based programs, such as tradeable permits for sulfur
dioxide, has substantially reduced the costs of the acid rain program while achieving significant reductions in
emissions. The tradeable permits have allowed those firms with the lower compliance costs to reduce pollution,
thus lowering the overall costs of achieving acid rain reductions. Businesses have also been “induced” by the
tradeable permit system to innovate and experiment with new technologies and to redesign their production
processes to reduce sulfur dioxide emissions.
In addition, EPA has programs such as its 33/50 program, a voluntary pollution prevention initiative begun
in the late 1980's where industrial firms promise to reduce air emissions of 17 toxic chemicals. Another EPA
program is the recent XL project which has a facility-community focus, and encourages firms to voluntarily design
their own approaches that provide “better” results than could be achieved even under full compliance with present
laws and regulations.3
While civic environmentalism trends are evident, many of the proposed changes within EPA have met
institutional inertia. Some within the EPA do not want to reduce regulations. Also, limited progress is partially
explained by the lack of an adequate statutory base for EPA to negotiate solutions that fall outside existing
legislation; a lack of trust between regulators, businesses, and environmentalists; and the introduction of new
actors who dispute the wisdom of agreed upon actions (Davies and Mazurek, 1997). Nevertheless, the trend
toward more flexible approaches appears not to be a fad, but rather a significant change in policy approach.
The experiment with more flexible incentives and partnerships is still young, but some general conclusions
can be drawn: (1) more flexible, performance based regulations4 tend to reduce costs and stimulate the search
for least cost technology for achieving environmental standards; (2) initial estimates of the costs of regulatory
compliance are likely to be too high unless they are adjusted for induced technological innovation in pollution
prevention; (3) providing more information to polluters helps to disseminate these innovations and reduce costs;
12
and (4) “compliance-push forces, that is, regulations, and/or the threat of regulation, or “demand-pull” forces, that
is, viable consumer demands for “green products” are necessary to spur most companies into searching for cost
saving or environmental quality improving innovations (Davis and Mazurek, 1996; Palmer, Oates and Portney,
1995; Porter and van der Linde, 1995; Power and Cox, 1994).
Business-led, Environmental Management
At the same time as EPA is experimenting with more flexible, outcome-based, partnership programs,
point-source firms increasingly are engaged in what some refer to as “business-led environmental management,”
and others refer to as “corporate, self-regulation;” “total quality environmental management;” or, “corporate
environmental management.” These firms are proactively integrating pollution prevention into their firm’s
systems, strategies and cultures. This trend appears to be driven by existing or anticipated legislation
(“compliance-push”) as well as consumer demands (“demand-pull”). To understand why corporate, self
regulation is emerging now, it is helpful to briefly examine the trend in an historical context--starting in the 1960s
and ending with the present.
Starting in the 1960s, businesses increasingly found themselves in a reactive, defensive position about
environmental issues. The initial reactions of business tended to be almost entirely defensive installation of
pollution control devices. Environmental management was generally thought to be a minor and irritating part of
the corporate structure, with managers’ positions often held by people untrained in the subject matter and at the
end of their business careers.
Andre Krol (1995) of the Technology Center of the University of Queensland in Australia terms this
phase as “first generation environmental management,” where regulatory compliance is minimal, resisted, and
considered an overhead cost. The reason for this mentality lay in the perception that there was always a tradeoff
between profits and environmental quality. Over time, some firms, particularly global ones, decided that a better
approach than minimal compliance was needed to offset the alleged lack of environmental sensitivity and their
own high compliance costs.
13
One of the first to adopt a new approach was the 3M Corporation, formerly Minnesota Mining and
Manufacturing Company. Because of its high use of toxic solvents and chemicals, 3M was subject to much
environmental regulation. Their initial response had been “first generation environmental management”; that is,
resistance to environmental regulation. By 1975, however, 3M decided to change its approach to environmental
acceptance, and they developed the 3P Program, “Pollution Prevention Pays.” The 3P program objective was to
reduce compliance costs and enhance the company’s public image. Their initial rationale apparently was that with
less pollution there would be less to regulate. Avoiding regulation was seen as beneficial because it gave 3M a
competitive edge over their more regulated competitors, since they would have less concern with variation in
environmental rules in the U.S. and abroad. Furthermore, they could minimize their public relations costs. As part
of the 3P program, the company adopted an environmental policy that pledged to: solve environmental pollution
problems, prevent pollution at its source; develop products with a minimum impact on the environment; conserve
natural resources through recycling and reclamation; assure that the company facilities and products meet the
regulations of all federal, state and local environmental agencies; and assist any and all official agencies and
organizations engaged in environmental activities.
By asking their managers to solve their own environmental problems, 3M embarked on Krol’s second and
third generation of environmental management. In the second generation, firms still have a limited approach,
viewing compliance as a necessary cost. However, they begin to build relationships with regulators, and start to
analyze the firm’s total processes with respect to the environment. In the third generation, environmental
management becomes an essential competitive aspect of a company’s strategic approach, resonating with
consumer-oriented concerns about quality and community, and integrating environmental sensitivity at all stages of
the business. In the third generation of environmental management, pollution is seen as a flaw in either product
design or production processes, with less focus on pollution abatement and more on system redesign for pollution
prevention. Partnerships with regulators are common (Sullivan, 1992).
14
What 3M learned through its 3P effort was that the presumed tradeoff model of profits versus
environmental quality did not always apply. Instead, by innovating and redesigning their products, processes,
corporate culture, and organizational strategy, the firm was able to improve environmental performance and often
add to profits. The improved profits in response to the pursuit of improved environmental performance is
sometimes referred to as “innovation offsets”; that is, technological changes induced by the desire to reduce
pollution also reduce production costs or improve productivity and thereby “offset” the costs of compliance.
3M saved millions of dollars with their 3P pledges, gained control over some of their management costs,
and improved their credibility with the general public, environmentalists, and regulators (Ayers and Ayers, 1996).
Nevertheless, by virtue of the product they produce, not all pollution problems have yet been solved, and the
company still remains highly regulated.
Stories similar to 3M’s are numerous, particularly regarding the larger, more visible businesses such as
Proctor and Gamble, AT&T, Volvo, and S.C. Johnson Wax. For example, Dupont and Dow Chemical, major
producers of agricultural inputs, have both developed programs similar to 3M’s (Tebo and Rittenhouse, 1997;
Hoffman, 1997). DuPont’s new “Safety, Health and Environment” program goals include eliminating all injuries,
illnesses, incidents, waste and emissions. Progress toward these goals are both measured and published, and the
philosophy behind the program is integrated through all the DuPont processes. DuPont found they can reduce the
cost of operation by reducing pollution and waste, and they can increase revenues by selling more product (Tebo
and Rittenhouse, 1997).
Like DuPont, many business firms no longer think of regulatory compliance as an overhead cost, but are
viewing environmental management as an essential component of their company’s strategic approach. In the
process of pursuing corporate environmental management, some (but not all) firms are finding they do not have to
give up profits to obtain environmental quality. By redesigning their production processes and considering the
whole firm as a system, they have been able to improve environmental performance and even add to profits
5There is considerable controversy, particularly among economists, about the profitability of pollutionprevention strategies. It appears, however, that not all actions that could abate pollution at a profit have beenexploited. The presumed tradeoff between profits and environmental quality may disappear with a longer term,dynamic perspective. Thus, exogenous changes can create new, but previously unrecognized profitableopportunities for pollution prevention and may induce the search for new improved technologies. See Ayers andAyers, 1996, for further discussion.
15
(Batie, 1997). Such savings are usually accomplished through either reducing waste treatment costs or disposal
costs.5
When firms move into the third generation of environmental management, they usually adopt some type of
environmental management system (EMS). The basic elements of a firm’s EMS are (Netherwood, 1994):
* A policy statement indicating commitment to environmental improvement, conservation, and
protection of natural resources.
* A set of plans and programs to implement the EMS policy within and outside the firm.
* Integration of these plans into day to day activity and the corporate culture.
* The measurement, audit, and review of the environmental performance.
* The provision of education and training to increase understanding of environmental issues
within the firm.
* The publication of information on the environmental performance of the firm.
Successful outcomes occur when firms are able to institutionalize the basic stages into the corporate
culture; a process which normally requires a strong commitment of top firm managers and the Board of Directors.
Of these basic elements, the life-cycle environmental audit of the firm’s eco-performance is key. With a life-
cycle environmental audit, the entire firm’s products and services--from inception to sale, use, and disposal (e.g.,
from “cradle-to-grave”)--are examined as to their impact on environmental outcomes. Knowledge gained is used
to redesign the firm’s production, marketing, and distribution system to eliminate potential pollutants.
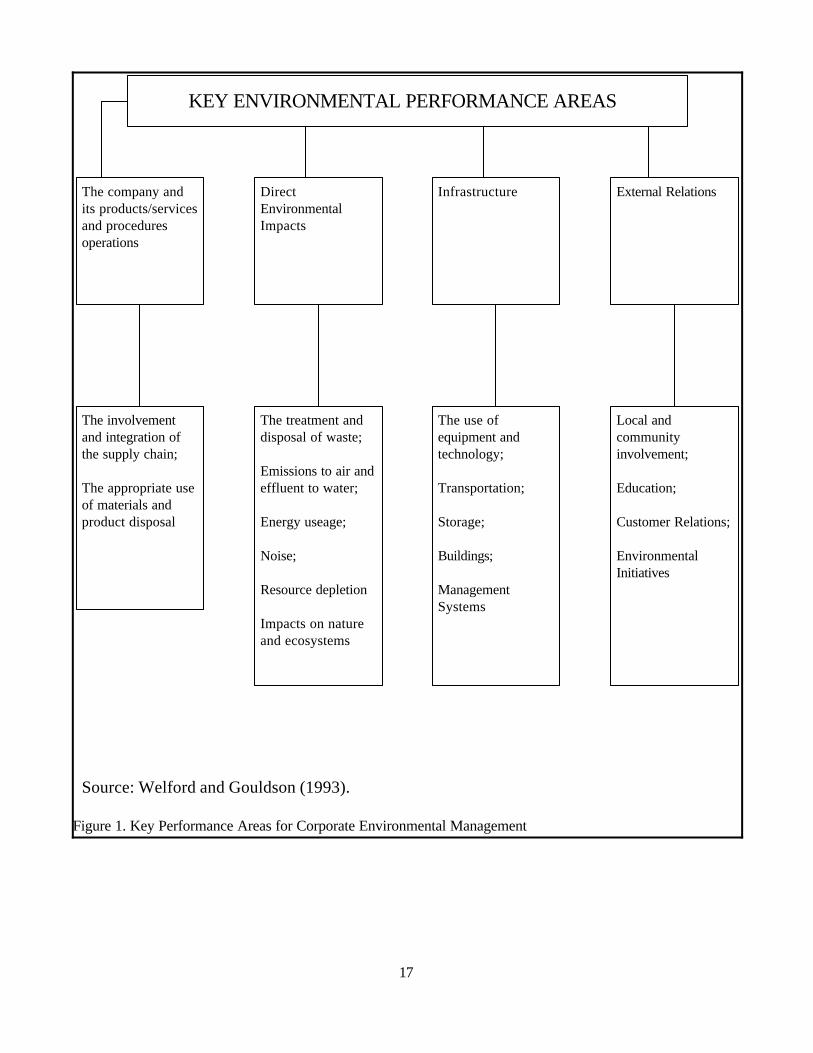
Welford and Gouldson (1993) note that there are usually four key areas at which to target environmental
management and any environmental audits. These are detailed in Figure 1, and are (a) the company’s products,
16
services, procedures and operations, (b) the company’s direct impact on environmental quality, (c) the company’s
use of the infrastructure, and (d) external relations with various public’s and agencies.
Private Codes and Ecolabeling
Accompanying the corporate trends is a trend toward both the use of private codes (or so-called “green
codes”) and ecolabeling. Both trends relate to maintaining a strong public reputation, avoiding future liability and
responding to consumer demands for products produced with environmentally protecting processes.
“Green codes” are private, voluntary codes of “good practices.” Some codes have arisen in response to
perceived consumer demands, but most appear to be a response to the fears of future mandatory regulation or
17
KEY ENVIRONMENTAL PERFORMANCE AREAS
The company andits products/servicesand proceduresoperations
DirectEnvironmentalImpacts
Infrastructure External Relations
The involvementand integration ofthe supply chain;
The appropriate useof materials andproduct disposal
The treatment anddisposal of waste;
Emissions to air andeffluent to water;
Energy useage;
Noise;
Resource depletion
Impacts on natureand ecosystems
The use ofequipment andtechnology;
Transportation;
Storage;
Buildings;
ManagementSystems
Local andcommunityinvolvement;
Education;
Customer Relations;
EnvironmentalInitiatives
Source: Welford and Gouldson (1993).
Figure 1. Key Performance Areas for Corporate Environmental Management
6ISO 14000 is a private code being developed by the “industry-driven” International Organization forStandardization headquartered in Geneva, Switzerland. Its purpose is to promote international trade by facilitatingthe standardization of products and provide a common approach to environmental management and theecolabeling of products.
18
liability. Examples include the Chemical Manufacturers Association (CMA) Responsible Care program, the
Coalitions for Environmentally Responsible Economies (CERES), the International Chamber of Commerce (ICC)
Business Charter for Sustainable Development, the Global Environmental Management Initiative (GEMI), and the
international environmental management standard, ISO 14000. A typical code is Responsible Care which has
approximately 175 member companies that account for over ninety percent of the basic chemical production in the
United States and Canada. (Similar commitments have been made in Europe with European chemical
companies.) The member companies agree to the guiding principles that require a commitment to the public’s
right-to- know, pollution prevention, process safety, employee health and safety, and product stewardship (Nash
and Ehrenfeld, 1996; Gottlieb, 1995).
As signatories to the private codes, businesses voluntarily agree to adhere to the codes’ environmental
management principles. Most codes require companies to develop management systems, audit environmental
progress, and include outside groups in their environmental programs. None, however, requires specific
environmental performance, and only the ISO 14000 requires third party verification of the business’s system
(Nash and Ehrenfeld, 1996).6
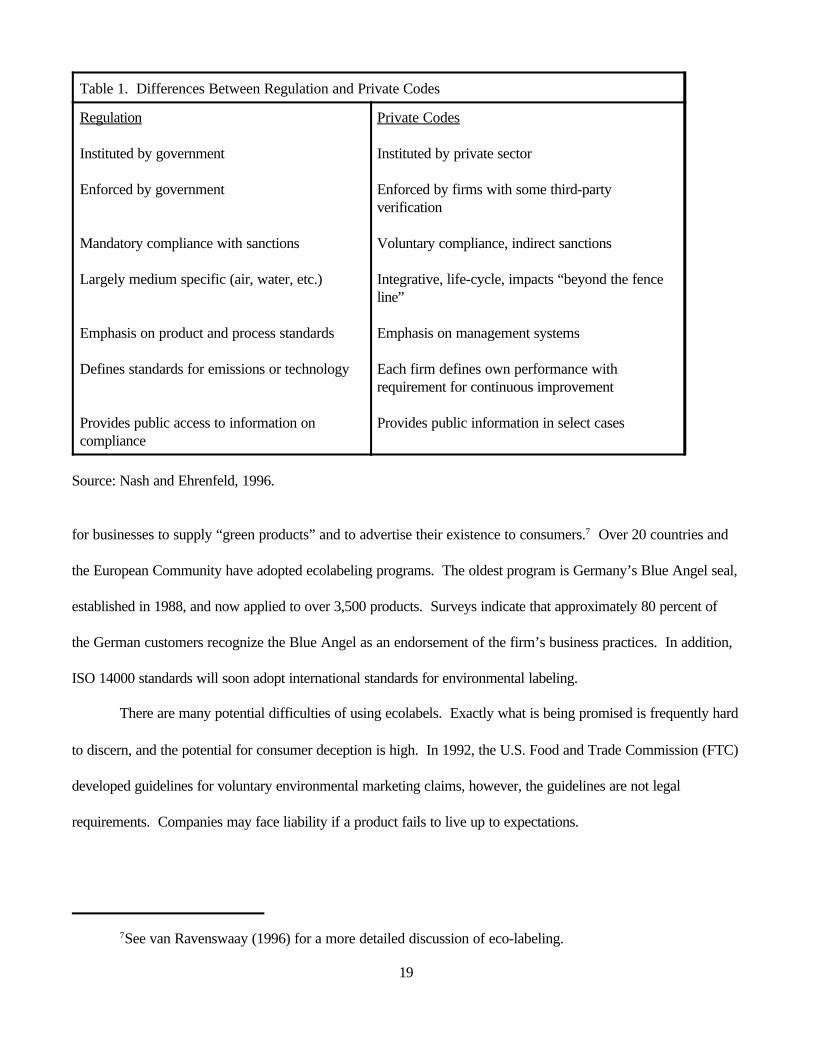
Nash and Ehrenfeld (1996) highlight some of the differences between private codes and regulations;
these differences are listed in Table 1. Key differences are that codes tend to consider the firm as a whole
system whereas regulations focus on end products or emissions.
Whereas private codes tend to be motivated by fear of regulation or liability, eco-labeling usually occurs
where there is market potential because of existing consumer demands for improved production processes. Thus,
ecolabels are “seals of approval” certified by either public or private organizations; they provide an opportunity
7See van Ravenswaay (1996) for a more detailed discussion of eco-labeling.
19
Table 1. Differences Between Regulation and Private Codes
Regulation
Instituted by government
Enforced by government
Mandatory compliance with sanctions
Largely medium specific (air, water, etc.)
Emphasis on product and process standards
Defines standards for emissions or technology
Provides public access to information oncompliance
Private Codes
Instituted by private sector
Enforced by firms with some third-partyverification
Voluntary compliance, indirect sanctions
Integrative, life-cycle, impacts “beyond the fenceline”
Emphasis on management systems
Each firm defines own performance withrequirement for continuous improvement
Provides public information in select cases
Source: Nash and Ehrenfeld, 1996.
for businesses to supply “green products” and to advertise their existence to consumers.7 Over 20 countries and
the European Community have adopted ecolabeling programs. The oldest program is Germany’s Blue Angel seal,
established in 1988, and now applied to over 3,500 products. Surveys indicate that approximately 80 percent of
the German customers recognize the Blue Angel as an endorsement of the firm’s business practices. In addition,
ISO 14000 standards will soon adopt international standards for environmental labeling.
There are many potential difficulties of using ecolabels. Exactly what is being promised is frequently hard
to discern, and the potential for consumer deception is high. In 1992, the U.S. Food and Trade Commission (FTC)
developed guidelines for voluntary environmental marketing claims, however, the guidelines are not legal
requirements. Companies may face liability if a product fails to live up to expectations.

20
Thus, using ecolabels and providing green products may have mixed results for businesses, consumers,
and the environment. Nevertheless, as many companies’ experiences illustrate, green products may fill a market
niche and ecolabeling may be a useful marketing tool (van Ravenswaay, 1996). Ecolabels, in some cases, can
provide a non-regulatory incentive for the adoption of less-polluting production practices and technologies.
Lessons
In some businesses associated with point source pollution, then, we are witnessing a search for pollution
“prevention” strategies. At least for some businesses, an environmental management strategy tends to be
motivated by a variety of factors such as liability and other risk concerns, public image, cost-savings, consumer
demands, pressure group demands, and/or the desire to reduce uncertainty. Firms so motivated examine their
whole production system with life-cycle environmental audits and engage in strategies to increase resource
productivity, to reduce material requirements, to recycle, and to “mine” their wastes for valuable products (Ayers
and Ayers, 1996). Indeed, such environmental auditing and system redesign is now so common that it has its own
field of investigation--industrial ecology--that focuses on resource productivity, materials cycle optimization, and
waste minimization.
It is an intriguing and a policy-relevant question to ask, what lessons that can be drawn from point-source
pollution regulation and applied to nonpoint, agro-environmental problems? The first lesson is that so-called
“command and control” regulation does not appear to be the best model for pursuit of nonpoint pollution
prevention goals. There is considerable promise in the design of more flexible strategies.
The second lesson is that corporate environmental management may be a model for agricultural
environmental management. However, there are important relationships between environmental regulations and
business environmental performance that need to be appreciated when making analogies from corporate to
agricultural environmental management strategies. The first relationship to be understood is that unless there are
viable and robust markets for “green products” (e.g., “pesticide-free baby food or “dolphin-safe” tuna), then
regulations, or liability, or the threat of regulations and liability, are necessary to motivate companies to leave the

21
first generation of environmental management and enter the second and third--generations of environmental
management. The second relationship to be understood is that regulations have the potential to be cost effective if
they are flexible and performance-based. That is, they should specify what needs to be accomplished as
measured by environmental outcomes, but not dictate how these outcomes are to be achieved. Ideally, it must be
clear that (a) the “polluting firm” does not have the right to pollute, (b) there are clear, certain, enforceable
performance standards, and (c) the firm is free to select which technologies or firm practices will be used to
achieve those standards. Obviously, monitoring of outcomes and accountability for failure to reach performance
standards is an important feature of a flexible regulatory pollution prevention policy.
Can the lessons from business environmental management be applied to agricultural agro-environmental
management? Is there a role for flexible policy undergirded by performance standards? Is there a agricultural
analog to corporate environmental management? Will farm-level innovation offsets be achieved? The answer
appears to be yes to all these questions, although there are gaps in information necessary for ideal agro-
environmental policy design and for farmer-led efforts. Section III examines the basic elements of a flexible,
agricultural agro-environmental management policy, including identification of information gaps. The policy
context for successful agricultural environmental management is explored in Section IV.
22
Section III. Applying the Corporate Environmental Management Lessons to
Agricultural Environmental Management
Total quality management (TQM) is a concept that is widely implemented through the business world.
TQM has usually meant the redesign of the business practices to assure total quality control, or “zero defects.”
As discussed in the previous section, some firms are now engaged in corporate environmental management or
Total Quality Environmental Management (TQEM) (Porter and van der Linde, 1995a) because they see a logic
that links environment, resource productivity, innovation, and competitiveness. With corporate environmental
management, pollution is seen as a flaw in either product design or production processes which calls for a system
redesign. Thus “zero emissions” is added to “zero defects” as a management goal.
As discussed earlier, the adoption of environmental management by firms requires an appropriate policy
context, at least in cases where there were inadequate consumer demands for “green products.” If there is to be
more agricultural environmental management, then agro-environmental policy must be redesigned to provide the
“right” incentives. However, this section will assume, counter-factually, that there are adequate incentives
for agricultural environmental management. (The exploration of the elements of policy redesign for
agricultural environmental management will be examined in Section IV.) Using this counter factual
assumption, the pertinent question examined in this section of the report is: if producers perceive
pollutants as a “flaw” in their farm system, how can they redesign their farm system for pollution
prevention?
Implementing environmental management at the farm level requires the producer to view the whole farm
as a system and to find and exploit profitable or low cost ways of preventing pollution (or ways of enhancing
habitat and amenity values). Environmental management at the farm level also requires that the producer have
the flexibility to respond to the market signals as well as to performance-based agro-environmental standards.
Furthermore, if environmental management is to become “endogenous” to producers’ production, it is necessary
that the producer have the flexibility to design the environmental management plan that meets his or her
23
production objectives and the unique conditions that exist within his or her operation (National Research Council,
1993).
If enough producers practice environmental management, there is a greater potential for “induced
innovation” to reduce the costs of achieving environmental quality goals. That is, producers searching for the
least cost alternative to their individual operations will identify the gaps in production technology and policy
research needed to achieve environmental management (OTA, 1995a and 1995b; Ervin, 1995). This flexible
approach to environmental management therefore has the advantage of putting producers in a lead role to
collectively indicate the industry’s information and technology needs, thereby providing not only the stimulus for
private innovation, but also guidance for governmental program assistance (OTA, 1995b).
Farm Environmental Management Systems
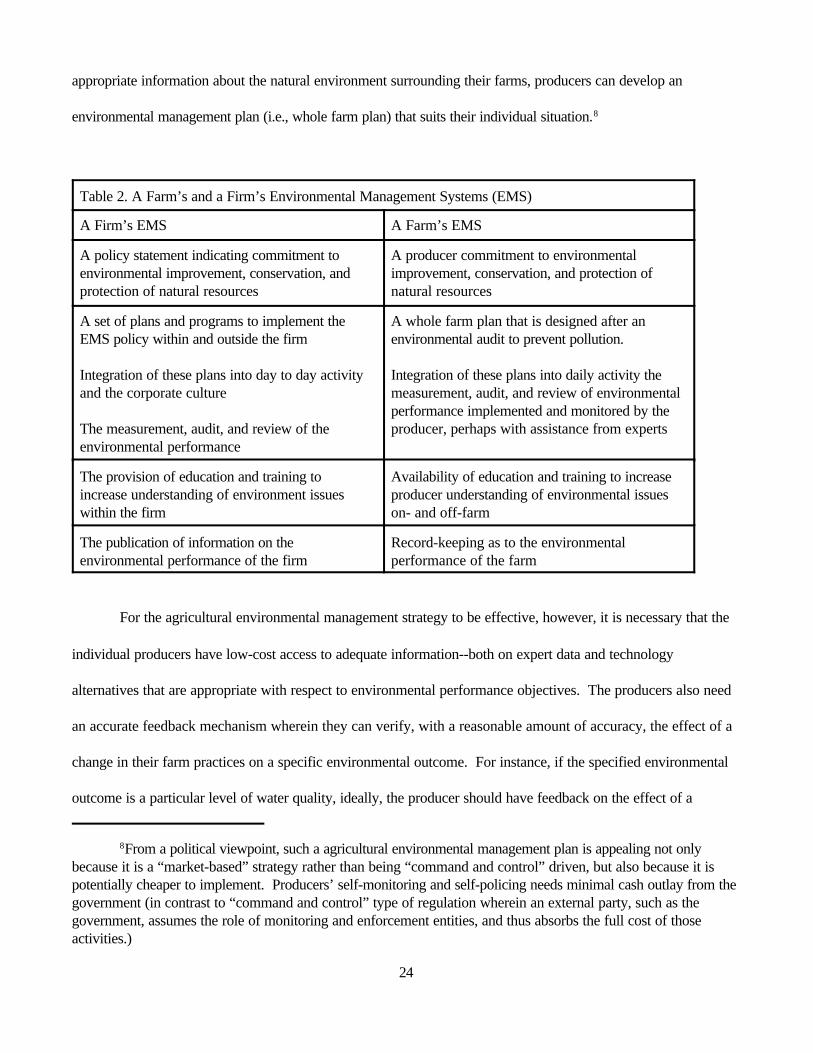
As with corporate environmental management, a key ingredient in agricultural environmental management
is the development and implementation of an Environmental Management System (EMS) that includes
environmental auditing. Table 2 draws the farm analog for previously discussed elements of a Corporate
Environmental Management System. An internalized Environmental Management System, such as a whole farm
plan, has the potential to enhance the profitability of the firm while improving the environment. To be effective,
producers must make a commitment to environmental improvement and take the lead in environmental
management because (1) they have intimate knowledge of their operation and because (2) without such a
commitment, agricultural environmental management will fail. Producers, with the assistance of others, need to
develop a whole farm plan that leads to pollution prevention and which is integrated throughout daily activities.
Producers should also undertake the main role of monitoring and policing the individual farm operation to be
certain the farm meets environmental criteria and careful record keeping is essential. Given accurate and
8From a political viewpoint, such a agricultural environmental management plan is appealing not onlybecause it is a “market-based” strategy rather than being “command and control” driven, but also because it ispotentially cheaper to implement. Producers’ self-monitoring and self-policing needs minimal cash outlay from thegovernment (in contrast to “command and control” type of regulation wherein an external party, such as thegovernment, assumes the role of monitoring and enforcement entities, and thus absorbs the full cost of thoseactivities.)
24
appropriate information about the natural environment surrounding their farms, producers can develop an
environmental management plan (i.e., whole farm plan) that suits their individual situation.8
Table 2. A Farm’s and a Firm’s Environmental Management Systems (EMS)
A Firm’s EMS A Farm’s EMS
A policy statement indicating commitment toenvironmental improvement, conservation, andprotection of natural resources
A producer commitment to environmentalimprovement, conservation, and protection ofnatural resources
A set of plans and programs to implement theEMS policy within and outside the firm
Integration of these plans into day to day activityand the corporate culture
The measurement, audit, and review of theenvironmental performance
A whole farm plan that is designed after anenvironmental audit to prevent pollution.
Integration of these plans into daily activity themeasurement, audit, and review of environmentalperformance implemented and monitored by theproducer, perhaps with assistance from experts
The provision of education and training toincrease understanding of environment issueswithin the firm
Availability of education and training to increaseproducer understanding of environmental issueson- and off-farm
The publication of information on theenvironmental performance of the firm
Record-keeping as to the environmentalperformance of the farm
For the agricultural environmental management strategy to be effective, however, it is necessary that the
individual producers have low-cost access to adequate information--both on expert data and technology
alternatives that are appropriate with respect to environmental performance objectives. The producers also need
an accurate feedback mechanism wherein they can verify, with a reasonable amount of accuracy, the effect of a
change in their farm practices on a specific environmental outcome. For instance, if the specified environmental
outcome is a particular level of water quality, ideally, the producer should have feedback on the effect of a
9To be discussed in Section IV.
25
potential change in his or her farming practices on water quality, an “ideal feedback” informational flow would
include information on profits as well as environmental outcomes. With careful record-keeping and by going
through this process of feedback, the producer could adjust his operation to find the least cost system of achieving
environmental and profit performance goals. As with corporate environmental management, agricultural
environmental management should ideally move the farm from a pollution-prone farm to an information-based,
pollution preventing farm.
Furthermore, with an ideal situation, the self-monitoring, self-policing, and self-adjustment by producers
would be integrated into a pollution policy so that producers know with certainty if they are in compliance with
public regulations and standards. This integration reduces the uncertainty involved in the adoption of alternative
farming practices that meet the environmental criteria.
Thus, in addition to a flexible policy (and/or adequate consumer demands) motivating and enabling
agricultural environmental management,9 there needs to be:
* an environmental audit of the existing farming system;
* a redesign of the farm system to reduce environmental impacts (e.g., a whole farm plan); which
incorporates an operation and maintenance strategy for the farm system as a whole;
* identification and use of “quality control indicators” as feedback mechanisms for ascertaining
the environmental performance of the farm system as a whole ;
* documentation and verification of plan implementation, with oversight from outside
supervisors;
and finally
* a policy enforcement mechanism for those farm systems which fail to comply with agreed-to
environmental criteria such as those reflected in performance standards.
26
Thus, an ideal agricultural environmental management strategy combines expert-provided information,
with specific producer-provided information regarding individual farm operations and farm characteristics. This
information enables producer monitoring of environmental performance and compliance with environmental goals.
Producers take the lead in agro-environmental management, with government bodies establishing performance
criteria as to what needs to be achieved with respect to environmental objectives. Producers would have the
freedom and assistance to meet the performance criteria using management practices and whole farm plans that
producers select themselves. Ideally, such a strategy would result in the reduction of compliance cost without the
sacrifice of environmental goals.
The Environmental Audit
To implement an EMS, producers would need to conduct a resource inventory and to “audit” their farm
operations. The audit would be a key element for the design and evaluation of a whole farm plan. The purpose
of the audit would be to discern which part, if any, of the farm’s production operation and procedures are causing
the farm to be in noncompliance with environmental goals. Ideally, producers should have access to information
with regard to his or her management practices, allowing him or her to select those practices within a systems
context as needed to meet environmental goals.
Environmental management at the farm level might operate best if there were a model available to
producers (or their advisers) that combines expert-provided data and information with specific producer-provided
data about the individual farm. The expert-supplied data would include such components as watershed or
groundwater environmental quality information, sources of environmental degradation, farm physical
characteristics, and historical weather data. (A more detailed list of these data are included in Appendix A.)
Data provided by the producer, on the other hand, would be information germane to profit calculations
such as ownership and financing arrangements, personal goals, contracts of consultants, farm practices including
manure management; cropping patterns; equipment; location of buildings, feedlots and fields; rotations; fertilizer,
herbicide and pesticide use; application rates; and, animal stocking rates. In the same manner, data addressing the
27
impact on the farm’s financial situation with changes in operation (such as input mix changes to meet
environmental standards) are included in the assessment. This data would include costs, revenues, and equity
changes.
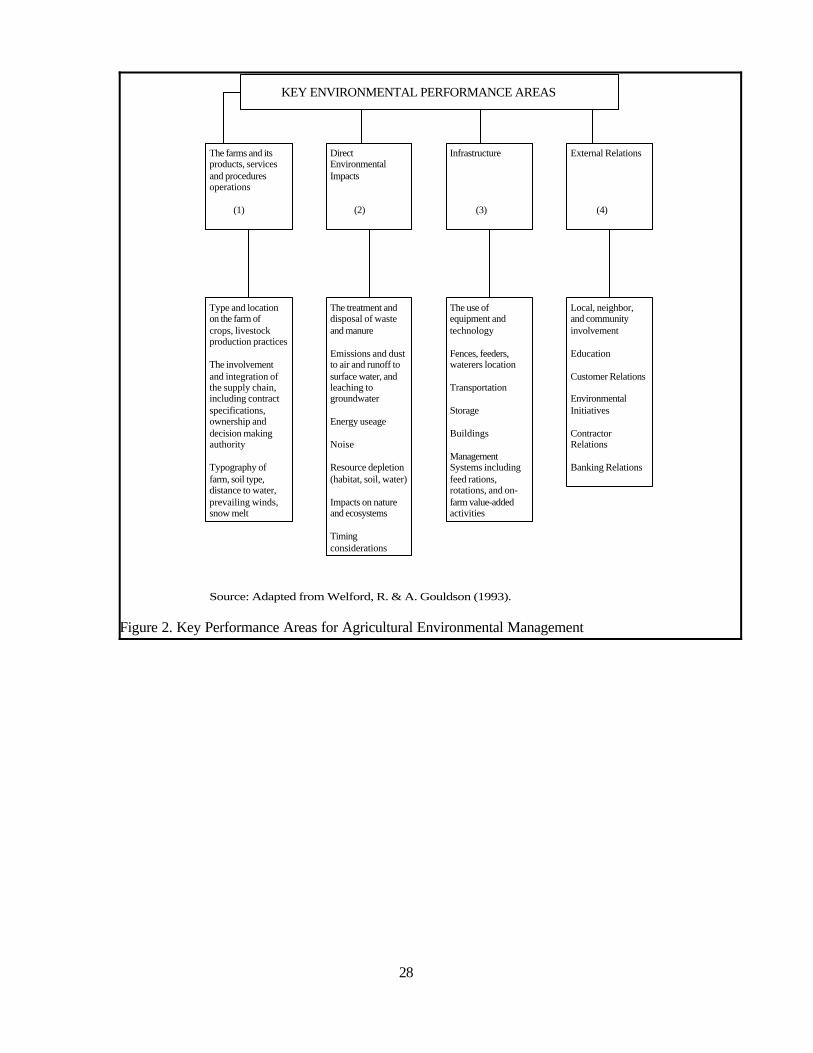
Figure 2 alters Figure 1 from Section II to be specific to a farm rather than a firm and suggests the
appropriate performance areas for a farm’s environmental audit. As Figure 2 indicates (Box 1, Figure 2), an audit
would include examining the farm’s product, service, procedures and operations. Constraints on decision making
authority such as those stemming from mortgages, contracts, or absentee ownership would be important. The
physical attributes of the farm in relationship to ground and surface water, soil type, potential for groundwater
leaching are also important, as would be the type and location of crops and livestock.
28
KEY ENVIRONMENTAL PERFORMANCE AREAS
The farms and itsproducts, servicesand proceduresoperations
(1)
DirectEnvironmentalImpacts
(2)
Infrastructure
(3)
External Relations
(4)
Type and locationon the farm ofcrops, livestockproduction practices
The involvementand integration ofthe supply chain,including contractspecifications,ownership anddecision makingauthority
Typography offarm, soil type,distance to water,prevailing winds,snow melt
The treatment anddisposal of wasteand manure
Emissions and dustto air and runoff tosurface water, andleaching togroundwater
Energy useage
Noise
Resource depletion(habitat, soil, water)
Impacts on natureand ecosystems
Timingconsiderations
The use ofequipment andtechnology
Fences, feeders,waterers location
Transportation
Storage
Buildings
ManagementSystems includingfeed rations,rotations, and on-farm value-addedactivities
Local, neighbor,and communityinvolvement
Education
Customer Relations
EnvironmentalInitiatives
ContractorRelations
Banking Relations
Source: Adapted from Welford, R. & A. Gouldson (1993).
Figure 2. Key Performance Areas for Agricultural Environmental Management

10A Michigan prototype example of such environmental management can be found on the World WideWeb (http://www.mi.nrcs.usda.gov/gis-demo/index.html). This example takes information gained from on-linesoils information to illustrate how a producer could use his or her computer to make a pesticide risk assessment. The producer enters into the computer a selected pesticide, a crop, and an application quantity per acre. Themodel predicts environmental risks from the use of that pesticide on a particular soil. The example integratesGeographical Information Systems and web-based model to produce a producer-friendly planning tool.
29
The audit should include consideration of the use of infrastructure (Box 3, Figure 2), such as the storage
of pesticides, the location of feeders and fences, the use of rotations or machinery. External relationships (Box 4,
Figure 2) such as the goals of maintaining good relationships with neighbors, township officials, and bankers are
included in the audit as well.
The crucial but difficult aspect of the farm environmental audit will be accurately ascertaining the direct
environmental impacts from the farm’s operations (Box 2, Figure 2). While producers can easily ascertain how
much fertilizer and manure they are applying per acre per time period, for example, they will usually not be able to
readily translate that information into potential nitrogen runoff in different farm or ranch systems, various
topographic and landscape conditions, and with probable weather events. Ideally, not only should producers
ascertain the probable contribution of their current management practices to environmental quality, they also need
to predict the profit ramifications of alternative management practices. This type of information on impacts will
require assistance from experts probably using expert-based models that can analyze the interactions of several
variables simultaneously.10
Currently this set of information is limited, fragmentary, ad hoc and difficult to access (OTA, 1995b;
Abel, et. al, 1995; NRC, 1993; Ervin, 1995). Nevertheless, there are advancements in research which suggests
such a system of collaborative analysis between the experts and the producers has potential (OTA, 1995).
Careful targeting to a limited number of farms as part of a policy strategy makes such an information intensive
approach more financially feasible.
Even though information which accurately links various and diverse farm systems with environmental
outcomes is not yet available, progress is real and could be accelerated if agro-environmental policy focused on its
use. In the interim, producers may have to rely on experts’ informed judgments as to these linkages in the
30
producers’ initial environment audit and then be prepared to change systems or practices if new information
suggests such changes are wise.
Whole Farm Planning
An environmental audit is an important component of a whole farm plan. Whole farm planning is more of
a process than a final product and involves viewing the farm as an integrated system. Producers assess the farm
resources, the goals surrounding farm management, including profit maximization and pollution minimization, and
other concerns both on and off the farm. Rather than focus on one farm problem and finding a single
solution—such as the adoption of a new farming practice—the producer diagnoses the entire farm operation for
the underlying cause of pollution problem(s) (Kemp, 1996). Thus, whole farm planning is for the farm, what
industrial ecology and firm redesign is for the business firm (Jones, 1997).
There are three major types of models for farm plans: the expert model, the decision-matrix model, and
the producer-led planning model--each with their own strengths and weaknesses (Higgins, forthcoming). The
expert model involves whole farm plans written for a producer by an expert or team of experts; the decision-
matrix model has producers self-identify problem areas on their farms and develop solutions through the use of a
workbook, computer model, or web-based interactive system into which they insert information about their farm
and which returns answers based on an expert-designed model; and, the agricultural planning model is where
the producer is provided education and assistance on how to plan, as well as planning guidelines, but does the
actual plan development by himself or herself (Higgins, forthcoming).
It appears that the decision-matrix model has the most potential for most agricultural environmental
management strategies. The decision-matrix model tends to use fewer resources than the expert model and be
more likely to yield a plan consistent with publically-desired environmental quality goals (Higgins, forthcoming).
Furthermore, the decision-matrix approach tends to be user-friendly and easily modified. With a well-developed
decision-matrix designed plan, the producer should be self-guided to consider his or her farm as an integrated
economic and ecological system embedded in watershed or airshed. Furthermore, the decision matrix plan is
31
amenable to modification from a variety of sources of information. Both the financial performance and the
environmental performance of the farm enterprise can be included in a well-designed decision-matrix model.
However, improved performance relies on an adequate information base to assure that self-monitoring is possible,
low cost, and accurate.
Ideally, the whole farm plan should lead to a redesign of the farm procedures and operations so as to
reduce or eliminate the negative environmental impacts at either a profit or as low a cost as possible. Such
redesign requires the analysis of alternatives as well as adaptation and change of the farm operation and
procedures overtime as more is learned or as situations change.
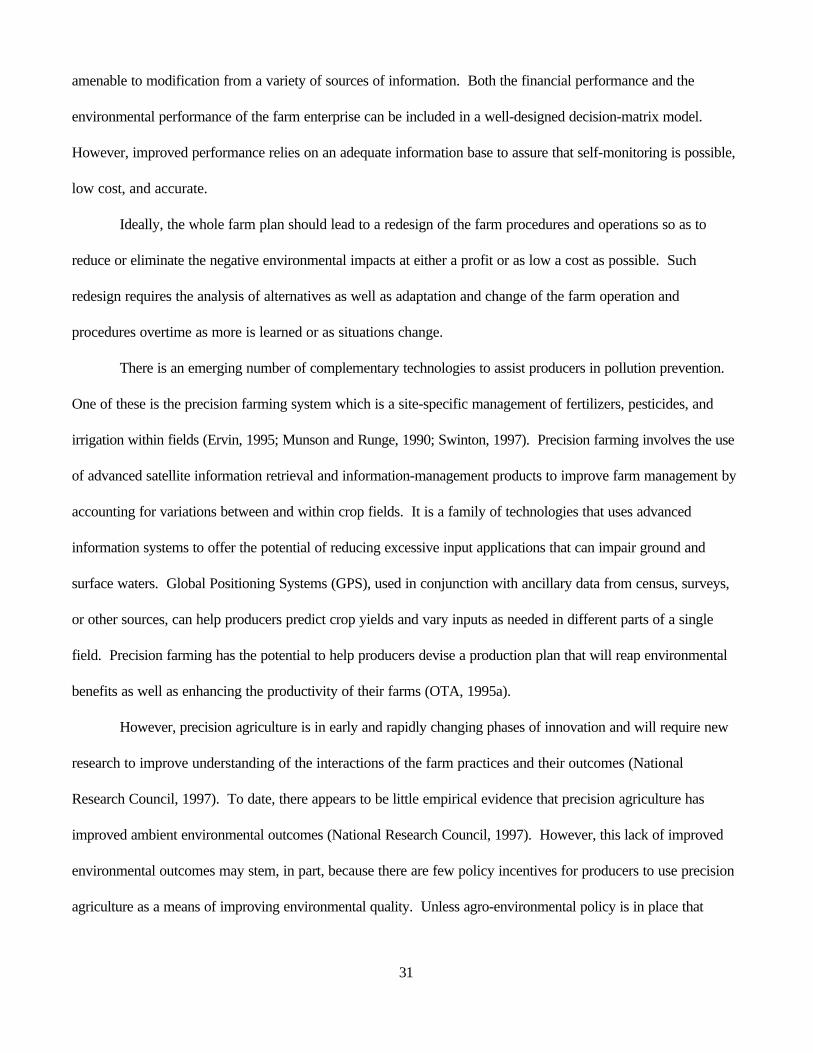
There is an emerging number of complementary technologies to assist producers in pollution prevention.
One of these is the precision farming system which is a site-specific management of fertilizers, pesticides, and
irrigation within fields (Ervin, 1995; Munson and Runge, 1990; Swinton, 1997). Precision farming involves the use
of advanced satellite information retrieval and information-management products to improve farm management by
accounting for variations between and within crop fields. It is a family of technologies that uses advanced
information systems to offer the potential of reducing excessive input applications that can impair ground and
surface waters. Global Positioning Systems (GPS), used in conjunction with ancillary data from census, surveys,
or other sources, can help producers predict crop yields and vary inputs as needed in different parts of a single
field. Precision farming has the potential to help producers devise a production plan that will reap environmental
benefits as well as enhancing the productivity of their farms (OTA, 1995a).
However, precision agriculture is in early and rapidly changing phases of innovation and will require new
research to improve understanding of the interactions of the farm practices and their outcomes (National
Research Council, 1997). To date, there appears to be little empirical evidence that precision agriculture has
improved ambient environmental outcomes (National Research Council, 1997). However, this lack of improved
environmental outcomes may stem, in part, because there are few policy incentives for producers to use precision
agriculture as a means of improving environmental quality. Unless agro-environmental policy is in place that

11The self-monitoring, self-policing and self-adjusting must also be integrated into agro-environmentalpolicy so that producers know with certainty whether they are in compliance.
32
requires producers to bear some of the costs of pollution, the use of precision agricultures will tend to focus on
non-environmental goals. However, the information-intensive nature of most precision agriculture technologies
means that producers using these technologies should be able to access valuable on-farm data (e.g., input use, soil
type, distance to water) for improved whole-farm planning.
There are other practices and technologies in addition to precision agriculture that can potentially improve
environmental quality (and, in some cases, profits) such as changes in timing and application rates of irrigation
water, nitrogen or pesticides, low-volume irrigation systems, rotations, or buffer and filter strips (Natural Resource
Council, 1993).
Quality Control Indicators
Accurate feedback as to the environmental outcome from a change in practices on the farm or ranch is
needed for agricultural environmental management. Such feedback would also need to include the predicted
outcome with respect to financial factors so the producer could adopt the least cost system to meet the
performance goals. An ideal feedback informational flow on the twin objectives of environmental protection and
profits would allow producers to monitor their environmental and financial performance and adjust their operation
accordingly to meet their objectives.11
Ideally, monitoring of financial and environmental performance would provide feedback on the functioning
of the farm system, analogous to the concept of “biofeedback” in medical care. In this “biofeedback” approach
to health care, patients are given primary responsibility for their health. Patients practicing biofeedback engage in
self-monitoring and self-assessment to check if they are in “compliance” with the level of health signs as
determined by their physician. A patient gathers and records information on vital body signs on a regular basis,
and uses the same information to judge whether adjustments in daily routine or diet are necessary to live a
healthier and fuller life.

12See pp. 189-236 in National Resource Council (1993) for a summary discussion of soil quality attributesand their relationship to environmental quality.
33
The same feedback principle is adopted for agricultural environmental management. If indicators can be
identified that provide the measure of the economic and environmental performance of the farm, analogous to
temperature, heart rate, cholesterol readings in bio-feedback, the producer will be well situated for the
implementation of the whole farm plan as a part of the daily operation and maintenance of the farm enterprise.
A major element in the monitoring of performance is the use of “quality control indicators” as a self-
evaluation device. “Quality control” is a concept borrowed from the manufacturing sector. Broadly defined,
quality control provides upper and lower bounds of the quality required of production. In the manufacturing
context, “quality” is said to be maintained if the plant’s production, upon inspection, is within the range of the
maximum and minimum quality control limits.
Using expert data on a state and local level, the tolerable (or “critical limits”) limit of agro-environmental
contaminants would, ideally, need to be pre-determined for each local area, taking into consideration the individual
topography and geographic location of each locality. For example, after being analyzed as to the basis of its
unique conditions, a certain watershed might be identified as having a high nitrogen runoff problem. Bounds for
nitrogen runoff, that is, performance standards, would be defined for the producer or for a watershed as a basis
for making farming adjustments. Ideally, a feedback mechanism would link farming systems and farming
practices to the impact on nitrogen runoff on water quality and would allow producers to create their own least-
cost compliance strategies.
Unfortunately, the knowledge relating farming practices and resultant level of agro-environmental
contaminants and environmental damage is fragmentary. It may be, however, that there are good proxies for
precise information for some source-pollution-damage linkages. It is known, for example, that degradation of soil
quality is closely linked to degradation of water quality (NRC, 1993). Figure 3 shows the effects of changes in
soil quality on water quality.12 Increased compaction, reduced soil depth, acidification and reduced biological
activity can result in increased runoff of chemicals, nutrients and sediment to surface water and increased

34
leaching of chemicals and nutrients to groundwater. In addition, excess manure commercial fertilizers, or
pesticides applied to plants or soil can lead to pollution. Thus, while the exact impact on resultant water quality
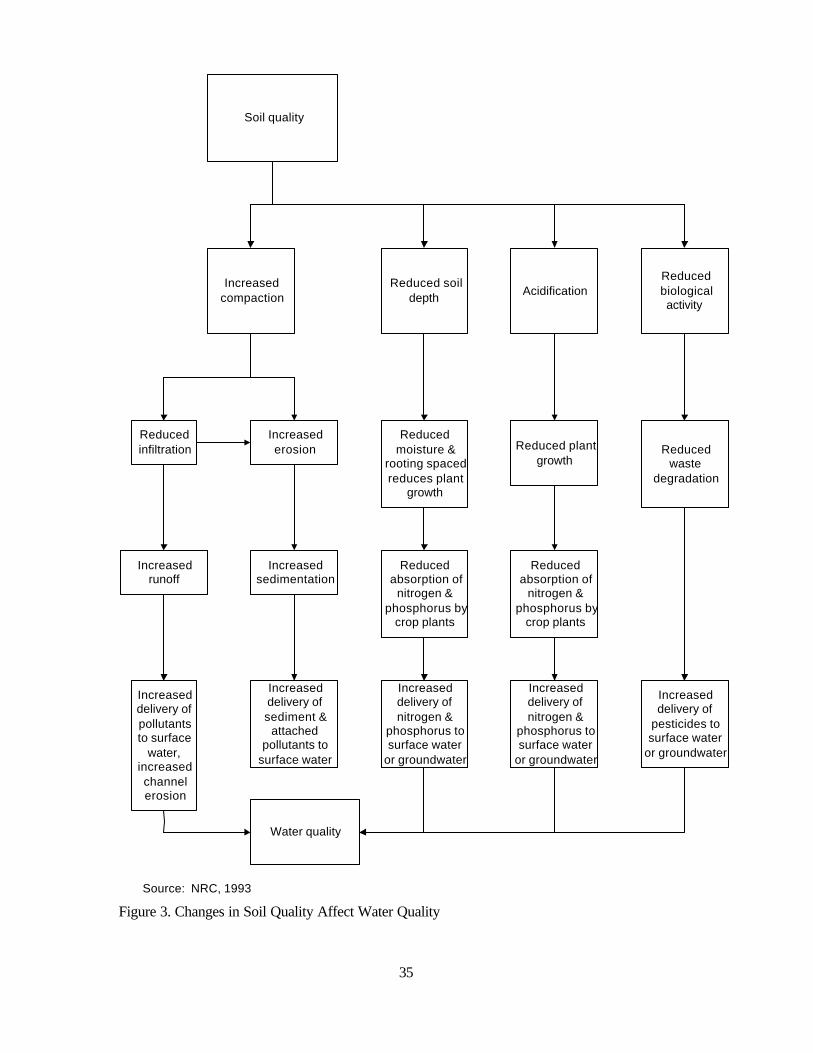
35
Soil quality
Increasedcompaction
Reduced soildepth
AcidificationReducedbiologicalactivity
Reducedinfiltration
Increasederosion
Reducedmoisture &
rooting spacedreduces plant
growth
Reduced plantgrowth
Reducedwaste
degradation
Increasedrunoff
Increasedsedimentation
Reducedabsorption of
nitrogen &phosphorus by
crop plants
Reducedabsorption of
nitrogen &phosphorus by
crop plants
Increaseddelivery ofpollutantsto surface
water,increasedchannelerosion
Increaseddelivery ofsediment &
attachedpollutants to
surface water
Increaseddelivery ofnitrogen &
phosphorus tosurface water
or groundwater
Increaseddelivery ofnitrogen &
phosphorus tosurface water
or groundwater
Increaseddelivery of
pesticides tosurface water
or groundwater
Water quality
Source: NRC, 1993
Figure 3. Changes in Soil Quality Affect Water Quality

36
remains unknown, there may be a reasonably reliable proxy for such outcomes that can be monitored by the
producer and which directs the producer to appropriate land use changes.
Figure 4 applies the concept of quality control indicators to soil quality characteristics. Soils can be
sampled overtime for a set of soil quality characteristics such as soil cover, organic matter, soil porosity,
compaction, acidification or phosphorus accumulation in soils (Larson and Pierce, 1993). Sometimes proxies such
as crop residue can be used to predict soil quality attributes such as organic matter (Larsen and Stewart, 1992).
As Figure 4 illustrates, producers use the quality control concept by sampling for various soil quality
characteristics overtime, and, if such characteristics are beyond the control limits, then changes in farming
practices need to take place. For example, producers might sample for phosphorous saturation levels and design
their farming operation not to exceed an upper control limit that causes negative environmental impacts nor to fall
below a lower control limit that represents critical plant requirements.
The analogy to biofeedback is most apt, with the health of interest in this example being that of soil
quality. This approach recognizes variability overtime, can be used for a variety of quality control indicators, and
can direct a producer toward needed land use changes (Pierce and Larson, 1993). These changes could, for
example, mean changes in manure applications, tillage, planting, residue cover, stocking rates, crop-field location to
bring the quality control index back into acceptable limits.
Even using soil quality as a proxy for water quality, however, there remains a research agenda to more
precisely identify those soil attributes that can serve as indicators for preventing excessive groundwater leaching
and runoff, for environmental buffering, and for improved crop productivity. In addition, there needs to be easy
and standard methods by which to measure and monitor changes in soil quality as well (National Research
Council, 1993). Still, if producers were actively engaged in agricultural management that relied on quality control
indicators, this research would be accelerated.

37
Until more accurate models or reliable environmental quality indicators are widely available, producers
may have to work closely with others in the watershed or airshed, and with experts to obtain the required
“feedback” to estimate performance with respect to those quality control indicators identified as crucial to the
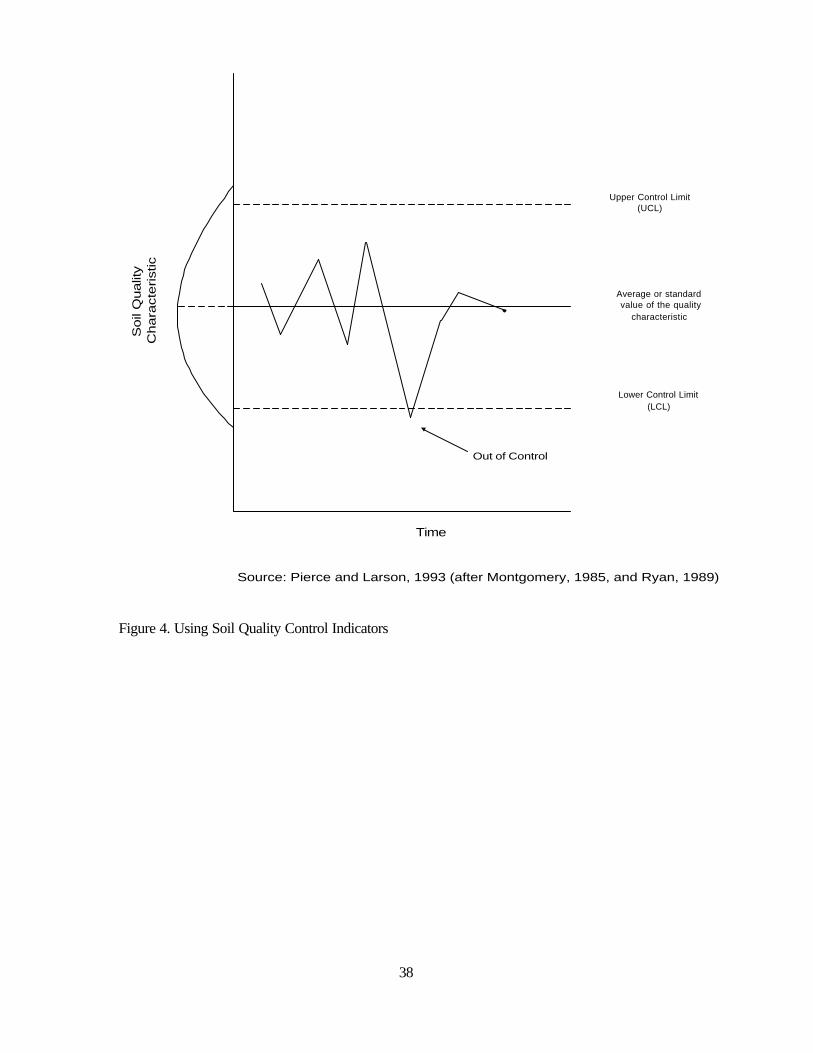
38
Time
Out of Control
Soil
Qualit
yC
hara
cte
ristic
Upper Control Limit(UCL)
Average or standardvalue of the quality
characteristic
Lower Control Limit(LCL)
Source: Pierce and Larson, 1993 (after Montgomery, 1985, and Ryan, 1989)
Figure 4. Using Soil Quality Control Indicators
13Economic models can address the farm level or a more aggregated level can be based on econometricsand/or mathematical programming techniques. Physical process models can be non-spatially distributed (e.g.,EPIC, CREAMS) or spatially distributed (e.g., ANSWERS, AGNPS, SWRRB), single event (e.g., AGNPS,ANSWERS) or continuous time scale (e.g., EPIC, CREAMS, SWRRB, ROTO), field-scale (WEPP, EPICCREAMS), or watershed/basin-wide (ANSWERS, AGNPS, SWRRB) (Srinivasan and Arnold, 1994).
39
environmental improvement goal. In some cases this feedback may be relatively straight-forward such as not
exceeding a phosphorus saturation critical limit in soils. In other cases, this feedback may require complicated
relationships such as leaching potential of certain pesticides overtime.
Quality control indicators are not only applicable to environmental criteria. Indicators can be used to
monitor the status of profitability of a farmer’s operation, as well. In a sense, “profitability” can be defined in
terms of “quality” as well--with a “high quality” profitability indicating business soundness, and “low quality”
referring to uncompetitive operation. The feedback strategy needs to be designed so as to find a balance between
environmental soundness of farm operation, and the farm’s profitability as a business endeavor. In the earlier
example of nitrogen runoff for example, a lower quality control limit for nitrogen levels would assure adequate
nitrogen levels for a growing crop.
The concept of meeting an overall total environmental quality standard of farm operation refers to a farm
that is both profitable and environmentally sound. Armed with the information that relates farm systems to
pollution and profit flow, producers would be in an informed position to make adjustments in their own production
practices, to redesign their own farm system, or to negotiate reallocation of input use with their neighbors if such
is called for in order to reach environmental performance goals. This marriage of private and public objectives is
the ultimate goal of the feedback strategy and agricultural environmental management.
There is considerable research linking economic models with physical process models so that impact of
alternative production systems on profits as well as on environmental outcomes, can be ascertained (Ahern,
1997).13 Many of these models, however, are not user-friendly, are designed for a specific research question and
are exceptionally “data-hungry.” One promising expert-based model with feedback mechanisms currently being

40
developed is PLANETOR. Textbox 2 discusses the PLANETOR model’s potential to provide accurate feedback
on a farm’s financial and environmental performance.
41
One expert model of considerable promise is PLANETOR. PLANETOR is a comprehensive environmentaland financial planning tool developed by the University of Minnesota Center for Farm Management. Thiscomputer software was created with databases sourced from the Soil and Water Conservation Society, U.S.Department of Agriculture, the Natural Resources Conservation Service, and also developed upon consultationwith various extension offices in the Midwest. Currently, the University of Minnesota is fine tuning the farm-planning software called PLANETOR to aid agricultural producers in planning production. PLANETOR’simportance lies in its ability to make an assessment of a farm’s environmental and financial performance usingspecific data. PLANETOR can be customized for a farmer’s region using the detailed database included inthe software, or by editing the database information about a state or county. As such, it has the potential toactively and accurately supply the farmer a feedback link to guide him in input-use decisions and in adjusting hisfarming practices and/or farming system. Thus, PLANETOR combines the twin concerns of farm operationwhich are profit and environmental implications of production in planning (PLANETOR, 1995). This model is asignificant step toward building an expert and producer based audit and whole farm plan.
Specifically, PLANETOR combines site-specific environmental models with individual farm economic planningdata to assess the impacts of farm operations (i.e., pesticide use, nitrogen, phosphorous and manureapplications, tillage systems and crop rotations) on environmental outcomes. It contains a broad database oncountry-level information about soil quality, climatic conditions, topography, geographic and water qualityinformation. It is designed to aid individual farmers to compare the various environmental and economicimpacts as a consequence of the different strategies of farming operations, thus enabling him or her to pinpointfarm practices that contribute to environmental degradation. Environmental degradation is categorized into sixtypes in PLANETOR, namely: soil erosion; pesticide leaching and runoff; pesticide toxicity, nitrogen leaching,phosphorous runoff; and wind erosion. See Appendix B for more detail.
The second component of PLANETOR is assessing the financial health of the farmer’s farming business. Thesoftware aids the farmer in measuring the financial impact of changing the farming pollution preventionstrategy. PLANETOR uses three generally-accepted indicators of financial health namely: profitability (theability of the farm to generate income as measured by net farm income), liquidity (the ability to generate cashfor the payment of costs, taxes, and in debt-servicing), and solvency (the overall level of assets and liabilities,debt structure and projected future net worth growth).
It appears that once fully developed and refined, PLANETOR could be used to supply producers much of thenecessary feedback information for environmental management. PLANETOR has the promise of aidingfarmers in generating the information needed to make appropriate adjustments in operations to meetenvironmental goals. If successful, PLANETOR could provide the producer the ability to gauge his or herfarm’s environmental and financial performance. However, PLANETOR is a computer software and hencerequires money and a degree of technical sophistication on the part of the producer. There would need to be atraining program for the use of a model such as PLANETOR.
Textbox 2. Expert-based Models: PLANETOR
42
Norris et. al (1993) evaluated the use of PLANETOR software by producers in Oklahoma and
Pennsylvania. Producers supplied such information as finances, soil tests, size of fields, type and number of
livestock, tillage practices, rotations, input use, as well as production levels and variability. The PLANETOR
software calculated the potential consequences of alternative production practices for soil erosion, water quality,
pesticide toxicity, net farm income, net worth change, and income risk. While the Oklahoma producers rated
PLANETOR of greater value than the Pennsylvania producers, both sets of producers judged the soil erosion and
water quality data to be generally inaccurate and not valuable. Many changes in farming practices did not have
the expected environmental results as predicted by the software. The pesticide label was judged to have better
information than the PLANETOR predictions on pesticide toxicity. The financial information was deemed slightly
more valuable as was the data collection exercise. The time involved by experts (in this case, Extension
specialists) was also viewed as excessive given the accuracy of the results. Clearly, building a user-friendly
model that accurately analyzes economic and environmental tradeoffs is quite difficult, but improvements are
forthcoming.
A significant dilemma is the tradeoffs between easy-to-use, but oversimplified models such as
PLANETOR and more sophisticated but expert-based, data-hungry models such as some of the newly physical
process models such as the Soil and Water Assessment Tool (SWAT) which provide more complete simulation
(Ahearn and Whittaker, 1997). SWAT can be integrated with geographic information systems (Srinivasan and
Arnold, 1994) as well as be linked with economic models. (Textbox 3 discusses SWAT in more detail.)
Documentation, Verification, and Enforcement
Effective policy implies effective self-policing by producers. To assure that self-policing does happen,
however there must be some oversight by a public authority. Enforcement could take the form of periodic
monitoring of components environment quality such as agri-chemical concentrations in water to assure that the

43
performance standards are being obtained. Periodic monitoring would not need to be of producers and farms
except in the case of significant and continuing failure to meet environmental performance-based standards.
44
As the scale of the area modeled increases, so to does the heterogeneity of the resource base. Newer physicalprocess models such as the Soil and Water Assessment Tool (SWAT) provide ever more complete simulationof the environment, but require very large amounts of data to operate. SWAT is designed for the analysis oflarge, ungauged rural basins on the order of hundreds of square kilometers or more. The unit of analysis is awatershed, where the size of the watersheds making up the basin is specified by the user and determined bytopography. The ideal circumstance to link SWAT to an economic model would be several observations onmicro-units within each watershed. In fact, since SWAT models the heterogeneity of the watersheds in soil,land use/land cover and topography, many observations of micro-unit economic data would be required foreach watershed. Since no such data exist, links to models such as SWAT require techniques from spatialstatistics. The application of spatial statistics to link SWAT to economic models requires the assumption thatthe values at each location (either from observation or an economic model) are representative of the populationin the area from which they were drawn. Then, a 3-dimensional surface can be fit to the data. There areseveral techniques available, including kriging, loess, local regression, and the averaged shifted histogram (Scottand Whittaker, 1996). Once a surface has been estimated for each variable, a summary statistic of surfacewithin each watershed is used as an input into the model. The link is completed by either the direct entry of theresult of the economic model or results of the SWAT simulation can be combined with results from the surfaceestimation for use in a micro-parameter distribution model.
SWAT has been integrated with a geographic information system (GIS) which allows most of the physical datato be inputted graphically (Srinivasan and Arnold, 1994). The GIS interface is an especially nice feature forcross-disciplinary efforts because it allows non-specialists to use the model with comparatively little effort, andexponentially reduces the time to create an application. Although the newer methods of linking requireextensive statistical estimation and manipulation of data in a GIS system, inexpensive computing power andcheaper, easier to use GIS software make the sort of analysis outlined for use with SWAT quite reasonable. Infact, an economic model can be linked to SWAT using the averaged shifted histogram version of non-parametric regression using all free software on an entry level personal computer.
Source: Ahearn and Whittaker, 1997.
Textbox 3. Soil and Water Assessment Tool (SWAT)
Only in such case of persistent failure to meet goals would there be a need to check for individual compliance.
The details of how such enforcement might be designed is discussed in Section IV.
The Challenge
Clearly there is a close analog between Environmental Management Systems for a non-agricultural
business firm and a farm. Both require environmental audits to identify potential processes and practices to
prevent pollution. However, the biological processes in a farm, the diverse spatial and topographic situations, and
probabilistic weather events makes effective low-cost environmentally auditing difficult.

45
The science and technology necessary to identify the causes of water, air, and land pollution from a large
number of diverse farm production systems has been slow in developing. While considerable recent progress has
been made in the development of models, geographic information systems, and improved understanding of source-
pollution-damage linkages, there is clearly a major research and technology agenda awaiting fulfillment (Batie and
Ervin, 1997b).
Such a research and technology agenda would be accelerated if agricultural environmental management
were to be accelerated. Such acceleration would occur in the appropriate policy setting. Indeed, Davies and
Mazurek (1996), after evaluating several major programs, concluded that clear, specific, measurable objectives
are crucial to the success of voluntary, incentive based approaches. In reviewing the weaknesses of relying just
on administrative reforms, the authors stress that there is no way to avoid the need to legislate improvements in
environmental policy. However, legislation can ensure that objectives are established through an open process
that includes the views of all key stakeholders. Without the certainty and incentives provided by those statutes,
less than full progress on the agro-environmental problems should be expected (Batie and Ervin, 1997b). The
elements of effective environmental policy is the subject of the next section of this report.

46
Section IV. Applying the Corporate Environmental Management Lessons
to Agro-pollution Policy
Section III assumed counter-factually , there was an agro-environmental policy in place that provided
appropriate incentives for agricultural environmental management. While some producers may be adequately
motivated by their own stewardship ethics, by fear of future regulation, liability, or by consumer demands to
pursue agricultural environmental management, probably many more are not so motivated. Thus, this section
explores future policy requirements for effective agricultural environmental management. More specifically, this
section details the characteristics of agro-environmental policy that will provide the incentives for agricultural
environmental management.
Policy to Encourage Agricultural Environmental Management
One of the key lessons from corporate environmental management is that such management tends to
occur only when current or future regulations, liability exposure (i.e., “compliance-push”), or robust consumer
demands for “green products” (i.e., “demand-pull”) are perceived by firms. That is, corporate environmental
management occurs in an institutional context that “gets the incentives right” for such management. When
regulations provide the incentive, however, they must provide for flexibility in the responses of business, if they are
to garner the maximum innovation off-sets and cost savings from corporate strategies.
There are some modest but growing consumer demands for “green agro-products,” that is, agricultural
products produced with environmentally protecting practices. Many of the current demands appear to originate
with food safety concerns, such as pesticide residues in baby foods. There is also an increase in eco-labeling of
food products, such as organic foods, and an increase in “green, private codes of practices” such as the National
Pork Producers Council Environmental Assurance Program (EAP). However, these activities influence only a
small share of agricultural enterprises’ environmental practices. At some time in the future, consumer demands
may be adequate incentive for agricultural environmental management for many types of farm enterprises.
Currently, however these consumer demands do not appear to be of such magnitude as to provide sufficient

47
market incentive for achieving national agro-environmental quality objectives. Indeed, not all environmental
services can be captured by market processes. It is difficult for example to image how “demand-pull” forces
could achieve a solution to excess fertilizers in the Gulf of Mexico--a situation that appears to be the cause of
serious hypoxic conditions in the Gulf (Batie and Ervin, 1997b). Thus, unless consumer demands grow
exceptionally strong for production practices that are environmentally protecting, only an effective agro-
environmental policy will result in wide-scale, agricultural environmental management.
Current agro-environmental policies are not well structured to provide incentives for agricultural
environmental management. Reliance on pesticide labels, land-retirement subsidies, voluntary actions and
technical assistance have knit together a policy structure that is not likely to encourage agricultural environmental
management (Batie and Ervin, 1997). Nor, at the present time, does the threat of liability for pollution clean-ups
appear to be sufficient motivation for most farmers to practice agricultural environmental management.
The attributes of an effective agro-environmental policy have been identified through numerous research
projects (NRC, 1993). The diverse nature of U.S. agriculture and attendant agro-environmental problems
suggests that a cost-effective agro-pollution prevention policy should be flexible so as to allow for non-uniform
situations and for producer innovation. Ideally, producers should have considerable flexibility to pursue
environmental goals in a manner that best meets their situation as well as information and technical assistance
tailored to their situation. Because not all producers contribute significantly to pollution problems and because
public dollars for pollution programs are limited, agro-environmental policy should be able to “target” policy
resources to priority areas, concerns, and farms.
Also, policy should incorporate the science that relates changes in farming practices to changes in
environmental quality and include reliable methods to monitor environmental quality changes related to changed
agricultural production practices--either individually or as part of a system--so that producers and public agencies
can ascertain if improvements are occurring. Any system of monitoring and evaluation should recognize the
stochastic nature of most agro-environmental polluting events.
14Parts of this section draw from Batie and Ervin, 1997.
48
Thus, the basic elements of a flexible, cost-effective agro-environmental policy appear to be:
* clear environmental quality objectives (e.g., performance based regulations),
* targeted policy resources to priority concerns, areas, and farms,
* flexible incentives (positive or negative) for farmers to achieve objectives,
* tailored assistance and information to the situation of those farmers who must change
their farming practices and/or farming systems to obtain environmental quality
objectives,
* monitoring and evaluation to ascertain changes in environmental quality, and
* enforcement mechanisms for those producers who fail to comply.
Objectives14
Agro-environmental problems are distinguished as to their impact on air quality, water quality, or soil
quality. Within these broad categories there are further distinctions. For example, water quality degradation may
be a public concern because of habitat destruction for a variety of species, because of disruption of ecological
processes such as results from eutrophication, because of degradation of amenity attributes such as those
associated with water recreation, or for animal or human safety reasons such as those traced to pathogens in
water supplies. Objectives of an agro-environmental policy need to specifically address these distinctions if
environmental quality is to be improved in a cost-effective manner; that is, the objectives need to be performance-
based. In general, broad objectives such as “obtainment of swimable and fishable waters” do not provide the
focus necessary to identify the source or type of pollutants most responsible for non-obtainment, unless translated
into specific quantative limits on individual pollutants.
15Because the existing voluntary approaches to nonpoint source pollution control have not resulted in thedesired water quality improvements, there is increasing policy attention being given to more regulatoryapproaches. There are many possible regulatory policy alternatives for nonpoint source pollution prevention andcontrol. Anderson, DeBossec and Kuch (1990) list five: (a) design standards (i.e., requiring certain practices ortechnologies), (b) performance standards (i.e., limiting the amounts of pollutants), (c) quotas on outputs or inputsand use restrictions, (d) licensing and registration requirements for agro-chemicals and required activity permitsand (e) management plans for selected activities.
49
Performance standards ideally would be arrived at through consideration of the entire eco-system of interest,that is, through use of eco-system management. Thus, eco-systems can be thought of as being comprised ofcommunities of organisms within particular habitats as well as the physical condition under which theseorganisms live. Eco-system management seeks to protect entire systems rather than maximizing someinterests, concerns, species, or environmental attribute that will be detrimental to others. A principle of thisapproach is that systems must be managed to stay within a range of desired conditions that can ensure long-term eco-system viability. Thus, eco-system management focuses on eco-processes rather than specificoutputs.
An agro-environmental example, would be consideration of the eutrophication processes as reducing habitat foraquatic species. If phosphorus is the “limiting factor” for eutrophication--that is, if excessive phosphorus isnecessary for the eutrophication process, then the agro-environmental primary objective should be to reducephosphorus loadings to levels below the critical amounts necessary for habitat-altering entrophication, eventhough other, non-limiting, pollutants may be present in the water. Eco-system management can also includeexpanded cooperative and collaborative roles of various stakeholders in managing the eco-system of interest(see Purvis, 1995).
Textbox 4. Eco-based Management
Performance-based regulations 15 usually are based on the desired environmental quality outcomes—and
are usually expressed as environmental quality standards such as parts per million of a pollutant within a particular
medium. An example of a performance standard would be a “not to be exceeded standard” of 10 parts per
million of nitrogen in water samples within a certain watershed. Ideally, performance standards should be
established based on knowledge of ecosystem functioning, as discussed further in Textbox 4.
Performance-based regulations have advantages over technology-design regulations that mandate the
adoption of certain best management strategies, technologies, or physical structures. That is, performance
standards provide flexibility for the polluter to search for a least cost strategy that achieves the desired result.

50
Clean Water Act. An exception to the generalization that performance standards are missing in agro-environmental federal legislation is the Clean Water Act (CWA) of 1972. This act requires that ConfinedAnimal Feeding Operations (CAFOs), over 1,000 animal units in size, discharge permits. Thus CAFOs are, ineffect, treated as point sources. The stipulated performance standard however, is “no discharge.” Thisstandard exceeds that applied to municipal waste. However, the strict “no discharge standard” limits theadoption of any treatment technologies that require discharge and effectively eliminates CAFOs as participantsin any pollution trading markets. Thus, the CWA use of a performance standard is not a flexible incentive, andthe CWA is not generally considered flexible policy. The inflexibility may explain why the CAFO standardshave been implemented in uneven fashion across states.
Coastal Zone Management Act. In addition, the Coastal Zone Management Act Reauthorization Amendments(CZARA) requires each coastal state to submit approved coastal zone plans which identify design standardsbest suited to solve nonpoint pollution problems. Coastal waters include not only the oceans and Great Lakes,but also watersheds that drain into them, thus the potential impact of CZARA is large. States can use voluntaryincentive mechanisms but have to have mandatory measures if they fail to achieve appropriate levels ofprotection of coastal waters. Here the federal government is, in effect, providing a performance standard forstates but not for producers. Within the CZARA, producers face mandated technologies whether or not theycontribute to pollution problems. The implementation of CZARA provisions for agriculture is still in earlystages. After early efforts to impose strong technology design standard failed, most states appear to beadopting slower processes that favor voluntary approaches.
Textbox 5. Performance Standards: The Clean Water Act and the Coastal Zone Management Act
Furthermore, performance regulations do not require changes in practices or farming systems where no problems
conservation and environmental programs.) The reason performance objectives have not been used traces to the
dominant use of voluntary-payment approaches, such as subsidies for land retirement and best management are
evident. A principal advantage is that the imposition of the performance regulations with the threat of penalty, but
with room for flexible responses, sets in motion public and private research and development processes to lower
the costs of meeting the target (i.e., innovation offsets). Furthermore, performance standards provide increased
certainty for the producer in the sense that the producer can identify when his or her farming enterprise has
achieved acceptable environmental performance.
Despite 60 years of federal conservation and environmental programs for farmers and ranchers, few
performance objectives have been set for the farming industry. (See Textbox 5 for a discussion of the Clean
Water Act and the Coastal Zone Management Act use of performance standards as exceptions to traditional

51
practices, that began during the Great Depression. These approaches reflected public policy objectives to support
farm income in addition to environmental protection. Currently, the “environmental” objectives of the vast
majority of federal programs affecting the industry are generally couched in terms of the use of particular
management technologies (or non-use for toxic pesticides). Alternatively, other federal efforts, such as
compliance strategies, have established “codes of good practice” for farmers receiving public subsides.
The absence of performance standards applied to most agro-environmental problems has profound
implications for the design of flexible agro-environmental policy. Since a flexible policy should ideally specify
what environmental objectives are to be accomplished, but not how these objectives are to be achieved, the logic
is straightforward--without clear, specific and measurable objectives, incentive-based environmental programs will
tend to flounder and fail (Davies and Mazurek, 1996). Such a prognosis would not be so stark if the current agro-
environmental policy of technology-design standards (e.g., best management practices) or land retirement
strategies could be shown to consistently and highly correlate with environmental outcomes. Unfortunately while
the use of some design standards (e.g., buffer and filter strips) correlate better than others, the use of many
design-technologies and poorly targeted land retirements do not necessarily correlate well with achievement of a
given environmental goal (National Research Council, 1993).
However, performance standards are difficult to apply to agro-environmental problems (Able and Shortle,
1991; Foran, et. al, 1991). There are at least two reasons for this difficulty. The first reason is the lack of clearly
distinguished environmental objectives whose achievement can be linked to the reduction of certain farm-source
pollutants. To overcome this missing component requires a political consensus with respect to a given
environment medium (e.g., airshed or watershed) as to the desired objectives. An example of an objective might
be the maintenance of sufficient water quality for a robust blue crab fishery in the Chesapeake Bay specified as
maximum level of certain water contaminants. Another required aspect is the scientific knowledge necessary to
52
link farm-source pollutants to water quality (e.g., Chesapeake Bay), to the environmental objective, (maximum
level of water contaminants) and to the health of wildlife (e.g., blue crabs).
In some situations, this scientific knowledge is available; in others, it is fragmentary but probably
adequate; in still others it is lacking or inconclusive. Often the farm-based pollutant is only one of many pollutants
and other factors impacting the environmental health of the ecosystem of concern--complicating the achievement
of the objective. The scientific knowledge is improving, but in many cases, policy designers have to rely on
proxies and on “informed assumptions” about linkages between agricultural pollutants and the desired
environmental outcome.
The second reason that performance standards are difficult to apply to agro-environmental problems is
that it is often difficult to trace pollutants back to their source or to identify which changes in farm practices and
farm systems will reduce pollutants to acceptable levels under various weather, management, and other site-
specific conditions. While in the future, there may be methods in the future of definitively tracing pollutants to
their source through some type of genetic marking or infrared detection, currently such technologies are in the
experimental phase and have high costs.
As discussed in Section III, an alternative to the physical tracing of pollutants is the use of computer
simulation or mathematical programming models. These models range from single conceptual mass balance
models to sophisticated research models (Ahearn and Whittaker, 1997; National Research Council, 1993).
Models, however, cannot substitute where scientific knowledge is lacking or inconclusive; they are only as valid as
their assumptions. Nevertheless, substantial progress is being made in refining models and incorporating new
knowledge so as to allow site-specific predictions on the transport and fate of pollutants (Ahearn and Whittaker,
1997; National Research Council, 1993).
Despite the difficulties associated with the use of performance regulations, some states are experimenting
with direct, ambient environmental objectives for agriculture in order to encourage flexible responses. For
example, Oregon has established total maximum daily loads (TMDLs) of pollutants, such as nitrates and

53
phosphorus, in rivers and streams that fail to meet designated uses such as swimmable and fishable waters. In the
Oregon experiment, all farmers within targeted watersheds are ultimately in charge of constructing their own set
of management practices to be approved by a local governing body as consistent with achieving the TMDL goals.
Because of the difficulty of linking farm and ranch practices to ambient conditions, however the local bodies have
had to substitute landscape condition standards such as minimum residue on tilled acres and no tail-water irrigation
discharges into streams, for the TMDL goals in targeted watersheds. If producers within the watershed fail to
meet the landscape standards, the state agency can intervene and impose civil fines to secure compliance. Using
performance standards, such as TMDLs as proxied by landscape conditions, is considered more flexible and
efficient by Oregon authorities than tightly regulating land management practices.
Nebraska also uses performance regulations for groundwater in the Central Platte Natural Resources
District. Nebraska’s performance based program is flexible only if producers are farming over aquifers that have
not yet exceeded the threshold. If nitrate levels exceed specific thresholds, then farmers are restricted to certain
agricultural practices. The restrictions increase with increases in groundwater nitrate levels. Florida has also
established performance standards for phosphorus runoff from dairies flowing into Lake Okeechobee. Dairies
can meet the phosphorus standard using any method they desire, however failure to maintain compliance with the
governing water quality programs precipitates state action (Boggess, et. al, 1997).
The Chesapeake Bay Program set performance standards of reducing the amount of nutrients entering
the Bay by the year 2000 to 40 percent of the 1987 amounts as part of an overall goal to restore and protect all
living resources, their habitats and their ecological relationships. The 40 percent reduction was divided into
tributary-specific nutrient reductions, measured in pounds for both nitrogen and phosphorus. Tributary strategies
were to be designed to determine how these reductions were to be achieved. While progress has been made
toward these goals, there are currently adjustments underway to better target tributary goals so that some
tributaries will have to achieve higher percentage reductions than others (Bay Journal, 1997).

54
Political sentiment for using more direct control measures to achieve agro-environmental goals appears to
be spreading as agricultural production concentrates in larger operations. Problems with adequate enforcement of
Confined Animal Feeding Operation (CAFO) permits also influences public sentiment for more protection.
Recent outbreaks of the so-called “cell-from-hell,” the Pfisteria in eastern rivers and coastlines have focused
attention on nutrient pollution stemming from nearby poultry and hog farms. In 1997, pfisteria outbreaks on
Maryland’s Pocomoke and Maryland-Virginia Eastern Shore rivers have killed nearly 20,000 fish and sickened
dozens of people (Bay Journal, 1997).
A forthcoming review of state water quality programs identified 23 states that could place constraints on
agricultural activities through penalty mechanisms (Ribaudo, 1997). Most of these programs are focused on a
particular pollutant or a particular water resource, which suggests that performance objectives are likely to be
included in these state programs. In addition, spurred on by legal action by environmental groups, the
Environmental Protection Agency (EPA) has pledged to work closely with states to “expeditiously” develop Total
Maximum Daily Loads (TMDL) for waters affected or impaired primarily or solely by nonpoint sources.
Whether these state and/or federal standards allow for flexibility in response, however, remains to be seen.
Targeting
Some of the information difficulties in using performance based regulations can be reduced with targeting.
In the Oregon case, information difficulties are reduced by targeting policy attention to particular watersheds, in
Nebraska to the particular concern of groundwater contamination, and in Florida to dairy farms in the Lake
Okeechobee. In some cases, there is need for groups of landowners to coordinate efforts; in others, individual
farms can be monitored for compliance.
Numerous nonpoint source pollution studies have recognized the need for tightly targeting policies toward
a limited number of priority areas, priority concerns, and priority farms (Thornton and Ford, 1985; Maas et al,
1985; Harrington, et al., 1985; Duda and Johnson, 1985 and 1987; Nielson, 1986; Gianessi, et al, 1986; Ribaudo,
1986, 1989; Setia and Magleby, 1987; MacGregor, et al, 1991; National Resource Council, 1993).
55
Targeting programs can reduce the cost and increase the effectiveness of soil and water quality
programs. The need for targeting stems from the realization that, because of the nature of nonpoint source
pollution, and, because of shrinking budgets, it is a cost-effective way to manage agriculturally related water
quality problems. Technical assistance, educational efforts, financial resources, or regulations can all be targeted
to those regions or farm enterprises that cause a disproportionate portion of soil and water quality problems or
areas where water quality improvements are most demanded (National Research Council, 1993).
To be cost-effective, soil and water quality policies designed to control or prevent nonpoint pollution
should be targeted at the areas or farms where the progress toward the policy objective(s) is (are) greatest per
dollar spent. These may be watersheds or farms that, because of their location, production practices, or
management, have greater potential to cause soil degradation or water pollution, or, these may be watersheds that
are most severely affected by pollution. It may be that the greatest return, however, may be found with a
watershed with great demand for high water quality (e.g., recreation demand for high quality waters).
Priority Areas. There are several reasons to focus policy resources on priority areas. First, there is a
concentration of agricultural production in certain regions. Second, there is considerable variation in both
agricultural enterprises and environmental resources between these regions. Such regions may have more water
quality wildlife habitat, air quality or soil quality attributes than others (OTA, 1995b and 1995c). Different regions
will have different capacity to absorb pollution and differing damages from agro-environmental pollution will
emerge. For example, the surface water pollution from agri-chemicals is much greater in the Corn Belt than in
the Southeast, while the loss of wildlife habitat is more of a concern in the Prairie Pothole region than in the Texas
High Plains. Priority regions may be further prioritized into priority areas such as priority watersheds using more
specific, localized information as to agro-environmental problems.
Priority areas targeting can be further refined by consideration of the time of the year and sub-areas
particularly sensitive to unique storm events. The United States Geological Survey (USGS) for example has found
16Alternatively, identification of priority concerns may precede identification of priority areas addressingthat concern.
56
significant peaks of agri-chemical concentrations in Midwest streams following the first major spring rain storm
following chemical application (Mueller and Helsel, 1996).
Priority Concerns. Priority concerns would usually be identified within priority areas16 and would address
issues such as (a) eutrophication of water as a result of excessive phosphorus loadings from either eroded soils or
manure runoff or (b) protection of unconfined groundwater aquifers serving as sole source of drinking water.
Prioritizing high levels of nitrogen and pesticide runoff that lead to habitat destruction might be another example.
For targeting to be successful, the identified priority areas and concerns should represent a much smaller area of
coverage than 100 percent of any state’s agricultural enterprises.
Priority Farms. Available empirical studies also stress the benefits of targeting programs to priority farms
within priority concerns or priority areas. Priority farms are those farms that are prone to pollute more because of
certain farm and soil characteristics, production practices, and farm management practices.
There is increasing evidence that certain farms are responsible for a more than proportional share of
pollution. For example, Carpentier (1996) found that only seven of 237 dairy farms in the Lower Susquehanna
Riverbasin in the Mid-Atlantic region accounted for over 53 percent of the total nitrogen reduction. The seven
farms were closer to water, were on certain soil hydrology types, had higher clay content in their soils, had greater
land slopes and did not use strip cropping. Only half of these seven farms used manure storage. In a related
study by Parsons, et al (1994), site and farm characteristics were related to simulated nitrogen losses on Virginia
cropland sites. The regression results identified commercial and manure nitrogen applications, tillage, soil water
capacity, and slope to be significant explanatory variables of nitrogen losses. The farm characteristics related to
manure nitrogen application were confined livestock, manure importation, manure nitrogen per crop acre and
gross income per acre. The research results indicated that policy makers should target manure-source nutrient
abatement programs toward farms having confined livestock operations, high animal densities, and farms
importing manure.
57
Just as some farms’ locations and production practices and management techniques tend to cause more
soil and water problems than others, many more farms cause little or no water quality problems, and some are
probably improving soil and water quality. Targeting programs at the set of farms that are responsible for most
soil and water quality degradation will reduce the cost and increase the fairness and effectiveness of soil and
water quality programs.
Problems with Targeting. A major problem in using targeting is the need for reliable information. Until
the last few years, information for cost-effective targeting was largely unavailable (Cuyno, 1996) or incomplete
(OTA, 1995b and 1995c). This problem, however, can be ameliorated by augmenting the available data with
expert’s judgement as to problem areas, concerns and farms. Although the results may not be precise, they are
usually sufficient; also, more accuracy can be obtained if expert judgment is augmented by local and regional
expertise.
One powerful tool in bridging the gap in information source for targeting is the Geographic Information
System (GIS) technology. GIS is a computer-based system that is capable of assembling, storing, manipulating
and displaying geographically referenced information (or data identified according to their location) and can be
combined with computer models (He, et. al, 1993). GIS makes it possible to perform analysis of, for example, a
specific wetland area, by combining information from various pooled sources, and in various forms (i.e., maps,
digital-based information). With GIS, for example, it becomes possible to simulate the discharge of materials say,
from farming systems in a pre-identified region upstream from a wetland. GIS can also be used to identify the
locations and characteristics of buffer strips next to streams or priority farms characterized by topographical
features such as slope and distance to streams (see for example, Lee and Lovejoy, 1994; Tim, et. al, 1991 and the
Purdue Study).
Another problem with targeting is that targeting can be politically unpopular. If cost-sharing or other
subsidies are used as incentives to achieve the desired changed farming practices, there is considerable political
pressure to spread the benefits widely. Such wide distribution of benefits garners political support from
58
constituents and is also seen as “fair.” Similar “fairness” arguments apply to the use of penalties; these
arguments are frequently discussed in terms of competitive advantage. That is, if some producers bear penalties
others do not, then they are put to an “unfair” competitive advantage relative to others. While sound arguments
can be offered that “polluters-should-pay” or that, alternatively, cost-sharing should be “invested” to achieve the
greatest environmental returns, the political difficulties of targeting remain.
Flexible Incentives
Providing incentives for farmers to change practices and adopt improved farming systems that can be in
compliance with performance standards is a crucial policy component. However, there remains the question of
whether a positive (e.g., subsidy) or negative incentive (e.g., penalty) is appropriate. In addition, there is the
question as to whether such incentives need to be provided by policy or whether there will be adequate private
market incentives to achieve desired environmental performance goals.
The answer to the latter question of “whether there will be adequate private market incentives without
public policy to achieve desired national environmental goals” appears, at present at least, to be “no.” While there
are food processors and retailers who are requiring the use of such practices as integrated pest management or
certain waste management strategies from their producer-suppliers, and while some commodity associations
encourage environmentally protecting practices, the total impact of these private incentives have not yet achieved
the desired national environmental quality goals.
In some cases--such as Gerber’s requiring certain reduced or no pesticide production practices--the
motivation is not dependent on an agro-environmental policy (for managing pesticide runoff or leaching). In other
situations, however, such as Murphy Farms requiring that their pork suppliers adopt certain waste handling
technologies, the motivation is more likely fear of liability or regulatory sanctions. Thus, public regulation or the
threat of regulation or liability seems necessary to provide the motivation for change; that is, there needs to be
“compliance-push” drivers of change.

17Win-win refers to opportunities to improve both profits and environmental performance.
18Other answers to “who should pay” might be the processing or wholesale firms. Eventually somepenalty costs will be shifted to consumers of the final product even if the first direct impact is on firms.
59
There is evidence that there are some unexploited “win-win”17 opportunities to improve the environment
and profits for some producers. For example, numerous studies have suggested many crop farmers can reduce
the use of commercial fertilizers without reductions in profits through improved nitrogen management strategies
(National Research Council, 1993). While some of these unexploited “win-win” situations may continue to be
unexploited from lack of knowledge, in others, there are institutional barriers to change. For example, if producers
are contracted to processors, if contracts are awarded on the basis of above average yields, and if excess
fertilizers are perceived as crucial to maintaining above average yields every year, then even targeted and tailored
education programs will not necessarily cause farmers to reduce fertilizer inputs to that which matches crop
uptake. Thus, even for some “win-win” situations, there remains a role for public regulatory policy beyond
voluntary education programs.
If public policies are used to obtain environmental quality goals, the issue of “who should pay” becomes
an important policy design question. If the answer to “who should pay” is “the general public,” or “beneficiaries
of less pollution” then positive incentives such as cost-sharing or other subsidies should be offered to producers
who voluntary comply or be given as compensation of producers who face compliance mandates. If the answer
to “who should pay” is “the producer” then the incentive should be to use a negative incentive such as a penalty
for non-compliance.18
It is also possible to have a mixed policy strategy, where a performance standard threshold is set in a
priority area. Producers who fail to meet the standard are penalized, but producers who “over-comply” are
rewarded. This mixed strategy has the advantage of penalizing so-called “bad actors” (i.e., those who refuse to
adopt pollution prevention or control practices) and of rewarding the so-called “good stewards” who attempt to do
as much to protect environmental quality as they can afford.
19Phosphorus in water that is traced to farm systems usually comes either in manures runoff or attachedto sediments. The original source is usually either manures or chemical fertilizers. Phosphorus above .01 ppmappears to create eutrophcation problems in fresh water (National Research Council, 1993).
60
In a mixed strategy, performance standards can be used within a nonpoint agro-environmental program to
establish the responsibilities of a producer versus the general public. For example, a performance standard for
phosphorus in surface water can be set for, say, .005 parts of soluble inorganic phosphorus per million (ppm) in a
particular watershed.19 In this example, producers within the targeted watershed would have a responsibility for
making any changes in their farming systems and practices that would be required to bring the watershed quality
in compliance with the standard without receiving compensation. Such a requirement is similar to the Oregon
experiment mentioned earlier and would require either coordinated action of producers within the watershed or
targeted requirements to certain farms based on the analysis of their phosphorus contribution to the watershed
(perhaps measured by phosphorous saturation levels in soil samples). Producers could respond in any manner
they wish, providing that overall compliance with the phosphorus standard is achieved. Failure to achieve the
standard would be met with some type of penalty.
In this phosphorus standard example, improving or protecting water quality to a lower ambient standard
than .005 ppm would, require public compensation or enhanced benefits for producers (such as property tax
reductions, income tax credits, or pollution credits to be traded within a market-trading system). Use of a
performance standard as a threshold level rewards producers who have been exceptionally good stewards, while
requiring those whose farms pollute beyond the threshold level to change practices without compensation. Thus
as Figure 5 illustrates, negative incentives (e.g., penalties) are used to induce producers to come into compliance,
but positive incentives, (e.g., subsidies) are used for those who exceed compliance and achieve or protect higher
environmental quality standards than the performance standards. Textbox 6 discusses one possible way of using
a mixed strategy, threshold approach in existing legislation such as “Right-to-Farm” legislation. Right-to-Farm
requirements may be voluntary and subsidized for all producers in the state, but for targeted priority farms, a
mixed, threshold approach might be used.

20Environmental economics literature offers many analyses of the design of such environmentalincentives. See for example Hanley, Shogren and White for a detailed review of the use of non-compliance fees(pp. 79-84).
61
Obviously, such a system requires monitoring to assess whether the performance standard is being met.
If information exists to correlate individual farm practices and typography with watershed water quality outcomes,
monitoring can be used to reward and penalize individual producers.20 Alternately, performance standards might
to set as not-to-exceed phosphorous soil saturation limits. If individual producer performance cannot be
monitored, producers would have to operate in concert, sharing as a group in either penalties or rewards. Such
group decision-making will probably work best with cohesive, smaller groups with similar operations, but such
cooperation has precedents found within marketing, input and sales cooperative arrangements.
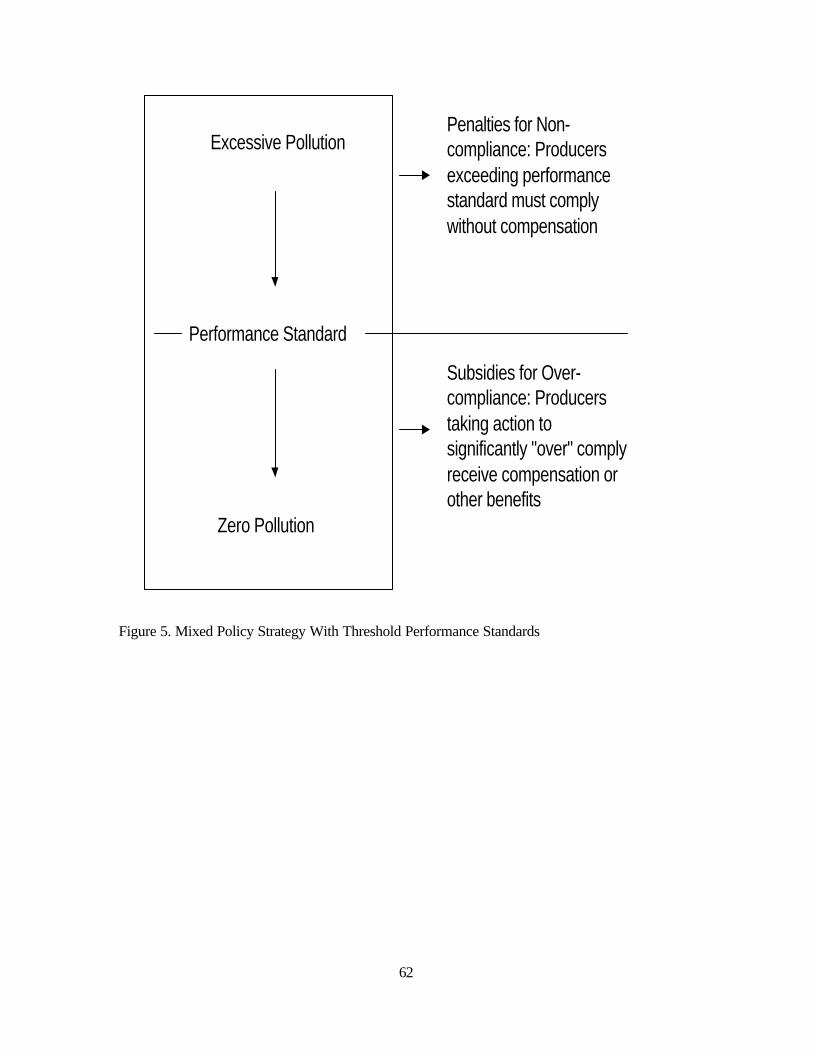
62
Penalties for Non-compliance: Producersexceeding performancestandard must complywithout compensation
Subsidies for Over-compliance: Producerstaking action tosignificantly "over" complyreceive compensation orother benefits
Excessive Pollution
Zero Pollution
Performance Standard
Figure 5. Mixed Policy Strategy With Threshold Performance Standards
63
Threshold performance standards could be embedded in existing voluntary institutions such as Right-to-Farmlegislation. An example of how this type of program might be designed is the establishment of two sets ofRight-to-Farm requirements: one mandatory set for priority farms within priority areas and/or concerns andanother voluntary set for every producer in the state.
Mandatory Requirements. The first set of requirements would be directed at priority farms within priorityareas or who are associated with priority concerns. For these priority areas ambient performance standardswould be set--such as a .01 ppm limit to phosphorus in the water or limits on phosphorus saturation in the soil. Priority farms are assisted by experts through whole farm planning processes to reduce their pollution (e.g.,phosphorus) contributions by a certain amount or to maintain their soils below critical saturation levels. That is,the “ambient” standard within the watershed is converted to a farm level “emission standard,” through the useof scientific information and modeling predictions. Farms must change their farming system to meet theirfarm’s “emission standard” or be penalized. However, while advice and assistance is offered, “how” thefarms meet their emission standard would be each producer’s choice. Priority farms which reduce emissionswell below the standard would receive enhanced cost-sharing and other benefits, such as pollution credits fortrading in point/nonpoint trading markets.
Voluntary Requirements. The second set of requirements would be voluntary for all producers within thestate and would include various recommended, science-based design technologies, practices tailored to differingtypes of enterprises. Record-keeping of the practices used on the farm would be required. If producersvoluntarily followed these recommended practices and kept records available for inspection in case ofsignificant environmental problems, they would receive “benefits” such as exemptions from nuisance suits, use-value assessment, or reduced liability for unforeseen environmental damages from their normal operations.
Alternatively, producers could follow an approved whole farm plan in lieu of adoption of the offered set ofdesign technologies. The reason for the use of various design technologies or adoption of a whole farm plan asrequirements is to reduce administrative costs of monitoring and evaluation of performance outcomes. Also notevery farm within the state is not significantly contributing to pollution. In either case, the second set ofrequirements serves as a positive incentive for all producers to adopt farming practices which are bestcorrelated with both profitable outcomes and with environment-protecting outcomes.
Textbox 6. Right-to-Farm Legislation and Use of Threshold Performance Standards
Tailoring
The fourth basic element of an cost-effective agro-environmental policy is the tailoring of assistance and
information to the particular situation and needs of the farmers who must change their farming practices or
systems if the desired changes in environmental quality are to occur.
64
Producers farm the way they do because of a variety of forces acting on their situation which influence
what is profitable or unprofitable. These forces can be those coming from the market, from policy influences
from personal beliefs, from the choice and cost of available technology, from consultants or friends, from
legislation, or numerous other sources. When the diversity of agricultural landscapes and enterprises is coupled
with the diversity of agricultural producers, it is clear that a “one-size-fits-all” education and assistance program is
inappropriate. Program implementation requires the matching of education and assistance to the targeted
producers circumstances and beliefs this matching is what is meant by a tailored approach.
Thus, a tailored approach involves applying known knowledge to the unique situation of the farmer whose
farm management practices or farming systems needed to change if environmental objectives are to be met. One
method to tailor assistance is to use whole farm planning.
As previously discussed in Section III, whole farm planning is a type of farm management that views the
farm as a system and which incorporates soil quality, water quality and wildlife habitat as part of the farm’s
production system that is, farm’s produce soil quality, water quality, and wildlife habitat as well as crops and
livestock. The construction and implementation of the plan draws heavily on the each producer’s individual
expertise and intimate knowledge of his farm’s natural resources.
Usually whole farm planning involves outside experts and technical assistance to producers. This
marriage of private and public expertise has the potential to achieve the fusion of environmental objectives and
private conservation goals within a competitive farm operation. The composition of the plan focuses on the on-
farm and off-farm environmental objectives as well as the farmer’s production objectives. As such, whole farm
planning creates a farm management plan that varies by farm and by region. This idea supports the notion of a
“tailor-fit” system which is based on flexible farm management planning.
Monitoring, Evaluation, and Enforcement
An effective agro-environmental policy must include enforcement mechanisms that include public
monitoring and evaluation. Public monitoring, however, should not mean that producers be required to adopt
21We are indebted to Professor Pierce of the Department of Crop and Soil Sciences at Michigan StateUniversity for this analogy.
65
certain technical practices such as best management practices (BMPs). Instead, they should engage in
information gathering that allows whole farm planning and which lets then select the unique combination of tillage,
inputs, cropping and livestock practices that best suit their individual operations and which results in the
appropriate level of environmental performance.
Thus, if producers were required to keep records that verified they had engaged in self-monitoring and
self-policing, these records could be accessed by appropriate agency personnel in the event (and only in the event)
of failure to achieve performance standards. Producers would only be responsible for pollution if they could not
show that they engaged in appropriate information gathering, self-monitoring, and any needed corrective action.
With respect to enforcement, there is an analogy between environmental protection and airline safety.21
In the unfortunate case of an airliner crash, the flight recorder (more popularly known as the black box) is
accessed to determine the cause and responsibility for the accident. Information gathered from the black box is
used to take corrective actions and add precautions to avoid a repeat of the situation that lead to the crash. In our
analogy, the crash is an environmental one--the significant and continuing failure to meet the environmental
performance standards. The black box in this situation is the producer’s own records of production information
related to variables that affect environmental quality such as input use and timing. Thus, one attractive attribute of
a agricultural feedback strategy is that it provides a low-cost alternative to continual government monitoring to
assure compliance. Since it is envisioned that the self-monitoring will lead to self-assessment.
If, upon examination, record keeping is in order and shows a good faith effort to use the information
available to maintain appropriate environmental performance, then the producer would be absolved of
responsibility of a decline in environmental quality in the producer’s region. Furthermore, he or she would not be
required to take uncompensated for corrective action in the farm’s operation. The producer’s guide, as well as
the indicator which the public authorities could use to evaluate whether the producer is conducting
“environmentally-safe” production, could be the “quality control limits” discussed in the previous section. In

66
essence, those who have been operating within these “limits” or bands, should be entitled to liability protection for
any continuing agro-environmental problem. Only those producers who have consistently operated beyond the
maximum limits of their “control quality indicators” should be subject to penalties or other legal reprimands.
Because of the paucity of information that links farm systems and various topographies to environmental
outcomes, however, an interim enforcement strategy may need to be adopted. That is, enforcement may be
based on “assumed good faith compliance” defined as the ability of the producer to demonstrate, through careful
record-keeping, that he or she is following an “approved” whole-farm plan.
The Challenge
Clearly there remains considerable policy and information gaps in designing and implementing agro-
environmental policies that contain the basic elements of an ideal agro-environmental policy that would encourage
agricultural environmental management. Policy and information gaps include the lack of established reference
levels for various environmental quality attributes--be they those of ecological processes or the provision of
amenities. The criteria for targeting to priority areas (e.g., critical watersheds), priority concerns (e.g., animal
manures), or priority farms within priority areas (e.g., those farms adjacent to riparian areas) needs to be
established as part of policy design. The policy mechanism that will provide incentives for changed farming
practices must be part of policy design as well. The development of indicators to monitor and evaluate changes in
environmental quality is still at an early stage.
Progress is being made in all these areas and designing policies targeted to priority areas, concerns, and
farms and developing whole farm systems that minimize the “escape” of such potential pollutants from the farm is
a realistic goal. While there are not yet many models of agricultural environmental management to illustrate the
concept there are a few. One is a food safety oriented agricultural environmental management program--The
California Egg Quality Assurance Program. Another is a “green code of good conduct” for pork producers: the
Pork Industry’s Environmental Assurance Program. Both programs appear to have been motivated by the desire
for enhanced public image and fear of future liability. While the California Egg Quality Assurance Program has

67
third-party verification and the National Pork Producers Council’s Environmental Assurance Program does not,
both programs provide illustrations of how many of the concepts discussed in this report can be and are being
implemented in agriculture.
The California Egg Quality Assurance Plan
The components necessary for effective agricultural environmental management are demanding:
C appropriate public and consumer incentives for agricultural environmental management
C whole farm audits and environmental plans
C establishment of quality control indicators and research-based feedback mechanisms
C provision of producer-friendly information and technical assistance
C monitoring, documentation, verification and enforcement.
Not surprisingly, at this early date in agro-environmental policy, there are not many existing examples of
agricultural environmental management with all these components. After all agro-environmental policy addressing
nonpoint pollution is relatively new and many difficulties remain stemming from lack of appropriate information.
However an example that has most elements of a environmental management strategy is provided by the
California Egg Quality Assurance Plan. This Plan focuses, however on food safety issues rather than
environmental outcomes but it is illustrative none-the-less.
The example of the California Egg Quality Assurance program provides an example of the key
components of a successful program: a regulatory (i.e., compliance-push) and consumer demand (i.e., demand-
pull) motivation for participation, an environmental audit and whole farm system plan, monitoring and verification,
documentation, and enforcement. While the program has many of the key components there are requirements as
to how to achieve objectives as well as specifying performance standards. Despite the lack of flexibility, this
assurance program is well worth studying.
While the California Egg Quality Assurance is only a few years old, many view it as a success and a
model for the nation. The Assurance Program was developed by the California Egg Industry in Cooperation with

22Ideally, the establishment of critical control points would be based on probable reduction of the mostimportant food safety risks.
68
the California Department of Food and Agriculture, the U.S. Department of Agriculture, the University of
California Cooperative Extension Service, the California Veterinary Diagnostic Laboratory System, California
Department of Health Services and the U.S. Food and Drug Administration. Clearly, partnerships of industry and
agencies is apparent within this program.
Consumer and industry concerns with salmonella contamination of eggs, plus existing and foreseeable
national legislation addressing food safety motivated the egg industry to join in a non-regulatory, agricultural
environmental management program to assure egg quality. The goal of the program is for “each producer to be
able to provide evidence that his products were produced in a safe and wholesome manner” (Breitmeyer, 1997).
This program addresses a human health food safety concern--salmonella contamination of eggs. This
particular environmental management strategy follows a Hazard Analysis Critical Control Points (HACCP) plan.
The HACCP plan contains seven principles to guide firms through a process that essentially includes an
environmental audit, a redesign of the farm system, to an operation and maintenance strategy, to quality control
and self-monitoring.22 The seven principles relate to assure food safety and were initially designed for industrial
food processors and they are:
1. Conduct a hazard analysis
2. Identify critical control points
3. Establish critical limits
4. Monitor the critical control points
5. Determine appropriate corrective action
6. Maintain accurate record keeping
7. Verification: Ensure the system works.
The California Egg Quality Assurance Plan applies the HACCP principles to the farm level. Training,
record keeping and science-based research are integral comments of the Assurance Plan. The program has

69
twenty components organized under three general core areas: administrative, production and processing. In
general, these components involve the development of a farm premises, flock and egg quality assurance plan with
employee training, supervision, and record keeping, the purchasing of feed and chicks from certified sources that
have acceptable salmonella prevention and control programs; effective flock health maintenance programs,
disinfecting of facilities, fly and rodent control and biosecurity plans for the farm; as well as following stringent
processing, packaging, labeling and transporting guidelines.
In addition, assurance plans developed by each egg ranch are validated by the California Department of
Food and Agriculture. Critical limits for cleaning, disinfecting, flock health, and rodent control are selected as part
of the plan by the rancher, as are the corrective actions to be taken if the critical limits are exceeded. There must
also be periodic sampling and testing of fecal material for salmonella bacteria and careful documentation. Any
salmonella bacteria found on the ranch premises call for immediate quarantine and suspension of egg sales until
the problem is identified and corrected. There is also a research component to the program: research is directed at
understanding the ecology of salmonella. The agency and university partners provide educational sessions and
stand ready to assist in implementation of plans and problem-solving.
While participation in the program is voluntary, Egg Quality Assurance Program participants must agree
to keep records documenting successful completion of their quality assurance ranch specific plan. These records
much be available to veterinarians from the California Department of Food and Agriculture. Furthermore, every
ranch must have a trained Quality Assurance Supervisor to supervise employees and the implementation of the
quality assurance plan. Careful documentation provides liability protection to an egg rancher should any
salmonella outbreaks occur in eggs in their market area. It is reasonable to anticipate that some retailers will soon
require that their egg suppliers be certified within the egg quality assurance program, thus adding an additional
market incentive for participation a certified seal also may be rewarded with consumer purchases of only certified
eggs.
The National Pork Producers Council’s Environmental Assurance Program

70
The Pork Industry’s Environmental Assurance Program (EAP) is a voluntary proactive educational
program that includes a half day workshop for pork producers led by local experts and an “on-farm”
environmental assessment. It is designed to enable a producer to identify key management issues that will affect
environment quality, and it encourages record-keeping and self-monitoring to assure compliance with current
regulations. It emphasizes understanding current environmental regulations as well as fundamentals of hydrology
and geology that influence potential pollution from hog manure. The assurance program is designed to encourage
the development and adoption of nutrient management plans. Like the California Quality Egg Assurance
Program, the EAP identifies critical control points for pollution prevention--including manure generation, storage,
transportation and application. The EAP also emphasizes the importance of monitoring the plan, taking corrective
action, and maintaining good records. The assurance program is a “green code of good conduct” for pork
producers and includes most of the necessary components of a agricultural environmental management. Like
most “green-codes,” the assurance program does not require any third-party verification that pork producers are
implementing environmental management techniques. Nevertheless, the program attempts to move hog farms
from pollution-prone enterprises toward information-rich, pollution prevention enterprises.
The National Pork Producers explain to their members their motivation for the program:Investing in environmental action now pays off in both short and long-term dividends. Short-termenvironmental dividends, like improved profits, reduced problems and enhanced relationships, canbe straight to your bottom line.
Equally important, the long-term growth of the entire pork industry will be directly affected by theenvironmental sensitivity, knowledge and action of each producer. We must all work together, beproactive, and reflect our personal and industry-wide dedication to conserving the environment. And, it is critically important that as we do this, we also let the American public know it(http:\\www.nppc.org).
It may well be that, like the California Egg Quality Assurance Program “demand-pull” motivating factors
will be added to “compliance-push” in the near future if wholesalers and retailers begin to demand the pork they
purchased from producers who have obtained an Environmental Assurance certificate.
71
Section V. Summary and Conclusions
Agro-environmental issues are now mainstream public concerns, as the public increasingly recognizes that
there are significant linkages between crop health, livestock health, environmental health, and human health.
Furthermore, after three decades of regulatory environmental policy directed at point pollution sources, the policy
attention is now directed at agro-environmental nonpoint pollution. Despite considerable progress on conserving
soil erosion and wildlife habitat, past public programs have not achieved solutions to many serious agro-
environmental problems identified by the public. Continuation of these past programs is not likely to achieve such
improvements in the future, particularly with constrained budgets for many of the traditional agencies.
At the same time, environmental policy in general is maturing, and there is currently considerable
experimentation with more flexible, incentive-based policies. Similarly many businesses are turning to
environmental management as a crucial strategy for their business. As one such business person noted: “I want
everything that leaves this business to be sold.” This expression was this person’s way of expressing the concept
that waste and pollution are flaws in system design to be minimized. That is, some businesses have replaced
pollution control with pollution prevention. In so doing, some businesses have found that the presumed tradeoff
between environmental quality and profits does not always apply; business-system redesign can enhance both
environmental and financial performance.
These corporate environmental initiatives appear to stem from two main sources: (1) a desire to lower
costs and/or improve profits while achieving or exceeding environmental regulatory compliance (i.e., “compliance
push”), and/or (2) a desire to respond to consumer demands for more environmentally friendly processes and
products (i.e., “demand pull”). As public attention turns to agro-environmental pollution, there are lessons to be
learned from the history and evolution of point source pollution policy. It is quite possible that agro-environmental
policy need not follow the path of command and control, but rather it could implement more flexible policies that
provide the incentive and assistance necessary for agricultural environmental management. Pursuit of private
approaches to agro-environmental pollution appears to be cost-effective and possible, but blindly shifting more
72
responsibility to businesses may only make some agro-environmental situations worse (Batie and Ervin, 1997b). It
is essential that the appropriate policy context and the limitations to private business approaches be understood, if
agro-environmental goals are to be achieved.
Because demand-pull forces are presently inadequate to achieve significant agro-environmentally
improvements. There is a necessary public policy role: to set and enforce clear agro-environmental goals while at
the same time providing flexibility to producers. If producers are to use this flexibility and change their enterprises
from pollution-prone ones to information-rich, pollution preventing ones, they will need tailored assistance as well.
Such tailored assistance should be designed to enable them to conduct environmental audits, to develop whole
farm plans, and to monitor and self-evaluate with quality control indicators. There is a crucial need for investing in
producers’ management skills that enable the producer to manage an integrated system.
Obviously, there are numerous information and policy gaps currently that mean the pursuit of flexible,
agricultural environmental management will, for a time, have to rely on second-best approaches. But adopting the
vision of agricultural environmental management and gleaning lessons from corporate environmental management
should avoid an ad hoc refining of past agro-environmental and conservation policies. There is no evidence that
mere refinement of past policies will provide the necessary agro-environmental improvement demanded by the
public. By focusing on the necessary policy context and the appropriate components of agricultural environmental
management, dynamic forces should be set into motion that should eventually led to closing the information and
policy gaps.

73
References
Abel, D.G. and J.S. Shortle. 1991. “The Political Economy of Water Quality Protection From Agricultural
Chemicals.” Northeastern Journal of Agricultural and Resource Economics 20(April): 53-60.
Ahearn, Mary C. and Gerald W. Whittaker. 1997. “Sustainability Challenges of Cross-Disciplinary Research.”
Unpublished paper. Washington, D.C., Economic Research Service, U.S. Department of Agriculture.
Anderson, G.D., A.E. DeBossec, and P.J. Kuch. 1990. “Control of Agricultural Pollution by Regulation.” In J.B.
Braden and S.B. Lovejoy (eds.), Agriculture and Water Quality: International Perspectives. Boulder,
CO: Lynne Rienner Publishers.
Andrews, Clinton. 1994. ‘Policies to Encourage Clean Technologies,” In R. Socolow, C. Andrews, F. Berkhout,
and V. Thomas. Industrial Ecology and Global Change. Cambridge, MA: Cambridge University Press,
pp. 405-422.
Ayers, Robert U. and Leslie W. Ayers. 1996. Industrial Ecology: Toward Closing the Materials Cycle .
Brookfield: Edward Elgar.
Batie. Sandra S. 1997. “Environmental Issues, Policy and the Food Industry,” in L.T. Wallace and W.R. Schroder
Perspectives on Food Industry Government Linkages. Boston: Kluwer Academic Publishers, pp. 235-
236.
Batie, Sandra S. and David E. Ervin. 1997. “Will Business-led Environmental Initiatives Grow in Agriculture?” In
Business-led Initiatives in Environmental Management: The Next Generation of Policy? Proceedings
of the AAES Preconference, Toronto, Ontario, Canada, July 26, 1997.
Batie, Sandra S. and David E. Ervin, (forthcoming). “Flexible Incentives for Environmental Management in
Agriculture: A Typology.” In Flexible Incentives for the Adoption of Environmental Technologies in
Agriculture. Edited by C.F. Casey, A. Schmitz, S. Swinton, and D. Zilberman. Boston: Kluwer Academic
Publishers (forthcoming, 1999).
74
Blankership, K. 1997 (December). “Review Warns 40 Percent Goal Will Not Be Enough.” Bay Journal 7(9): 1
and 14.
Blue Ribbon Panel on National Resource Inventory and Performance Measurement. 1995 (November). Data
Rich and Information Poor. A Report to the Chief of the Natural Resources Conservation Service.
Washington, D.C.: USDA, NRCS.
Boggess, W., G. Johns and C. Meline. “Economic Impacts of Water Quality Programs in the Lake Okeechobee
Watershed, Florida.” Paper presented to the American Dairy Science Association Symposium on Manure
Management, Corvallis, Oregon. (1997?)
Breitmeyer, Richard. 1997. “Enhancing Food Safety Partnerships.” Paper presented at the Farm Foundation
Bennett Roundtable, Monterrey, California, (June).
Carpentier, Chantal Line. 1996. “Value of Information for Targeting Agro-Pollution Control: A Case Study of the
Lower Susquehanna Watershed.” Unpublished Dissertation. Blacksburg, VA: Department of Agricultural
and Applied Economics, Virginia Polytechnic Institute and State University.
Cuyno, Leah. 1996. “Targeting Areas as a Cost-Effective Method of Agricultural Nonpoint Pollution Control.”
Plan B Research Paper. East Lansing, MI: Department of Agricultural Economics, Michigan State
University.
Davies, Terry and Jan Mazurek. 1996 Industry Incentives for Environmental Improvement: Evaluation of
U.S. Federal Initiatives. Washington, D.C.: Global Environmental Management Initiative.
Duda, A.M. and R.J. Johnson. 1987. “Targeting to Protect Groundwater Quality.” Journal of Soil and Water
Conservation 42(5): 325-331.
Duda, A.M. and R.J. Johnson. 1985. “Cost-effective Targeting of Agricultural Nonpoint Source Pollution
Controls.” Journal of Soil and Water Conservation 40(January-February): 108-111.
75
Ervin, David E. 1995. “A New Era of Water Quality Management in Agriculture: From Best Management
Practices to Watershed-Based Whole Farm Approaches.” (Forthcoming article in the Water Resources
Update).
Foran, J.A., P. Butler, L.B. Cleckner and J.W. Buckley. 1991. “Regulating Nonpoint Source Pollution in Surface
Waters: A Proposal.” Water Resources Bulletin 27: 479-484.
Gianessi, Leonard P., Henry M. Peskin, Pierre Crosson and Cindi Puffer. 1986. Nonpoint Source Pollution
Controls: Are Cropland Controls the Answer? Washington, D.C.: Resources for the Future.
Gottlieb, Robert. 1995. Reducing Toxics: A New Approach to Policy and Industrial Decision Making.
Washington, D.C.: Island Press.
Hanley, N., J.F. Shogren and B. White. 1997. Environmental Economics: In Theory and Practice. New York:
Oxford University Press.
Harrington, Winston, Alan J. Krupnick and Henry M. Peskin. 1985. “Policies for Nonpoint Source Water Pollution
Control.” Journal of Soil and Water Conservation 40(1): 27-32.
He, C., J.F. Riggo and Y. Kang. 1993. “Integration of Geographic Information Systems and a Computer Model to
Evaluate the Impacts of Agricultural Runoff on Water Quality.” Water Resources Bulletin 29(6): 891-
1000.
Higgins, E. Forthcoming. Whole Farm Planning: A Survey of North American Experiments. Policy Studies
Report. Washington, D.C.: Henry A. Wallace Institute.
Hoffman, Andrew J. 1997. From Hearsay to Dogma: An Institutional History of Corporate
Environmentalism. San Francisco: The New Lexington Press.
John, Dewitt. 1994. “Civic Environmentalism: Alternatives to Regulation in States and Communities.” Washington,
D.C.: Congressional Quarterly Press.

76
Jones, Maggie. 1997. “Whole Farm Planning as Industrial Ecology.” Paper presented at “Corporate Initiatives in
Environmental Management: The Next Generation of Policy?” Learning Workshop, American
Agricultural Economics Association Meetings, Toronto, Ontario, Canada, July 26, 1997.
Kemp, Loni. 1996 (July). “Successful Whole Farm Planning: Essential Elements Recommended by the Great
Lakes Basin Farm Planning Network.” St. Paul, MN: The Minnesota Project.
Krol, Andre. 1995. “Environmental Management-Issues and Approaches for an Organization,” in Michael D.
Rogers, editor. Business and the Environment. London: MacMillian Press.
Larson, W.E. and B.A. Stewart. 1992. “Thresholds for Soil Removal for Maintaining Cropland Productivity, pp. 6-
14. In Proceedings of the Soil Quality Standards Symposium, San Antonio, Texas, October 23, 1990.
Larson, W.E. and Frank J. Pierce. 1994. “The Dynamics of Soil Quality as a Measure of Sustainable
Management.” In Defining Soil Quality for a Sustainable Environment, Soil Science Society of
America, Special Publication #35, Madison, Wisconsin.
Lee, John G. and Stephen B. Lovejoy. 1994 (December 28). “Land Area Available and Characteristics for
Riparian Buffers to Control Agricultural Nonpoint Source Pollution: A GIS Approach.” Report prepared
for the Office of Policy Analysis, U.S. Environmental Protection Agency (Subcontract # 3-350-5726).
Maas, R.P., M.D. Smolen and S.A. Dressing. 1985. “Selecting Critical Areas for Nonpoint Source Pollution
Control.” Journal of Soil and Water Conservation 40(1): 68-71.
MacGregor, Robert D., Judith A. Maxwell and Fred J. Hitzhusen. 1991. “An Operational Model for Targeting
Erosion Remediation on the Basis of Partial-Off-Site Damage Assessments.” Journal of Soil and Water
Conservation 46(4): 301-304.
Mueller, David and Dennis R. Helsel. 1996. Nutrients in the Nation’s Waters Too Much of a Good Thing?
U.S. Geological Survey Circular 1136. Washington, D.C.
77
Munson, Robert D. and C. Ford Runge. 1990. “Improving Fertilizer and Chemical Efficiency Through ‘High
Precision Farming’.” Minneapolis, Center for International Food and Agricultural Policy, University of
Minnesota.
Nash, Jennifer and John Ehrenfeld. 1996. “Code Green: Business Adopts Voluntary Environmental Standards.”
Environment 36(1).
National Research Council, (NRC). 1993. Soil and Water Quality: An Agenda for Agriculture. Washington,
D.C.: National Academy Press.
National Research Council, (NRC). 1997. Precision Agriculture in the 21st Century: Geospatial and
Information Technologies in Crop Management. Washington, D.C.: National Academy Press.
Netherwood, A. 1994. The Standardization of EMS. London: Earthscan Publications Ltd.
Nielson, James. 1986. “Conservation Targeting Success or Failure?” Journal of Soil and Water Conservation
41(2): 70-76.
Norris, Patricia E., Japson K. Harper, Laura L. Crockerham, and George L. Greaser. 1993 (February).
“Evaluation of the PLANETOR Software for Integrated Crop Management Participants.” Report to
USDA-ES Cooperative Agreement 91-EXCA-3-0144. Washington, D.C.: USDA.
Office of Technology Assessment. 1995a. Agriculture, Trade, and Environment: Achieving Complementary
Policies. OTA-ENV-617. Washington, D.C.: Government Printing Office.
Office of Technology Assessment. 1995b. Targeting Environmental Priorities in Agriculture: Reforming the
Conservation Reserve Program and Other Strategies. Interim Report, OTA-ENV-625. Washington,
D.C.: Government Printing Office.
Office of Technology Assessment. 1995c. Targeting Environmental Priorities in Agriculture: Reforming
Program Strategies. OTA-ENV-640. Washington, D.C.: Government Printing Office.
Palmer, Karen, Wallace E. Oates, and Paul R. Portney. 1995. “Tightening Environmental Standards: The Benefit-
Cost or the No-Cost Paradigm?” Journal of Economic Perspective 9(4) Fall.
78
Parsons, R.L., J.W. Pease and D.J. Bosch. 1994. “Developing Tools for Targeting Water Quality Programs:
Simulating Nitrogen Losses From Survey Data.” Staff Paper. Blacksburg, VA: Department of
Agricultural and Applied Economics, Virginia Polytechnic Institute and State University.
Pierce, Francis J. and W.E. Larson. 1993. “Developing Criteria to Evaluate Sustainable Land Management,” pp.
714. In J.M. Kimble (ed.), Utilization of Soil Survey Information for Sustainable Land Use.
Washington, D.C.: Soil Conservation Service, U.S. Department of Agriculture.
Porter, Michael E. and Claas van der Linde. 1995a. “Green and Competitive.” Harvard Business Review
September-October.
Porter, Michael E. and Claas van der Linde. 1995b. “Towards a New Conception of the Environment-
Competitiveness Relationship.” Journal of Economic Perspectives 9(4) Fall.
Power, S.J. and C. Cox. 1994. “Value-driven Organizations: A New Look at Corporate Environmentalism.” In
Greener Management International, pp. 29-35 (Journal?)
Purvis, Amy. 1995. “Ecosystem Management: Origins and Implications.” Faculty Paper Series, Department of
Agricultural Economics, FP 95-2. College Station, Texas A&M University.
Ribaudo, Marc O. 1986. “Consideration of Offsite Impacts in Targeting Soil Conservation Programs.” Land
Economics 62(4): 402-411.
Ribaudo, Marc O. 1989. “Targeting the Conservation Reserve Program to Maximize Water Quality Benefits.”
Land Economics 65(4): 320-331.
Ribaudo, Marc O. 1997. “Managing Agricultural Non-Point Source Pollution: Are States Doing the Job?” Draft
paper for Resource Policy Consortium meeting, Washington, D.C., June.
Russell, C. and D. Powell. 1996. “Choosing Environmental Policy Tools,” In Environmental Policy for
Economies in Transition: Lessons Learned and Future Directions, M. Livingston (ed.). Greeley, CO:
Resource Policy Consortium Proceedings.
79
Scott, David W. and Gerald Whittaker. 1996. “Multivariate Applications of the ASH in Regression.”
Communications in Statistics 25: 2521-2530.
Setia, Parveen and Richard Magleby. 1987. “An Economic Analysis of Agricultural Nonpoint Pollution Control
Alternatives.” Journal of Soil and Water Conservation 42(6): 427-431.
Shelton, Robert D. 1995. “The Greening of American Industry,” in Michael D. Rogers, Editor. Business and the
Environment. London: MacMillan Press.
Shortle, James S. and James W. Dunn. 1986. “The Relative Efficiency of Agricultural Source Water Pollution
Control Policies.” American Journal of Agricultural Economics 68: 668-677.
Smith, R.A., R.B. Alexander and M.G. Wolman. 1987. “Water Quality Trends in the Nation’s Rivers.” Science
235: 1607-1615.
Srinivasan, R. and J.G. Arnold. 1994. “Integration of a Basin-Scale Water Quality Model With GIS.” Water
Resources Bulletin 30: 453-462.
Sullivan, Thomas F.P. 1992. The Greening of American Business: Making Bottom-Line Sense of
Environmental Responsibility. Rockville, MD: Government Institutes, Inc.
Swinton, Scott. 1997. “Precision Farming as Green and Competitive.” Paper presented at “Corporate Initiatives in
Environmental Management: The Next Generation of Policy?” Learning Workshop, American
Agricultural Economics Association Meetings, Toronto, Ontario, Canada, July 26, 1997.
Tebo, Paul V. and Dawn G. Rittenhouse. 1997. “Sustainable Development: Creating Business Opportunities at
DuPont.” Corporate Environmental Strategy 4(3): 5-14
The Bay Journal. 1997. 7(4): June.
Thornton, K.W. and D.E. Ford. 1985. “Identifying Critical NPS Contributing Watershed Areas.” In Perspectives
on Nonpoint Source Pollution: Proceedings of a National Conference. Washington, D.C.: Office of
Water Regulation and Standards, U.S. Environmental Protection Agency.
80
Tim, U.S., S. Mostaghimi and V.O. Shanholtz. 1992 (May). “Identification of Critical Nonpoint Source Areas
Using GIS and Water Quality Monitoring.” Water Resources Bulletin 28: 877-887.
U.S. Department of Agriculture, Natural Resources Conservation Service (USDA, NRCS). 1995. “National
Survey of Attitudes Towards Agricultural Resource Conservation.” Unpublished Gallup Report.
van Ravenswaay, Eileen O. 1996. “Emerging Demands on Our Food and Agricultural System: Developments in
Environmental Labeling.” Staff Paper 96-88. East Lansing, MI, Department of Agricultural Economics,
Michigan State University.
Welford, R. and A. Gouldson. 1993. Environmental Management and Business Strategy. London: Pittman
Publishing.
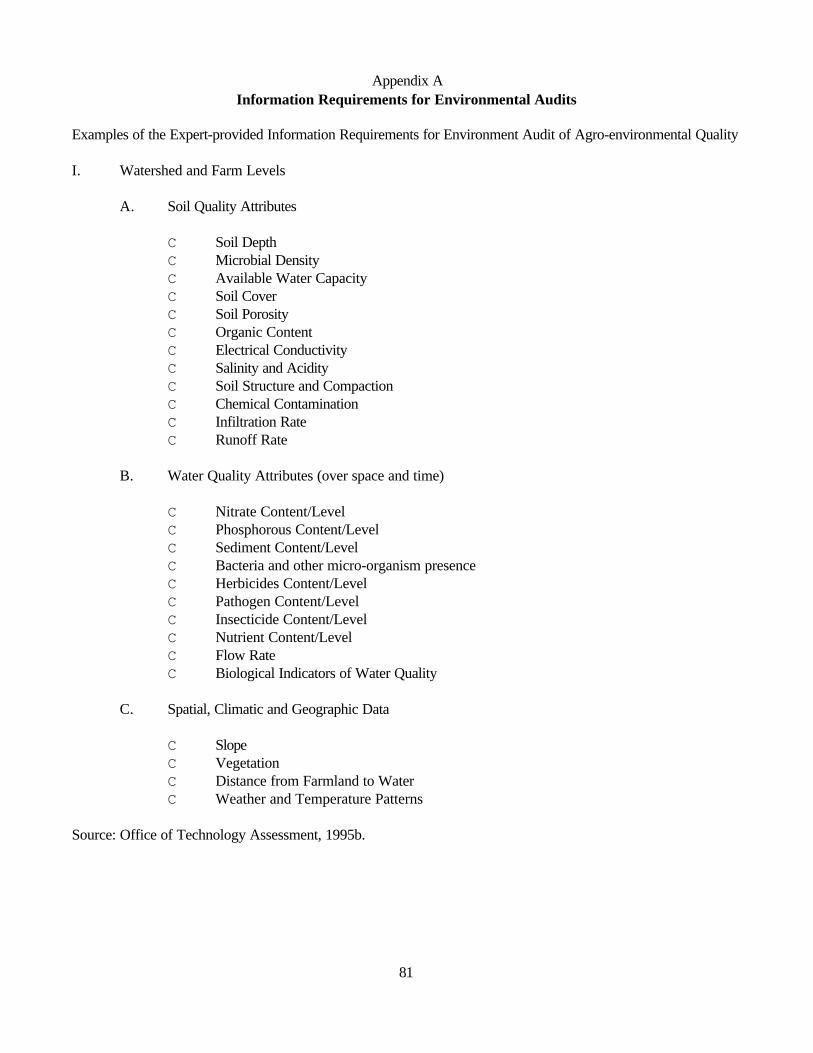
81
Appendix AInformation Requirements for Environmental Audits
Examples of the Expert-provided Information Requirements for Environment Audit of Agro-environmental Quality
I. Watershed and Farm Levels
A. Soil Quality Attributes
C Soil DepthC Microbial DensityC Available Water CapacityC Soil CoverC Soil PorosityC Organic ContentC Electrical ConductivityC Salinity and AcidityC Soil Structure and CompactionC Chemical ContaminationC Infiltration RateC Runoff Rate
B. Water Quality Attributes (over space and time)
C Nitrate Content/LevelC Phosphorous Content/LevelC Sediment Content/LevelC Bacteria and other micro-organism presenceC Herbicides Content/LevelC Pathogen Content/LevelC Insecticide Content/LevelC Nutrient Content/LevelC Flow RateC Biological Indicators of Water Quality
C. Spatial, Climatic and Geographic Data
C SlopeC VegetationC Distance from Farmland to WaterC Weather and Temperature Patterns
Source: Office of Technology Assessment, 1995b.
82
Appendix BFactors Used in the PLANETOR Program
Environmental Standards
PLANETOR uses six environmental factors over the life of a farm plan. Each of the factors is a model
by itself. For purposes of description, the six environmental criteria are listed as follows.
Each of the environmental factors described in PLANETOR is a complete model by itself, but together
they provide a complete description of the trade-offs associated with changes to a farmer’s operations.
A more technical description of each model is contained in the technical notes of PLANETOR Users’
Manual.
A) Soil Erosion. To estimate soil erosion by water, PLANETOR uses the Revised Universal Soil Loss
Equation. PLANETOR uses the soil characteristics, erosivity of rainfall, slope length and steepness, tillage and
plant growth impacts on crop cover, and specific field practices (such as terracing) to estimate annual soil loss.
B) Pesticide Leaching and Runoff. For pesticide leaching and runoff, PLANETOR uses the University
of Florida Soil and Water Science Department model for measurement, which ranks pesticide based on chemical
properties, soil interaction, application method and timing. Pesticide application weighing factors are used to
estimate the possibility of the pesticide (as determined by its active ingredients) to leach or runoff, and to estimate
the fraction of foliar applications that might stay on the foliage, and therefore not be subject of leach or runoff. In
addition, soil ratings for pesticide leaching and runoff are stored in the PLANETOR database and are assigned
using the Soil/Pesticide Interaction.
C) Pesticide Toxicity. PLANETOR uses the applicator hazard to estimate pesticide toxicity. This
information is gathered from the pesticide label (can be a caution, warning, danger, or danger/poison). “Caution”
means that the pesticide product has a relatively low level of toxicity. All other labels suggest that special
protective measures must be followed depending on the level of possible danger to health and the environment.
83
D) Nitrogen Leaching. To estimate nitrogen leaching, PLANETOR uses the design developed by the
Agricultural Research Service in Colorado. PLANETOR implements the monthly time-step approach portion of
the Nitrogen Leaching and Economic Analysis Package (NLEAP) which basically means that water and nitrogen
budgets are calculated at the end of each month throughout the crop rotation. Soil profile is divided into two
horizons, the upper foot and the lower foot down to the bottom of the root zone or root-restricting layer (up to a
maximum of five feet). In this approach, soil carbon and nitrogen transformation are estimated in terms of
denitrification, volatilization, mineralization or soil organic matter, nitrification, and mineralization-immobilization
associated with crop residues and manure. PLANETOR reports two amounts from the nitrogen leaching model:
projected nitrate-N available for leaching (NAL), and projected nitrate-N leached (NL). NAL is computed each
month to estimate NL. NL is the exponential relationship between NAL, soil porosity, and water availability for
leaching.
E) Phosphorous Runoff. The phosphorous runoff is determined in PLANETOR by using the
Phosphorous Index developed by the Natural Resources Conservation Service Phosphorous Index Core Team.
This Index is a matrix that relates site characteristics with the range of value categories and is used to assess the
various land form and management practices for potential risk of phosphorous movement to water bodies. The
ranking identifies sites where risk of phosphorous movement is relatively higher than in other sites and relates
these with the site characteristics (rated low, medium, high or very high in vulnerability to phosphorous leaching).
F) Wind Erosion. This factor is currently being developed.
Economic Standards
PLANETOR evaluates three economic factors to allow the users to gauge the financial viability of
alternative farm plans. These are as follows:
A) Profitability - This is measured by net farm income representing the returns to labor, management, and
equity capital invested in the business.
B) Liquidity - PLANETOR projects an average annual cash flow in the following manner:

84
Net Cash Farm Income; +Nonfarm Income; -Family Living; -Income Taxes and Social Security; -Debt
Payments; -Equipment Replacements; =Cash Surplus or Deficit
C) Future Net Worth - PLANETOR measures future net worth growth by calculating the average annual
projected change in net worth.