STAFF PA PER June 2012 eting ntation re - Home | … · STAF IASB Me Project Paper to CONTACT(This...
28
The IASB is the in information visit w STAF IASB Me Project Paper to CONTACT( This paper IASB and d the applicat Technical d Purpose 1. Thi rese Seg aca con Structure 2. The (a) (b) (c) (d) (e) Introduct 3. Thi liter ndependent standard www.ifrs.org FF PA eeting Pos pic App (S) Ann T April P has been prep oes not repres tion of IFRSs d ecisions are m is paper con earch and o gments. Thi ademic litera ntain questio e of the pa e paper is or Introdu Overvi Append Append Append tion is paper acc rature to M d-setting body of th APER t-impleme endices: S Tarca Pitman pared by the s sent the views do not purport made in public ntains appen ther reports is paper acc ature to Ma ons for the B aper rganised as uction ew of resea dix A: Acad dix B: Acad dix C: Othe companies J ay 2012—p e IFRS Foundation, entation re Summary o ata apit staff of the IFR s of the IASB o t to set out acc c and reported ndices that p s about the i companies J y 2012—pr Board. follows: arch method demic resea demic resear er research o June 2012 B preliminary , a not-for-profit cor eview of IF of relevant [email protected] t[email protected]g RS Foundation or any individu ceptable or un d in IASB Upda provide deta impact of th June 12 Boa reliminary f ds arch on IFRS rch on IFRS on IFRS 8 – Board Paper findings’. rporation promoting IA J FRS 8 literature t + g + n for discussio ual member o nacceptable a ate. ails of the fi he applicatio ard Paper 12 findings’. T S 8 – List o S 8 – Summ – Published r 12B ‘Revie It includes g the adoption of IF ASB Agend une 2012 o May 201 +44 (0)20 724 +44 (0)20 724 on at a public m f the IASB. Co pplication of IF indings of a on of IFRS 2B ‘Review This paper d f studies. mary of find reports. ew of acade three appen FRSs. For more Page 1 of 2 da ref 12(amended 12 6 6410 6 6492 meeting of the omments on FRSs. academic 8 Operating w of does not dings. emic ndices which 8 C d) e g h
Transcript of STAFF PA PER June 2012 eting ntation re - Home | … · STAF IASB Me Project Paper to CONTACT(This...

The IASB is the ininformation visit w
STAFIASB Me
Project
Paper to
CONTACT(
This paper IASB and dthe applicatTechnical d
Purpose
1. Thi
rese
Seg
aca
con
Structure
2. The
(a)
(b)
(c)
(d)
(e)
Introduct
3. Thi
liter
ndependent standardwww.ifrs.org
FF PAeeting
Pos
pic App
(S) Ann T
April P
has been prepoes not represtion of IFRSs decisions are m
is paper con
earch and o
gments. Thi
ademic litera
ntain questio
e of the pa
e paper is or
Introdu
Overvi
Append
Append
Append
tion
is paper acc
rature to M
d-setting body of th
APER
t-impleme
endices: S
Tarca
Pitman
pared by the ssent the viewsdo not purportmade in public
ntains appen
ther reports
is paper acc
ature to Ma
ons for the B
aper
rganised as
uction
ew of resea
dix A: Acad
dix B: Acad
dix C: Othe
companies J
ay 2012—p
e IFRS Foundation,
entation re
Summary o
ata
apit
staff of the IFRs of the IASB ot to set out accc and reported
ndices that p
s about the i
companies J
y 2012—pr
Board.
follows:
arch method
demic resea
demic resear
er research o
June 2012 B
preliminary
, a not-for-profit cor
eview of IF
of relevant
RS Foundationor any individuceptable or und in IASB Upda
provide deta
impact of th
June 12 Boa
reliminary f
ds
arch on IFRS
rch on IFRS
on IFRS 8 –
Board Paper
findings’.
rporation promoting
IA
J
FRS 8
literature t
+
g +
n for discussioual member onacceptable aate.
ails of the fi
he applicatio
ard Paper 12
findings’. T
S 8 – List o
S 8 – Summ
– Published
r 12B ‘Revie
It includes
g the adoption of IF
ASB Agend
une 2012
o May 201
+44 (0)20 724
+44 (0)20 724
on at a public mf the IASB. Copplication of IF
indings of a
on of IFRS
2B ‘Review
This paper d
f studies.
mary of find
reports.
ew of acade
three appen
FRSs. For more
Page 1 of 2
da ref 12C
(amended
12
6 6410
6 6492
meeting of theomments on FRSs.
academic
8 Operating
w of
does not
dings.
emic
ndices which
8
C
d)
e
g
h

pro
Boa
(a)
(b)
(c)
Overview
The workin
short time
data availa
conclusion
summary, w
highlightin
include as
the questio
In addition
Relevant is
Whresu
ovide details
ard Paper 12
Append
contain
authors
include
Append
This ap
studies
forthco
contras
Their d
Append
append
entities
(Table
w of resear
ng papers in
period. Co
ability) and h
ns may chan
we do not p
ng limitation
many studi
ons of intere
n, the findin
ssues are as
hat is the samults based o
s the academ
2B.
dix A: Acad
ns published
s, study setti
es a bibliogr
dix B: Acad
ppendix prov
. The studi
oming) inclu
st, the worki
data and con
dix C: Furth
dix includes
s (Table 1).
2). The con
rch metho
ncluded in t
nsequently,
have not ye
nge as the st
present a cri
ns in the des
es as possib
est to the Bo
gs must be
follows:
mple size anon this samp
P
mic research
demic resea
d or accepte
ing and rese
raphy.
demic resear
vides detail
es that are p
ude data and
ing papers m
nclusions m
her research
a list of rep
It also cont
ntent of the
ods
the literature
, they often
et received p
tudies go thr
itical review
sign of the s
ble that cont
oard in relat
reviewed w
nd the locatple to other
PIR IFRS 8│A
h and other
arch on IFRS
ed papers an
earch questi
rch on IFRS
ls of the find
published or
d conclusion
may be revi
may change.
h on IFRS 8
ports provid
tains a sum
se reports w
e review ha
include sm
peer feedbac
rough the p
w of the stud
study or in i
tain data wh
tion to the a
within the co
tion of compcompanies
Appendices: R
reports that
S 8 – List o
nd working p
ions for eac
S 8 – Summ
dings of eac
r accepted f
ns that not w
ised and dev
– Other rep
ded by regul
mmary of the
will not chan
ave been pre
mall samples
ck. Their fi
eer review p
dies and gen
its executio
hich may be
application o
onstraints of
panies? Caand setting
Agenda re
Review of acad
t are referre
f studies. T
papers. It s
ch study and
mary of find
ch of the ac
for publicat
will change
veloped furt
ports. This
lators and o
e reports’ fin
nge.
epared in a r
s (because o
findings and
process. In
nerally avoi
on. Our obje
e useful for
of IFRS 8.
f the researc
an we geners?
ef 12C
demic researc
Page 2 of 2
d to in the
The list
shows the
d
dings.
ademic
ion (ie
. In
ther.
other
ndings
relatively
of lack of
d
this
id
ective is to
answering
ch process.
ralise the
C
ch
8

Agenda ref 12C
PIR IFRS 8│Appendices: Review of academic research
Page 3 of 28
What is the source of data? Has it been hand collected rather than from a database? For segment data, hand-collected data is likely to be more detailed and accurate.
Are the statistical tests used and interpreted correctly?
Are the models constructed appropriately? That is, is the selection and use of variables justified in terms of prior research and the setting of the present research paper?
Have the authors carried out robustness tests? That is, what happens if they change elements of the sample or model? Do the results remain the same?
The studies use a range of research methods. The evidence that they present is based on
use of the following techniques:
Descriptive statistics: data is collected about segment information under IFRS 8 and IAS 14 (eg number of segments, segment profit, segment assets) and compared. A statistical test informs us whether the items are significantly different when companies follow one standard or the other.
Tests of association: data is collected about a set of variables. The extent to which one variable (the dependent variable) is associated with the other variables (the variables predicted to influence the dependent variable) is explored using multiple regression analysis.
o Tests of value relevance: multiple regression models are used to test the statistical association of items of information (eg a company’s book value of equity, book value of earnings, segment earnings, segment assets) with the company’s share price or market returns. A significant positive association is interpreted to mean that capital market participants (the users of accounting information and the people whose actions influence share prices) find the information useful.
o Tests of properties of analyst forecasts: the dependent variable is an attribute of analyst forecasts (eg error or dispersion). The independent variables are those expected to influence the attribute (eg they are expected to lead to lower error or dispersion). (Note: these tests can only show association. They cannot show causality.)

Agenda ref 12C
PIR IFRS 8│Appendices: Review of academic research
Page 4 of 28
A1. Appendix A: Academic research on IFRS 8 – List of studies
Author Study setting Research questions Published or forthcoming
Crawford et al. (2012) ICAS
IFRS 8 v. IAS 14 UK150 listed UK companies (99 FTSE 100 and 51 FTSE 250). (1) A comparison of data presented in segment reports under IAS 14 and IFRS 8 for FYE 31 December 2008 and 2009 (one year pre- and one year post-application of IFRS 8). (2) Comments from 20 interviewees (6 preparers, 7 auditors, 7 users).
RQ1: Did segment disclosure change under IFRS 8? RQ2: Is IFRS 8 more decision useful than IAS 14?
Nichols et al. (2012) Accepted paper, International Journal of Accounting Auditing and Taxation.
IFRS 8 v. IAS 14 EU listed companies 335 listed European companies from 12 EU countries and Norway and Switzerland. Eleven industry sectors including manufacturing 40 per cent; finance, insurance and real estate 23 per cent; Mining 6 per cent; Communications 6 per cent; and sundry others 25%. A comparison of IAS 14 and IFRS 8; one year pre- and one year post-application of IFRS 8 (31 December 2008 and 2009). The sample includes 32 early applying companies.
RQ1 Did companies early apply? RQ2 Are operating segments consistent with other parts of the report? RQ3 What segments are disclosed? RQ4 Are more segments reported? Are there fewer single segment companies? RQ5 What items are disclosed? What measures of profitability are used? RQ6 Are segment items reconciled to financial statement amounts? RQ7 What items are included in entity-wide disclosures? RQ8 Is the CODM identified? Data to answer each of these questions is collected from the financial statements and analysed.
Pisano and Landriana (2012) Financial reporting (1): 113-132
IFRS 8 v. IAS 14 ItalyListed companies (124) in FYE 2008-2009. Non-financial companies from a range of industries (manufacturing 33 per cent; media and telecommunication 14 per cent; utility 11 per cent clothing 9 per cent).
RQ1 Is segment disclosure associated with level of industry competition? RQ2 Is variation in segment disclosure associated with level of industry competition?
Working papers Bugeja, Czernowski and Moran (2012) Working paper, University of Technology Sydney
AASB 14 v. AASB 8 (IFRS 8 v. IAS 14) Australia 1,617 listed companies, one year pre- and one year post-application of AASB 8 (in the period 2009-2010).
RQ1 Do companies disclose more segments under IFRS 8? RQ2 Is the increase in number of segments positively associated with company diversity? RQ3 Is the increase in number of segments positively associated with segments making an operating loss? RQ4 Is segment disclosure positively related to industry competition? RQ5 When there is no change in

Agenda ref 12C
PIR IFRS 8│Appendices: Review of academic research
Page 5 of 28
number of segments, does segment disclosure decrease under IFRS 8?
He, He and Evans (2012) Working paper, Macquarie University
AASB 14 v. AASB 8 (IFRS 8 v. IAS 14) Australia 173 listed companies, one year pre- and one year post-application of AASB 8 (in the period 2008-2010). Nine industry sectors including industrials (28 per cent); materials (20 per cent); consumer discretionary (18 per cent); and energy (10 per cent).
RQ1 Do companies report (a) more segments (b) less segment information and (c) less geographical information after application of AASB 8? RQ2 Does analyst forecast accuracy increase and forecast dispersion decrease after application of AASB 8?
Heem and Valenza (2012) Working paper, University of Nice and EDHEC
IFRS 8 v. IAS 14 France37 of CAC 40 listed companies in first half-yearly reporting under IFRS (in the period 2007-2009; includes two early appliers)
RQ1 Do companies disclose more segments under IFRS 8? RQ2 What items of information are included?
Kajuter and Nienhaus (2012) Working paper, University of Munster
IFRS 8 v. IAS 14 GermanyHDAX listed companies, 110 per year for four years 2007-2010. Excludes banks, insurance and financial sector companies. Companies must have three sectors.
RQ1 What is the value relevance of segment information compared to other financial statement information? RQ2 How useful are items in segment reports? RQ Is IFRS 8 information more value relevant than IAS 14 information? The study uses data collected from financial statements and databases.
Kang and Gray (2012) Working paper, University of New South Wales
AASB 14 v. AASB 8 (IFRS 8 v. IAS 14) Australia 189 listed companies in 2008 and 2010. Industries include energy/materials/industrials (24 per cent), consumer discretionary/staples (17 per cent); financials (19 per cent), others (15 per cent).
RQ1 Does format and identification of reportable segments change under IFRS 8? RQ2 Does the number of reportable segments increase under IFRS 8?
Li, Richardson and Tuna (2012)
FAS 131, IAS 14 and IFRS 8324,892 company-years in the period 1998-2010. Some non-US companies used IAS 14 then IFRS 8. The focus of the study is not about the use of either of these standards.
RQ1 Is information about a company’s geographical exposure useful for forecasting company fundamentals and stock returns?
Pardal and Morais (2012) Working paper, ESCE and ISCTE Business School Spain
IFRS 8 v. IAS 14 SpainListed companies (131) in FYE 2009. A range of industries included (financial 24 per cent; construction 12 per cent; utilities 8 per cent; food 5 per cent; paper 5 per cent).
RQ1 What segments are disclosed? RQ2 What items were disclosed in segment notes for operating segments and entity-wide segments? Do companies comply with IFRS 8? RQ3 What company attributes are associated with the segment disclosure score?
Agenda ref 12C
PIR IFRS 8│Appendices: Review of academic research
Page 6 of 28
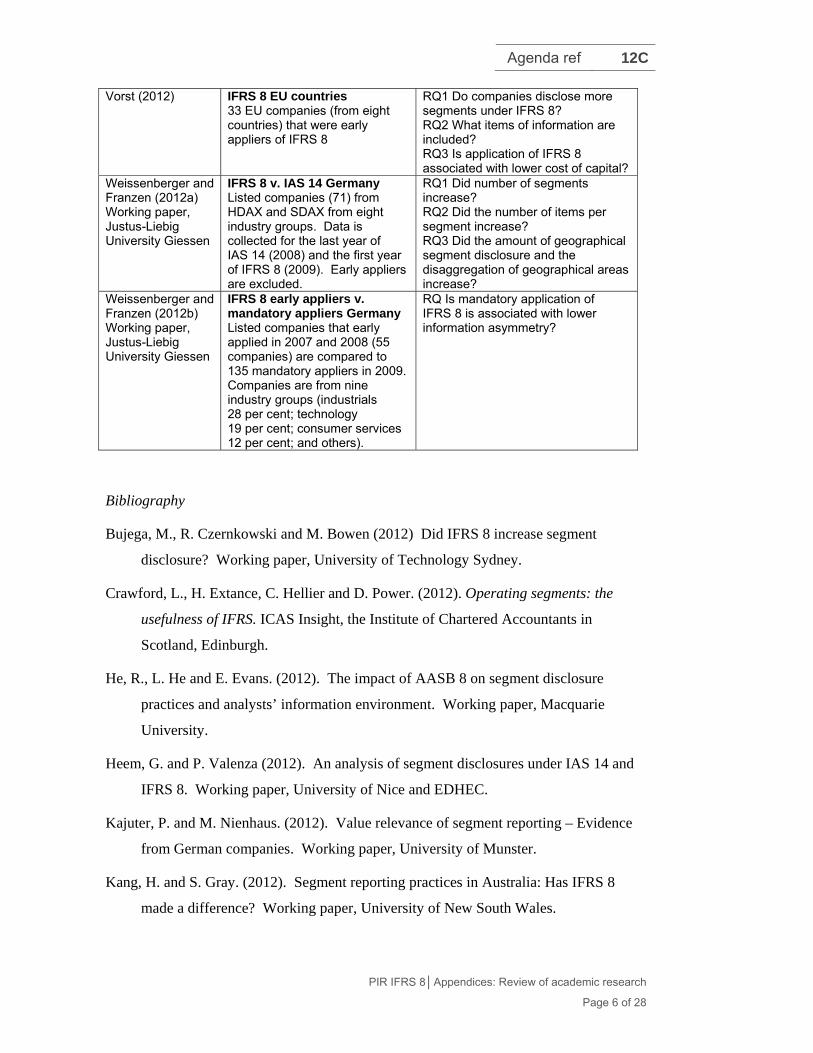
Vorst (2012)
IFRS 8 EU countries33 EU companies (from eight countries) that were early appliers of IFRS 8
RQ1 Do companies disclose more segments under IFRS 8? RQ2 What items of information are included? RQ3 Is application of IFRS 8 associated with lower cost of capital?
Weissenberger and Franzen (2012a) Working paper, Justus-Liebig University Giessen
IFRS 8 v. IAS 14 GermanyListed companies (71) from HDAX and SDAX from eight industry groups. Data is collected for the last year of IAS 14 (2008) and the first year of IFRS 8 (2009). Early appliers are excluded.
RQ1 Did number of segments increase? RQ2 Did the number of items per segment increase? RQ3 Did the amount of geographical segment disclosure and the disaggregation of geographical areas increase?
Weissenberger and Franzen (2012b) Working paper, Justus-Liebig University Giessen
IFRS 8 early appliers v. mandatory appliers Germany Listed companies that early applied in 2007 and 2008 (55 companies) are compared to 135 mandatory appliers in 2009. Companies are from nine industry groups (industrials 28 per cent; technology 19 per cent; consumer services 12 per cent; and others).
RQ Is mandatory application of IFRS 8 is associated with lower information asymmetry?
Bibliography
Bujega, M., R. Czernkowski and M. Bowen (2012) Did IFRS 8 increase segment
disclosure? Working paper, University of Technology Sydney.
Crawford, L., H. Extance, C. Hellier and D. Power. (2012). Operating segments: the
usefulness of IFRS. ICAS Insight, the Institute of Chartered Accountants in
Scotland, Edinburgh.
He, R., L. He and E. Evans. (2012). The impact of AASB 8 on segment disclosure
practices and analysts’ information environment. Working paper, Macquarie
University.
Heem, G. and P. Valenza (2012). An analysis of segment disclosures under IAS 14 and
IFRS 8. Working paper, University of Nice and EDHEC.
Kajuter, P. and M. Nienhaus. (2012). Value relevance of segment reporting – Evidence
from German companies. Working paper, University of Munster.
Kang, H. and S. Gray. (2012). Segment reporting practices in Australia: Has IFRS 8
made a difference? Working paper, University of New South Wales.

Agenda ref 12C
PIR IFRS 8│Appendices: Review of academic research
Page 7 of 28
Li, N., S. Richardson and I. Tuna (2012). Macro to micro: Country exposures, company
fundamentals and stock returns. Working paper, London Business School.
Nichols, N., D. Street and S. Cereola. (2012). An analysis of the impact of applying
IFRS 8 on the segment disclosures of European blue chip companies. James
Madison University. Forthcoming, Journal of International Accounting Auditing
and Taxation.
Pardal, P. and A. Morais. (2012). Segment reporting under IFRS 8 – Evidence from
Spanish listed companies. Working paper, ESCE and ISCTE Business School
Spain.
Pisano, S. and L. Landriana. (2012). The determinants of segment disclosure: an
empirical analysis of Italian listed companies. Financial Reporting, Vol. 1, pp 113-
132.
Vorst, P. (2012). The effects of IFRS 8 on a company’s segment disclosures and the cost
of equity capital. Working paper. Available at
http://arno.unimaas.nl/show.cgi?fid=16929
Weissenberger, B., and N. Franzen. (2012a). The application of IFRS 8 – A step in the
right direction? Evidence from segment disclosure in Germany. Working paper,
Justus-Liebig-University Giessen.
Weissenberger, B., and N. Franzen. (2012b). The impact of mandatory IFRS 8
application on information asymmetry in Germany: Much ado about nothing?
Working paper, Justus-Liebig-University Giessen.

Agenda ref 12C
PIR IFRS 8│Appendices: Review of academic research
Page 8 of 28
A2. Appendix B: Academic research on IFRS 8 – Summary of findings
Published or forthcoming
Crawford et al. (2012)
A study of 150 listed UK companies’ segment disclosure for the last year of IAS 14 and
the first year of IFRS 8. The companies’ financial year-ends were 31 December 2008
and 2009. The sample includes 99 FTSE 100 companies and 51 FTSE 250 companies.
RQ1: Did segment disclosure change under IFRS 8?
Nature and number of segments
The number of operating segments is, on average, higher, because it increased from 3.30 to 3.56 segments (Table 2A). However, 62 per cent of companies did not change the number of business segments. On average, the number of geographical segments based on location of customers increased from 3.68 to 4.09 segments (Table 2A). The number of geographical segments based on location of assets is not significantly different under IFRS 8. The study finds that 54 per cent of companies did not change geographical (location of customers) segments and 52 per cent of companies did not change geographical (location of assets) segments.
Items reported for each segment
The mean number of items per operating segment declined significantly from 7.02 to 6.43 (Table 3A). More companies disclose segment revenue to external customers (from 87 per cent to 91 per cent). Fewer companies disclose amounts for all of the line items that were required under IAS14 eg capital expenditure (from 83 per cent to 77 per cent), liabilities (from 84 per cent to 60 per cent), and total carrying amount of assets (from 87 per cent to 83 per cent). More companies disclose items for interest revenue, interest expense, income tax expense and minority interests under IFRS 8.
Entity-wide disclosure
The mean number of items for secondary (IAS 14) compared to entity-wide (IFRS 8) segments declined significantly from 2.02 to 1.06 (Table 3B). Fewer companies disclose amounts for capital expenditure by location (from 64 per cent to 14 per cent) and carrying amount of assets by location (from 65 per cent to 17 per cent). Under IFRS 8, 80 per cent of companies provide revenue from external customers by products and services, 85 per cent provide revenue from external customers by geographical area and 21 per cent provide information about major customers (Table 3D).
Measure of segment profit
A minority of companies disclose use of non-IFRS measures. Reconciliations (non-GAAP to IFRS) are not provided.
Reconciliation The number of companies providing a reconciliation of segment revenue and entity revenue is the same (85 per cent—85 per cent). The number of companies reconciling segment and entity operating profit, assets and liabilities is lower (78 per cent to 68 per cent; 84 per cent to 79 per cent; and 72 per cent to 52 per cent respectively).

Agenda ref 12C
PIR IFRS 8│Appendices: Review of academic research
Page 9 of 28
Fewer companies reconcile segment data to IFRS data based on PAT (57 per cent to 45 per cent). More companies reconcile segment data to PBT (13 to 29 per cent) (Table 4).
Identity of CODM The majority of companies (69 per cent) disclosed the name of the CODM.
Other Narrative information in segment notes
The word count of segment notes increased. Conclusion: More narrative information now accompanies segment note disclosure.
Narrative information in Annual Report
For some companies discussion of business structure in narrative reports may not be consistent with IFRS 8 segments. On average, there are four operating segments and four geographical (customer) segments in the segment note, but additional operating and geographical segments are described in the annual reports (Table 7).
Small and large companies
Impact of IFRS 8 application differs (a) between FTSE 100 and FTSE 250 companies and (b) between industries. Mining companies have the largest number of segments and consumer goods sector companies the fewest. Financial sector companies are more likely to provide a matrix presentation and provide the most items of disclosure of any sector.
RQ2: Is IFRS 8 more useful for making decisions than IAS 14? Comments from interviews (n = 20. Six preparers, seven auditors, seven users) 1. Interviewee view: use of non-IFRS measures in IFRS 8 segment note is infrequent 2. Preparers welcomed the management approach. Auditors and users were less enthusiastic. According to preparers, the benefits are reporting though the eyes of management and providing more useful information (eg non-GAAP earnings). Users are concerned about companies’ flexibility to hide unfavourable results and the lack of comparability between companies. Auditors considered the standard uncontroversial.3 Interviewee concerns: 3.1 Disclosure of commercially sensitive information. 3.2 Level of aggregation in constructing segments (there is more detail in the narrative than in the segment note). 3.3 Materiality thresholds for separate identification of a segment. 4 Author comments: Interviewees did not seem to understand the concept ‘entity-wide disclosure’
Nichols et al. (2012)
This study includes 335 listed European companies from 12 EU countries and Norway
and Switzerland. (The sample was selected based on national stock market indices.)
Eleven industry sectors are included (manufacturing 40 per cent; finance, insurance and
real estate 23 per cent; mining 6 per cent; communications 6 per cent). Data is collected
for one year pre- and one year post-application of IFRS 8 (31 December 2008 and 2009)
to allow a comparison of IAS 14 and IFRS 8. The sample includes 32 early applying
companies.

Agenda ref 12C
PIR IFRS 8│Appendices: Review of academic research
Page 10 of 28
RQ1 Early application
Among sample companies 32 early applied IFRS 8. Some explanations for the change were: four companies changed management structure, eleven had no change in reportable segments; two disposed of segments; and six had major acquisitions.
RQ2 Narrative information - consistency
IFRS 8 BC 6(d) stated that prior US research showed improvement in consistency (between segment note disclosures and narrative discussion) when FAS 131 was applied. However, other research suggests reporting under IAS14R was already consistent with other section of narrative reports (p. 8). This study finds that for 96 per cent of companies, segment information is consistent with ‘other sections’ of annual report (narrative reports eg management report, financial review, MD&A).
RQ3 Type of segments
In the sample of n=335, 75 per cent companies provide LOB segments (67 per cent pure, 6 per cent matrix, 2 per cent mixed), 19 per cent provide geographical (12 per cent pure, 5 per cent matrix, 2 per cent mixed) and 6 per cent provide a single segment report (Table 3). Under IAS 14 25 companies reported LOB segments. They changed to other presentations as follows: geographical (5 companies), matrix LOB (8); matrix geographical (8); mixed LOB (2); mixed geographical (2). Under IAS 14 15 companies reported geographical segments. They changed to other presentations as follows: LOB (7 companies), matrix LOB (1); matrix geographical (4); mixed geographical (2); single segment (1) (Table 4). There is little change in the number of companies reporting a single segment (23 to 20).
RQ4 Number of segments
On average, more segments are disclosed (from 3.84 to 4.19 segments, a significant change, Table 5). However:
62 per cent of companies do not change the number of segments. 27 per cent of companies increase the number of segments. 11 per cent of companies decrease the number of segments.
The average number of segments increased in all countries except Switzerland.
RQ5 Items reported for each segment
Profitability: disclosed by 100 per cent of companies (pre- and post-IFRS 8) (Table 6) Companies report significantly more measures of segment profitability under IFRS 8. Companies reporting one measure declined from 82 per cent to 75 per cent. Companies reporting two measures increased from 14 per cent to 19 per cent. Companies reporting three measures increased from 4 per cent to 6 per cent. Conclusion: IFRS 8 leads to more information about segment profitability. Most companies (83 per cent) use a non-GAAP measure of profitability in the segment report (Table 6). Comparison of the pre-and post-IFRS 8 measures are:
Operating profit (from 57 per cent to 57 per cent of companies) EBIT (from 19 per cent to 23 per cent) EBT (from 20 per cent to 56 per cent) EBITDA (from 8 per cent to 16 per cent).
Segment assets: decline in disclosure (from 96 per cent to

Agenda ref 12C
PIR IFRS 8│Appendices: Review of academic research
Page 11 of 28
93 per cent of companies). Segment liabilities: decline in disclosure (from 87 per cent to 71 per cent of companies, significantly different) (Table 6). Balance sheet information: the percentage of companies that provide disclosure on equity method investments (decline from 41 per cent to 30 per cent) and capital expenditure (decline from 81 per cent to 73 per cent) is significantly lower (Table 6). Voluntary disclosures: the percentage of companies that provide disclosure on items (list of six) is lower (not significantly) (Table 6). Conclusion: IFRS 8 does not lead to disclosure of more items of segment information.
RQ6 Reconciliation Most companies use a profit measure that appears in their income statement. In 34 cases (Table 7 line c) where the segment profit measure does not appear in the income statement, 31 companies provide reconciliations between the profit measure in the segment report and the profit measure in the income statement (Table 7).
RQ7 Entity-wide disclosure
Companies provided the following entity-wide disclosures under IFRS 8 (Table 8):
Geographical: 77 per cent of companies Product/service: 17 per cent of companies Major customers: 6 per cent of companies.
Considering geographical disclosures, fewer companies used the broad groupings of IAS 14 (from 17 per cent to 10 per cent of sample companies). The proportion of companies reporting country-specific disclosures increased from 13 per cent to 18 per cent (Table 10). Fineness of country-specific disclosure increased significantly. There is little change in the number of companies reporting sales revenue and assets under IAS14 and IFRS 8. However, the number reporting capital additions declines significantly (47 per cent to 13 per cent) (Table 9). There is a significant decline in broad groupings for geographical segment (under IAS14) (from 17 per cent to 10 per cent of companies) and an increase in country-specific disclosure (from 13 per cent to 18 per cent) and mix of countries and regions disclosure (from 25 per cent to 29 per cent) (Table 10). Conclusion: IFRS 8 does not lead to loss of geographical segment information.
RQ8 Identity of CODM
The identity of the CODM is disclosed by 36 per cent of companies (eg Board of Directors, senior management group, senior individual executive). Three per cent of companies specify the Board of Directors as the CODM.
Pisano and Landriana (2012)
A study of 124 listed companies in 2008-2009. The sample includes non-financial
companies from a range of industries include manufacturing 33 per cent; media and
telecommunication 14 per cent; utilities 11 per cent; clothing 9 per cent; other 33 per
cent.

Agenda ref 12C
PIR IFRS 8│Appendices: Review of academic research
Page 12 of 28
Number and type of segments; items of segment disclosure
Comparing firms that disclosed segment information under IAS14 and IFRS 8, 75 per cent made no change in the number of segments; 14 per cent increased disclosure and 11 per cent decreased disclosure. Only 4 per cent of firms gave the same number of segments but changed the composition of segments. There is very little change in the proportion of firms providing segments based on LOB (84 per cent in 2008 and 85 per cent in 2009). GEO segments were provided by 13 per cent of firms in 2008 and 12 per cent in 2009. The average number of segments increased from 3.71 to 3.85. The average number of items of disclosure increased from 8.47 to 10.33. Among 119 firms, 23 per cent made no change in the number of items; 55 per cent increased the number of items and 22 per cent decreased the number of items. Disclosure of IAS 14 required items compared to items reported to the CODM under IFRS 8 is largely consistent for segment revenue, depreciation and amortisation, material non-cash expenses, equity method income, investments in associates and joint ventures. Fewer companies include items for liabilities and capital additions. The number of companies disclosing income tax and additions to non-current assets has increased (13 per cent to 28 per cent; and 19 per cent to 26 per cent). Some companies did not comply with IFRS 8; eg only 94 per cent provided the segment result and 82 per cent provided segment assets.
RQ1-2 Is segment disclosure (and variation in segment disclosure) associated with level of industry competition?
Test: Is the number of segments positively associated with measures of industry concentration? Result: yes. Firms in more competitive (lower concentration) industries, larger firms, firms with lower debt and less profitable firms have more items in their segment note disclosure. There are more items in segment notes under IFRS 8.
Working papers
Bugeja, Czernowski and Moran (2012)
A study of 1,617 listed Australian companies using data from one year pre- and one year
post-application of AASB 8 (in the period 2009-2010). (AASB 114 = IAS 14 and
AASB 8 = IFRS 8.)
RQ1 Do companies disclose more segments under IFRS 8?
On application of IFRS 8, 79 per cent of companies did not change the number of segments and 17 per cent increased the number of segments. The number of single segment companies reduced by 12 per cent. Considering companies that did not change the number of segments, disclosure of specific line items by segment decreased in all categories, except segment results. For assets there is a reduction in number of companies disclosing from 227 to 244; liabilities 227 to 218; revenue 277 to 274; capital expenditure 227 to 160; depreciation 277 to 200.

Agenda ref 12C
PIR IFRS 8│Appendices: Review of academic research
Page 13 of 28
RQ2 Is the increase in number of segments is positively associated with: company diversity; making a loss; or industry competition?
On average, companies changing from single to multi-segment reporting were more profitable and operated in fewer industries. Multi-segment firms that increased the number of segments were more profitable, but not more diverse. Both groups of changers had higher market to book ratio (a possible proxy for growth potential) than companies that did not change their number of segments.
He, He and Evans (2012)
A study of 173 listed Australian companies using data from one year pre- and one year
post-application of AASB 8 (in the period 2008-2010). The companies were from nine
industry sectors including industrials (28 per cent); materials (20 per cent); consumer
discretionary (18 per cent); and energy (10 per cent). (AASB 114 = IAS 14 and AASB 8
= IFRS 8).
RQ1a Do companies report more segments after application of AASB 8?
Test: Count the number and type of segments under AASB 114 and AASB 8. Result: the average number of segments is 2.6 under AASB 114 and 3.1 AASB 8 (median 2 and 3). The increase is significant (Table 7). Most companies (78 out of 173 or 45 per cent) made no change in the number of segments. Sixty-seven companies (39 per cent) increased and 28 (16 per cent) decreased the number of segments (Table 7). Most companies use LOB for operating segments. Eight (5 per cent) more companies use LOB under AASB 8 than previously. Ten (6 per cent) fewer companies reported geographical segments under AASB 8 than previously (Table 6). Companies using a matrix increased from one to 16 (8 per cent increase). Nineteen companies (11 per cent) disclosed segment information for the first time under AASB 8. Ten of these companies were in the energy and materials sector. The number of single segment companies decreased by 13 (7 per cent).
RQ1b Do companies report less segment information?
Test: Count the number of items in each segment under AASB 114 and AASB 8. Result: the average number of items is 6.35 under AASB 114 and 6.28 under AASB 8 (median 7 and 7). The decrease is not significant (Table 9). Many companies (63 companies, 36 per cent) made no change in the number of items. Fifty-one companies (29 per cent) increased and 59 (34 per cent) decreased the number of segments. There was an increase in number of companies disclosing these items: intersegment revenue, interest expense, interest revenue, income tax and income. There was a decrease in number of companies disclosing these items: liabilities, capital expenditure and assets.

Agenda ref 12C
PIR IFRS 8│Appendices: Review of academic research
Page 14 of 28
Considering the companies that presented multiple segments under both AASB 114 and AASB 8, the average number of items declined from 9.1 to 8.2 (median 9 and 8). The decrease is significant (Table 10). Another measure of the amount of segment information presented is the Herfindahl Index (a measure of market concentration, based on amount of segment revenue). The study reports that the H Index, on average, declines significantly, indicating that information is more disaggregated under AASB 8. (Note: the H index is based on segment revenue only and thus is not informative about other segment items.) (Table 8).
RQ1c Do companies report less geographical information after application of AASB 8?
Test: Count the number and type of segments under AASB 114 and AASB 8. Result: the average number of geographical areas is 2.2 under AASB 114 and 2.4 under IFRS 8 (median 2 and 2). The increase is significant. The number of items reported for each segment decreases significantly (Tale 11). Most companies (103 companies, 60 per cent) made no change in the number of geographical areas. Sixty-seven companies (39 per cent) increased and 28 (16 per cent) decreased the number of areas. Most companies (78 companies, 45 per cent) made no change in the number of items in each geographical area. Forty companies (23 per cent) increased and 55 (32 per cent) decreased the number of items. The number of companies reporting geographical revenue increased (8 companies, 9 per cent increase). The number reporting assets decreased (6 companies, 7 per cent decline). The number presenting capital expenditure decreased (42 companies, 53 per cent decline).
RQ2 Does analyst forecast accuracy increase, and dispersion decrease, after application of AASB 8?
Test: Regression models test the association of (a) analyst forecast accuracy and (b) analyst forecast dispersion and explanatory variables (size, volatility and forecast horizon) in the pre- period and the post- period. Result: accuracy and disagreement are not significantly different in the pre- and post- period. Additional tests of levels of information uncertainty and analyst consensus show that they are not significantly different in the pre- and post- period.
Heem and Valenza (2012)
A study of accounting practices pre- and post-IFRS 8 for 37 of the CAC 40 French stock
market index companies. Data was extracted from the first half-yearly reporting under
IFRS (in the period 2007-2009, including eight early appliers)
RQ1 Do companies disclose more segments under IFRS 8?
Test: Count segments under IAS 14 and IFRS 8. Result: the average number of segments is 2.8 under IAS 14 and 2.8 under IFRS 8 (median 2 and 2.5) (Table 3). One company increased the number of segments (12 to 13), six decreased the number and 29 made no change (Table 4).
RQ2 What items of information are included?
Test: Count line items in the segment note. Result: the average number of items is 2.06 under IAS 14 and 1.94 under IFRS 8 (median 2 and 2) (Table 7).

Agenda ref 12C
PIR IFRS 8│Appendices: Review of academic research
Page 15 of 28
Six companies increased the number items, two decreased the number and 28 made no change (Table 5).
Conclusion: For 80 per cent of sample companies, segment reporting is largely unchanged from IAS 14 to IFRS 8. For many companies, segments are the same under both standards.
Kajuter and Nienhaus (2012)
The study includes 110 German companies listed on HDAX for four years 2007-2010
(n= 286; excludes financial services companies). Companies have at least three reported
segments. The IAS 14 and IFRS 8 comparison is based on 66 companies. The study uses
data collected from financial statements and databases.
RQ1 What is the value relevance of segment information compared to other financial statement information?
Test: Is the amount of a company’s segment earnings (EBIT) and segment assets associated with its share price? Result: adding segment earnings (but not segment assets) to a model including book value of equity and book value of assets improves the explanatory power of the model. Conclusion: the models show that information users find measures of segment earnings (based on EBIT) to be useful.
RQ2 How useful are items in segment reports?
Test: Split sample as follows: companies with high or low (a) variability of segment profit; (b) number of reported segment items; and (c) number of reported segments.
Result: segment information is more value-relevant in the group that has:
(a) low variability of profit; and (b) fewer reported items.
RQ3 Is IFRS 8 information more value-relevant than IAS 14 information?
Test: Use IAS 14 data from the year prior to IFRS application. Compare it to IFRS 8 data for the same year (because companies restate the prior year data when they apply IFRS 8). Is value relevance the same for IFRS 8 and IAS 14 data? Result: IFRS 8 data is more value-relevant.
Kang and Gray (2012)
A study of 189 Australian listed companies in 2008 and 2012. A range of industries are
included (energy/materials/industrials 24 per cent; consumer discretionary/staples
17 per cent; financials 19 per cent; others 15 per cent).
RQ1 Does format and identification of reportable segments change under IFRS 8?
Test: Record the basis for reporting segments. Result: there is no change in the identification of primary (operating) segments between 2008 and 2010 (LOB is 78 per cent and GEO is 22 per cent). On average, companies disclosed 3.19 segments in 2008 and 3.63 segments in 2010 (a significant increase). There was no increase in the number of geographical segments from 2008 to 2010.
RQ2 Does the number of reportable segments increase under IFRS 8?
Test: Count the segments. Result: the number of reportable segments is the same for 45 per cent of companies; it decreased for 15 per cent; and increased for 40 per cent.
RQ3 Does the extent Test: Review segment note.

Agenda ref 12C
PIR IFRS 8│Appendices: Review of academic research
Page 16 of 28
of segment information disclosed increase under IFRS 8?
Result: the extent of segment disclosure is similar for 42 per cent of companies; decreased for 13 per cent; and increased for 45 per cent.
Fourteen companies (7.4 per cent) are early appliers of IFRS 8. The CODM is identified by 155 (82 per cent) companies.
Li, Richardson and Tuna (2012)
A study of 324,892 company-years in the period 1998-2010. Some non-US companies
used IAS 14 and then IFRS 8. The focus of the study is not about the use of either of
these standards.
RQ1 Is information about a company’s geographical exposure useful for forecasting company fundamentals and stock returns?
Test: The study uses segment information (from companies’ segment note disclosures) and country-level predictions of economic growth to test whether the combined data is relevant in predicting future profitability and returns and is useful for analysts. Result: the county exposure data improves prediction of future return on assets. Analyst forecast revisions and stock returns incorporate the country exposure information (with a lag). The relationship is stronger for non-US companies (including IFRS companies), but the authors have not linked the effect to use of IAS 14 or IFRS 8.
Pardal and Morias (2012)
A study of 131 Spanish listed companies in FYE 2009. A range of industries are
included (financial 24 per cent; construction 12 per cent; utilities 8 per cent; food
5 per cent; paper 5 per cent).
RQ1 What segments are disclosed?
Test: Record the basis for reporting segments. Result: LOB 71 per cent GEO 14 per cent Matrix (LOB and GEO) 7 per cent Single 7 per cent. On average, companies disclosed 3.63 segments. Entity-wide disclosure was provided by 70 per cent of companies. In this group, 55 per cent of companies provided disclosure based on geographical segments, 19 per cent on customer information and 14 per cent on products of services. In entity-wide disclosures companies disclosed 3.11 segments on average.
RQ2 What items were disclosed in segment notes? Do companies comply with IFRS 8?
Test: Count the items included in the segment note. Result: all companies included a profit and loss measure (not further described) and external revenue. Assets were included by 90 per cent of companies, liabilities by 89 per cent and depreciation and amortisation by 85 per cent. On average companies disclosed 8.5 items.
RQ3 What company attributes are associated with the segment disclosure score?
Test: Calculate a compliance score (total items reported/total items required to be disclosed). (The authors did not discuss issues associated with determining the coding score). Result: higher scores are associated with larger size, being cross-listed and lower profitability.

Agenda ref 12C
PIR IFRS 8│Appendices: Review of academic research
Page 17 of 28
Vorst (2012)
This study includes 32 EU companies (from eight countries) that were early appliers of
IFRS 8. Twenty five companies changed from IAS 14 to IFRS 8.
RQ1 Do companies disclose more segments under IFRS 8?
Test: Count the number and type of segments under IAS 14 and IFRS 8. Result: the average number of segments is 4.44 under IAS 14 and 5.08 IFRS 8 (median 4 and 4) (Table 6). Most companies (11, 44 per cent) made no change in the number of segments. Only three companies decreased the number while 11 increased the number of segments. Most companies use LOB for operating segments. Thirteen companies used LOB and did not change, while four used geographical and did not change. Three companies changed from LOB to mixed (Table 5). Comparing the geographical segments under IAS 14 and entity-wide geographical disclosures under IFRS 8, the study reports a significant increase in the number of reported segments (numbers of segments not provided).
RQ2 What items of information are included?
Test: Identify the line items and count how many companies disclose these line items under IAS 14 and IFRS 8. Result: the average number of items reported is 12.1 under IAS 14 and 12.6 IFRS 8 (median 13 and 13). Six companies (24 per cent) made no change in the number of line items. Seven companies (24 per cent) decreased the number while 12 (50 per cent) increased the number of line items (Tables 13, 14). Items included reflect requirements of each standard and the changes from IAS 14 to IFRS 8. For example, external revenue provided by 100 per cent of companies under both standards; intersegment revenue provided by 80 per cent of companies under both standards. For new required (if reviewed by the CODM) items (interest income, interest expense and income tax expense) the proportion of companies disclosing these items increased. The proportion of companies disclosing liabilities decreased from 92 per cent to 84 per cent (Table 12). In specific areas the increase in the proportion of companies providing disclosure was: external revenue by country of domicile (12 per cent increase); external revenue all other foreign countries (4 per cent increase); net current assets (32 per cent increase); major customers (12 per cent increase). The proportion of companies disclosing total assets for individual countries declined 12 per cent (Table 11).
RQ3 Is application of IFRS 8 associated with lower cost of capital?
Test: Is early application of IFRS 8 associated with lower cost of capital? Result: the study finds no evidence of lower cost of capital. The results are likely affected by the small sample size and the study period (2008) when share prices and earnings expectations were affected by specific economic conditions.

Agenda ref 12C
PIR IFRS 8│Appendices: Review of academic research
Page 18 of 28
Weissenberger and Franzen (2012a)
This study includes 71 listed companies from the HDAX and SDAX indices from eight
industry groups. Data is collected for the last year of IAS 14 (2008) and the first year of
IFRS 8 (2009). Early appliers are excluded.
RQ1 Did number of segments increase?
Forty eight companies (68 per cent) did not change the number of segments and 13 (18 per cent) increased the number of segments. The number of single segment companies declined by three. On average, the number of product and services segments increases significantly under IFRS 8 (from 2.9 to 3.1). Considering 62 multi-segment companies, 49 (79 per cent) define their operating segments by products and services, 7 (11 per cent) by geographical area and 5 (8 per cent) use a combination (one company uses other criteria). Practices are similar under IAS 14: 52 (84 per cent) of companies define their operating segments by products and services and 10 (16 per cent) by geographical area.
RQ2 Did the number of items per segment increase?
The average number of items disclosed for each segment is 13.9 under IFRS 8 and 14.4 under IAS 14 but the difference is not significant. However, there is less disclosure of some key items, notably liabilities. The proportion of firms disclosing earnings, assets and liabilities under IAS 14 and IFRS 8 is: earnings 100 per cent under both standards; assets from 98 per cent to 89 per cent; liabilities from 98 per cent to 71 per cent.
RQ3 Did the amount of geographical segment disclosure and the disaggregation of geographical areas increase?
Fifty-five companies provide entity-wide geographical disclosures. The average number of segments is 4.7, significantly more than provided in secondary geographical segments under IAS 14 (4.2). The proportion of companies providing country-specific information has increased significantly (from 16 per cent to 36 per cent) and the proportion not disclosing their country of domicile separately decreased (from 24 per cent to 12 per cent). The proportion of companies providing disaggregation of revenue by country has increase significantly from 36 per cent under IAS 14 to 42 per cent under IFRS 8. A large proportion of companies use only broad categories for geographical disclosures: under IFRS 8 47 per cent (IAS 14, 56 per cent) use supranational regions or continents even though these companies have high levels of foreign sales (average 58 per cent). The average number of items disclosed for each geographical segment is 3.4 under IFRS 8, which is significantly lower than the 4.5 items reported under IAS 14. Most companies limit disclosure to the number of items explicitly required by the standard (Table 15). There is a lack of disclosure of geographical segment earnings: under IFRS 8 only four companies (IAS 14, seven companies) report this item. Entity-wide disclosure about major customers is also limited. Only 24 per cent of companies provide all required information about major customers.
Agenda ref 12C
PIR IFRS 8│Appendices: Review of academic research
Page 19 of 28
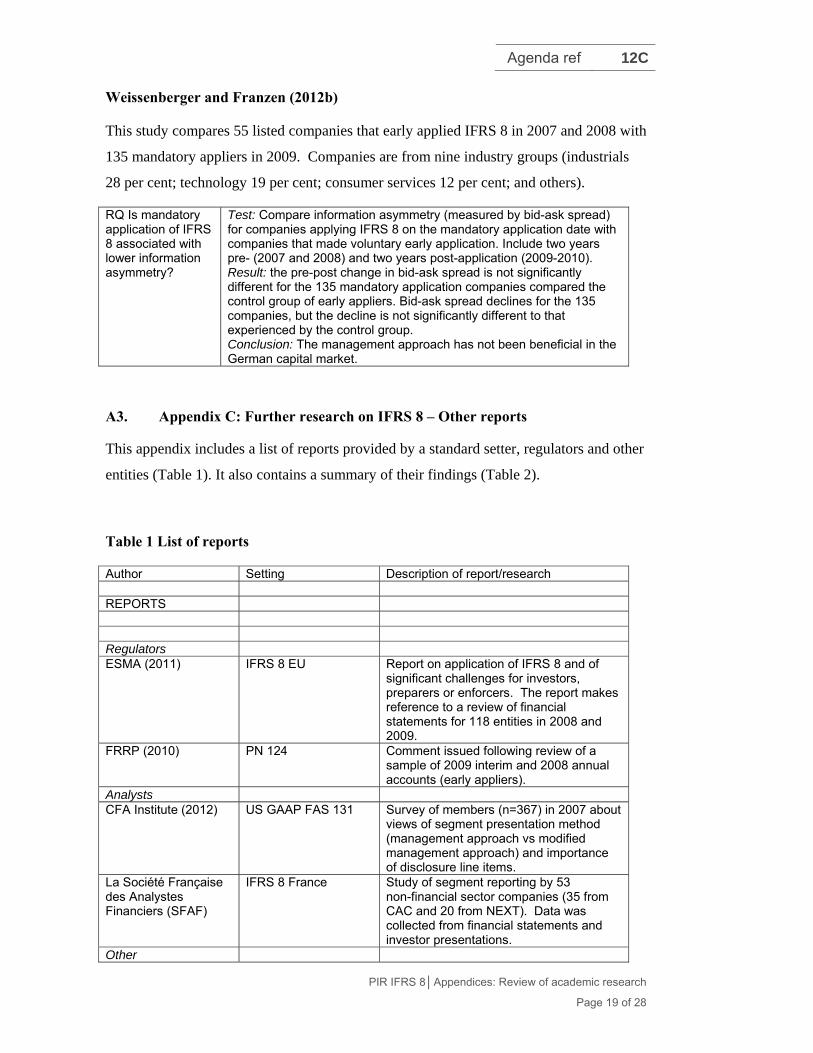
Weissenberger and Franzen (2012b)
This study compares 55 listed companies that early applied IFRS 8 in 2007 and 2008 with
135 mandatory appliers in 2009. Companies are from nine industry groups (industrials
28 per cent; technology 19 per cent; consumer services 12 per cent; and others).
RQ Is mandatory application of IFRS 8 associated with lower information asymmetry?
Test: Compare information asymmetry (measured by bid-ask spread) for companies applying IFRS 8 on the mandatory application date with companies that made voluntary early application. Include two years pre- (2007 and 2008) and two years post-application (2009-2010). Result: the pre-post change in bid-ask spread is not significantly different for the 135 mandatory application companies compared the control group of early appliers. Bid-ask spread declines for the 135 companies, but the decline is not significantly different to that experienced by the control group. Conclusion: The management approach has not been beneficial in the German capital market.
A3. Appendix C: Further research on IFRS 8 – Other reports
This appendix includes a list of reports provided by a standard setter, regulators and other
entities (Table 1). It also contains a summary of their findings (Table 2).
Table 1 List of reports
Author Setting Description of report/research REPORTS Regulators ESMA (2011) IFRS 8 EU Report on application of IFRS 8 and of
significant challenges for investors, preparers or enforcers. The report makes reference to a review of financial statements for 118 entities in 2008 and 2009.
FRRP (2010) PN 124 Comment issued following review of a sample of 2009 interim and 2008 annual accounts (early appliers).
Analysts CFA Institute (2012) US GAAP FAS 131 Survey of members (n=367) in 2007 about
views of segment presentation method (management approach vs modified management approach) and importance of disclosure line items.
La Société Française des Analystes Financiers (SFAF)
IFRS 8 France Study of segment reporting by 53 non-financial sector companies (35 from CAC and 20 from NEXT). Data was collected from financial statements and investor presentations.
Other

Agenda ref 12C
PIR IFRS 8│Appendices: Review of academic research
Page 20 of 28
Backhuis and Camfferman (MAB 01-02)
IFRS 8 EU Study of segment disclosure in annual reports of 50 EU non-financial companies from FTSE Eurotop 100 in 2009.
Blase, Mϋller and Reinke (2012).
IFRS 8 Germany Study of 101 German DAX, MDAX and SDAX companies (fiscal year 2009), excluding financial service firms and companies that voluntarily applied IFRS 8 in earlier years.
Company Reporting (2012)
IFRS 8 Study of 24 European listed companies FYE 30 June 2010 considering segment disclosure in annual reports of companies (UK = 12; Germany = 4; Switzerland = 3; other = 5) after application of IFRS 8.
KPMG (2010) IFRS 8 EU Study of IFRS 8 implementation by 81 companies (drawn from the 2009 Fortune Global 500) from a range of countries (17, including European countries, Israel and Hong Kong) and industries (10).
Table 2 Summary of findings of other reports
ESMA (2011)
On the basis of this review, the overall conclusion reached by European enforcers is that (i) the implementation of IFRS 8 resulted in a fairly similar level of information compared to its predecessor IAS 14 and that (ii) there is homogeneity in the issues faced by European enforcers when enforcing this standard. This stems from a combination of weaknesses in the standard and a failure to fully comply with its requirements by issuers.
The following material, which identifies four topics that emerged from a review of 118 entities, is taken from the report (pp. 3-4).
(1) Identification of the chief operating decision maker (CODM): 41% of issuers with this information identified the Board of Directors as the CODM (although this body often includes non-executive members). This indicates that there might be some confusion caused with the definition of CODM in the standard.
(2) Aggregation of operating segments into reportable segments: Disclosures on aggregation of segments were explicitly mentioned by only 29% of issuers even though IFRS 8.22(a) refers to aggregation as helping investors understand the entity’s basis of organisation. The level of subjectivity in deciding how aggregation should be applied may lead to diversity in practice.
(3) Measurement basis for presentation of information: 93% of issuers used IFRS as a measurement basis for segment information and 47% presented non-GAAP measures such as EBIT and EBITDA in the segment information. Information about allocation policies of profit or loss, assets and liabilities to reporting segments, definition of non-GAAP measures and the reconciliation between segment information and the amounts reported in the financial statements were often not disclosed properly.
(4) Analysis of entity-wide disclosures: 58% of issuers provided information about revenues and non-current assets by geographical area. However, the notes to the financial statements rarely presented information for individual foreign countries

Agenda ref 12C
PIR IFRS 8│Appendices: Review of academic research
Page 21 of 28
and there is no common understanding on how the materiality concept should be applied in this context.
In addition, the quality and level of geographical segment information disclosed under IAS 14 and IFRS 8 was compared. A few entities changed their reporting basis (from a focus on geographical areas to a focus on business segments or vice versa). There is also limited evidence that the quality of information provided on geographical areas is lower than what was previously reported under IAS 14 in the cases where the same basis applied.
As part of this review, ESMA also held discussions with organisations representing financial analysts. Generally, the investor community is concerned that the segmental information reported may not be consistent with the way management really looks at the activities to run the business. Analysts also consider that the present level of reconciliations on a reportable basis required by the standard is unsatisfactory. Furthermore, the investor community is generally of the view that the information provided does not give meaningful information as it is not reported at a sufficiently low level of granularity.
The report also contains proposals for amendments to the standard (p. 4).
FFRP (2010)
The Panel reviewed a sample of UK listed companies’ 2009 interim accounts and 2008 annual accounts (when they had early applied the standard). Following the review, the panel asked a number of companies to provide additional explanations where:
only one operating segment is reported, but the group appears to be diverse with different businesses or with significant operations in different countries;
the operating analysis set out in the narrative report differs from the operating segments in the financial statements;
the titles and responsibilities of the directors or executive management team imply an organisational structure that is not reflected in the operating segments; or
the commentary in the narrative report focuses on non-IFRS measures whereas the segmental disclosures are based on IFRS amounts.
CFA INSTITUTE (2012)
The CFA Survey (2012) presents views of 367 members from a range of countries in 2007. Users are asked about their preferences regarding the management approach for segment reporting under US GAAP. Given the date of the survey, we must assume that these views relate to segment reporting under US GAAP. Respondents could have up to 10 years’ experience of FAS 131, adopted in the period after 15 December 1997.
Key findings:
(1) Management approach vs modified management approach: the modified management approach is preferred by 41 per cent of respondents; the management

Agenda ref 12C
PIR IFRS 8│Appendices: Review of academic research
Page 22 of 28
approach is preferred by 25 per cent; and 22 per cent consider both have similar relevance and usefulness. For 12 per cent neither is useful or they have no opinion.
(2) The modified management approach is more likely to be preferred by respondents in the UK and continental Europe (57 per cent and 57 per cent respectively of that country’s respondents) than in the US or Canada (32 per cent and 47 per cent respectively).
(3) When asked about geographical disclosure, 76 per cent of respondents indicated that it was a useful complement to disclosure by nature.
NOTE: management approach—segments are determined based on how the entity manages the business. Segment information is based on managers’ internal reporting. Non-GAAP measures are reconciled to consolidated financial statement data.
Modified management approach—segments are determined on how the entity manages the business. Segment information is based on GAAP and totals to financial statement information.
SFAF (2011)
The study (by Trapeza Consulting) reviewed the application of IFRS 8 by the companies of the CAC 40 and the NEXT 20 in 2010. The 53 companies included in the research represent all of the CAC 40 and NEXT 20 excluding financial institutions. Data was collected from the financial statements, directors’ reports and the annual results presentation.
Key findings:
Applying IFRS 8 allows great flexibility in presenting financial information This flexibility was illustrated by the use of the company’s own management (non-GAAP) indicators by nearly 50% of the companies. Reasons for using non-GAAP indicators were: (a) They wanted to present recurring, especially by restating costs of restructuring (b) They wanted to restate the impact of acquisition accounting in accordance
with IFRS 3 by cancelling revaluation adjustments made on acquisition Some also used performance indicators specific to their industry. For example, the segment results of Total include the effects of stocks measured at replacement cost although that is not permitted by IAS 2.
This flexibility translates into a wealth of specific performance indicators About 15 non-GAAP performance indicators were used by the companies in the sample. Insufficient information was provided to allow the reader to reconcile the entity’s own indicators with those in IFRS. Generally there is no connection between the company’s own indicator and the IFRS amounts and the two cannot be reconciled for 45% of the companies studied.
Some companies make significant use of the options allowed by IFRS 8 For example, STMicroelectronic made about 10 adjustments between operating profit and the operating income in the segment information without producing reconciling information at the level of each segment. Furthermore, as permitted by IFRS 8, the company used operating income as defined by US GAAP as its performance indicator at the segment level and only reconciled that at the group level.
Agenda ref 12C
PIR IFRS 8│Appendices: Review of academic research
Page 23 of 28
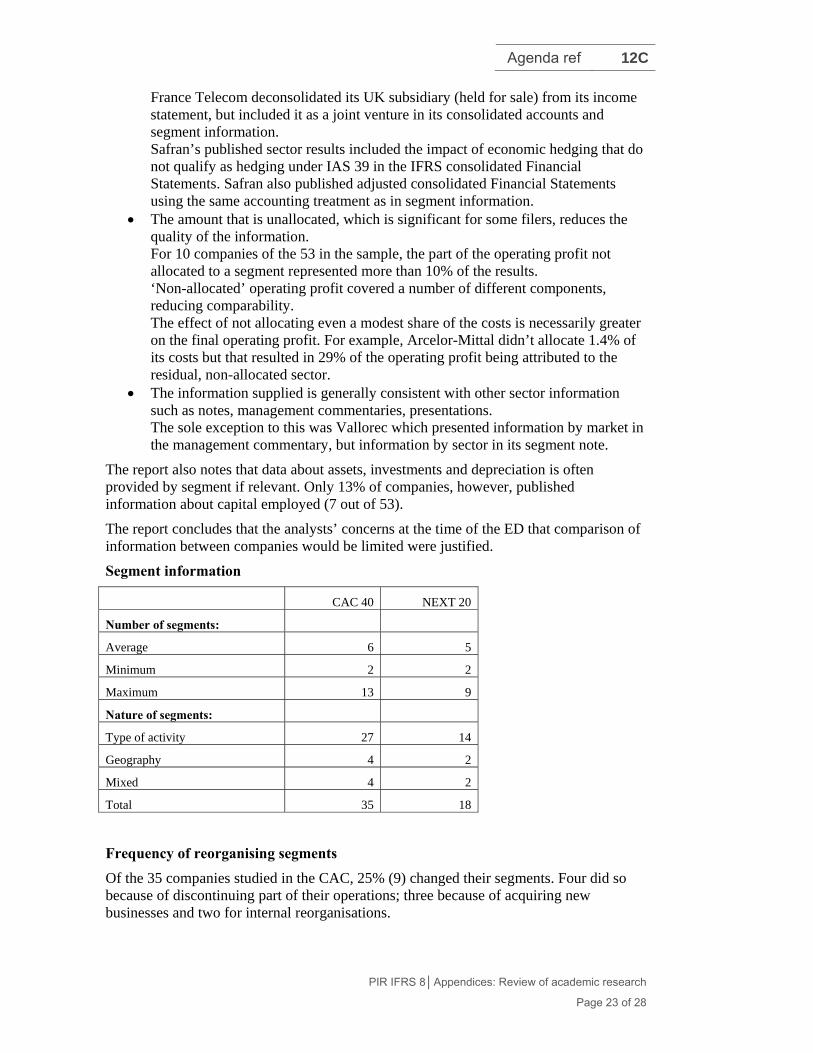
France Telecom deconsolidated its UK subsidiary (held for sale) from its income statement, but included it as a joint venture in its consolidated accounts and segment information. Safran’s published sector results included the impact of economic hedging that do not qualify as hedging under IAS 39 in the IFRS consolidated Financial Statements. Safran also published adjusted consolidated Financial Statements using the same accounting treatment as in segment information.
The amount that is unallocated, which is significant for some filers, reduces the quality of the information. For 10 companies of the 53 in the sample, the part of the operating profit not allocated to a segment represented more than 10% of the results. ‘Non-allocated’ operating profit covered a number of different components, reducing comparability. The effect of not allocating even a modest share of the costs is necessarily greater on the final operating profit. For example, Arcelor-Mittal didn’t allocate 1.4% of its costs but that resulted in 29% of the operating profit being attributed to the residual, non-allocated sector.
The information supplied is generally consistent with other sector information such as notes, management commentaries, presentations. The sole exception to this was Vallorec which presented information by market in the management commentary, but information by sector in its segment note.
The report also notes that data about assets, investments and depreciation is often provided by segment if relevant. Only 13% of companies, however, published information about capital employed (7 out of 53).
The report concludes that the analysts’ concerns at the time of the ED that comparison of information between companies would be limited were justified.
Segment information
CAC 40 NEXT 20
Number of segments:
Average 6 5
Minimum 2 2
Maximum 13 9
Nature of segments:
Type of activity 27 14
Geography 4 2
Mixed 4 2
Total 35 18
Frequency of reorganising segments
Of the 35 companies studied in the CAC, 25% (9) changed their segments. Four did so because of discontinuing part of their operations; three because of acquiring new businesses and two for internal reorganisations.

Agenda ref 12C
PIR IFRS 8│Appendices: Review of academic research
Page 24 of 28
Of the 18 companies studied in the NEXT, a third (6) changed their segments. Of these last, 83% (or 5 of the 6) were due to an internal reorganisation or a change in the definition of the segments. The sixth changed because of acquisitions.
In the CAC 40 group, 20 companies used non-IFRS performance indicators. Of these, 70% (14) did not provide a reconciliation by segment (the 11 that provided non-IFRS indicators and 3 others). In the NEXT 20 group, 10 of the 18 companies presented a non-GAAP measure of performance. These 10 companies did not provide reconciliations at segment level.
Comparison of performance indicators used with results presentations
In their results presentations, the majority (67%) of companies used their own performance indicators (23 CAC; 13 NEXT). The companies showed more freedom in the presentations. Many were based on restated recurring results eg CGG Veritas told the reader that the annual results excluded any exceptional items.
Some of the companies that used their own performance indicator in the financial statements, whether with an IFRS indicator or not, used a different performance, non-GAAP indicator in their results presentations (7 (20%) of the CAC; 4 (22%) of the NEXT). More than 15 different non-GAAP performance indicators were used. (Listed by company in the report.)
Restatements and adjustments to non-IFRS operating profit
The principal types of adjustments were for restructuring costs, amortisation of capitalised R&D, R&D charges, exceptional items, discontinued businesses and non –recurring items. The three most common types of adjustment were: restructuring costs; R&D charges; and restatement of depreciation/amortisation of assets revalued in business combinations (cancellation of revaluation adjustments made on acquisition).
Assets
Of the CAC group, 88% of the sample presented assets by segment; only 4 companies did not provide it. Of the 31 who did, 27 agreed directly with the balance sheet. For the other 4 it was not possible to reconcile the segment information with the group balance sheet. Four companies of the 31 showing assets also presented capital employed.
Of the NEXT group, 44% (8) of companies presented disaggregated assets. All of those 8 gave a reconciliation that agreed almost directly with the group balance sheet. Of the 8, 3 presented capital employed.
Investments
In the CAC group, 30 of the 35 companies disaggregated investments. In the NEXT group, 11 of the 18 companies presented disaggregated investments.
Depreciation and provisions
In CAC group, 30 of the 35 companies presented disaggregation of depreciation and provisions. In the NEXT group, 11 of the 18 companies published this disaggregation.
Non allocated amounts
Some of the companies did not allocate a part of their income or expenses and presented that information in a separate segment (eg holding company; corporate, non-allocated).

Agenda ref 12C
PIR IFRS 8│Appendices: Review of academic research
Page 25 of 28
Those companies for which non-allocated income or expense was significant (10% of the result) are listed in the report for both CAC 40 and NEXT 20 groups.
The unallocated portion as a percentage of the results of those 6 CAC 40 companies was between 13% and 29%, arising from unallocated costs of between 0.8% and 3%. The 4 NEXT companies had unallocated segments with percentages of results between 10% and 35% on unallocated costs of between 1.4% and 8% and unallocated revenues of 0.4% to 3%.
Backhuis and Camfferman (MAB 01-02)
Segmental disclosure in accordance with IFRS 8
Summary (translation)
From 2009 IFRS 8 is the standard for segmental disclosure. This article discusses the main characteristics of the standard and looks at a number of financial statements for the financial year 2009. A finding is that the new standard for segmental disclosure is being followed reasonably closely even though there is some room for improvement. One aspect of IFRS 8 is that segments are disclosed on the basis of the internal reporting system. As a consequence, there is great diversity in the disclosures across companies. Furthermore, it requires extra care when disclosing segmental information and consolidated information in a manner that is meant to be useful and insightful.
Headlines:
1. Introduction
2. Comparison between IAS 14 and IFRS 8
3. Sample description
The 50 largest non-financial companies of the FTSE Eurotop 100 that are under the jurisdiction of an EU country. Table 1 shows that the introduction of IFRS 8 took place over four years. Forty per cent of the companies had already started in 2007 or 2008. Five companies had not yet applied IFRS 8 in their 2009 annual report.
4.4.1. Segments reported
The first step is for companies to determine the top management of the enterprise. The second step is to determine the operational segments. The third step is to determine the segments to be reported on. This is a somewhat complicated process shown in Fig 1. The expected advantages of segmental reporting in accordance with IFRS 8 were:
(a) segments more similar to those in internal management reporting;
(b) more consistency between reporting segments and other parts of the annual report;
(c) some firms will report more segments than under IAS 14; and
d) more segmental information in interim reports.
4.4.2. Number of segments reported (Table 2)
The study shows 15 out of 18 companies had no significant changes in the segments reported under IAS 14 and IFRS 8.

Agenda ref 12C
PIR IFRS 8│Appendices: Review of academic research
Page 26 of 28
Of the 19 companies that reported in accordance with IFRS 8 in both 2008 and 2009, 12 companies showed the same number of segments, 3 companies showed a reduction and 4 companies showed an increase. Table 3 shows that the number of segments reported increases, decreases or stays the same.
4.4.3. Consistency between segmental reporting and directors’ report
Only two companies showed significant differences.
4.4.4 Additional information on the determination (identification) of the segments.
Table 4 shows that 31 per cent of the companies do not discuss the factors that determine the identification of segments and 69 per cent do discuss these factors. However, in practice this difference is not so significant as the discussions are fairly superficial.
5. Information on income per segment
6. Other segmental information
7. Other information on the enterprise as a whole
8. Conclusions
IFRS 8 is not an easy standard both for preparers and users.
Blase, Müller and Reinke (2012)
Paradigmenwechsel in der Segmentberichterstattung?
Summary (translation)
The objective of the thesis was the analysis of the change in the segment reporting standards from IAS 14 to IFRS 8.
The research sample includes the initial segment reporting of all listed German DAX, MDAX and SDAX companies (fiscal year 2009), excluding financial service firms and companies which voluntarily adopted IFRS 8 in earlier years (sample of 101 firms).
The Empirical analysis shows that:
(a) The segmentation criteria did not materially change—4 out of 5 companies still report segment financials based on products and services; with regards to the company-wide disclosures 9 out of 10 firms apply a regional segmentation.
(b) The number of operating segments reported only slightly increased (average IAS 14: 3.2 vs. IFRS 8: 3.5 segments on the primary segmentation level; average IAS 14: 3.4 vs. IFRS 8: 3.7 segments for the company-wide disclosures).
(c) The disclosure of segmental P&L/balance sheet items worsened as the disclosure levels of assets, liabilities and at-equity investments decreased up to 30 per cent; disclosure level of P&L items remains unchanged.

Agenda ref 12C
PIR IFRS 8│Appendices: Review of academic research
Page 27 of 28
(d) Differences between the operating segments and the consolidated figures mainly result from consolidation effects and fair value-adjustments; systematic adjustments of IFRS accounting standards could not be observed.
(e) However, the quality of the reconciliations turned out to be relatively poor—only half of all companies fully complies with IFRS 8 and hence provides sufficient transparency.
KPMG (2010)
KPMG (2010) reports on IFRS 8 implementation by 81 companies (drawn from the 2009 Fortune Global 500). Companies were not selected randomly but instead to provide a cross-section of countries (17 countries, comprising European countries and Israel and Hong Kong) and industries (10). All companies had applied IFRS 8 and the sample included 29 early appliers.
The major findings of the study (pp. 5-6) were as follows:
(1) The average number of reportable segments was 4.6 under IAS 14 and 5.2 under IFRS 8, possibly reflecting the high hurdle in IFRS 8 that must be met before aggregation is permitted.
(2) Few companies disclosed how segments had been aggregated. (3) One third of companies provided the identity of the CODM. Within this group
75 per cent indicated that the CODM was a group of executive directors or a similar governing body.
(4) Most companies (66 per cent) provided disaggregation by products and services. Only 11 per cent of companies presented solely geographical segments. Geographical disaggregation was predominant in specific sectors (eg food, drink, consumer goods; communication and media). Some companies (25 per cent) presented segments on a mixed basis (products and services; and geographical segments).
(5) Most disclosed segment measures were based on IFRS (95 per cent of companies), possibly because IFRS are now embedded in management reporting.
(6) More than half of the companies disclose segment profit excluding items (eg interest, depreciation, amortisation or other one-off items). There was a high level of consistency regarding the profit and loss measure used by companies in the same sector (eg 80 per cent of companies in the communication and media sector used EBITDA or adjusted EBITDA; 80 per cent of Insurance sector companies used operating profit or adjusted operating profit).
(7) The reconciliations required by IFRS 8 were generally not presented like the examples in the IFRS 8 Illustrative Guidance. Most companies presented columnar tables with an elimination/consolidation column immediately to the left of the final total column (comprising the IFRS amounts).
COMPANY REPORTING (2012)
Company Reporting (2012) presents comments on segment reporting under IFRS 8 for 24 companies with financial years ending in the period June-December 2010. Companies were listed in S&P 350 index and were from a number of number of countries (12 from the UK; 4 from Germany; 3 from Switzerland; 5 other) and a range of industries.
Key findings:

Agenda ref 12C
PIR IFRS 8│Appendices: Review of academic research
Page 28 of 28
(1) Nature of segments: business (13 companies); geographical (5 companies); mixed (3 companies); single segment (3 companies).
(2) Number of segments: 2-4 (9 companies); 5-7 (9 companies); 8-10 (3 companies). (3) Measure of segment profit: operating profit (9 companies); adjusted operating
profit (2 companies); other adjusted (6 companies); profit before tax (2 companies); profit after tax (2 companies).
(4) Items excluded from segment profit: taxation (19 companies); financial income and expense (17 companies); share of associates/equity accounting (6 companies); restructuring (3 companies); other (10 companies).
(5) Chief operating decision maker: Nine companies identify the CODM as Board of Directors (2 companies); chief executive’s committee (1 company); executive committee (3 companies); and management/managing board (2 companies). The CODM is not mentioned by 13 companies.