
Stable Value Investment Association (SVIA) Conference Value Investment Association ... Conference...
34
Stable Value Investment Association (SVIA) Conference April 2013 Goldman Sachs Asset Management
Transcript of Stable Value Investment Association (SVIA) Conference Value Investment Association ... Conference...

Stable Value Investment Association
(SVIA) Conference
April 2013
Goldman Sachs Asset Management

Introduction
Four key areas of focus regarding our take on current environment:
1. Global Impact on the US Market
2. Current US Trends
3. Key Risks to GS Outlook
4. GS Investment Recommendations
This information discusses general market activity, industry or sector trends, or other broad-based economic, market or political conditions and should not be construed as research or investment advice.
1
Global Impact on the US Market
Current US Trends
Key Risks to GS Outlook
GS Investment Recommendations

Outlook on the US Economy
Ripple Effects US economic growth trend should remain positive
We expect to continue to feel the impact of fiscal policies
Tail risk from European financial crisis appears to have been mitigated
for now
Quantitative monetary easing planned by the BOJ is expected to have a
positive impact on markets
Trending US financial system is largely healthy
Improving consumer spending and corporate balance sheet
Healthier housing market
Growing energy boom in the US
Premature / excessive tightening of fiscal and/or monetary policy
Reassertion of the European sovereign crisis
Re-emergence of China growth concerns
Geopolitical shock
Unexpected inflationary pressures
Key Risks
Source: Goldman Sachs. This information discusses general market activity, industry or sector trends, or other broad-based economic, market or political conditions and should not be construed as research or
investment advice. As of March 2013.
2

3
China: While Hard Landing Concerns Have Been Mitigated For Now…
Source: Goldman Sachs. (1) Jim O’Neill, Goldman Sachs Asset Management. Source: Plot Tool. Plot tool is a proprietary analytical tool and database representing developed and emerging markets including the
US, Europe, Asia, and Latin America for their respective Fixed Income, Equity, Foreign Exchange, Commodities, and Credit Markets covering thousands of cash, forward, futures, options, and swap instruments.
Plot tool houses over 20 years of economic data. The views and opinions expressed may differ from those of GSAM or other departments or divisions of Goldman Sachs and its affiliates. This information
discusses general market activity, industry or sector trends, or other broad-based economic, market or political conditions and should not be construed as research or investment advice. Investors are urged to
consult with their financial advisors before buying or selling any securities.
China Real GDP Growth (YoY)
Growth forecasts for the next 10 years are ~7%1, consistent with a view of successful policy
management. These levels should support US growth and are in line with lower concerns about the
Chinese financial sector
6.0
7.0
8.0
9.0
10.0
11.0
12.0
1998 1999 2000 2001 2002 2003 2004 2005 2006 2007 2008 2009 2010 2011 2012
Yo
Y G
DP
Gro
wth
(%
)
China Real GDP YoY Growth

4
…Uncertainty Remains
Source: PBOC, Wind, Gao Hua Securities Research estimates. Plot tool. Plot tool is a proprietary analytical tool and database representing developed and emerging markets including the US, Europe, Asia, and
Latin America for their respective Fixed Income, Equity, Foreign Exchange, Commodities, and Credit Markets covering thousands of cash, forward, futures, options, and swap instruments. Plot tool houses over
20 years of economic data. The views and opinions expressed may differ from those of GSAM or other departments or divisions of Goldman Sachs and its affiliates. This information discusses general market
activity, industry or sector trends, or other broad-based economic, market or political conditions and should not be construed as research or investment advice. Investors are urged to consult with their financial
advisors before buying or selling any securities. The economic and market forecasts presented herein are based on proprietary models for informational purposes as of the date of this presentation. There can be
no assurance that the forecasts will be achieved. Please see additional disclosures at the end of this presentation.
Leadership Transition
Proactive Government Policies
China’s Shadow Banking Activity Continues to Grow
Sh
ad
ow
Ba
nkin
g a
s %
of
To
tal C
red
it
China needs to grow consumer demand without excessive reliance on expansion of credit
1.0
1.5
2.0
2.5
3.0
3.5
4.0
-6.0
-5.5
-5.0
-4.5
-4.0
-3.5
-3.0
-2.5
-2.0
-1.5
-1.0
-0.5
Jan-2010 Jul-2010 Jan-2011 Jul-2011 Jan-2012 Jul-2012 Jan-2013
Avg of Italian & Spanish 10y Spread to Germany (LHS, Inverted) US 10y (RHS)
5
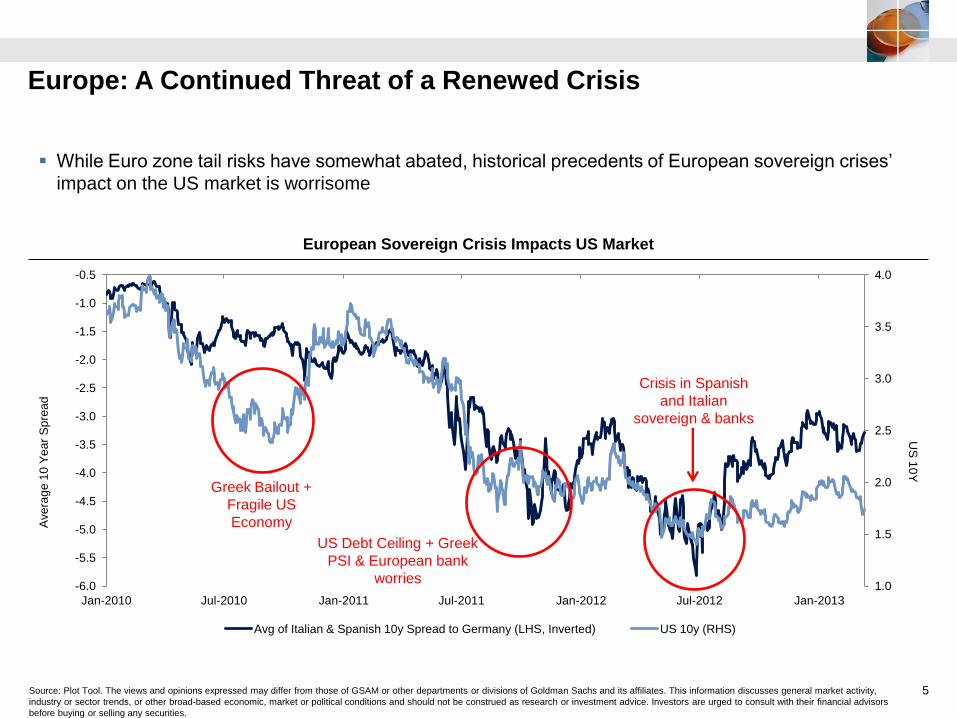
Europe: A Continued Threat of a Renewed Crisis
Source: Plot Tool. The views and opinions expressed may differ from those of GSAM or other departments or divisions of Goldman Sachs and its affiliates. This information discusses general market activity,
industry or sector trends, or other broad-based economic, market or political conditions and should not be construed as research or investment advice. Investors are urged to consult with their financial advisors
before buying or selling any securities.
While Euro zone tail risks have somewhat abated, historical precedents of European sovereign crises’
impact on the US market is worrisome
European Sovereign Crisis Impacts US Market
US Debt Ceiling + Greek
PSI & European bank
worries
Greek Bailout +
Fragile US
Economy
Crisis in Spanish
and Italian
sovereign & banks
Ave
rag
e 1
0 Y
ea
r S
pre
ad
U
S 1
0Y

6
Europe: The Banking Crisis Has Had a Prolonged Impact on the US
Source: Goldman Sachs, Plot Tool. Plot Tool is a proprietary analytical tool and database representing developed and emerging markets including the US, Europe, Asia, and Latin America for their respective
Fixed Income, Equity, Foreign Exchange, Commodities, and Credit Markets covering thousands of cash, forward, futures, options, and swap instruments. Plot tool houses over 20 years of economic data. The
views and opinions expressed may differ from those of GSAM or other departments or divisions of Goldman Sachs and its affiliates. This information discusses general market activity, industry or sector trends,
or other broad-based economic, market or political conditions and should not be construed as research or investment advice. Investors are urged to consult with their financial advisors before buying or selling
any securities.
Euro zone 10 Year Treasury Bond Yields
Since last summer, Draghi’s actions have reduced the prospect of a major crisis, but this continues to be
tested
0.0
1.0
2.0
3.0
4.0
5.0
6.0
7.0
8.0
Apr-08 Oct-08 Apr-09 Oct-09 Apr-10 Oct-10 Apr-11 Oct-11 Apr-12 Oct-12 Apr-13
Germany France Italy Spain
10
Ye
ar
Yie
lds
July 2012, Draghi
announces ECB will
fight to preserve Euro

7
Europe: Is Cyprus a Unique Case?
Source: ECB. The views and opinions expressed may differ from those of GSAM or other departments or divisions of Goldman Sachs and its affiliates. This information discusses general market activity, industry
or sector trends, or other broad-based economic, market or political conditions and should not be construed as research or investment advice. Investors are urged to consult with their financial advisors before
buying or selling any securities.
Questions raised of a potential Cyprus exit from the Euro, the probability of which is mitigated by the
ECB’s continued support of the euro and statements that the bailout approach is not a blueprint
Foreign and Corporate Deposits in Euro zone
0.00
0.10
0.20
0.30
0.40
0.50
0.00 0.10 0.20 0.30 0.40 0.50 0.60 0.70 0.80
Fore
ign
de
po
sits a
s %
of to
tal d
ep
osits
Euro area corporate deposits as % of household deposits
Italy
Greece
Malta
Cyprus
Ireland
Netherlands
Spain
Luxembourg

Japan: Bolder Than Expected Quantitative Easing
Source: Goldman Sachs, Plot Tool. Plot tool is a proprietary analytical tool and database representing developed and emerging markets including the US, Europe, Asia, and Latin America for their respective
Fixed Income, Equity, Foreign Exchange, Commodities, and Credit Markets covering thousands of cash, forward, futures, options, and swap instruments. Plot tool houses over 20 years of economic data. The
views and opinions expressed may differ from those of GSAM or other departments or divisions of Goldman Sachs and its affiliates. This information discusses general market activity, industry or sector trends, or
other broad-based economic, market or political conditions and should not be construed as research or investment advice. Investors are urged to consult with their financial advisors before buying or selling any
securities. The economic and market forecasts presented herein are based on proprietary models for informational purposes as of the date of this presentation. There can be no assurance that the forecasts will
be achieved. Please see additional disclosures at the end of this presentation.
BOJ announced it aimed to double the monetary base in 2 years, with the goal of ending a long
period of deflation
BOJ Asset and Monetary Base
8
Asse
t a
nd
Mo
ne
tary
Ba
se
(¥
tn)

9
US Government Balance Sheet Was In a Period of Expansion
Source: Goldman Sachs, Plot Tool. Plot tool is a proprietary analytical tool and database representing developed and emerging markets including the US, Europe, Asia, and Latin America for their respective
Fixed Income, Equity, Foreign Exchange, Commodities, and Credit Markets covering thousands of cash, forward, futures, options, and swap instruments. The views and opinions expressed may differ from those
of GSAM or other departments or divisions of Goldman Sachs and its affiliates. This information discusses general market activity, industry or sector trends, or other broad-based economic, market or political
conditions and should not be construed as research or investment advice. Investors are urged to consult with their financial advisors before buying or selling any securities.
The unprecedented fiscal and monetary policy set the foundation for US economic recovery
Asset Side of Federal Reserve’s Balance Sheet ($mm)
Asse
t S
ide
of F
ed
era
l R
ese
rve
’s B
ala
nce
Sh
ee
t
($m
m)

10
Both Private and Public Sectors Beginning to Reduce Their Financial
Balances
Source: Department of Commerce, March 2013; Goldman Sachs. The views and opinions expressed may differ from those of GSAM or other departments or divisions of Goldman Sachs and its affiliates. This
information discusses general market activity, industry or sector trends, or other broad-based economic, market or political conditions and should not be construed as research or investment advice. Investors are
urged to consult with their financial advisors before buying or selling any securities.
Public Sector vs. Private Sector Balance as a % of GDP
A close inverse relationship exists between private sector balance and federal government balance,
indicating that a decrease in the financial balance of both the public and private sectors would lead to
GDP growth
-12
-9
-6
-3
0
3
6
9
12
-12.0
-9.0
-6.0
-3.0
0.0
3.0
6.0
9.0
12.0
1960 1965 1970 1975 1980 1985 1990 1995 2000 2005 2010 2015
Private Sector Financial Balance General Government Budget Balance
1960-2011
Avg = 1.9%
% o
f G
DP

Sequestration Used as a Tool to Enforce Discretionary Spending Cuts
Source: Dept. of Commerce, Congressional Budget Office. *Drawdown scenario assumes troops deployed for overseas military operations declines to 45k by 2015.
Federal Spending is Projected to Decline
While sequestration is projected to reduce spending significantly, it is only one of several sources of
spending restraint that has taken or will soon take effect B
illio
ns o
f 2
00
5 D
olla
rs
Bill
ion
s o
f 2
00
5 D
olla
rs
600
800
1000
1200
1400
1600
600
800
1000
1200
1400
1600
2000 2005 2010 2015 2020
CBO January 2011 Projectionw/ Spring 2011 Reductionsw/ Budget Control Act Spending Capsw/ Sequestrationw/ Other Adjustmentsw/ Military Drawdown*
Billions of 2005 dollars Billions of 2005 dollars
Federal Discretionary Spending:
* Drawdown scenario assumes troops deployed for overseas military operations declines to 45k by 2015.
Actual Projection
11

Impact of the Sequestration Will be Negative, But Manageable
Source: Goldman Sachs. This information discusses general market activity, industry or sector trends, or other broad-based economic, market or political conditions and should not be construed as research or
investment advice. Please see additional disclosures.
Fiscal Policy’s Effect on Real GDP Growth
The sequester cuts, which are less than 3% of spending, are concentrated in discretionary spending in
the second half of the year
12
Q1 Q2 Q3 Q4 Q1 Q2 Q3 Q4 Q1 Q2 Q3 Q4
-3.0
-2.5
-2.0
-1.5
-1.0
-0.5
0.0
0.5
-3.0
-2.5
-2.0
-1.5
-1.0
-0.5
0.0
0.5
Tax Spending (Ex Sequester) Sequester
Impact of Federal Fiscal Policy on
Real GDP Growth:
2012 2013 2014
Imp
act o
n R
ea
l G
DP
Gro
wth
(%
)

10.0%
12.0%
14.0%
16.0%
18.0%
20.0%
22.0%
1960 1970 1980 1990 2000 2010
Deb
t a
s %
of a
sse
ts
Debt / Asset Ratio for US Households
Trend line (1952-2012)
Government Borrowing Has Supported Private Deleveraging
US Households Debt / Asset Ratio
Source: Goldman Sachs, Plot Tool. Plot tool is a proprietary analytical tool and database representing developed and emerging markets including the US, Europe, Asia, and Latin America for their respective
Fixed Income, Equity, Foreign Exchange, Commodities, and Credit Markets covering thousands of cash, forward, futures, options, and swap instruments. Time series for the Debt/GDP is the longest available.
GSAM, ERWIN, Bloomberg. Plot tool is a proprietary analytical tool and database representing developed and emerging markets including the US, Europe, Asia, and Latin America for their respective Fixed
Income, Equity, Foreign Exchange, Commodities, and Credit Markets covering thousands of cash, forward, futures, options, and swap instruments. Plot tool houses over 20 years of economic data. The views
and opinions expressed may differ from those of GSAM or other departments or divisions of Goldman Sachs and its affiliates. This information discusses general market activity, industry or sector trends, or other
broad-based economic, market or political conditions and should not be construed as research or investment advice. Investors are urged to consult with their financial advisors before buying or selling any
securities.
13
The consumer balance sheet is looking healthier with debt / asset ratios nearing historic trends
0.0
0.5
1.0
1.5
2.0
2.5
3.0
3.5
4.0 Domestic Financial
Non-fin Biz
Household
State & Local Govn't
Federal Govn't
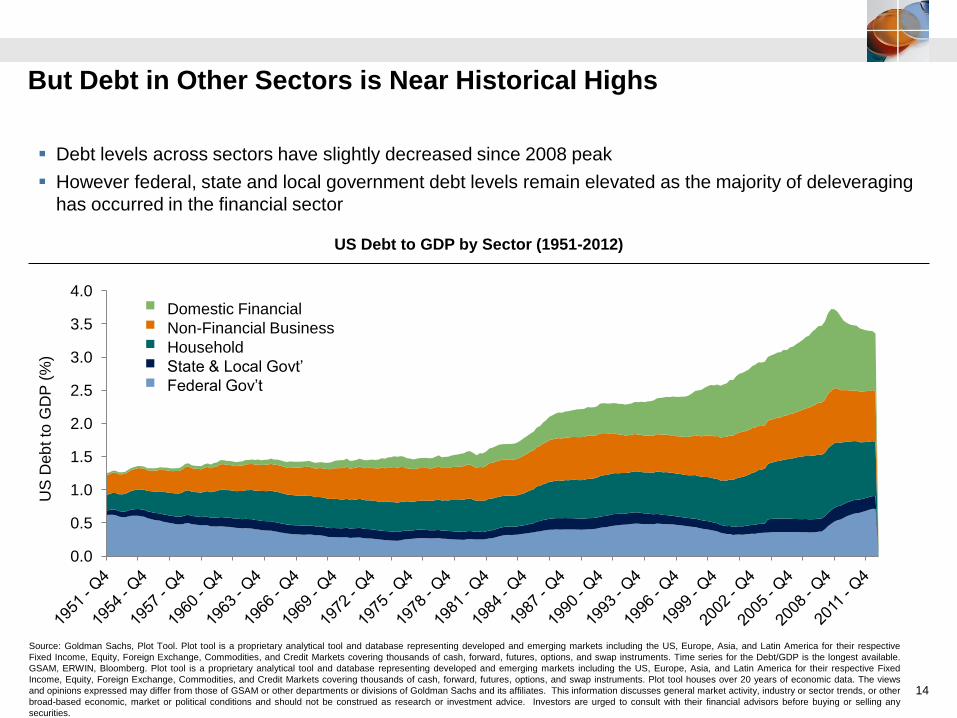
But Debt in Other Sectors is Near Historical Highs
US Debt to GDP by Sector (1951-2012)
Source: Goldman Sachs, Plot Tool. Plot tool is a proprietary analytical tool and database representing developed and emerging markets including the US, Europe, Asia, and Latin America for their respective
Fixed Income, Equity, Foreign Exchange, Commodities, and Credit Markets covering thousands of cash, forward, futures, options, and swap instruments. Time series for the Debt/GDP is the longest available.
GSAM, ERWIN, Bloomberg. Plot tool is a proprietary analytical tool and database representing developed and emerging markets including the US, Europe, Asia, and Latin America for their respective Fixed
Income, Equity, Foreign Exchange, Commodities, and Credit Markets covering thousands of cash, forward, futures, options, and swap instruments. Plot tool houses over 20 years of economic data. The views
and opinions expressed may differ from those of GSAM or other departments or divisions of Goldman Sachs and its affiliates. This information discusses general market activity, industry or sector trends, or other
broad-based economic, market or political conditions and should not be construed as research or investment advice. Investors are urged to consult with their financial advisors before buying or selling any
securities.
14
Debt levels across sectors have slightly decreased since 2008 peak
However federal, state and local government debt levels remain elevated as the majority of deleveraging
has occurred in the financial sector
US
Deb
t to
GD
P (
%)
Domestic Financial
Non-Financial Business
Household
State & Local Govt’
Federal Gov’t

U.S.A
2d
0.425
0.45
0.475
0.5
0.525
0.55
0.575
0.6
0.625
0.65
0.675
0.7
0.725
0.75
0.775
0.8
0.825
0.85
0.875
-2.2
-2.1
-2
-1.9
-1.8
-1.7
-1.6
-1.5
-1.4
-1.3
-1.2
-1.1
Positive US Trends Have Emerged
15 Source: Goldman Sachs. This information discusses general market activity, industry or sector trends, or other broad-based economic, market or political conditions and should not be construed as research or
investment advice. As of March 2013.
Housing Recovery
Factors like affordability, availability of credit and supply are trending
toward normalized levels
Positive growth is expected to have a moderate impact on US growth
Consumer Spending
With more stable finances and the availability of credit, consumer
demand may spur growth
Labor force participation expected to stabilize
Corporate Growth and Capital Spending
Increased corporate investing despite policy uncertainty
Growth of manufacturing sector has been trending positively
Energy Boom
Oil and natural gas production has increased, driving fixed investment
in commodity exploration
Stability of low natural gas prices expected to drive reduced electricity
and manufacturing costs
Estim
ate
d E
ffe
ct o
n H
ou
sin
g o
n R
ea
l G
DP
Gro
wth
(%
)
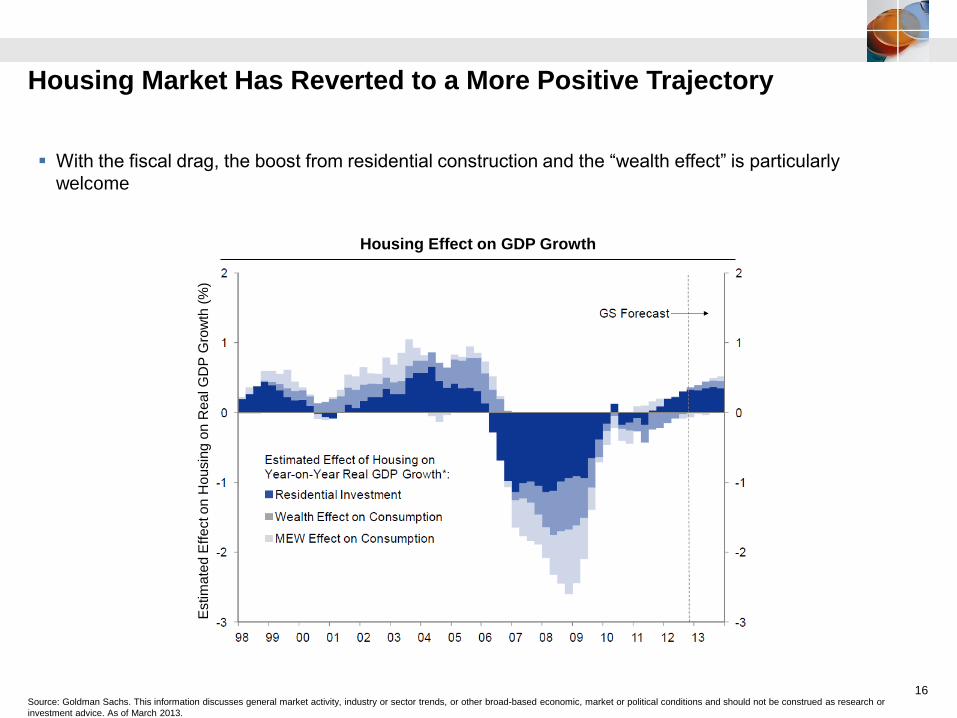
Housing Market Has Reverted to a More Positive Trajectory
Source: Goldman Sachs. This information discusses general market activity, industry or sector trends, or other broad-based economic, market or political conditions and should not be construed as research or
investment advice. As of March 2013.
Housing Effect on GDP Growth
16
With the fiscal drag, the boost from residential construction and the “wealth effect” is particularly
welcome

While Certain Factors Have Returned To Normal….
*Assumed demolition rate of 300,000 per year. Source: Department of Commerce. GS Global ECS Research. March 2013.
Housing Affordability Has Risen Significantly
Pri
ce
to
Ren
t R
atio
(In
de
x)
Hou
sin
g A
fford
ab
ility (In
de
x)
17
The Housing Affordability Index shows that housing is the most affordable in decades, thanks to record
low mortgage rates

…Others Are More Dislocated
Source: Department of Commerce. Goldman Sachs. *Assumed demolition rate of 300,000 per year.
Household Formation Has A Long Way to Rise
Hou
sin
g A
ffo
rda
bili
ty (
Th
ou
sa
nds)
18
Household formation has started to normalize. However, there are still headwinds as exemplified by
housing starts, which are well below demand
0
400
800
1200
1600
2000
2400
2800
0
400
800
1200
1600
2000
2400
2800
86 88 90 92 94 96 98 00 02 04 06 08 10 12 14 16
Household Formation Demolitions* Housing Starts
Household
Formation
Forecast

19
Positive Signs Emerging for Consumer Spending
Source: Goldman Sachs, Plot Tool. Plot Tool is a proprietary analytical tool and database representing developed and emerging markets including the US, Europe, Asia, and Latin America for their respective
Fixed Income, Equity, Foreign Exchange, Commodities, and Credit Markets covering thousands of cash, forward, futures, options, and swap instruments. Plot tool houses over 20 years of economic data.
With more stable finances and the availability of credit, consumer demand should spur growth
Fed Senior Loan Officer Survey (% Easing - % Tightening)
-90
-70
-50
-30
-10
10
30
C&L Loans to Large Firms C&L Loans to Small Firms Consumer Loans
% E
asin
g -
% T
igh
ten
ing

20
Unemployment has Been Declining
Source: Plot tool. Plot tool is a proprietary analytical tool and database representing developed and emerging markets including the US, Europe, Asia, and Latin America for their respective Fixed Income, Equity,
Foreign Exchange, Commodities, and Credit Markets covering thousands of cash, forward, futures, options, and swap instruments. Plot tool houses over 20 years of economic data.
Unemployment rate dropped to 7.6%, but this decrease was undermined by news that only 88,000 jobs
where created in March 2013, far below February 2013’s 268,000 gain
Headline Unemployment and Labor Force
Part
tim
e W
ork
/ L
abor
Fo
rce
H
eadlin
e U
nem
plo
ym
ent
-1
1
3
5
7
9
11
0
1
2
3
4
5
6
1998 1999 2000 2001 2002 2003 2004 2005 2006 2007 2008 2009 2010 2011 2012 2013
Persons Working Part Time for Economic Reasons / Labor Force (LHS)
Headline Unemployment Rate (RHS)

21
Labor Force Participation Has Been on Downward Trend
Source: Goldman Sachs, Plot Tool. Plot Tool is a proprietary analytical tool and database representing developed and emerging markets including the US, Europe, Asia, and Latin America for their respective
Fixed Income, Equity, Foreign Exchange, Commodities, and Credit Markets covering thousands of cash, forward, futures, options, and swap instruments. Plot tool houses over 20 years of economic data.
Labor Force and Average Duration of Unemployment
Unemployment is down, partially as a result of a decline in the number of workers seeking jobs
Avg D
ura
tio
n o
f U
ne
mp
loym
en
t (w
ks) L
ab
or F
orc
e P
artic
ipa
tion
(RH
S)
63.0%
63.5%
64.0%
64.5%
65.0%
65.5%
66.0%
66.5%
67.0%
67.5%
10.0
12.5
15.0
17.5
20.0
22.5
25.0
27.5
30.0
32.5
35.0
37.5
40.0
42.5
Average Duration of Unemployment in Weeks (LHS)
Last Value 37w (LHS)
Labor Force Participation (RHS)
22
Impact of Recent Tax Increases Likely To Come
Source: Goldman Sachs. This information discusses general market activity, industry or sector trends, or other broad-based economic, market or political conditions and should not be construed as research or
investment advice. Please see additional disclosures.. The economic and market forecasts presented herein are based on proprietary models for informational purposes as of the date of this presentation. There
can be no assurance that the forecasts will be achieved. Please see additional disclosures at the end of this presentation.
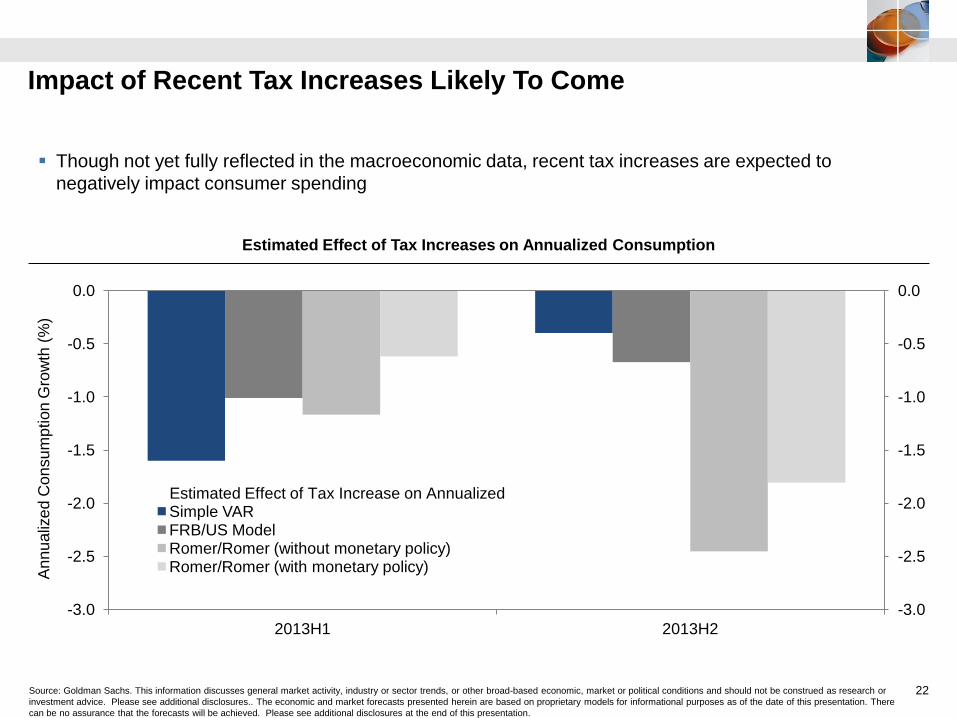
Estimated Effect of Tax Increases on Annualized Consumption
Though not yet fully reflected in the macroeconomic data, recent tax increases are expected to
negatively impact consumer spending
2013H1 2013H2
-3.0
-2.5
-2.0
-1.5
-1.0
-0.5
0.0
-3.0
-2.5
-2.0
-1.5
-1.0
-0.5
0.0
Simple VAR FRB/US Model Romer/Romer (without monetary policy) Romer/Romer (with monetary policy)
Estimated Effect of Tax Increase on Annualized
An
nu
aliz
ed
Co
nsu
mp
tion G
row
th (
%)

23
Corporate Profits Have Been Robust….
Source: Department of Commerce, Goldman Sachs. This information discusses general market activity, industry or sector trends, or other broad-based economic, market or political conditions and should not be
construed as research or investment advice. Please see additional disclosures. *After-tax adjusted profits as percent of GDP.
2012 Corporate Profit Margins – Actual and Forecasted
While general market sentiment suggests that capital spending should not accelerate until policy and tax
reforms are resolved, profit margins indicate that companies are positioned to drive demand
3.0
4.0
5.0
6.0
7.0
8.0
9.0
10.0
11.0
3.0
4.0
5.0
6.0
7.0
8.0
9.0
10.0
11.0
70 75 80 85 90 95 00 05 10 15
Actual
Corporate Profit Margins*:
Co
rpo
rate
Pro
fit M
arg
ins (
%)

24
…As Corporate Spending Poised to Increase
Source: Department of Commerce, Goldman Sachs. *After-tax adjusted profits as percent of GDP. This information discusses general market activity, industry or sector trends, or other broad-based economic,
market or political conditions and should not be construed as research or investment advice. Please see additional disclosures.
Growth of Real Private Capital and Profit Margins
Capital spending is expected pick up as the profit rate has led investment growth during the last 2
business cycles
0.0
1.0
2.0
3.0
4.0
5.0
6.0
2.0
3.0
4.0
5.0
6.0
7.0
8.0
1950 1960 1970 1980 1990 2000 2010
Profit Margin, Domestic Industries (left)
Growth Rate of Real Private Capital Stock (right)
Pro
fit M
arg
in,
Do
me
stic In
du
str
ies (
%)
Gro
wth
Ra
te o
f Re
al P
riva
te C
ap
ital S
tock (%
)

25
Oil and Natural Gas Production Has Increased…
Source: EIA Annual Energy Outlook 2012. Actual data through 2010, EIA projections beginning in 2011. This information discusses general market activity, industry or sector trends, or other broad-based
economic, market or political conditions and should not be construed as research or investment advice. Please see additional disclosures.The economic and market forecasts presented herein are based on
proprietary models for informational purposes as of the date of this presentation. There can be no assurance that the forecasts will be achieved. Please see additional disclosures at the end of this presentation.
Rise in Domestic Oil and Gas Production
Advances in technology have unlocked oil and gas in shale beds across the US, allowing substantially
more energy production and providing modest benefit to employment

26
…Leading to Indirect Stimulus in Other Areas of the Market
Source: Bloomberg, Goldman Sachs. This information discusses general market activity, industry or sector trends, or other broad-based economic, market or political conditions and should not be construed as
research or investment advice. Please see additional disclosures.
Natural Gas Prices Across US, UK and Japan
The potential collapse in the price of natural gas, which supports 20-25% of US electricity, could create a
meaningful competitive advantage for US companies that are energy cost sensitive

27
Given These Trends, Outlook Moving Forward
Source: Goldman Sachs. (1) Jim O’Neill, Goldman Sachs Asset Management. This information discusses general market activity, industry or sector trends, or other broad-based economic, market or political
conditions and should not be construed as research or investment advice. As of March 2013.
GDP
GDP growth in the US and Euro zone continues at a slow pace
Forecasts indicate 2.3% and -0.3% GDP growth for the US and the Euro zone
in 2013 respectively1
Interest Rates
Yields are still low, but rising rates may be on the horizon
We expect 10y Treasuries to potentially trade around 2.5% in the next 12
months
Fed guidance on unemployment (6.5% target) indicates potential rates hike in
2015-2016
Inflation
Near-term inflation is benign
We expect both headline and core CPI inflation to remain contained through
2013
Equity Market
Investors are continuing to seek out riskier assets
Threat of tail risks from US fiscal policy and Euro zone crisis has somewhat
abated

Rates Likely to Rise Modestly, However Risk is Asymmetrical
Source: Goldman Sachs. This information discusses general market activity, industry or sector trends, or other broad-based economic, market or political conditions and should not be construed as research or
investment advice.
Downside is still possible:
Renewed European concerns
US fiscal / political mismanagement
Adoption of more dovish Fed policy
Possibility of US growth surprise:
Housing market
Consumer balance sheet
Labor market
Unexpected inflation
2.5% 3.5% 2.0%
1 std 1 std
28
In light of these trends, we expect 10Y treasuries to trade around 2.5% in 6-12 months (somewhat higher
than forwards)

29
Inflation Likely to Remain Below 2.0%
Source: Department of Commerce. Federal Reserve Board. This information discusses general market activity, industry or sector trends, or other broad-based economic, market or political conditions and should
not be construed as research or investment advice. As of March 2013.
Near Term Inflation Expectations are Benign
Despite small upticks in CPI reports from January and February, ongoing slack in the labor market and
stable inflation expectations continue to keep inflation low
0
1
2
3
4
5
0
1
2
3
4
5
90 92 94 96 98 00 02 04 06 08 10 12 14
Actual Fed Forecast GS Forecast
Core PCE Inflation:
Fed Inflation Target = 2.0%
Pro
fit M
arg
in,
Do
me
stic In
du
str
ies (
%)
Gro
wth
Rate
of R
ea
l Priv
ate
Ca
pita
l Sto
ck (%
)

30
Unexpected Acceleration in Inflation
Expected to be contained, but risk has increased
Several Key Risks Remain
Return of the EMU Crisis
Cyprus highlights the long road ahead
China Credit Concerns
Limited risk of “hard landing”, but withdrawing liquidity earlier than expected
could be a concern
Shadow banking system may create a threat
Geopolitical concerns
Increased possibility of conflict in the Middle East
Recent developments in North Korea pose a tail risk
Source: Goldman Sachs. This information discusses general market activity, industry or sector trends, or other broad-based economic, market or political conditions and should not be construed as research or
investment advice. As of March 2013.
30

Equity valuations are still
generally attractive,
despite strong YTD
performance
In credit, strong corporate
balance sheets give
comfort that defaults
should continue to be low.
Additional spread
compression is likely to be
limited
Relative to other asset
classes, muted returns can
be expected from
Emerging Markets Debt,
Corporate Credit, and
Government Bonds given
their current low yields and
potential for rising rates
A disorderly rise in yields is
unlikely as the 10y
Treasury yield may rise to
about 2.5% by year end
2013 31
Less Attractive More Attractive
Source: Goldman Sachs. As of March 2013. This information discusses general market activity, industry or sector trends, or other broad-based economic, market or political conditions and should not be
construed as research or investment advice. Asset class views are relative to the GPS Model Strategic Portfolio.
Where to Invest Today E
qu
ity US Equity
European Equity
Japanese Equity
Fix
ed
Inc
om
e Emerging Markets Debt
Corporate Credit
High Yield
Rea
l
As
se
ts Commodities
Real Estate
Infrastructure
Deve
lop
ed
Go
ve
rnm
en
t
Bo
nd
s
US Gov’t Fixed Income
German Gov’t Fixed Income
European ex-Germany
Gov’t Fixed Income
UK Gov’t Fixed Income
Oth
er
Curve Steepeners

Disclosures
THIS MATERIAL DOES NOT CONSTITUTE AN OFFER OR SOLICITATION IN ANY JURISDICTION WHERE OR TO ANY PERSON TO WHOM IT WOULD BE UNAUTHORIZED OR UNLAWFUL TO DO SO.
This material has been prepared by GSAM and is not a product of Goldman Sachs Global Investment Research. The views and opinions expressed may differ from those of Goldman Sachs Global Investment Research or
other departments or divisions of Goldman Sachs and its affiliates. Investors are urged to consult with their financial advisors before buying or selling any securities. This information may not be current and GSAM has no
obligation to provide any updates or changes. Views and opinions expressed are for informational purposes only and do not constitute a recommendation by GSAM to buy, sell, or hold any security. Views and opinions are
current as of the date of this presentation and may be subject to change, they should not be construed as investment advice.
References to indices, benchmarks or other measures of relative market performance over a specified period of time are provided for your information only and do not imply that the portfolio will achieve similar results. The
index composition may not reflect the manner in which a portfolio is constructed. While an adviser seeks to design a portfolio which reflects appropriate risk and return features, portfolio characteristics may deviate from
those of the benchmark.
Indices are unmanaged. The figures for the index reflect the reinvestment of all income or dividends, as applicable, but do not reflect the deduction of any fees or expenses which would reduce returns. Investors cannot
invest directly in indices.
The indices referenced herein have been selected because they are well known, easily recognized by investors, and reflect those indices that the Investment Manager believes, in part based on industry practice, provide a
suitable benchmark against which to evaluate the investment or broader market described herein. The exclusion of “failed” or closed hedge funds may mean that each index overstates the performance of hedge funds
generally.
32

Past performance does not guarantee future results, which may vary. The value of investments and the income derived from investments will fluctuate and can go down as well as up. A loss of principal
may occur.
Economic and market forecasts presented herein reflect our judgment as of the date of this presentation and are subject to change without notice. These forecasts do not take into account the specific investment
objectives, restrictions, tax and financial situation or other needs of any specific client. Actual data will vary and may not be reflected here. These forecasts are subject to high levels of uncertainty that may affect actual
performance. Accordingly, these forecasts should be viewed as merely representative of a broad range of possible outcomes. These forecasts are estimated, based on assumptions, and are subject to significant revision
and may change materially as economic and market conditions change. Goldman Sachs has no obligation to provide updates or changes to these forecasts. Case studies and examples are for illustrative purposes only.
This material is provided for educational purposes only and should not be construed as investment advice or an offer or solicitation to buy or sell securities.
Goldman Sachs does not provide accounting, tax, or legal advice. Notwithstanding anything in this document to the contrary, and except as required to enable compliance with applicable securities law, you may disclose to
any person the US federal and state income tax treatment and tax structure of the transaction and all materials of any kind (including tax opinions and other tax analyses) that are provided to you relating to such tax
treatment and tax structure, without Goldman Sachs imposing any limitation of any kind. Investors should be aware that a determination of the tax consequences to them should take into account their specific
circumstances and that the tax law is subject to change in the future or retroactively and investors are strongly urged to consult with their own tax advisor regarding any potential strategy, investment or transaction.
Confidentiality
No part of this material may, without GSAM’s prior written consent, be (i) copied, photocopied or duplicated in any form, by any means, or (ii) distributed to any person that is not an employee, officer, director, or authorized
agent of the recipient.
© 2013 Goldman Sachs. First use: April 15, 2013. All rights reserved: 96823.OTHER.TMPL/4/2013
33
Disclosures


