
Stable silicon isotope signatures of marine pore waters â ......Stable silicon isotope signatures...
16
Stable silicon isotope signatures of marine pore waters – Biogenic opal dissolution versus authigenic clay mineral formation Claudia Ehlert a,⇑ , Kristin Doering a,b , Klaus Wallmann a , Florian Scholz a , Stefan Sommer a , Patricia Grasse a,1 , Sonja Geilert a , Martin Frank a a GEOMAR Helmholtz Centre for Ocean Research Kiel, Germany b Institute of Geoscience, Department of Geology, Kiel University, Germany Received 16 November 2015; accepted in revised form 14 July 2016; Available online 22 July 2016 Abstract Dissolved silicon isotope compositions have been analysed for the first time in pore waters (d 30 Si PW ) of three short sedi- ment cores from the Peruvian margin upwelling region with distinctly different biogenic opal content in order to investigate silicon isotope fractionation behaviour during early diagenetic turnover of biogenic opal in marine sediments. The d 30 Si PW varies between +1.1‰ and +1.9‰ with the highest values occurring in the uppermost part close to the sediment–water inter- face. These values are of the same order or higher than the d 30 Si of the biogenic opal extracted from the same sediments (+0.3‰ to +1.2‰) and of the overlying bottom waters (+1.1‰ to +1.5‰). Together with dissolved silicic acid concentrations well below biogenic opal saturation, our collective observations are consistent with the formation of authigenic alumino- silicates from the dissolving biogenic opal. Using a numerical transport-reaction model we find that approximately 24% of the dissolving biogenic opal is re-precipitated in the sediments in the form of these authigenic phases at a relatively low pre- cipitation rate of 56 lmol Si cm 2 yr 1 . The fractionation factor between the precipitates and the pore waters is estimated at 2.0‰. Dissolved and solid cation concentrations further indicate that off Peru, where biogenic opal concentrations in the sediments are high, the availability of reactive terrigenous material is the limiting factor for the formation of authigenic alumino-silicate phases. Ó 2016 Elsevier Ltd. All rights reserved. Keywords: Silicon isotopes; Pore water; Silicic acid; Biogenic opal; Authigenic alumino-silicates 1. INTRODUCTION The Peruvian upwelling region is characterised by high diatom primary productivity (Estrada and Blasco, 1985; Bruland et al., 2005). As the diatom valves (biogenic opal) sink down about 92% dissolve in the water column and/or below the sediment – water interface (Tre ´guer and De La Rocha, 2013 and references therein). Therefore, silicic acid concentrations increase with increasing water depth, espe- cially in the water column of shallow shelf regions. As a result of the high diatom primary productivity, the underly- ing sediments are rich in biogenic opal (Abrantes et al., 2007). Previous studies have shown that the Peru – Chile Undercurrent gets strongly enriched in silicic acid along its flow path from 15 lM prior to its contact with the north- ern Peruvian shelf to 40 lM above the shelf at 12°S(Ehlert et al., 2012). These bottom waters of the shelf stations have a lower dissolved silicon isotope composition (d 30 Si) than http://dx.doi.org/10.1016/j.gca.2016.07.022 0016-7037/Ó 2016 Elsevier Ltd. All rights reserved. ⇑ Corresponding author at: Max Planck Research Group for Marine Isotope Geochemistry, Institute for Chemistry and Biology of the Marine Environment (ICBM), University of Oldenburg, Germany. E-mail address: [email protected] (C. Ehlert). 1 University of California Santa Barbara, USA. www.elsevier.com/locate/gca Available online at www.sciencedirect.com ScienceDirect Geochimica et Cosmochimica Acta 191 (2016) 102–117
-
Upload
hoangkhanh -
Category
Documents
-
view
217 -
download
0
Transcript of Stable silicon isotope signatures of marine pore waters â ......Stable silicon isotope signatures...

Available online at www.sciencedirect.com
www.elsevier.com/locate/gca
ScienceDirect
Geochimica et Cosmochimica Acta 191 (2016) 102–117
Stable silicon isotope signatures of marine pore waters –Biogenic opal dissolution versus authigenic clay mineral formation
Claudia Ehlert a,⇑, Kristin Doering a,b, Klaus Wallmann a, Florian Scholz a,Stefan Sommer a, Patricia Grasse a,1, Sonja Geilert a, Martin Frank a
aGEOMAR Helmholtz Centre for Ocean Research Kiel, Germanyb Institute of Geoscience, Department of Geology, Kiel University, Germany
Received 16 November 2015; accepted in revised form 14 July 2016; Available online 22 July 2016
Abstract
Dissolved silicon isotope compositions have been analysed for the first time in pore waters (d30SiPW) of three short sedi-ment cores from the Peruvian margin upwelling region with distinctly different biogenic opal content in order to investigatesilicon isotope fractionation behaviour during early diagenetic turnover of biogenic opal in marine sediments. The d30SiPWvaries between +1.1‰ and +1.9‰ with the highest values occurring in the uppermost part close to the sediment–water inter-face. These values are of the same order or higher than the d30Si of the biogenic opal extracted from the same sediments(+0.3‰ to +1.2‰) and of the overlying bottom waters (+1.1‰ to +1.5‰). Together with dissolved silicic acid concentrationswell below biogenic opal saturation, our collective observations are consistent with the formation of authigenic alumino-silicates from the dissolving biogenic opal. Using a numerical transport-reaction model we find that approximately 24% ofthe dissolving biogenic opal is re-precipitated in the sediments in the form of these authigenic phases at a relatively low pre-cipitation rate of 56 lmol Si cm�2 yr�1. The fractionation factor between the precipitates and the pore waters is estimated at�2.0‰. Dissolved and solid cation concentrations further indicate that off Peru, where biogenic opal concentrations in thesediments are high, the availability of reactive terrigenous material is the limiting factor for the formation of authigenicalumino-silicate phases.� 2016 Elsevier Ltd. All rights reserved.
Keywords: Silicon isotopes; Pore water; Silicic acid; Biogenic opal; Authigenic alumino-silicates
1. INTRODUCTION
The Peruvian upwelling region is characterised by highdiatom primary productivity (Estrada and Blasco, 1985;Bruland et al., 2005). As the diatom valves (biogenic opal)sink down about 92% dissolve in the water column and/or
http://dx.doi.org/10.1016/j.gca.2016.07.022
0016-7037/� 2016 Elsevier Ltd. All rights reserved.
⇑ Corresponding author at: Max Planck Research Group forMarine Isotope Geochemistry, Institute for Chemistry and Biologyof the Marine Environment (ICBM), University of Oldenburg,Germany.
E-mail address: [email protected] (C. Ehlert).1 University of California Santa Barbara, USA.
below the sediment – water interface (Treguer and De LaRocha, 2013 and references therein). Therefore, silicic acidconcentrations increase with increasing water depth, espe-cially in the water column of shallow shelf regions. As aresult of the high diatom primary productivity, the underly-ing sediments are rich in biogenic opal (Abrantes et al.,2007).
Previous studies have shown that the Peru – ChileUndercurrent gets strongly enriched in silicic acid alongits flow path from 15 lM prior to its contact with the north-ern Peruvian shelf to 40 lM above the shelf at 12�S (Ehlertet al., 2012). These bottom waters of the shelf stations havea lower dissolved silicon isotope composition (d30Si) than

C. Ehlert et al. /Geochimica et Cosmochimica Acta 191 (2016) 102–117 103
waters further offshore at the same water depth, which havenot been in contact with the shelf sediments (Grasse et al.,2013). The potential reason for this pattern is the higherfluxes and concentrations of isotopically light biogenic opalabove the shelf and its dissolution in the water column.Also, benthic dissolution of diatom opal could result in aflux of isotopically light silicon from the sedimentary porewaters into the bottom water.
In general, most of the biogenic opal deposited on theseafloor dissolves rapidly in the silica under-saturated bot-tom waters. However, a significant fraction is preservedand matures. Moreover, authigenic silicate phases areformed in near-surface sediments by the precipitation of sil-ica, aluminium (Al), iron (Fe) and seawater solutes(Mackin, 1987). In opal-rich sediments, the formation ofthese authigenic phases is limited by Al and Fe releasedfrom reactive terrigenous phases (Loucaides et al., 2010;Van Cappellen and Qiu, 1997a) whereas biogenic opal isthe limiting factor in river delta sediments containing abun-dant Al- and Fe-bearing phases including metal oxides,feldspars, and clays (Michalopoulos and Aller, 1995).Authigenic Fe-, potassium (K)- and magnesium (Mg)-richalumino-silicates, often described as glauconite or greenclay, are major alteration products of biogenic opal in mar-ine sediments (Loucaides et al., 2010; Michalopoulos andAller, 2004). In terrigenous sediments of the Amazon deltathese authigenic phases form at a rate as high as280 lmol Si cm�2 yr�1 (Michalopoulos and Aller, 2004).In hemipelagic sediments their formation is focused in thetopmost layer of the sediment column (ca. 0–5 cm sedimentdepth) where dissolved Al and Fe are released from metaloxides and reactive alumino-silicates (Mackin and Aller,1984; Van Cappellen and Qiu, 1997a).
The main goal of this study is to investigate dissolutionof biogenic opal and the potential formation of authigenicalumino-silicate phases during early diagenesis of biogenicopal in marine sediments off Peru. For this purpose, weanalysed three short sediment cores from different waterdepths across the Peruvian shelf at 11�S for their biogenicopal and silicic acid concentrations in the pore waters, thesilicic acid flux to the overlying bottom waters, and solidphase and selected dissolved cation concentrations. Theseparameters were for the first time combined with the stablesilicon isotope composition of the sedimentary biogenicopal (d30SibSi) and of the silicic acid in the pore waters(d30SiPW). Based on these data, we use a numericaltransport-reaction model to constrain the benthic rates ofbiogenic opal dissolution, authigenic mineral precipitation,and overall reaction fractionation factors.
2. MATERIALS AND METHODS
The three sediment cores for this study were recoveredwith a multiple corer (MUC) along a depth transect at11�S at the Peruvian shelf from 145 m (core 470-MUC29),319 m (core 449-MUC19) and 1005 m (core 549-MUC53)water depth during cruise M77/1 with the German R/VMeteor in October–November 2008 (Table 1). Details onthe age models and sedimentation rates of the three corescan be found in the Supplement.
The cores were transferred to a cool room (4 �C) imme-diately after recovery and were processed within a fewhours. Samples for bottom water analysis were taken fromthe supernatant water of the sediment cores within 1 h aftercore retrieval. After removal of overlying water, MUCswere sampled under oxygen-free conditions using anargon-filled glove bag, given that redox-sensitive elementswere also analysed from sample aliquots. Sediment sectionsfor pore water extraction were transferred into 50 mL cen-trifuge tubes pre-flushed with argon gas and subsequentlycentrifuged at max. 4500 rpm for 20 min. The supernatantpore waters were filtered through 0.2 lm cellulose acetateNuclepore� filters within the glove bag. Silicic acid concen-trations were measured on board colorimetrically usingstandard photometric techniques (Grasshoff et al., 1999)(Fig. 1, Table 1). Pore water subsamples (0.5 cm3) werediluted to 5 cm3 with pure water, 0.2 cm3 of heptamolyb-date solution was added, and the samples were shaken vig-orously. After 30 min, 0.2 cm3 oxalic acid and 0.2 cm3
ascorbic acid were added to the sample. About 30 min later,the absorbance was measured at 810 nm.
2.1. In situ flux measurements
In situ fluxes of silicic acid from the sediments close tocore 449-MUC19 were measured using the BiogeochemicalObservatory BIGO-T as described in detail by Sommeret al. (2009) at two sites at 305 m water depth (535-BIGO-T3) and 309 m water depth (566-BIGO-T4) fromwithin the Peruvian oxygen minimum zone during the samecruise (Fig. 2, Table 2). At these sites oxygen levels were<2 lM.
BIGO-T observatories contained one circular flux cham-ber (internal diameter 28.8 cm, area 651.4 cm2). A TV–guided launching system allowed smooth emplacement ofthe observatories at selected sites on the sea floor. Twohours after the observatories were placed on the sea floorthe chamber was slowly driven into the sediment (ca.30 cm h�1). During this initial time period, the water insidethe flux chamber was replaced four times with ambient bot-tom water. After the chamber was fully driven into the sed-iment, the chamber water was again replaced with ambientbottom water to flush out solutes that might have beenreleased from the sediment during chamber insertion. Thewater volume enclosed by the benthic chamber in BIGO-T3 and BIGO-T4 was 9.93 and 9.53 L respectively. Duringthe deployments of BIGO-T, the chamber water wasreplaced with ambient bottom water half way through theincubation period to restore outside conditions and repeatthe benthic flux measurement.
To determine silicic acid fluxes, four sequential watersamples were removed with glass syringes (volume of eachsyringe ca. 47 mL). During the deployments of BIGO-T,a series of four water samples were taken before and afterthe chamber water was replaced. Two fluxes were calculatedfor silicic acid, one for the first series of water samples takenprior to the replacement of the chamber water denoted asI1, and another one for the second series of water samples(I2). The flux measurements for I1 and I2 were conductedfor 10 h. The syringes were connected to the chamber using

Table 1Data for solid phase (biogenic opal (bSi), d30SibSi, porosity, Al, K and porosity-corrected K concentrations) and pore waters (silicic acid (Si),d30SiPW, dissolved K and Cl concentrations) for the three cores.
Profile depth Solid phase Pore water
bSi d30SibSi 2rsd Porosity Al K (porosity corrected) Si d30SiPW 2rsd K Cl(cm) (wt%) (‰) (mg/g) (mg/g) (lM) (‰) (mM) (mM)
M77/1-470-MUC29
Bottom water – – – – – – 36.4 – – 10.2 5570.5 18.8 +1.03 0.15 0.953 39.30 9.54 325.0 – – 10.2 5591 – – – – – – – +1.21 0.04 – –1.5 18.6 – – 0.944 47.82 10.70 448.0 – – 10.2 5622.5 22.2 – – 0.945 49.12 11.11 632.0 – – 10.2 5593.5 16.9 +0.93 0.08 0.940 48.96 10.85 722.0 – – 10.3 5594.5 16.3 – – 0.932 48.35 10.97 795.0 – – 10.3 5565 – – – – – – – +1.41 0.21 – –5.5 17.2 – – 0.938 46.54 10.53 772.0 – – 10.2 5577 19.5 – – 0.955 40.91 8.69 806.0 � – 10.3 5589 19.8 +0.96 0.09 0.935 53.30 11.24 842.0 – – 10.3 55811 18.8 – – 0.928 50.70 11.19 834.0 – – 10.0 56413 15.9 – – 0.925 50.68 11.30 838.0 +1.23 0.11 10.2 53716 19.3 +0.96 0.07 0.920 49.51 11.17 858.5 – – 10.2 56520 18.9 +1.05 0.1 0.915 48.71 10.80 898.0 – – 10.2 54321 – – – – – – – +1.33 0.20 – –24 26.9 +1.15 0.13 0.920 45.17 10.12 892.5 – – 10.3 54525 – – – – – – – +1.09 0.23 – –28 14.0 +1.00 0.14 0.838 36.80 9.36 883.0 – – 10.1 54532 – +0.55 0.17 0.818 – – – – – – –32.5 10.1 – – – 62.56 14.15 863.0 – – 9.7 56033 – – – – – – – +1.13 0.02 – –36 – +1.10 0.15 0.846 – – – – – – –37.5 14.4 – – – 58.12 13.13 888.0 – – 10.0 56240 – +0.79 0.11 0.822 – – – – – – –42.5 12.3 – – – 61.02 14.36 853.5 – – 10.1 56344 – +0.91 0.18 0.841 � – – – – – –47.5 15.0 – – – 60.10 13.52 860.5 – – 10.2 56348 – +0.75 0.05 0.839 – – – – – – –
M77/1-449-MUC19
Bottom water – – – – – – 41.4 +1.40 0.18 9.8 5540.5 12.4 – – 0.958 22.27 5.26 357.2 – – 9.9 5521.5 5.7 – – 0.939 27.90 6.92 363.2 – – 9.8 5462.5 4.4 – – 0.944 28.67 7.17 360.2 – – 10.0 5513.5 4.1 +0.44 0.21 0.942 30.36 7.69 359.2 – – 9.9 5514 – – – – – – – +1.73 0.08 – –4.5 5.0 – – 0.936 37.93 9.18 351.2 – – 10.0 5375.5 5.4 – – 0.932 41.00 9.77 346.8 – – 10.0 5507 4.4 – – 0.927 41.25 10.08 370.2 – – 9.8 5478 – – – – – – – +1.93 0.15 – –9 4.2 – – 0.927 39.03 9.38 397.2 – – 10.0 54111 – +0.58 0.19 0.925 37.14 8.79 426.8 – – 9.8 55212 – – – – – – – +1.60 0.14 – –13 3.8 – – 0.920 37.25 8.80 478.0 – – 10.0 55216 4.6 +0.30 0.26 0.910 42.23 10.56 511.6 +1.57 0.15 9.8 54820 5.2 – – 0.902 48.86 11.91 602.6 – – 9.9 55124 7.3 +0.47 0.15 0.903 47.56 11.70 657.6 +1.79 0.09 10.0 55428 11.6 – – 0.899 45.11 11.09 697.4 – – 9.9 54432 9.3 – – 0.893 – – – +1.60 0.16 – –32.5 – – – – 46.09 11.60 727.8 – – 9.7 55136 7.7 +1.16 0.17 0.892 – – – +1.56 0.15 – –37.5 – – – – 46.07 11.72 743.0 – – 9.8 54440 7.7 – – 0.885 – – – – – – –42.5 – – – – 47.11 12.14 745.6 – – 10.0 54944 7.5 +1.20 0.17 0.888 – – – +1.36 0.04 – –47.5 – – – – 39.88 10.27 758.2 – – 9.8 54248 7.3 – – 0.876 – – – – – – –
Line missing
104 C. Ehlert et al. /Geochimica et Cosmochimica Acta 191 (2016) 102–117

M77/1-459-MUC53
Bottom water – – – – – – 61.2 – – 10.0 5530.5 2.0 – – 0.818 42.13 12.95 195.2 – – 10.1 5591.5 1.9 – – 0.794 42.20 12.56 207.0 – – 10.3 5612 – – – – – – – +1.68 0.15 – –2.5 1.6 – – 0.772 43.50 13.46 218.2 – – 10.4 5573.5 2.0 – – 0.760 42.90 13.48 243.4 – – 10.5 5594 – – – – – – – +1.70 0.07 – –4.5 – – – – 44.03 14.55 261.0 – – 10.4 5625 1.6 – – 0.740 – – – – – – –5.5 – – – – 43.67 14.47 259.6 – – 10.4 5586 – – – – – – – +1.37 0.06 – –7 1.6 – – 0.710 45.38 15.90 293.8 – – 10.6 5669 1.4 – – 0.678 44.52 15.51 322.2 – – 10.6 55810 – – – – – – – +1.48 0.03 – –11 1.3 – – 0.720 – – – – – – –12 – – – – 44.74 15.21 347.0 – – 10.4 55714 1.4 – – 0.715 – – – – – – –16 – – – – 45.20 15.18 376.4 +1.40 0.11 10.4 55718 – – – – – – – +1.28 0.06 – –20 – – – – – – – +1.34 0.04 – –20.5 – – – – 41.69 13.55 342.2 – – 10.5 55525.5 – – – – 36.06 12.41 328.2 – – 10.8 559
C. Ehlert et al. /Geochimica et Cosmochimica Acta 191 (2016) 102–117 105
1 m long Vygon tubes with a dead volume of 6.9 mL. Priorto deployment, these tubes were filled with distilled water,and great care was taken to avoid enclosure of air bubbles.Immediately after retrieval of the observatories, the watersamples were transferred to the onboard cool room (4 �C)for further sample processing and sub-sampling. Chlorideconcentrations were determined to correct for dilution withfresh water and the silicic acid fluxes were calculated fromthe linear increase of the corrected silicic acid concentra-tions with time (Fig. 2).
2.2. Sample preparation and measurements
For major element analyses, 100 mg of freeze dried andground sediment sample was digested in HF (40%, suprapure), HNO3 (65%, supra pure) and HClO4 (60%, p.a.).The accuracy of the digestion procedure was monitoredby including method blanks and the reference standardsSDO-1 (Devonian Ohio Shale, USGS; Govindaraju, 1994)and MESS-3 (Marine Sediment Reference Material, Cana-dian Research Council) in the digestion procedure. Selectedcation concentrations in pore water samples and digestionsolutions were determined by inductively coupled plasmaoptical emission spectrometry (ICP-OES, VARIAN 720-ES). The K and Al concentrations measured for SDO-1and MESS-3 were well within the certified ranges and thereproducibility was <2% relative standard deviation.
For dissolved d30SiPW measurements, the samples weretreated following the method of Georg et al. (2006). No pre-concentration of Si was necessary because the concentra-tion of silicic acid relative to its salt content is muchhigher in pore waters than in seawater. Samples werediluted to equal Si concentrations using MilliQ-water(18.2 MX), were then loaded directly onto pre-cleanedBioRad columns filled with 1 mL cation exchange resinAG50 W-X8 (Georg et al., 2006; de Souza et al., 2012),and were eluted typically using 2 mL of MilliQ-water. The
determination of the Si isotope composition can be suscep-tible to the complex matrix composition in a sample, i.e.,anions and dissolved organic matter (e.g., Van den Boornet al., 2009; Hughes et al., 2011). Therefore, several testswere executed in order to check for those matrix effects. Ali-quots of a pore water sample were treated with Ba toremove SO4 by precipitation of barite. Organic matterwas removed by the addition of hydrogen peroxide and lefton the hotplate until the reaction ceased. Every test wasexecuted for three aliquots of the same pore water sample.Subsequently all test solutions were measured on theNuPlasma MC-ICPMS (Nu Instruments) at GEOMARtogether with three aliquots of the untreated sample. Theaverage d30Si in all three tests was +1.3‰ and was identicalwithin analytical precision (see Supplementary Table S2).The standard deviation of the individual measurementsand aliquots was higher for the samples treated with Ba(2rsd = 0.6‰) than for the untreated sample (2rsd = 0.2‰)and the sample treated with hydrogen peroxide (2rsd = 0.2-‰). Consequently no matrix effects affected the Si isotopemeasurements on the NuPlasma MC-ICPMS and no sam-ple pretreatment or standard doping was necessary for thepore water measurements.
For the d30SibSi the size fraction 11–32 lm was chosenbecause it contained a high abundance of different diatomsspecies while at the same time it was generally not compro-mised significantly by other biogenic opal material such asradiolarian fragments or sponge spicules. Larger diatomsspecies like Coscinodiscus were usually also present as frag-ments (Ehlert et al., 2012; Doering et al., 2016). The dia-toms were separated from the sediment using establishedchemical and physical cleaning techniques (sieving andheavy liquid separation) as described by Morley et al.(2004). All samples were scanned via light microscopy toverify their purity with respect to the detrital (clay) fractionand other opal phases (radiolarians, sponge spicules) priorto dissolution. Only pure (>95%) diatom samples were
106 C. Ehlert et al. /Geochimica et Cosmochimica Acta 191 (2016) 102–117
further treated. Sample aliquots were transferred intoTeflon vials and dissolved in 1 mL 0.1 M NaOH at 130 �C for 12 h. Residual material was separated via centrifuga-tion and remaining organic matter was removed by adding200 lL concentrated H2O2 (Suprapur). Sample solutionswere diluted with 4 mL MilliQ water, neutralised with0.1 mL 1 M HCl, and purified using ion chromatography(Reynolds et al., 2008).
Si isotope ratios were measured on the NuPlasma HRMC-ICPMS (Nu Instruments) at GEOMAR in medium
0
10
20
30
40
50
0 0.5 1 1.5 2
Sedi
men
t dep
th (c
m)
0 5 10 15 20 25 30 A
0
0 B
0
10
20
30
40
50
0 0.5 1 1.5 2
Sedi
men
t dep
th (c
m)
0 5 10 15 20 25 30 C
0
0 D
0
5
10
15
20
25
30 0 5 10 15 20 25 30 bSi (wt%)
Sedi
men
t dep
th (c
m)
E
0
F0
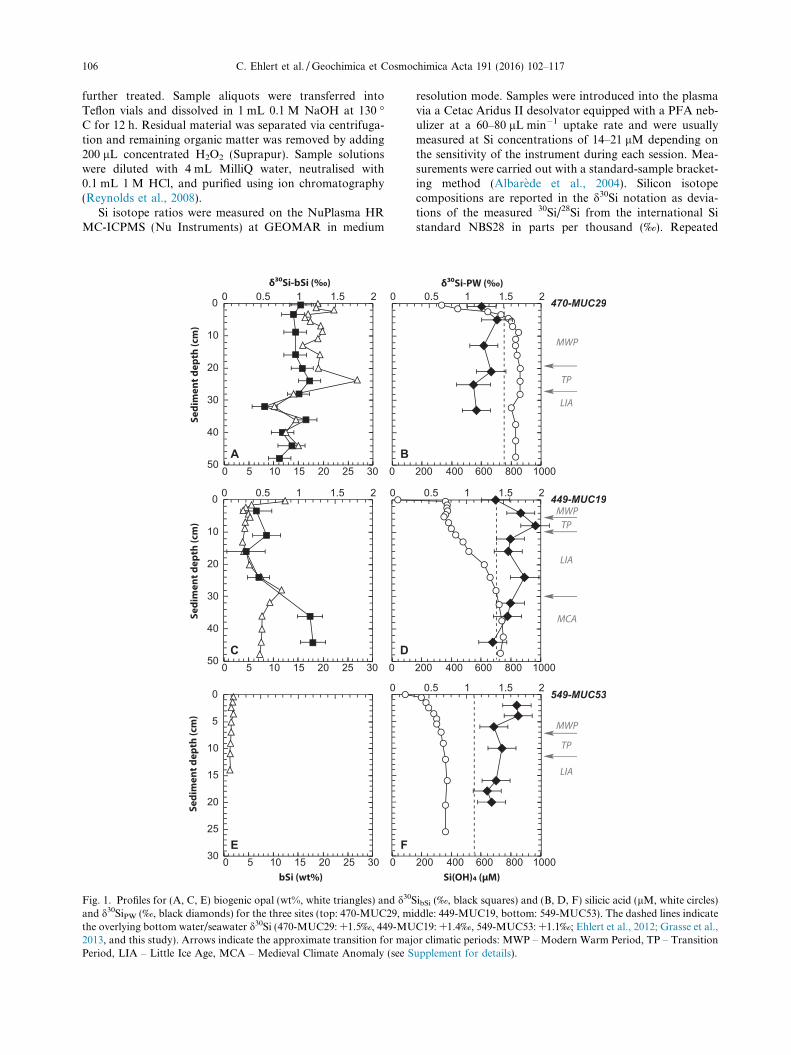
Fig. 1. Profiles for (A, C, E) biogenic opal (wt%, white triangles) and d30Sand d30SiPW (‰, black diamonds) for the three sites (top: 470-MUC29, mithe overlying bottom water/seawater d30Si (470-MUC29: +1.5‰, 449-MU2013, and this study). Arrows indicate the approximate transition for majPeriod, LIA – Little Ice Age, MCA – Medieval Climate Anomaly (see S
resolution mode. Samples were introduced into the plasmavia a Cetac Aridus II desolvator equipped with a PFA neb-ulizer at a 60–80 lL min�1 uptake rate and were usuallymeasured at Si concentrations of 14–21 lM depending onthe sensitivity of the instrument during each session. Mea-surements were carried out with a standard-sample bracket-ing method (Albarede et al., 2004). Silicon isotopecompositions are reported in the d30Si notation as devia-tions of the measured 30Si/28Si from the international Sistandard NBS28 in parts per thousand (‰). Repeated
0.5 1 1.5 2
200 400 600 800 1000
0.5 1 1.5 2
200 400 600 800 1000
0.5 1 1.5 2
200 400 600 800 1000
470-MUC29
449-MUC19
549-MUC53
MWP
TP
LIA
MWPTP
LIA
MWP
TP
LIA
MCA
ibSi (‰, black squares) and (B, D, F) silicic acid (lM, white circles)ddle: 449-MUC19, bottom: 549-MUC53). The dashed lines indicateC19: +1.4‰, 549-MUC53: +1.1‰; Ehlert et al., 2012; Grasse et al.,or climatic periods: MWP – Modern Warm Period, TP – Transitionupplement for details).

60
50
40
300 2 4 6 8 10 12
B: BIGO T4
I1: y = 1.06x + 41.64
I2: y = 1.31x + 39.85
A: BIGO T3
60
50
40
30
I1: y = 1.51x + 42.98
I2: y = 0.89x + 43.77
0 2 4 6 8 10 12
Time (h)
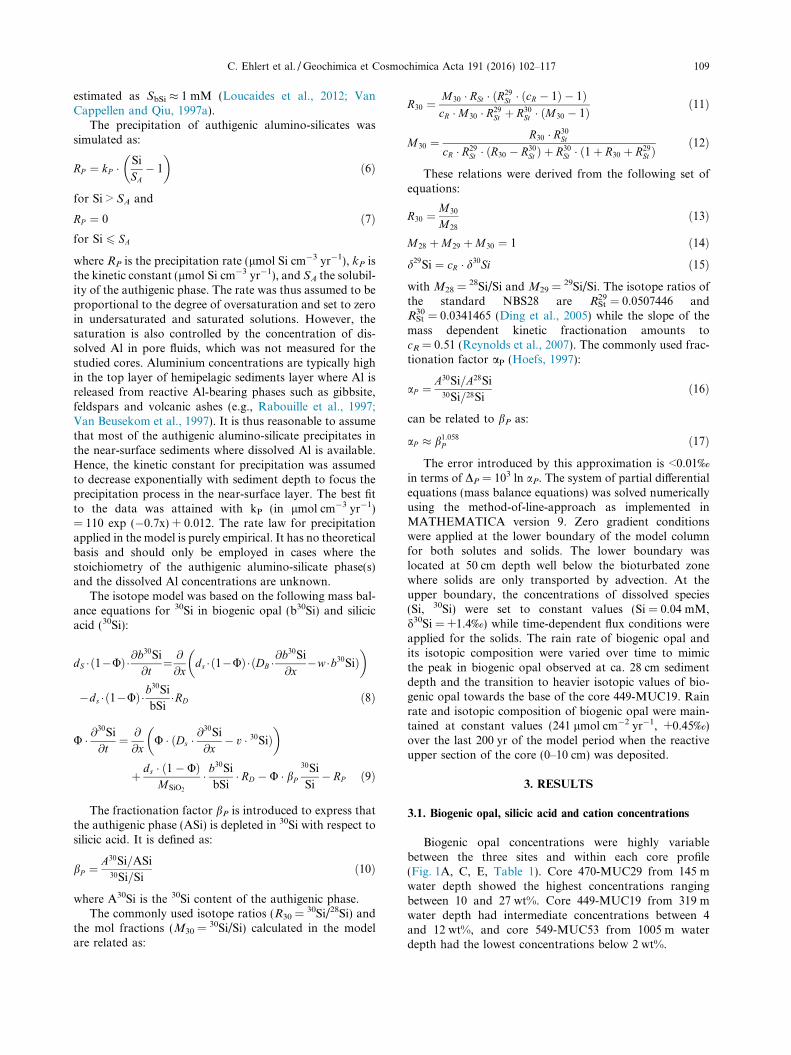
Fig. 2. Concentrations of silicic acid (lM) during the chamber fluxmeasurements inside the OMZ at 305 m water depth (BIGO-T3)and 309 m water depth (BIGO-T4). Repeat flux experiments wereconducted within the same chamber, where the enclosed waterbody was replaced after about 10 h. I1 (white circles) and I2 (blackdiamonds) denote the incubation period before and after replace-ment of the chamber water, respectively.
C. Ehlert et al. /Geochimica et Cosmochimica Acta 191 (2016) 102–117 107
measurements of the reference materials IRMM018, BigBatch (an isotopically highly fractionated SiO2 standardproduced by precipitation of dissolved sodium metasilicate;Brzezinski et al., 2006) and Diatomite gave average d30Sivalues of �1.44 ± 0.11‰ (2rsd, n = 18), �10.63 ± 0.18‰and +1.20 ± 0.08‰, respectively, which are in good agree-ment with values obtained by other laboratories (Reynoldset al., 2007). Samples were measured three to five times dur-ing a daily session, and were measured two to three timeson different days resulting in reproducibilities between±0.02‰ and ±0.26‰ (2rsd) (Table 1). Replicate measure-ments of an in–house pore water matrix standard gave areproducibility of ±0.19‰ (2rsd, n = 8) and a matrix opalstandard was reproduced at ±0.15‰ (2rsd, n = 9). Errorbars provided in the figures correspond to the externalreproducibilities of the matrix standards unless theuncertainties of the repeated sample measurements werehigher.
Table 2Stations where in situ benthic fluxes of silicic acid were determined (lmindicate release from the seabed. During the flux measurements of BIGO Tway through the incubation period. For these deployments, I1 refers to thto the time interval after the chamber water was replaced.
Lander Chamber/interval Date (2008) Position (long.
BIGO-T4 I1 14.11 78�09.13´M77-1–566 I2BIGO-T3 I1 12.11 78�15.38´M77-1–535 I2
2.3. Numerical model set-up
The turnover of biogenic opal and silicic acid in core449-MUC19 was simulated applying the following massbalance equations:
ds � ð1� UÞ � @bSi@t
¼ @
@xds � 1� Uð Þ DB � @bSi
@x� w � bSi
� �� �
� ds � ð1� UÞ � RD
U �@Si@t
¼ @
@x� UðDS �@Si
@x� v �SiÞ
� �þds � 1�Uð Þ
MSiO2
�RD�U �RP
ð2Þwith ds: density of dry solids (ds = 2.0 g cm�3 for sedimentsfrom the Peruvian OMZ; Boning et al., 2004), U: porosity;bSi: solid phase concentration of biogenic opal (g SiO2 g
�1),t: time (yr), x: sediment depth (cm), DB: bioturbation coef-ficient (cm2 yr�1), w: burial velocity of solids (cm yr�1), RD:dissolution rate of biogenic opal (g SiO2 g
�1 yr�1), Si: con-centration of silicic acid (lmol cm�3), DS: molecular diffu-sion coefficient of silicic acid in sediment pore water(cm2 yr�1), v: burial velocity of pore water (cm yr�1),MSiO2: molecular weight of SiO2, and RP: precipitation rate(lmol Si cm�3 yr�1).
The partial differential equations above assume steadystate compaction, i.e. porosity is allowed to change withsediment depth but not over time. This simplification is jus-tified by the porosity data (Fig. 3A) showing a regularexponential decrease with sediment depth indicative ofsteady-state compaction (Berner, 1980). The followingequation was employed for porosity (Berner, 1980):
U ¼ Uf þ ðUi � Uf Þ � e�p�x ð3Þwhere the initial porosity at the sediment water interface(Ui = 0.95), the porosity after compaction (Uf = 0.86), andthe attenuation coefficient (p = 0.07 cm�1) were determinedby fitting the model to the data. The effect of tortuosity ondiffusion was considered applying the following empiricalequation (Boudreau, 1996):
Ds ¼ DM
1� 2 � lnU ð4Þ
where the molecular diffusion coefficient for ambient tem-perature (11.4 �C) and salinity (35) amounts to DM = 218cm2 yr�1 (Wollast and Garrels, 1971). The bioturbationcoefficient (1 cm2 yr�1 at the surface, halving depth 1 cm)and burial velocity after compaction (wf = 0.05 cm yr�1)
ol cm�2 d�1) along a latitudinal transect at 11�S. Positive fluxes, the chamber water was replaced once with ambient seawater half-e time interval after driving the chamber into the sediment, I2 refers
W) Depth (m) Tinc. (h) Diss. Si flux (lmol cm�2 d�1)
309 20.7 0.370.46
305 20.7 0.550.33

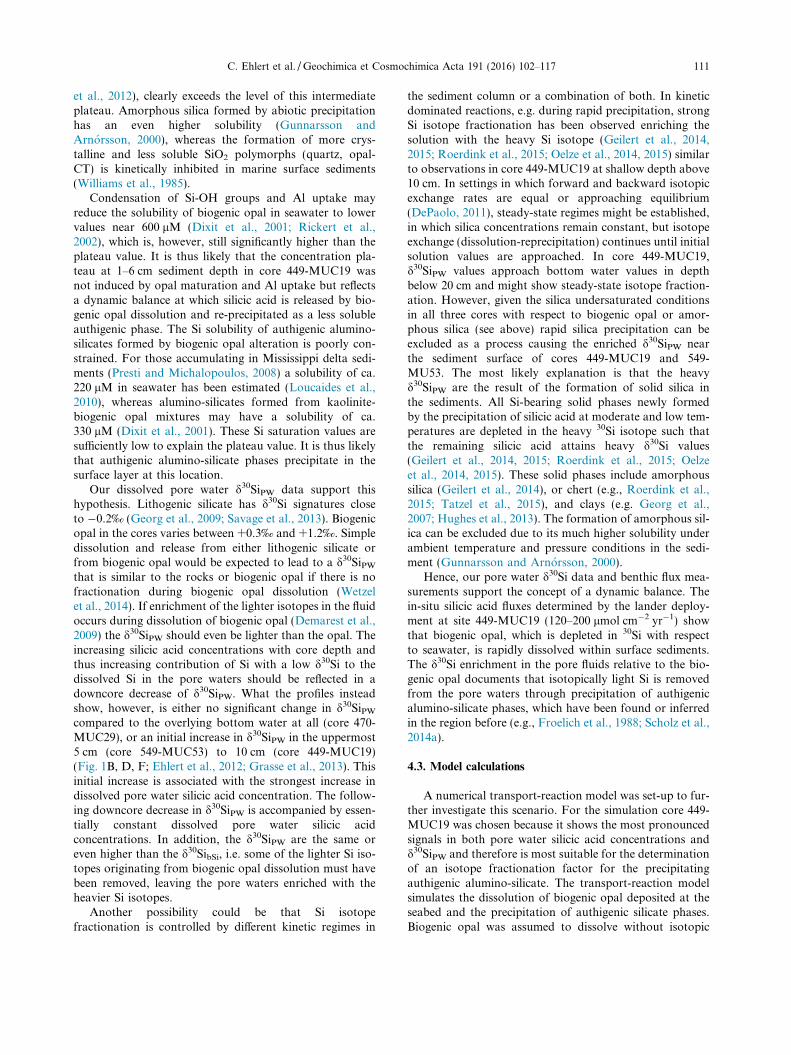
Fig. 3. Model results (lines) versus data (dots) obtained at station 449-MUC19. (A) porosity, (B) excess 210Pb, (C) biogenic opal, (D) silicicacid, (E) rate of biogenic opal dissolution, (F) rate of authigenic mineral precipitation, (G) d30Si of biogenic opal, H) pore water dissolvedd30Si. The isotopic fraction factor for authigenic mineral precipitation DP was varied from �1‰ (dashed line) to �3‰ (dotted line). The bestfit was obtained with �2‰ (solid line).
108 C. Ehlert et al. /Geochimica et Cosmochimica Acta 191 (2016) 102–117
were derived from 210Pb measurements applying a steadystate model (Meysman et al., 2005; Dale et al., 2015).Down-core changes in burial velocity were calculatedassuming steady-state compaction (Berner, 1980). How-ever, it should be noted that the burial velocity below15 cm sediment depth is not constrained by our 210Pb data(Fig. 3B). Since the reactions considered in the model occurmostly within the top 10 cm of the sediment column(Fig. 3E and F), the poorly constrained sedimentation ratebelow 15 cm depth has no significant effect on the modelresults.
The kinetic rate law of biogenic opal dissolution (Hurd,1972) was formulated as:
RD ¼ kD � bSi � 1� Si
SbSi
� �ð5Þ
with RD: dissolution rate (g SiO2 g�1 yr�1), kD: kinetic con-
stant (yr�1), bSi: solid phase concentration of biogenic opal(g SiO2 g
�1), Si: silicic acid (mM), and SbSi: solubility ofbiogenic opal (mM). The kinetic rate law states that the dis-solution rate is proportional to the saturation state. How-ever, this first order relationship is not valid in solutionsstrongly undersaturated with respect to biogenic opal(Si < 0.2 mM) where rates are higher than predicted bythe linear rate law (Van Cappellen and Qiu, 1997b). Hence,the kinetic constant kD was allowed to decrease exponen-tially with sediment depth to consider this effect and thedown-core decrease in reactivity induced by opal matura-tion (Rickert, 2000; Van Cappellen and Qiu, 1997b). Thesolubility of biogenic opal at ambient pressure and temper-ature conditions (11.4 �C, 31.9 bar; Bohlen et al., 2011) was
C. Ehlert et al. /Geochimica et Cosmochimica Acta 191 (2016) 102–117 109
estimated as SbSi � 1 mM (Loucaides et al., 2012; VanCappellen and Qiu, 1997a).
The precipitation of authigenic alumino-silicates wassimulated as:
RP ¼ kP � Si
SA� 1
� �ð6Þ
for Si > SA and
RP ¼ 0 ð7Þfor Si 6 SA
where RP is the precipitation rate (lmol Si cm�3 yr�1), kP isthe kinetic constant (lmol Si cm�3 yr�1), and SA the solubil-ity of the authigenic phase. The rate was thus assumed to beproportional to the degree of oversaturation and set to zeroin undersaturated and saturated solutions. However, thesaturation is also controlled by the concentration of dis-solved Al in pore fluids, which was not measured for thestudied cores. Aluminium concentrations are typically highin the top layer of hemipelagic sediments layer where Al isreleased from reactive Al-bearing phases such as gibbsite,feldspars and volcanic ashes (e.g., Rabouille et al., 1997;Van Beusekom et al., 1997). It is thus reasonable to assumethat most of the authigenic alumino-silicate precipitates inthe near-surface sediments where dissolved Al is available.Hence, the kinetic constant for precipitation was assumedto decrease exponentially with sediment depth to focus theprecipitation process in the near-surface layer. The best fitto the data was attained with kP (in lmol cm�3 yr�1)= 110 exp (�0.7x) + 0.012. The rate law for precipitationapplied in the model is purely empirical. It has no theoreticalbasis and should only be employed in cases where thestoichiometry of the authigenic alumino-silicate phase(s)and the dissolved Al concentrations are unknown.
The isotope model was based on the following mass bal-ance equations for 30Si in biogenic opal (b30Si) and silicicacid (30Si):
dS �ð1�UÞ�@b30Si
@t¼ @
@xds �ð1�UÞ�ðDB �@b
30Si
@x�w �b30SiÞ
� �
�ds � 1�Uð Þ�b30Si
bSi�RD ð8Þ
U � @30Si
@t¼ @
@xU � ðDs � @
30Si
@x� v � 30SiÞ
� �
þ ds � 1� Uð ÞMSiO2
� b30Si
bSi� RD � U � bP
30Si
Si� RP ð9Þ
The fractionation factor bP is introduced to express thatthe authigenic phase (ASi) is depleted in 30Si with respect tosilicic acid. It is defined as:
bP ¼ A30Si=ASi30Si=Si
ð10Þ
where A30Si is the 30Si content of the authigenic phase.The commonly used isotope ratios (R30 =
30Si/28Si) andthe mol fractions (M30 =
30Si/Si) calculated in the modelare related as:
R30 ¼ M30 � RSt � ðR29St � ðcR � 1Þ � 1Þ
cR �M30 � R29St þ R30
St � ðM30 � 1Þ ð11Þ
M30 ¼ R30 � R30St
cR � R29St � ðR30 � R30
St Þ þ R30St � ð1þ R30 þ R29
St Þð12Þ
These relations were derived from the following set ofequations:
R30 ¼ M30
M28
ð13Þ
M28 þM29 þM30 ¼ 1 ð14Þd29Si ¼ cR � d30Si ð15Þwith M28 =
28Si/Si and M29 =29Si/Si. The isotope ratios of
the standard NBS28 are RSt29 = 0.0507446 and
RSt30 = 0.0341465 (Ding et al., 2005) while the slope of the
mass dependent kinetic fractionation amounts tocR = 0.51 (Reynolds et al., 2007). The commonly used frac-tionation factor aP (Hoefs, 1997):
aP ¼ A30Si=A28Si30Si=28Si
ð16Þ
can be related to bP as:
aP � b1:058P ð17Þ
The error introduced by this approximation is <0.01‰in terms of DP = 103 ln aP. The system of partial differentialequations (mass balance equations) was solved numericallyusing the method-of-line-approach as implemented inMATHEMATICA version 9. Zero gradient conditionswere applied at the lower boundary of the model columnfor both solutes and solids. The lower boundary waslocated at 50 cm depth well below the bioturbated zonewhere solids are only transported by advection. At theupper boundary, the concentrations of dissolved species(Si, 30Si) were set to constant values (Si = 0.04 mM,d30Si = +1.4‰) while time-dependent flux conditions wereapplied for the solids. The rain rate of biogenic opal andits isotopic composition were varied over time to mimicthe peak in biogenic opal observed at ca. 28 cm sedimentdepth and the transition to heavier isotopic values of bio-genic opal towards the base of the core 449-MUC19. Rainrate and isotopic composition of biogenic opal were main-tained at constant values (241 lmol cm�2 yr�1, +0.45‰)over the last 200 yr of the model period when the reactiveupper section of the core (0–10 cm) was deposited.
3. RESULTS
3.1. Biogenic opal, silicic acid and cation concentrations
Biogenic opal concentrations were highly variablebetween the three sites and within each core profile(Fig. 1A, C, E, Table 1). Core 470-MUC29 from 145 mwater depth showed the highest concentrations rangingbetween 10 and 27 wt%. Core 449-MUC19 from 319 mwater depth had intermediate concentrations between 4and 12 wt%, and core 549-MUC53 from 1005 m waterdepth had the lowest concentrations below 2 wt%.

110 C. Ehlert et al. /Geochimica et Cosmochimica Acta 191 (2016) 102–117
The pore water silicic acid concentration profiles of allthree cores strongly increased with increasing profile depthfrom lower bottom water concentrations around 40 lM(470-MUC29 and 449-MUC19) and 60 lM (549-MUC53)to pore water concentration of up to 900 lM (470-MUC29), 760 lM (449-MUC19) and 370 lM (549-MUC53) in the deeper part of the cores (Fig. 1B, D, F).Core 470-MUC29 showed the strongest increase withinthe upper ca. 6 cm profile depth, below which the silicic acidconcentrations remained constant. Core 449-MUC19 wascharacterised by a strong increase from bottom water toelevated pore water concentrations within the first centime-tre, then remained constant around 350 lM until ca. 6 cmprofile depth, increased again and approached apparentequilibrium below ca. 30 cm profile depth. Core549-MUC53 showed increasing concentrations in theupper ca. 8 cm profile depth, and constant concentrationsbelow.
3.2. Stable silicon isotopes in biogenic opal and pore waters
d30SibSi could only be measured in cores 470-MUC29and 449-MUC19, because the biogenic opal concentrationin core 549-MUC53 was too low (1–2 wt%). The range inisotope compositions in both cores was similar varyingbetween +0.6‰ and +1.2‰ in core 470-MUC29 andbetween +0.3‰ and +1.2‰ in core 449-MUC19(Fig. 1A, C, Table 1) but the downcore patterns differed sig-nificantly. Core 470-MUC29 showed similar values near+1‰ in the deepest and shallowest parts of the profileand minimum and maximum values of +0.6‰ and+1.2‰ close to each other at intermediate depths. In con-trast, core 449-MUC19 showed low d30SibSi near +0.5‰in the upper ca. 25 cm core depth and a sharp increase to+1.2‰ below 25 cm.
The bottom water d30Si values for discrete Niskin bottlesamples collected at 10�S and 12�S varied between +1.5‰at 140 m water depth, +1.4‰ at 328 m water depth and+1.1‰ at 1000 m water depth (Fig. 1B, D, F) (Ehlertet al., 2012; Grasse et al., 2013). At site 449-MUC19 dis-solved d30Si was measured directly in the overlying bottomwater of the MUC, and the value of +1.4‰ was compara-ble to nearby bottom water measurements.
The dissolved pore water d30SiPW of core 470-MUC29varied between +1.1‰ and +1.4‰, and are indistinguish-able from each other within the uncertainties of repeatedsample measurements. These values were similar to thehigher d30SibSi values in the core (+1.2‰). In contrast,the d30SiPW of core 449-MUC19 were significantly higherthan those of core 470-MUC29. The values increased from+1.4‰ in the overlying bottom water to up to +1.9‰within the upper 10 cm. Some variations could be observedbelow, but a generally decreasing trend towards d30SiPWvalues around +1.3‰ at the bottom of the core was found.Importantly, the d30SiPW in the upper 25 cm profile depthwere up to 1.5‰ heavier than the d30SibSi values, whereasin deeper regions both approached similar values. In core549-MUC53 the d30SiPW varied between +1.3‰ and+1.7‰, whereby the highest values were found within theuppermost 5 cm.
4. DISCUSSION
4.1. Silica concentrations and Si isotopes
The Si isotope compositions of biogenic opal and silicicacid in the pore waters were determined to investigate thebehaviour of Si isotope fractionation during processes pre-dominantly influencing the early diagenetic turnover of Siin marine sediments. In general, pore water silicic acid con-centrations and the Si fluxes across the sediment – bottomwater interface are controlled by the concentration, reactiv-ity and solubility of biogenic opal. However, surface alter-ation or precipitation of authigenic silicate phases can limitthese processes (Mackin and Aller, 1984; Van Bennekomet al., 1991; McManus et al., 1995; Dixit and VanCappellen, 2003).
Biogenic opal content varies greatly between the threesites of our study and within each core (Fig. 1), but at thesame time biogenic opal content and d30SibSi follow similardepth trends. The variations can be attributed to the differ-ent environmental and climatic periods covered by the dif-ferent cores (Ehlert et al., 2015; see Supplement foradditional information). This co-variation of biogenic opalcontent and d30SibSi is a common trend that has beenobserved in several downcore records from upwellingregions. A likely explanation for this is that high productiv-ity and high surface water silicic acid utilisation caused30SibSi compositions to approach seawater values as wellas increased biogenic opal accumulation and preservationin the sediments (Ehlert et al., 2013, 2015; Pichevin et al.,2014). On a global scale, about 92% of the biogenic opalproduced in the photic zone is dissolved before burial,whereby most of the recycling occurs directly below the sed-iment–water interface (Treguer and De La Rocha, 2013,and references therein). Accordingly, the diffusive flux ofsilicic acid from the sediments is highly variable and greatlydepends on the amount of biogenic opal supplied to thesediment surface. Off Peru, benthic chamber incubationdata from two sites at 11�S in 305 m and 309 m water depthrevealed silicic acid fluxes of 120–200 lmol cm�2 yr�1
(0.33–0.55 lmol cm�2 d�1) into the overlying bottomwaters (Fig. 2, Table 2). These fluxes are comparable toother areas of high diatom primary productivity (e.g. ca.230 lmol cm�2 yr�1 off Monterey; Berelson et al., 2003),and much higher compared to regions with low diatom pro-ductivity (e.g. ca. 13 lmol cm�2 yr�1 in the equatorial Paci-fic; Treguer and De La Rocha, 2013).
4.2. Authigenic alumino-silicate precipitation
All three sites off Peru show downcore pore water silicicacid concentrations that asymptotically increase to maxi-mum concentrations ranging from 900 lM at the shallowestshelf site to 370 lM at the deepest shelf site. The pore waterprofile at site 449-MUC19 feature a conspicuous concentra-tion plateau (ca. 350 lM) for silicic acid at 1–6 cm depthinterrupting the continuous down-core increase (Fig. 1D).The solubility of biogenic opal at ambient pressure andtemperature conditions, estimated as ca. 1000 lM (VanCappellen and Qiu, 1997a; Dixit et al., 2001; Loucaides
C. Ehlert et al. /Geochimica et Cosmochimica Acta 191 (2016) 102–117 111
et al., 2012), clearly exceeds the level of this intermediateplateau. Amorphous silica formed by abiotic precipitationhas an even higher solubility (Gunnarsson andArnorsson, 2000), whereas the formation of more crys-talline and less soluble SiO2 polymorphs (quartz, opal-CT) is kinetically inhibited in marine surface sediments(Williams et al., 1985).
Condensation of Si-OH groups and Al uptake mayreduce the solubility of biogenic opal in seawater to lowervalues near 600 lM (Dixit et al., 2001; Rickert et al.,2002), which is, however, still significantly higher than theplateau value. It is thus likely that the concentration pla-teau at 1–6 cm sediment depth in core 449-MUC19 wasnot induced by opal maturation and Al uptake but reflectsa dynamic balance at which silicic acid is released by bio-genic opal dissolution and re-precipitated as a less solubleauthigenic phase. The Si solubility of authigenic alumino-silicates formed by biogenic opal alteration is poorly con-strained. For those accumulating in Mississippi delta sedi-ments (Presti and Michalopoulos, 2008) a solubility of ca.220 lM in seawater has been estimated (Loucaides et al.,2010), whereas alumino-silicates formed from kaolinite-biogenic opal mixtures may have a solubility of ca.330 lM (Dixit et al., 2001). These Si saturation values aresufficiently low to explain the plateau value. It is thus likelythat authigenic alumino-silicate phases precipitate in thesurface layer at this location.
Our dissolved pore water d30SiPW data support thishypothesis. Lithogenic silicate has d30Si signatures closeto �0.2‰ (Georg et al., 2009; Savage et al., 2013). Biogenicopal in the cores varies between +0.3‰ and +1.2‰. Simpledissolution and release from either lithogenic silicate orfrom biogenic opal would be expected to lead to a d30SiPWthat is similar to the rocks or biogenic opal if there is nofractionation during biogenic opal dissolution (Wetzelet al., 2014). If enrichment of the lighter isotopes in the fluidoccurs during dissolution of biogenic opal (Demarest et al.,2009) the d30SiPW should even be lighter than the opal. Theincreasing silicic acid concentrations with core depth andthus increasing contribution of Si with a low d30Si to thedissolved Si in the pore waters should be reflected in adowncore decrease of d30SiPW. What the profiles insteadshow, however, is either no significant change in d30SiPWcompared to the overlying bottom water at all (core 470-MUC29), or an initial increase in d30SiPW in the uppermost5 cm (core 549-MUC53) to 10 cm (core 449-MUC19)(Fig. 1B, D, F; Ehlert et al., 2012; Grasse et al., 2013). Thisinitial increase is associated with the strongest increase indissolved pore water silicic acid concentration. The follow-ing downcore decrease in d30SiPW is accompanied by essen-tially constant dissolved pore water silicic acidconcentrations. In addition, the d30SiPW are the same oreven higher than the d30SibSi, i.e. some of the lighter Si iso-topes originating from biogenic opal dissolution must havebeen removed, leaving the pore waters enriched with theheavier Si isotopes.
Another possibility could be that Si isotopefractionation is controlled by different kinetic regimes in
the sediment column or a combination of both. In kineticdominated reactions, e.g. during rapid precipitation, strongSi isotope fractionation has been observed enriching thesolution with the heavy Si isotope (Geilert et al., 2014,2015; Roerdink et al., 2015; Oelze et al., 2014, 2015) similarto observations in core 449-MUC19 at shallow depth above10 cm. In settings in which forward and backward isotopicexchange rates are equal or approaching equilibrium(DePaolo, 2011), steady-state regimes might be established,in which silica concentrations remain constant, but isotopeexchange (dissolution-reprecipitation) continues until initialsolution values are approached. In core 449-MUC19,d30SiPW values approach bottom water values in depthbelow 20 cm and might show steady-state isotope fraction-ation. However, given the silica undersaturated conditionsin all three cores with respect to biogenic opal or amor-phous silica (see above) rapid silica precipitation can beexcluded as a process causing the enriched d30SiPW nearthe sediment surface of cores 449-MUC19 and 549-MU53. The most likely explanation is that the heavyd30SiPW are the result of the formation of solid silica inthe sediments. All Si-bearing solid phases newly formedby the precipitation of silicic acid at moderate and low tem-peratures are depleted in the heavy 30Si isotope such thatthe remaining silicic acid attains heavy d30Si values(Geilert et al., 2014, 2015; Roerdink et al., 2015; Oelzeet al., 2014, 2015). These solid phases include amorphoussilica (Geilert et al., 2014), or chert (e.g., Roerdink et al.,2015; Tatzel et al., 2015), and clays (e.g. Georg et al.,2007; Hughes et al., 2013). The formation of amorphous sil-ica can be excluded due to its much higher solubility underambient temperature and pressure conditions in the sedi-ment (Gunnarsson and Arnorsson, 2000).
Hence, our pore water d30Si data and benthic flux mea-surements support the concept of a dynamic balance. Thein-situ silicic acid fluxes determined by the lander deploy-ment at site 449-MUC19 (120–200 lmol cm�2 yr�1) showthat biogenic opal, which is depleted in 30Si with respectto seawater, is rapidly dissolved within surface sediments.The d30Si enrichment in the pore fluids relative to the bio-genic opal documents that isotopically light Si is removedfrom the pore waters through precipitation of authigenicalumino-silicate phases, which have been found or inferredin the region before (e.g., Froelich et al., 1988; Scholz et al.,2014a).
4.3. Model calculations
A numerical transport-reaction model was set-up to fur-ther investigate this scenario. For the simulation core 449-MUC19 was chosen because it shows the most pronouncedsignals in both pore water silicic acid concentrations andd30SiPW and therefore is most suitable for the determinationof an isotope fractionation factor for the precipitatingauthigenic alumino-silicate. The transport-reaction modelsimulates the dissolution of biogenic opal deposited at theseabed and the precipitation of authigenic silicate phases.Biogenic opal was assumed to dissolve without isotopic
112 C. Ehlert et al. /Geochimica et Cosmochimica Acta 191 (2016) 102–117
fractionation (Wetzel et al., 2014) whereas the precipitatingsolid was assumed to be isotopically lighter than the ambi-ent pore fluids applying a fractionation factor DP defined as:
DP ¼ d30SiA � d30SiD ð18Þwhere d30SiA represents the isotopic composition of theauthigenic solid while d30SiD is the corresponding valuefor silicic acid.
Rain rates of biogenic opal and the rates of biogenicopal dissolution and silica precipitation were varied untilthe calculated benthic flux of silicic acid (Fig. 2, Table 2)and the down-core profiles of biogenic opal and silicic acidwere consistent with observations in core 449-MUC19(Fig. 3). The model results (Table 3) show that most ofthe silicic acid produced by biogenic opal dissolution isreleased into the overlying bottom water. However, ca.24% of the opal-derived silica are re-precipitated presum-ably as authigenic alumino-silicate minerals. The modelledsolubility of this authigenic alumino-silicate (250 lM,Table 3) is consistent with previous observations duringincubation experiments of fresh diatom opal with sedimentin a seawater matrix (Loucaides et al., 2010). The precipita-tion rate of 56 lmol Si cm�2 yr�1 (Table 3) is lower than therate observed in the Amazon delta (Michalopoulos andAller, 2004). The fractionation factor DP was constrainedby fitting the model to the measured dissolved d30SiPW data.The best fit was achieved with DP = �2.0‰ (Fig. 3H).Essentially the same value (�2.05‰) was previously derivedfor 2:1 clays formed in the Amazon Basin (Hughes et al.,2013). Below ca. 2 cm depth the pore waters of 449-MUC19 are enriched in 30Si due to this precipitation pro-cess. Only the uppermost layer, where the pore water isundersaturated with respect to the authigenic phase, isdepleted in 30Si due to the rapid dissolution of biogenic opal(Fig. 3H). Here, the d30SiPW value dropped from +1.40‰ inthe overlying bottom water to a minimum value of +0.95‰at 2 cm sediment depth. The isotopic composition of silicicacid diffusing into the overlying bottom water (+0.75‰,Table 3) reflects the mixing effects of the release of isotopi-cally light Si from biogenic opal (+0.45‰) and the removalof light Si into authigenic phases. Silicon isotope fractiona-tion by adsorption onto Al-hydroxide phases was previ-ously shown in experimental studies by Oelze et al.(2015), in which varying kinetic regimes control the Si iso-tope fractionation. During initial high precipitation rates,they found a rapid removal of the light 28Si isotope fromsolution, resulting in a large kinetically controlled Si iso-tope fractionation (comparable to the high d30Si values inthe upper ca. 10 cm of 449-MUC19; Figs. 1 and 3).
Table 3Model results for station 449-MUC19 obtained at the end of thetransient simulation.
Parameter Value
Dissolution rate of biogenic opal 234 lmol cm�2 yr�1
Precipitation rate of authigenic phase 56 lmol cm�2 yr�1
Benthic flux of silicic acid 181 lmol cm�2 yr�1
d30Si of benthic flux +0.75‰
4.4. Alteration of terrigenous silicate minerals versus reverse
weathering
The transport-reaction model suggests that the relativelyheavy d30SiPW isotope composition of core 449-MUC19reflects the combined process of biogenic opal dissolutionand removal of pore water silicic acid by authigenicalumino-silicate minerals. Previous studies have demon-strated that sequestration of pore water or opaline silicaby authigenic silicate minerals in marine sediments caneither operate through dissolution of terrigenous silicateminerals and subsequent co-precipitation with the releasedAl (Van Cappellen and Qiu, 1997a; Dixit et al., 2001) orthrough reaction with Al and Fe (oxyhydr)oxides andcations (mainly K and Mg) dissolved in the pore waters(Michalopoulos and Aller, 1995, 2004; Michalopouloset al., 2000). The latter process results in the formation ofK- and Fe-rich clay minerals and is commonly referred toas reverse weathering (Mackenzie and Garrels, 1966).
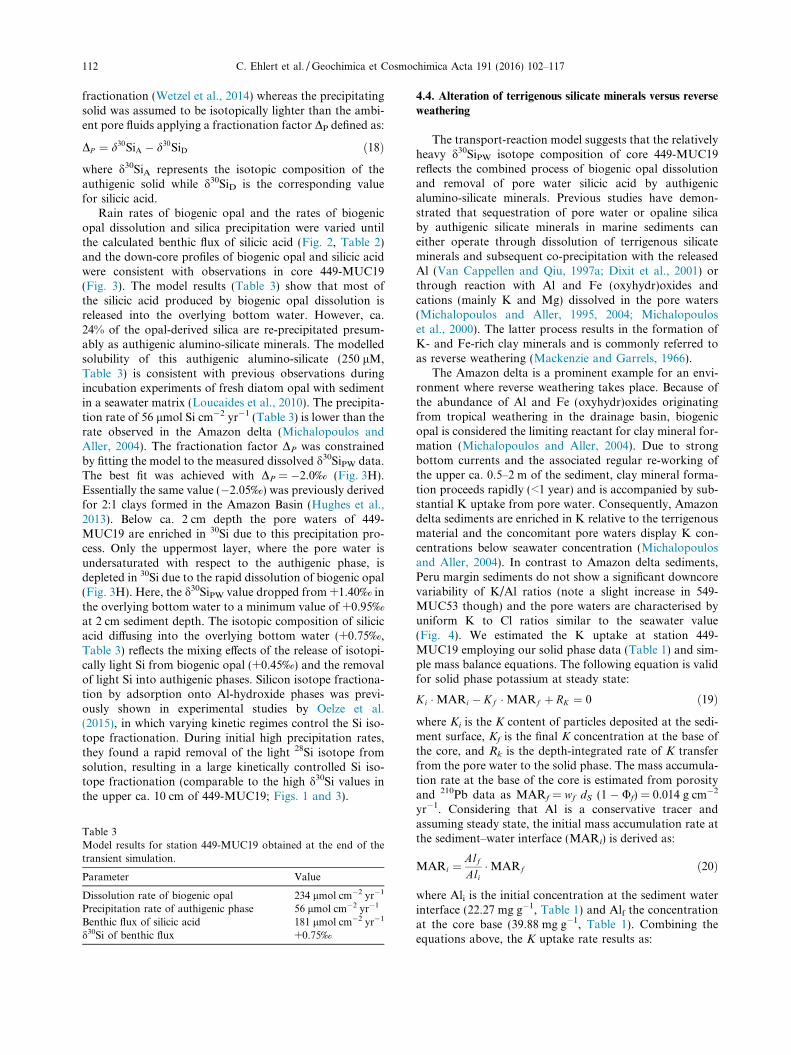
The Amazon delta is a prominent example for an envi-ronment where reverse weathering takes place. Because ofthe abundance of Al and Fe (oxyhydr)oxides originatingfrom tropical weathering in the drainage basin, biogenicopal is considered the limiting reactant for clay mineral for-mation (Michalopoulos and Aller, 2004). Due to strongbottom currents and the associated regular re-working ofthe upper ca. 0.5–2 m of the sediment, clay mineral forma-tion proceeds rapidly (<1 year) and is accompanied by sub-stantial K uptake from pore water. Consequently, Amazondelta sediments are enriched in K relative to the terrigenousmaterial and the concomitant pore waters display K con-centrations below seawater concentration (Michalopoulosand Aller, 2004). In contrast to Amazon delta sediments,Peru margin sediments do not show a significant downcorevariability of K/Al ratios (note a slight increase in 549-MUC53 though) and the pore waters are characterised byuniform K to Cl ratios similar to the seawater value(Fig. 4). We estimated the K uptake at station 449-MUC19 employing our solid phase data (Table 1) and sim-ple mass balance equations. The following equation is validfor solid phase potassium at steady state:
Ki �MARi � Kf �MARf þ RK ¼ 0 ð19Þwhere Ki is the K content of particles deposited at the sedi-ment surface, Kf is the final K concentration at the base ofthe core, and Rk is the depth-integrated rate of K transferfrom the pore water to the solid phase. The mass accumula-tion rate at the base of the core is estimated from porosityand 210Pb data as MARf = wf dS (1 � Uf) = 0.014 g cm�2
yr�1. Considering that Al is a conservative tracer andassuming steady state, the initial mass accumulation rate atthe sediment–water interface (MARi) is derived as:
MARi ¼ AlfAli
�MARf ð20Þ
where Ali is the initial concentration at the sediment waterinterface (22.27 mg g�1, Table 1) and Alf the concentrationat the core base (39.88 mg g�1, Table 1). Combining theequations above, the K uptake rate results as:

0
10
20
30
40
50
0.2 0.4
Sedi
men
t dep
th (c
m)
K/Al (wt%/wt%)
0.0 1.0 2.0
15 20 25 K/Cl (mM/M)
0 0.5 1.0 Al/bSi (wt%/wt%)
0 500 1000
0
10
20
30
40
50
0.2 0.4
Sedi
men
t dep
th (c
m)
0.0 1.0 2.0
15 20 25 0 0.5 1.0
0 500 1000
0
5
10
15
20
25
30
0.2 0.4
Sedi
men
t dep
th (c
m)
15 20 25
0.0 1.0 2.0 K (wt%)
0 2 4
0 500 1000
470-MUC29
449-MUC19
549-MUC53
A B C
D E F
G H I
MWP
TP
LIA
MWPTP
LIA
MWP
TP
LIA
MCA
Fig. 4. Downcore profiles of (A, D, G) solid phase K/Al (solid circles) and K (open circles), (B, E, H) pore water K/Cl (the vertical dashedline depicts the K/Cl of seawater) and (C, F, I) solid phase Al/bSi ratio (solid circles) and pore water silicic acid (open circles) for all sedimentcores. Note differing axis scalings for Al/bSi. Solid phase K concentrations were corrected for the K contribution from evaporated pore water.Contributions of Al from pore waters are insignificant.
C. Ehlert et al. /Geochimica et Cosmochimica Acta 191 (2016) 102–117 113
RK ¼ MARf � Kf � Ki � AlfAli
� �¼ 0:01 mg cm�2 yr�1 ð21Þ
with Ki = 5.26 mg g�1 and Kf = 10.27 mg g�1 (Table 1).This rate can be compared to the depth-integrated rate ofsilica precipitation derived from the model (56 lmol cm�2
yr�1, Table 3) that translates into a K uptake rate of0.416 mg cm�2 yr�1 if the authigenic phase had a molarK/Si ratio of 0.19 as observed in the Amazon delta(Michalopoulos and Aller, 2004) and if all K required forthe authigenic phase originated from the pore water. Therate derived from the solid phase measurements(0.01 mg cm�2 yr�1) is much smaller than this hypotheticalvalue (0.416 mg cm�2 yr�1). Hence, it can be concluded thatthe authigenic phase at station 449-MUC19 either containsmuch less K than the silicates formed in Amazon delta sed-iments and/or that most of the K bound in this phase is not
derived from the pore water but from other solid phases.Therefore, the authigenic mineral formation at our studysite does not qualify as reverse weathering.
The formation of authigenic alumino-silicate mineralsthrough dissolution of terrigenous silicate minerals andco-precipitation of the liberated Al with pore water silicicacid has been reported for opal-rich deep-sea sediments ofthe Southern Ocean (Van Cappellen and Qiu, 1997a). Thesediment cores investigated in that study display an inverserelationship between the extent of silicic acid build-up inpore water and the ratio of the depositional flux of biogenicopal and detrital material, i.e. maximum pore water silicicacid concentrations are lower with increasing ratios ofdetrital material and biogenic opal. Based on this observa-tion, the authors concluded that the simultaneous re-precipitation of Al and silicic acid prevents pore water silica

114 C. Ehlert et al. /Geochimica et Cosmochimica Acta 191 (2016) 102–117
from reaching saturation with respect to the dissolving bio-genic opal. This interpretation is in line with our observa-tions. The sediment cores from the Peruvian marginstudied here show a similar exponential decline in the max-imum silicic acid concentrations with increasing ratiosbetween detrital material (as represented by sedimentaryAl) and biogenic opal (Fig. 5). Moreover, the plateau inthe pore water silicic acid profile as well as high d30SiPWup to +1.9‰ in 449-MUC19 could be explained by a higherAl availability related to a positive excursion in the Al tobiogenic opal ratio in the upper 20 cm of the sediment(Fig. 4F). All three cores in this study cover a period of time(Figs. 1 and 4; see Supplement for details), during whichsignificant climatically triggered changes in terrigenousmatter supply occurred. High Al to biogenic opal ratiosoccur in sediment depths corresponding to the Little IceAge, which was characterised by permanent El Nino-likeconditions with higher precipitation and runoff of detritalmaterial from land. The younger sediment layers above aswell as the deeper sediments show decreasing Al to biogenicopal ratios and d30SiPW values closer to the bottom watervalues and correspond to the Modern Warm Period andthe Medieval Climate Anomaly, which are characterisedby much drier conditions on land and reduced supply ofterrigenous material (e.g. Sifeddine et al., 2008). In analogyto biogenic opal-rich sediments in the Southern Ocean, for-mation of alumino-silicate minerals in diatomaceous mudsof the Peruvian continental margin is thus most likely con-trolled by the availability of terrigenous matter rather thanbiogenic opal. This assumption is consistent with the mostlydry climate on land and thus low concentrations of pure Al(oxyhydr)oxides in Peru margin sediments. Moreover,because of reductive dissolution of Fe (oxyhydr)oxidesand diffusive loss of pore water Fe across the sediment-bottom water interface, sediments within the Peruvian oxy-gen minimum zone (470-MUC29 and 449-MUC19) aredepleted rather than enriched in reactive Fe (Scholz et al.,2014a, 2014b), which may inhibit formation of Fe-richalumino-silicates. The deeper sediments deposited belowthe Peruvian oxygen minimum zone (549-MUC53), how-ever, may also represent a transition between terrigenousmatter(Al)-limited and opal-limited formation of alumino-silicate minerals. Due to downslope transfer of Fe from sed-iments within the oxygen minimum zone, sediments below
0 1 2 3mean Al/bSi (wt.%/wt.%)
0
200
400
600
800
1000470-MUC29
449-MUC19
549-MUC53
Si(O
H)
(µM
)4
Fig. 5. Plot of the asymptotic concentrations of Si in pore waters(maximum silicic acid concentration at the lower ends of theprofiles) versus mean Al/bSi for all sediment cores.
the oxygen minimum zone are enriched in reactive Fe(Scholz et al., 2014b). The higher d30SiPW in shallow sedi-ment depths of 549-MUC53 could therefore also be relatedto adsorption and fractionation of Si to reactive Fe(Delstanche et al., 2009). Previous studies detected orinferred high concentrations of authigenic Fe-rich silicateminerals in this area (Suits and Arthur, 2000; Scholzet al., 2014a). Consistent with this hypothesis, sedimentsof 549-MUC53 display a slight downcore increase inK/Al (Fig. 4G).
5. SUMMARY AND IMPLICATIONS
In this study we investigate the processes affecting thesilicon isotope fractionation of biogenic opal and porewater silicic acid during early diagenesis in marine sedi-ments by comparing the silicic acid and biogenic opal con-centration data with their silicon isotope compositions fromthree short cores from the Peruvian shelf. Silicic acid fluxesreveal that a large amount of the settling biogenic opal,which is depleted in the heavy Si isotopes relative to seawa-ter, is dissolved in the upper few millimetres directly belowthe sediment–water interface making these sediments animportant source for isotopically light Si in marine bottomwaters. At the same time, about 24% of the dissolving bio-genic opal is reprecipitated as authigenic phases, most likelyalumino-silicates, which form in the uppermost centimetresof the sediment profile. The Si isotope fractionation factorbetween authigenic precipitates and fluid is estimated to be�2.0‰, leaving the pore waters enriched in the heavy Si iso-topes. The isotope composition of biogenic opal is constantwithin the reactive surface layer where most of the dissolu-tion and precipitation occurs. This observation is consistentwith the isotope composition of the diatoms not being sig-nificantly affected by these processes. In the Peruvian sedi-ments, which are characterised by high biogenic opalconcentrations, the precipitation process is likely controlledby terrigenous mineral supply (reactive Al). Our pioneeringstudy suggests that Si isotopes may help to unravel the stillenigmatic mechanisms responsible for the formation ofauthigenic silicate phases not only in the Peruvian OMZbut also in other upwelling regions.
ACKNOWLEDGEMENTS
This work is a contribution of Sonderforschungsbereich 754‘‘Climate – Biogeochemistry Interactions in the Tropical Ocean”(www.sfb754.de), which is supported by the Deutsche Forschungs-gemeinschaft. The Seventh Framework Program of the EuropeanUnion supported the participation of F.S. (Marie Curie IOF300648, BICYCLE). We thank M. Dibbern, B. Domeyer, R.Ebbinghaus, N. Glock, J. Heinze, C. Hensen, S. Kriwanek, A. Nof-fke, A. Petersen, R. Surberg and M. Turk for technical assistanceduring sampling and analysis.
APPENDIX A. SUPPLEMENTARY DATA
Supplementary data associated with this article can befound, in the online version, at http://dx.doi.org/10.1016/j.gca.2016.07.022.
C. Ehlert et al. /Geochimica et Cosmochimica Acta 191 (2016) 102–117 115
REFERENCES
Abrantes F., Lopes C., Mix A. C. and Pisias N. G. (2007) Diatomsin Southeast Pacific surface sediments reflect environmentalproperties. Quatern. Sci. Rev. 26, 155–169. http://dx.doi.org/10.1016/j.quascirev.2006.02.022.
Albarede F., Telouk P., Blichert-Toft J., Boyet M., Agranier A.and Nelson B. K. (2004) Precise and accurate isotopicmeasurements using multiple-collector ICPMS. Geochim. Cos-
mochim. Acta 68(12), 2725–2744. http://dx.doi.org/10.1016/j.gca.2003.11.024.
Berelson W. M., McManus J., Coale K. H., Johnson K. S. andBurdige D., et al. (2003) A time series of benthic fluxmeasurements from Monterey Bay, CA. Cont. Shelf Res. 23,457–481.
Berner R. A. (1980) Early Diagenesis – A Theoretical Approach.Princeton University Press, Princeton.
Bohlen L., Dale A. W., Sommer S., Mosch T., Hensen C., NoffkeA. and Wallmann K. (2011) Benthic nitrogen cycling traversingthe Peruvian oxygen minimum zone. Geochim. Cosmochim.
Acta 75(20), 6094–6111. http://dx.doi.org/10.1016/j.gca.2011.08.010.
Boning P., Brumsack H.-J., Bottcher M. E., Schnetger B., KrieteC., Kallmeyer J. and Borchers S. L. (2004) Geochemistry ofPeruvian near-surface sediments. Geochim. Cosmochim. Acta 68
(21), 4429–4451. http://dx.doi.org/10.1016/j.gca.2004.04.027.Boudreau B. P. (1996) The diffusive tortuosity of fine-grained
unlithified sediments. Geochim. Cosmochim. Acta 60(16), 3139–3142.
Bruland K. W., Rue E. L., Smith G. J. and DiTullio G. R. (2005)Iron, macronutrients and diatom blooms in the Peru upwellingregime: brown and blue waters of Peru.Mar. Chem. 93, 81–103.http://dx.doi.org/10.1016/j.marchem.2004.06.011.
Brzezinski M. A., Jones J. L., Beucher C. P., Demarest M. S. andBerg H. L. (2006) Automated determination of silicon isotopenatural abundance by the acid decomposition of cesiumhexafluosilicate. Anal. Chem. 78(17), 6109–6114.
Dale A. W., Sommer S., Lomnitz U., Montes I., Treude T.,Liebetrau V. and Wallmann K. (2015) Organic carbon produc-tion, mineralisation and preservation on the Peruvian margin.Biogeosciences 12(5), 1537–1559. http://dx.doi.org/10.5194/bg-12-1537-2015.
De Souza G. F., Reynolds B. C., Rickli J., Frank M., Saito M. A.,Gerringa L. J. A. and Bourdon B. (2012) Southern Oceancontrol of silicon stable isotope distribution in the deep AtlanticOcean. Global Biogeochem. Cycles 26(GB2035). http://dx.doi.org/10.1029/2011GB004141.
Delstanche S., Opfergelt S., Cardinal D., Elsass F., Andre L. andDelvaux B. (2009) Silicon isotopic fractionation during adsorp-tion of aqueous monosilicic acid onto iron oxide. Geochim.
Cosmochim. Acta 73(4), 923–934. http://dx.doi.org/10.1016/j.gca.2008.11.014.
Demarest M. S., Brzezinski M. A. and Beucher C. P. (2009)Fractionation of silicon isotopes during biogenic silica dissolu-tion. Geochim. Cosmochim. Acta 73(19), 5572–5583. http://dx.doi.org/10.1016/j.gca.2009.06.019.
DePaolo D. J. (2011) Surface kinetic model for isotopic and traceelement fractionation during precipitation of calcite fromaqueous solutions. Geochim. Cosmochim. Acta 75(4), 1039–1056. http://dx.doi.org/10.1016/j.gca.2010.11.020.
Ding T. P., Wan D., Bai R., Zhang Z., Shen Y. and Meng R. (2005)Silicon isotope abundance ratios and atomic weights of NBS-28and other reference materials. Geochim. Cosmochim. Acta 69
(23), 5487–5494. http://dx.doi.org/10.1016/j.gca.2005.06.015.
Dixit S. and van Cappellen P. (2003) Predicting benthic fluxes ofsilicic acid from deep-sea sediments. J. Geophys. Res. 108(C10),3334. http://dx.doi.org/10.1029/2002JC001309.
Dixit S., Van Cappellen P. and Van Bennekom A. J. (2001)Processes controlling solubility of biogenic silica and pore waterbuild-up of silicic acid in marine sediments. Mar. Chem. 73,333–352.
Doering K., Ehlert C., Grasse P., Crosta X., Fleury S., Frank M.and Schneider R. (2016) Differences between mono-generic andmixed diatom silicon isotope compositions trace present andpast nutrient utilisation off Peru. Geochim. Cosmochim. Acta
177, 30–47. http://dx.doi.org/10.1016/j.gca.2015.12.029.Ehlert C., Grasse P., Mollier-Vogel E., Boschen T., Franz J., De
Souza G. F. and Frank M. (2012) Factors controlling thesilicon isotope distribution in waters and surface sediments ofthe Peruvian coastal upwelling. Geochim. Cosmochim. Acta 99,128–145. http://dx.doi.org/10.1016/j.gca.2012.09.038.
Ehlert C., Grasse P. and Frank M. (2013) Changes in silicateutilisation and upwelling intensity off Peru since the LastGlacial Maximum – insights from silicon and neodymiumisotopes. Quatern. Sci. Rev. 72, 18–35. http://dx.doi.org/10.1016/j.quascirev.2013.04.013.
Ehlert C., Grasse P., Gutierrez D., Salvatteci R. and Frank M.(2015) Nutrient utilisation and weathering inputs in thePeruvian upwelling region since the Little Ice Age. Climate
Past 11, 187–202. http://dx.doi.org/10.5194/cp-11-187-2015.Estrada M. and Blasco D. (1985) Phytoplankton assemblages in
coastal upwelling areas. In Simposio Internacional Sobre Las
Areas de Afloramiento Mas Importantes del Oeste Africano
(Cabo Blanco y Benguela) (eds. C. Bas, R. Margalef and P.Rubies). Instituto de Investigaciones Pesqueras, Barcelona, pp.379–402.
Froelich P. N., Arthur M. A., Burnett W. C., Deakin M., HensleyV., Jahnke R., Kaul L., Kim K.-H., Roe K., Soutar A. andVathakanon C. (1988) Early diagenesis of organic matter inPeru continental margin sediments: phosphorite precipitation.Mar. Geol. 80, 309–343.
Geilert S., Vroon P. Z., Roerdink D. L., Van Cappellen P. and vanBergen M. J. (2014) Silicon isotope fractionation during abioticsilica precipitation at low temperatures: Inferences from flow-through experiments. Geochim. Cosmochim. Acta 142, 95–114.http://dx.doi.org/10.1016/j.gca.2014.07.003.
Geilert S., Vroon P. Z., Keller N. S., Gudbrandsson S., StefanssonA. and van Bergen M. J. (2015) Silicon isotope fractionationduring silica precipitation from hot-spring waters: evidencefrom the Geysir geothermal field, Iceland. Geochim. Cos-
mochim. Acta 164, 403–427. http://dx.doi.org/10.1016/j.gca.2015.05.043.
Georg R. B., Reynolds B. C., Frank M. and Halliday A. N. (2006)New sample preparation techniques for the determination of Siisotopic compositions using MC-ICPMS. Chem. Geol. 235, 95–104. http://dx.doi.org/10.1016/j.chemgeo.2006.06.006.
Georg R. B., Reynolds B. C., West A. J., Burton K. W. andHalliday A. N. (2007) Silicon isotope variations accompanyingbasalt weathering in Iceland. Earth Planet. Sci. Lett. 261(3–4),476–490. http://dx.doi.org/10.1016/j.epsl.2007.07.004.
Georg R. B., Zhu C., Reynolds B. C. and Halliday A. N. (2009)Stable silicon isotopes of groundwater, feldspars, and claycoatings in the Navajo Sandstone aquifer, Black Mesa,Arizona, USA. Geochim. Cosmochim. Acta 73(8), 2229–2241.http://dx.doi.org/10.1016/j.gca.2009.02.005.
Govindaraju K. (1994) Compilation of working values and sampledescription for 383 geostandards. Geostand. Newslett. 18, 1–158.
116 C. Ehlert et al. /Geochimica et Cosmochimica Acta 191 (2016) 102–117
Grasse P., Ehlert C. and Frank M. (2013) The influence of watermass mixing on the dissolved Si isotope composition in theEastern Equatorial Pacific. Earth Planet. Sci. Lett. 380, 60–71.http://dx.doi.org/10.1016/j.epsl.2013.07.033.
Grasshoff K., Kremling K. and Ehrhardt M. (1999) Methods of
Seawater Analysis. Wiley.Gunnarsson I. and Arnorsson S. (2000) Amorphous silica solubil-
ity and the thermodynamic properties of H4SiO4 in the range of0� to 350 �C at Psat. Geochim. Cosmochim. Acta 64(13), 2295–2307.
Hoefs J. (1997) Stable Isotope Geochemistry. Springer-Verlag,Berlin.
Hughes H. J., Delvigne C., Korntheuer M., De Jong J. T. M.,Andre L. and Cardinal D. (2011) Controlling the mass biasintroduced by anionic and organic matrices in silicon isotopicmeasurements by MC-ICP-MS. J. Anal. At. Spectrom. 26,1892–1896.
Hughes H. J., Sondag F., Santos R. V., Andre L. and Cardinal D.(2013) The riverine silicon isotope composition of the AmazonBasin. Geochim. Cosmochim. Acta 121, 637–651. http://dx.doi.org/10.1016/j.gca.2013.07.040.
Hurd D. C. (1972) Factors affecting solution rate of biogenic opalin seawater. Earth Planet. Sci. Lett. 15(4), 411–417. http://dx.doi.org/10.1016/0012-821X(72)90040-4.
Loucaides S., Michalopoulos P., Presti M., Koning E., Behrends T.and Van Cappellen P. (2010) Seawater-mediated interactionsbetween diatomaceous silica and terrigenous sediments: Resultsfrom long-term incubation experiments. Chem. Geol. 270(1–4),68–79. http://dx.doi.org/10.1016/j.chemgeo.2009.11.006.
Loucaides S., Koning E. and Van Cappellen P. (2012) Effect ofpressure on silica solubility of diatom frustules in the oceans:Results from long-term laboratory and field incubations. Mar.
Chem. 136–137, 1–6. http://dx.doi.org/10.1016/j.marchem.2012.04.003.
Mackenzie F. T. and Garrels R. M. (1966) Chemical mass balancebetween rivers and oceans. Am. J. Sci. 264(7), 507–525. http://dx.doi.org/10.2475/ajs.264.7.507.
Mackin J. E. (1987) Boron and silica behavior in salt-marshsediments: implications for paleo-boron distributions and theearly diagenesis of silica. Am. J. Sci. 287, 197–241.
Mackin J. E. and Aller R. C. (1984) Dissolved Al in sediments andwaters of the East China Sea: implications for authigenicmineral formation. Geochim. Cosmochim. Acta 48, 281–297.
McManus J., Hammond D. E., Berelson W. M., Kilgore T. E.,DeMaster D. J., Ragueneau O. G. and Collier R. W. (1995)Early diagenesis of biogenic opal: Dissolution rates, kinetics,and paleoceanographic implications. Deep. Res. II 42(2–3),871–903. http://dx.doi.org/10.1016/0967-0645(95)00035-O.
Meysman F. J. R., Boudreau B. P. and Middelburg J. J. (2005)Modeling reactive transport in sediments subject to bioturba-tion and compaction. Geochim. Cosmochim. Acta 69, 3601–3617.
Michalopoulos P. and Aller R. C. (1995) Rapid clay mineralformation in Amazon delta sediments: reverse weathering andoceanic elemental cycles. Science 270(5236), 614–617.
Michalopoulos P. and Aller R. C. (2004) Early diagenesis ofbiogenic silica in the Amazon delta: Alteration, authigenic clayformation, and storage. Geochim. Cosmochim. Acta 68(5),1061–1085. http://dx.doi.org/10.1016/j.gca.2003.07.018.
Michalopoulos P., Aller R. C. and Reeder R. J. (2000) Conversionof diatoms to clays during early diagenesis in tropical,continental shelf muds. Geology 28, 1095–1098. http://dx.doi.org/10.1130/0091-7613.
Morley D. W., Leng M. J., Mackay A. W., Sloane H. J., Rioual P.and Battarbee R. W. (2004) Cleaning of lake sediment samplesfor diatom oxygen isotope analysis. J. Paleilimnol. 31, 391–401.
Oelze M., von Blanckenburg F., Hoellen D., Dietzel M. andBouchez J. (2014) Si stable isotope fractionation duringadsorption and the competition between kinetic and equilib-rium isotope fractionation: Implications for weathering sys-tems. Chem. Geol. 380, 161–171. http://dx.doi.org/10.1016/j.chemgeo.2014.04.027.
Oelze M., von Blanckenburg F., Bouchez J., Hoellen D. andDietzel M. (2015) The effect of Al on Si isotope fractionationinvestigated by silica precipitation experiments. Chem. Geol.
397, 94–105. http://dx.doi.org/10.1016/j.chemgeo.2015.01.002.Pichevin L. E., Ganeshram R. S., Geibert W., Thunell R. C. and
Hinton R. W. (2014) Silica burial enhanced by iron limitation inoceanic upwelling margins. Nat. Geosci. 8–13. http://dx.doi.org/10.1038/NGEO2181.
Presti M. and Michalopoulos P. (2008) Estimating the contributionof the authigenic mineral component to the long-term reactivesilica accumulation on the western shelf of the Mississippi RiverDelta. Cont. Shelf Res. 28(6), 823–838. http://dx.doi.org/10.1016/j.csr.2007.12.015.
Rabouille C., Gaillard J. F., Treguer P. J. and Vincendeau M. A.(1997) Biogenic silica recycling in surficial sediments across thePolar Front of the Southern Ocean (Indian Sector). Deep. Res.
II 44(5), 1151–1176. http://dx.doi.org/10.1016/S0967-0645(96)00108-7.
Reynolds B. C., Aggarwal J., Andre L., Baxter D. C., Beucher C.P., Brzezinski M. A. and Cardinal D. (2007) An inter-laboratory comparison of Si isotope reference materials. J.
Anal. At. Spectrom. 22(5), 561–568. http://dx.doi.org/10.1039/b616755a.
Reynolds B. C., Frank M. and Halliday A. N. (2008) Evidence fora major change in silicon cycling in the subarctic North Pacificat 2.73 Ma. Paleoceanography 23(PA4219). http://dx.doi.org/10.1029/2007PA001563.
Rickert D. (2000) Dissolution kinetics of biogenic silica in marineenvironments. Ber. Zur Polarforschung 351.
Rickert D., Schluter M. and Wallmann K. (2002) Dissolutionkinetics of biogenic silica from the water column to thesediments. Geochim. Cosmochim. Acta 66(3), 439–455.
Roerdink D. L., van den Boorna S. H. J. M., Geilert S., Vroon P.Z. and van Bergen M. J. (2015) Experimental constraints onkinetic and equilibrium silicon isotope fractionation during theformation of non-biogenic chert deposits. Chem. Geol. http://dx.doi.org/10.1016/j.chemgeo.2015.02.038.
Savage P. S., Georg R. B., Williams H. M. and Halliday A. N.(2013) The silicon isotope composition of the upper continentalcrust. Geochim. Cosmochim. Acta 109, 384–399. http://dx.doi.org/10.1016/j.gca.2013.02.004.
Scholz F., Severmann S., McManus J., Noffke A., Lomnitz U. andHensen C. (2014a) On the isotope composition of reactive ironin marine sediments: Redox shuttle versus early diagenesis.Chem. Geol. 389, 48–59. http://dx.doi.org/10.1016/j.chemgeo.2014.09.009.
Scholz F., Severmann S., McManus J. and Hensen C. (2014b)Beyond the Black Sea paradigm: The sedimentary fingerprint ofan open-marine iron shuttle. Geochim. Cosmochim. Acta 127,368–380. http://dx.doi.org/10.1016/j.gca.2013.11.041.
Sifeddine A., Gutierrez D., Ortlieb L., Boucher H., Velazco F.,Field D. B. and Baumgartner T. (2008) Laminated sedimentsfrom the central Peruvian continental slope: A 500 year recordof upwelling system productivity, terrestrial runoff and redoxconditions. Prog. Oceanogr. 79, 190–197. http://dx.doi.org/10.1016/j.pocean.2008.10.024.
Sommer S., Linke P., Pfannkuche O., Schleicher T., Deimling J. S.V., Reitz A. and Hensen C. (2009) Seabed methane emissionsand the habitat of frenulate tubeworms on the Captain

C. Ehlert et al. /Geochimica et Cosmochimica Acta 191 (2016) 102–117 117
Arutyunov mud volcano (Gulf of Cadiz). Marine Ecol. Prog.
Ser. 382, 69–86. http://dx.doi.org/10.3354/meps07956.Suits N. S. and Arthur M. A. (2000) Sulfur diagenesis and
partitioning in Holocene Peru shelf and upper slope sediments.Chem. Geol. 163(1–4), 219–234. http://dx.doi.org/10.1016/S0009-2541(99)00114-X.
Tatzel M., von Blanckenburg F., Oelze M., Schuessler J. A. andBohrmann G. (2015) The silicon isotope record of early silicadiagenesis. Earth Planet. Sci. Lett. 428, 293–303. http://dx.doi.org/10.1016/j.epsl.2015.07.018.
Treguer P. J. and De La Rocha C. L. (2013) The world ocean silicacycle. Ann. Rev. Marine Sci. 5, 477–501. http://dx.doi.org/10.1146/annurev-marine-121211-172346.
Van Bennekom A. J., Buma A. G. J. and Nolting R. F. (1991)Dissolved aluminium in the Weddell-Scotia Confluence andeffect of Al on the dissolution kinetics of biogenic silica. Mar.
Chem. 35, 423–434. http://dx.doi.org/10.1016/S0304-4203(09)90034-2.
Van Beusekom J. E. E., Van Bennekom A. J., Treguer P. J. andMorvan J. (1997) Aluminium and silicic acid in water andsediments of the Enderby and Crozet Basins.Deep Res. II 44(5),987–1003. http://dx.doi.org/10.1016/S0967-0645(96)00105-1.
Van Cappellen P. and Qiu L. (1997a) Biogenic silica dissolution insediments of the Southern Ocean, I. Solubility.Deep-Sea Res. II
44(5), 1109–1128.Van Cappellen P. and Qiu L. (1997b) Biogenic silica dissolution in
sediments of the Southern Ocean. II. Kinetics. Deep Sea Res.
Part II 44(5), 1129–1149. http://dx.doi.org/10.1016/S0967-0645(96)00112-9.
Van den Boorn S. H. J. M., Vroon P. Z. and Van Bergen M. J.(2009) Sulfur-induced offsets in MC-ICP-MS silicon-isotopemeasurements. J. Anal. At. Spectrom. 24, 1111–1114. http://dx.doi.org/10.1039/b816804k.
Wetzel F., De Souza G. F. and Reynolds B. C. (2014) Whatcontrols silicon isotope fractionation during dissolution ofdiatom opal? Geochim. Cosmochim. Acta. http://dx.doi.org/10.1016/j.gca.2014.01.028.
Williams L. A., Parks G. A. and Crerar D. A. (1985) Silicadiagenesis, I. Solubility controls. J. Sediment. Petrol. 55(3),301–311. http://dx.doi.org/10.1016/0198-0254(85)93828-2.
Wollast R. and Garrels R. M. (1971) Diffusion coefficient of silca inseawater. Nat. Phys. Sci. 229, 94.
Associate editor: Silke Severmann