Click Here Full Article Stable isotope ratios of tap water ...

NRL/FR/6114--05--10,074
THOMAS J. BOYD
MICHAEL T. MONTGOMERY
RICHARD B. COFFIN
Chemical Dynamics and Diagnostics BranchChemistry Division
March 3, 2005
Approved for public release; distribution is unlimited.
Stable Carbon Isotope Ratios and Biodegrada-tion Rates of BTEX Compounds at the Tranguch Gasoline Site, Hazleton, Pennsylvania
Naval Research LaboratoryWashington, DC 20375-5320
i
REPORT DOCUMENTATION PAGE Form ApprovedOMB No. 0704-0188
3. DATES COVERED (From - To)
Standard Form 298 (Rev. 8-98)Prescribed by ANSI Std. Z39.18
Public reporting burden for this collection of information is estimated to average 1 hour per response, including the time for reviewing instructions, searching existing data sources, gathering and Public reporting burden for this collection of information is estimated to average 1 hour per response, including the time for reviewing instructions, searching existing data sources, gathering and maintaining the data needed, and completing and reviewing this collection of information. Send comments regarding this burden estimate or any other aspect of this collection of information, including maintaining the data needed, and completing and reviewing this collection of information. Send comments regarding this burden estimate or any other aspect of this collection of information, including suggestions for reducing this burden to Department of Defense, Washington Headquarters Services, Directorate for Information Operations and Reports (0704-0188), 1215 Jefferson Davis Highway, suggestions for reducing this burden to Department of Defense, Washington Headquarters Services, Directorate for Information Operations and Reports (0704-0188), 1215 Jefferson Davis Highway, Suite 1204, Arlington, VA 22202-4302. Respondents should be aware that notwithstanding any other provision of law, no person shall be subject to any penalty for failing to comply with a collection of information if it does not display a currently valid OMB control number. PLEASE DO NOT RETURN YOUR FORM TO THE ABOVE ADDRESS.
5a. CONTRACT NUMBER
5b. GRANT NUMBER
5c. PROGRAM ELEMENT NUMBER
5d. PROJECT NUMBER
5e. TASK NUMBER
5f. WORK UNIT NUMBER
2. REPORT TYPE1. REPORT DATE (DD-MM-YYYY)
4. TITLE AND SUBTITLE
6. AUTHOR(S)
8. PERFORMING ORGANIZATION REPORT NUMBER
7. PERFORMING ORGANIZATION NAME(S) AND ADDRESS(ES)
10. SPONSOR / MONITOR’S ACRONYM(S)9. SPONSORING / MONITORING AGENCY NAME(S) AND ADDRESS(ES)
11. SPONSOR / MONITOR’S REPORT NUMBER(S)
12. DISTRIBUTION / AVAILABILITY STATEMENT
13. SUPPLEMENTARY NOTES
14. ABSTRACT
15. SUBJECT TERMS
16. SECURITY CLASSIFICATION OF:
a. REPORT
19a. NAME OF RESPONSIBLE PERSON
19b. TELEPHONE NUMBER (include areacode)
b. ABSTRACT c. THIS PAGE
18. NUMBEROF PAGES
17. LIMITATIONOF ABSTRACT
10-03-2005 NRL Formal Report
Stable Carbon Isotope Ratios and Biodegradation Rates of BTEX Compounds at theTranguch Gasoline Site, Hazleton, Pennsylvania
Thomas J. Boyd, Michael T. Montgomery, and Richard B. Coffi n
Naval Research Laboratory4555 Overlook Avenue, SWWashington, DC 20375-5320
U.S. Environmental Protection Agency, Region IIIHazardous Site Cleanup Division (3HS31)1650 Arch StreetPhiladelphia, PA 19103-2029
NRL/FR/6114--05-10,074
In April 2002, NRL sampled groundwater at the Tranguch Gasoline Site (TGS), located in Hazleton, Pennsylvania. The goal of this study was to determine the rates and effi cacy of on-site bacterial fuel hydrocarbon biodegradation; measure the overall metabolic activity and state of the on-site bacterial consortia; and determine fuel hydrocarbon stable isotope ratios. Mineralization rates were relatively high, and calculated turnover (removal of ambient pool) times for benzene and toluene were on the order of days. The exception was OSMW-02, which had a benzene turnover time of about 5 months. In wells with appreciable BTEX, mineralization of benzene and toluene accounted for ~100% of the calculated production. From compound-specifi c stable carbon isotope analysis, it was determined that the BTEX in each well was signifi cantly different from the BTEX of every other well (P < 0.05). Results of the compound-specifi c stable carbon isotope analysis with limited sample distribution indicated that there are at least two likely sources on-site—one represented by SAMW-01 and OSMW-04 and another represented by OSMW-04 and TTMW-07.
BTEX, Stable isotope, Mineralization, Bacterial production, Turnover
Unclassifi ed Unclassifi ed Unclassifi edUL 38
Dr. Thomas J. Boyd
202-404-6424
Approved for public release; distribution is unlimited.
January 2002 - August 2003

Stable Carbon Isotope Ratios and Biodegradation Rates of BTEX Compounds
iii
CONTENTS
EXECUTIVE SUMMARY ........................................................................................................................E1
INTRODUCTION ....................................................................................................................................... 1
Site Description .................................................................................................................................. 2 Objectives ........................................................................................................................................... 3 Approach ............................................................................................................................................ 3 Field Sampling and Sample Analysis ................................................................................................. 5
RESULTS OF ANALYSES ......................................................................................................................... 6
Physical Analyses ............................................................................................................................... 6 Chemical Analyses ............................................................................................................................. 6 Biological Analyses ............................................................................................................................ 8
DISCUSSION ............................................................................................................................................ 10
Stable Isotope Analysis .................................................................................................................... 10 Chemical Analyses ........................................................................................................................... 16 Benzene and Toluene Mineralization ............................................................................................... 24 Bacterial Production ......................................................................................................................... 24 Phospholipid Fatty Acid (PFLA) Analysis ....................................................................................... 24
CONCLUSIONS ........................................................................................................................................ 31
REFERENCES .......................................................................................................................................... 32
APPENDIX—Summary of Analytical Methods ....................................................................................... 35

Stable Carbon Isotope Ratios and Biodegradation Rates of BTEX Compounds
E-1
EXECUTIVE SUMMARY
In April 2002, NRL sampled groundwater at the Tranguch Gasoline Site (TGS), which is located in Hazleton, Pennsylvania. The goal of this study was to determine the rates and efficacy of on-site bacterial fuel hydrocarbon biodegradation; measure the overall metabolic activity and state of the on-site bacterial consortia; and determine fuel hydrocarbon stable isotope ratios. Biodegradation of benzene and toluene occurred in several wells, mostly associated with specific source areas (Tranguch Tire, Orlosky gas station, Sam’s Amoco, and Hazleton Standard Oil). The mineralization rates were relatively high, and calculated turnover (removal of ambient pool) times for benzene and toluene were on the order of days. The exception was OSMW-02, which had a benzene turnover time of about 5 months. Bacterial production rates ranged from nondetectable to about 4 µg C L-1 d-1. In wells with appreciable benzene, toluene, ethylbenzene, and xylene (BTEX), mineralization of benzene and toluene generally accounted for ~100% of the calculated pro-duction. In some cases, there was significantly more mineralization of benzene or toluene than the estimated production. This was probably due to a systematic error in the conversion factor used to calculate production. No empirical estimations of this conversion factor in groundwater are available. A series of experiments were conducted to determine whether nutrient additions enhanced microbial activity, either benzene/toluene mineralization or bacterial production. We found no corollary relationship between nutrient additions and bacterial activities. Nitrogen was added in an oxidized form (NO
3-), but we observed no systematic increase
in microbial activities in wells with low dissolved oxygen.
From compound-specific stable carbon isotope analysis, it was determined that the BTEX in each well with measurable contaminant levels was significantly different from BTEX of every other well (P < 0.05). Using only three components (in wells with incomplete BTEX profiles) for a multivariate significance analy-sis, BTEX was not always found to be different in different wells. Using principal components analysis, a relationship between BTEX in wells was used to cluster “like” BTEX sources. This analysis showed a close relationship between SAMW-01 and OSMW-02 (Sam’s Amoco and Orlosky) and a close relationship between OSMW-04 and TTMW-07 (Orlosky and Tranguch Tire). A probability distribution was calculated to arrive at an “index” of relatedness among BTEX in wells. Again, SAMW-01 and OSMW-02 showed very close relation to one another, as did OSMW-04 to TTMW-07. Each of these clusters was in turn more distantly related to one another and to BTEX in wells downgradient. Results of the compound-specific stable carbon isotope analysis with limited sample distribution indicated that there are at least two likely sources on-site, one represented by SAMW-01 and OSMW-04 and another represented by OSMW-04 and TTMW-07. A more thorough sampling, including more wells between the putative sources, should help to more accurately define sources of on-site contamination.

Stable Carbon Isotope Ratios and Biodegradation Rates of BTEX Compounds
Manuscript approved September 23, 2003.
STABLE CARBON ISOTOPE RATIOS AND BIODEGRADATION RATES OF BTEX COMPOUNDS AT THE TRANGUCH GASOLINE SITE, HAZLETON, PENNSYLVANIA
INTRODUCTION
In groundwater, there is complex cycling of natural organic matter (NOM), nutrients, and metabolites through food webs. In areas where hydrocarbon impacts occur, both NOM and contaminant hydrocarbons can be assimilated and respired by bacteria. Contaminant utilization is controlled by the same environmen-tal factors that influence natural carbon and nutrient fluxes. Typical site evaluations focus on compound concentration surveys and/or biotreatability studies and do not give attention to determining the factors that control contaminant metabolism. As a result, remediation strategies may not achieve cleanup goals. Further understanding of the mechanisms controlling contaminant flux and transformation will enable managers to make scientifically sound and fiscally responsible decisions when choosing bioremediation strategies for site cleanup.
Fuel hydrocarbons are an excellent source of energy and carbon for microorganisms. However, other biogenic elements are needed in a relatively precise balance to sustain microbial metabolism. In contaminated groundwater, the major elements are nitrogen and phosphorous for building cellular constituents, and O
2 as
a terminal electron acceptor. The typical balance between available carbon, nitrogen, and phosphorous in unimpacted groundwater sustains relatively even rates of microbial activity. In contrast, the large amount of carbon found in groundwater hydrocarbon plumes quickly creates an environment low in inorganic nutrients and dissolved O
2. Many techniques have been used to understand the rate of hydrocarbon degradation. A
common practice is to try to stimulate biodegradation of hydrocarbons by adding nutrients or O2. In most
cases, these techniques have met with mixed results[1,2]. Disrupting the delicate balance of microbial ac-tivity at a contaminated site may ultimately decrease the biodegradation of hydrocarbon constituents[3]. It is generally agreed that a number of lines of evidence should be used to determine how and to what extent bioremediation of on-site groundwater contamination is occurring[2].
The most straightforward means of determining microbial activities is to measure their growth rates. Many techniques have been used over the years to do this, most requiring culturing or counting of mi-croorganisms. These indirect methods have a number of limitations and cannot give information on the actual rates of microbial growth. In recent years, however, techniques have been developed that allow rapid (~1-2 h) and sensitive (to the ng C L-1 level) measurements of microbial carbon demand, typically called bacterial production. These techniques measure the uptake of radiolabeled nucleotides or amino acids into microbial biomass and provide information on bacterial growth rates. A major benefit of these newer tech-niques is that they are nonspecific and measure the activity of the entire microbial assemblage[4,5]. These bacterial production assays provide an upper boundary for the amount of carbon fueling bacterial metabolism. In other words, the biodegradation rate of contaminant hydrocarbon cannot be greater than the measured bacterial production. Loss of contaminant in excess of the bacterial production value would then have to be attributed to physical or chemical changes.
In addition to measuring the total carbon demand of the microbial assemblage, some idea of the amount of specific contaminants being used by the bacteria should be known. A tracer study can be used to accom-plish this. For this technique, several sentinel contaminants are acquired in their radiolabeled form (usually 14C). For gasoline plumes, common sentinel tracers might be 14C-benzene and 14C-toluene. One adds a tracer
1

Boyd et al.
amount (i.e., much lower than the ambient amount) of the radiolabeled contaminant to an incubation contain-ing groundwater from the study site. After a short incubation, typically ~24 h, the water sample is acidified and 14CO
2 is collected and radioassayed. The amount of 14CO
2 produced can then be related to the amount
of contaminant degraded per unit time.
For many subsurface fuel-contaminated sites, multiple sources exist and complex mixing and transport result in uncertain assessment and organization of remedial action. Stable isotope analyses of carbon and nitrogen may help identify the individual sources and their ultimate fate in complex mixtures of NOM. Iso-tope analysis of carbon, nitrogen, and sulfur pools has provided a more thorough understanding of organic matter sources and cycling in a variety of ecosystems[6-8]. Development of stable isotope methods has been used to identify the cycling of carbon at a molecular level[9-12]. In addition, stable carbon isotope analysis (δ13C) has assisted in development and interpretation of bioremediation strategies for ecosystems that are contaminated with organic chemicals[13]. The recent development of gas chromatographic (GC) transfer of individual compounds, combusted inline, to an isotope ratio mass spectrometer (IRMS) provides the ability to identify individual contaminant sources[14]. Fractionation of carbon isotopes is related to the pool size of the substrate in question. Small pool sizes and anaerobic conditions favor isotope fractionation from source material to bio-products (biomass, CO
2). However, if the source material is the component being analyzed
and its pool size is large, no significant fractionation will be observed[15]. If contaminant sources have a broad range in δ13C in individual hydrocarbon compounds, it is possible to determine the contribution of a single source to the total loading. By using δ13C for analysis of benzene, toluene, ethylbenzene, and xylene (BTEX), multiple petroleum sources were shown to be present in groundwater that was thought to be con-taminated with one source[16]. Other recent research provides further support for the application of carbon isotope analysis to trace the contaminant sources. The approach has been applied in tracking nitroaromatic compounds, PCE and TCE[17], and jet fuels[18].
Another key step in environmental remediation is confirmation and measurement of contaminant degra-dation rates. Identification of the role of microorganisms in biogeochemical cycles will assist in monitoring contaminant turnover and developing of strategies for site cleanup. Over the past decade, basic research in microbial assemblage activities and carbon isotope chemistry has led to the development of technology that can identify sources of organic matter cycled through bacteria[3,9,19,20]. These techniques have been combined with δ13C analysis of dissolved and particulate organic carbon (DOC and POC) and dissolved inorganic carbon (DIC) to examine the roles of bacterioplankton in aquatic carbon cycles[6,8,19,21]. The development of these new approaches in isotope biogeochemistry has provided the ability to determine carbon sources that support bacterial production from a variety of anthropogenic, autochthonous, and allochtho-nous sources. This technology has recently been applied to study petroleum hydrocarbons assimilated by bacteria[22]. However, in most terrestrial environments, the δ13C of anthropogenic carbon sources is nearly identical to natural organic matter, resulting in uncertain identification of sources of carbon cycled through the microbial assemblage[23]. Cifuentes et al.[24] used δ13C of CO
2 to monitor degradation of PAH and BTEX
in groundwater and found that results of stable carbon isotope analyses indicated enhanced degradation. However, isotope ratios of the contaminant and indigenous carbon overlapped, thus inhibiting confirmation of contaminant degradation.
Significant cost savings will result from implementation of an appropriate cleanup strategy for specific site conditions or from a scientifically-based decision to not further impact the area. Additional cost savings could result from data documenting the extent to which the Navy is responsible when negotiating with other potentially responsible parties (PRPs). These savings could result from reduced sampling costs associated with integrated studies or reduced legal liability.
Site Description
The Tranguch Gasoline Site (TGS) is located in Hazleton, Pennsylvania (Fig. 1). Gasoline leaking from underground storage tanks (USTs) from several potentially responsible parties was discovered in early 1994.
2

Stable Carbon Isotope Ratios and Biodegradation Rates of BTEX Compounds 3
The leak was found beneath the Tranguch Tire and Auto Center. It was estimated that 50,000 U.S. gallons of gasoline had leaked into the surrounding groundwater. In 1995, the USTs were removed and remedial investigation initiated. It was noted that an oily sheen could be seen on Black Creek. After initial surveys, an impacted area bound by Black Creek to the north, Hayes Street to the east, Vine Street to the west, and 17th Street to the south was designated. A number of follow-on studies have been initiated, and currently a soil vapor extraction system is installed and operational.
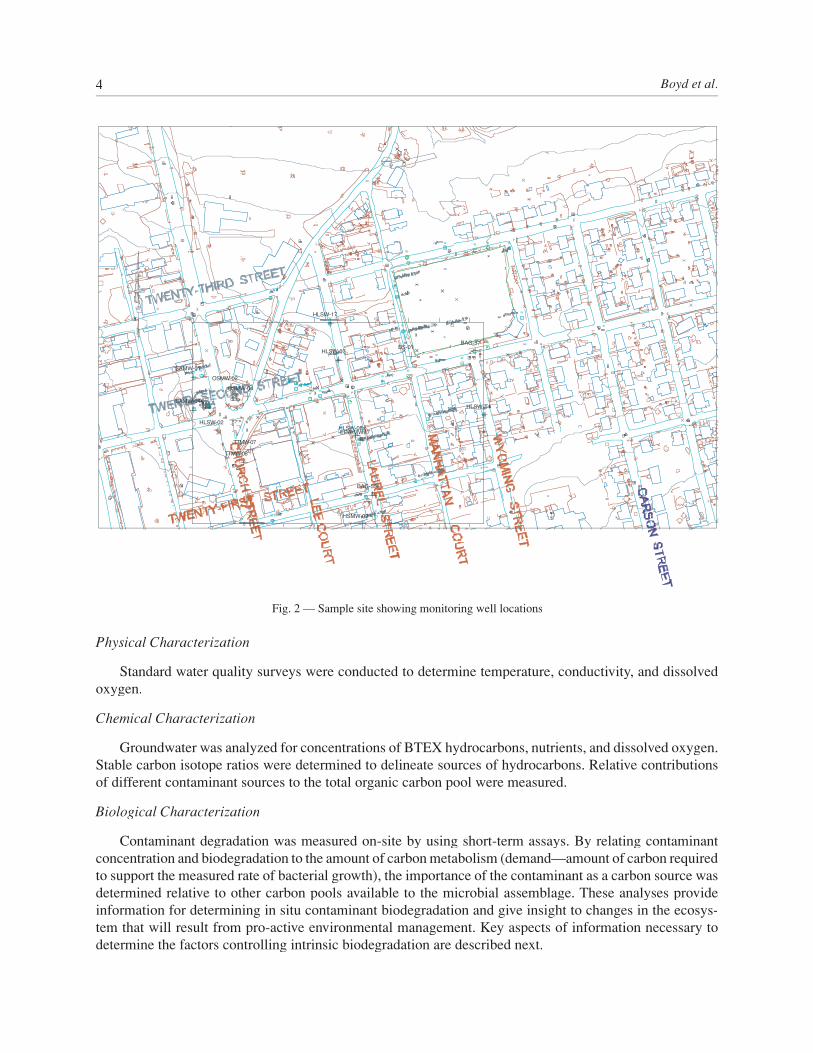
Groundwater flows roughly east to west, with a slight northward trend. A series of groundwater monitoring wells has been installed on-site. For this sampling, a number were selected for their proximity to potential sources of contamination. A number were also selected to be in relatively unimpacted areas (Fig. 2).
Objectives
The objectives of this study were to evaluate in situ biodegradation of petroleum hydrocarbons in ground-water at the Tranguch Gasoline Site and to determine whether compound-specific stable isotope ratios of individual hydrocarbons can be used to distinguish different sources of contamination on-site.
Approach
The study of contaminant sources and biodegradative processes involves physical, chemical, and biologi-cal characterization of the study site. Data collected to date and in any future seasonal samples will be used to determine hydrocarbon source, transport, and intrinsic rates of biodegradation occurring in groundwater at the TGS.
Fig. 1 — Tranguch Gasoline Site
Boyd et al.4
Physical Characterization
Standard water quality surveys were conducted to determine temperature, conductivity, and dissolved oxygen.
Chemical Characterization
Groundwater was analyzed for concentrations of BTEX hydrocarbons, nutrients, and dissolved oxygen. Stable carbon isotope ratios were determined to delineate sources of hydrocarbons. Relative contributions of different contaminant sources to the total organic carbon pool were measured.
Biological Characterization
Contaminant degradation was measured on-site by using short-term assays. By relating contaminant concentration and biodegradation to the amount of carbon metabolism (demand—amount of carbon required to support the measured rate of bacterial growth), the importance of the contaminant as a carbon source was determined relative to other carbon pools available to the microbial assemblage. These analyses provide information for determining in situ contaminant biodegradation and give insight to changes in the ecosys-tem that will result from pro-active environmental management. Key aspects of information necessary to determine the factors controlling intrinsic biodegradation are described next.
W
W
W
W
W
W
W
W
W
W
W
W
W
W
W
W
W
W
W W
W
W
WW
W W
W
W
W
W
W
W
W
W
W
W
WW
BAG-55
BAG-57BS-01
EPA-MW47HLSW-02
HLSW-07
HLSW-08
HLSW-14
HLSW-17
HSMW-02
OSMW-02OSMW-04
SAMW-01
SAMW-04
TTMW-06
TTMW-07
Fig. 2 — Sample site showing monitoring well locations

Stable Carbon Isotope Ratios and Biodegradation Rates of BTEX Compounds 5
Field Sampling and Sample Analysis
This section describes:
• Sampling objectives and locations,
• Sample size and sample frequency,
• Field methods, and
• Quality control sampling.
Sampling Objectives and Locations
Sampling objectives were to physically, chemically, and biologically characterize groundwaters spa-tially over the impacted site, maintain proper chain-of-custody and control of samples, and follow quality assurance/quality control procedures. Sampling was conducted in April 2002. The sample site is located in Hazleton, Pennsylvania. See Site Description on page 2 for sampling locations.
Sample Size and Frequency
Sample size is dependent on the type of sample analysis to be conducted. Groundwater samples were taken in acid-cleaned 500-mL amber glass bottles with Teflon-lined closures. Samples were stored at 4 °C until extracted and analyzed. Water samples used for biological analysis were immediately transferred to on-site laboratory facilities for processing within minutes of collection (Table 1).
SamplingEvent
SampleType
AnalyticalParameter
Number of Field Samples and QC TotalSamples
Field Field Blanks Trip Blanks TotalApril 02 Water BTEX* 16 1 1 18 18
Stable carbonisotopes
16 1 1 18 18
Nutrients* 16 1 1 18 18Bacterialproduction
16 16* 0 16 16
Hydrocarbonmineralization
16 16* 0 16 16
*Analyses performed by Lockheed-Martin
Table 1 — Summary of Sample Collection, April 2002
Field Methods
This section describes the procedures for collection and preservation of samples.
Sample Collection
A peristaltic pump was used to pull in-well waters to the surface and into collection vessels. Aged Pharmed tubing was used during all samplings. Approximately three well volumes were purged within 12 h of sampling. Pier water samples were collected by using a weighted bottle suspended with nylon string.
Groundwater Samples
Groundwater samples were collected via a peristaltic pump through a Hydrolab DataSonde IV sensor system measuring conductivity, salinity, transmissivity, dissolved oxygen (DO), and density. Samples were

Boyd et al.6
taken below the level of free product. The following brief protocol was used: Note time and date in field log. Collect water sample through a peristaltic pump. Note conductivity, salinity, transmissivity, and DO in field log. Transfer water to appropriate sample containers: (a) PAH samples to two 500-mL amber bottles; (b) microbiological samples to one 20-mL scintillation vial. Preserve PAH samples as appropriate with two pellets of NaOH. Label sample containers, fill in chain-of-custody documents and any other appropriate information in field logbook.
Analytical Methods
Analytical methods were chosen for applicability, sensitivity, and conformity. For maximum compa-rability with existing databases (NPDES discharges, water quality records, etc.), Environmental Protection Agency (EPA) methods (with described modifications) were chosen for most of the chemical analyses. Most microbiological methods were chosen from the scientific literature and have been subjected to extensive peer review before being published. No standard EPA or compliance analyses provide the microbiological informa-tion sought in this project. The Appendix summarizes analytical methods used in this project. Analyses are presented in operating procedure format. Data validation, reporting, and quality control are also covered.
RESULTS OF ANALYSES
Physical Analyses
Water Temperature
Groundwater temperature did not range more than 1°C and averaged 6.75 °C (Table 2).
SamplingEvent
MinimumTemperature
(C)
MaximumTemperature
(C)
AverageTemperature
(C)
StandardError(C)
April 2002 6.67 6.84 6.75 0.25
Table 2 — Temperature Variation in Groundwater Samples
Chemical Analyses
BTEX in Groundwater
BTEX concentrations were below minimum confidence detection limits in many samples. However, wells closest to PRPs had higher concentrations of BTEX (Table 3). The highest BTEX concentrations were found in well TTMW-07 located on the former Tranguch Tire property.
Alkane δ13C Analysis
Groundwaters were extracted and analyzed for alkane δ13C. No alkanes were detected in concentrations sufficient to provide stable isotope values.
BTEX δ13C Analysis
BTEX δ13C was analyzed by purge and trap (P&T) extraction followed by GC separation and isotope ratio mass spectroscopy. The Appendix describes operating conditions. δ13C Values were obtained for BTEX components in nine wells (Table 4). Significant variations in stable isotope signatures were observed.

Stable Carbon Isotope Ratios and Biodegradation Rates of BTEX Compounds 7
WellBenzene(µ g-1)
Toluene(µ g-1)
Ethyl-benzene(µ g-1)
Xylenes(µ g-1)
TotalBTEX(µ g-1)
BAG-55 U† U U UBAG-57 3.6 3.7 U 16.7 34BS-01 U U U UEPA-MW47 19 U U U 19HLSW-02 U U U UHLSW-07 N.D.* N.D. N.D. N.D. N.D.HLSW-08 2.1 U 4.7 3.2 1UHLSW-14 U U U UHLSW-17 U U U UHSMW-02 15 1.6 63 12.7 92.3OSMW-02 34 2 20 2.2 58.2OSMW-04 170 32 240 226 668SAMW-01 1.7 5.2 16 12 34.9SAMW-04 U U U UTTMW-06 2.7 U U U 2.7TTMW-07 2500 2800 3600 11900 20800
U
U
U
U
UU
†U Below limits of detection*N.D. Not determined
Table 3 — BTEX Concentrations in Groundwater
WellBenzene(δ13C)
Toluene(δ13C)
Ethyl-benzene(δ13C)
o,m-Xylenes(δ13C)
p-Xylenes(δ13C)
BAG-55 UUUU† U
U
UU
UU
UU
U
BAG-57 -26.59 -25.56 -23.85 -28.61 -28.04BS-01 U U U UEPA-MW47 -28.41 U U UHLSW-02 U U U UHLSW-07 U U U UHLSW-08 -25.89 U -26.29 -27.60 -25.94HLSW-14 U U U UHLSW-17 U U U UHSMW-02 -26.88 U -27.26 U -26.92OSMW-02 -26.76 -28.49 -24.88 -29.53 -26.07OSMW-04 -28.41 -23.15 -26.16 -28.25 -26.98SAMW-01 -25.56 -25.11 -25.56 -29.38 -26.81SAMW-04 U U U UTTMW-06 -29.34 U U UTTMW-07 -27.70 -25.49 -27.65 -27.54 -27.45
†U Below limits of detection
Table 4 — Stable Carbon Isotope Ratios of Alkanes
Boyd et al.8
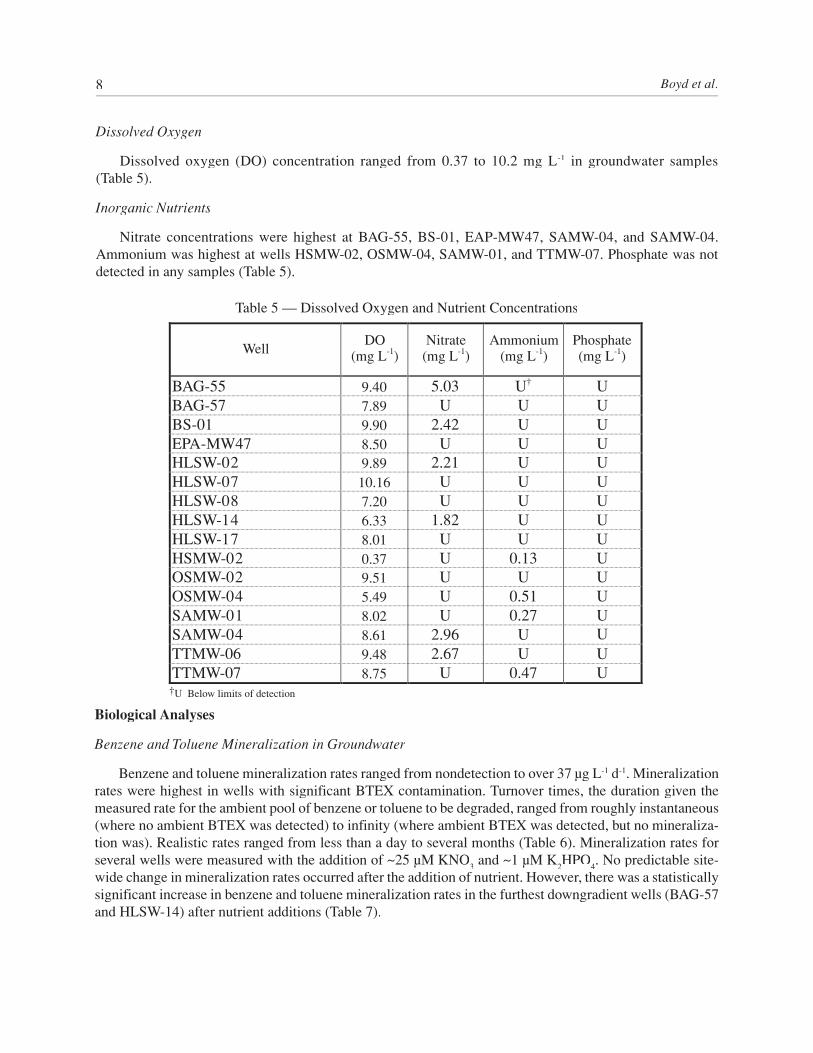
Dissolved Oxygen
Dissolved oxygen (DO) concentration ranged from 0.37 to 10.2 mg L-1 in groundwater samples (Table 5).
Inorganic Nutrients
Nitrate concentrations were highest at BAG-55, BS-01, EAP-MW47, SAMW-04, and SAMW-04. Ammonium was highest at wells HSMW-02, OSMW-04, SAMW-01, and TTMW-07. Phosphate was not detected in any samples (Table 5).
WellDO
(mg L-1)Nitrate
(mg L-1)Ammonium
(mg L-1)Phosphate(mg L-1)
BAG-55 9.40 5.03 U† UBAG-57 7.89 U U U
UBS-01 9.90 2.42 UEPA-MW47 8.50 U U U
UHLSW-02 9.89 2.21 UHLSW-07 10.16 U U UHLSW-08 7.20 U U U
UHLSW-14 6.33 1.82 UHLSW-17 8.01 U U UHSMW-02 0.37 U 0.13 UOSMW-02 9.51 U U UOSMW-04 5.49 U 0.51 USAMW-01 8.02 U 0.27 U
UU
SAMW-04 8.61 2.96 UTTMW-06 9.48 2.67 UTTMW-07 8.75 U 0.47 U
†U Below limits of detection
Table 5 — Dissolved Oxygen and Nutrient Concentrations
Biological Analyses
Benzene and Toluene Mineralization in Groundwater
Benzene and toluene mineralization rates ranged from nondetection to over 37 µg L-1 d-1. Mineralization rates were highest in wells with significant BTEX contamination. Turnover times, the duration given the measured rate for the ambient pool of benzene or toluene to be degraded, ranged from roughly instantaneous (where no ambient BTEX was detected) to infinity (where ambient BTEX was detected, but no mineraliza-tion was). Realistic rates ranged from less than a day to several months (Table 6). Mineralization rates for several wells were measured with the addition of ~25 µM KNO
3 and ~1 µM K
2HPO
4. No predictable site-
wide change in mineralization rates occurred after the addition of nutrient. However, there was a statistically significant increase in benzene and toluene mineralization rates in the furthest downgradient wells (BAG-57 and HLSW-14) after nutrient additions (Table 7).

Stable Carbon Isotope Ratios and Biodegradation Rates of BTEX Compounds 9
Well
BenzeneMinerali-
zation(µg L-1d-1)
±14%
BenzeneTurnover
Time(days)±14%
TolueneMinerali-
zation(µg L-1d-1)
±14%
TolueneTurnover
Time(days)±14%
BAG-55 0.94 0* U† ∞
∞∞
∞
∞
∞
∞∞∞
∞
∞
BAG-57 3.14 0.05 0.05 3.17BS-01 0.02 0 1.71 0EPA-MW47 U
§
0.55 0HLSW-02 U UHLSW-07 U UHLSW-08 U 0.08 0HLSW-14 0.99 0 UHLSW-17 U 8.88 0HSMW-02 0.19 3.22 UOSMW-02 0.01 137 0.34 0.24OSMW-04 37.5 0.19 2.46 5.40SAMW-01 0.41 0.17 7.83 0.03SAMW-04 0.71 0 UTTMW-06 0.31 1.01 0.63 0.18TTMW-07 7.27 14.3 30.10 3.88* Indicates no ambient pools so there is no turnover†U Below limits of detection§ Indicates no mineralization detected so infinite turnover time for ambient pool
Table 6 — Benzene and Toluene Mineralization Rates
BAG-57 4.40 0.03 0.65 0.24∞∞∞
∞
∞
BS-01 † § UEPA-MW47 U
UU
HLSW-07 0.06 0* UHLSW-14 1.36 0 0.09 0HLSW-17 2.63 2.69 0.66 2.04OSMW-04 4.40 0.03 0.65 0.24
* Indicates no ambient pools so there is no turnover†U Below limits of detection§ Indicates no mineralization detected so infinite turnover time for ambient pool
Well
BenzeneMinerali-
zation(µg L-1d-1)
±14%
BenzeneTurnover
Time(days)±14%
TolueneMinerali-
zation(µg L-1d-1)
±14%
TolueneTurnover
Time(days)±14%
Table 7 — Benzene and Toluene Mineralization Rates with Added Nutrients
Bacterial Production
Bacterial production was low for all wells sampled, most likely due to the low ambient groundwater temperature (~5 °C). It ranged from nondetection to 3.7 µg C L-1 d-1. The addition of ~25 µM KNO
3 and ~1
µM K2HPO
4 to counteract any nutrient limitation yielded no predictable or significant change (Table 8).

Boyd et al.10
Well
BAG-55 0.12 U†
BAG-57 0.21 0.14BS-01 0.02 0.05EPA MW47 COAL U UHLSW-02 1.26 0.91HLSW-03 0.17 0.36HLSW-07 0.52 0.35HLSW-08 0.20 0.32HLSW-14 0.62 0.46HLSW-17 U UHSMW-02 0.65 0.54OSMW-02 0.11 0.23OSMW-04 0.29 0.11SAMW-01 3.72 4.00SAMW-04 1.57 1.73TTMW-06 0.40 0.33TTMW-07 0.25 0.78
BacterialProduction
(µg C L-1d-1)±22%
BacterialProduction
(nutrients added)(µg C L-1d-1)
±22%
†U Below limits of detection
Table 8 — Bacterial Production Rates
DISCUSSION
The main goals of this study were to determine the source of groundwater fuel hydrocarbons by chemi-cal fingerprinting and to determine the rates of sentinel hydrocarbon biodegradation. We sampled several monitoring wells adjacent to the potentially responsible parties on-site. Variations in chemical and biological parameters indicated that several potential sources of hydrocarbons exist and that the majority of hydrocarbon contamination is likely degraded on-site, with very little off-site migration.
Stable Isotope Analysis
Stable carbon isotopes were for all BTEX compounds were obtainable for five of the nine wells con-taining sufficient analytical quantities of fuel hydrocarbons (Bag 57, OSMW-02, SAMW-01, TTMW-07, and OSMW-04). Partial analysis of at least three BTEX compounds was obtainable for two additional wells (HSMW-02 and HLSW-08), while only benzene was found in EPAMW-47 and TTMW-06. Three separate analyses of variance were conducted in Matlab® to determine if there were statistical differences in the stable carbon isotope profiles between wells. For samples with five BTEX compounds identified, a five-vari-able analysis was conducted. For samples with three to four BTEX compounds identified, a three-variable analysis was conducted.
Analysis of Variance
The first test conducted was a multiple analysis of variance (MANOVA). Five and three variable tests were performed. For samples with only benzene identified, a one-way analysis of variance (ANOVA) was conducted. Obviously, the greater the number of variables, the more confidence one has in interpreting the results. A probability value was obtained for each test, which indicates the probability that the two

Stable Carbon Isotope Ratios and Biodegradation Rates of BTEX Compounds 11
sample means are the same. Generally, a probability > 0.05 indicates that there is no statistical difference between the sample means, whereas a probability < 0.05 indicates the sample means are different. By using a five-variable MANOVA, BTEX from each well was found to be different from BTEX in every other well (Table 9). By using only a three-variable MANOVA, we observed similarities between the BTEX profiles of several wells. For instance, there was no statistical difference between TTMW-07 (highest BTEX con-centrations) and HSMW-02 (southeast) or HLSW-08 (east). Similarly, there was no statistical difference between BTEX compounds in HSMW-02 and HLSW-08 (Table 9). This test also showed no statistical difference between BTEX compounds in HSMW-02 and the far downgradient (northeast) well (Bag 57). It was also observed that BTEX in HLSW-08 (intermediate downgradient) was no different than BTEX in Bag 57 (farthest downgradient). By using a one-way ANOVA, benzene in EPAMW-47 was found to be no different from benzene in OSMW-04 and TTMW-06, and benzene in TTMW-06 was found to be no different than benzene in OSMW-04 (Table 9). From a cursory look at these tests, it appears that a relationship exists between OSMW-04, TTMW-07, TTMW-06, and HSMW-02. Downgradient wells HLSW-08 and Bag 57 appear to relate to several of the upgradient wells.
Table 9 — Probability Tablefor MANOVA/ANOVA Analysis
Well Compared to WellProbability
(P)
Five-compound tests
Bag 57 OSMW-02 <0.001Bag 57 SAMW-01 <0.001Bag 57 OSMW-04 <0.001OSMW-02 OSMW-04 <0.001SAMW-01 OSMW-02 <0.001SAMW-01 OSMW-04 <0.001TTMW-07 OSMW-02 <0.001TTMW-07 SAMW-01 <0.001TTMW-07 Bag 57 <0.001TTMW-07 OSMW-04 <0.001
Three-compound tests
Bag 57 HLSW-08 0.105HSMW-02 TTMW-07 0.096HSMW-02 Bag 57 0.056HSMW-02 SAMW-01 0.009HSMW-02 OSMW-02 0.013HSMW-02 OSMW-04 0.207HSMW-02 HLSW-08 0.068OSMW-02 HLSW-08 0.031OSMW-04 HLSW-08 0.009SAMW-01 HLSW-08 0.020TTMW-07 HLSW-08 0.086
Benzene-only tests
EPAMW-47 TTMW-07 0.009EPAMW-47 HSMW-02 0.001EPAMW-47 Bag 57 0.015

Boyd et al.12
Principal Components Analysis
In addition to determining the statistical differences among BTEX in the wells, it is of interest to know the relatedness between them. Ones means to accomplish this is to conduct a principal-components analysis (PCA). In data sets with multiple variables, groups of variables often behave similarly. More than one variable may, in fact, be describing the same principle of the system. PCA attempts to simplify a multivariate data set by replacing a group of variables with a single new variable, called a principal component. Each principal component is a linear combination of the original variables. The variance of each principal component is the maximum among all possible choices. The analysis provides information as to how much of the original variance is represented by each principal component. Therefore, when the primary components are graphed against one another, data sets that are highly similar will plot together, while dissimilar data sets will occupy different spaces on a graph.
A PCA analysis was conducted on the average carbon isotope values from wells with five BTEX com-ponents. About 90% of the variance was explained in the first two principal components (Fig. 3).
The first two principal components were then graphed relative to one another to determine how closely the BTEX in wells related (Fig. 4). TTMW-07 and OSMW-04 group together, or show similarity in the fac-tors that cause variation. SAMW-01 and OSMW-02 also group together, perhaps indicating a shared source. HLSW-08 and Bag 57 (both downgradient) plot distinctly from the putative source wells, indicating either mixing or a separate source altogether. Because all BTEX components were not found in each well (c.f. Table 4), we conducted another PCA analysis using only three of the BTEX components. Again, about 90% of the variation could be explained within the first two principal components (Fig. 5). Results were similar with OSMW-04 and TTMW-07, and OSMW-02 and SAMW-01 both grouping together. Downgradient wells (HLSW-08, Bag 57) both plotted in different locations, and another putative source well (HSMW-02) plotted close to OSMW-04 and TTMW-07, indicating a possible shared source with these two wells (Fig. 6).
Table 9 (continued) — Probability Table for MANOVA/ANOVA Analysis
Well Compared to WellProbability
(P)
Benzene-only tests
EPAMW-47 OSMW-02 <0.001EPAMW-47 OSMW-04 0.326EPAMW-47 HLSW-08 <0.001TTMW-06 TTMW-07 0.005TTMW-06 HSMW-02 0.001TTMW-06 Bag 57 0.007TTMW-06 SAMW-01 <0.001TTMW-06 OSMW-02 <0.001TTMW-06 OSMW-04 0.089TTMW-06 HLSW-08 <0.001
EPAMW-47 SAMW-01 0.000EPAMW-47 TTMW-06 0.115

Stable Carbon Isotope Ratios and Biodegradation Rates of BTEX Compounds 13
Principal Component1
0
10
20
30
40
50
60
70
90
100
80
2 3 4
Varia
nce
Expl
aine
d (%
)
Fig. 3 — Variation explained by principal components
Bag 57 OSMW-4
TTMW-07
HLSW-08
OSMW-02
SAMW-01
2
1.5
1
0.5
0
-0.5
-1
-1.5
-2-2.5 -2 -1.5 -1 -0.5 0 0.5 1 1.5 2
1st Principal Component
2nd
Prin
cipa
l Com
pone
nt
Fig. 4 — First vs second principal components (fi ve-compound test)

Boyd et al.
Clustering Analysis
In addition to PCA analysis, clustering analysis can be used to determine a relative “distance” between relations in multivariate data. This would be analogous to plotting a family tree and using 1 inch to represent each generation of distance between progenitors and progeny. We used Matlab®’s clustering algorithms to determine the relatedness and similarity between stable isotope values of BTEX compounds. The length of
14
10
10
20
30
40
50
60
70
80
90
100
2 2Principal Component
Varia
nce
Expa
nded
(%)
Fig. 5 — Variation explained by principal components
Bag 57
OSMW-04
TTMW-07
HSMW-02
SAMW-1
HLSW-08
OSMW-02
-2.5-1.5
-1
-0.5
0
0.5
1
1.5
2
-2 -1.5 -1 -0.5 0 0.5 1 1.5 21st Principal Component
2nd
Prin
cipa
l Com
pone
nt
Fig. 6 — First vs second principal components (three-compound test)

Stable Carbon Isotope Ratios and Biodegradation Rates of BTEX Compounds 15
Fig. 7 — Cluster analysis dendrogram superimposed on site map (fi ve-compound test)
vertical lines in clusters is indicative of the “distance” of relatedness between wells. We superimposed the cluster dendrogram on the site map so that relatedness could be seen graphically. For the five-compound cluster analysis, results were similar to those seen in the PCA analysis: OSMW-02 and SAMW-01 were very closely related (black line), and OSMW-04 and TTMW-07 were very closely related (blue line). Both were related to HLSW-08 (although OSMW-02 and SAMW-01 were slightly closer). Finally, the furthest downgradient well (Bag 57) appeared to be related to all upgradient wells (Fig. 7).
Cluster analysis was also conducted to include those wells with only three or four BTEX components identified. In this analysis, OSMW-02 and SAMW-01 were less closely related to one another and more closely related to HLSW-08 (downgradient). OSMW-04 and TTMW-07 were also closely related, but HSMW-02 was most related to TTMW-07 using fewer BTEX components for the test. As with the five-compound test, all upgradient wells were distantly related to the most downgradient well, Bag 57 (Fig. 8). Based on these data and analyses, it seems most likely that there are at least two separate sources of BTEX compounds on-site. Because of the strong relationship seen in both PCA and clustering analysis, one source was in the vicinity of SAMW-01 and OSMW-02 (gas station), while another distinct source was in the vicinity of OSMW-04 and TTMW-07 (gas station, Tranguch Tire). Downgradient wells showed similarly to both of these putative source areas. HSMW-02 clustered with TTMW-02/OSMW-04 in the three-compound tests, indicating it may be part of the same source. However, the three-compound tests are not as robust as the five-compound tests, so intermediary sampling may be necessary to determine how closely related the fuel sources in these wells are. Because of the limited number of samples taken as part of this effort, we were not able to achieve the sampling resolution necessary to definitively identify all potential sources. It does appear highly likely that at least two separate BTEX sources are on-site.

Boyd et al.16
Chemical Analyses
Contaminant Compounds
A number of chemical analyses were useful in describing the biogeochemistry on-site. Concentrations of BTEX contaminants showed very high levels at the potential source areas, Tranguch Tire and the gas station on the corner of Routes 309 and 940 (Orlosky’s). To visualize concentrations, an interpolation was performed between values for each well location. Using all the data collected, extremely high concentrations of benzene and toluene at well TTMW-07 (Tranguch Tire) obscured detail at other stations (Figs. 9 and 10).
For finer resolution, separate plots were made by removing data from TTMW-07 and interpolating between sample wells (Figs. 11 and 12). With these plots, it is possible to see the levels of benzene and toluene at the peripheral well (BAG-57). This well is downgradient of the treatment system and most likely represents residual source (as opposed to a “new” source). One can also note from either set of benzene and toluene concentrations that the middle series of wells (BS-01, BAG-55, HLSW-14, and HLSW-17) are devoid of measurable contaminant. This is probably due to the in-place remediation system.
Also of note is the high concentration of MTBE only in well OSMW-04 (gas station), with traces in downgradient wells (Fig. 13). MTBE is a gasoline additive (oxygenate) that has been widely used within the last decade after the 1990 Clean Air Act mandated the use of reformulated gasoline. The fact that there was virtually no MTBE found in wells TTMW-07 and TTMW-06 (Tranguch Tire) argues for a distinct and probably recent source of gasoline contamination at OSMW-04.
Fig. 8 — Cluster analysis dendrogram superimposed on site map (three-compound test)

Stable Carbon Isotope Ratios and Biodegradation Rates of BTEX Compounds 17
1.6
1.7
1.8
1.9
2
2.1
Fig. 9 — Benzene concentrations interpolated over sampling area

Boyd et al.18
Fig. 10 — Toluene concentrations interpolated over sampling area

Stable Carbon Isotope Ratios and Biodegradation Rates of BTEX Compounds 19
Fig. 11 — Benzene concentrations interpolated over sampling area, Tranguch well removed

Boyd et al.20
Fig. 12 — Toluene concentrations interpolated over sampling area, Tranguch well removed

Stable Carbon Isotope Ratios and Biodegradation Rates of BTEX Compounds 21
Fig. 13 — MTBE concentrations interpolated over sampling area

Boyd et al.22
Dissolved Oxygen and Nutrients
Dissolved oxygen (DO) was measured during the sampling event using a field-deployed sensor system. Generally, DO concentrations are very low within groundwater hydrocarbon plumes[3,25,26]. It is unusual that DO concentrations were high in wells most adjacent to hydrocarbon source areas (Tables 3 and 5). Because O
2 makes up ~20% of the ambient atmosphere, it is possible that accurate field measurements of
DO were not obtained. There was no correlation between DO and BTEX concentration (P > 0.05), further supporting the idea that perhaps the field measurements were incorrect. Dissolved nutrients (NO
3-, NH
4+,
and PO43-) showed trends consistent with the historical literature[27,28] – very low NO
3- and detectable NH
4+
where BTEX literature[27,28] was prevalent, and the opposite where BTEX concentrations were low (Figs. 14 and 15). PO
43- was not detected in any of the samples.
Fig. 14 — NO3
- concentrations interpolated over sampling area

Stable Carbon Isotope Ratios and Biodegradation Rates of BTEX Compounds 23
Fig. 15 — NH4
+ concentrations interpolated over sampling area

Boyd et al.24
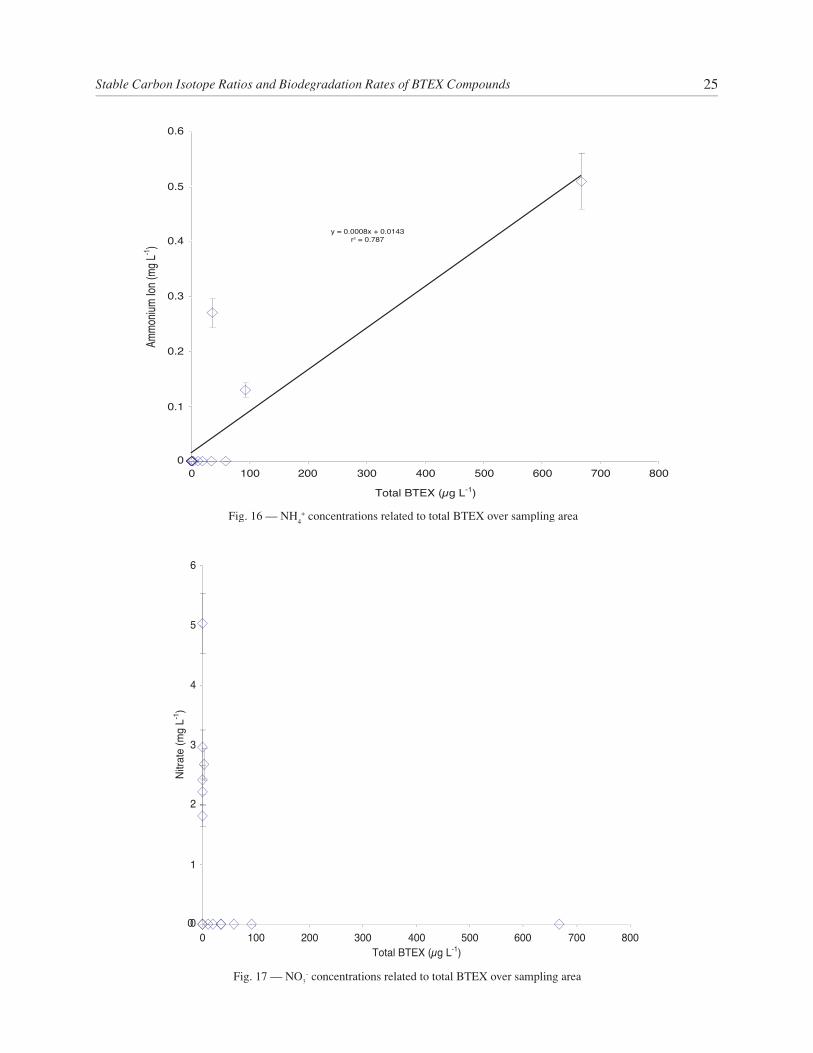
Ammonium ion concentration increased as a function of BTEX concentration, indicating that denitrify-ing conditions were prevalent at source areas (Fig. 16). Nitrate varied over the site but was consistently not detected where detectable levels of BTEX existed (Fig. 17). In all likelihood, BTEX biodegradation occurs close to source areas under denitrifying conditions. Interestingly, there was little stimulation of benzene and toluene mineralization with added NO
3-. The addition of this electron acceptor should perhaps have stimu-
lated benzene and toluene mineralization (Tables 6 and 7)[29]. In contrast, it has been shown that rapidly (i.e., less than 24 h) changing levels of electron acceptors may in fact decrease the biodegradation of organic contaminants in groundwater[3].
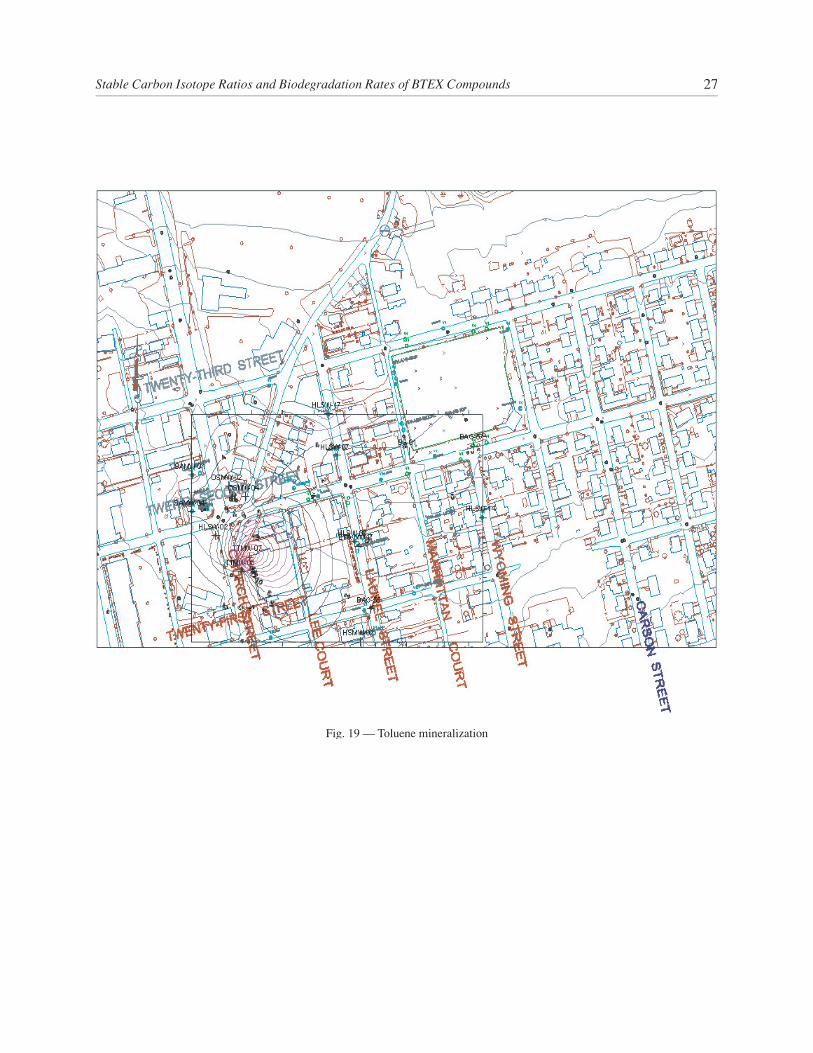
Benzene and Toluene Mineralization
Benzene and toluene mineralization were highest in wells with appreciable quantizes of BTEX (Tables 3 and 6). The high rates around source areas dominated the interpolation of benzene and toluene mineralization (Figs. 18 and 19). Significant benzene and toluene mineralization was measured at well BS-1 and BAG-57 on the downgradient portion of the plume. Benzene and toluene turnover times were relatively short (up to only 137 days). Generally, turnover times were less than 20 days. This indicates that BTEX compounds migrating toward the eastern portion of the impacted area are likely degraded before moving far off-site. Measurement of BTEX in downgradient wells (i.e., BS-1 and BAG-57) indicates that the biodegradation rate is lower than the BTEX delivery rate.
Bacterial Production
Bacterial production was low for all wells sampled. The general observation was high production upgra-dient of the plume, with lower production values at source areas and downgradient (Fig. 20). The addition of nutrients had no predictable effect on production (Table 8), and the interpolated levels over the entire site were very similar in trend to productions with no nutrients added (Fig. 21). Bacteria do not mineralize 100% of any compound to carbon dioxide. Generally, efficiencies for aromatic compounds are between 10-20%[3]. That is, 10-20% of the carbon is incorporated into bacterial biomass (and thus not measured in this assay), and 80-90% is respired as carbon dioxide. For wells SAMW-04, HLSW-08, and HSMW-02, benzene and toluene accounted for a very small amount of bacterial production, and thus bioremediation would not be occurring there relative to degradation of non-BTEX compounds (e.g., natural organic matter). For wells HLSW-14, SAMW-01, and TTMW-06, benzene and toluene mineralization accounted for about 30-50% of bacterial metabolism in the groundwater. This suggests that natural organic matter (or another VOC) accounted for the remaining production. In seven other wells (HLSW-17, EPA MW46 COAL, TTMW-07, OSMW-04, BS-01, BAG-57, and BAG-55), essentially all of the bacterial production was supported by the measured benzene and/or toluene mineralization rates, meaning that active bioremediation was going on at these sites or that the assemblage was adapted to degrade BTEX that would migrate onto the monitoring well station.
Phospholipid Fatty Acid (PFLA) Analysis
The bacterial assemblage was described by using three types of analyses, which are compared with other chemical analyses of groundwater from the same monitoring well. Two of the analyses involve rate measurements of bacterial growth (production) and BTEX metabolism (benzene and toluene mineralization) from samples removed from the subsurface environment. The third measurement involves identifying and quantifying the fatty acids specific to certain bacterial types (PLFA). This latter method does not provide rate information but does not involve ex situ incubations and thus may be a line of evidence that is more closely coupled to in situ conditions. This analysis will provide one of the first couplings of these measurements describing the bacterial assemblage in groundwater.
Stable Carbon Isotope Ratios and Biodegradation Rates of BTEX Compounds 25
000
1
2
3
4
5
6
100 200 300 400Total BTEX (µg L-1)
Nitra
te (m
g L-1
)
500 600 700 800
Fig. 17 — NO3
- concentrations related to total BTEX over sampling area
Fig. 16 — NH4
+ concentrations related to total BTEX over sampling area
y = 0.0008x + 0.0143r2 = 0.787
00
0.1
0.2
0.3
0.4
0.5
0.6
100 200 300 400
Total BTEX (µg L-1)
Ammo
nium
Ion (m
g L-1 )
500 600 700 800

Boyd et al.26
Fig. 18 — Benzene mineralization
Stable Carbon Isotope Ratios and Biodegradation Rates of BTEX Compounds 27
Fig. 19 — Toluene mineralization

Boyd et al.28
Fig. 20 — Bacterial production

Stable Carbon Isotope Ratios and Biodegradation Rates of BTEX Compounds 29
Fig. 21 — Bacterial production with added nutrients
1.6
1.7
1.8
1.9
2
2.1

Boyd et al.30
Assemblage Profile
Of the 18 monitoring well samples evaluated for relative bacterial assemblage composition, 10 samples had a very similar composition. These 10 stations were in the source area of the plumes and downgradient so the primary environmental influence of the bacterial assemblage composition may have been the elevated fuel concentrations. Two other monitoring wells (SAMW-1, -4) harbored assemblages that were very similar to each other. The remaining six samples harbored assemblages that were different enough from these two described groups that they will be excluded from some of the subsequent analyses. These samples were generally near the fringe or outside of the plume and were probably more heavily influenced by other en-vironmental factors like the presence of metals (e.g., HLSW-2), sulfate (e.g., HLSW-1), or alternate carbon sources (e.g., HLSW-7).
Organotolerance
Bacteria can alter their membrane structure in response to the presence of high concentrations of organic solvents, thus making them adapted for metabolizing carbon in contaminated environments (organotolerant). The relative degree of organotolerance is determined in the PLFA analyses with the ratio of trans to cis fatty acids. Ratios greater than 0.1 suggest that a large proportion of the bacteria present have recently been ex-posed to high organic solvent concentrations and are now organotolerant. Many of the bacterial assemblages surrounding the source area (e.g., SAMW-1, OSMW-2, -4, TTMW-1, -7, HLSW-3) were organotolerant, which is consistent with that expected for an area undergoing intrinsic bioremediation.
Biomass and Production
Of the 10 stations with similar bacterial assemblage compositions, the four stations nearest to the plume center had the highest amount of bacterial biomass (OSMW-2, -4, TTMW-7, HLSW-3) as determined with the PLFA analyses. Although the amount of biomass did not correlate with rate of bacterial production, these high standing stock values are probably reflective of reduced protozoan grazing rates resulting from BTEX toxicity. While these reduced grazing rates may result in higher bacterial abundance, they may reduce the overall rate of BTEX mineralization by reducing nutrient remineralization.
Potential for Source Removal
Benzene and toluene were able to be metabolized by the natural bacterial assemblage at many locations in the study site. The mineralization rates and the biomass concentrations were high in the middle of the source area, and this bacterial assemblage was found to be organotolerant. However, even with rates around 1 µg BTEX carbon L-1 d-1 being mineralized, natural attenuation may not be a likely means of source removal in areas over a 1000 µg L-1 of total BTEX. This is based on the biological rates measured at this one time point, which would be expected to be a low point seasonally.
Potential for Plume Migration Offsite
The capacity of the natural bacterial assemblage to adapt to BTEX input and metabolize the fuel in the fringes of the plume appears to be high when the ambient concentrations are under ca. 100 µg L-1 of total BTEX. The natural bacterial assemblage in much of the study site would likely be able to metabolize BTEX dissolved in the groundwater (over days to months) once the free product in the source area was removed or if the plume was sufficiently diluted with groundwater prior to migration downgradient.

Stable Carbon Isotope Ratios and Biodegradation Rates of BTEX Compounds 31
CONCLUSIONS
Based on our analyses to date, we were able to determine the rates of groundwater bacterial production, benzene and toluene biodegradation, and the stable carbon isotope ratios of BTEX compounds. The follow-ing conclusions can be made:
• There was significant BTEX in samples around two of the PRPs (gas station and Tranguch Tire).
• Ammonium and nitrate concentrations indicated that reducing conditions existed in wells with significant BTEX contamination and that denitrification may be an important electron accepting process on-site.
• MTBE concentration data indicated that fuels from Tranguch Tire and the neighboring gas station were likely from different sources.
• Mineralization of benzene and toluene were highest in source areas, but it also was signifi-cant in wells with low-to-no BTEX contamination. Turnover times indicate that much of the benzene and toluene is utilized before having the opportunity to move off-site.
• Bacterial production was very low throughout the wells sampled. Highest production occurred upgradient of the plume, which presumably is not impacted. BTEX mineralization could ac-count for almost all bacterial production at seven wells.
• Groundwater bacterial production was highest during warmer seasons, mimicking trends traditionally seen in adjacent estuarine water.
• PFLA analysis showed organotolerant populations in source areas and those downgradient. Biomass calculated from PFLA yields was highest downgradient of the source areas.
• Stable carbon isotope ratios were found to be significantly different among BTEX constitu-ents when five components were analyzed. Statistical differences became less apparent with three- and one-compound tests.
• Stable carbon isotope analysis suggested that at least two sources of BTEX hydrocarbons exist on site – one located in the SAMW-01 and OSMW-02 region and one located in the OSMW-04 and TTMW-07 region. Clustering analysis showed a hierarchical relationship between the putative source wells and downgradient wells.
To better understand the processes described above and to determine the seasonal dynamics of chemical contaminants and biological activities, the following studies are suggested:
• A seasonal survey of wells should be conducted to determine the effect(s) of temperature on microbial activities.
• A site-specific empirical calculation of bacterial production conversion factor should be at-tempted.
• A careful measurement of Eh (potential) should be made at each monitoring well to determine what terminal electron accepting process predominates on-site.
• Natural abundance radiocarbon isotope analysis of inorganic carbon in the groundwater and vadose zone may be used as an in situ confirmation of bacterial processes measured with the radiotracer addition experiments.
• Stable isotope ratios should be measured in more wells near the potential source areas. Of the top 20 wells in BTEX concentration, isotope analyses were conducted only on three.

Boyd et al.32
REFERENCES
1. K.H. Baker and D.S. Herson, “Insitu Bioremediation of Contaminated Aquifers and Subsurface Soils,” Geomicrobiol. J. 8,133-146 (1990).
2. National Research Council, Committee on in situ Bioremediation, In situ Bioremediation : When Does It Work? National Academy of Sciences, Washington, DC, (1993).
3. T.J. Boyd, M.T. Montgomery, B.J. Spargo, D.C. Smith, R.B. Coffi n, C.A. Kelley, and J.G. Mueller, “Ef-fects of Oxygenation on Hydrocarbon Biodegradation in a Hypoxic Environment,” Biorem. J. 5,145-157 (2001).
4. J.A. Fuhrman and F. Azam, “Thymidine Incorporation as a Measure of Heterotrophic Bacterioplankton Production in Marine Surface Waters: Evaluation and Field Results, Mar. Biol. 66,109-120 (1982).
5. D.L. Kirchman, S.Y. Newell, and R.E.Hodson, “Incorporation versus Biosynthesis of Leucine: Implica-tions for Measuring Rates of Protein Synthesis and Biomass Production by Bacteria in Marine Systems,” Mar. Ecol. Prog. Ser. 32, 47-59 (1986).
6. R.B. Coffi n and L.A. Cifuentes, “Analysis of Microbial Carbon Cycling with Stable Isotope Analysis in the Perdido Estuary, FL,” Estuaries 22, 917-926 (1999).
7. B. Fry, 1986 “Sources of Carbon and Sulfur Nutrition for Consumers in Three Meromictic Lakes in New York State,” Limnol. Oceanogr. 31, 79-88 (1986).
8. B.J. Peterson, B. Fry, M. Hullar, S. Saupe, and R.T. Wright, “The Distribution and Stable Carbon Isotopic Composition of Dissolved Organic Carbon in Estuaries,” Estuaries 17, 111-121 (1994).
9. R.B. Coffi n, D.J. Velinsky, R. Devereux,W.A. Price, and L.A. Cifuentes, “Stable Carbon Isotope Analysis of Nucleic Acids to Trace Sources of Dissolved Substrates Used by Estuarine Bacteria,” Appl. Environ. Microbiol 56, 2012-2020 (1990).
10. M.A.J. Hullar, B. Fry, B.J. Peterson, and R.T. Wright, “Microbial Utilization of Estuarine Dissolved Organic Carbon: a Stable Isotope Tracer Approach Tested by Mass Balance,” Appl. Environ. Microbiol.62, 2489-2493 (1996).
11. W. Meier-Augenstein, “On-Line Recording of 13C/12C Ratios and Mass Spectra in One Gas Chromato-graphic Analysis,” High Resol. Chromatogr. 18, 28-32 (1995).
12. J.A. Silfer, M.H. Engel, S.A. Macko, and E.J. Jumeau, “Stable Carbon Isotope Analysis of Amino Acid Enantiomers by Conventional Isotope Ratio Mass Spectrometry and Combined Gas Chromatography/Isotope Ratio Mass Spectrometry,” Anal. Chem. 63, 370-374 (1991).
13. J.G. Mueller, F.S. Lakhwala, SE. Lantz, C. Heard, E. J. Klingel, W.B. Langley, M.D. Brourman, R.B. Coffi n, B. Trust, C. Kelley, L.A. Cifuentes, M.T. Montgomery, T.J. Boyd, and W.W. Schultz, “Use of Groundwater Circulation (UVB) Technology and Integrated Bioreactors for Chemical Containment and in-situ Bioremediation of Subsurface Environments Contaminated by Coal Tar Creosote: Full-scale Field Validation,” Land Contam. Reclamat. 3, 6-11-6-16 (1995).
14. B.T. Hammer, C.A. Kelley, R.B. Coffi n, L.A. Cifuentes, and J.G. Mueller, “Delta C-13 Values of Poly-cyclic Aromatic Hydrocarbons Collected from Two Creosote-contaminated Sites,” Chem. Geol. 152, 43-58 (1998).

Stable Carbon Isotope Ratios and Biodegradation Rates of BTEX Compounds
15. L. Mazeas, H. Budzinski, and N. Raymond, “Absence of Stable Carbon Isotope Fractionation of Satu-rated and Polycyclic Aromatic Hydrocarbons During Aerobic Bacterial Biodegradation,” Org. Geochem. 33,1259-1272 (2002).
16. C.A. Kelley, B.T. Hammer, and R.B. Coffi n, “Concentrations and Stable Isotope Values of BTEX in Gasoline-Contaminated Groundwater,” Environ. Sci. Technol. 31, 2469-2472 (1997).
17. B.S. Lollar, G.F. Slater, B. Sleep, M. Witt, G.M. Klecka, M. Harkness, and J. Spivack, “Stable Carbon Isotope Evidence for Intrinsic Bioremediation of Tetrachloroethene and Trichloroethene at Area 6, Dover Air Force Base,” Environ. Sci. Technol. 35, 261-269 (2001).
18. J.E. Landmeyer, D.A. Vroblesky, and F.H. Chapelle, “Stable Carbon Isotope Evidence of Biodegradation Zonation in a Shallow Jet-Fuel Contaminated Aquifer,” Environ. Sci. Technol. 30, 1120-1128 (1996).
19. R.B. Coffi n, L.A. Cifuentes, and P.M. Elderidge, “The Use of Stable Carbon Isotopes to Study Microbial Processes in Estuaries in Stable Isotopes in Ecology and Environmental Science,” K. Lajtha and R.H. Michener, eds., (Blackwell Scientifi c Publications, Boston, 1994).
20. R.B. Coffi n, B. Fry, B.J. Peterson, and R.T. Wright, “Carbon Isotopic Compositions of Estuarine Bac-teria,” Limnol. Oceanogr. 34, 1305-1310 (1989).
21. R.B. Coffi n, L.A. Cifuentes, and P.H. Pritchard, “Assimilation of Oil-derived Carbon and Remedial Nitrogen Applications by Intertidal Food Chains on a Contaminated Beach in Prince William Sound, Alaska,” Mar. Environ. Res. 44, 27-39 (1977).
22. O. Pelz, L.A. Cifuentes, B.T. Hammer, C.A. Kelley, and R.B. Coffi n, “Tracing the Assimilation of Or-ganic Compounds Using Delta C-13 Analysis of Unique Amino Acids in the Bacterial Peptidoglycan Cell Wall,” Fems Microbiol. Ecol. 25, 229-240 (1998).
23. L.A. Cifuentes, R.B. Coffi n, L. Solorzano, W. Cardenas, J. Espinoza, and R.R. Twilley, “Isotopic and Elemental Variations of Carbon and Nitrogen in a Mangrove Estuary,” Estuar. Coast. Shelf Sci. 43, 781-800 (1996).
24. L.A. Cifuentes, R.B. Coffi n, R.C. Downer, C.A. Kelley, L.A. Roelke, and G.G. Salata, “Stable Isotope Measurements of Dissolved Inorganic Carbon and Soil Gases at Two Bioremediation Sites,” in In Situ Bioremediation and Effi cacy Monitoring, B. J. Spargo, ed., Naval Research Laboratory, Washington, DC (1996), pp. 195-206.
25. S.W. Chapman, M.R. Vandergriendt, B.J. Butler, and D.M. Mackay, “Measurement of Oxygen Demand of Petroleum Hydrocarbon-contaminated Groundwater.” Biorem. J. 1, 165-172 (1998).
26. J.A. Cunningham, H. Rahme, G.D. Hopkins, C. Lebron, and M. Reinhard, “Enhanced in situ Bioreme-diation of BTEX Contaminated Groundwater by Combined Injection of Nitrate and Sulfate,” Environ. Sci. Technol. 35, 1663-1670 (2001).
27. J.R. Barbaro, J.F. Barker, L.A. Lemon, and C.I. Mayfi eld, “Biotransformation of BTEX Under Anaero-bic, Denitrifying Conditions - Field and Laboratory Observations,” J. Contam. Hydrol. 11, 245-272 (1992).
28. R.M. Gersberg, K.G. Korth, L.E. Rice, J.D. Randall, A.H. Bogardt, W.J. Dawsey, and B.B. Hemmingsen, “Chemical and Microbial Evaluation of in-situ Bioremediation of Hydrocarbons in Anoxic Groundwater Enriched with Nutrients and Nitrate,” World J. Microbiol. Biotechnol. 11, 549-558 (1995).
33

Boyd et al.
29. M. Reinhard, S. Shang, P.D. Kitanidis, E. Orwin, G.D. Hopkins, and C.A. Lebron, “In situ BTEX Bio-transformation Under Enhanced Nitrate- and Sulfate-reducing Conditions,” Environ. Sci. Technol. 31, 28-36 (1997).
34
Stable Carbon Isotope Ratios and Biodegradation Rates of BTEX Compounds
Appendix
SUMMARY OF ANALYTICAL METHODS
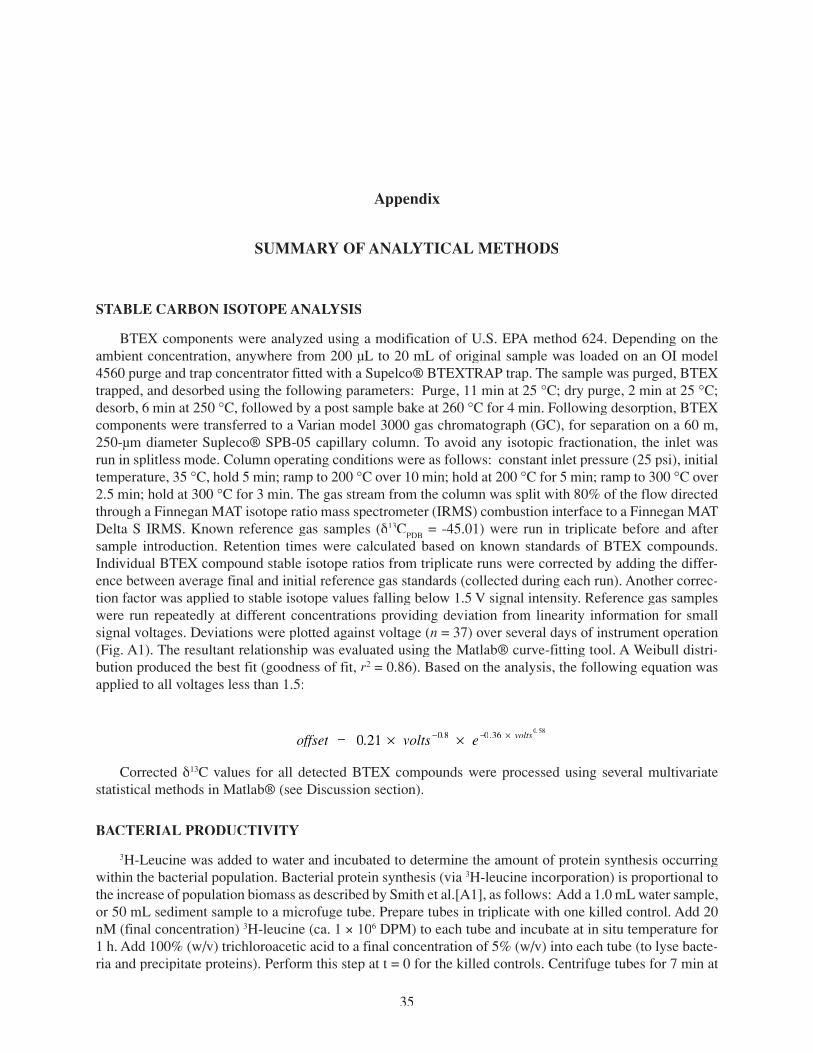
STABLE CARBON ISOTOPE ANALYSIS
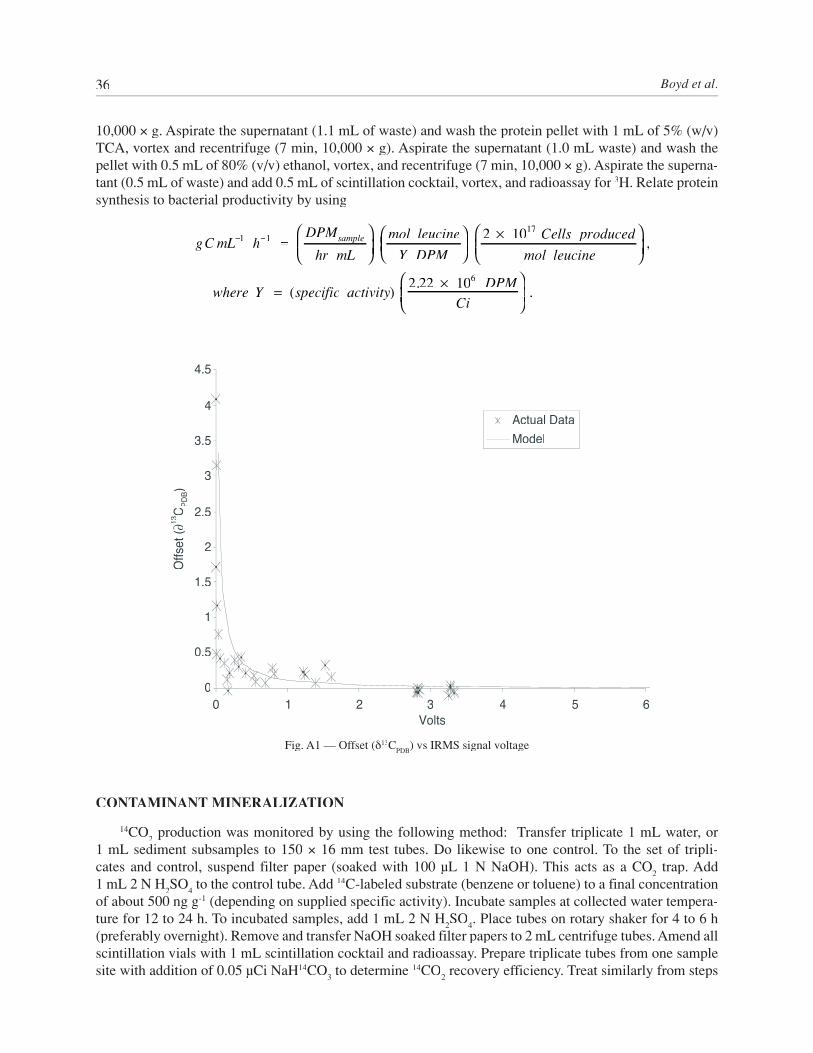
BTEX components were analyzed using a modification of U.S. EPA method 624. Depending on the ambient concentration, anywhere from 200 µL to 20 mL of original sample was loaded on an OI model 4560 purge and trap concentrator fitted with a Supelco® BTEXTRAP trap. The sample was purged, BTEX trapped, and desorbed using the following parameters: Purge, 11 min at 25 °C; dry purge, 2 min at 25 °C; desorb, 6 min at 250 °C, followed by a post sample bake at 260 °C for 4 min. Following desorption, BTEX components were transferred to a Varian model 3000 gas chromatograph (GC), for separation on a 60 m, 250-µm diameter Supleco® SPB-05 capillary column. To avoid any isotopic fractionation, the inlet was run in splitless mode. Column operating conditions were as follows: constant inlet pressure (25 psi), initial temperature, 35 °C, hold 5 min; ramp to 200 °C over 10 min; hold at 200 °C for 5 min; ramp to 300 °C over 2.5 min; hold at 300 °C for 3 min. The gas stream from the column was split with 80% of the flow directed through a Finnegan MAT isotope ratio mass spectrometer (IRMS) combustion interface to a Finnegan MAT Delta S IRMS. Known reference gas samples (δ13C
PDB = -45.01) were run in triplicate before and after
sample introduction. Retention times were calculated based on known standards of BTEX compounds. Individual BTEX compound stable isotope ratios from triplicate runs were corrected by adding the differ-ence between average final and initial reference gas standards (collected during each run). Another correc-tion factor was applied to stable isotope values falling below 1.5 V signal intensity. Reference gas samples were run repeatedly at different concentrations providing deviation from linearity information for small signal voltages. Deviations were plotted against voltage (n = 37) over several days of instrument operation (Fig. A1). The resultant relationship was evaluated using the Matlab® curve-fitting tool. A Weibull distri-bution produced the best fit (goodness of fit, r2 = 0.86). Based on the analysis, the following equation was applied to all voltages less than 1.5:
offset = 0.21 × volts −0.8 × e−0−0− .36 × volts 0.0.0 58
Corrected δ13C values for all detected BTEX compounds were processed using several multivariate statistical methods in Matlab® (see Discussion section).
BACTERIAL PRODUCTIVITY
3H-Leucine was added to water and incubated to determine the amount of protein synthesis occurring within the bacterial population. Bacterial protein synthesis (via 3H-leucine incorporation) is proportional to the increase of population biomass as described by Smith et al.[A1], as follows: Add a 1.0 mL water sample, or 50 mL sediment sample to a microfuge tube. Prepare tubes in triplicate with one killed control. Add 20 nM (final concentration) 3H-leucine (ca. 1 × 10⁶ DPM) to each tube and incubate at in situ temperature for 1 h. Add 100% (w/v) trichloroacetic acid to a final concentration of 5% (w/v) into each tube (to lyse bacte-ria and precipitate proteins). Perform this step at t = 0 for the killed controls. Centrifuge tubes for 7 min at
35
Boyd et al.
10,000 × g. Aspirate the supernatant (1.1 mL of waste) and wash the protein pellet with 1 mL of 5% (w/v) TCA, vortex and recentrifuge (7 min, 10,000 × g). Aspirate the supernatant (1.0 mL waste) and wash the pellet with 0.5 mL of 80% (v/v) ethanol, vortex, and recentrifuge (7 min, 10,000 × g). Aspirate the superna-tant (0.5 mL of waste) and add 0.5 mL of scintillation cocktail, vortex, and radioassay for 3H. Relate protein synthesis to bacterial productivity by using
g C mL−1 h−1 =DPMsample
hr mL
mol leucine
Y DPM
2 × 10¹⁷ Cells producedmol leucine
,
where Y = (specific activity)2.22 × 10⁶ DPM
Ci
.
0 1 2 3 4 5 60
0.5
1
1.5
2
2.5
3
3.5
4
4.5
Volts
Actual Data
Offs
et (∂
13C PD
B)
Model
Fig. A1 — Offset (δ13CPDB
) vs IRMS signal voltage
CONTAMINANT MINERALIZATION
14CO2 production was monitored by using the following method: Transfer triplicate 1 mL water, or
1 mL sediment subsamples to 150 × 16 mm test tubes. Do likewise to one control. To the set of tripli-cates and control, suspend filter paper (soaked with 100 µL 1 N NaOH). This acts as a CO
2 trap. Add
1 mL 2 N H2SO
4 to the control tube. Add 14C-labeled substrate (benzene or toluene) to a final concentration
of about 500 ng g-1 (depending on supplied specific activity). Incubate samples at collected water tempera-ture for 12 to 24 h. To incubated samples, add 1 mL 2 N H
2SO
4. Place tubes on rotary shaker for 4 to 6 h
(preferably overnight). Remove and transfer NaOH soaked filter papers to 2 mL centrifuge tubes. Amend all scintillation vials with 1 mL scintillation cocktail and radioassay. Prepare triplicate tubes from one sample site with addition of 0.05 µCi NaH14CO
3 to determine 14CO
2 recovery efficiency. Treat similarly from steps
36

Stable Carbon Isotope Ratios and Biodegradation Rates of BTEX Compounds 37
6-8. Relate respiration to contaminant removal by using the following equation:
Mineralizationg
L h
=DPMsample
L h
mol substrate
Y DPM
g substrateno. of labeled carbons
mol substrate
,
where Y = (specific activity)2.22 × 10⁶ DPM
Ci
.
QUALITY CONTROL SAMPLING
Various QC samples were collected during field operations to include field blanks and trip blanks.
Field Blanks
Field blanks were collected by rinsing sampling equipment with MilliQ water and collecting the rinse water. The rinse was analyzed for organics in a similar manner to water column samples. This analysis de-fines the contribution of equipment-borne contaminants to the samples.
Trip Blanks
A trip blank was prepared in the laboratory for shipment to the sample site. It consisted of a centrifuge tube filled with precombusted Ottawa sand. It was kept with the sampling equipment and handled the same as regular samples. The trip blank served to clarify the contribution of outside contamination to samples collected, shipped, and stored before analysis.
REFERENCES
A1. D.C. Smith and F. Azam, “A Simple, Economical Method for Measuring Bacterial Protein Synthesis Rates in Seawater Using 3H-leucine,” Mar. Microb. Food Webs 6,107-114 (1992).