STA304H1F/1003HF Summer 2015: Lecture 10 - … Summer 2015: Lecture 10 ... Lecture 10 June 16, 2015...
59
STA304H1F/1003HF Summer 2015: Lecture 10 We should learn... I When is systematic sampling not appropriate? I When is systematic sampling nearly equivalent to SRS? I Why is repeated systematic sampling used? I What is one-stage cluster sampling? I What is the trade-off in cluster sampling? I What is two-stage cluster sampling? Lecture 10 June 16, 2015 1
Transcript of STA304H1F/1003HF Summer 2015: Lecture 10 - … Summer 2015: Lecture 10 ... Lecture 10 June 16, 2015...
STA304H1F/1003HF Summer 2015: Lecture 10
We should learn...
I When is systematic sampling not appropriate?
I When is systematic sampling nearly equivalent to SRS?
I Why is repeated systematic sampling used?
I What is one-stage cluster sampling?
I What is the trade-off in cluster sampling?
I What is two-stage cluster sampling?
Lecture 10 June 16, 2015 1
Cluster Sampling Ch. 8
I What is a cluster?
I What is cluster sampling?
I psu- primary sampling units
I ssu- secondary sampling units
I Types of cluster samples:
I one-stage cluster sampling
I two-stage cluster sampling
I Why?
Lecture 10 June 16, 2015 2
Cluster Sampling Ch. 8
I What is a cluster?
I What is cluster sampling?
I psu- primary sampling units
I ssu- secondary sampling units
I Types of cluster samples:
I one-stage cluster sampling
I two-stage cluster sampling
I Why?
Lecture 10 June 16, 2015 3
Cluster Sampling Ch. 8
I What is a cluster?
I What is cluster sampling?
I psu- primary sampling units
I ssu- secondary sampling units
I Types of cluster samples:
I one-stage cluster sampling
I two-stage cluster sampling
I Why?
Lecture 10 June 16, 2015 4
Cluster Sampling Ch. 8
I What is a cluster?
I What is cluster sampling?
I psu- primary sampling units
I ssu- secondary sampling units
I Types of cluster samples:
I one-stage cluster sampling
I two-stage cluster sampling
I Why?
Lecture 10 June 16, 2015 5
Cluster Sampling Ch. 8
I What is a cluster?
I What is cluster sampling?
I psu- primary sampling units
I ssu- secondary sampling units
I Types of cluster samples:
I one-stage cluster sampling
I two-stage cluster sampling
I Why?
Lecture 10 June 16, 2015 6
Cluster Sampling Ch. 8
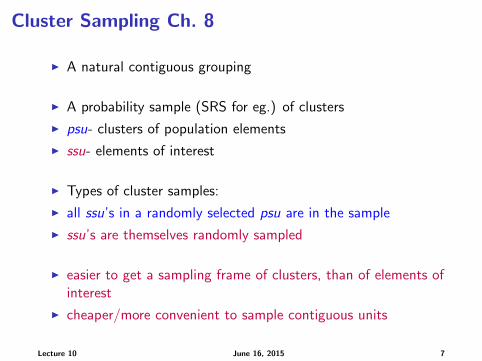
I A natural contiguous grouping
I A probability sample (SRS for eg.) of clusters
I psu- clusters of population elements
I ssu- elements of interest
I Types of cluster samples:
I all ssu’s in a randomly selected psu are in the sample
I ssu’s are themselves randomly sampled
I easier to get a sampling frame of clusters, than of elements ofinterest
I cheaper/more convenient to sample contiguous units
Lecture 10 June 16, 2015 7

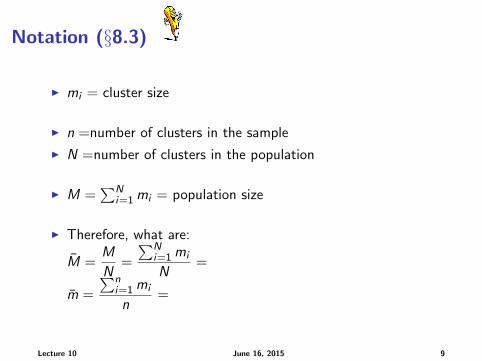
Notation (§8.3)
I mi = cluster size
I n =number of clusters in the sample
I N =number of clusters in the population
I M =∑N
i=1mi = population size
I Therefore, what are:
M =M
N=
∑Ni=1mi
N=
m =
∑ni=1mi
n=
Lecture 10 June 16, 2015 9
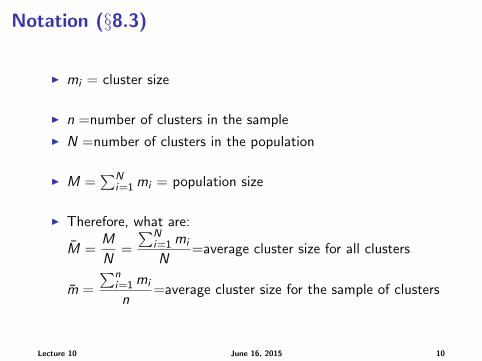
Notation (§8.3)
I mi = cluster size
I n =number of clusters in the sample
I N =number of clusters in the population
I M =∑N
i=1mi = population size
I Therefore, what are:
M =M
N=
∑Ni=1mi
N=average cluster size for all clusters
m =
∑ni=1mi
n=average cluster size for the sample of clusters
Lecture 10 June 16, 2015 10
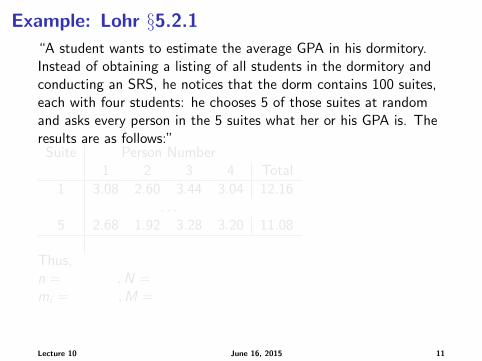
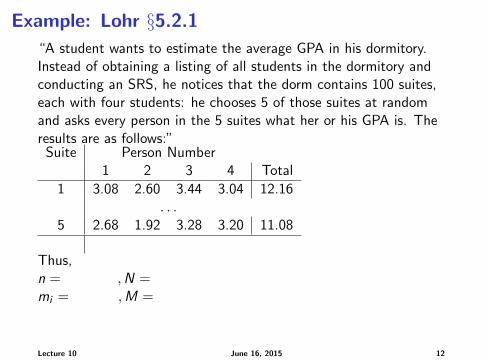
Example: Lohr §5.2.1“A student wants to estimate the average GPA in his dormitory.Instead of obtaining a listing of all students in the dormitory andconducting an SRS, he notices that the dorm contains 100 suites,each with four students: he chooses 5 of those suites at randomand asks every person in the 5 suites what her or his GPA is. Theresults are as follows:”
Suite Person Number1 2 3 4 Total
1 3.08 2.60 3.44 3.04 12.16. . .
5 2.68 1.92 3.28 3.20 11.08
Thus,n = ,N =mi = ,M =
Lecture 10 June 16, 2015 11
Example: Lohr §5.2.1“A student wants to estimate the average GPA in his dormitory.Instead of obtaining a listing of all students in the dormitory andconducting an SRS, he notices that the dorm contains 100 suites,each with four students: he chooses 5 of those suites at randomand asks every person in the 5 suites what her or his GPA is. Theresults are as follows:”
Suite Person Number1 2 3 4 Total
1 3.08 2.60 3.44 3.04 12.16. . .
5 2.68 1.92 3.28 3.20 11.08
Thus,n = ,N =mi = ,M =
Lecture 10 June 16, 2015 12
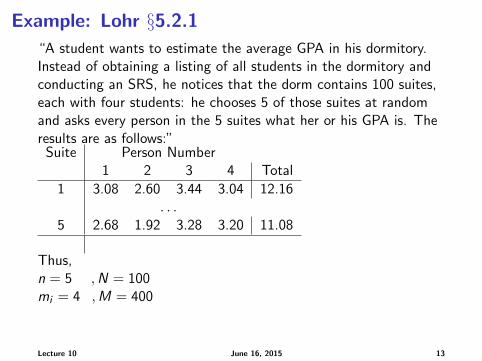
Example: Lohr §5.2.1“A student wants to estimate the average GPA in his dormitory.Instead of obtaining a listing of all students in the dormitory andconducting an SRS, he notices that the dorm contains 100 suites,each with four students: he chooses 5 of those suites at randomand asks every person in the 5 suites what her or his GPA is. Theresults are as follows:”
Suite Person Number1 2 3 4 Total
1 3.08 2.60 3.44 3.04 12.16. . .
5 2.68 1.92 3.28 3.20 11.08
Thus,n = 5 ,N = 100mi = 4 ,M = 400
Lecture 10 June 16, 2015 13
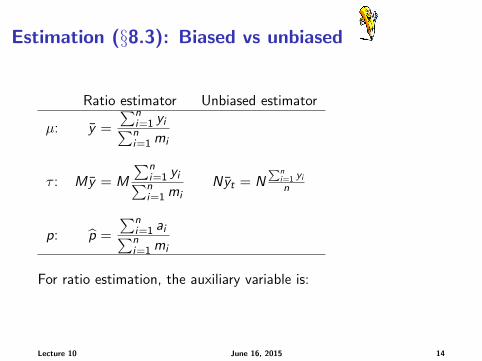
Estimation (§8.3): Biased vs unbiased
Ratio estimator Unbiased estimator
µ: y =
∑ni=1 yi∑ni=1mi
τ : My = M
∑ni=1 yi∑ni=1mi
Nyt = N∑n
i=1 yin
p: p =
∑ni=1 ai∑ni=1mi
For ratio estimation, the auxiliary variable is:
Lecture 10 June 16, 2015 14
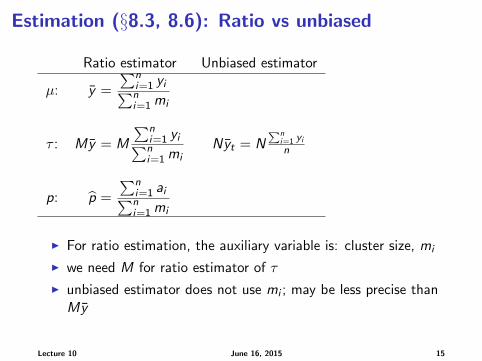
Estimation (§8.3, 8.6): Ratio vs unbiased
Ratio estimator Unbiased estimator
µ: y =
∑ni=1 yi∑ni=1mi
τ : My = M
∑ni=1 yi∑ni=1mi
Nyt = N∑n
i=1 yin
p: p =
∑ni=1 ai∑ni=1mi
I For ratio estimation, the auxiliary variable is: cluster size, mi
I we need M for ratio estimator of τ
I unbiased estimator does not use mi ; may be less precise thanMy
Lecture 10 June 16, 2015 15
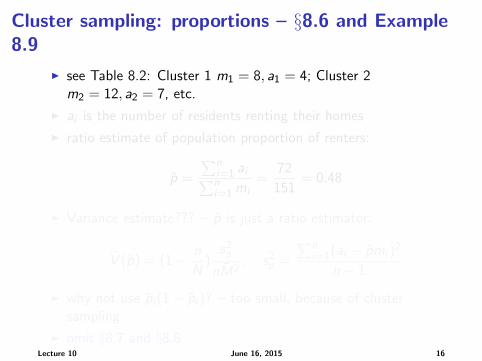
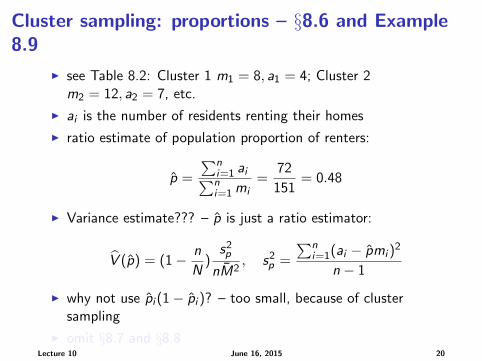
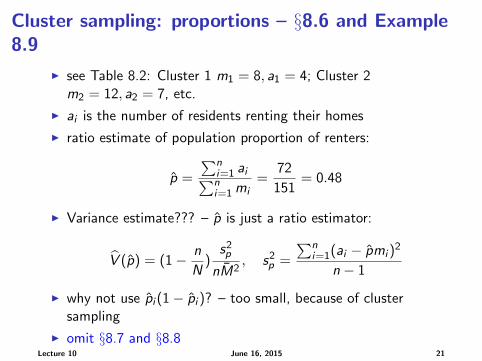
Cluster sampling: proportions – §8.6 and Example8.9
I see Table 8.2: Cluster 1 m1 = 8, a1 = 4; Cluster 2m2 = 12, a2 = 7, etc.
I ai is the number of residents renting their homes
I ratio estimate of population proportion of renters:
p =
∑ni=1 ai∑ni=1mi
=72
151= 0.48
I Variance estimate??? – p is just a ratio estimator:
V (p) = (1− n
N)
s2p
nM2, s2p =
∑ni=1(ai − pmi )
2
n − 1
I why not use pi (1− pi )? – too small, because of clustersampling
I omit §8.7 and §8.8Lecture 10 June 16, 2015 16
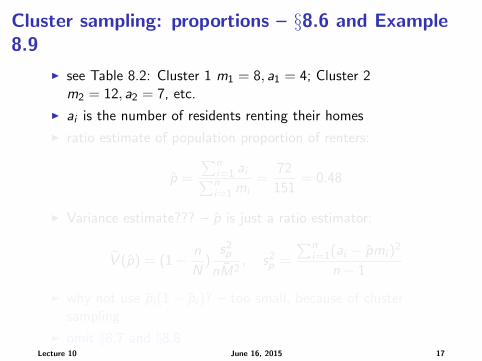
Cluster sampling: proportions – §8.6 and Example8.9
I see Table 8.2: Cluster 1 m1 = 8, a1 = 4; Cluster 2m2 = 12, a2 = 7, etc.
I ai is the number of residents renting their homes
I ratio estimate of population proportion of renters:
p =
∑ni=1 ai∑ni=1mi
=72
151= 0.48
I Variance estimate??? – p is just a ratio estimator:
V (p) = (1− n
N)
s2p
nM2, s2p =
∑ni=1(ai − pmi )
2
n − 1
I why not use pi (1− pi )? – too small, because of clustersampling
I omit §8.7 and §8.8Lecture 10 June 16, 2015 17
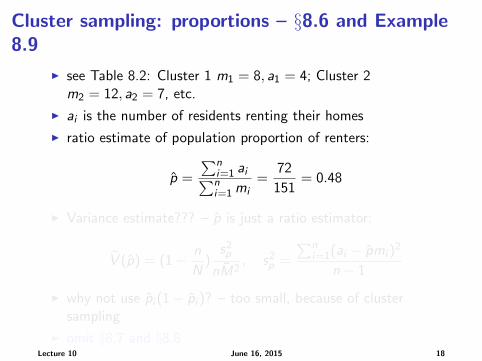
Cluster sampling: proportions – §8.6 and Example8.9
I see Table 8.2: Cluster 1 m1 = 8, a1 = 4; Cluster 2m2 = 12, a2 = 7, etc.
I ai is the number of residents renting their homes
I ratio estimate of population proportion of renters:
p =
∑ni=1 ai∑ni=1mi
=72
151= 0.48
I Variance estimate??? – p is just a ratio estimator:
V (p) = (1− n
N)
s2p
nM2, s2p =
∑ni=1(ai − pmi )
2
n − 1
I why not use pi (1− pi )? – too small, because of clustersampling
I omit §8.7 and §8.8Lecture 10 June 16, 2015 18
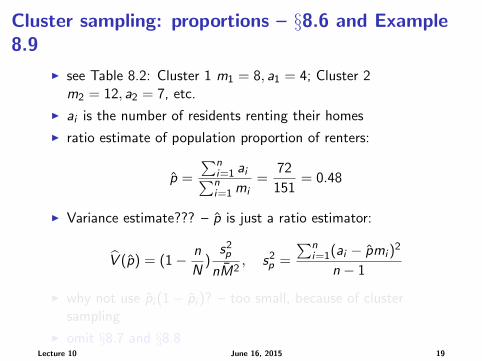
Cluster sampling: proportions – §8.6 and Example8.9
I see Table 8.2: Cluster 1 m1 = 8, a1 = 4; Cluster 2m2 = 12, a2 = 7, etc.
I ai is the number of residents renting their homes
I ratio estimate of population proportion of renters:
p =
∑ni=1 ai∑ni=1mi
=72
151= 0.48
I Variance estimate??? – p is just a ratio estimator:
V (p) = (1− n
N)
s2p
nM2, s2p =
∑ni=1(ai − pmi )
2
n − 1
I why not use pi (1− pi )? – too small, because of clustersampling
I omit §8.7 and §8.8Lecture 10 June 16, 2015 19
Cluster sampling: proportions – §8.6 and Example8.9
I see Table 8.2: Cluster 1 m1 = 8, a1 = 4; Cluster 2m2 = 12, a2 = 7, etc.
I ai is the number of residents renting their homes
I ratio estimate of population proportion of renters:
p =
∑ni=1 ai∑ni=1mi
=72
151= 0.48
I Variance estimate??? – p is just a ratio estimator:
V (p) = (1− n
N)
s2p
nM2, s2p =
∑ni=1(ai − pmi )
2
n − 1
I why not use pi (1− pi )? – too small, because of clustersampling
I omit §8.7 and §8.8Lecture 10 June 16, 2015 20
Cluster sampling: proportions – §8.6 and Example8.9
I see Table 8.2: Cluster 1 m1 = 8, a1 = 4; Cluster 2m2 = 12, a2 = 7, etc.
I ai is the number of residents renting their homes
I ratio estimate of population proportion of renters:
p =
∑ni=1 ai∑ni=1mi
=72
151= 0.48
I Variance estimate??? – p is just a ratio estimator:
V (p) = (1− n
N)
s2p
nM2, s2p =
∑ni=1(ai − pmi )
2
n − 1
I why not use pi (1− pi )? – too small, because of clustersampling
I omit §8.7 and §8.8Lecture 10 June 16, 2015 21
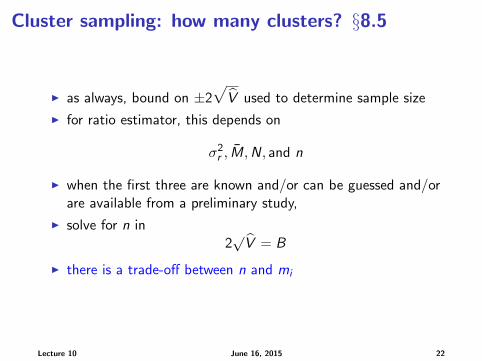
Cluster sampling: how many clusters? §8.5
I as always, bound on ±2√
V used to determine sample size
I for ratio estimator, this depends on
σ2r , M,N, and n
I when the first three are known and/or can be guessed and/orare available from a preliminary study,
I solve for n in2√V = B
I there is a trade-off between n and mi
Lecture 10 June 16, 2015 22
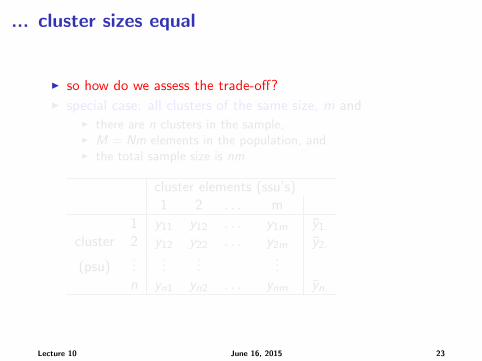
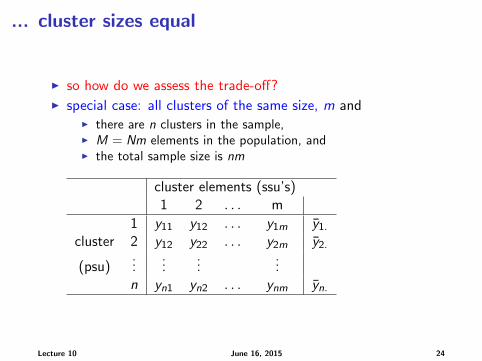
... cluster sizes equal
I so how do we assess the trade-off?I special case: all clusters of the same size, m and
I there are n clusters in the sample,I M = Nm elements in the population, andI the total sample size is nm
cluster elements (ssu’s)1 2 . . . m
1 y11 y12 . . . y1m y1.cluster 2 y12 y22 . . . y2m y2.
(psu)...
......
...n yn1 yn2 . . . ynm yn.
Lecture 10 June 16, 2015 23
... cluster sizes equal
I so how do we assess the trade-off?I special case: all clusters of the same size, m and
I there are n clusters in the sample,I M = Nm elements in the population, andI the total sample size is nm
cluster elements (ssu’s)1 2 . . . m
1 y11 y12 . . . y1m y1.cluster 2 y12 y22 . . . y2m y2.
(psu)...
......
...n yn1 yn2 . . . ynm yn.
Lecture 10 June 16, 2015 24
... cluster sizes equal
I
cluster elements (ssu’s)1 2 . . . m
1 y11 y12 . . . y1m y1.cluster 2 y12 y22 . . . y2m y2.
(psu)...
......
...n yn1 yn2 . . . ynm yn.
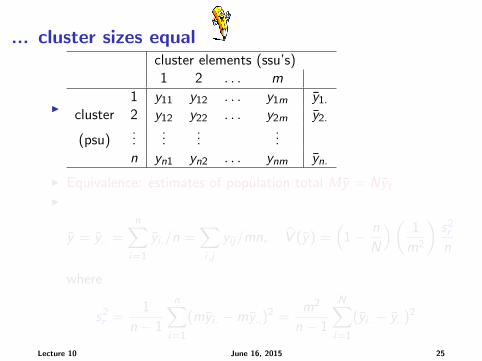
I Equivalence: estimates of population total My = NytI
y = y.. =n∑
i=1
yi ./n =∑i ,j
yij/mn, V (y) =(
1− n
N
)( 1
m2
)s2rn
where
s2r =1
n − 1
n∑i=1
(myi . −my..)2 =
m2
n − 1
N∑i=1
(yi . − y..)2
Lecture 10 June 16, 2015 25
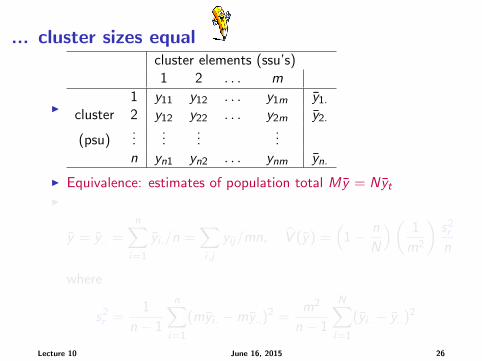
... cluster sizes equal
I
cluster elements (ssu’s)1 2 . . . m
1 y11 y12 . . . y1m y1.cluster 2 y12 y22 . . . y2m y2.
(psu)...
......
...n yn1 yn2 . . . ynm yn.
I Equivalence: estimates of population total My = NytI
y = y.. =n∑
i=1
yi ./n =∑i ,j
yij/mn, V (y) =(
1− n
N
)( 1
m2
)s2rn
where
s2r =1
n − 1
n∑i=1
(myi . −my..)2 =
m2
n − 1
N∑i=1
(yi . − y..)2
Lecture 10 June 16, 2015 26
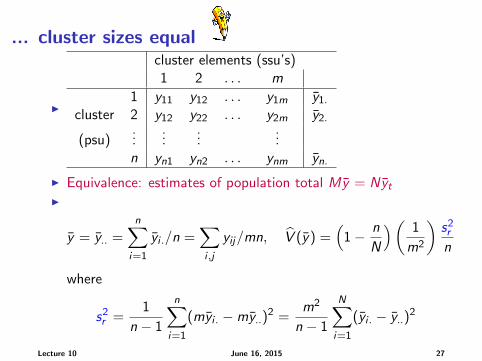
... cluster sizes equal
I
cluster elements (ssu’s)1 2 . . . m
1 y11 y12 . . . y1m y1.cluster 2 y12 y22 . . . y2m y2.
(psu)...
......
...n yn1 yn2 . . . ynm yn.
I Equivalence: estimates of population total My = NytI
y = y.. =n∑
i=1
yi ./n =∑i ,j
yij/mn, V (y) =(
1− n
N
)( 1
m2
)s2rn
where
s2r =1
n − 1
n∑i=1
(myi . −my..)2 =
m2
n − 1
N∑i=1
(yi . − y..)2
Lecture 10 June 16, 2015 27
... cluster sizes equal
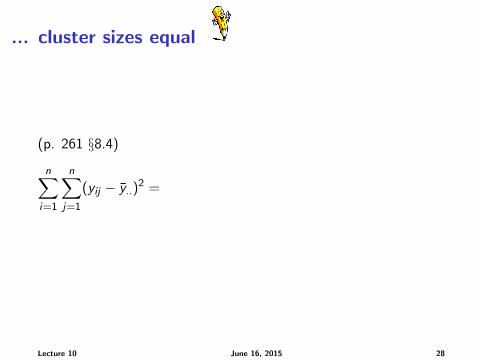
(p. 261 §8.4)
n∑i=1
n∑j=1
(yij − y..)2 =
Lecture 10 June 16, 2015 28
... cluster sizes equal
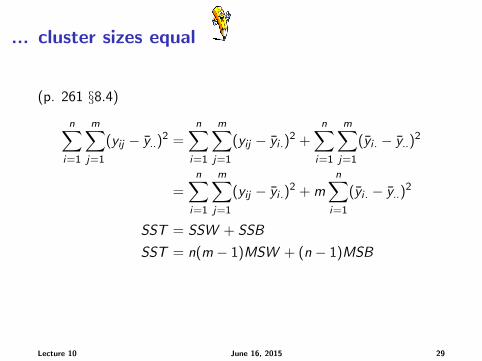
(p. 261 §8.4)
n∑i=1
m∑j=1
(yij − y..)2 =
n∑i=1
m∑j=1
(yij − yi .)2 +
n∑i=1
m∑j=1
(yi . − y..)2
=n∑
i=1
m∑j=1
(yij − yi .)2 + m
n∑i=1
(yi . − y..)2
SST = SSW + SSB
SST = n(m − 1)MSW + (n − 1)MSB
Lecture 10 June 16, 2015 29
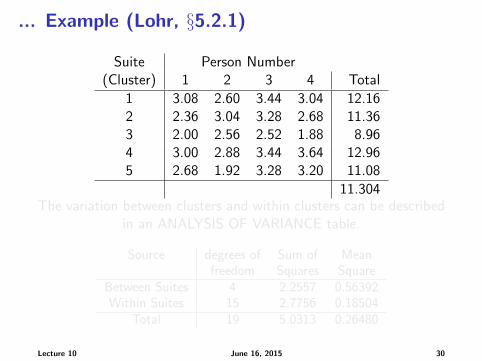
... Example (Lohr, §5.2.1)
Suite Person Number(Cluster) 1 2 3 4 Total
1 3.08 2.60 3.44 3.04 12.162 2.36 3.04 3.28 2.68 11.363 2.00 2.56 2.52 1.88 8.964 3.00 2.88 3.44 3.64 12.965 2.68 1.92 3.28 3.20 11.08
11.304The variation between clusters and within clusters can be described
in an ANALYSIS OF VARIANCE table.
Source degrees of Sum of Meanfreedom Squares Square
Between Suites 4 2.2557 0.56392Within Suites 15 2.7756 0.18504
Total 19 5.0313 0.26480
Lecture 10 June 16, 2015 30
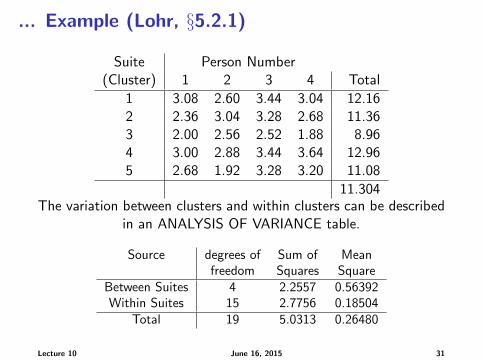
... Example (Lohr, §5.2.1)
Suite Person Number(Cluster) 1 2 3 4 Total
1 3.08 2.60 3.44 3.04 12.162 2.36 3.04 3.28 2.68 11.363 2.00 2.56 2.52 1.88 8.964 3.00 2.88 3.44 3.64 12.965 2.68 1.92 3.28 3.20 11.08
11.304The variation between clusters and within clusters can be described
in an ANALYSIS OF VARIANCE table.
Source degrees of Sum of Meanfreedom Squares Square
Between Suites 4 2.2557 0.56392Within Suites 15 2.7756 0.18504
Total 19 5.0313 0.26480
Lecture 10 June 16, 2015 31
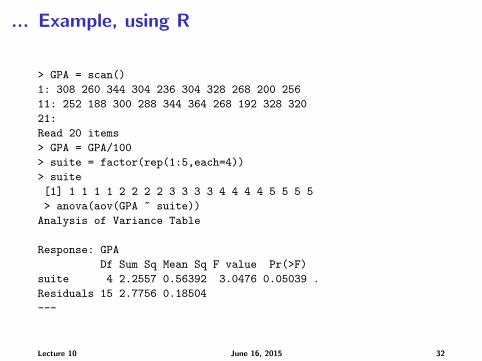
... Example, using R
> GPA = scan()
1: 308 260 344 304 236 304 328 268 200 256
11: 252 188 300 288 344 364 268 192 328 320
21:
Read 20 items
> GPA = GPA/100
> suite = factor(rep(1:5,each=4))
> suite
[1] 1 1 1 1 2 2 2 2 3 3 3 3 4 4 4 4 5 5 5 5
> anova(aov(GPA ~ suite))
Analysis of Variance Table
Response: GPA
Df Sum Sq Mean Sq F value Pr(>F)
suite 4 2.2557 0.56392 3.0476 0.05039 .
Residuals 15 2.7756 0.18504
---
Lecture 10 June 16, 2015 32

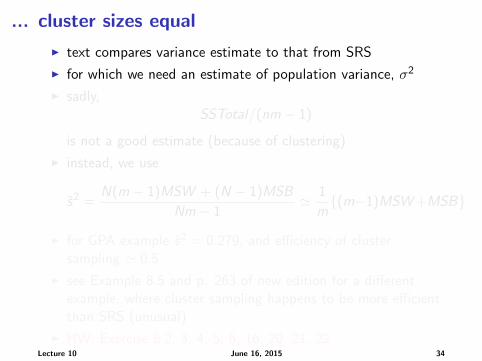
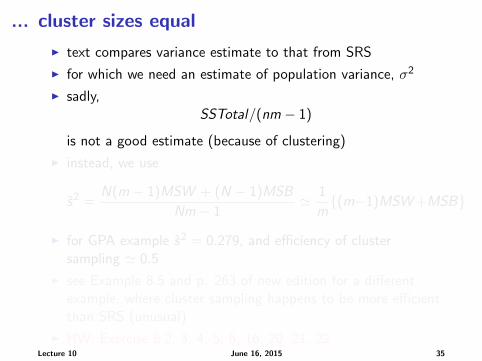
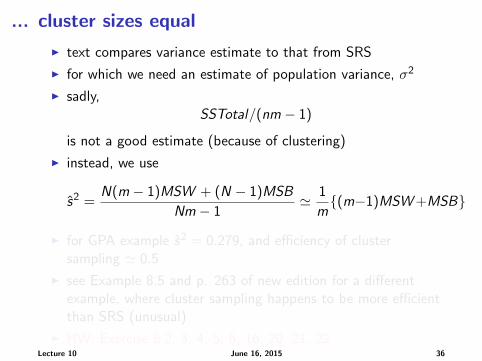
... cluster sizes equal
I text compares variance estimate to that from SRS
I for which we need an estimate of population variance, σ2
I sadly,SSTotal/(nm − 1)
is not a good estimate (because of clustering)
I instead, we use
s2 =N(m − 1)MSW + (N − 1)MSB
Nm − 1' 1
m{(m−1)MSW+MSB}
I for GPA example s2 = 0.279, and efficiency of clustersampling ' 0.5
I see Example 8.5 and p. 263 of new edition for a differentexample, where cluster sampling happens to be more efficientthan SRS (unusual)
I HW: Exercise 8.2, 3, 4, 5, 6, 16, 20, 21, 22Lecture 10 June 16, 2015 33
... cluster sizes equal
I text compares variance estimate to that from SRS
I for which we need an estimate of population variance, σ2
I sadly,SSTotal/(nm − 1)
is not a good estimate (because of clustering)
I instead, we use
s2 =N(m − 1)MSW + (N − 1)MSB
Nm − 1' 1
m{(m−1)MSW+MSB}
I for GPA example s2 = 0.279, and efficiency of clustersampling ' 0.5
I see Example 8.5 and p. 263 of new edition for a differentexample, where cluster sampling happens to be more efficientthan SRS (unusual)
I HW: Exercise 8.2, 3, 4, 5, 6, 16, 20, 21, 22Lecture 10 June 16, 2015 34
... cluster sizes equal
I text compares variance estimate to that from SRS
I for which we need an estimate of population variance, σ2
I sadly,SSTotal/(nm − 1)
is not a good estimate (because of clustering)
I instead, we use
s2 =N(m − 1)MSW + (N − 1)MSB
Nm − 1' 1
m{(m−1)MSW+MSB}
I for GPA example s2 = 0.279, and efficiency of clustersampling ' 0.5
I see Example 8.5 and p. 263 of new edition for a differentexample, where cluster sampling happens to be more efficientthan SRS (unusual)
I HW: Exercise 8.2, 3, 4, 5, 6, 16, 20, 21, 22Lecture 10 June 16, 2015 35
... cluster sizes equal
I text compares variance estimate to that from SRS
I for which we need an estimate of population variance, σ2
I sadly,SSTotal/(nm − 1)
is not a good estimate (because of clustering)
I instead, we use
s2 =N(m − 1)MSW + (N − 1)MSB
Nm − 1' 1
m{(m−1)MSW+MSB}
I for GPA example s2 = 0.279, and efficiency of clustersampling ' 0.5
I see Example 8.5 and p. 263 of new edition for a differentexample, where cluster sampling happens to be more efficientthan SRS (unusual)
I HW: Exercise 8.2, 3, 4, 5, 6, 16, 20, 21, 22Lecture 10 June 16, 2015 36
... cluster sizes equal
I text compares variance estimate to that from SRS
I for which we need an estimate of population variance, σ2
I sadly,SSTotal/(nm − 1)
is not a good estimate (because of clustering)
I instead, we use
s2 =N(m − 1)MSW + (N − 1)MSB
Nm − 1' 1
m{(m−1)MSW+MSB}
I for GPA example s2 = 0.279, and efficiency of clustersampling ' 0.5
I see Example 8.5 and p. 263 of new edition for a differentexample, where cluster sampling happens to be more efficientthan SRS (unusual)
I HW: Exercise 8.2, 3, 4, 5, 6, 16, 20, 21, 22Lecture 10 June 16, 2015 37
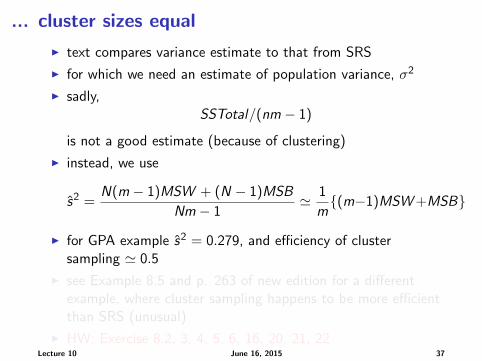
... cluster sizes equal
I text compares variance estimate to that from SRS
I for which we need an estimate of population variance, σ2
I sadly,SSTotal/(nm − 1)
is not a good estimate (because of clustering)
I instead, we use
s2 =N(m − 1)MSW + (N − 1)MSB
Nm − 1' 1
m{(m−1)MSW+MSB}
I for GPA example s2 = 0.279, and efficiency of clustersampling ' 0.5
I see Example 8.5 and p. 263 of new edition for a differentexample, where cluster sampling happens to be more efficientthan SRS (unusual)
I HW: Exercise 8.2, 3, 4, 5, 6, 16, 20, 21, 22Lecture 10 June 16, 2015 38
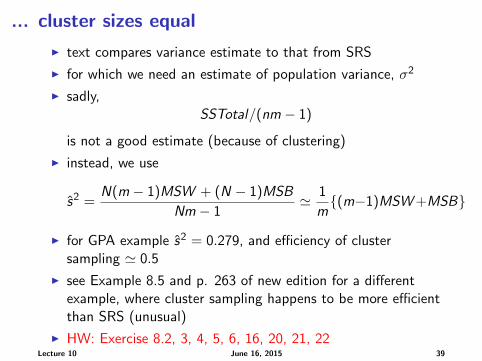
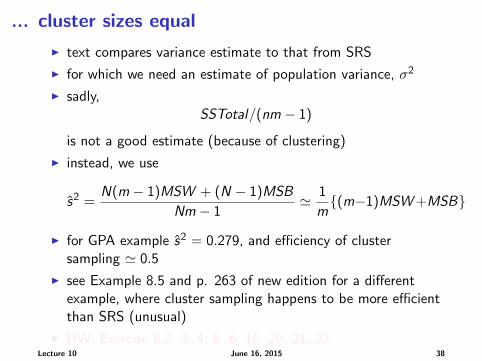
... cluster sizes equal
I text compares variance estimate to that from SRS
I for which we need an estimate of population variance, σ2
I sadly,SSTotal/(nm − 1)
is not a good estimate (because of clustering)
I instead, we use
s2 =N(m − 1)MSW + (N − 1)MSB
Nm − 1' 1
m{(m−1)MSW+MSB}
I for GPA example s2 = 0.279, and efficiency of clustersampling ' 0.5
I see Example 8.5 and p. 263 of new edition for a differentexample, where cluster sampling happens to be more efficientthan SRS (unusual)
I HW: Exercise 8.2, 3, 4, 5, 6, 16, 20, 21, 22Lecture 10 June 16, 2015 39
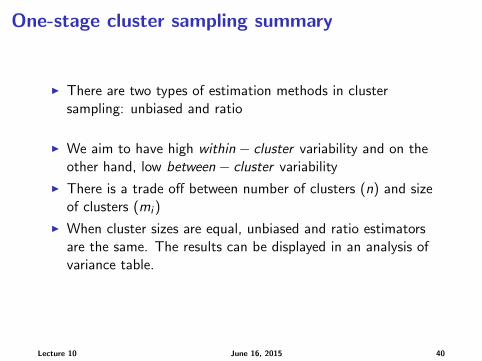
One-stage cluster sampling summary
I There are two types of estimation methods in clustersampling: unbiased and ratio
I We aim to have high within − cluster variability and on theother hand, low between − cluster variability
I There is a trade off between number of clusters (n) and sizeof clusters (mi )
I When cluster sizes are equal, unbiased and ratio estimatorsare the same. The results can be displayed in an analysis ofvariance table.
Lecture 10 June 16, 2015 40
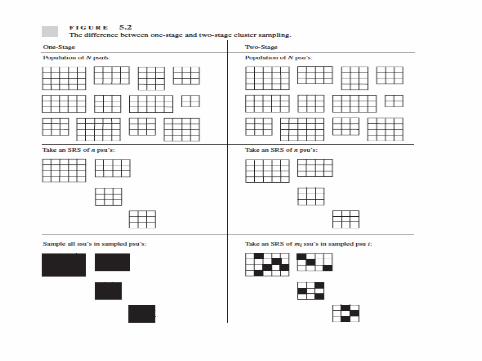

Two-stage cluster sampling Ch. 9
I select a sample of clusters, called primary sampling units – psu
I usually by SRS
I select a random sample of units within each cluster, calledsecondary sampling units – ssu
I also often by SRS
I but could use stratified random sampling at any step
I or even more complicated probability sampling methods
I as with one-stage cluster sampling, easier/cheaper/safer, dueto geographic proximity of elements within a cluster (often)
I can be used without a list of all population elements, justneed a list of population clusters, and then a list of ssu’s foreach sampled cluster
I example: sample universities (psu); sample students at chosenuniversities (ssu)
Lecture 10 June 16, 2015 42
Two-stage cluster sampling Ch. 9
I select a sample of clusters, called primary sampling units – psu
I usually by SRS
I select a random sample of units within each cluster, calledsecondary sampling units – ssu
I also often by SRS
I but could use stratified random sampling at any step
I or even more complicated probability sampling methods
I as with one-stage cluster sampling, easier/cheaper/safer, dueto geographic proximity of elements within a cluster (often)
I can be used without a list of all population elements, justneed a list of population clusters, and then a list of ssu’s foreach sampled cluster
I example: sample universities (psu); sample students at chosenuniversities (ssu)
Lecture 10 June 16, 2015 43
Two-stage cluster sampling Ch. 9
I select a sample of clusters, called primary sampling units – psu
I usually by SRS
I select a random sample of units within each cluster, calledsecondary sampling units – ssu
I also often by SRS
I but could use stratified random sampling at any step
I or even more complicated probability sampling methods
I as with one-stage cluster sampling, easier/cheaper/safer, dueto geographic proximity of elements within a cluster (often)
I can be used without a list of all population elements, justneed a list of population clusters, and then a list of ssu’s foreach sampled cluster
I example: sample universities (psu); sample students at chosenuniversities (ssu)
Lecture 10 June 16, 2015 44
Two-stage cluster sampling Ch. 9
I select a sample of clusters, called primary sampling units – psu
I usually by SRS
I select a random sample of units within each cluster, calledsecondary sampling units – ssu
I also often by SRS
I but could use stratified random sampling at any step
I or even more complicated probability sampling methods
I as with one-stage cluster sampling, easier/cheaper/safer, dueto geographic proximity of elements within a cluster (often)
I can be used without a list of all population elements, justneed a list of population clusters, and then a list of ssu’s foreach sampled cluster
I example: sample universities (psu); sample students at chosenuniversities (ssu)
Lecture 10 June 16, 2015 45
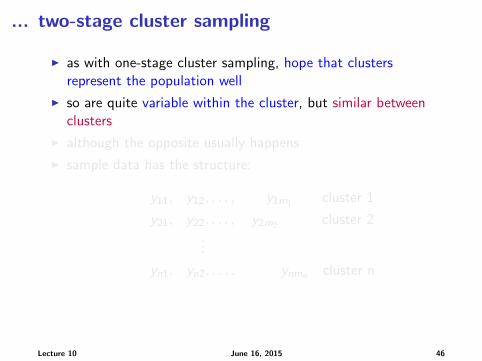
... two-stage cluster sampling
I as with one-stage cluster sampling, hope that clustersrepresent the population well
I so are quite variable within the cluster, but similar betweenclusters
I although the opposite usually happens
I sample data has the structure:
y11, y12, . . . , y1m1 cluster 1
y21, y22, . . . , y2m2 cluster 2...
yn1, yn2, . . . , ynmn cluster n
Lecture 10 June 16, 2015 46
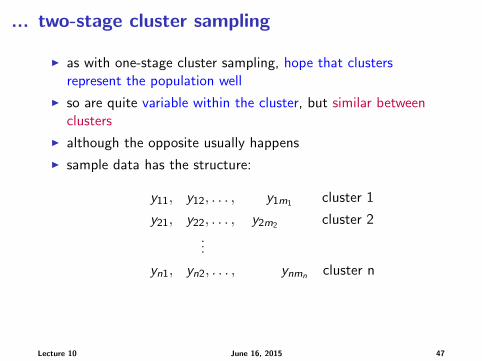
... two-stage cluster sampling
I as with one-stage cluster sampling, hope that clustersrepresent the population well
I so are quite variable within the cluster, but similar betweenclusters
I although the opposite usually happens
I sample data has the structure:
y11, y12, . . . , y1m1 cluster 1
y21, y22, . . . , y2m2 cluster 2...
yn1, yn2, . . . , ynmn cluster n
Lecture 10 June 16, 2015 47
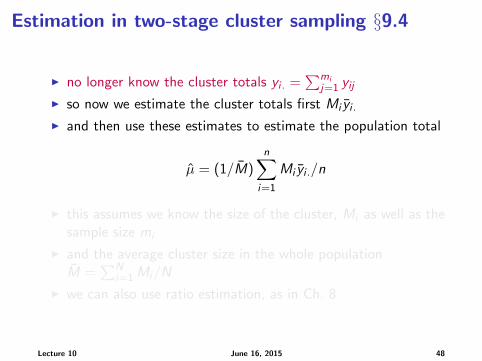
Estimation in two-stage cluster sampling §9.4
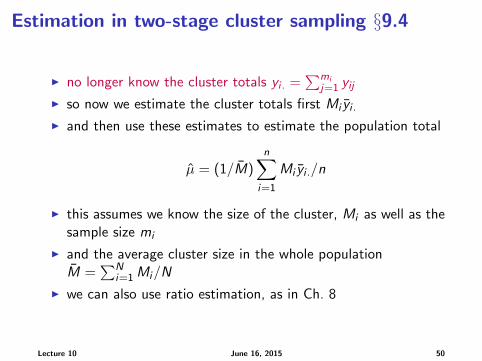
I no longer know the cluster totals yi . =∑mi
j=1 yijI so now we estimate the cluster totals first Mi yi .I and then use these estimates to estimate the population total
µ = (1/M)n∑
i=1
Mi yi ./n
I this assumes we know the size of the cluster, Mi as well as thesample size mi
I and the average cluster size in the whole populationM =
∑Ni=1Mi/N
I we can also use ratio estimation, as in Ch. 8
Lecture 10 June 16, 2015 48
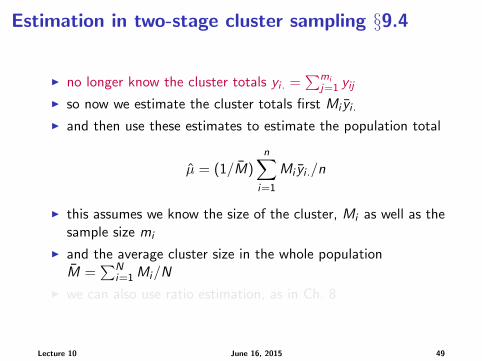
Estimation in two-stage cluster sampling §9.4
I no longer know the cluster totals yi . =∑mi
j=1 yijI so now we estimate the cluster totals first Mi yi .I and then use these estimates to estimate the population total
µ = (1/M)n∑
i=1
Mi yi ./n
I this assumes we know the size of the cluster, Mi as well as thesample size mi
I and the average cluster size in the whole populationM =
∑Ni=1Mi/N
I we can also use ratio estimation, as in Ch. 8
Lecture 10 June 16, 2015 49
Estimation in two-stage cluster sampling §9.4
I no longer know the cluster totals yi . =∑mi
j=1 yijI so now we estimate the cluster totals first Mi yi .I and then use these estimates to estimate the population total
µ = (1/M)n∑
i=1
Mi yi ./n
I this assumes we know the size of the cluster, Mi as well as thesample size mi
I and the average cluster size in the whole populationM =
∑Ni=1Mi/N
I we can also use ratio estimation, as in Ch. 8
Lecture 10 June 16, 2015 50
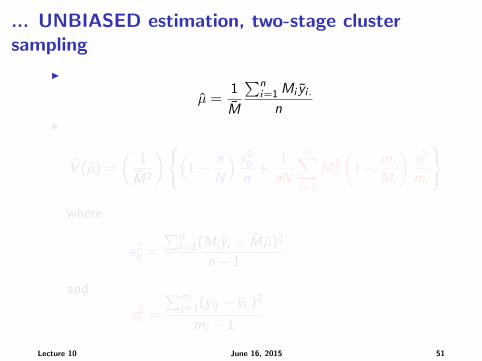
... UNBIASED estimation, two-stage clustersampling
I
µ =1
M
∑ni=1Mi yi .
nI
V (µ) =
(1
M2
){(1− n
N
) s2bn
+1
nN
n∑i=1
M2i
(1− mi
Mi
)s2imi
}
where
s2b =
∑ni=1(Mi yi − Mµ)2
n − 1
and
s2i =
∑mij=1(yij − yi .)
2
mi − 1
Lecture 10 June 16, 2015 51

... UNBIASED estimation, two-stage clustersampling
I
µ =1
M
∑ni=1Mi yi .
nI
V (µ) =
(1
M2
){(1− n
N
) s2bn
+1
nN
n∑i=1
M2i
(1− mi
Mi
)s2imi
}
where
s2b =
∑ni=1(Mi yi − Mµ)2
n − 1
and
s2i =
∑mij=1(yij − yi .)
2
mi − 1
Lecture 10 June 16, 2015 52
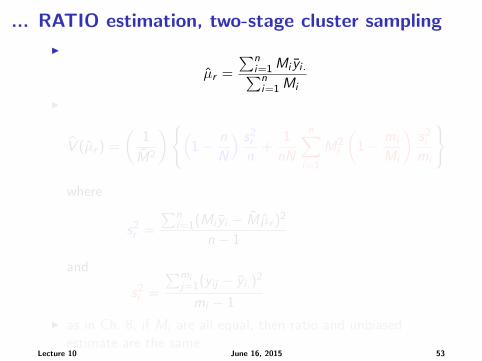
... RATIO estimation, two-stage cluster sampling
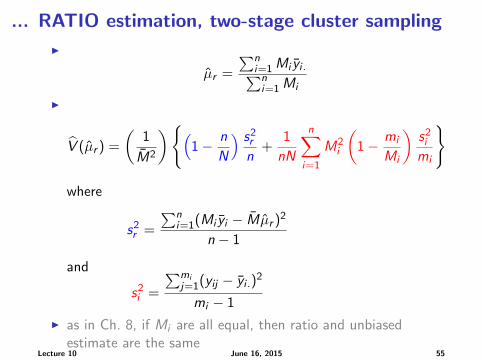
I
µr =
∑ni=1Mi yi .∑ni=1Mi
I
V (µr ) =
(1
M2
){(1− n
N
) s2rn
+1
nN
n∑i=1
M2i
(1− mi
Mi
)s2imi
}
where
s2r =
∑ni=1(Mi yi − Mµr )2
n − 1
and
s2i =
∑mij=1(yij − yi .)
2
mi − 1
I as in Ch. 8, if Mi are all equal, then ratio and unbiasedestimate are the same
Lecture 10 June 16, 2015 53
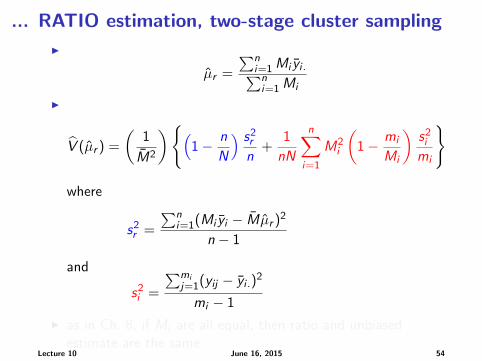
... RATIO estimation, two-stage cluster sampling
I
µr =
∑ni=1Mi yi .∑ni=1Mi
I
V (µr ) =
(1
M2
){(1− n
N
) s2rn
+1
nN
n∑i=1
M2i
(1− mi
Mi
)s2imi
}
where
s2r =
∑ni=1(Mi yi − Mµr )2
n − 1
and
s2i =
∑mij=1(yij − yi .)
2
mi − 1
I as in Ch. 8, if Mi are all equal, then ratio and unbiasedestimate are the same
Lecture 10 June 16, 2015 54
... RATIO estimation, two-stage cluster sampling
I
µr =
∑ni=1Mi yi .∑ni=1Mi
I
V (µr ) =
(1
M2
){(1− n
N
) s2rn
+1
nN
n∑i=1
M2i
(1− mi
Mi
)s2imi
}
where
s2r =
∑ni=1(Mi yi − Mµr )2
n − 1
and
s2i =
∑mij=1(yij − yi .)
2
mi − 1
I as in Ch. 8, if Mi are all equal, then ratio and unbiasedestimate are the same
Lecture 10 June 16, 2015 55
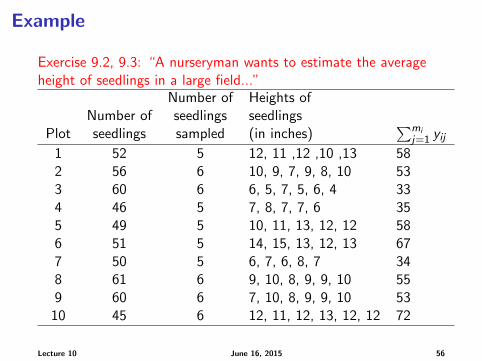
Example
Exercise 9.2, 9.3: “A nurseryman wants to estimate the averageheight of seedlings in a large field...”
Number of Heights ofNumber of seedlings seedlings
Plot seedlings sampled (in inches)∑mi
j=1 yij1 52 5 12, 11 ,12 ,10 ,13 582 56 6 10, 9, 7, 9, 8, 10 533 60 6 6, 5, 7, 5, 6, 4 334 46 5 7, 8, 7, 7, 6 355 49 5 10, 11, 13, 12, 12 586 51 5 14, 15, 13, 12, 13 677 50 5 6, 7, 6, 8, 7 348 61 6 9, 10, 8, 9, 9, 10 559 60 6 7, 10, 8, 9, 9, 10 53
10 45 6 12, 11, 12, 13, 12, 12 72
Lecture 10 June 16, 2015 56
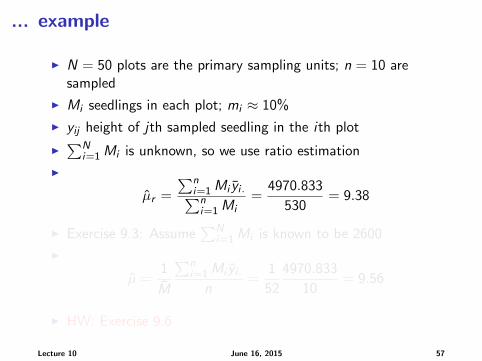
... example
I N = 50 plots are the primary sampling units; n = 10 aresampled
I Mi seedlings in each plot; mi ≈ 10%
I yij height of jth sampled seedling in the ith plot
I∑N
i=1Mi is unknown, so we use ratio estimation
I
µr =
∑ni=1Mi yi .∑ni=1Mi
=4970.833
530= 9.38
I Exercise 9.3: Assume∑N
i=1Mi is known to be 2600
I
µ =1
M
∑ni=1Mi yi .
n=
1
52
4970.833
10= 9.56
I HW: Exercise 9.6
Lecture 10 June 16, 2015 57
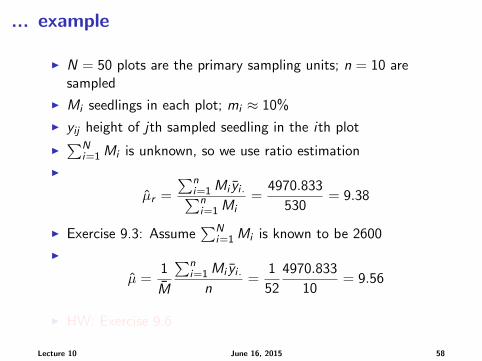
... example
I N = 50 plots are the primary sampling units; n = 10 aresampled
I Mi seedlings in each plot; mi ≈ 10%
I yij height of jth sampled seedling in the ith plot
I∑N
i=1Mi is unknown, so we use ratio estimation
I
µr =
∑ni=1Mi yi .∑ni=1Mi
=4970.833
530= 9.38
I Exercise 9.3: Assume∑N
i=1Mi is known to be 2600
I
µ =1
M
∑ni=1Mi yi .
n=
1
52
4970.833
10= 9.56
I HW: Exercise 9.6
Lecture 10 June 16, 2015 58
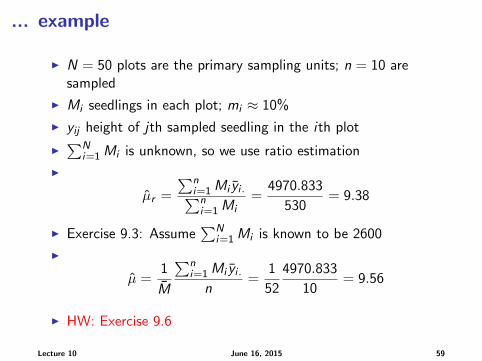
... example
I N = 50 plots are the primary sampling units; n = 10 aresampled
I Mi seedlings in each plot; mi ≈ 10%
I yij height of jth sampled seedling in the ith plot
I∑N
i=1Mi is unknown, so we use ratio estimation
I
µr =
∑ni=1Mi yi .∑ni=1Mi
=4970.833
530= 9.38
I Exercise 9.3: Assume∑N
i=1Mi is known to be 2600
I
µ =1
M
∑ni=1Mi yi .
n=
1
52
4970.833
10= 9.56
I HW: Exercise 9.6
Lecture 10 June 16, 2015 59