st Transportation Research Board (TRB) Annual Meeting ... _SJR.pdf · 91st Transportation Research...
39
91 st Transportation Research Board (TRB) Annual Meeting January 23, 2012 The State of the Intelligent Transportation Systems Industry Session # 316 Shelley Row Director Intelligent Transportation Systems Joint Program Office Research and Innovative Technology Administration, USDOT
Transcript of st Transportation Research Board (TRB) Annual Meeting ... _SJR.pdf · 91st Transportation Research...

91st Transportation Research Board (TRB) Annual Meeting
January 23, 2012
The State of the Intelligent Transportation Systems Industry
Session # 316
Shelley Row Director
Intelligent Transportation Systems Joint Program Office Research and Innovative Technology Administration, USDOT

2 U.S. Department of Transportation
1992 Best Movie
3 U.S. Department of Transportation
Strategic Plan for IVHS
4 U.S. Department of Transportation
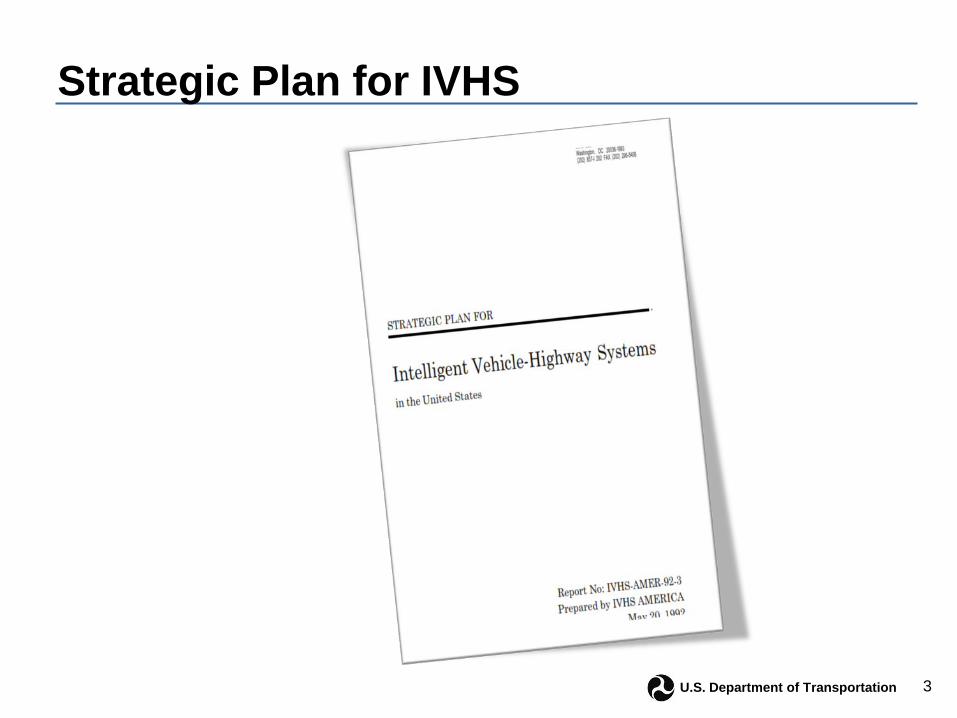
20-Year Look Back Top level view of the 20-year vision
established by planners: Implementation of a national ITS
Program Scope comparable to Interstate
Highway System, but major difference – NOT exclusively a Government program Public-private sector partnerships –
with major private sector involvement National system of travel support
operating mode-to-mode and state-to-state to promote safe, expeditious, environmentally safe, and economic movement of people and goods A vigorous US ITS industry

5 U.S. Department of Transportation
INTERMODAL SURFACE TRANSPORTATION EFFICIENCY ACT (ISTEA) – 1991

6 U.S. Department of Transportation
20-Year Look Back: ISTEA Highlights New innovative technology research for transportation Organize & categorize functional areas – establish a common language Find out what works and what does not work – identify barriers to deployment
Operational Tests Deployment
ISTEA was the era of: □ Field Operational Tests – deployment in an
operational setting, bridge between R&D and Deployment – and evaluate deployment impacts
□ Priority Corridor Program □ Early Deployment Planning Studies –
planning for deployment at the local level □ Architecture Development Initiated (1994)
– private sector firms partnering to develop □ CVISN Initiated □ Metropolitan Model Deployment Initiatives □ Standards Program starts up (1996) with a
list of critical interfaces □ Sec. Peña Operation Timesaver (1996) –
75 metro areas (expanded to 78) □ Deployment Tracking – Definition of
metrics for evaluation □ AHS Demonstration – Possibilities of
vehicle-infrastructure cooperation

7 U.S. Department of Transportation
Transportation Equity Act for the 21st Century (TEA-21) 1998

8 U.S. Department of Transportation
20-Year Look Back: TEA-21 TEA-21 (July 1998 – September 2005) funded two separate activities: ITS Research and Development Program
□ Reaffirms Department’s role in advancing research, development and integrated deployment of ITS
□ Creation and testing of vehicle infrastructure integration systems □ Address policy and institutional issues uncovered during ISTEA ITS Deployment Program
□ ITS Integration Program □ Commercial Vehicle ITS Infrastructure (CVISN) Deployment
Program
Integrated Deployment Deployment Earmarks

9 U.S. Department of Transportation
20-Year Look Back: TEA-21 Other TEA-21 milestones

10 U.S. Department of Transportation
Safe, Accountable, Flexible, Efficient Transportation Equity Act: A Legacy for Users (SAFETEA-LU)
2005

11 U.S. Department of Transportation
20-Year Look Back: SAFETEA-LU Concept of deploying/integrating ITS is portrayed as in the mainstream
of transportation Congress enacts Safe, Accountable, Flexible, Efficient Transportation
Equity Act: A Legacy for Users (SAFETEA-LU) – ITS Deployment Program NOT renewed JPO focuses on development of fewer, high-impact, high-value projects
to showcase benefits of ITS. Connected vehicle emerges as the emphasis. ITS Research Program focuses on connected vehicles. Modal administrations lead in operations and deployment. ITS is
growing part of “mainstream” programs.
Connected Vehicle Research Performance Management

12 U.S. Department of Transportation
2012
How have we done with ITS deployment?
13 U.S. Department of Transportation
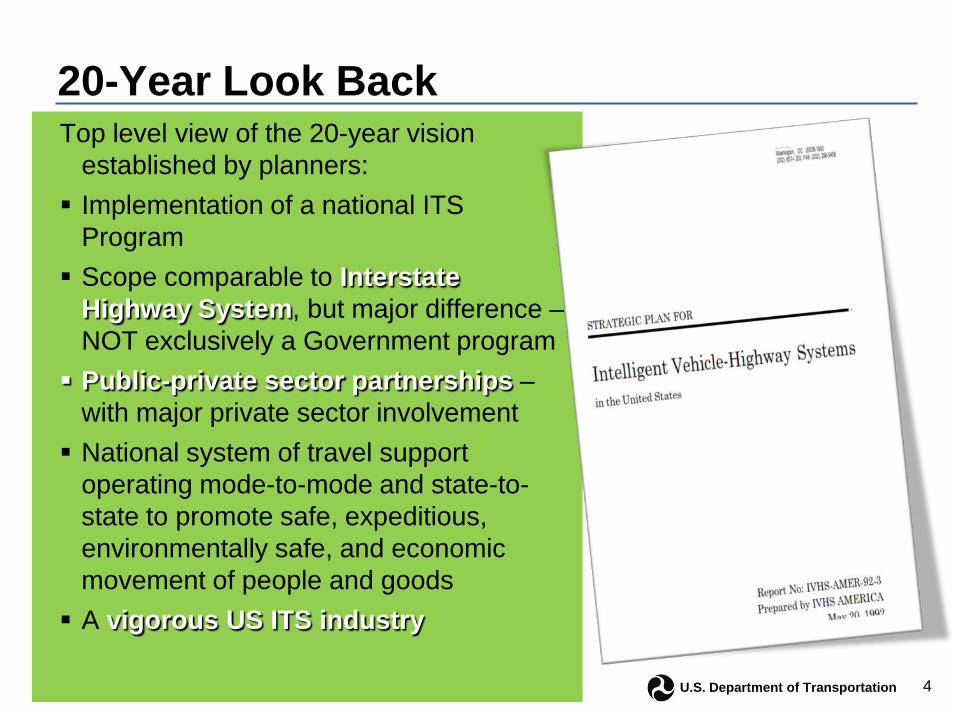
Near-Term (1992-1996) Mid-Term (1997-2001) Long-Term (2002-2011) Productivity Enhancements
• Productivity management systems for commercial and transit fleets
• Electronic toll collection • Electronic transit fee collection • Electronic credential checking
• Electronic record-keeping for vehicle fleet operations
• Integrated electronic transit fare, parking, and toll collection
• Automated HOV lane use verification
• Transparent borders for commercial vehicles
• Fully integrated transportation user-fee collection systems
77% of 117 fixed bus route agencies have AVL & real-time arrival data in fleets 16,000+ fixed route buses equipped with smart card readers 451 heavy/rapid rail station equipped with smart cards Electronic Toll Collection:
□ 99% of Toll plazas □ 94% Toll lanes
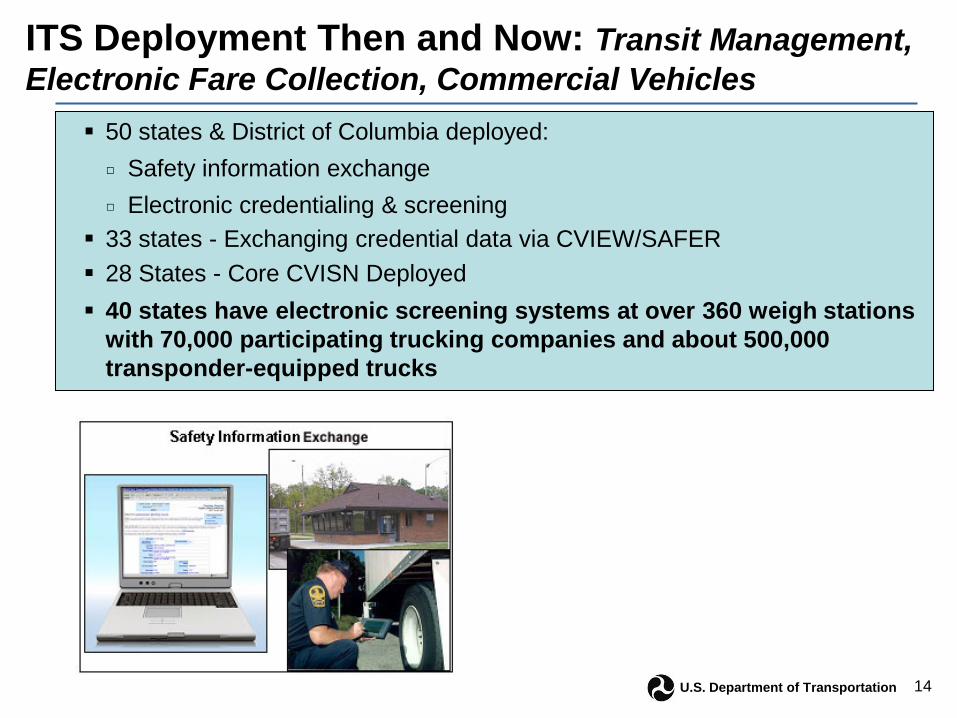
ITS Deployment Then and Now: Transit Management, Electronic Fare Collection, Commercial Vehicles
14 U.S. Department of Transportation
50 states & District of Columbia deployed: □ Safety information exchange □ Electronic credentialing & screening
33 states - Exchanging credential data via CVIEW/SAFER 28 States - Core CVISN Deployed 40 states have electronic screening systems at over 360 weigh stations
with 70,000 participating trucking companies and about 500,000 transponder-equipped trucks
ITS Deployment Then and Now: Transit Management, Electronic Fare Collection, Commercial Vehicles
15 U.S. Department of Transportation
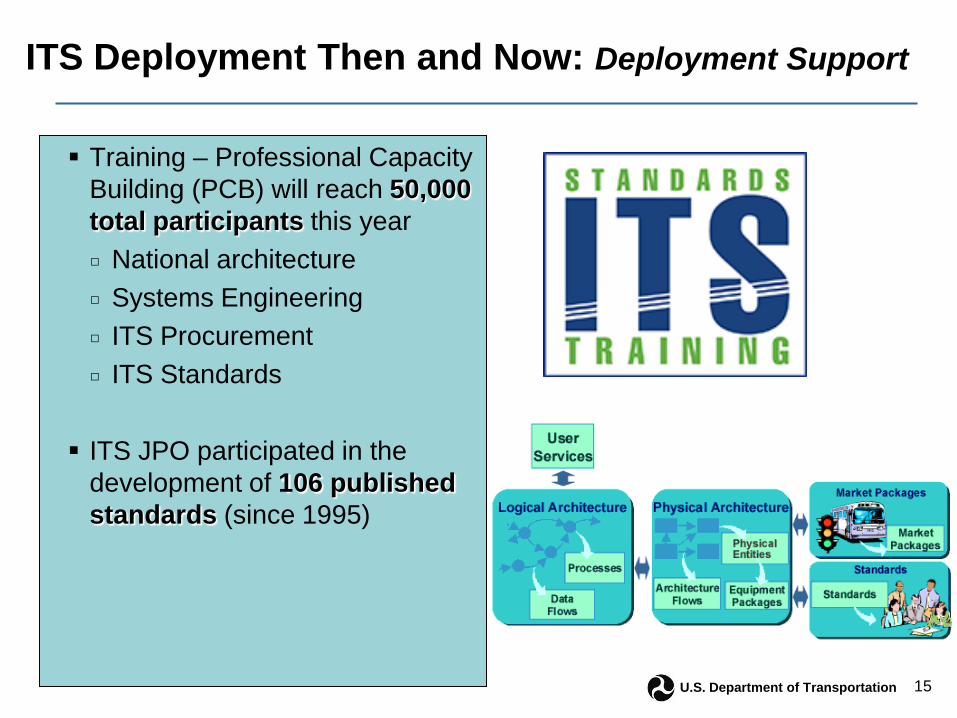
Training – Professional Capacity Building (PCB) will reach 50,000 total participants this year □ National architecture □ Systems Engineering □ ITS Procurement □ ITS Standards ITS JPO participated in the
development of 106 published standards (since 1995)
ITS Deployment Then and Now: Deployment Support

16 U.S. Department of Transportation
Near-Term (1992-1996) Mid-Term (1997-2001) Long-Term (2002-2011) Transportation Management
Local area traffic monitoring and control for 15 metro area corridors
Area-wide, real-time, adaptive traffic and transit fleet control for corridors in 50 metro areas and 25 inter-city corridors
Area-wide, full-featured systems to manage intermodal surface transportation nationwide in large urban areas and major rural corridors
ITS Deployment Then and Now: Freeway and Arterial Management
266 Operational Traffic Management Centers (TMCs) For collection of travel times:
□ 7700 freeway miles under surveillance from roadside infrastructure □ 4500 miles under surveillance from vehicle probes □ 54% of all freeways in 75 metro areas are under surveillance

17 U.S. Department of Transportation
Near-Term (1992-1996) Mid-Term (1997-2001) Long-Term (2002-2011) Transportation Management
Local area traffic monitoring and control for 15 metro area corridors
Area-wide, real-time, adaptive traffic and transit fleet control for corridors in 50 metro areas and 25 inter-city corridors
Area-wide, full-featured systems to manage intermodal surface transportation nationwide in large urban areas and major rural corridors
ITS Deployment Then and Now: Freeway and Arterial Management
For collection of travel times: □ 2464 arterial miles under surveillance from roadside infrastructure □ 1730 miles under surveillance from vehicle probes □ 50% of intersections in 75 metro are under electronic surveillance

18 U.S. Department of Transportation
Vehicle Probes

19 U.S. Department of Transportation
Growth in Vehicle Probe Data
April 2009 January 2012
• 15 minute snapshot of incoming GPS data (fleets, cars, phones, apps, etc.) – Source INRIX®
Courtesy: INRIX

20 U.S. Department of Transportation
Rise and Fall of Gadgets
NOTE: 2010 data are estimates and 2011 data are projections. GRAPHIC: Alicia Parlapiano / The Washington Post - January 10, 2011

21 U.S. Department of Transportation
0
500
1000
1500
2000
2500
3000
3500
4000
4500
0%
10%
20%
30%
40%
50%
60%
70%
80%
90%
100%
1997
1998
1999
2000
2001
2002
2003
2004
2005
2006
2007
2008
2009
2010
Num
ber o
f Dyn
amic
Mes
sage
Sig
ns D
eplo
yed
% F
reew
ay M
iles
Freeway Management Deployment Indicators
%Freeway miles with real-time traffic data collection technologies
%Freeway miles covered by surveillance cameras (CCTV)
Number of Dynamic Message Signs (DMS)

22 U.S. Department of Transportation
Near-Term (1992-1996) Mid-Term (1997-2001) Long-Term (2002-2011) Traveler Information Systems
• Transportation data available at home, work, public kiosks, stations, and through hand-held devices
• Static route guidance with business/tourist data in new vehicles and as after-market product
• Real-time transportation system condition information for regional and rural travel and multiple modes of transportation
• Route guidance reflecting dynamic traffic conditions
• In-vehicle display of road signs
• Multi-modal demand-responsive information systems
• Area-wide transportation control integrated with optimal routing
511 coverage for all or parts of 38 states covering 70% of US population 36 of 40 metro areas and 58 locations use travel time on DMS 109 freeway management agencies report posting traveler information
on DMS
ITS Deployment Then and Now: Traveler Information

23 U.S. Department of Transportation 23
Twitter & other Social Networking Site 40%

24 U.S. Department of Transportation
Sample of companies providing traveler information: □ INRIX □ TrafficLand □ Speed Info □ Navteq
ITS Deployment Then and Now: Traveler Information

26 U.S. Department of Transportation
US New Traffic Subscribers 1996 to 2011
0
5000000
10000000
15000000
20000000
25000000
30000000
1994 1995 1996 1997 1998 1999 2000 2001 2002 2003 2004 2005 2006 2007 2008 2009 2010 2011
Smartphone navigation devices - New Traffic Service users
Dedicated portable navigation devices - New Traffic Service users
Factory Fitted System - New Traffic Service users
Courtesy: Navteq

27 U.S. Department of Transportation
2012: In fact, the connected car ” is the third-fastest growing technological device, following smartphones and tablets,” said Intel in a statement Wednesday. – CEO Outlook

28 U.S. Department of Transportation
Near-Term (1992-1996) Mid-Term (1997-2001) Long-Term (2002-2011) Safety and Driver Assistance
• Roadway and environment safety systems
• Near-obstacle warning • Simple vehicle performance
monitoring • Adaptive cruise control
• Automated highway demonstration
• Semi-automated Mayday capability
• Passenger security systems • Vehicle monitoring systems • Collision warning • Automated collision avoidance
• Automated vehicle operation on specially equipped roadways
• Fully automated Mayday systems with coordinated dispatching
• Intersection hazard warnings
ITS Deployment Then and Now: Vehicle Safety Systems

29 U.S. Department of Transportation
Crashes Avoidance Has Arrived
Functions □ Electronic Stability Control □ Adaptive Cruise Control □ Forward collision warning/avoidance □ Lane departure warning / avoidance □ Blind spot warning / avoidance □ Pedestrian warning / avoidance □ Driver Alert (fatigue) □ Night Vision □ Speed Sign Recognition
XC60
Courtesy: Bishop Consulting

30 U.S. Department of Transportation
Today’s Intelligent Vehicles - What’s Available in a $20,000 Car?
Adaptive cruise control Forward Collision Mitigation Blind spot information system
Traffic sign recognition Lane keeping aid
Driver alert
2012 Ford Focus
Courtesy: Bishop Consulting

31 U.S. Department of Transportation
Connected Vehicle Program

32 U.S. Department of Transportation
NHTSA Agency Decision - 2013
• Evaluation includes several factors: • Technical functionality
• Vehicle-based technology • Security network and back end functions
• Effectiveness of applications – Safety Pilot • Cost Effective • Supportable operationally
• Well managed • Sustainable financially
33 U.S. Department of Transportation
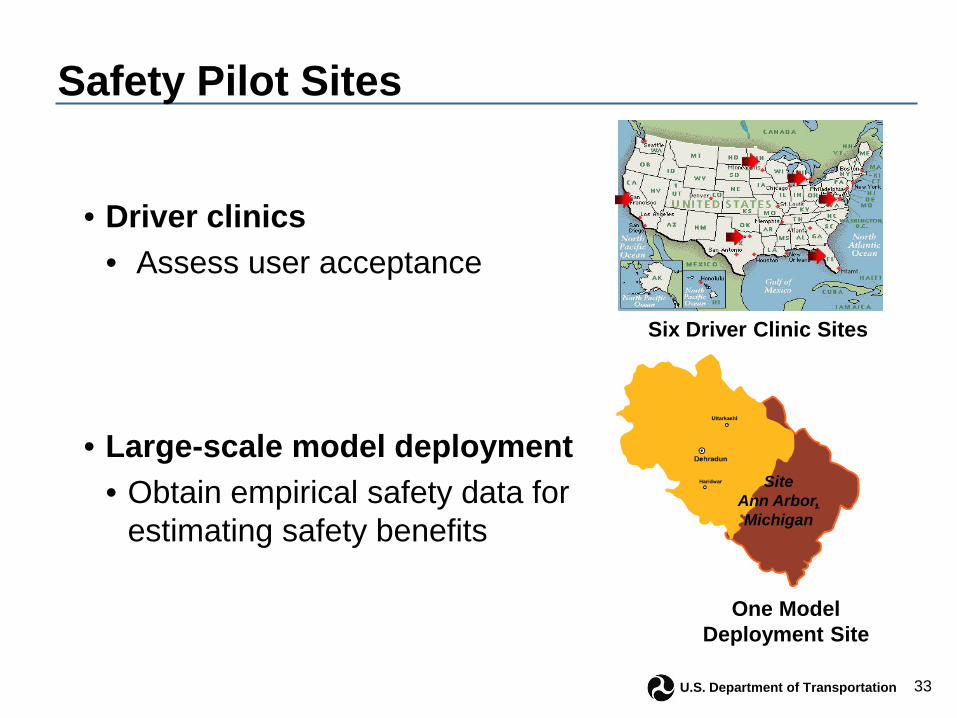
Safety Pilot Sites
• Driver clinics • Assess user acceptance
• Large-scale model deployment • Obtain empirical safety data for
estimating safety benefits
Six Driver Clinic Sites
Site Ann Arbor, Michigan
One Model Deployment Site

34 U.S. Department of Transportation
Critical Questions
Which communications media can support the needs for distributing security certificates? Choices include:
□ Existing Cellular Networks
□ Dedicated Short Range Communications (DSRC)
□ WiFi
□ No infrastructure option
All security network options require financing for operational support
□ All public – politically feasible?
□ Public/private partnership – what type of framework?
□ All private – where’s the value?
35 U.S. Department of Transportation
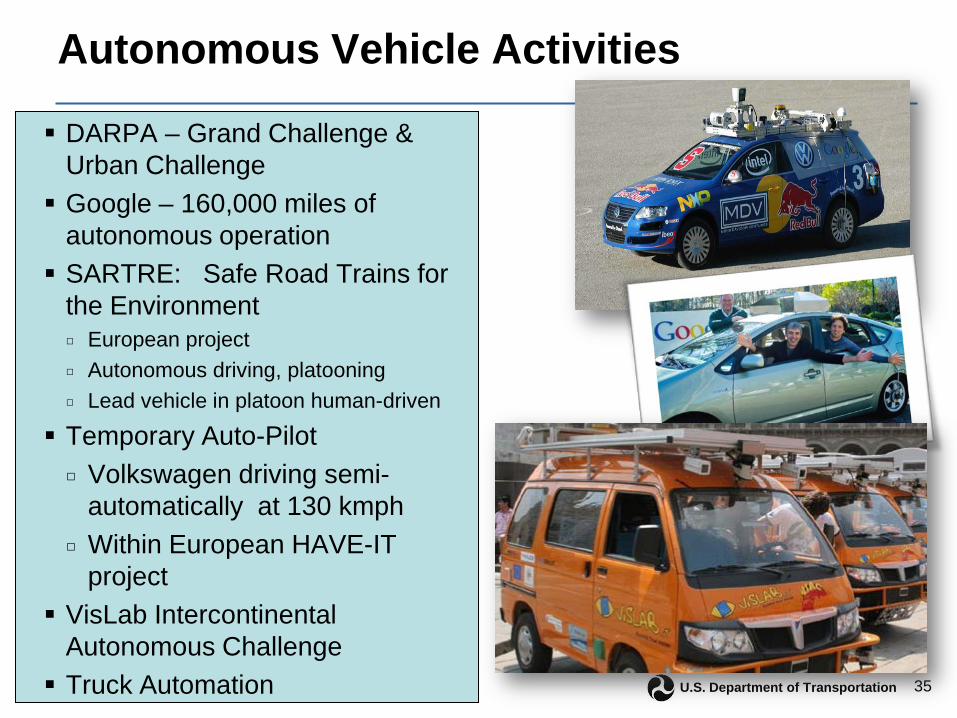
Autonomous Vehicle Activities
DARPA – Grand Challenge & Urban Challenge Google – 160,000 miles of
autonomous operation SARTRE: Safe Road Trains for
the Environment □ European project □ Autonomous driving, platooning □ Lead vehicle in platoon human-driven
Temporary Auto-Pilot □ Volkswagen driving semi-
automatically at 130 kmph □ Within European HAVE-IT
project VisLab Intercontinental
Autonomous Challenge Truck Automation

36 U.S. Department of Transportation
Future Technology Evolution
0102030405060708090
100
vehicle basedconnectedautonomous

37 U.S. Department of Transportation
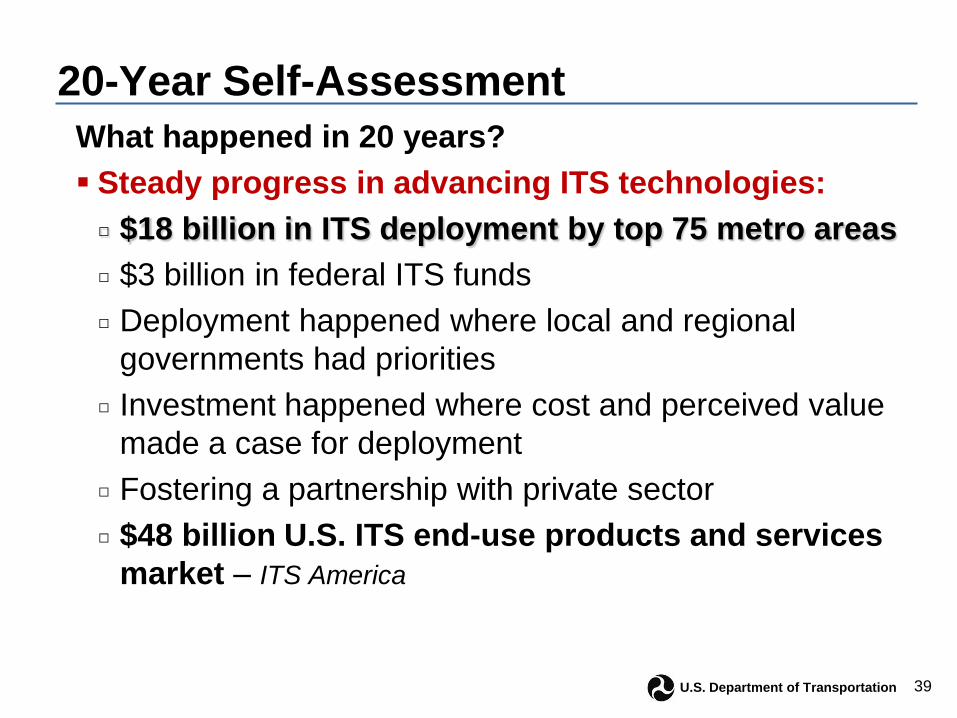
20-Year Self-Assessment What happened in 20 years? Steady progress in advancing ITS technologies: □ $18 billion in ITS deployment by top 75 metro areas □ $3 billion in federal ITS funds □ Deployment happened where local and regional
governments had priorities □ Investment happened where cost and perceived value
made a case for deployment □ Fostering a partnership with private sector □ $48 billion U.S. ITS end-use products and services
market – ITS America

38 U.S. Department of Transportation 38
79%
39 U.S. Department of Transportation
20-Year Self-Assessment What happened in 20 years? Steady progress in advancing ITS technologies: □ $18 billion in ITS deployment by top 75 metro areas □ $3 billion in federal ITS funds □ Deployment happened where local and regional
governments had priorities □ Investment happened where cost and perceived value
made a case for deployment □ Fostering a partnership with private sector □ $48 billion U.S. ITS end-use products and services
market – ITS America

40 U.S. Department of Transportation
20-Year Look Back: Closing Thoughts ITS is not the Interstate System model ITS is model of state and local government choice ITS is a public and private sector success story
The ITS deployment glass is more than half full