ST Segment and T Wave Abnormalities Not Caused - Kalluskallus.com/er/resident/julycourse/reading/non...
21
ST Segment and T Wave Abnormalities Not Caused by Acute Coronary Syndromes William J. Brady, MD Department of Emergency Medicine, University of Virginia School of Medicine, Charlottesville, VA 22911, USA The evaluation of the chest pain patient suspected of acute coronary syn- drome (ACS) represents the major indication for electrocardiograph (ECG) performance in the emergency department (ED) and prehospital settings [1]. The ECG demonstrates significant abnormality in a minority of these pa- tients, ranging from minimal nonspecific ST segment/T wave changes to pronounced STE and T wave abnormalities, including the prominent T wave, the inverted T wave, and the nonspecific T wave (Figs. 1 and 2). The ECG syndromes responsible for these various abnormalities include po- tentially malignant entities, such as ACS and cardiomyopathy, and less con- cerning patterns, such as benign early repolarization (BER) or ventricular paced rhythms (VPR) [2–4]. In a study considering all chest pain patients with electrocardiographic ST segment depression (STD), the following clinical syndromes were re- sponsible for the ECG abnormality: ACS, 26%; left ventricular hypertrophy (LVH), 43%; bundle branch block (BBB), 21%; VPR, 5%; left ventricular aneurysm, 3%; and other patterns, 1% [5]. Similarly, STE is a fairly com- mon finding on the ECG of the chest pain patient and frequently does not indicate STE acute myocardial infarction (AMI). One prehospital study of adult chest pain patients revealed that, of patients manifesting STE who met criteria for fibrinolysis, most were not diagnosed with AMI; rather, LVH and left BBB were found more frequently [6]. Furthermore, in two re- views of adult ED chest pain patients with STE on ECG, the ST segment abnormality resulted from AMI in only 15%–31% of these populations; LVH, seen in 28%–30% of these patients, was a frequent cause of this STE. Other findings responsible for this STE included BER, acute E-mail address: [email protected] 0733-8627/06/$ - see front matter Ó 2005 Elsevier Inc. All rights reserved. doi:10.1016/j.emc.2005.08.004 emed.theclinics.com Emerg Med Clin N Am 24 (2006) 91–111
Transcript of ST Segment and T Wave Abnormalities Not Caused - Kalluskallus.com/er/resident/julycourse/reading/non...

Emerg Med Clin N Am 24 (2006) 91–111
ST Segment and T Wave AbnormalitiesNot Caused by AcuteCoronary Syndromes
William J. Brady, MDDepartment of Emergency Medicine, University of Virginia School of Medicine,
Charlottesville, VA 22911, USA
The evaluation of the chest pain patient suspected of acute coronary syn-drome (ACS) represents the major indication for electrocardiograph (ECG)performance in the emergency department (ED) and prehospital settings [1].The ECG demonstrates significant abnormality in a minority of these pa-tients, ranging from minimal nonspecific ST segment/T wave changes topronounced STE and T wave abnormalities, including the prominent Twave, the inverted T wave, and the nonspecific T wave (Figs. 1 and 2).The ECG syndromes responsible for these various abnormalities include po-tentially malignant entities, such as ACS and cardiomyopathy, and less con-cerning patterns, such as benign early repolarization (BER) or ventricularpaced rhythms (VPR) [2–4].
In a study considering all chest pain patients with electrocardiographicST segment depression (STD), the following clinical syndromes were re-sponsible for the ECG abnormality: ACS, 26%; left ventricular hypertrophy(LVH), 43%; bundle branch block (BBB), 21%; VPR, 5%; left ventricularaneurysm, 3%; and other patterns, 1% [5]. Similarly, STE is a fairly com-mon finding on the ECG of the chest pain patient and frequently doesnot indicate STE acute myocardial infarction (AMI). One prehospital studyof adult chest pain patients revealed that, of patients manifesting STE whomet criteria for fibrinolysis, most were not diagnosed with AMI; rather,LVH and left BBB were found more frequently [6]. Furthermore, in two re-views of adult ED chest pain patients with STE on ECG, the ST segmentabnormality resulted from AMI in only 15%–31% of these populations;LVH, seen in 28%–30% of these patients, was a frequent cause of thisSTE. Other findings responsible for this STE included BER, acute
E-mail address: [email protected]
0733-8627/06/$ - see front matter � 2005 Elsevier Inc. All rights reserved.
doi:10.1016/j.emc.2005.08.004 emed.theclinics.com

92 BRADY
myopericarditis, BBB, VPR, and ventricular aneurysm [7,8]. In a criticalcare unit setting, Miller et al [9] showed that STE was noted frequently,yet was responsible for AMI in only 50% of patients.
This article discusses the non-ACS causes of ST segment/T wave abnor-malities, highlighting differentiation from STE associated with ACS.
Benign early repolarization
BER is a normal electrocardiographic variant with no known associationwith cardiac dysfunction or disease. BER describes a pattern of STE withprominent T waves most often seen in the precordial leads. A recent inves-tigation demonstrated a BER prevalence of 29% among patients undergo-ing a screening health examination. Patients who had early repolarizationwere more likely to be male, were younger (less than age 40 years), andtended to be more athletically active compared with those individuals with-out the early repolarization pattern. The long-term health of these patientswho had BER was equivalent to the control population [10]. In anotherlarge study of BER, the mean age of patients was 39 years (range, 16–80years); although the pattern was seen across this rather broad age range,it was encountered predominantly in patients less than age 50 years andrarely seen in individuals older than age 70 years [11]. The BER pattern isseen much more often in men than in women. BER is encountered most fre-quently in younger black men (20–40 years of age) [12].
The electrocardiographic characterization of the BER pattern (Figs. 3–5)includes the following features: STE [1]; concavity of the initial, upsloping
Fig. 1. Electrocardiographic differential diagnosis of T wave abnormalitiesdprominent, in-
verted, and nonspecific in non-ACS syndromes.

93ST SEGMENT AND T WAVE ABNORMALITIES
portion of the ST segment [2]; notching or slurring of the J point [3]; sym-metric, concordant, prominent T waves [4]; widespread distribution of theelectrocardiographic abnormalities [5]; and temporal stability [6,13,14].
In the normal state, the ST segment is neither elevated nor depressed; it islocated at the isoelectric baseline as defined by the TP segment. The ST seg-ment itself begins at the J or juncture point. The ST segment is elevated inthe BER pattern, usually less than 3.5 mm. The contour of the elevated STsegment is an important characteristic of the pattern; the ST segment seemsto have been lifted off the baseline starting at the J point (Figs. 3–5). Thenormal concavity of the initial, upsloping portion of the ST segment is pre-served. Eighty percent to 90% of individuals demonstrate STE less than2 mm in the precordial leads and less than 0.5 mm in the limb leads; only2% of cases of BER manifest STE greater than 5 mm [13,14]. In the BERpattern, the J point itself frequently is notched or irregular. This finding,although not diagnostic of BER, is highly suggestive of the diagnosis[11,13,15].
Prominent T waves also are encountered (see Figs. 3 and 4). These Twave are often of large amplitude and slightly asymmetric morphology.The T waves are concordant with the QRS complex (ie, oriented in thesame direction as the major portion of the QRS complex) and usually arefound in the precordial leads. The height of the T waves in BER rangesfrom approximately 6 mm in the precordial leads to 4–6 mm in the limbleads [11,13,16].
Fig. 2. Electrocardiographic differential diagnosis of ST segment elevation and depression in
non-ACS syndromes.

94 BRADY
These abnormalities are greatest in the precordial leads, particularly theprecordial leads (leads V2–V5). STE in the limb leads, if present, is usuallyless pronounced. In fact, this isolated STE in the limb leads is seen in lessthan 10% of BER cases and should prompt consideration of another expla-nation for the observed ST segment abnormality, such as AMI. The T wavestend to follow the QRS complex in the BER pattern; essentially, pro-nounced STE usually is associated with prominent T waves in the samedistribution.
Acute myopericarditis
Acute pericarditis is better termed acute myopericarditis in that both thepericardium and the superficial epicardium are inflamed. This epicardial in-flammation produces the ST segment and related electrocardiographicchanges; the pericardial membrane is electrically silent in a direct effect onthe ST segment and T wave.
Fig. 3. ECG criteria for benign early repolarization.
Fig. 4. Benign early repolarization.

95ST SEGMENT AND T WAVE ABNORMALITIES
The electrocardiographic abnormalities evolve through four classic stages(Fig. 6) [16]. Stage I (Figs. 6 and 7) is characterized by STE, prominent Twaves, and (in most cases) PR segment depression. Stage II is characterizedby a normalization of the initial abnormalities, namely a resolution of theSTE. Stage III involves T wave inversion, usually in the same distributionwhere STE was encountered. Finally, stage IV is a normalization of allchanges with a return to the baseline ECG. Persistent STE and pathologicQ waves are not encountered in patients who have myopericarditisdtheseelectrocardiographic findings suggest another etiology.
These electrocardiographic stages usually occur in an unpredictable man-ner. In a general sense, stages I through III develop over hours to days. Con-versely, changes related to stage IV myopericarditis may not develop formany days to many weeks. Furthermore, patients may not manifest all char-acteristic features. Finally, patients may present for medical care at a laterstage of the process; for instance, the patient may present after a delay of
Fig. 5. Benign early repolarization.
Fig. 6. ECG criteria for myopericarditis.

96 BRADY
a week or more with chest discomfort and manifest electrocardiographicT wave inversiondthe clinician having ‘‘missed’’ the STE.
Stage I abnormalitydthat is, STE, prominent T wave, and PR segmentdepressiondis often electrocardiographically obvious with STE the mostprominent electrocardiographic feature (Figs. 6 and 7). The magnitude ofelevation usually ranges from 2–4 mm, with greater than 5 mm unusualfor myopericarditis. The morphology of the elevated ST segment is mostfrequently concave in shape. In other cases, STE can also be obliquelyflat or convex in contour; these morphologies, however, are suggestive ofAMI [7]. STE resulting from myopericarditis is usually widespread, notedin the following electrocardiographic leads: I, II, III, aVL, aVF, and V2–V6dessentially all leads except the more rightward-oriented leads aVRand V1; reciprocal ST segment depression is seen in lead aVR and occa-sionally in lead V1. The STE is seen most often in many leads simulta-neously, though it may be limited to a specific anatomic segment if theprocess is focal; if focal inflammation is present, the inferior wall most of-ten is involved.
PR segment abnormality (Figs. 6 and 7) resulting from atrial inflamma-tion and irritation is a highly suggestive feature of stage I myopericarditis.PR segment depression is described as ‘‘almost diagnostic’’ [16] and isbest observed in the lateral precordial (V5 and V6) and inferior (II, III,and aVF) leads. Reciprocal PR segment elevation is seen in lead aVR; inmany cases, this finding is in fact more obvious to the clinician comparedwith PR segment depression [17,18].
T wave inversion, a stage III feature, is usually transient and most oftenoccurs in leads that had recently manifested stage I STE. The magnitude andmorphology of the inverted T wave are nonspecific. The inverted T wavesare usually of normal amplitude with symmetric initial (downsloping) andfinal (upsloping) limbs, which can be confused with an ACS presentation.
Fig. 7. Myopericarditis.
97ST SEGMENT AND T WAVE ABNORMALITIES
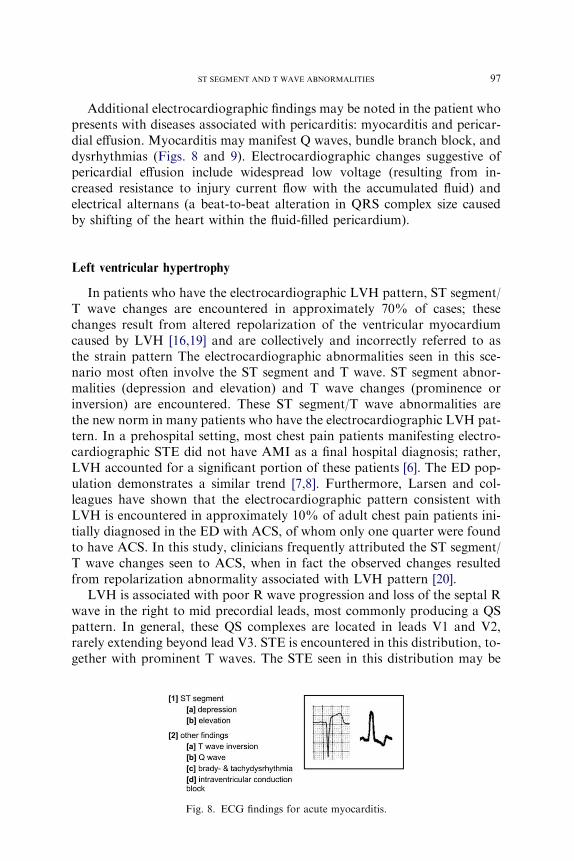
Additional electrocardiographic findings may be noted in the patient whopresents with diseases associated with pericarditis: myocarditis and pericar-dial effusion. Myocarditis may manifest Q waves, bundle branch block, anddysrhythmias (Figs. 8 and 9). Electrocardiographic changes suggestive ofpericardial effusion include widespread low voltage (resulting from in-creased resistance to injury current flow with the accumulated fluid) andelectrical alternans (a beat-to-beat alteration in QRS complex size causedby shifting of the heart within the fluid-filled pericardium).
Left ventricular hypertrophy
In patients who have the electrocardiographic LVH pattern, ST segment/T wave changes are encountered in approximately 70% of cases; thesechanges result from altered repolarization of the ventricular myocardiumcaused by LVH [16,19] and are collectively and incorrectly referred to asthe strain pattern The electrocardiographic abnormalities seen in this sce-nario most often involve the ST segment and T wave. ST segment abnor-malities (depression and elevation) and T wave changes (prominence orinversion) are encountered. These ST segment/T wave abnormalities arethe new norm in many patients who have the electrocardiographic LVH pat-tern. In a prehospital setting, most chest pain patients manifesting electro-cardiographic STE did not have AMI as a final hospital diagnosis; rather,LVH accounted for a significant portion of these patients [6]. The ED pop-ulation demonstrates a similar trend [7,8]. Furthermore, Larsen and col-leagues have shown that the electrocardiographic pattern consistent withLVH is encountered in approximately 10% of adult chest pain patients ini-tially diagnosed in the ED with ACS, of whom only one quarter were foundto have ACS. In this study, clinicians frequently attributed the ST segment/T wave changes seen to ACS, when in fact the observed changes resultedfrom repolarization abnormality associated with LVH pattern [20].
LVH is associated with poor R wave progression and loss of the septal Rwave in the right to mid precordial leads, most commonly producing a QSpattern. In general, these QS complexes are located in leads V1 and V2,rarely extending beyond lead V3. STE is encountered in this distribution, to-gether with prominent T waves. The STE seen in this distribution may be
Fig. 8. ECG findings for acute myocarditis.

98 BRADY
greater than 5 mm in height. The initial, upsloping portion of the ST seg-ment/T wave complex is frequently concave in LVH compared with the flat-tened or convex pattern observed with AMI. This morphologic feature isimperfect; early AMI may reveal such a concave feature (Figs. 10 and 11) [7].
Leftward-oriented leads I, aVL, V5, and V6 frequently demonstratelarge, monophasic R waves; these leads typically reveal STD with invertedT waves. This ST segment/T wave complex has been described in the follow-ing manner: initially bowed upward (convex upward) followed by a gradualdownward sloping into an inverted, asymmetric T wave with an abrupt re-turn to the baseline [21]. The T wave, however, may assume other morphol-ogies, including minimally inverted or inversion greater than 5 mm. These Twave abnormalities also may be encountered in patients lacking prominent
Fig. 10. ECG criteria for left ventricular hypertrophy.
Fig. 9. Acute myocarditis.

99ST SEGMENT AND T WAVE ABNORMALITIES
QRS voltage (ie, large S and R waves) typical of LVH [16,19]. Other featuresof this portion of the ST segment/T wave complex suggestive of LVH-related change include the following: (1) J point depression, (2) T waveasymmetry with rapid return to the baseline, (3) ‘‘overshoot’’ of the terminalT wave at the baseline (terminal positivity), (4) T wave inversions in leadsV4, V5, and V6 with the inversion greatest in lead V6, and (5) prominentT wave inversion in lead V6 (greater than 3 mm) (Figs. 10 and 11).
Bundle branch block
Unlike left bundle branch block (LBBB), right bundle branch block(RBBB) does not obscure the electrocardiographic diagnosis of ACS. InBBB, the QRS complex duration is prolongeddgreater than 0.12 seconds.Perhaps the most obvious and distinctive electrocardiographic feature inRBBB is a prominent R wave in lead V1. This R wave is broad and mayassume any of several morphologies: monophasic R wave, biphasic rSR#,or qR formation. In lead V6, a wide RS wave is seen (Figs. 12 and 13).
Significant ST segment/T wave changes are encountered in the patientwho has uncomplicated BBB [16]. In general, the correct and appropriateposition of the ST segment/T wave complex is dictated by the major, termi-nal portion of the QRS complexdthe rule of appropriate discordance. Us-ing this concept, the ST segment/T wave complex is located on the oppositeside of the isoelectric baseline from the major, terminal portion of the QRScomplex. As such, leads with predominantly positive QRS complex wouldpresent with STD and T wave inversionddiscordant STD and T wave in-version. Conversely, a primarily negative QRS complex would be associatedwith STE and prominent, upright T waveddiscordant STE. This conceptholds true not only for right and left BBB, but also for VPR, and, to a lesserextent, LVH.
Fig. 11. Left ventricular hypertrophy.

100 BRADY
LBBB is found commonly among ED chest pain patients, which is unfor-tunate for several reasons: (1) LBBB is a marker of significant heart diseasewith extreme risk for acute cardiovascular complication and death in pa-tients who have ACS, (2) LBBB, if new or presumably new and occurringwithin an appropriate clinical context suggesting AMI, represents an indica-tion for fibrinolysis, and (3) LBBB markedly reduces the diagnostic powerof the ECG in the evaluation of potential AMI.
As with RBBB, the rule of appropriate discordance predicts the normalST segment/T wave findings in LBBB. In the right precordial leads (leadsV1 and V2), broad, mainly negative QS or rS complexes are found (Figs.14 and 15). In these leads, STE with a prominent T wave is seen. TheSTE in these leads ranges from minimal (1–2 mm) to prominent (O5 mm),although STE O5mm in these leads should spark consideration of AMI[22]. Moving from the right to left precordial leads, poor R wave progres-sion or QS complexes are noted, rarely extending beyond leads V4 or V5.In leads V5 and V6, a positive, monophasic R wave is encountered; the STsegment is depressed in these leads, whereas the T wave is inverted. Similarmorphologies are found in leads I and aVL (Figs. 14 and 15).
Fig. 12. ECG criteria for right bundle branch block.
Fig. 13. Right bundle branch block.

101ST SEGMENT AND T WAVE ABNORMALITIES
Ventricular paced rhythm
As with the LVH and LBBB patterns, right-VPR confounds the ability ofthe physician to detect ACS on the ECG. Right-VPR not only confounds theelectrocardiographic diagnosis of ACS but also imitates ECG findings ofacute coronary ischemic events. In right-VPR, the ECG displays a broad,mainly negative QRS complex with a QS configuration in leads V1 to V6; ifan R wave is present, it is usually small and does not appear until the left pre-cordial leads, resulting in poor R wave progression. A large monophasic Rwave is encountered in leads I and aVL and, on occasion, in leads V5 andV6. QS complexes also may be encountered in the inferior leads (Figs. 16–18).
The anticipated or expected ST segment/T wave configurations arediscordant and directed opposite from the terminal portion of theQRS complexdthe rule of appropriate discordancedsimilar to the
Fig. 14. ECG criteria for left bundle branch block.
Fig. 15. Left bundle branch block.

102 BRADY
electrocardiographic principles applied to BBB [16,23]. Accordingly, leadswith QS complexes demonstrate STE with an upright T wave; this STE isseen in leads II, III, and aVF as well as leads V1 to V6, depending on thepositioning of the pacemaker electrode. Leads with a large monophasic Rwave demonstrate STD with T wave inversion (Figs. 16–18) [24].
Left ventricular aneurysm
One structural complication of extensive myocardial infarction is ventric-ular aneurysm, most often arising from the left ventricle after a large trans-mural infarction. The most frequent electrocardiographic manifestation ofventricular aneurysm is STE (Figs. 19 and 20). Because of the frequent an-terior location of ventricular aneurysm, STE is observed most often in leadsI, aVl, and V1 to V6. An inferior wall ventricular aneurysm would revealSTE in the inferior leads, though usually less pronounced than that seenwith the anterior left ventricular aneurysm. The actual ST segment abnor-mality may manifest varying morphologies, ranging from obvious, convexSTE to minimal, concave elevations.
Fig. 16. ECG criteria for right ventricular paced rhythm.
Fig. 17. Right ventricular paced rhythm, with ventricular pacing spikes.

103ST SEGMENT AND T WAVE ABNORMALITIES
In patients who have ventricular aneurysm, significant Q waves are ob-served in the same distribution as the STE. The calculation of the ratio ofthe amplitude of the T wave to that of the QRS complex may help distin-guish anterior AMI from ventricular aneurysm. If the ratio of the amplitudeof the T wave/QRS complex exceeds 0.36 in any single lead, the ECG likelyreflects AMI. If this ratio is less than 0.36 in all leads, however, the findingsare likely caused by ventricular aneurysm (Fig. 20) [25].
Other non-ACS causes of ST segment/T wave abnormalities
Cardiomyopathy may produce electrocardiographic patterns that simu-late findings associated with acute and chronic coronary syndromes [16].These findings include significant Q waves, ST segment changes, T wave
Fig. 18. Right ventricular paced rhythm with atrial and ventricular pacing spikes.
Fig. 19. ECG findings for left ventricular aneurysm.

104 BRADY
abnormalities, and BBB patterns. Cardiomyopathy may produce significantQ waves in the inferior and right precordial distributions; in certain cases,such Q waves may be seen across the precordium, involving the entire ante-rolateral region of ECG. These leads also can demonstrate STE with prom-inent T waves. In most instances, the STE is usually less than 5 mm in heightwith a concave, initial upsloping portion of the ST segment/T wavecomplex.
In 1992, Pedro and Josep Brugada described a new syndrome that wasassociated with sudden death in individuals who have a structurally normalheart and no evidence of atherosclerotic coronary disease [26]. Patients whohave this syndrome were noted to have a distinct set of electrocardiographicabnormalities, characterized by an RBBB pattern with STE in the right pre-cordial leads. Patients who have this Brugada syndrome have a tendency forsudden cardiac death resulting from polymorphic ventricular tachycardia[27]. ECG abnormalities (Fig. 21) that suggest the diagnosis includeRBBB (complete or incomplete) and STE in leads V1, V2, or V3. Two typesof STE (Fig. 21) morphologies have been described: convex upwards (coved)and concave upwards (saddle-type) [28–30]. The ECG morphologies maytransform from one type to the other or may normalize completely.
Fig. 20. Left ventricular aneurysm.
Fig. 21. ECG findings for Brugada syndrome-related ST segment/T wave abnormalities.

105ST SEGMENT AND T WAVE ABNORMALITIES
Left ventricular apical ballooning syndrome, also known as Takastubosyndrome, is a recently described disorder in which patients develop anginalsymptoms with acute congestive heart failure during times of stress. Atcardiac catheterization, these patients are found to have abnormal left ven-tricular function but normal coronary arteries [31,32]. Classic electrocardio-graphic findings (Fig. 22) encountered in this syndrome include STE, T waveinversion, and abnormal Q waves [33]. These findings are most often tran-sient, presenting only when the patient is symptomatic and resolving duringphysiologically normal periods. The STE itself has a similar morphology tothat seen in the patient who has AMI [33].
At therapeutic levels, digitalis produces characteristic electrocardio-graphic changes, referred to as the digitalis effect. The electrocardiographicmanifestations (Fig. 23) of digitalis are as follows: (1) ‘‘scooped’’ STD, mostprominent in the inferior and precordial leads (those with the largest Rwave) and usually absent in the rightward leads; (2) flattened T waves; (3)increased U waves; and (4) shortening of the QT interval.
The earliest sign of hyperkalemia is the appearance of tall, symmetric Twaves, described as hyperacute, which may be confused with the hyperacuteT wave of early STE AMI. As the serum potassium level increases, the Twaves tend to become taller, peaked, and narrowed in a symmetric fashionin the anterior distribution (Fig. 24). Hyperkalemic T waves tend to be tall,narrow, and peaked with a prominent or sharp apex. Also, these T wavestend to be symmetric in morphology (Fig. 24). Conversely, the hyperacuteT waves of early AMI are often asymmetric with a broad base. As the serumlevel continues to increase, the QRS complex widens (Fig. 24), which canmake the ST segment seem elevated. This pseudo-STE associated with hy-perkalemia is characterized by J point elevation and prominent T waves.
The Wolff Parkinson White syndrome (WPW) frequently presents withevidence of ventricular pre-excitation or actual dysrhythmic events. Such ev-idence of pre-excitation includes the classic electrocardiographic triad of PRinterval shortening, a delta wave, and QRS complex widening. The patient
Fig. 22. ECG findings for Takastubo cardiomyopathy.

106 BRADY
may present with paroxysmal supraventricular tachycardia that does not re-flect the underlying WPW syndrome, rapid, bizarre atrial fibrillation, broad-complex tachycardia, or sudden cardiac death. Various pseudoinfarctionfindings may be observed that, if not recognized, may once again lead theuninformed clinician to the wrong diagnostic conclusion. Q waves can beseen in leads II, III, and aVF, mimicking past inferior myocardial infarction,and tall R waves in the right precordial leads are suggestive of a posteriorwall AMI. T wave inversions can be seen in leads with prominent R waves(Fig. 25).
With the development of hypothermia, the ECG manifests numerousECG abnormalities, particularly an unusual form of STE (Fig. 26). Thishypothermia-related electrocardiographic change involves the juncture be-tween the terminal portion of the QRS complex and the initial ST segmentdthe J point. The J point itself and the immediately adjacent ST segmentseem to have lifted unevenly off the isoelectric baseline, producing theJ wave (also know as the Osborn J wave). In general, the amplitude ofthe J wave is directly proportional to the degree of hypothermia. Otherelectrocardiographic features associated with hypothermia include (1) bra-dycardia, (2) tremor artifact, (3) prolongation of the PR and QT intervals,(4) T wave inversions in leads with preeminent J waves, and (5) dysrhyth-mias such as atrial fibrillation and ventricular fibrillation (Fig. 26).
Fig. 23. ECG Findings for digoxin effect.
Fig. 24. ECG findings for hyperkalemia-related ST segment/T wave abnormalities.

107ST SEGMENT AND T WAVE ABNORMALITIES
Central nervous system events such as subarachnoid and intraparenchy-mal hemorrhage can present with ST segment/T wave abnormalities. TheseCNS disasters may manifest electrocardiographic abnormality, most oftensignificant T wave inversion in the precordial leads; other electrocardio-graphic abnormalities such as STD and STE, however, also are seen.
ST segment/T wave abnormalitiesdelectrocardiographic distinction from
acute coronary syndrome
If the ECG reveals ST segment or T wave changes (Fig. 27), the clinicianthen is confronted with the challenge of identifying the source of the electro-cardiographic abnormality. In addition to clinical correlation, specific at-tributes of these ECG findings aid in reaching a diagnosis. QRS complexmagnitude (a criterion for LVH pattern diagnosis) and the width (a criterionfor BBB or VPR) should be considered first. If either of these abnormalitiesis present, a confounding electrocardiographic pattern is present, complicat-ing the analysis. Furthermore, the presence of one of these patterns serves toforewarn that ST segment or T wave abnormalities will be encountered;
Fig. 25. ECG findings of Wolff-Parkinson-White syndrome-related ST segment/T wave
abnormalities.
Fig. 26. ECG findings for hypothermia.

108 BRADY
these abnormalities can represent the normal findings associated with thesepatterns or, alternatively, ACS changes superimposed on the confoundingpattern.
If a confounding pattern is not seen, the ST segment should be scruti-nized, considering the presence of either STE or STD. From the anatomicperspective, the location of the elevation is suggestive of the electrocardio-graphic diagnosis in two circumstances. First, widespread anterior STEmost often is caused by a non-AMI process, including LVH, BBB, andBER [34]. These patterns, when considered as a whole, are encounteredmuch more frequently than AMI occurring in the anterior area [34].
Second and perhaps more important, inferior STE, particularly when iso-lated, results from AMI in most instances [34]. Again, the most commonlyencountered non-infarction causes of STE usually have electrocardiograph-ically widespread or diffuse STE [23,35,36]. Isolated STE is a rare finding inBER [35], whereas isolated STE is not found in LVH and BBB presentations[23,35]. Similarly, lateral wall STE is an electrocardiographic finding moreoften the result of AMI [34].
The morphology of the elevated ST segment is a predictor of etiology.The use of ST segment waveform analysis has been reported as a useful ad-junct in establishing the electrocardiographic diagnosis of AMI [7]. Usingthis analysis, a concave ST segment pattern is seen significantly more oftenin the non-AMI patient, whereas the non-concave morphology is seen
Fig. 27. Specific ECG findings (prominent T wave, T wave inversion, ST segment depression,
and ST segment elevation) in normal, ACS, and non-ACS presentations.

109ST SEGMENT AND T WAVE ABNORMALITIES
almost exclusively in the patient who has AMI. As with most guidelines, it isnot infallible; patients who have STE caused by AMI may demonstrate con-cavity of this portion of the waveform.
STD can occur as the sole finding on the ECG or as a component ofa more complicated electrocardiographic presentation. If present as the ma-jor electrocardiographic abnormality, the morphology of STD is an impor-tant consideration. Horizontal (flat) or downsloping ST segment depressionis associated more often with ACS, although nonischemic causes of STDalso may present with similar morphologies [37]. Reciprocal STD is definedas depression in leads anatomically opposite, or near-opposite, to those withSTE (eg, STD in lead aVL in inferior STE AMI). Its presence on the ECGsupports the diagnosis of AMI with high sensitivity, and positive predictivevalues greater than 90%. The use of reciprocal change in prehospital andED chest pain patients retrospectively increased the diagnostic accuracy inthe electrocardiographic recognition of AMI [6]. It is perhaps most usefulin patients who have chest pain and STE of questionable cause. The STDoccurring in an LVH, BBB, or VPR does not meet criteria for reciprocalST segment depression.
Considering the magnitude of ST segment changes, the total amount ofSTE is greater in the patient who has AMI compared with the non-infarc-tion patient. Furthermore, the total quantity of ST segment deviation, ie,the sum of STE and STD, is significantly greater in the patient who hasAMI [34].
Summary
The 12-lead ECG furnishes invaluable information in patients who pres-ent with chest pain or other symptomatology suggestive of ACS. The ECGcan demonstrate abnormalities in a subset of these individuals, ranging fromminimal nonspecific ST segment/T wave changes to pronounced STE. Theelectrocardiographic differential diagnosis of these abnormalities includesnot only AMI and ACS, but also BER, myopericarditis, LVH, BBB,VPR, ventricular aneurysm, and other non-ACS entities. A sound reviewof the 12-lead ECG, together with knowledge of the expected electrocardio-graphic abnormalities associated with these common diseases, assists the cli-nician in differentiating ACS and non-ACS ST segment and T waveabnormalities on the 12-lead ECG.
References
[1] BradyWJ, AdamsM, Burry SD, et al. The impact of the 12-lead ECGonED evaluation and
management. Acad Emerg Med 2002;40:S47.
[2] Hayden GE, Brady WJ, Perron AD, et al. Electrocardiographic T wave inversion: differen-
tial diagnosis in the chest pain patient. Am J Emerg Med 2002;20:252–62.
[3] Somers M, Brady WJ, Perron AD, et al. Prominent T waves: electrocardiographic differen-
tial diagnosis. Am J Emerg Med 2002;20:243–51.

110 BRADY
[4] Pollen T, BradyWJ, Perron AD. Electrocardiographic ST segment depression. Am J Emerg
Med 2001;19:303–9.
[5] BradyWJ, Dobson T, Holstege C, et al. Electrocardiographic ST segment depression: asso-
ciation with ACS. Acad Emerg Med 2004;11:578.
[6] Otto LA, Aufderheide TP. Evaluation of STE criteria for the prehospital electrocardio-
graphic diagnosis of acute myocardial infarction. Ann Emerg Med 1994;23:17–24.
[7] BradyWJ, Syverud SA, Beagle C, et al. Electrocardiographic STE: the diagnosis of AMI by
morphologic analysis of the ST segment. Acad Emerg Med 2001;8:961–7.
[8] Brady WJ, Perron AD, Martin ML, et al. Electrocardiographic STE in emergency depart-
ment chest pain center patients: etiology responsible for the ST segment abnormality. Am
J Emerg Med 2001;19:25–8.
[9] Miller DH, Kligfield P, Schreiber TL, et al. Relationship of prior myocardial infarction to
false-positive electrocardiographic diagnosis of acute injury in patents with chest pain.
Arch Intern Med 1987;147:257–61.
[10] Klatsky AL, OehmR, Cooper RA, et al. The early repolarization normal variant electrocar-
diogram: correlates and consequences. Am J Med 2003;115:171–7.
[11] MehtaMC, Jain AC. Early repolarization on scalar electrocardiogram. Am JMed Sci 1995;
309:305–11.
[12] Thomas J, Harris E, Lassiter G. Observations on the T wave and S-T segment changes in the
precordial electrocardiogram of 320 young Negro adults. Am J Cardiol 1960;5:468–74.
[13] Wasserburger RM, Alt WJ, Lloyd C. The normal RS-T segment elevation variant. Am J
Cardiol 1961;8:184–92.
[14] Kabara H, Phillips J. Long-term evaluation of early repolarization syndrome (normal var-
iant RS-T segment elevation). Am J Cardiol 1976;38:157–61.
[15] Hackworthy RA, VogelMB, Harris PJ. Relationship between changes in ST-segment eleva-
tion and patency of the infarct-related coronary artery in acute myocardial infarction. Am
Heart J 1986;112:279–88.
[16] Aufderheide TP, Brady WJ. Electrocardiography in the patient with myocardial ischemia
or infarction. In: Gibler WB, Aufderheide TP, editors. Emergency cardiac care. 1st edition.
St. Louis: Mosby; 1994. p. 169–216.
[17] Spodick DH. Differential diagnosis of the electrocardiogram in early repolarization and
acute pericarditis. N Engl J Med 1976;295:523–6.
[18] Glinzton LE, Laks MM. The differential diagnosis of acute pericarditis from the normal
variant: new electrocardiographic criteria. Circulation 1982;65:1004–9.
[19] HuwezFU, Pringle SD,MacfarlaneFW.Variable patterns of ST-T abnormalities in patients
with left ventricular hypertrophy and normal coronary arteries. Br Heart J 1992;67:304–7.
[20] Larsen GC, Griffith JL, Beshansky JR, et al. Electrocardiographic left ventricular hypertro-
phy in patients with suspected acute cardiac ischemiadits influence on diagnosis, treatment,
and short-term prognosis. J Gen Intern Med 1994;9:666–73.
[21] Rykert HE,Hepburn J. Electrocardiographic abnormalities characteristic of certain cases of
arterial hypertension. Am Heart J 1935;10:942–54.
[22] Sgarbossa EB, Pinski SL, Barbagelata A, et al. Electrocardiographic diagnosis of evolving
acute myocardial infarction in the presence of left bundle branch block. N Engl J Med
1996;334:481–7.
[23] Brady WJ, Aufderheide TP. Left bundle block pattern complicating the evaluation of acute
myocardial infarction. Acad Emerg Med 1997;4:56–62.
[24] Kozlowski FH, Brady WJ, Aufderheide TP, et al. The electrocardiographic diagnosis of
acute myocardial infarction in patients with ventricular paced rhythms. Acad Emerg Med
1998;5:52–7.
[25] Smith S, NolanM. Ratio of T amplitude to QRS amplitude best distinguishes acute anterior
MI from anterior left ventricular aneurysm. Acad Emerg Med 2003;10:516.
[26] Brugada P, Brugada J. Right bundle branch block, persistent STE and sudden cardiac death:
a distinct clinical and electrocardiographic syndrome. J Am Coll Cardiol 1992;20:1391–6.

111ST SEGMENT AND T WAVE ABNORMALITIES
[27] Brugada P, Brugada R, Brugada J. The Brugada syndrome. Curr Cardiol Rep 2000;2:
507–14.
[28] Alings M, Wilde A. ‘‘Brugada’’ syndromedclinical data and suggested pathophysiological
mechanism. Circulation 1999;99:666–73.
[29] MonroeMH, Littmann L. Two-year case collection of the Brugada syndrome electrocardio-
gram pattern at a large teaching hospital. Clin Cardiol 2000;23:849–51.
[30] Furuhashi M, Uno K, Tsuchihashi K, et al. Prevalence of asymptomatic STE in right
precordial leads with right bundle branch block (Brugada-type ST shift) among the general
Japanese population. Heart 2001;86:161–6.
[31] Akashi YJ, Musha H, Nakazawa K, Miyake F. The clinical features of Takotsubo cardio-
myopathy. Q J Med 2003;96:563–73.
[32] Ueyma YA. Emotional stress induces transient LV hypocontraction in the rat via activation
of cardiac adrenoreceptors. Circ J 2002;66:712–3.
[33] TsuchihashiK,UeshimaK,Uchida T. ForAP-MI. Transient left ventricular apical balloon-
ing without coronary artery stenosis: a novel heart syndrome mimicking AMI. J Am Col
Cardiol 2001;38:11–8.
[34] Brady WJ, Perron AD, Ullman EA. STE: a comparison of electrocardiographic features of
AMI and non-AMI ECG syndromes. Am J Emerg Med 2002;20:609–12.
[35] BradyWJ. Electrocardiographic left ventricular hypertrophy in chest pain patients: differen-
tiation from acute coronary ischemic events. Am J Emerg Med 1998;16:692–6.
[36] Brady WJ. Benign early repolarization: electrocardiographic manifestations and differenti-
ation from other STE syndromes. Am J Emerg Med 1998;16:592–7.
[37] ChanTC, BradyWJ,HarriganRA, et al, editors. The ECG in emergencymedicine and acute
care. St. Louis: Mosby, Inc.; 2004.