ST. LUCIA ELECTRICITY SERVICES LIMITED (LUCELEC) RESEARCH REPORT RESEARCH REPO… · ·...
27
ST. LUCIA ELECTRICITY SERVICES LIMITED (LUCELEC) RESEARCH REPORT INVESTMENT BANKER: BANK OF SAINT LUCIA LIMITED APRIL 2003
Transcript of ST. LUCIA ELECTRICITY SERVICES LIMITED (LUCELEC) RESEARCH REPORT RESEARCH REPO… · ·...

ST. LUCIA ELECTRICITY SERVICES LIMITED
(LUCELEC)
RESEARCH REPORT
INVESTMENT BANKER: BANK OF SAINT LUCIA LIMITED APRIL 2003

1
TABLE OF CONTENTS
PAGE EXECUTIVE SUMMARY_______________________________________02
1. BUSINESS DESCRIPTION________________________________ __04
1.1 History/Background………………………………………………04 1.2 Corporate & Management Structure……………………………….05 1.3 Corporate Information…………………………………………… 09 1.4 Management Structure…………………………………………… 11 1.5 Operations…………………….…………………………………12 1.6 Management Information Systems………………………………… 14 1.7 Dividend Policy…………………….………………………….... 15
2. OPERATING ENVIRONMENT________________________________15
2.1 Regulatory Environment ………………………………………….15 2.2 Geography……………………………………………………..…15 2.3 Politics & Law…………………………………………………….16 2.4 Economy…………………………………………………………16
3. FINANCIAL PERFORMANCE & ANALYSIS __ _________18
3.1 Historical Financial Performance (1997-2002) …….……………… 18 3.2 Projected Financial Performance ..……………………………….. 21
4. RISK ISSUES/ANALYSIS ______ _ 22
5. VALUATION AND INDICATION OF PRICE _______________ ___ 23
6. CONCLUSION________________ ___________________________ 26

2
EXECUTIVE SUMMARY
Pursuant to the commercial code of Saint Lucia Lucelec was incorporated in St Lucia in November 1964 as a private limited liability Company with the objective of generating, producing & distributing electricity and electromotive force energy. The Company has been the sole commercial supplier of electrical energy in Saint Lucia. On August 11, 1994 the Company changed status to a Public Company, thereby allowing for the offering of its shares to the regional public in the Organization of East Caribbean States, Barbados and Trinidad and Tobago.
St. Lucia Electricity Services Limited is the sole commercial generator, transmitter, distributor and seller of electrical energy in St. Lucia. The Company operates under an exclusive statutory license, under the Electricity Supply Act of 1994. The license that expires in 2045, gives the Company the exclusive right to generate, and distribute electricity to domestic, commercial and industrial users in St. Lucia. The customer base as of December 31st 2002 was 48,633, consisting of residential, commercial and industrial customers. Lucelec operates three power stations, with a standby facility at Soufriere on the western coast of Saint Lucia and three sub-stations integrated to form one power system. The Company uses diesel fuel as its exclusive energy source and has a fuel supply contract with Hess Oil St. Lucia Limited (HOSL).
Lucelec’s Board of Directors and Senior Management is highly qualified and experienced. The ownership structure (voting shares) of Lucelec comprises of 11.72 million shares, of which 11.2 million represent voting shares and 0.52 million represent non-voting shares. The voting shares are 0.2% owned by the Directors of Lucelec, 45% by Commonwealth Development Corporation (CDC) Group Plc., 16% Castries City Council, 12% by the Government of Saint Lucia, 13% by National Insurance Corporation and 14% by the citizens of the Organization of East Caribbean States (OECS) and Barbados and the local business houses. In additional, the Government of Saint Lucia owns the non-voting shares of 0.52 million.
Lucelec’s Financial Highlights & Operating Statistics ITEMS 2001
(‘000) 2002
(‘000) Financial Highlights: Operating Revenue $141,784 $134,189 Net Profit after Taxation $19,468 $16,301 Ordinary Dividend Declared $13,478 $11,105 Earning per Share (EPS) $1.66 1.39 EPS (% on Par) 16.61% 13.91% Ordinary Dividend per Share (DPS) $1.15 0.95 DPS (% on Par) 11.50% 9.48% Ordinary Dividends as % of net profits after tax 69.23% 68.12% Book Value Per Share (Historical) $9.52 $9.87 Debt to Equity Ratio 55/45 51/49

3
Operating Statistics (KW): Generating Plant (kW): Installed Capacity 66,400 66,400 Firm Capacity 47,800 47,800 Peak Demand 43,300 43,400 Total Sales (kWh x 1000) 243,416 239,387 Total Number of Customers 47,760 48,633
The performance of the St. Lucian economy has shown a marginal improvement over 2001, as reflected in real GDP growth for 2002 of 0.11%, compared to –4.6% in 2001. The performance in 2002 was influenced by a recovery in banana output, expansion in output of the manufacturing and communications, sectors and modest recovery in tourism arrivals. However, the increase in activity in tourism was offset by the prevalence of heavy discounting within the industry.
Lucelec is in a strong financial position with all good financial indicators. Lucelec’s financial strength has been focused on providing a satisfactory return to shareholders. Return on equity averaged about 15.6% over the period 1997 to 2002 while return on assets has averaged about 5%. Earnings per share (EPS) have grown from $0.78 in 1997 to $1.39 in 2002, an average of 13.8% over the period. Dividends per share on par value ($10.00) have ranged from 6% to 12.5% during the period 1997 to 2002, an average of 9%. The dividend payout ratio has averaged 68%. Sales Revenue for the past six years experienced an average growth rate of 6.7%. The Company’s level of efficiency in the use of its fixed assets and the effective management of its trade payables and receivables have been satisfactory. Lucelec has recognized the need to become more sensitive, proactive and strategic to respond to the global changes that are impacting on the economy, business environment and consumers generally.
The following projections are provided for the next five years:
INDICATOR 2003 2004 2005 2006 2007 Average Earnings Per Share (EPS) $2.05 $1.88 $2.03 $2.01 $2.14 $2.02 Dividend Per Share $1.39 $1.28 $1.38 1.36 $1.46 $1.37 Return on Par Value $10.00 13.9% 12.8% 13.8% 13.6% 14.6% 13.7%
Three methodologies were used to assess the value of Lucelec and to determine the future performance of the company over the next five years - the Discounted Cash Flow Model, the Dividend Discount Model and the Constant Dividend Growth Method. Based on the three methodologies, the total equity value of Lucelec is placed at a range from EC$151,891,200 to EC$206,204,024 and a share value ranging from EC$12. 96 to EC$17.59.

4
1. BUSINESS DESCRIPTION
1.1 HISTORY/BACKGROUND Pursuant to the commercial code of Saint Lucia Lucelec was incorporated in St Lucia in November 1964 as a private limited liability Company with the objective of generating, producing & distributing electricity and electromotive force energy. The Company has been the sole commercial supplier of electrical energy in Saint Lucia. On August 11, 1994 the Company changed status to a Public Company, thereby allowing for the offering of its shares to the regional public in the Organization of East Caribbean States, Barbados and Trinidad and Tobago.
The formation of the Company in 1964 saw the creation of a unified and centrally managed source of power from the dozens of disparate and small facilities scattered around the island. This allowed for the expansion of facilities island-wide, as well as the opportunity to rationalize operating costs. In the 1970s the Company faced an explosion in the demand for power as hotel development and banana production green gold transformed the economy. Average annual demand grew by almost 30% a doubling of capacity every three years, putting huge strains on the resources of manpower and equipment. Two new power stations were commissioned and the basic, and still existing, 11kV sub-transmission system was erected.
By the early 1980s, given the rapid developments in various sectors of the Saint Lucian economy, the Company entered a new environment and recognized the need for better-trained persons to cope in an increasingly technological environment. The Company initiated a highly successful craft apprenticeship program and began the recruitment of graduate staff for all senior positions. The end of the 1980s saw the Company almost self-sufficient in all but the most specialized areas. In 1990, a new generating and transmission system was commissioned which redefined the standards the Company had previously applied to all its operations. The opening of the Cul de Sac power station, in the south of Castries heralded an era of highly professional and efficient operations, leading to the development of new standards throughout the Company. A 66 kV transmission system was introduced allowing the efficient flow of power around the island.
Lucelec went public in 1994. Profitability and shareholder value became new words in the vocabulary of operations. The new motto was excellence and profitability in operations. By the late 1990s, driven by the demands for a higher quality of customer service, the business changed again. The main focus was no longer just to produce a reliable and efficient supply, but to service customers in a cost-effective manner.

5
1.2 CORPORATE & MANAGEMENT STRUCTURE
1.2.1 CORPORATE GOVERNANCE/BYE LAWS The Board of Directors has general responsibility for governance of the Company. Lucelec has established documented governance policies setting out the role and responsibilities of the Board of Directors. Board meetings are held regularly at least quarterly to review policy issues, major capital expenditure budgets and accounts. The Board is made up of ten (10) non- executive directors; four (4) appointed by CDC, one (1) each by the Government of Saint Lucia, Castries City Council, the National Insurance Corporation and three (3) elected by at the annual general meeting. One (1) ex-officio director, the Managing Director who is the Chief Executive Officer (CEO) is appointed by the Board. A minimum of five is required to constitute a quorum. Appointments are made in accordance with the Articles of Association and one-third of members retires each year on the basis of the longest serving members, but are entitled to reappointment.
The CEO is responsible for the management of the Company and reports to the Board of Directors. He is responsible for policy formulation, human resource development, government relations, industrial relations, customer relations, use of consultants, and relationship with CDC. A management service contract in which management services was being provided by CDC to Lucelec, was terminated in 2002. Policy documents exist for several areas of operation, including awarding of contracts, internal auditing, human resource and training, environmental issues, among others.
Lucelec is permitted by the Company’s Act of 1996 to redeem or purchase any of its shares, increase or reduce the stated capital, issue any part of the capital whether original, redeemed or increased with or without preference, priority or special privilege or subject to any postponement of rights. Directors holding office currently own a total interest of 0.16% in the Company.
It must be noted that the future relations and involvement of CDC in Lucelec is uncertain at the time of preparing this report, as it is understood that CDC is contemplating the disposal of their shares.

6
1.2.2 DIRECTORATE Mr. Marius St. Rose Mr. St. Rose is the Chairman of Lucelec from 1997. He is currently the Managing Director of the East Caribbean Financial Holding Company Limited. Mr. St. Rose holds a Msc in Economics and a Diploma in Management Studies from the University of the West Indies (UWI). Bernard C. Theobalds OBE (Ex-Officio Director) Mr. Theobalds joined the Company in 1989 and holds the post of Managing Director. Mr. Theobalds holds a BSc in Electrical Engineering from the University of Glasgow and a Diploma in Accounting & Finance from the Institute of Electrical Engineers.
Mr. Irving John, Director Mr. John is the Chairman of the Castries City Council. Mr. Isaac Anthony, Director Mr. Anthony is the Director of Finance in the Ministry of Finance. Mr. Anthony holds a BSc in Economics & Accounting from the University of West Indies (UWI), an Executive MBA from the Centre for Management Development UWI, and a Certification in Government Financial Management from the Association of Government Accountants, USA. Murray Duncan Rogers, Director Mr. Rogers is the Investment Manager Utilities at CDC Globeleq. Mr. Rogers holds a BSc in Electrical Engineering from the University of Alberta. David West Griffith, Director Mr. Griffin is the Acting Business Unit Head at CDC Globeleq; Chief Financial Officer of Interben North America Inc. He holds an MBA from Amos Tuck School of Business; a B.E. from Thayer School of Engineering and a B.A. from Dartsmouth College Mr. Brian Rasmussen, Director Mr. Rasmussen is the Regional Manager of Central America - CDC Globeleq. He holds a BSc in International Finance from Brigham Young University. Mr. Ian Carrington, Director Mr. Carrington is the Director of National Insurance in the Ministry of Labour & Social Security (Barbados). He is a member of the Fellowship of Certified General Accountants of Canada and a member of the Institute of Chartered Accountants of Barbados.

7
Ms. Emma Hippolyte, Director Ms. Hippolyte is the Director of the National Insurance Corporation (St. Lucia). She is a qualified Certified General Accountant (CGA) and also a Certified Fraud Examiner.
1.2.3 SENIOR MANAGEMENT TEAM
Trevor Louisy - Chief Engineer B.Sc. Electrical Engineer
Duleep Cheddie - Financial Comptroller F.C.C.A.
Cathy-Ann Wright-Auguste - Company Secretary/Internal Auditor B.Sc. Accounting, C.G.A., Grad FCIS Dalkeith Foster – Manager Information Technology Business Unit B.Sc. Information Systems, M.A. Management Systems
Timothy Chaderton – Human Resource Advisor B.Sc., MBA
Nicole Du Boulay – Human Resource Manager (Ag) B.A.; MBA, MSc.
Jennifa R. Flood - Customer Service Manager B.Sc. Management
Gennifer Faisal – Chief Accountant F.C.C.A. Francis Daniel – Planning Manager (Ag). B.Sc. Electrical Engineering, Victor Emmanuel – Generation M.Sc. Electrical Engineering and B. Eng (Electrical)
Gilroy Pultie – Transmission & Distribution Manager (Ag.) B.Sc in Electrical Engineering, Diploma in Accounting & Finance
Goodwin L. D' Auvergne – System Control Engineer B.Sc. Electrical Engineering

8
1.2.4 LUCELEC OWNERSHIP STRUCTURE
OECS Citizens & Barbados
14%
Government of Saint Lucia
12% Castries City Council
16%
CDC Group Plc.45%
National Insurance Corp.13%
* Included in the Saint Lucia Citizens & Business Places is Directors holdings
Lucelec ownership structure (voting shares) comprises the following: Shares Percentages Directors 17,550 0.16% Commonwealth Development Corporation 5,025,982 44.9% Castries City Council 1,828,409 16.3% Government of Saint Lucia 1,392,842 12.4% National Insurance Corporation 1,401,496 12.5% OECS Citizens and Barbados 1,533,621 13.7% Total shareholdings 11,200,000 100% In addition the Government of Saint Lucia owns 520,000 non-voting shares, making a total of 11,720,000.

9
1.2.5 COMPANY INFORMATION Registered Office Head Office: San Soucis, John Compton Highway Castries, St. Lucia Telephone: (758) 457-4400 Fax: (758) 457-4409 E-mail: [email protected] Web site: www.lucelec.com Auditors PriceWaterHouseCooper Chartered Accountants Pointe Seraphine P O Box 195 Castries, Saint Lucia
Attorneys-at-Law Mc Namara & Company 20 Micoud Street Castries, St. Lucia Bankers/Financiers European Development Bank National Insurance Corporation Bank of Saint Lucia Limited First Caribbean International Bank Citibank (Trinidad) Royal Merchant Bank In the past ten (10) years, Lucelec has borrowed from CDC and the Caribbean Development Bank (CDB). These loans have since been repaid. The Company is currently in the process of seeking another loan from CDB.
1.3 CORPORATE INFORMATION
1.3.1 MISSION STATEMENT To run a reliable and efficient service; to be a good corporate citizen in the local environment and workforce and to ensure a satisfactory return to shareholders.

10
1.3.2 CORPORATE STRATEGY
The corporate strategy of Lucelec, as the sole provider of electricity in Saint Lucia is characterized by the delivery of an efficient and low-cost service to the consumers of Saint Lucia while providing good returns to its shareholders. Compared to its peers in the Caribbean, Lucelec is regarded as a model supplier of electricity, satisfying its customers with a reliable and efficient service and shareholders with fair returns on their investments, by way of annual dividends and capital appreciation.
In addition to Lucelec’s monopolistic position, the Electricity Supply Act No 10 of 1994 also guarantee’s Lucelec a return on its investment by providing for the establishment of a fuel surcharge. This surcharge keeps Lucelec’s cost of fuel (diesel) at a base price and allows it to pass on any increases beyond the base price to consumers.
A recent Review Commission appointed by the Government of Saint Lucia has noted that notwithstanding, Lucelec’s good performance over the years, there is need for the Company to pay greater attention to the areas of customer service and community relations. Additionally, it is noted that the company needs to explore means of obtaining fuel at a reduced cost and to review the application of the fuel surcharge currently in effect. For the long-term development of the Company, it is also noted that the Company needs to pay attention to human resource development and long-term planning.
Nevertheless, the weaknesses implied in the observations, as it relates to Lucelec’s corporate image and strategy do not minimize the significant role and impact of the Company. In the conclusions of the Review Commission, the following is noted:
“Lucelec is one of the more significant corporate citizens of the country and impacts the lives of all citizens and activities in Saint Lucia. It has made and will continue to make significant contributions to the development of Saint Lucia.”
While some issues have been raised regarding the exclusivity of the license to generate and distribute electricity in Saint Lucia, the Review Commission also notes that while there is need to review the Electricity Supply Act No. 10 of 1994, “ there are still sufficiently strong reasons for the exclusivity granted to Lucelec.”

11
1.3 MANAGEMENT STRUCTURE
Lucelec’s organizational structure includes the Board of Directors, Managing Director and Senior and Middle/Line management. The structure is as follows:
Lucelec management team comprises twelve highly experienced professionals. The management team is assisted by middle or line managers, who have responsibilities for profit centers, operations and head office activities.
1.4.1 HUMAN RESOURCE
Lucelec employs approximately 244 persons, including management. The Company’s wages are generally above the minimum wage level in Saint Lucia. The workforce is unionized with terms and conditions governed by a collective agreement. There have been no major industrial disputes over the last five years. The level of absenteeism, accidents and staff turnover are very low and compare favorably with international norms.
All employees are required to have some form of formal qualification for employment, and almost 10% are certified to degree level. There is in-house training capability for all training needs of the organization, except for the most skilled professional needs.
BOARD OF DIRECTORS
MANAGING DIRECTOR
Chief Engineer Financial Controller
Company Secretary/ Internal Auditor
Planning Manager
Transmission & Distribution
Manager
Generation Engineer
Chief Accountant
Customer Service
Manager
Stores Manager
System Control
Engineer
IT Business Unit
Manager
- HR Manager - HR Advisor
Purchasing Manager

12
Though the Company lost three (3) senior staff in the recent past, no effects on the Company’s operation are noticeable. The Company is conscious of the need for succession planning and has been adopting measures to deal with this issue. There is a an increased awareness of the need to prepare for the future and all the Company's training programs place a high priority on this.
1.5 OPERATIONS
St. Lucia Electricity Services Limited is the sole commercial generator, transmitter, distributor and seller of electrical energy in St. Lucia. The customer base as of December 31st 2002 was 48,633, consisting of residential, commercial and industrial customers. Lucelec operates three power stations, with a standby facility at Soufriere on the western coast of Saint Lucia and three sub-stations integrated to form one power system. The Company uses diesel fuel as its exclusive energy source and has a fuel supply contract with Hess Oil St. Lucia Limited (HOSL).
1. Generation
In 2002, generation operations recorded 239 million units of electricity for sale. Demand peaked at 43,400 kilowatts. Fuel cost represented approximately 30% of total cost and over 40% of operating cost.
Cul de Sac power station is the mainstay of operations, though the aging Union Power Station is held in availability in case of need. Cul de Sac remains a state of the art station, where the facilities and sophistication can compare with any in the world. The performance and reliability of the new Wartsila diesel generators is superlative, and problems experienced in earlier years with other equipment have been completely resolved. The Company now serves its customers with one of the finest generating systems in the region.
2. Transmission & Distribution System The critical transmission and distribution systems are responsible for providing the power supply to all domestic and business customers. The Company has built a 66 kV line to the north, extending to Reduit Substation in the north of the island, to Dennery on the East Coast. The System Control department coordinates the various facets of system operation, and in particular manages the unified transmission and generating systems introduced in 1990. The department currently coordinates the operations of Cul de Sac and Union power stations, with a transmission and distribution system serving six 66 kV sub-stations and over 1,000 miles of overhead lines. An enhanced computerized SCADA (System Control and Data Acquisition) system was installed in 2000.

13
3. Administration
Currently all customer services are handled at the Company's offices at Castries and Vieux Fort. A number of local banks and other locations around the island are used to facilitate easy access to points of payment. Lucelec has expanded its computer network to facilitate the servicing of its customers.
The Company utilizes a sophisticated computer system with a specialized software module for its billing operations. This enables the Company to effectively manage over 47,000 customer accounts. Computer facilities have been greatly expanded throughout the Company, supported with adequate training, thus providing all operating centers access to the information they need to manage efficiently in an increasingly demanding environment. Alternate month meter reading and estimate billing for domestic accounts was introduced in 1998. However, there had been concerns from the public for the Company to provide monthly actual readings and billings and monthly reading was re-instituted in 2002.
1.5.1 OPERATING STATISTICS
The following statistics reflect the production capacity and operations of Lucelec for the period 1997 - 2002
Table 1
Operating Capacity
Generating Plant (kW) 1997 1998 1999 2000 2001 2002
Installed Capacity 44,500 59,900 59,900 66,400 66,400 66,400
Firm Capacity 32,600 46,700 46,700 47,800 47,800 47,800
Peak Demand 34,650 37,200 41,000 43,300 43,300 43,400
Percentage growth in peak demand 6.6% 7.4% 10.2% 5.6% 0.0% 0.2%
While growth in peak demand reduced over the latter part of the period under review, this situation could be attributed to the economic difficulties in Saint Lucia and the region generally. Notwithstanding, it is expected that as the economic situation improves over the medium to long-term Lucelec has the capacity to meet increased demand.
14
1.6 MANAGEMENT INFORMATION SYSTEMS
Lucelec has made significant investments in its management information systems. The Company recognizes that information technology is an important factor in the delivery of quality service in a cost effective manner. The application of software systems within the Company in 1982 was directed at the provision of solutions to simplify the complexity of managing large volumes of customer data and providing accounting information for proper administration of the business. A suite of integrated applications from Avenir Systems is used by the Company to manage its billing and cash collection. This software has added a degree of sophistication to billing and has simplified editing and verification procedures. Computer software suitable to the needs of the Company is available. Real time processing capabilities are used, providing automated inventory counts and re-order facilities linked to the various operations. Besides providing details of product consumption, the system caters for monitoring and reporting on the status of contacts with customers. This serve to ensure that customers’ needs are met on demand, but also as a management tool to ensure adherence to the Company’s service standards and to assign responsibility for work to relevant persons and department. The Datamatic Route Star software is used to administer the collection of meter readings using hand-held devices. This system is fully automated. The accounting system of the Company is fully computerized. Avenir’s integrated financial suite is used for that purpose. Other up-to-date systems are used to manage and maintain its generation and transmission operations. Security and firewall arrangements are implemented to protect the integrity of the Company’s data system. Continual upgrading of hardware and training of staff has been recognized as essential to make maximum use of the information technology.
The Company has sourced adequately trained and qualified information technology personnel for the management of its computer system. The software supplier also provides specific training for staff and upgrades are made available, with necessary training of IT personnel. The reporting system is quite efficient and assists in providing management with timely and accurate information for quick decision-making. Lucelec’s strength in information technology is noted and the Company is giving active consideration to making its IT function a self-supporting business by offering services to other local and regional businesses.
15
1.8 DIVIDEND POLICY
The Company pays approximately 70% of income after tax as dividends to shareholders annually and plans to continue doing so. The amount of any dividend declared is determined on an annual basis after reviewing the Company’s financial position and requirements (cash flow, earnings, financial position, debt retirement obligations, growth and reserves requirements). The dividend history of the Company in respect of ordinary shares is as follows:
Table 2
Dividend History of Lucelec 1998 1999 2000 2001 2002
Dividend per share $0.70 $1.00 $1.25 $1.15 $0.95
Return on Par Value ($10.00) 7.0% 10.0% 12.5% 11.5% 9.48%
Dividend $'000 $8,341 $11,819 $14,711 $13,478 $11,105
The projected return on ordinary shares (dividend per share on par of $10.00) for the short to medium term is 13%.
2.0 OPERATING ENVIRONMENT
2.1 Regulatory Environment
The Company operates under an exclusive statutory license, under the Electricity Supply Act of 1994. The license that expires in 2045, gives the Company the exclusive right to generate, and distribute electricity to domestic, commercial and industrial users in St. Lucia. Inter alia, the Act provides the legal framework for maintaining the companies targeted Rate of Return on Equity (ROR) .
Section four of the Act notes as follows:
“Nothing in this section permits the Review Board to review or propose any change to (a) the adjustment of basic energy rated on an annual basis; and (b) the Companies target rate of return that –(i) compensates creditors under their respective loan agreements, (ii) and provides a market rate of return on equity to be able to attract adequate levels of financing as may be required by the Company from time to time.
The fuel surcharge provision of the Act is the mechanism used for maintaining the ROR. A fuel price adjustment clause is structured to allow all increases or decreases in an established base price of EC$0.2977 per gallon of fuel, at January 01, 1973 to be passed on to the consumers.

16
There have been recommendations to review the Electricity Supply Act in so far as it relates to issues of a fuel surcharge, tariffs and guaranteed returns.
2.2 Geography
St. Lucia is located in the Windward Islands and is in the middle of the Eastern Caribbean chain of islands, approximately 21 miles south of Martinique and 90 miles northwest of Barbados. The capital city of Castries, which is in the north of the island, has a population of approximately 60,000. Two major towns in the South and west, namely Vieux-Fort and Soufriere, have populations of approximately 20,000 each, and the country’s population is approximately 150,000. Due to the support of government in a rural electrification programme over the years, all major communities are connected to Lucelec’s grid. It is expected the support of Government to the rural electrification programme will continue.
2.3 Politics & Law
Like most other English speaking territories in the region, St. Lucia’s legal system is based primarily on English law with significant French influence in its commercial legal system. The head of Government is the Prime Minister as in most other Westminster type parliamentary democratic systems, which Saint Lucia has adopted. The island gained independence in 1979 and is a member of the British Commonwealth.
2.4 Economy
According to the last budget addressed presented to the parliament of Saint Lucia on April 08, 2003 the performance of the Saint Lucian economy in 2002 was influenced by a recovery in banana output, expansion in output of the manufacturing and communications sectors, and modest recovery in tourism arrivals. However, the increase in activity in tourism was offset by the prevalence of heavy discounting within the industry.
The gross domestic product of the country was EC$1109.09 million in 2002, and grew marginally at a rate of 0.11% in 2002 following on contraction of 4.6% in the previous year. The country experienced deflation as movement in the consumer price index (CPI) dropped to -0.64% in 2002.
The following reflects the performance and status of some of the major sectors of the economy at the end of 2002:
2.4.1 Agriculture
The agriculture sector’s contribution to the economy in Saint Lucia is significant to out put and employment. Its direct impact on consumer spending is significant. Output in the agriculture sector, which contracted by 22.6% in 2001, contracted slightly by only 1% in 2002. Reflected in this performance, is growth of 36.7% in value added in the
17
Banana Industry. Banana exports increased by 41.5% to 48,160 tonnes, due to the positive impact of restructuring initiatives in the industry.
Despite the improvement in output and the restructuring of the industry, the Banana Industry is still faced with the major challenge of liberalization of the market in 2008. The survival of the Banana Industry beyond 2008 will depend entirely on Saint Lucia’s ability to produce and market a top grade, world-class fruit at a high level of efficiency.
Non-banana production is a significant component of the agricultural sector’s contribution to Gross Domestic Product. Activity in the livestock sub-sector increased by approximately 5%, while there was a decline in output in the fisheries sector. Overall the contribution of Agriculture, Livestock, Forestry and Fishing to GDP in 2002 was 5.91%.
2.4.2 Manufacturing
Improvements were recorded in the manufacturing sector during the year 2002. Activity in that sector increased by 5.0% compared to a decline of the same magnitude in 2001. The contribution of the sector to GDP is approximately 6.29%.
Based on the current regime of fiscal incentives, technical assistance grants and Consumption Tax rebates, it is expected that the sector should continue to improve.
2.4.3 Construction and Housing Development
Construction activity increased during the year 2002. Applications for building permits increased by 12.8% over 2001. The increase was mainly due to applications for building for commercial purposes, as residential related applications declined. It is expected that given Government’s intention to provide additional support to the Housing Sector, through its various low and middle income housing initiatives, activity in the construction will accelerate. The contribution of the sector to GDP is approximately 8.5%. The direct benefit to Lucelec should be noted.
2.4.4 Tourism
In 2002, tourism continued to contribute significantly to the economy, accounting for 12.5% of total GDP, which represents the largest contribution by any sector. Following an unprecedented 7.3% slump in 2001, there was a 1.3% rebound in arrivals to 253,463, just over the 1998 level.
In the cruise sector, ship arrivals slumped by 21%, from 378 in 2001 to 245 for 2002. Arrivals fell consistently throughout the past year, with sharp drops in April, July, August and November. Cruise arrivals totaled 387,180 in 2002, slowing from the more robust gains of the past and below the 500,000 mark, achieved in 2001.

18
Indications are that the real tourism output, as measured by value added in the hotel and restaurant sectors, slipped by 0.6%. Indicating that the sharp contraction of 10.6% experienced in 2001 was reversed. Given the international environment and global competition in this sector, the Industry has some challenges ahead.
The direct and significant impact of the traditional land base tourism on Lucelec’s performance should be noted. Notably, developments in the tourism and construction sectors in particular, impact directly on the performance of Lucelec. Moreover, Lucelec like most utility companies cannot create demand for its service. Rather it responds to the demand for electricity, which is strongly positively correlated to the economic fortunes of Saint Lucia.
3.0 FINANCIAL PERFORMANCE & ANALYSIS
3.1 Historical Performance
Lucelec financial strength has been focused on providing a satisfactory return to shareholders. Return on equity averaged about 15.6% over the period 1997 to 2002 while return on assets has averaged about 5%. Earnings per share (EPS) have grown from $0.78 in 1997 to $1.39 in 2002, an average of 13.8% over the period. At the end of financial year 2002, share book value (SBV) was $9.87. Dividends per share on par value of $10.00 (DPS) have ranged from 6% to 12.5% during the period 1997 to 2002, an average of 9%. The dividend payout ratio has averaged 68%.
Generally, it can be said the Lucelec is in a strong financial position with all favourable financial indicators. The tables below illustrate Lucelec’s overall financial performance over the period 1997 to 2002 (Table 3 to 4):

19
Table 3
Selected Historical Financial Data
(In Eastern Caribbean Dollars)
ITEMS 1997 1998 1999 2000 2001 2002 AGR* Current Assets 45,983,219 36,324,977 51,730,607 45,195,865 47,879,225 44,873,389 1.7%Current Liabilities 28,464,310 37,495,798 45,315,182 41,750,926 46,451,096 38,144,321 7.6%Working Capital 17,518,909 (1,170,821) 6,415,425 3,444,939 1,428,129 6,729,068 -97.7%Investments 3,000,000 3,000,000 0 0 0 0 0.0%Inventory 8,747,910 12,816,717 14,918,708 15,195,294 14,068,338 10,809,051 6.8%Operating Cash Flow 30,168,524 39,491,446 50,568,985 54,832,098 54,676,029 50,095,590 11.7%Fixed Assets 221,325,885 241,148,710 238,027,980 261,728,100 262,957,269 256,014,139 3.1%Long term Debt 105,596,844 95,117,317 88,047,381 99,215,983 91,982,796 83,987,755 -4.1%Other Long term Liabilities 29,407,452 34,845,522 35,705,773 38,346,749 39,336,037 40,445,907 6.8%Consumer contributions 20,006,740 21,447,637 22,340,384 22,918,501 22,624,660 23,108,370 3.0%Ordinary Share Capital 80,162,792 80,162,792 80,162,792 80,162,792 80,162,792 80,162,792 0.0%Retained Earnings 6,670,966 11,404,621 18,187,075 24,529,014 30,279,113 35,038,383 40.9%Reserves 0 0 0 843,000 1,083,000 520,000 -11.8%Total Equity 86,833,758 91,567,413 98,349,867 105,534,806 111,524,905 115,721,175 5.9%Total Assets 270,309,104 280,473,687 289,758,587 307,766,965 311,919,494 301,970,528 2.3%No. of Ordinary Shares (issued) 11,720,000 11,720,000 11,720,000 11,720,000 11,720,000 11,720,000 0.0%Trade receivables 17,012,786 17,427,145 24,690,001 20,289,627 24,616,821 25,393,908 10.2%Trade payables 12,818,692 11,144,936 5,272,179 5,239,323 3,010,018 3,926,757 -15.7%Provision for doubtful debt 1,057,445 451,032 722,370 1,563,275 1,681,368 na 31.7%Revenue 99,243,775 102,736,735 113,514,617 141,053,317 141,783,902 134,189,285 6.7%Cost of Goods Manufactured 68,202,494 62,476,306 63,492,266 84,942,989 85,090,524 80,945,843 4.5%Net Operating income 19,482,996 27,055,319 35,116,109 38,937,179 37,725,719 32,685,005 12.6%Net Income 12,802,902 20,000,147 26,862,700 31,360,087 28,436,321 24,069,439 16.5%Other income- Investments NA NA NA NA NA NA Income before tax 12,802,902 20,000,147 26,862,700 31,360,087 28,436,321 24,069,439 16.5%Taxation 3,672,688 6,925,591 8,261,286 10,294,148 8,968,222 7,768,204 21.2%Net Income after Tax 9,130,214 13,074,556 18,601,414 21,065,939 19,468,099 16,301,235 15.0%Dividends on Preference shares 174,843 136,901 98,960 37,942 0 0 -37.0%Dividends on Ordinary shares 7,032,000 8,204,000 11,720,000 14,650,000 13,478,000 11,104,965 11.8%

20
Table 4
Selected Financial Indicators
1997 1998 1999 2000 2001 2002 CAPITAL STRUCTURE & SOLVENCY Long term Debt to Equity 0.55 0.51 0.47 0.48 0.45 0.42 Total Debt to Equity 0.61 0.59 0.58 0.57 0.55 0.51 Total liabilities to Total Assets 0.33 0.32 0.32 0.31 0.31 0.29 LIQUIDITY Current Ratio 1.62 0.97 1.14 1.08 1.03 1.18 Quick ratio 1.31 0.63 0.81 0.72 0.73 0.89 Cash Flow Ratio 1.06 1.05 1.12 1.31 1.18 1.31 RETURN ON INVESTED CAPITAL Return on Assets 0.03 0.05 0.06 0.07 0.06 0.05 Return on Equity 0.10 0.14 0.19 0.20 0.17 0.14 ASSET UTILIZATION & EFFICIENCY Fixed Assets Turnover 0.45 0.43 0.48 0.54 0.54 0.52 Aging of Payables 47.14 39.60 16.95 13.56 7.75 10.68 Aging of Receivables 62.57 61.91 79.39 52.50 63.37 69.07 Trade payables/Trade receivables 0.75 0.64 0.21 0.26 0.12 0.15 Provision for bad debt/Trade receivables 0.06 0.03 0.03 0.08 0.07 NA PROFITABILITY Profit margin (net profit/turnover) $0.13 $0.19 $0.24 $0.22 $0.20 $0.18 Earnings per share –EPS $0.78 $1.12 $1.59 $1.80 $1.66 $1.39 EPS (% on Par) 7.79% 11.16% 15.87% 17.97% 16.61% 13.91% Ordinary Dividend Per Share (DPS) $0.60 $0.70 $1.00 $1.25 $1.15 $0.95 Ordinary DPS (% on Par) 6.00% 7.00% 10.00% 12.50% 11.50% 9.48% Ordinary Dividends as % of Net Income 77.02% 62.75% 63.01% 69.54% 69.23% 68.12% Total Equity/No.of shares (SBV) $7.41 $7.81 $8.39 $9.00 $9.52 $9.87
21
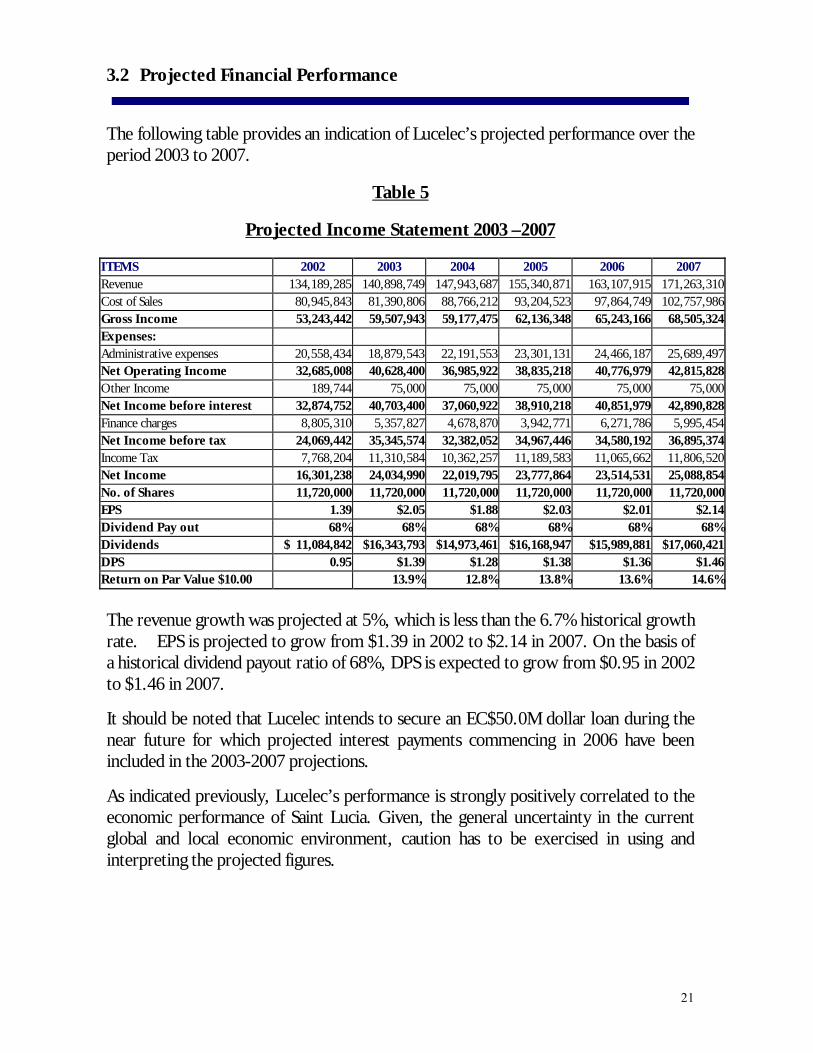
3.2 Projected Financial Performance
The following table provides an indication of Lucelec’s projected performance over the period 2003 to 2007.
Table 5
Projected Income Statement 2003 –2007
ITEMS 2002 2003 2004 2005 2006 2007 Revenue 134,189,285 140,898,749 147,943,687 155,340,871 163,107,915 171,263,310Cost of Sales 80,945,843 81,390,806 88,766,212 93,204,523 97,864,749 102,757,986Gross Income 53,243,442 59,507,943 59,177,475 62,136,348 65,243,166 68,505,324Expenses: Administrative expenses 20,558,434 18,879,543 22,191,553 23,301,131 24,466,187 25,689,497Net Operating Income 32,685,008 40,628,400 36,985,922 38,835,218 40,776,979 42,815,828Other Income 189,744 75,000 75,000 75,000 75,000 75,000Net Income before interest 32,874,752 40,703,400 37,060,922 38,910,218 40,851,979 42,890,828Finance charges 8,805,310 5,357,827 4,678,870 3,942,771 6,271,786 5,995,454Net Income before tax 24,069,442 35,345,574 32,382,052 34,967,446 34,580,192 36,895,374Income Tax 7,768,204 11,310,584 10,362,257 11,189,583 11,065,662 11,806,520Net Income 16,301,238 24,034,990 22,019,795 23,777,864 23,514,531 25,088,854 No. of Shares 11,720,000 11,720,000 11,720,000 11,720,000 11,720,000 11,720,000 EPS 1.39 $2.05 $1.88 $2.03 $2.01 $2.14Dividend Pay out 68% 68% 68% 68% 68% 68%Dividends $ 11,084,842 $16,343,793 $14,973,461 $16,168,947 $15,989,881 $17,060,421DPS 0.95 $1.39 $1.28 $1.38 $1.36 $1.46Return on Par Value $10.00 13.9% 12.8% 13.8% 13.6% 14.6%
The revenue growth was projected at 5%, which is less than the 6.7% historical growth rate. EPS is projected to grow from $1.39 in 2002 to $2.14 in 2007. On the basis of a historical dividend payout ratio of 68%, DPS is expected to grow from $0.95 in 2002 to $1.46 in 2007.
It should be noted that Lucelec intends to secure an EC$50.0M dollar loan during the near future for which projected interest payments commencing in 2006 have been included in the 2003-2007 projections.
As indicated previously, Lucelec’s performance is strongly positively correlated to the economic performance of Saint Lucia. Given, the general uncertainty in the current global and local economic environment, caution has to be exercised in using and interpreting the projected figures.

22
4.0 RISK ISSUES/ANALYSIS
Some of the important risk issues that are worthy of noting are as follows:
4.1 Deregulation
With the trend of deregulation and liberalization, the dedicated electricity generator and supplier may become something of an anachronism. Notwithstanding the high entry barriers, as persons seek to find alternative supply of energy, Lucelec’s position as the sole provider and distributor of electricity can be challenged as independent power suppliers attempt to enter the market. Additionally, given the recommendations for changes to the Electricity Supply Act, such changes are likely to present certain financial risks to investors when implemented.
4.2 New Approaches to Business
Increasingly, power providers are moving out of their traditional home grounds to create new business opportunities that will increase the revenue base and create added value for shareholders. Whether Lucelec will consider moving into other areas within the Eastern Caribbean or other companies seeking to operate in Saint Lucia, in some form or fashion is uncertain. However these are possibilities that are likely to impact on the operations and performance of the company.
4.3 Technological Change
Technological advance is also creating change. The imminent impact of fuel cells will create a completely non-polluting, environment-friendly, and compact source of power that could threaten the very survival of traditional power companies. The opportunity to go to the nearest supermarket and buy a power source is an appealing and entirely possible alternative in the not too distant future. There is also the challenge of power generation from micro-turbines supplied from a gas source, allowing a distributed resource without the need for huge central generating stations and costly transmission facilities.
The rapid increases in the price of fuel, driven by reducing resources of oil and increasingly stringent environmental regulations, will also drive the development of alternatives. Increasingly, in spite of difficulties with inconsistent wind regimes and the great difficulty with energy storage devices, wind and solar power will become more attractive alternative or supplement to existing fuel-based supplies. These are likely to impact on the nature of Lucelec’s operations and performance.
23
4.4 Economic
There is a high positive correlation between the performance of the economy and the success of the power industry and therefore any downturn in economic performance will have an effect on the Company’s sales revenue. Economic pressures from globalization and trade liberalization continue to affect the economies of the region. Substantial reductions in revenue from the agricultural sector and the effects of September 11, 2001 and the current Iraq war on the tourism industry have and are contributing to increased unemployment, and thus affecting the purchasing power of consumers and business development. Potential investors must note the direct impact on Lucelec’s performance.
4.5 Natural Disasters
Due to the nature of Lucelec’s operations, natural disasters pose great threat on the operations of the Company. Large losses in income may result from the passage of natural disasters such as hurricanes, as the network of overhead power lines can be disrupted.
4.6 Supplier
Lucelec relies on a single supplier for fuel in the production of electricity, albeit at a special price. Such a relationship poses a serious risk to the company’s performance, should this single supplier experience difficulties with its supply.
4.7 Financial Leverage
Lucelec intends to contract additional long-term debt of EC$50.0M. Though the projected interest cost has been factored, investors should note this, as the total debt to equity ratio would move to approximately 58:42.
5.0 VALUATION AND INDICATION OF PRICE
5.1 Information and Data Used
The valuation exercise was conducted based on historical information supplied by Management of the Company, supported by audited financial statements by the firm of PricewaterHouseCooper and budget and projected income statement for the year 2003, also supplied by Management and examined by the Valuers for consistency with the historical performance as reported.
Generally, the budgeted and projected income statement is consistent with the historical performance of the company and relevant to its current business environment.

24
5.2 Valuation Models and Values In commenting on the valuation of the Company it must be noted that valuation is not a science. However, a menu of models exists for determining the value of firms. Three models were employed in valuing the equity of St Lucia Electricity Services Limited (Lucelec) – The Discounted Cash Flow Model, Dividend Discount Model and the Constant Dividend Growth Model. 5.2.1 Discounted Cash Flow Model
This model is based on the determination of the present value of the expected or projected free cash flows of the firm to a horizon year, by discounting with an appropriate factor. Fundamental in this approach is the determination of the appropriate discount factor and determining the reasonableness of the projected free cash flows. This model of valuation is also extremely sensitive to the quality of input data, in projecting free cash flows.
Discount Factor In determining the discount factor several issues were taken into consideration. Principally, using the Capital Asset Pricing Model (CAPM), an attempt was made to determine the cost of equity. The average rate on 10-year government bonds in the Eastern Caribbean region was used as the risk free rate (rf) and the average return on equities in the region was used as the market risk (rm). Using a weighted beta (β), based on the utilities industry sector betas in the USA, and adjusting for the following variables: (i) general economic conditions in St Lucia and the Eastern Caribbean region, (ii) current predictions for inflation in Saint Lucia, (iii) country risk; (iv) size premium based on historical returns, and (v) operational risk, given the nature of the operating environment, a discount factor of 0.12 was arrived at.
In the view of the valuers this discount factor incorporates: the opportunity cost of capital, characteristics of the utility (electricity generating companies) industry, country/region and operational risk as perceived by the valuers. The discount factor also reflects the current and expected rate of return of the company.
On the basis of the foregoing, a total equity value of EC$206,204,024 and a share value of EC$17.59 was concluded. 5.2.2 Constant-Growth Dividend Discount Model
The dividend valuation model is based on the premise that the value of ordinary shares represents the sum of future dividend flows, discounted to a present value. The factors determining the growth rate of dividends include the quantity of resources retained and reinvested; the rate of return on retained resources; and the rate of return on existing
25
assets. These are reflected in two important variables: expected growth rate (g) and discount rate (k). The model is predicated on a constant future state. The model reviewed the average annual growth rate of dividends over the years, but used the 2002 dividend payment and projected returns in perpetuity. On the basis of the foregoing a total equity value of share value of EC $161,853,200 and a share value ofEC$13.81 were determined 5.2.3 The Dividend Discount Model As a variation to the Constant-Growth Dividend Discount Model, the Dividend Discount Model was used in where in growth was not projected in perpetuity.
The results of this model indicated an equity value of EC$151,891,200 and a share value of EC$12. 96.
Generally, the variations inherent in the valuation of shares cannot be escaped, as the future always remains uncertain. What investors are willing to pay depends on what is expected to happen in the future. It makes sense to treat different valuations as complimentary, but it is also important to identify the weaknesses of each approach and apply informed judgment to determine the value region.
While the results of the three models show some variations, the values determined are in no way invalidated. Investors may want to base their investment decisions within the range provided or an average value. Additionally, since the DCF model is more sensitive to errors in projections, greater reliance could be placed on the Dividend Models, not withstanding their inherent weakness as well. Lucelec’s shares were being traded through a resale facility at the former Barclays Bank Plc. in Saint Lucia. The arrangement ceased upon the establishment of the Eastern Caribbean Securities Exchange. Last traded price on that facility at September 30, 2001 was EC$11.50. Over the period of trading through that facility, the price ranged between EC$10.50 and EC$11.50
GIVEN THE RESULTS OF THE THREE MODELS, A RANGE OF VALUES FOR THE SHARES OF LUCELEC IS PLACED AT EC$12. 96 TO EC$17.59.
26
6.0 CONCLUSION
The significant finding is the overall strong financial position of Lucelec. While at the business and corporate level there are some critical issues that require attention, these should not detract from the historical and projected financial performance of the Company. It is noted that in the medium to long term there may be significant changes in the operating and regulatory environment of Lucelec. As well, there may be some significant internal changes, as CDC considers and finalizes its relationship the Company. However, with the development of the relevant corporate strategies, Lucelec should be able to respond to the new internal and external challenges and continue its satisfactory financial performance.
Like all investments there are some significant risks that investors should note. However, given the range of values placed on the shares, investors should be able to determine the price that they are willing to pay for the shares based on the range of values provided.