St. Joseph Coastal Engineering Study - Great Lakes Coastal...
97
City of St. Joseph Coastal Engineering Study August 17, 2012
Transcript of St. Joseph Coastal Engineering Study - Great Lakes Coastal...

City of St. Joseph Coastal Engineering Study August 17, 2012

St. Joseph Coastal Engineering Study

St. Joseph Coastal Engineering Study
City of St. Joseph, Michigan Coastal Engineering Study
Prepared for:
City of St. Joseph 700 Broad Street
St. Joseph, Michigan August 17, 2012
Prepared by: Survey consultant:
Edgewater Resources, LLC 518 Broad Street, Suite 200 St. Joseph, Michigan 49085
Phone: (269) 932-4502
Abonmarche Consultants, Inc. 95 West Main Street
Benton Harbor, Michigan 49022

St. Joseph Coastal Engineering Study i

St. Joseph Coastal Engineering Study ii
Table of Contents
Purpose 1
Executive Summary 1
Study Areas 2
Definitions & Coastal Considerations 4
o Vertical Datum o Waves o Wave Runup o Lake Michigan Water Level o Floodplain o Ordinary High Water Mark o Littoral Drift o High Risk Erosion Area o Seiches
Berrien County Coastal Damage: 1957-1977 19
Other Great Lakes States 22
Great Lakes Shoreline Protection 23
o Design Considerations o Failure Examples o Successful Examples
Area 1 Findings 29
Area 2 Findings 31
Area 3 Findings 33
Reference List
Appendices
Exhibits


St. Joseph Coastal Engineering Study 1
PURPOSE
This report is intended to evaluate the Lake Michigan coast within the St. Joseph City Limits and to provide recommendations for shoreline management to best preserve the public trust property along the shoreline and protect private interests and property, taking into consideration the unique characteristics and circumstances of the shoreline in different areas of the city that will govern the shoreline management approach. The recommended shoreline management approach is intended to help city policy makers as they evaluate options to further public purposes such as protecting natural resources; preserving the Lake Michigan shoreline, advancing the economic and environmental well-being, health, safety, and general welfare of the City; and preserving/enhancing property values by preserving the natural character of the shoreline.
EXECUTIVE SUMMARY
AREA 1
Area 1 is bookended by public parks at either end that are connected by uninterrupted public trust property and to private property. To preserve this public trust property, reduce the risks of coastal hazards to private property, and maintain the natural shoreline, we recommend the implementation of a fixed setback line, based on coastal engineering principles. The setback line would prevent the construction of structures within a fixed area adjacent to Lake Michigan and prevent the need for shoreline protection structures that cause unnatural erosion and irreversible damage to the shoreline and adjacent property.
AREA 2
Area 2 contains public parks at both ends and publicly-owned shoreline along its entire length. The area is fully developed and shallow lots prevent structures from being built significantly further from the lake than existing structures. This area is already impacted by existing shore protection activity. To protect existing structures during periods of high water, more substantial shoreline protection structures may be required. We recommend the implementation of design guidelines to preserve public access, while allowing property owners to construct, if necessary, properly designed shoreline protection structures which could ultimately become one unified structure.
AREA 3
The entire shoreline of Area 3 contains existing shoreline protection structures, including stone revetments, sheet piling, groins, and timber structures. Steep bluffs containing cohesive soils line the shoreline and the structures are necessary for the protection of the bluffs against erosion. The steep bluffs and shoreline structures restrict public access. We do not recommend additional regulation of shoreline protection structures in Area 3.

St. Joseph Coastal Engineering Study 2
STUDY AREAS
AREA 1
Area 1 includes the St. Joseph shoreline from the south limit of Jean Klock Park to the north line of the St. Joseph River. The public trust property in this area varies in width and extends from the water line to the Natural Ordinary High Water Mark (NOHWM). Structures in this area are generally located at least 300 feet inland from the Ordinary High Water Mark (OHWM), with a few exceptions that are as close as 70 feet from the OHWM.
Figure 1: Area 1 Aerial Area 1 is bordered on both ends by public parks, with Jean Klock Park to the north and Tiscornia Beach to the south. Between the parks, private properties exist and many of the lots extend several hundred feet southeast to the street known as Ridgeway. Currently, no shore protection structures exist within Area 1, apart from the federal navigation structure at the southerly limit of the area. The entire shoreline here is sandy beach and the southern half of Area 1 is typically an accretion zone, but subject to erosion at times.
AREA 2
Area 2 includes the St. Joseph shoreline from the south pier of the St. Joseph River to the north limit of the St. Joseph Water Plant. This area includes two public parks, with Silver Beach located at the north end and Lions Park Beach located at the south end. The entire shoreline here is publicly-owned with some existing federally-constructed shore protection structures and some private shore protection structures on adjacent private property. In some circumstances, the Lake Michigan water line can reach private property at the southern extents of the residential neighborhood.
St. Joseph Coastal Engineering Study 3
Area 2 consists of sandy beach, with some coarse fill from past beach nourishment. This area receives beach nourishment from federal dredging operations on a regular basis, typically annually, because it is subject to erosion. Public access along the public trust property can vary, depending on lake conditions, erosion, and beach nourishment. Private properties that border Area 2 between Silver Beach and Lions Park Beach are fully developed and parcels are typically very shallow in comparison to those in Area 1, none exceeding 132 feet in depth.
Figure 2: Area 2 Aerial
AREA 3
Area 3 includes the St. Joseph shoreline from the north limit of the St. Joseph Water Plant to the south City Limit, just south of Orleans Circle.
Figure 3: Area 3 Aerial Little to no meaningful public trust property exists here due to limited access, high bluffs, stone revetments, and other existing shoreline protection structures. The shores within Area 3, in contrast to Areas 1 and 2 are composed of cohesive material and the entire shoreline here contains shore protection of varying types and states of repair.
St. Joseph Coastal Engineering Study 4
DEFINITIONS & COASTAL CONSIDERATIONS
VERTICAL DATUM All elevations within this study are in reference to the International Great Lakes Datum, 1985 (IGLD 85), unless otherwise noted. Some elevations within the study are converted from other datums which were referenced in original documents. A table summary of the key elevations and conversions is located in Appendix 1.
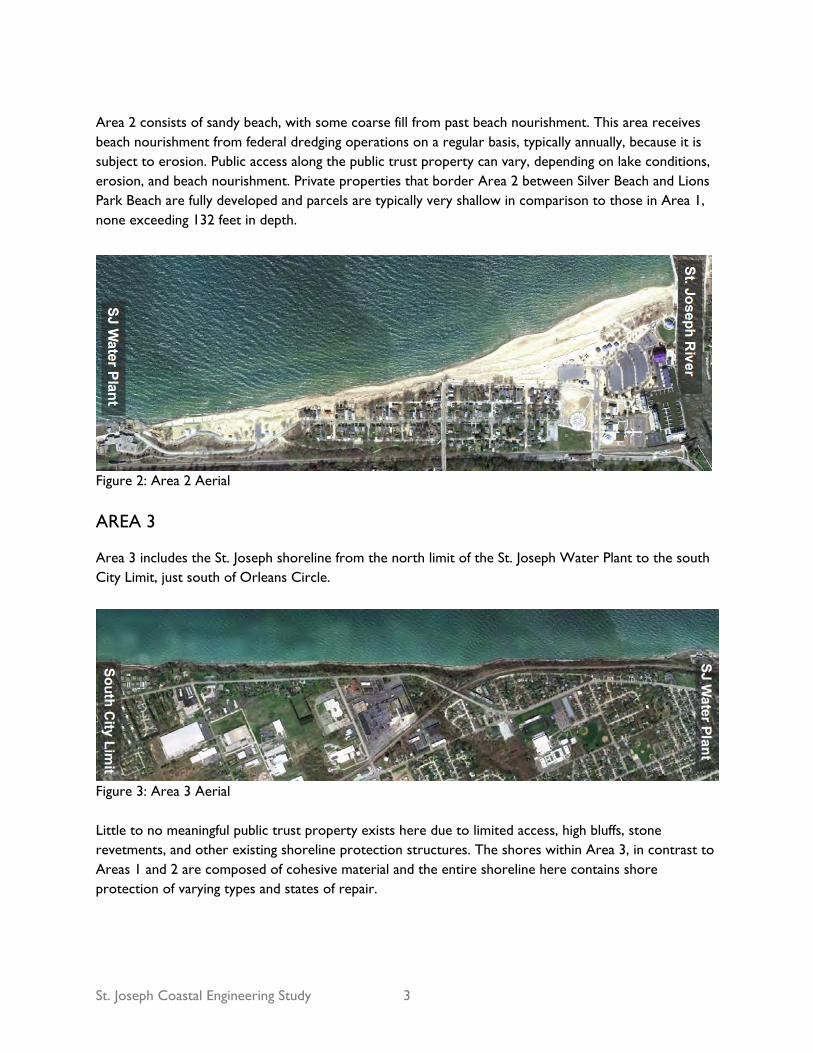
WAVES A wave is defined as the difference in elevation between the wave’s crest to its neighboring trough. In order to standardize wave heights for statistical analysis, wave heights are generally referred to as significant wave heights. A significant wave height was originally defined as the average wave height of the largest third of the waves; it is now commonly defined as four times the standard deviation of the surface elevation of the water. According to the U.S. Army Corps of Engineers Wave Information Studies (WIS) for St. Joseph, the 50-year event peak wave height is 7 meters, or 23 feet, and the 100-year event peak wave height is 7.5 meters, or 24.6 feet. A 50-year event has a 2% chance of being equaled or exceeded in any single year and a 100-year event has a 1% chance of being equaled or exceeded in any single year.
Figure 4: U.S. Army Corps of Engineers WIS Data

St. Joseph Coastal Engineering Study 5
Also according to the Wave Information Studies, wind occurs most frequently from the south-southwest direction, and high frequencies of wind also occur from the southwest and north-northwest directions (Figure 6). The greatest frequency of wave occurrence, however, is from the north-northwest, due to the long wave fetch in the north-northwest direction (Figure 7). Wave fetch is the distance over which wave-generating winds travel. In St. Joseph, although winds come from the south-southwest most frequently, the fetch in that direction is only 25 miles, so waves have a relatively short distance to form. When winds come from the north-northwest, the fetch distance is 150 miles and extreme waves can be generated. Figure 5 illustrates the St. Joseph fetch distances for each of the two most predominant wind directions.
Figure 5: Fetch Distances for St. Joseph

St. Joseph Coastal Engineering Study 6
Figure 6: U.S. Army Corps of Engineers WIS Wind Rose

St. Joseph Coastal Engineering Study 7
Figure 7: U.S. Army Corps of Engineers WIS Wave Rose

St. Joseph Coastal Engineering Study 8
As a strong, sustained wind with a large fetch blows across open water, some of its energy is transferred to the water. This energy transfer causes water to be dragged with the wind, causing a storm surge, or set-up, to occur on the leeward (downwind) side of the water body. This set-up inversely causes a set-down on the windward (upwind) side of the water body. This relationship is shown in Figure 8. Set-ups and set-downs can also be caused by sudden changes in atmospheric pressure on the lake. Since it is located on the side of Lake Michigan that is typically leeward, St. Joseph is highly susceptible to wave set-ups ranging from two to three feet. These set-ups, combined with large wave heights during a storm event, can create extreme shoreline conditions.
Figure 8: U.S. Army Corps of Engineers/University of Wisconsin. Living on the Coast. USA: U.S. Army Corps of Engineers/University of Wisconsin, 2003. Print.
WAVE RUNUP Wave runup is defined as the landward extent of wave uprush measured vertically from the still water level (Figure 9). Runup is largely dependent on deep water wave height, wave period, slope of lake bottom, and slope of shoreline. The calculated 2% wave runup of a 50-year deep water wave that propagates to shore for Area 1 is 7.0 feet and the average calculated 2% wave runup for Area 2 is 6.0 feet, both relative to still water elevation. The primary difference in runup is attributed to slope/bathymetry differences between the areas.
Figure 9: FEMA Wave Runup Graphic

St. Joseph Coastal Engineering Study 9
LAKE MICHIGAN WATER LEVEL Water levels are typically expressed in reference to a static elevation referred to as low water datum (LWD). The low water datum of Lake Michigan is elevation 577.5’ IGLD 85. As of the August 2012 U.S. Army Corps of Engineers (USACE) Lakes Michigan-Huron Water Level Bulletin (see Appendix), the current water level is +0.2’ LWD. The long-term average level for August is +1.8’ LWD, meaning that Lake Michigan is currently in a low lake level condition. The USACE has monitored and recorded Great Lakes water levels since 1918 (Figure 10). Over this period, the long term lake water level fluctuates between -1.3’ LWD and +4.9’ LWD, a range of 6.4 feet. The all-time high occurred in 1986 and the all-time low occurred in 1964. On the date of survey, the Lake Michigan water level was +0.4’ LWD. Figure 10 illustrates the horizontal movement of the water line in Area 1resulting from long term water level fluctuations and accretion.
Figure 10: Aerial comparison of 1974 waterline and 2005 waterline Although the records only extend back to 1918, they are still commonly referred to as “all-time high”/ “all-time low” and these terms will be used for the purposes of this study. However, prior to 1918, there are few records of Lake Michigan’s long term water level fluctuations. Record data from Milwaukee, Wisconsin suggests that in 1838 Lake Michigan may have reached an even higher level than the 1986 “all-time high”. The data indicates that a level of +6.6’ LWD was reached in 1838, which is 1.7 feet higher than the 1986 level. Due to information such as the record from Milwaukee, a factor of safety is recommended as the basis of design is based on 90 years of water level data. Ideally, we would have additional/older historic data, but unfortunately this is not available. Therefore, it is important to

St. Joseph Coastal Engineering Study 10
note that this report and its assumptions are based on the best information currently available (including existing studies, historic data, local, state and federal documentation) however there is no guarantee that unusual coastal conditions will not occur that could create conditions worse than projected herein. Since 1918, data for Lake Michigan shows there have been three 10-year periods of low lake level, in which water levels are at least one foot below the long-term annual average (Figure 11). These periods occurred from approximately 1931 to 1942, from 1957 to 1967, and from 1999 to the present. Each of the two previously recorded low-level periods was followed by high water levels. Based on the long term fluctuations of the Lake Michigan water level, high water can be expected to occur again in the future.
Figure 11: U.S. Army Corps of Engineers long term water level chart In addition to long term fluctuations, Lake Michigan fluctuates on an annual cycle. Typically, water levels will fluctuate one to two feet per year, with lowest water levels in the winter and highest water levels in the summer. Figure 12 below depicts the annual cycle of the Lake Michigan water level and shows the relationship between the long term average water level, current water level, OHWM, all-time high water level, and all-time low water level.

St. Joseph Coastal Engineering Study 11
Figure 12: U.S. Army Corps of Engineers short term water level chart
FLOODPLAIN (FEMA) According to the Federal Emergency Management Agency (FEMA), areas that will be inundated by the base flood, or 100-year flood, are identified as a Special Flood Hazard Area (SFHA). The base flood is the flood event that has “a 1-percent chance of being equaled or exceeded in any given year”. The base flood is defined by FEMA as a base flood elevation using historical flood events and floodplain studies. The elevations are published by FEMA Flood Insurance Studies (FIS) and on Federal Insurance Rate Maps (FIRMs). These maps also show areas that are outside of the SFHA, but still susceptible to other flood risks.
FEMA recommends and the State of Michigan requires that structures built in the SFHA are constructed at least one foot of freeboard (height) above the base flood elevation to lower the risk of flooding. FEMA’s freeboard recommendations increase when building near the coast to compensate for changing shoreline conditions, water levels and storm events. However, currently there are no FEMA requirements to account for these hazards on the Great Lakes beyond the base flood elevation, which is a still water level and does not account for waves, setup, or other coastal conditions.
Per the Berrien County Flood Insurance Study No. 26021CV000A, effective April 17, 2006, the 1% annual chance flood elevation is 584.0’ south of the St. Joseph River and 583.8’ north of the St. Joseph River (both elevations are IGLD 85, converted from NGVD 29). This document is the authoritative document for flood levels. FEMA Flood Insurance Rate Map Number 26021C0101C, revised March 1, 2007, indicates a Base Flood Elevation of 584.0’ IGLD 1985 (converted from 585.0’ NGVD 1929) along the shoreline, within the study limits. This map is shown as Figure 13.

St. Joseph Coastal Engineering Study 12
FEMA is currently collaborating with the USACE, the Association of State Floodplain Managers (ASFPM), and state partners to conduct a Great Lakes Coastal Flood Study. The study began in 2010 and will provide updated flood risk information serving the U.S. communities with Great Lakes shorelines. Currently, data collection and the application of modern analysis of historic storm and high water events are ongoing. The study will result in updated Flood Rate Insurance Rate Maps along the shorelines of the Great Lakes, with anticipated release during the period of 2014 to 2016. Berrien County is one of seven counties selected as pilot counties, so updated information for St. Joseph may be available for review sooner. The FEMA study is intended to address high water along the Great Lakes Coast due to flooding and wave and wind effects. Currently, the FEMA Base Flood Elevation is 1.6 feet above the all-time high Lake Michigan Water level however neither elevation accounts for wind and waves. The FEMA study may have results that could impact the recommendations in this analysis. Therefore this analysis should be updated once the FEMA findings are known.
Figure 13: Part of FEMA Flood Insurance Rate Map Number 26021C0101C, Revised March 1, 2007
ORDINARY HIGH WATER MARK The Michigan Department of Environmental Quality (MDEQ) provides a guidance document for clarifying the authority of the MDEQ under Part 325 of the Natural Resources and Environmental Protection Act, also referred to as the Great Lakes Submerged Lands Act (GLSLA), as it relates to the

St. Joseph Coastal Engineering Study 13
Ordinary High Water Mark (OHWM). The document refers to Section 324.32502 of the Michigan legislature, which says:
“For the purposes of this part, the ordinary high-water mark shall be at the following elevations above sea level, international Great Lakes Datum of 1955; …Lakes Michigan and Huron 579.8 feet…”
Although Section 324.32502 does not provide a conversion between IGLD 1955 and IGLD 1985, the MDEQ Guidance Document Number 325-06-02 does. It specifically names an elevation of 580.5’ IGLD 1985 as the OHWM of Lakes Michigan and Huron. This elevation will be used as OHWM for the purposes of this study and it is this elevation that constitutes the limit of the MDEQ’s jurisdiction under the GLSLA. The OHWM is +3 LWD, which is 1.9 feet below the all-time Lake Michigan high water level. The USACE defines the OHWM and limit of USACE jurisdiction of Lake Michigan as elevation 581.5’ IGLD 1985, which is one foot higher than the MDEQ OHWM elevation. Additional definitions are provided within the MDEQ guidance document to explain what is commonly referred to as the Natural Ordinary High Water Mark (NOHWM). The NOHWM is the upland boundary of the public trust property. According to the guidance document, “prior to 1968 amendments to the Part 325, the rules contained the following definition:
‘Ordinary high water mark means the line between upland and bottomland which persists through successive changes in water levels, and below which the presence and action of the water is so common or recurrent as to mark upon the soil a character, distinct from that which occurs on the upland, as to the soil itself, the configuration of the surface of the soil and the vegetation. When the soil, configuration of the surface, or vegetation has been altered by man’s activity, the ordinary high water mark shall be located where it would have been if this alteration had not occurred.’
It is important to note that the horizontal locations of both OHWM and NOHWM change over time, depending on water level, waves, and coastal processes. For instance, after a period of erosion, although the determining elevation remains unchanged, the OWHM will intersect the shoreline at a more landward point than pre-erosion. After a period of accretion, the OWHM, likewise, will intersect the shoreline at a more lakeward point than pre-accretion. Figure 14 illustrates this concept.
Figure 14: Illustration of OHWM movement

St. Joseph Coastal Engineering Study 14
LITTORAL DRIFT One of the key processes that affect the coastline of St. Joseph is littoral drift or longshore transport. Littoral drift is the transportation of sediment in the littoral zone of a water body. Littoral drift is a function of wind and wave direction, wind and wave amplitude, shoreline material, sediment supply, water circulation patterns, water level, and shoreline structures.
The creation of groins and piers create barriers that alter the sediment transportation process. This process has a major effect on a shoreline by adding material through accretion in some locations and by interrupting the supply of sediment in others, thereby resulting in an erosion-like process.
Generally, sandy shores are identified by what seems to be an unlimited supply of cohesionless beach material. Oppositely, cohesive shores are classified by having a cohesive sub layer (typically beneath a cohesionless surface) consisting of such materials as glacial till, soft rock and other various deposits. This cohesive sub layer determines the long-term shoreline condition. On cohesive shores, the thin surface layer of cohesionless (such as sand and gravel) material is eroded by coastal forces and replenished by littoral drift. When replenishment is interrupted, the cohesive sub layer can become exposed and susceptible to increased erosion.
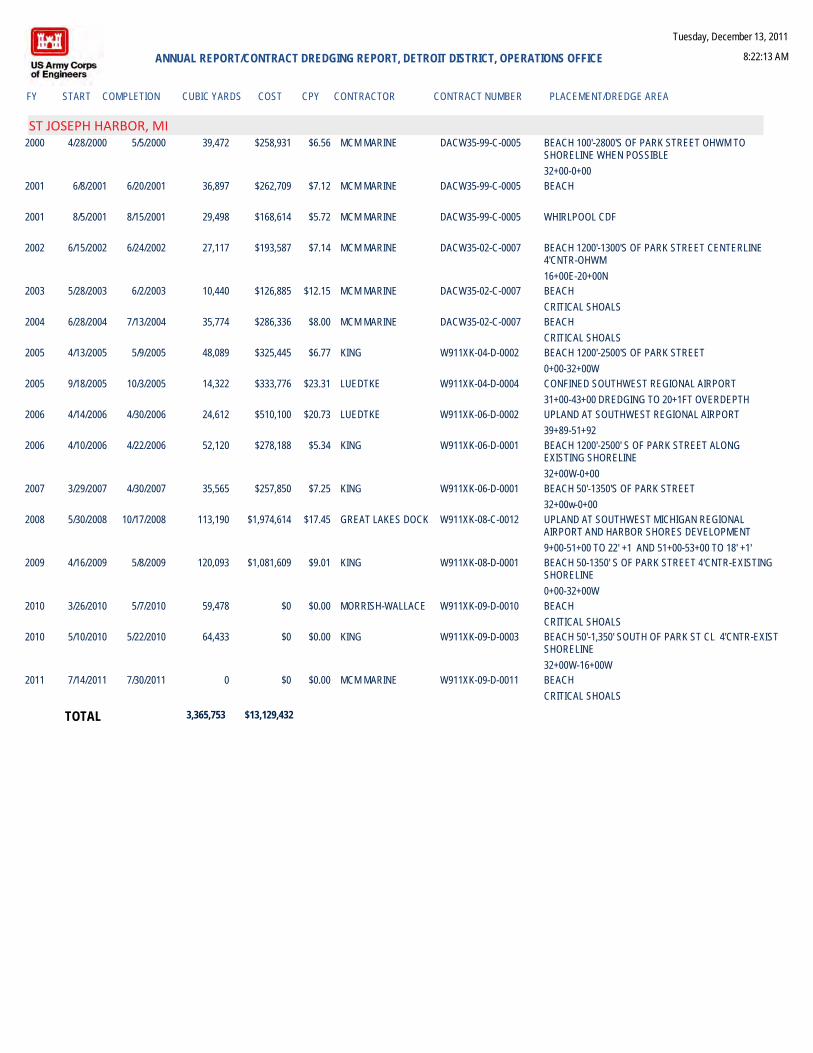
Near the City of St. Joseph, the lake bed is comprised of cohesive material with a cohesionless surface layer with varying thickness of 0-4 meters (0-13 feet). Large deposits of sand accumulate near the mouth of the harbor and are dredged on a regular basis. Since the 1970s, this material has been deposited as beach nourishment on the designated feeder beach south of the St. Joseph River, typically south of Park Street, as shown in Figure 15. This material helps to protect the existing cohesive sub layer; however, since it is primarily fine to very fine grain, it is easily eroded by coastal forces. The quantity of dredging that is completed per year ranges from 20,000 to 150,000, cubic yards, although not all of the material is used for beach nourishment. It is important to consider that USACE funding is often an issue and that beach nourishment may not always be available. A summary of dredging quantities by year is included in Appendix 3.
Figure 15: 2012 photo of beach nourishment south of Park Street showing the dredge in background

St. Joseph Coastal Engineering Study 15
Immediately north of the St. Joseph River, sand accumulates via littoral drift, creating an accretion zone. The piers act as a barrier, interrupting sediment as it is moved along the coast in a southerly direction. This accretion zone has grown during the recent 13-year period of low lake levels. This area, as well as Area 2, experiences short term erosion during significant storm events and is expected to experience erosion during the transition period from low to high water conditions (Figures 16-19).
Figure 16: January 24, 2012 - Area 1 short term beach erosion
Figure 17: January 29, 2012 - Area 1 short term beach erosion

St. Joseph Coastal Engineering Study 16
Figure 18: October, 2004 - Area 2 short term erosion
Figure 19: December, 2004, Area 2 short term erosion
St. Joseph Coastal Engineering Study 17
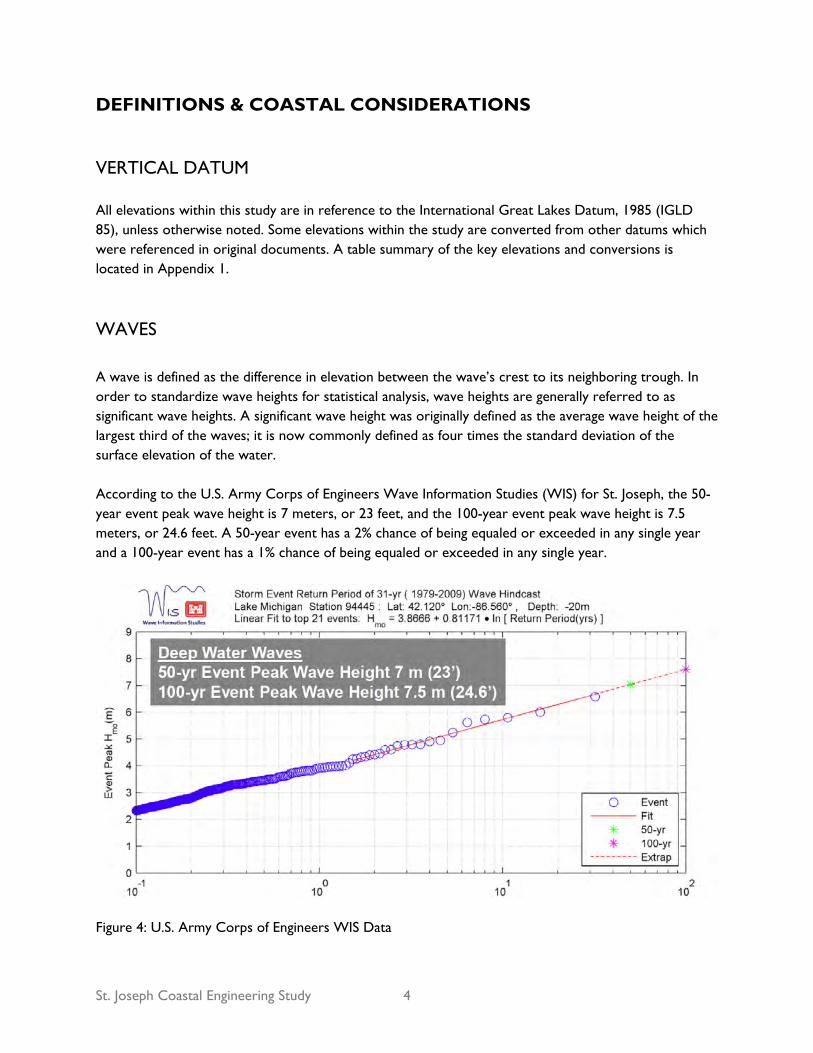
Based on the 1997 USACE study, “Effectiveness of Beach Nourishment on Cohesive Shores, St. Joseph, Lake Michigan”, Figure 20 illustrates the modeled longshore transport of sediment in Area1 and Area 2 during the early 1990s. Net transport quantities are depicted, along with northerly and southerly components.
Figure 20: Graphic representation of longshore sediment transport
HIGH RISK EROSION AREA The MDEQ identifies and designates High Risk Erosion Areas (HREAs) and defines them as:
Those shorelands of the Great Lakes and connecting waters where recession of the zone of active erosion has been occurring at a long-term average rate of one foot or more per year, over a minimum period of 15 years.
Within the study area, only one designated HREA exists, located at the southern extent of Area 3. The HREA has a projected 30-year recession of 65 feet and a projected 60-year recession of 115 feet (Figure 21). Based on aerial imagery, shoreline protection has been constructed in this area within the past five years, so recession projections will likely be revised as the HREA studies are revisited and updated.

St. Joseph Coastal Engineering Study 18
Figure 21: MDEQ High Risk Erosion Area Map Figure 22: HREA Area A1 Aerial
SEICHES According to the U.S. Army Corps of Engineers (Vol. 162 2006), a seiche is a periodic oscillation of lake levels caused by either a rapid change in air pressure or a rapid shift in wind direction as weather systems pass over the lakes. This process is often compared to water sloshing from side to side in a bathtub. A seiche can last anywhere from seconds to minutes, occurring at intervals of tens of minutes to multiple hours until stored energy is dissipated from the lake. In St. Joseph, seiches typically range from one to three feet in height.
Although data regarding seiche events is scarce, the following is a sample of events that have occurred in southern Lake Michigan since 1900:
▪ On August 24, 1900, a huge seiche like wave was reported hitting the shores of St. Joseph, washing away small boats and various other items along the shoreline. (1900 NY Times)
▪ In 1929, a seiche occurred in Grand Haven during a 4th of July Celebration with 20’ waves
sweeping people off of the piers. 10 people were killed by the event. (MSU Report)
▪ On August 3, 1960 a seiche temporarily raised the water levels in Chicago 2.5’-4’ and St. Joseph residents were warned against 4’-6’ waves. (1960 Lawrence Journal)
▪ On July 11, 2011, a seiche of unrecorded height hit near Holland causing significant damage. (2011 Holland Sentinel)

St. Joseph Coastal Engineering Study 19
BERRIEN COUNTY COASTAL DAMAGE, 1957-1977
For the ten year period 1957 to 1967, Lake Michigan experienced low to average water levels, similar to the conditions experienced today. The ten year period that followed until 1977 saw water levels rise to high levels, reaching 581.8’ (+4.3) in 1974, which is only 0.6’ below the Lake Michigan all-time high water level. This water level fluctuation is part of the normal cycle of Lake Michigan as observed from 1918 to 2012 and discussed above. High water conditions and severe storms culminated in 1973, when President Nixon declared Berrien County a disaster area, according to articles from the Herald Palladium. Damage that occurred during the early 1970s included the loss of beach, bluff erosion, damage to structures, and the loss of structures. Figures 23-26 illustrate some of the damage that occurred.
Figure 23: 1973 Herald Palladium photo of Jean Klock Park

St. Joseph Coastal Engineering Study 20
Figure 24: 1973 Herald Palladium photo of Jean Klock Park sidewalk
Figure 25: 1970s Herald Palladium photo of bluff erosion south of St. Joseph, MI

St. Joseph Coastal Engineering Study 21
Figure 26: 1970s Herald Palladium photo of bluff erosion south of St. Joseph, MI The period of 1957-1977 is an important example of what can happen as the conditions of Lake Michigan change. During times of low water, building structures closer to the lake is a dangerous temptation for many property owners and leaves structures exposed to the risk of erosion, wave action, and damage when water levels rise again. Based on 94 years of Lake Michigan water level records and the cycles that have occurred in the past, water levels will rise again and coastal communities must plan and prepare for these ever-changing conditions.

St. Joseph Coastal Engineering Study 22
OTHER GREAT LAKES STATES
Other Great Lakes states have developed standard setbacks and/or guidelines for various reasons. These states provide valuable examples of setbacks and coastal guidelines. This study will focus on the setbacks and guidelines that have been implemented in Wisconsin and in Ohio.
WISCONSIN
The State of Wisconsin implemented setbacks to “…conform to health, safety and welfare requirements, preserve natural beauty, reduce flood hazards and avoid water pollution”. Chapter NR 115 of the Wisconsin Administrative Code requires all buildings and structures to be setback a minimum of 75 feet from the OHWM of navigable lakes, rivers, and streams. This requirement applies to Wisconsin’s coastline on both Lake Michigan and on Lake Superior. In addition to the statewide setback, some counties have increased minimum setbacks. For instance, the setback in Sheboygan County is 225 feet from OHWM. Michigan does not currently have a similar setback. Additional methods are provided within NR 115 for the reduction of setbacks for lots with minimal depth or for vacant lots between lots that were developed before setbacks. Some counties require new structures to be setback as far as lots allow. Others average the setbacks of adjacent developed substandard lots to provide a requirement to an undeveloped lot. The third and most flexible method for reducing setbacks is what is called “the formula approach”. This method allows limited reduction of a roadway setback first; then allows reduction of the shoreline setback until a 30 foot deep building envelope is created. Typically, when any setback reduction is allowed, mitigation measures are required to compensate for the reduction of buffers.
OHIO
In 2011, the Ohio Department of Natural Resources, Office of Coastal Management published the Ohio Coastal Design Manual to “promote better projects along the Ohio shore of Lake Erie”. It provides guidance in the design of commonly constructed structures for engineers, surveyors, and landowners, while attempting to balance erosion control needs with lake access and protection of natural resources. The manual does not provide specific setback requirements but does include guidance for the design of shoreline structures, including considerations such as erosion, existing structures, geology, habitat, near shore bathymetry, wave climate, submerged lands, water levels, littoral drift, revetment flanking, and revetment materials. Based on conversations with the Ohio Office of Coastal Management, setbacks have not been implemented. However, where a proposed structure is within a designated Coastal Erosion Area, plans must be submitted to the Office of Coastal Management for review and approval before construction can commence. In Ohio, the Coastal Erosion Areas are updated every ten years and are based upon recession rates observed from aerial photos, similar to Michigan’s High Risk Erosion Areas.

St. Joseph Coastal Engineering Study 23
GREAT LAKES SHORELINE PROTECTION
According to the USACE Coastal Engineering Manual (Section III-5-13):
(1) The two most important issues in the planning and management of cohesive shores relate to implementing setbacks for development and to managing human influences on the sediment supply.
(2) Many Jurisdictions along U.S. shorelines impose a setback for new development consisting of some multiple of the average annual recession rate (e.g., 30 to 100 times the average recession rate). The purpose of the setback is to avoid the need for shore protection within the life of the new development, recognizing the irreversible and inevitable erosion that occurs along cohesive shores (and some sandy shores as well).
[emphasis added]
Shoreline protection structures reflect and accelerate wave energy, causing unnatural erosion and resulting in irreversible changes to the shoreline. Where possible, it is recommended to avoid the need for shore protection and in Area 1this opportunity still exists. Most structures are set back from Lake Michigan and the public trust property is uninterrupted between two public parks.
However, in Area 2, structures are located closer to Lake Michigan, potentially requiring the construction of shoreline protection structures during periods of high water in addition to the existing shoreline protection structures.
In Area 3, cohesive bluffs would be exposed to erosion, were it not for the existing shoreline protection structures that line the shore. These structures are necessary to prevent erosion and protect property.
DESIGN CONSIDERATIONS
Shoreline protection must be designed with an awareness of the following considerations:
Height: The top of the structure must be built to an elevation that will prevent wave overtopping.
Surface: Irregular shapes and permeable materials absorb wave energy, whereas flat, planar surfaces reflect and accelerate wave energy.

St. Joseph Coastal Engineering Study 24
Toe Protection: Sufficient toe protection must be incorporated to prevent scour of the toe of the structure which can result in slip failure of the structure.
Figure 27: Graphic from USACE Coastal Engineering Manual
Length: Sufficient structure length and/or return walls are required to prevent flanking of the structure and produce potential adverse effects on neighboring properties. As depicted in Figures 28-30, flanking is the erosion that occurs on either side of a shoreline structure caused by the reflection and acceleration of wave energy.

St. Joseph Coastal Engineering Study 25
Figures 28-30: Graphics from USACE/University of Wisconsin, “Living with the Coast” Booklet
FAILURE EXAMPLES
Berrien County coastal structures are subjected to severe coastal conditions on a regular basis. Any weakness will be exposed by these conditions. The USACE Coastal Engineering Manual includes examples of the effects Lake Michigan can have on these structures in order to help guide the design process of future protection.
Figure 31: Example of flanking in southern Berrien County. Note how this failure has resulted in the loss of the public trust property lakeward of the NOHWM and public passage is only possible in the lake itself.

St. Joseph Coastal Engineering Study 26
Figure 32: USACE CEM Photo, “A toppled concrete seawall along the Lake Michigan coast of Berrien County. Failure probably resulted from undermining of the underlying glacial till foundation, April 1991.”
Figure 33: USACE CEM Photo, “A steel sheet-pile wall and groin field has been ineffective at protecting this section of cohesive shore along the Berrien County shore of Lake Michigan, south of the town of St. Joseph, April 1994.”

St. Joseph Coastal Engineering Study 27
SUCCESSFUL EXAMPLES
Within the study area, two successful examples of shore protection have been identified. The first is the shoreline that borders the St. Joseph Water Plant, located at the north end of Area 3. The structure consists of armor stone, laid on a slope of 1 vertical on 2 horizontal to a top elevation of 591.20 feet. The toe of the revetment extends several feet below the lake bottom to prevent scour.
Figure 34: St. Joseph Water Plant Revetment Oblique Photo
Figure 35: St. Joseph Water Plant Revetment, spring 2012

St. Joseph Coastal Engineering Study 28
The stone revetment along South Lakeshore Drive provides another example of a successful shoreline protection structure. It is also comprised of armor stone set at a slope of approximately 1 vertical on 2 horizontal and protects the high bluffs on which South Lakeshore Drive is constructed.
Figure 36: Stone Revetment along South Lakeshore Drive Oblique Photo However, although both of these stone revetments have been successful in protecting the water plant and South Lakeshore Drive bluff, respectively, from erosion, they have had a dramatic effect on the public trust property along the shoreline.

St. Joseph Coastal Engineering Study 29
AREA 1 FINDINGS
CURRENT CONDITIONS
Area 1 is bordered by Jean Klock Park to the north and Tiscornia Beach to the south. Between the parks, private properties exist and many of the lots extend several hundred feet from the street known as Ridgeway to Lake Michigan. Currently, no shore protection structures exist within Area 1. The entire shoreline is sandy beach. The southern half of Area 1 is typically an accretion zone, but subject to erosion as well. The public trust property in this area varies in width and extends from the water line to the NOHWM, connecting the public parks.
Figure 36: Area 1 typical shoreline
SHORELINE MANAGEMENT RECOMMENDATION
We recommend that the City of St. Joseph prohibit the construction, erection, or expansion of Structures, as defined by the Zoning Ordinance of the City of St. Joseph, within Area 1 by a fixed setback line as shown on the attached exhibit, “Area 1 Proposed Setback Line”. The definition of a Structure per the Zoning Ordinance of the City of St. Joseph is as follows:
“Anything fabricated, constructed or erected, the Use of which requires fixation or placement in, on or attachment to something having location on the ground including but not limited to all Buildings, independently supported Decks, satellite dishes and free-standing Signs; excepting anything lawfully in a public Right-Of-Way including but not limited to utility poles, sewage pumping stations, utility manholes, fire hydrants, electric transformers, telephone boxes, and related public facilities and utilities defined as essential public services. A paved, uncovered parking lot is not considered a structure.”

St. Joseph Coastal Engineering Study 30
We recommend that the following Structure types be exempt from the setback ordinance: Walkways that are not attached to primary structures Staircases of wood construction only that are not attached to primary structures Free-standing signs
The location of the propose setback line is based upon the long-term cycles of Lake Michigan and therefore is a fixed line, not a line defined by elevation that may move during short term changes. The setback would help preserve the public trust property along the shoreline, maintain the natural shoreline, and reduce the risk of coastal hazards to private structures. The location of the proposed setback is based upon the following factors:
Lake Michigan all-time high water level + 5.0 LWD (Rounded from +4.9 LWD)
Storm surge of two feet + 2.0’ 2% wave runup, 50-year deep water wave + 7.0’
+ 14.0’ LWD = Elevation 591.5’ Factor of Safety
o Factor of Safety of 1.3 applied to average offset of the calculated runup elevation from current still water level. (50’) Engineering design utilizes a factor of safety ranging from 1.2 to over 4.0, depending on what is being designed, data quality/accuracy and consequences of failure. Most designs use a factor between 1.2 and 1.8.
o Reduces the likelihood that structures will adversely affect the public trust property and the natural shoreline
o Provides space to account for the constantly-changing shoreline The location of the setback line should be reviewed, at minimum, every ten years or with a change in the Lake Michigan water level of four feet or more from the current water level of +0.2’ LWD to ensure it is performing its intended function based on continuing experience and then current conditions. This recommendation is based on 94 years of Lake Michigan water level data and less than fifty years of wave data. Recognizing that we do not have data extending beyond these time periods, an even more conservative approach could be considered to account for future unpredictable events such as a 500-year event, which would consider layered design waves and higher lake levels, if that data were available.

St. Joseph Coastal Engineering Study 31
AREA 2 FINDINGS
CURRENT CONDITIONS
Area 2 is fully-developed by homes along the shoreline, with the exception of the two public parks at its ends. Under most lake levels, the entire shoreline is publicly-owned and consists of a sandy beach. Area 2 is an erosion zone, but typically receives beach nourishment from the USACE on an annual basis. Existing structures are built on shallow lots that do not allow structures to move significantly closer or further from Lake Michigan. In order to protect structures, in reasonably foreseeable coastal conditions, shore protection may be required because limited lot sizes restrict private property owners’ options.
Figure 37: Area 2 typical shoreline
SHORELINE MANAGEMENT RECOMMENDATION
To provide the best protection to private property while maintaining meaningful public access along the shoreline, we recommend that future shoreline protection structures within the area bounded on the north by the St. Joseph River, on the east by Lions Park Drive, and on the south by the St. Joseph Water Plant be subject to the following requirements:
Design must be prepared by a licensed professional engineer experienced in coastal engineering to account for coastal engineering factors including, but not limited to wave overtopping, scour protection, and flanking prevention.
Approval must be granted by the City of St. Joseph City Engineer prior to construction Vertical walls are prohibited Perpetual public access landward of the structure must be provided to ensure continued public
access along the coast regardless of lake levels. Structures must not adversely affect other/neighboring properties and must connect to adjacent
shoreline protection structures, if present, to eventually create one unified structure

St. Joseph Coastal Engineering Study 32
Furthermore, we recommend that any shoreline protection structures be of the same type that has been successfully constructed, such as the stone revetments at the St. Joseph Water Plant. The attached exhibit, “Typical Proposed Shoreline Protection Section” contains a typical cross section of this type of shoreline protection. This type of protection would require that private property owners be permitted to construct all or part of the structure within public property. We recognize that there are likely a number of issues that the City must or may wish to consider before implementing this recommendation, including but not limited to issues regarding ownership, maintenance, liability, cost of the structures, as well as the appropriate mechanism or procedure for permitting the construction on public property. Such issues are beyond the scope of this study.

St. Joseph Coastal Engineering Study 33
AREA 3 FINDINGS
CURRENT CONDITIONS
The entire shoreline of Area 3 contains existing shoreline protection structures, including stone revetments, sheet piling, groins, and timber structures. Steep bluffs containing cohesive soils line the shoreline and the structures are necessary for the protection of the bluffs against erosion.
Figure 38: Area 3 typical shoreline
SHORELINE MANAGEMENT RECOMMENDATIONS
We do not recommend additional regulation of shoreline protection within Area 3, beyond the regulation already administered by both the USACE and the MDEQ. Because Area 3 contains little to no public shoreline access and existing shoreline protection structures extend across its full shoreline, additional regulation is unnecessary.

St. Joseph Coastal Engineering Study 34

REFERENCE LIST
1. "Annual Report/ Contract Dredging Report, Detroit District." St. Joseph Harbor. USACE,
13 Dec. 2011. Web.
2. High Risk Erosion Areas & Critical Dune Areas. Digital image. Great Lakes Shorelands Unit.
MDEQ, 3 Oct. 2007. Web.
3. Naim, Robert B., Peter Zuzek, and Andrew Morang. Effectiveness of Beach Nourishment
on Cohesive Shores, St. Joseph, Lake Michigan. Rep. No. CHL-97-15. 1997. Print.
4. USA. Army Corps of Engineers. Detroit District. Ordinary High Water Mark and Low
Water Datum. Great Lakes Information, 7 Oct. 2005. Web.
5. USA. Army Corps of Engineers. Coastal & Hydraulics Laboratory. Wave Information
Studies. Web. June 2012.
6. USA. Army Corps of Engineers. Detroit District. Great Lakes Water Levels. USACE, 23
Mar. 2012. Web.
7. USA. Army Corps of Engineers. Engineering and Design. Coastal Engineering Manual. Vol.
No. 1110-2-1100. 2002. Print.
8. USA. MDEQ. Land & Water Management Division. Guidance Document 325-06-02. 2006.
Print.
9. USA. Wisconsin Department of Natural Resources. Wisconsin's Shoreline Protection
Program. Administrative Code. Vol. NR 115. 2012. Print.


Appendices


APPENDIX 1
St. Joseph Coastal Study Datum Conversion Chart IGLD 55 IGLD 85 NAVD 88 NGVD 29
Lake Michigan Base Flood Elevation, north of SJ River (Berrien County FIS No. 26021CV000A, effective April 17, 2006) - 583.8 584.3 584.8
Lake Michigan Base Flood Elevation, south of SJ River (Berrien County FIS No. 26021CV000A, effective April 17, 2006) - 584.0 584.5 585.0
Michigan Statutory OHWM for Lake Michigan (GLSLA Section 324.32502) 579.8 580.5 581.0 581.5
USACE OHWM for Lake Michigan - 581.5 582.0 582.5
USACE Lake Michigan Low Water Datum - 577.5 578.0 578.5
"All Time" record high water elevation (since 1918) - 582.4 582.9 583.4
Study, Calculated elevation for Area 1 setback - 591.5 592.0 592.5 Notes:
1.) Bold elevations indicate original/published elevation/datum. 2.) All elevations shown in feet.


APPENDIX 2


Ft. -10+ 1
+ 2
+ 3
+ 4
+ 5
M.
-0.30
+ 0
.3
+ 0
.6
+ 0
.9
+ 1
.2
+ 1
.5
2010
AU
G
1986
SE
P
1986
OC
T
1986
NO
V
1986
DE
C
1986
20
11
JAN
1987
FE
B
1986
MA
R
1986
AP
R
1986
MA
Y
1986
JUN
1986
JUL
1986
AU
G
1986
1964
SE
P
1986
1964
OC
T
1986
1964
NO
V
1986
1964
DE
C
1986
1964
20
12
JAN
1987
1965
FE
B
1986
1964
MA
R
1986
1964
AP
R
1986
1964
MA
Y
1986
1964
JUN
1986
1964
JUL
1986
1964
AU
G
1986
1964
SE
P
1986
1964
OC
T
1986
1964
NO
V
1986
1964
DE
C
1986
1964
13
JAN
1987
1965
CH
AR
T D
AT
UM
577.5
FE
ET
(176.0
ME
TE
RS
)
1985
1985
1973
1973
1936
1934
1926
1934
**
Av
era
ge,
Max
imu
m a
nd
Min
imu
m f
or
peri
od
19
18
-20
11
LA
KE
S M
ICH
IGA
N-H
UR
ON
LA
KE
S M
ICH
IGA
N-H
UR
ON
WA
TE
R L
EV
EL
S -
AU
GU
ST
20
12
LE
GE
ND
LA
KE
LE
VE
LS
RE
CO
RD
ED
PR
OJE
CT
ED
AV
ER
AG
E *
*
MA
XIM
UM
**
MIN
IMU
M *
*


APPENDIX 3


FY CONTRACT NUMBERSTART COMPLETION COST CPYCUBIC YARDS CONTRACTOR PLACEMENT/DREDGE AREA
ANNUAL REPORT/CONTRACT DREDGING REPORT, DETROIT DISTRICT, OPERATIONS OFFICE
Tuesday, December 13, 2011
8:22:12 AM
ST JOSEPH HARBOR, MI1963 19,325 $27,917 $1.44 GOVT/TOMPKINS
1963 81,412 $33,066 $0.41 GOVT/HAINS
1964 71,078 $48,100 $0.68 GOVT/HAINS
1965 34,500 $50,458 $1.46 GOVT/TOMPKINS
1965 51,149 $22,543 $0.44 GOVT/HOFFMAN
1965 79,643 $35,101 $0.44 GOVT/HAINS
1966 13,800 $19,441 $1.41 GOVT/TOMPKINS
1966 4/21/1966 5/19/1966 75,917 $51,546 $0.68 GOVT/HAINS
1967 4/27/1967 5/11/1967 99,244 $48,639 $0.49 GOVT/HAINS
1967 16,450 $20,319 $1.24 GOVT/TOMPKINS
1968 5/13/1968 5/22/1968 48,186 $26,681 $0.55 GOVT/HAINS
1969 5/7/1969 5/20/1969 73,316 $46,791 $0.64 GOVT/HAINS
1969 4/21/1969 5/8/1969 20,350 $23,427 $1.15 GOVT/TOMPKINS
1970 12/13/1969 12/17/1969 46,483 $37,539 $0.81 GOVT/HAINS
1971 5/23/1971 6/1/1971 33,225 $24,557 $0.74 GOVT/HAINS
1972 5/17/1972 5/27/1972 52,292 $46,611 $0.89 GOVT/HAINS
1973 3/28/1973 4/11/1973 47,828 $59,222 $1.24 GOVT/HAINS
1974 5/4/1974 5/15/1974 65,428 $54,040 $0.83 GOVT/HAINS
1975 5/9/1975 5/20/1975 69,638 $89,754 $1.29 GOVT/HAINS OPEN WATER (15,260) BEACH OVER S PIER (54,026) 1.5 MI SOUTH AT 20'CNTR (352)
1976 5/27/1976 6/30/1976 94,185 $86,477 $0.92 GOVT/HAINS BEACH (SILVER BEACH) (87,810) AND 500' SOUTH AT 18'CNTR (6,375)
1977 4/19/1977 5/29/1977 181,097 $130,675 $0.72 GOVT/HAINS OPEN WATER (19,101) BEACH (SILVER BEACH) (160,236) .5 MI SOUTH AT 18'CNTR (1,760)
1978 5/8/1978 6/15/1978 118,658 $345,055 $2.91 GOVT/HAINS BEACH (SILVER BEACH) (84,565) 7 MI SOUTH AT 18'CNTR (4,928) WHIRLPOOL CDF (38,735)
1979 5/12/1979 6/26/1979 147,512 $365,958 $2.48 GOVT/HAINS BEACH (SILVER BEACH) (108,233) WHIRLPOOL CDF (39,279)
1980 4/28/1980 6/1/1980 92,348 $387,338 $4.19 GOVT/HAINS BEACH (SILVER BEACH) (91,905) WHIRLPOOL CDF(24,359)
1981 6/9/1981 6/23/1981 64,110 $262,083 $4.09 GOVT/HAINS OPEN WATER (3,975) BEACH 150-1200' SOUTH (65,767) WHIRLPOOL CDF (21,094)
1982 5/28/1982 7/3/1982 152,981 $73,501 $0.48 GOVT/HAINS OPEN WATER (18,136) BEACH 1000-3000'S OF S PIER (116,895) WHIRLPOOL CDF (17,900)
1983 5/22/1983 6/30/1983 140,040 $218,469 $1.56 GOVT/HAINS BEACH 1000-3000' S OF S PIER
1984 8/21/1984 8/27/1984 17,010 $89,306 $5.25 LUEDTKE DACW35-84-C-0014 WHIRLPOOL CDF
30+00E - 40+00E

FY CONTRACT NUMBERSTART COMPLETION COST CPYCUBIC YARDS CONTRACTOR PLACEMENT/DREDGE AREA
ANNUAL REPORT/CONTRACT DREDGING REPORT, DETROIT DISTRICT, OPERATIONS OFFICE
Tuesday, December 13, 2011
8:22:12 AM
ST JOSEPH HARBOR, MI1984 8/4/1984 9/14/1984 68,533 $246,719 $3.60 LUEDTKE DACW35-84-C-0014 BEACH SOUTH CL OF PARK STREET EXTENDED
THENCE 3400'S 8'CNTR-OHWM
OUTER FLARE AREA1985 7/17/1985 8/5/1985 37,701 $209,405 $5.55 HARBOR MARINE DACW35-85-C-0006 BEACH SOUTH CL OF PARK STREET EXTENDED
THENCE 3400'S
OUTER CONTOUR - 2+00E1985 8/17/1985 8/26/1985 15,446 $92,796 $6.01 HARBOR MARINE DACW35-85-C-0031 WHIRLPOOL CDF
52+00 - 43+00 AND 38+00 - 32+001986 7/24/1986 8/15/1986 14,564 $195,001 $13.39 KING DACW35-86-C-0028 WHIRLPOOL CDF
35+00N - 38+00N 28+00N - 17+00N1986 6/16/1986 8/14/1986 14,533 $101,004 $6.95 KING DACW35-86-C-0013 BEACH SOUTH CL OF PARK STREET EXTENDED
THENCE 3400'S 4'CNTR-OHWM
25+00W - 0+001987 6/27/1987 7/11/1987 24,227 $131,910 $5.44 KING DACW35-87-C-0025 WHIRLPOOL CDF
30+00E - 52+00E INCL TB 52+00 - 44+00 OUTER1987 6/26/1987 7/11/1987 3,320 $36,636 $11.03 KING DACW35-87-C-0025 UPLAND - SHORELINE SOUTH OF HARBOR AT LECO
CORP
52+00 - 44+001988 5/31/1988 7/28/1988 43,725 $291,446 $6.67 KING DACW35-88-C-0016 BEACH SOUTH CL OF PARK STREET EXTENDED
THENCE 3100'S 8'CNTR-OHWM
27+84W-16+50W1989 5/24/1989 6/22/1989 18,745 $147,725 $7.88 LUEDTKE DACW35-89-C-0021 BEACH SOUTH CL OF PARK STREET EXTENDED
THENCE 2700'S 8'CNTR-OHWM
0+00-27+00W1990 5/22/1990 6/22/1990 58,314 $317,067 $5.44 KING DACW35-90-C-0009 BEACH SOUTH CL OF PARK STREET EXTENDED
THENCE 2700'S 7'CNTR-OHWM
CRITICAL SHOALS 0+00 - 28+00W1991 5/3/1991 5/22/1991 10,225 $35,519 $3.47 KING DACW35-91-C-0010 WHIRLPOOL CDF
31+00-43+00 AREA NEAR TURNING BASIN1991 5/3/1991 5/22/1991 52,513 $278,160 $5.32 KING DACW35-91-C-0010 BEACH CL OF PARK STREET EXTENDED THENCE
2700'S 7'CNTR-OHWM
0+00 - 28+00W 3' ALLOWABLE OVERDEPTH1992 5/22/1992 6/9/1992 33,644 $123,324 $3.67 ANDRIE DACW35-92-C-0018 BEACH CENTERLINE OF PARK STREET EXTENDED
THENCE 2700' SOUTHWARD 7'CNTR-OHWM
28+00W-32+00W1992 6/23/1992 6/30/1992 24,182 $293,097 $12.12 KING DACW35-92-C-0021 WHIRLPOOL CDF
16+66-52+001993 6/18/1993 6/30/1993 2,360 $13,185 $5.59 MCM MARINE DACW35-93-C-0017 BEACH 50' SOUTH OF THE CENTERLINE OF PARK
STREET EXTENDED THENCE 2700' SOUTHWARD 7'CNTR-OHWM
0+00-32+00W1994 6/3/1994 7/8/1994 31,469 $439,744 $13.97 KING DACW35-94-C-0023 BEACH AT SHOREHAM COMMENCING AT OHWM-
8'CNTR
0+00-28+00W1995 5/3/1995 5/10/1995 33,335 $185,008 $5.55 KING DACW35-95-C-0010 BEACH 50'-2550'S OF PARK STREET 8'CNTR-OHWM
0+00-32+00W1996 6/10/1996 6/28/1996 24,918 $199,738 $8.02 TNT DACW35-96-C-0008 BEACH 50'-3050'S OF CL OF PARK STREET 4'CNTR-
OHWM
0+00-32+001997 5/14/1997 6/6/1997 35,042 $158,877 $4.53 KING DACW35-97-C-0004 BEACH 50'-1550'S OF PARK STREET 4'CNTR-OHWM
12+50W-30+00W 24' + 1' OD1997 5/27/1997 6/17/1997 30,696 $373,870 $12.18 MCM MARINE DACW35-97-C-0002 WHIRLPOOL CDF
17+00-54+501998 4/30/1998 5/7/1998 24,285 $147,154 $6.06 MCM MARINE DACW35-98-C-0003 BEACH 500'-3300'S OF PARK STREET 4'CNTR-OHWM
31+00W-20+00W 23'+1'OD & 6+00W-2+00W 21'+1'OD1999 4/27/1999 5/7/1999 22,482 $171,376 $7.62 MCM MARINE DACW35-99-C-0005 BEACH 500'-3200'S OF CL OF PARK STREET 4'CNTR-
OHWM
0+00-32+001999 6/28/1999 7/11/1999 23,189 $157,413 $6.79 MCM MARINE DACW35-99-C-0005 WHIRLPOOL CDF
CRITICAL SHOALS
FY CONTRACT NUMBERSTART COMPLETION COST CPYCUBIC YARDS CONTRACTOR PLACEMENT/DREDGE AREA
ANNUAL REPORT/CONTRACT DREDGING REPORT, DETROIT DISTRICT, OPERATIONS OFFICE
Tuesday, December 13, 2011
8:22:13 AM
ST JOSEPH HARBOR, MI2000 4/28/2000 5/5/2000 39,472 $258,931 $6.56 MCM MARINE DACW35-99-C-0005 BEACH 100'-2800'S OF PARK STREET OHWM TO
SHORELINE WHEN POSSIBLE
32+00-0+002001 6/8/2001 6/20/2001 36,897 $262,709 $7.12 MCM MARINE DACW35-99-C-0005 BEACH
2001 8/5/2001 8/15/2001 29,498 $168,614 $5.72 MCM MARINE DACW35-99-C-0005 WHIRLPOOL CDF
2002 6/15/2002 6/24/2002 27,117 $193,587 $7.14 MCM MARINE DACW35-02-C-0007 BEACH 1200'-1300'S OF PARK STREET CENTERLINE 4'CNTR-OHWM
16+00E-20+00N2003 5/28/2003 6/2/2003 10,440 $126,885 $12.15 MCM MARINE DACW35-02-C-0007 BEACH
CRITICAL SHOALS2004 6/28/2004 7/13/2004 35,774 $286,336 $8.00 MCM MARINE DACW35-02-C-0007 BEACH
CRITICAL SHOALS2005 4/13/2005 5/9/2005 48,089 $325,445 $6.77 KING W911XK-04-D-0002 BEACH 1200'-2500'S OF PARK STREET
0+00-32+00W2005 9/18/2005 10/3/2005 14,322 $333,776 $23.31 LUEDTKE W911XK-04-D-0004 CONFINED SOUTHWEST REGIONAL AIRPORT
31+00-43+00 DREDGING TO 20+1FT OVERDEPTH2006 4/14/2006 4/30/2006 24,612 $510,100 $20.73 LUEDTKE W911XK-06-D-0002 UPLAND AT SOUTHWEST REGIONAL AIRPORT
39+89-51+922006 4/10/2006 4/22/2006 52,120 $278,188 $5.34 KING W911XK-06-D-0001 BEACH 1200'-2500' S OF PARK STREET ALONG
EXISTING SHORELINE
32+00W-0+002007 3/29/2007 4/30/2007 35,565 $257,850 $7.25 KING W911XK-06-D-0001 BEACH 50'-1350'S OF PARK STREET
32+00w-0+002008 5/30/2008 10/17/2008 113,190 $1,974,614 $17.45 GREAT LAKES DOCK W911XK-08-C-0012 UPLAND AT SOUTHWEST MICHIGAN REGIONAL
AIRPORT AND HARBOR SHORES DEVELOPMENT
9+00-51+00 TO 22' +1 AND 51+00-53+00 TO 18' +1'2009 4/16/2009 5/8/2009 120,093 $1,081,609 $9.01 KING W911XK-08-D-0001 BEACH 50-1350' S OF PARK STREET 4'CNTR-EXISTING
SHORELINE
0+00-32+00W2010 3/26/2010 5/7/2010 59,478 $0 $0.00 MORRISH-WALLACE W911XK-09-D-0010 BEACH
CRITICAL SHOALS2010 5/10/2010 5/22/2010 64,433 $0 $0.00 KING W911XK-09-D-0003 BEACH 50'-1,350' SOUTH OF PARK ST CL 4'CNTR-EXIST
SHORELINE
32+00W-16+00W2011 7/14/2011 7/30/2011 0 $0 $0.00 MCM MARINE W911XK-09-D-0011 BEACH
CRITICAL SHOALS
$13,129,4323,365,753TOTAL


APPENDIX 4


APPENDIX 5


August 20, 2012 draft
Page 1
CITY OF ST. JOSEPH BERRIEN COUNTY, MICHIGAN
AN ORDINANCE TO AMEND THE ZONING ORDINANCE OF THE CITY OF ST. JOSEPH, MICHIGAN
THE CITY OF ST. JOSEPH ORDAINS:
The Zoning Ordinance of the City of St. Joseph, Michigan, is hereby amended by adding the following Section 9.7 to Article IX of the Ordinance:
“SECTION 9.7 “EB-OD” EDGEWATER BEACH OVERLAY DISTRICT
9.7.1 Intent. The Edgewater Beach Overlay District (EB-OD) is an overlay District intended to preserve the character of the public trust land along the shore of Lake Michigan, which is found to be a valuable public resource of the community, to prevent damage to the public trust land and to prevent damage to private property.
Based on the record presented the City finds that during periods of low Lake Michigan water levels, sand accretion in this District tends to significantly enlarge the beach and to enlarge affected parcels in this District. This additional land area can be seen by property owners as permanent and attractive for development. The character of the public trust land along the Lake Michigan shoreline, as well as viewsheds along the shoreline from public parks included in and adjacent to this District, is compromised by development in immediate proximity to the public trust land.
Based on the record presented the City further finds that the beach and property area near the shoreline is subject to submergence and erosion during periods of higher Lake Michigan water levels and resulting from weather conditions. It has been demonstrated that current state and federal development standards for the Lake Michigan shoreline, such as the Ordinary High Water Mark (OHWM) and the Base Flood Elevation, do not ensure that property shoreward of those locations is protected from erosion, inundation, or damage during such periods of time and/or weather events. The OHWM is not intended to reflect these periods of peril, and the Base Flood Elevation is a still water elevation that does not take into account the effect of wave action. The City further understands that revised federal floodplain regulations are being developed to take into account additional environmental factors such as waves and to provide an improved standard of floodplain development protection, but implementation of these regulations will not likely occur for several years.
When erosion threatens a Structure legally built near the shoreline, a natural reaction for the owner is to attempt to construct a seawall or other shore protection structure. Shore protection structures in this District would diminish significantly the character of the public trust land and pose an increased threat of erosion and damage to the public trust land as well as to adjacent private property.
The City has long experience with the detrimental effects of seawalls and shore protection structures constructed over a period of many years in response to erosion south of the St. Joseph River. These shore protection structures were and are necessary to protect previously developed areas of the City which are otherwise subject to regular and ongoing erosion. However, given the physical, environmental, and developmental characteristics of the EB-OD, including generally large lots which need not be developed near to the water’s edge to be economically viable and that the area is generally benefitting from accretion rather than persistent erosion, the City believes that shore protection structures should not be necessary in this area and that would be detrimental to the public health, safety and welfare for reasons further identified and set forth in the City of St. Joseph, Michigan Coastal Engineering Study, dated August 17, 2012, a copy of which is on file with the City.

August 20, 2012 draft
Page 2
The City believes the most appropriate, effective and reasonable method to further the public interests of protecting natural resources; preserving the economic and environmental well-being of the community; to protect the health, safety and general welfare of the community; and the general preservation or enhancement of property values is to restrict the construction of structures so near to the water’s edge as to be detrimental to the character of the public trust property and/or the vistas from neighboring public parks; and/or to be susceptible to damage resulting from inundation or erosion or to create an apparent future need for seawalls or other shore protection structures in order to protect these structures from damage resulting from inundation or erosion; and/or to be potentially built in a location that will render the structure nonconforming under the future federal floodplain protection regulations currently under development.
These regulations are intended to preserve the character of the public trust property along the shoreline, protect the vistas from neighboring public parks, and prevent the construction of structures and shore protection structures which would have deleterious effects on the public trust property as well as neighboring private property.
These regulations are also supported by the Comprehensive Plan, as the Future Land Use Map indicates lakefront property in this area should be used as open space and the supporting text indicates that open space areas should be maintained and encouraged along the shoreline.
9.7.2 Description of District. The EB-OD includes all lands in any zoning District located north of the St. Joseph River and situated lakeward of a line sequentially connecting the following points described by Michigan State Plane Grid Coordinates, South Zone, Grid, NAD 83, U.S. Survey Feet and as illustrated in Map 9-3, Area of Edgewater Beach Overlay District:
Point Northing Easting
A 231408.65’ 12547511.47’
B 231835.41’ 12547625.92’
C 232647.21’ 12548673.22’
D 232952.85’ 12549032.86’
E 233537.35’ 12549657.47’
F 233846.96’ 12549969.52’
G 234468.24’ 12550591.09’
H 234820.85’ 12550921.86’

August 20, 2012 draft
Page 3
9.7.2.1 Area of Edgewater Beach Overlay District
Map 9-3 Area of Edgewater Beach Overlay District

August 20, 2012 draft
Page 4
9.7.3 Structure Development. For the reasons set forth in Subsection 9.7.1 and elsewhere in this Ordinance, the installation, construction and operation of Structures, which for the purpose of this section includes seawalls and shore protection structures, within the EB-OD shall be subject to the following:
A. No Structure shall be installed or constructed in the EB-OD. The following are not considered a Structure for purposes of this section only:
1. Public recreational equipment in public parks;
2. Open, unroofed walkways, including those constructed of pavers or similar objects;
3. Stairs and similar open, unroofed structures that are set on the surface of the ground and which are not attached to a Structure; and
4. Freestanding signs.
B. In the event the provisions of the EB-OD prevents the development or use of a Lot existing on the effective date of this amendment for the purposes permitted in the Zoning District, or creates practical difficulties or unnecessary hardship for the use of such a Lot, the property owner may seek a Hardship Planned Unit Development or Variance under the terms of this Ordinance.
C. If any Lot within or partially within the EB-OD is divided or the subject of a boundary adjustment after the effective date of this amendment such that any resulting parcel is nonbuildable due to the regulations of this section, except for a boundary adjustment that has the effect of lessening a Nonconformity with respect to this section, it will be deemed a voluntary action of the property owner and will disqualify the resulting nonbuildable parcel from receiving a Variance or Hardship Planned Unit Development.
D. In the event the provisions of the EB-OD render Nonconforming any Structure which is existing or which is the subject of a valid building permit and under construction on the effective date of this amendment, this shall not be deemed a voluntary action of the property owner and will not disqualify the parcel from receiving a Variance or Hardship Planned Unit Development under the procedures described in this Ordinance.
E. To the extent of any conflict between the regulatory provisions contained in this section and other provisions of the Zoning Ordinance, the restrictions contained in this section shall control.
This ordinance shall take effect 10 days after its final passage.
The Mayor and Clerk of the City of St. Joseph, Berrien County, certify that this ordinance was passed by the St. Joseph City Commission on ___________, 2012, and that notice of its adoption or a copy of the ordinance was published in The Herald-Palladium newspaper on ______________, 2012.
ROBERT L. JUDD, Mayor DEBORAH S. KOROCH, Clerk

APPENDIX 6


Exhibits


EXHIBIT 1 Area 1 Proposed Setback Line


EXHIBIT 2 Area 2 Shoreline Protection Concept Section


EXHIBIT 3 Working Overall Maps, Areas 1-3