St. James Town Community Scan · St. James Town Community Scan ... Tamil Tagalong . Figure 4 ......
21
St. James Town Community Scan What Parents with Young Children Have to Say A St. James Town CAPC Initiative Data analyses and report written by: Laura Heinz-Ziliotto
Transcript of St. James Town Community Scan · St. James Town Community Scan ... Tamil Tagalong . Figure 4 ......

St. James Town Community Scan
What Parents with Young Children Have to Say
A St. James Town CAPC Initiative
Data analyses and report written by:
Laura Heinz-Ziliotto

Table of Contents
1) Respondents
a) Where they live b) Where they were born c) Length of time in Canada and the area d) Languages spoken e) Main activity f) Community Involvement g) Perceived Social Support
2) Feedback from Parents about living in the St. James Town Area
A: What they like about the neighbourhood B: What they would change in the neighbourhood C: Families’ biggest needs D: What parents like best about the community programs they are currently involved in E: Services and programs parents would like to see offered or developed in their community F: Potential volunteers in the community G: General Comments
3) Summary and Conclusions 4) Recommendations

St. James Town Community Scan
What Parents with Young Children have to say. In the summer of 2003 389 parents completed a Community Scan with young children living in the St. James Town area. It is an initiative of the St. James Town CAPC program designed to understand what parents have to say about their community and about its programs and services. The Community Scan respondents were parents involved in CAPC programs and other programs in the community as well as parents not involved in any community programs. It was distributed to parents during program time, door to door, during focus group and at the St. James Town Festival. The majority of the parents completed it independently, in a group or during an interview with CAPC staff. The information from this Community Scan provides powerful and current information about parents’ needs and wishes for their community. Given the large number of respondents, the information is very valuable and can be used for program and community planning and development. The report is organized as follows:
1. The first section describes the parents who completed the scan. It illustrates the diversity of the population in St. James Town.
2. The second section of the report highlights parents’ feedback concerning their
neighbourhood and the programs and services offered.
3. The third section summarizes the findings and makes some initial recommendations. 1) Respondents Three hundred and eighty-nine parents1 with young children living in the St. James town area of Toronto completed the Community Scan. Eighty-five percent of the respondents were mothers, 10% were fathers and the remaining 5% were other caregivers such as aunts and grandparents. All respondents had a child less than 6 years of age. a) Where they live (N=382) Almost all of the respondents reported living in St. James Town or the close vicinity. St. James Town is located south of Bloor Street, north of Wellesley Street and in between Sherbourne Street and Parliament Street in downtown Toronto. This area is known as the most densely populated area in Canada and is comprised of about 20 high-rise apartment buildings. Most of the respondents came from this small geographic area of about one quarter of a square kilometre. Three hundred and eighty-two parents reported the name of the closest main intersection to their home. Figure 1 illustrates where 372 of these parents live. The remaining 10 1 Throughout the report the number of respondents vary from question to question because not every respondent answered every question. The number of respondents per question is indicated as N=(the number of respondents).

families live just south or east of the area shown. As illustrated in Figure 1, 351 respondents reported living within the small boundaries of St. James Town outlined in black.
Figure 1: Frequency and location of respondents’ homes.
209
1
13
41
4 5
23
32
18 5
2
2
2
5
3
2
1
1
1
1
1
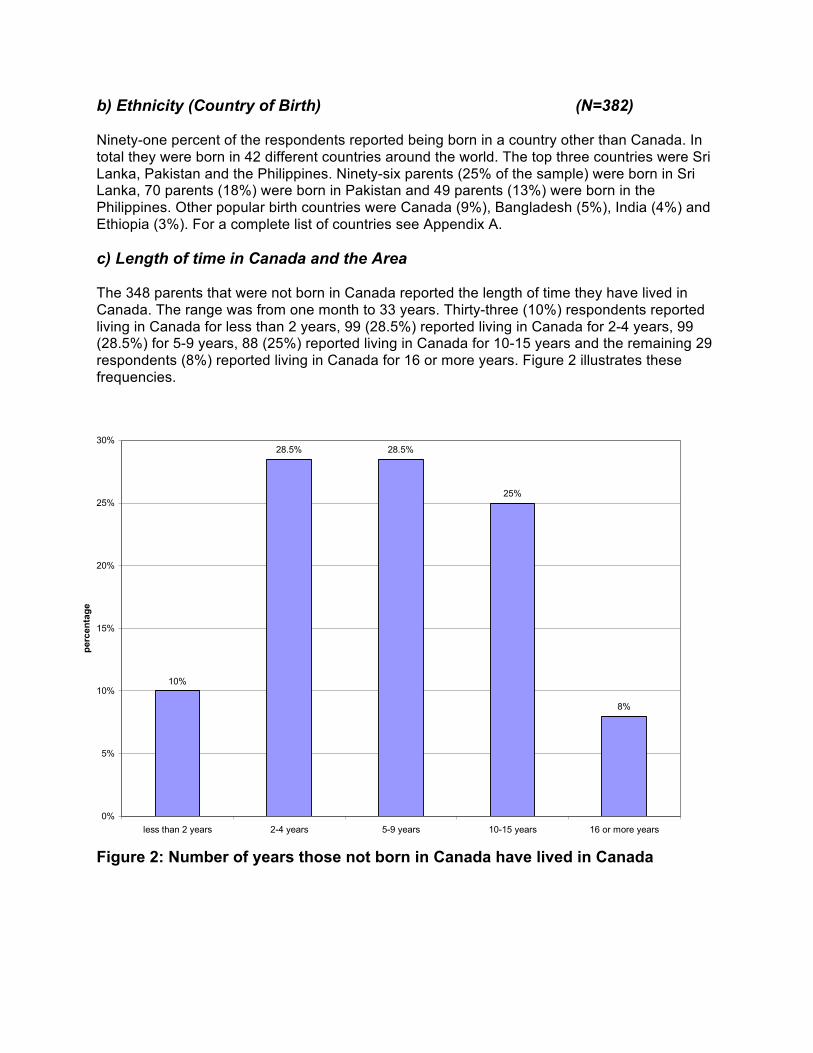
b) Ethnicity (Country of Birth) (N=382) Ninety-one percent of the respondents reported being born in a country other than Canada. In total they were born in 42 different countries around the world. The top three countries were Sri Lanka, Pakistan and the Philippines. Ninety-six parents (25% of the sample) were born in Sri Lanka, 70 parents (18%) were born in Pakistan and 49 parents (13%) were born in the Philippines. Other popular birth countries were Canada (9%), Bangladesh (5%), India (4%) and Ethiopia (3%). For a complete list of countries see Appendix A. c) Length of time in Canada and the Area The 348 parents that were not born in Canada reported the length of time they have lived in Canada. The range was from one month to 33 years. Thirty-three (10%) respondents reported living in Canada for less than 2 years, 99 (28.5%) reported living in Canada for 2-4 years, 99 (28.5%) for 5-9 years, 88 (25%) reported living in Canada for 10-15 years and the remaining 29 respondents (8%) reported living in Canada for 16 or more years. Figure 2 illustrates these frequencies.
Figure 2: Number of years those not born in Canada have lived in Canada
10%
28.5% 28.5%
25%
8%
0%
5%
10%
15%
20%
25%
30%
less than 2 years 2-4 years 5-9 years 10-15 years 16 or more years
percentage

While the area of St. James Town is known for housing a transient population, the parents surveyed varied greatly in the number of years they had lived in the area. Twelve percent (12%) reported living in the area for less than 2 years, 31% for 2 - 4 years, 32% for 5 - 9 years, 16% for 10 - 15 years and 9% for 16 years or more. Figure 3 presents this information.
Figure 3. Number of years respondents have lived in the area. Looking only at the non-Canadian born respondents, the information gathered shows that 59% of the sample has lived in St. James Town the entire time they have been in Canada. Another 18% have lived elsewhere in Canada for 2 years or less and 14% have lived in a different area for between 2.5 and 5 years. The remaining 9% of the respondents reported living in a different area of Canada for more than 5 years before moving to St. James Town.
12%
31%32%
16%
9%
0%
5%
10%
15%
20%
25%
30%
35%
less than 2 years 2-4 years 5-9 years 10-15 years 16 or more years
percentage

d) Languages Spoken (N=389) In total, the respondents reported speaking 37 different languages in their homes. Fifty-eight percent of the parents reported that they speak only one language at home, 37% reported speaking 2 languages and 5% reported 3 languages at home. The most frequently reported language spoken in the home was English (n=192), followed by Tamil (n=100), Urdu (n=76) and Tagalog (n=45). The next most frequently spoken languages were Punjabi (n=25), Mandarin (n=18), Bengali (n=14) and Farsi (n=10). Seventy-three respondents reported speaking another language. Figure 4 illustrates the most commonly spoken languages. Because more than 40% speak more than one language the numbers shown in figure 4 are higher than the number of respondents. A complete list of languages spoken is presented in Appendix B. Although 192 respondents reported speaking English in their homes, only 46 of these respondents speak English as their only language.
192
109
76
45
25
18
14
10
73
English
Other
Punjabi
Mandarin
Bengali
Farsi
Tagalog
Urdu
Tamil
Tagalong
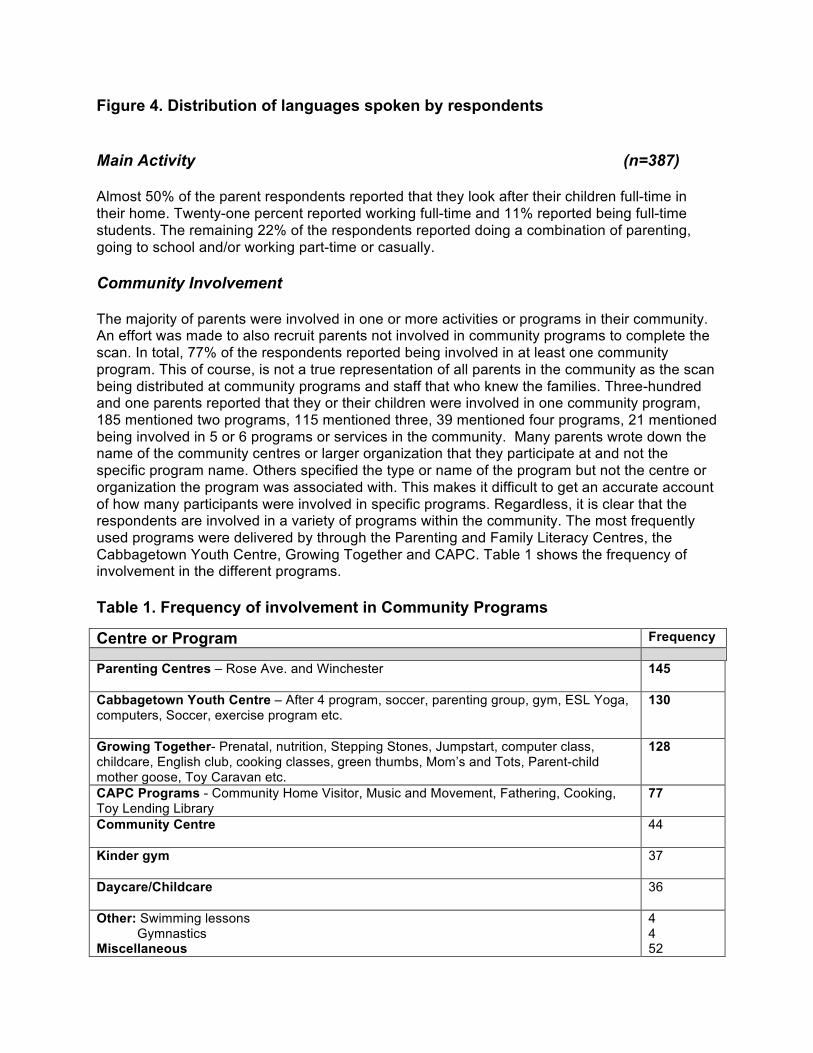
Figure 4. Distribution of languages spoken by respondents Main Activity (n=387) Almost 50% of the parent respondents reported that they look after their children full-time in their home. Twenty-one percent reported working full-time and 11% reported being full-time students. The remaining 22% of the respondents reported doing a combination of parenting, going to school and/or working part-time or casually. Community Involvement The majority of parents were involved in one or more activities or programs in their community. An effort was made to also recruit parents not involved in community programs to complete the scan. In total, 77% of the respondents reported being involved in at least one community program. This of course, is not a true representation of all parents in the community as the scan being distributed at community programs and staff that who knew the families. Three-hundred and one parents reported that they or their children were involved in one community program, 185 mentioned two programs, 115 mentioned three, 39 mentioned four programs, 21 mentioned being involved in 5 or 6 programs or services in the community. Many parents wrote down the name of the community centres or larger organization that they participate at and not the specific program name. Others specified the type or name of the program but not the centre or organization the program was associated with. This makes it difficult to get an accurate account of how many participants were involved in specific programs. Regardless, it is clear that the respondents are involved in a variety of programs within the community. The most frequently used programs were delivered by through the Parenting and Family Literacy Centres, the Cabbagetown Youth Centre, Growing Together and CAPC. Table 1 shows the frequency of involvement in the different programs. Table 1. Frequency of involvement in Community Programs
Centre or Program Frequency Parenting Centres – Rose Ave. and Winchester
145
Cabbagetown Youth Centre – After 4 program, soccer, parenting group, gym, ESL Yoga, computers, Soccer, exercise program etc.
130
Growing Together- Prenatal, nutrition, Stepping Stones, Jumpstart, computer class, childcare, English club, cooking classes, green thumbs, Mom’s and Tots, Parent-child mother goose, Toy Caravan etc.
128
CAPC Programs - Community Home Visitor, Music and Movement, Fathering, Cooking, Toy Lending Library
77
Community Centre 44
Kinder gym 37
Daycare/Childcare 36
Other: Swimming lessons Gymnastics Miscellaneous
4 4 52

Perceived Social Support (n=375) The parents were asked about the support they feel they receive from their family and friends. The results show that, in general, the parents feel that they have people they can count on for support or help in an emergency. They were asked if in general they felt supported not if the support came from their own neighbourhood. Figure 5 illustrates the results.
Figure 5: Perceived Social Support
18%
6%
5%
4%
17%
13%
13%
5%
65%
81%
82%
91%
0% 10% 20% 30% 40% 50% 60% 70% 80% 90% 100%
I feel I have friends orneighbours who will help me with
my children
I feel there are people I cancount on in an emergancy
I feel I there is someone I cantalk to if I am having problems or
need support
I feel I have family and/or friendswho help me feel safe, secure
and happy
percentage
YesNot sureNo

2) Feedback from Parents about living in St. James Town A: What they like about the Neighbourhood (n=346) Parents were asked to list the top three reasons or things they like best about living in their neighbourhood. Three hundred and forty-four respondents listed one reason, 310 listed two reasons and 246 listed three reasons. In total, 900 comments were made about what the parents liked best about living in the neighbourhood. These 900 comments were divided into several themes. Overall, the majority were in regards to living in close proximity to or being conveniently accessible to many different amenities. In total 517 (57%) different comments referred to this. Fifty-nine of these respondents reported that one thing they liked best about the neighbourhood was that it was convenient to “everything”. Parents said things like “everyday needs are at walking distance”, and it is ”easy to get to everything I want”. In total, 145 parents liked being close to schools, 144 said they liked being close to grocery stores, the mall and shopping, and 120 respondents said they liked being close to the TTC. Other less frequently mentioned things were that they liked living close to health care facilities (n=34), community services (n=33), Churches and Mosques (n=15), work (n=14), downtown (n=13), and parks and playgrounds (n=13). Other places identified were libraries, banks, daycare, the post office, family and friends. The second most frequently reported theme, mentioned by 156 respondents, was that they liked the Sense of Community of the neighbourhood. Comments that fell into this theme were reports that the neighbourhood was friendly, neighbourly, that residents watch out for each other, that they live close to family, relatives and friends, that the neighbourhood is multicultural, diverse and that people have similar backgrounds and culture. Some examples of what the parents like best are: “Lots of people from my culture live here”, “there are really friendly people here”, “neighbourhood as whole is family web” and “loving neighbours”. The third most reported thing the parents liked best about the neighbourhood was the Community Services provided. One hundred and fourteen parents said that they liked the neighbourhood because of the community centres, libraries, childcare, children’s programs, adult programs, the Cabbagetown Youth Centre, the Parenting Centres, Growing Together, and Health Clinics etc. Examples of comments that fit into this theme are: “I like the Parenting Centre the most”, “Lot’s of children’s programs” and “Community centre - places to socialize” Fewer parents mentioned the next themes. Twenty-eight reported that they like the Playground and Parks in the area. Twenty-six felt that the area was safe and peaceful, 14 people liked the area because it was clean, 11 people said they liked the shopping, 10 people reported liking the affordable housing in the neighbourhood and 8 people reported liking the recreational activities available.

B: What they would Change in the Neighbourhood to make it a Better Place to Live Parents were then asked to list three things that they would change in the neighbourhood to make it a better place to live. Two hundred and fifty-three people reported one thing they would like to change, 186 reported two things, and 114 reported three things. In total there were 553 comments made. An additional 25 parents reported that they liked it the way it is and had no suggestions for change. The 553 comments were again organized in to themes to represent the main things that the respondents were saying. Interestingly many of the things that some parents wanted to change were the same things other parents liked best. The most frequently mentioned theme was that they wanted More Programs and Services. One hundred and twenty-five comments were made about this issue. More specifically, 35 parents reported wanting more child and youth programs and services. Comments such as “give more activities to youth”, “more active stuff for toddlers”, “have homework help for children”,“ emotional support of school-aged children” and “more programs for girls” fit into this category. Twenty-four people mentioned that they wanted a local indoor pool and swimming lessons for children and adults. Eighteen people said they wanted “more childcare” or “more daycare available”. Other programs or services that parents wanted, or wanted more of, in their neighbourhood were parenting programs and parent support (n=15) such as “parent support while in transition”, “English classes with childcare”, and a library (n=10). Other requested services or programs reported were more community centres, more shopping malls and more health programs and health clinics. Two comments that are related to programs and services are “We would like to see more teachers and workers from our culture in the community” and “We want more teachers and volunteers from other cultures.” Other comments that did not fit into a theme were “improve the condition of fitness centre”, “for the school cross guard to cross the road”, and “togetherness – all community centres under one umbrella”. The second most frequently reported thing the respondents wanted to change was the Cleanliness and Maintenance of the Area. One hundred and ten people said that this was one of the things they would like changed. More specifically, 81 reported that they wanted the environment, parks and apartments to be cleaner. Specific comments were “Keep it clean in the parks”, “cleaning apartment building”, and “clean the environment.” More specifically, 24 parents mentioned that their apartments need to be repaired or better maintained. Fifteen of these comments were specifically about the elevators not working. Nine people mentioned that there were cockroaches in their apartments. One parent said “My apartment if not good, too many cockroaches”. Another eight people commented on the garbage collecting and recycling and said that it needed to be improved. Two people mentioned that the roads and sidewalks were in disrepair and too bumpy. Thirdly, 86 parents reported that they would like the Neighbourhood to be Safer. Thirty-two parents said that, in general, the area needed more and better security at all times. Statements such as “more security watch is needed after 7:00pm”, “more security at night”, “faster security response”, “better security – lots of teens roaming around” were given. Ten parents said that they wanted the schools to be safer and 9 parents reported that the playgrounds in the area are not safe places for children to play. Another 8 respondents suggested that a curfew be instilled, “impose curfew hours on teenagers raising public disturbance in the area”; seven mentioned more lights and security cameras are needed. They said things such as “Light up the bulbs especially behind the buildings”, and “mount cameras on all building lobbies”. Six parents also mentioned the noise level in the neighbourhood and suggested “educating people who make much noise during the night”, and “neighbours could be more considerate, could be quieter after 11:00pm”. One parent commented “there are dark corners and risky areas at night especially in

the winter”. Other comments were about gangs, dangerous neighbours and the need for a neighbourhood watch program. The next largest number of comments was about the Parks and Playgrounds in the area. In general the parents wanted more parks, greenery, gardens and playgrounds nearby. Comments such as “More playgrounds, there is only one swing in the whole big area”, “to have more greenery”, “better playgrounds suited for toddlers”, and “have gardening surrounding the buildings” were common comments made by 49 parents. The fifth theme is in regards to Affordable Housing. Forty-six parents mentioned this as one of the things they would like changed. The following comments fit into this category. “Rent control should be in place”, “apartments rent should be less for less income”, and “apartment rent should be more affordable”. In addition to comments about rent and affordable housing three parents said that they wanted better or bigger apartments. Comments about increasing a Sense of Community were mentioned by 32 respondents. Twenty people said that they wanted better relationships between neighbours. For example parents said that they wanted “a more friendlier neighbourhood”, “cooperation of each other”, more communication between neighbours”, “to improve inter-community tolerance” and to “be more helpful to neighbours and friends”. The other 12 parents commented on the need for “more community events” or “more neighbourhood social events”. One parent suggested having a community party every month to make the community stronger. Another said that community events needed to be advertised better because they didn’t know about most of the community information. In regards to community-wide events one parent said, “get rid of ethnic based events which excludes other individuals.” Many comments throughout the scan mention the multiculturalism within the community. Many parents like the fact that other families of their culture are near by but others state that discrimination is a problem and that cross-cultural events and friendships should be encouraged. Related to the safety theme was the theme of Crime Prevention. Twenty-four respondents said that they wanted increased crime prevention by having more police patrol (n=12), a crack down on drugs (n=5), and the elimination of prostitution in the area (n=3), and generally “less crime” (n=4). Comments that fit into this category are “more watching by police”, “more surveillance for drug dealers”, “kids and teenagers taking drugs”, and “provide more security staff to curb crime.” In addition to the main themes mentioned, a number of respondents mentioned that they had employment problems and wanted more job opportunities (n=11), and had health concerns (n=9) including concerns about pollution. Seven parents said the neighbourhood was too crowded and that they would like less people in the area. C: Families’ Biggest Needs Parents were asked to list their families top three most important needs at this time. Two hundred and sixty-four parents reported at least 1 need, 192 of these parents also reported a second need and 118 reported a third. All the responses were categorized into six themes. The most frequently reported need was in regards to Housing, mentioned by 103 parents. Forty-one of these parent said that they needed affordable housing or to have lower rent, 28 said that they needed a bigger and affordable place to live, 11 wanted to find a better place to live, four wanted to get into subsidized housing and another four said that one of their biggest needs is to buy a home instead of renting.

The second most reported need was Employment, mentioned by 89 respondents. Sixty-two said that one of their biggest needs is to find a job, 12 reported needing to get a better or better paid job, seven reported needing job training, and six reported that their husband needed to find a job. Fifty-four respondents said that one of their biggest needs was Education. The majority of those who said ‘education” did not specify whether they themselves needed education or that their children needed better education. Seven respondents did specify that they needed education for themselves. The fourth most frequently reported need was to do with Money, Finances and Budgeting. Fifty-one parents reported that they needed help in this area. Forty-eight parents reported that one of their biggest needs was Daycare or childcare for their children. Some parents also mentioned needing subsidized or free daycare. This need relates to the need to find employment for many of the parents are unable to work without their children being looked after in a daycare setting. The sixth most popular need was the need for More Programs. Forty-six parents reported that their family needed more programs in the community for children and themselves. Sixteen parents reported needing more programs for their children including; a homework club or program for their school aged children (n=7), speech and language assistance (n=4), swimming lessons (n=3) and Growing Together (n=2). Another 15 parents reported that they needed more English classes and nine of these parents specified that they needed English classes with childcare. Many other needs were reported less frequently. These needs are listed below in table 2 along with the top six needs mentioned above. Table 2: Families’ Biggest Needs Theme/Category Number of respondents
that reported this theme Housing 103 Employment 89 Education 54 Money, Finances, Budgeting 51 Daycare, Childcare 48 More programs 46 Health/dental care 19 Food/nutrition 17 Safety and security in neighbourhood 17 Bigger and safer playgrounds in area 15 Parenting classes, parenting support 15 Cleaner/better environment 14 Applications: visa’s, licenses, applications for benefits, health card 13 Happiness 7 Immigration problems 6 Love, good family relations 5 Child development 4

Transportation 3 Clothing 3 D: What the parents like best about the community programs they are currently involved in. The Community Scan asked the parents to identify the program they liked the best and why they liked it or found it useful. The most frequently reported reasons are presented on the top four most used programs. Parenting Centres: The respondents reported liking the Parenting Centres because their children can socialize with peers, build social skills and interact with their peer group. They find them helpful for child development and for their children to learn new things. They also like the Parenting Centres because they give their children a chance to play and have fun. Parents also feel that they learn about being a good parent and receive information from the centres. In addition, they are a place for parents to get together and socialize. Cabbagetown Youth Centre: The respondents reported liking the Cabbagetown Youth Centre (CYC) for many of the same reasons parents reported liking the Parenting Centres. They found that the CYC was good for their children in that it provided them with good activities, helped them learn, and gave them a chance to socialize with other children. The parents also found it a friendly atmosphere with great staff and liked that fact that it was free. Parents also commented on the After 4 program and how it allowed parents to work later. Other things they liked about the CYC was that it provides computer training for beginners, and that it is close by. Growing Together: Respondents like Growing Together because it helps children develop and learn, has good children’s programs and provides a place for babies to socialize with other babies. Parents found Growing Together to be very supportive and like it because it teaches parenting skills. Others reported liking it because it is free, has useful computer classes and is a good place for parents to socialize. CAPC: Community Home Visitor. Parents listed a number of ways the Community Home Visitor has helped them. These include help with resolving welfare/financial assistance issues, accessing the food bank, housing and rent, employment issues, custody, applying for OSAP, daycare subsidy, daycare, immigration, child tax benefit, getting legal aid, disability benefits, OHIP, emotional support, job training, access to dental/health care, getting a work Visa, etc. E: Services and Programs parents would like to see offered or developed in their community. (N=320) When asked if there were other services or programs that they would like offered or developed in their community, 252 respondents (79%) said “yes” and 68 respondents (21%) said “no”. Those who felt they would like to see other services or programs offered were asked to check off which of the listed programs/services they would like. Many of the respondents checked off more than one service or program with an average of 5 programs checked by each respondent with a range of 1 – 12 programs. Table 3 presents the list of programs or services and the number and percentage of respondents that wanted this type of program.

Table 3. Programs and services parents want offered or developed in their community Programs or Services Number and percentage of respondents Arts and Crafts programs for children 146 (58%) Computer Training programs 143 (57%) Sports and recreation programs for children 126 (50%) Childcare services 124 (49%) Employment skill training programs 119 (47%) Language Classes for children 119 (47%) Parenting Programs 116 (46%) Music and dance programs 100 (40%) Fitness programs for adults 96 (38%) Special education programs for children 90 (36%) Transportation services 55 (22%) Language courses for adults 56 (22%) Nineteen parents suggested other programs or services that they would like offered and 5 parents provided 2 or 3 suggestions. The most popular response was swimming lessons (n=8), followed by a homework club (n=3) and a local library (n=2). Only one person each provided all other suggested programs or services. They include: emergency child care, food banks, free babysitting between 5-7pm, information on housing, outdoor activities for children, photography classes, religious programs, support groups, first-aid classes for parents, musical instrument lessons, special classes for English reading and writing, and self-defence classes for adults. F: Potential Volunteers in the Community To gauge the number interested in volunteering in the community the parents were asked if they have time to help out in their community. Three hundred and eleven parents answered the question. The results show that 105 respondents (34%) reported that they do have time to help out, 100 (32%) were not sure, and 106 (34%) said that they did not have time to help out. Those respondents who said that they had time and some of those who were not sure checked off things that they would like to do if they were to help out (n=144). The average number of things that people checked was 3 with a range from 1 to 13. Table 4 presents this information. Table 4. Interests of potential volunteers Programs or Services Number and percentage that said they would be
interested in helping out with the specific program or service.
Volunteering for children’s programs 87 (60%) Volunteering at a school 55 (38%) Babysitting other people’s children 48 (33%) Helping develop new programs for children 42 (29%) Cooking or making snack for a program 40 (28%) Teaching a skill 36 (25%)

Community gardening 30 (21%) Contacting other parents about programs 26 (18%) Donating materials 23 (16%) Sitting on a board or committee 23 (16%) Donating financially 15 (10%) Three people made additional comments about how they would like to help including: teaching different hairstyles, teaching safety for kids, teaching children with special needs. G: General Comments At the end of the community scan, parents were asked to make general comments. One hundred and fifteen parents made a comment, which fell into four main themes: 1) Positive comments about community programs, 2) Suggestions for additional programs, 3) Negative comments about the neighbourhood, and 4) Positive comments about the neighbourhood. Positive Comments about Community Programs: The largest number of comments (44) was positive comments about the CYC and CAPC programs. Nineteen people gave the programs general praise saying that they were helpful, worthwhile, and supportive and that they appreciated them. Six people said that the programs were good for their children and helped them learn. Another 6 commented that the services were free and accessible. Other comments were positive about the Community Home Visitor, the Fathering program and the Parenting Centres. Three people commented that the staff at CYC is the greatest. Examples of these comments are: “Our family finds that Parenting Centre an important resource. It has provided our child with a stimulating learning environment and opportunities to learn social skills. We would like to see the Parent Centre continue for our community.” “Parenting Centre and Fathering is one of the best programs in Toronto. We should have more such programs” “I like to bring my child to the Parenting Centre. CYC Gym and Music and Movement. Children learn social skills, language and lots of other things” Suggestions for Additional Programs: Twenty-seven people made suggestions for programs or services or for more programs and services. Five people suggested that a homework club was needed in the neighbourhood. Another 5 said that they wanted a local pool and swimming lessons for their children. Four people said that while the existing programs are good they need more support and improvement. Other suggestions included to have a local library, start a community newspaper, have more services like CYC, have more community patrolling, job training programs, extend the Fathering program, and have more computer classes for children and adults. Examples of comments from this category are: “It would be nice to have a community newspaper. A guest speaker about health and safety issues. Community trips for parents and kids.”

“I would like Moms & Tots group everyday in the week. and music, dancing and art class everyday too.” “Please have ongoing lecture/workshops concerning drugs (addiction).” Two notable comments related to programs and services are: “Certain community programs are wait-listed due to lack of space or other reasons. Kids interested in each program should be accommodated without disappointment or if they are wait-listed should be informed accordingly.” “Finding the proper information is important to everyone since there are many community programs it should be located in a better area rather than a basement or subbasement. These resources are accessible but it is hard to locate.” Negative Comments about the Neighbourhood: Twenty-five comments were negative comments about the neighbourhood with some suggestions about how to make it better. For example, seven comments were that the area needed to be cleaned up, four people commented that some neighbours were too noisy, another four said that the rent was too high and that rent assistance was needed. Three said that area was not safe for children to play, three said the playgrounds were too crowded and another three made comments about people in the area doing drugs and how this should be a concern for parents. Examples are: “Please, build more playgrounds for children so that it is not too crowded all the times in the slides. Build swing set too!!” “Neighbours should not create too much noise. Not safe in the community to have children play in the playground.” Positive Comments about the Neighbourhood: There were 12 positive comments made about the neighbourhood. Seven respondents said that it was perfect and that they loved it, three said it was convenient and close to everything and two people commented about the friendly residents. Examples that fit into this category are: “Our neighbourhood is close to everything such as bus stops, grocery stores, school, hospital, community centre, Growing Together, CYC and Parenting Centre. The are good services” “I am absolutely thrilled to live in Cabbagetown/St. James Town area and can’t think of a better place to raise kids” 3) Summary and Recommendations The community scan set out to give a voice to the parents of young children in St. James town so they could communicate how they feel about their community, what their needs are, and what changes could be made to make the community a better place to live. These objectives were achieved and interesting and important information was gathered from 389 parents. Based on their feedback, it is clear that many parents are happy with the programs and services offered and enjoy living in the neighbourhood. However, they also feel that changes need to be made to make the community a better place for them to live with their young children.

The results of the community scan provide us with some clear insight into what these parents want or want more of in the community. The main findings are highlighted and recommendations and suggestions are made to address the issues raised. The parents reported many other needs and suggestions for changes in their community and all should be considered when planning new programs or services in the area. a) What Parents Want Changed in their Community. The main thing that parents want changed in their community is they want more programs and services offered. The parents currently involved in community programs and services find them helpful for themselves and their children but many of the respondents stated that they want and need more programs offered. Specifically, parents want programs for children such as arts and crafts, sports and recreation, language classes, homework help or educational programs, and dance and music classes. Parents also want programs for themselves such as computer training programs, employment skill training programs and parenting programs. A large number of parents also want more childcare services.
1) The families that are involved in a variety of programs are very satisfied with the programs, the staff and the impact the programs have on themselves and their children. The parents report that the programs allow them to socialize with other parents, and learn parenting skills. Their children benefit by learning new skills, socializing with other children and participating in enjoyable activities. It is recommended that the programs currently running continue to be offered to the families.
2) As mentioned, the change that parents want most in their community is more programs and services. It is recommended that new programs be developed and offered in the community. More programs for children and parents should be developed as well as more childcare services. If at this point new programs cannot be developed it is recommended that the existing programs make an effort to expand their current programs to include more families. It is also suggested that more community-wide activities or events be offered to help residents feel less isolated and part of a neighbourhood. The details included in this Community Scan report should be considered to ensure that the specific programs parents want for themselves and their children are developed.
Over 100 parents in the community reported that they have time to help out in the community. The majority of these parents reported that they would be interested in volunteering for children’s programs, at a school, baby-sitting other people’s children or helping develop programs for children. This is encouraging and should definitely be capitalized on. Not only can parent volunteers expand the programs developed and offered in the community, and the volunteer experience will allow parents to get involved in the community, learn new skills that could assist them in gaining employment, increase their confidence and be part of a social support network.
3) It is recommended that a volunteer service be developed and widely advertised to give interested parents an opportunity to help out in their community. This effort will have to be coordinated with the different programs in the area so that the volunteers can be linked with programs that need help. This extra help may make it possible for more programs to be offered and will also provide the parents with skill and/or job training. As

many parents will need childcare in order to be free to volunteer it is suggested that the service either provide childcare or coordinate with other childcare services in area. To be most effective this volunteer service should be on-going and integrated with other programs and services in the community.
The CAPC Community Home visitor was mentioned by many families as being helpful for a variety of issues such as housing, job training, accessing daycare and financial issues. These issues are consistent with many of the needs reported by the parents in the Community Scan.
4) It is recommended that, in addition to training more community home visitors, a group that offers support, resources and advocacy be offered to the parents with young children. Support groups for new families in the community and other families that need support should be created to address the many issues and problems that the families encounter in everyday life. Volunteer parent mentors could talk to the parents that need support and share with them the strategies and resources they are using to overcome similar challenges. The group(s) should be a safe place for parents to come and learn from each other and educated staff how to approach situations and address their needs. It is suggested that guest speakers that are knowledgeable about certain topics such as housing, heath, budgeting and immigration issues periodically come to talk to the group so that they are receiving current and informed information.
The second priority for parents is that they want the area to be cleaner, better maintained and safer for their families.
5) It is recommended that parents be supported in developing a voice for their community and be given the opportunity and resources to advocate for the health and safety of their families. This will increase the sense of community in the neighbourhood, provide an opportunity for community leaders to come forward and help bring these important issues to the forefront. For this to be a reality the families will need support to help them coordinate their efforts and bring their issues to the appropriate people in the community. By joining together in an attempt to have their concerns heard, a sense of community may result and may help neighbours feel less isolated in their concerns and wishes for their families’ welfare.
b) Families’ Biggest Needs Parents reported that their families needed affordable housing the most. Many parents stated that rent in the area is too high and that they need to have lower rent or subsidized housing. Other families need a bigger place to live that is also affordable.
6) To address this widespread need, it is recommended that (like recommendation #5) parents be supported in developing a voice for the issue of housing. This issue needs to be brought forward and to the attention of influential figures in the city. By joining together to advocate for themselves, the community will have a stronger voice that is hopefully heard and addressed. To do this the community members will need support, resources and leadership.
The second biggest need reported by the parents is employment. Many parents reported that they or their spouse need to find a job and others said that they need job training or programs to

develop specific job skills. This need is directly related to the need for more money, which in turn is related to affordable housing.
7) It is recommended that an employment resource and training program be developed that focuses specifically on the needs of parents with young children. This employment program would have to be sensitive not only to their past experience and education, but also to cultural, religious and language issues that may influence their employment. Also, the fact that they are parents of young children and will most likely need child care services needs to be recognized. This service could be linked to the recommendation for a volunteer service and perhaps skill training and workshops could be shared.
In summary, the main recommendations made based on the feedback from 389 parents of young children living in the St. James Town are: 1) That the programs currently running continue to be offered to the families 2) That new programs be developed and offered in the community 3) That a volunteer service be developed 4) That, in addition to training more community home visitors, a group that offers support, resources and advocacy be offered to the parents with young children 5) That parents be supported in developing a voice for their community and be given the opportunity and resources to advocate for the health and safety of their families. 6) That parents be supported in developing a voice for the issue of affordable housing 7) That an employment resource and training service be developed that focuses specifically on the needs of parents with young children
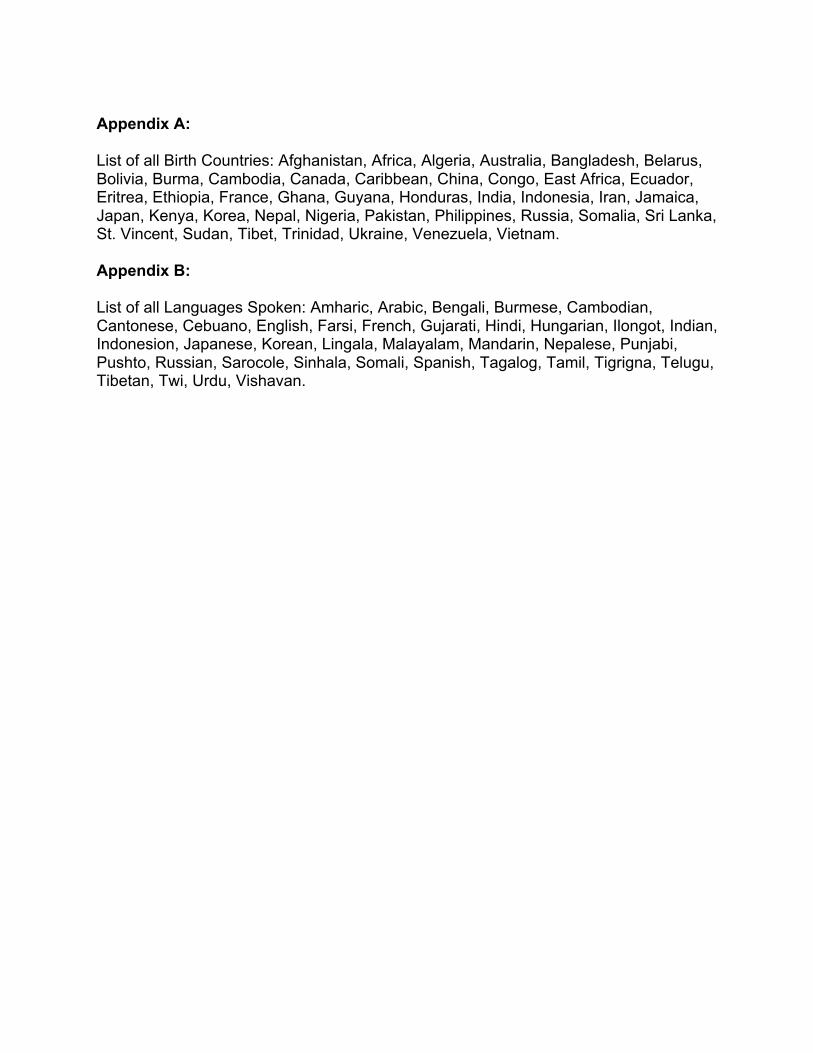
Appendix A: List of all Birth Countries: Afghanistan, Africa, Algeria, Australia, Bangladesh, Belarus, Bolivia, Burma, Cambodia, Canada, Caribbean, China, Congo, East Africa, Ecuador, Eritrea, Ethiopia, France, Ghana, Guyana, Honduras, India, Indonesia, Iran, Jamaica, Japan, Kenya, Korea, Nepal, Nigeria, Pakistan, Philippines, Russia, Somalia, Sri Lanka, St. Vincent, Sudan, Tibet, Trinidad, Ukraine, Venezuela, Vietnam. Appendix B: List of all Languages Spoken: Amharic, Arabic, Bengali, Burmese, Cambodian, Cantonese, Cebuano, English, Farsi, French, Gujarati, Hindi, Hungarian, Ilongot, Indian, Indonesion, Japanese, Korean, Lingala, Malayalam, Mandarin, Nepalese, Punjabi, Pushto, Russian, Sarocole, Sinhala, Somali, Spanish, Tagalog, Tamil, Tigrigna, Telugu, Tibetan, Twi, Urdu, Vishavan.