SRP948 Agronomic and Economic Impacts of Kansas ... · Soft white wheat is characterized by low...
13
Agronomic and Economic Impacts of Kansas Agricultural Experiment Station Wheat Breeding Program 1977-2005 Kansas State University Agricultural Experiment Station and Cooperative Extension Service Report of Progress 948 This publication from the Kansas State University Agricultural Experiment Station and Cooperative Extension Service has been archived. Current information is available from http://www.ksre.ksu.edu.
Transcript of SRP948 Agronomic and Economic Impacts of Kansas ... · Soft white wheat is characterized by low...
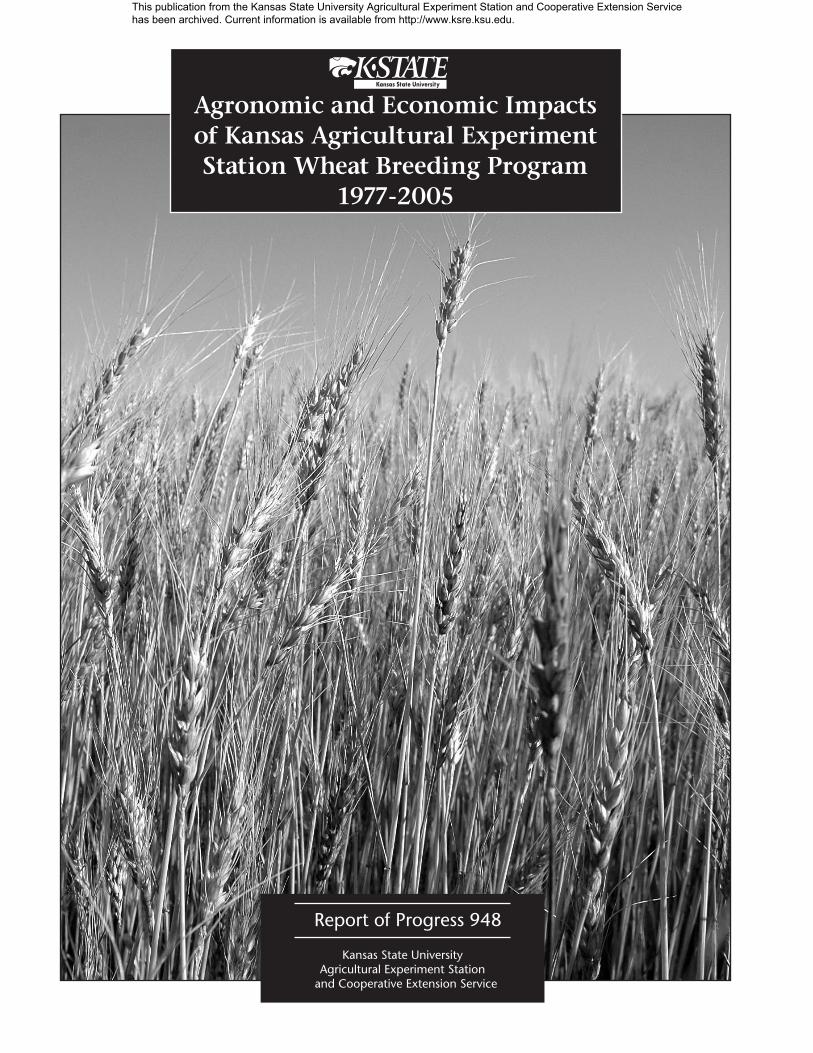
Agronomic and Economic Impacts of Kansas Agricultural Experiment Station Wheat Breeding Program
1977-2005
Kansas State UniversityAgricultural Experiment Station
and Cooperative Extension Service
Report of Progress 948
This publication from the Kansas State University Agricultural Experiment Station and Cooperative Extension Service has been archived. Current information is available from http://www.ksre.ksu.edu.
________________________________________________________________________
THE AGRONOMIC AND ECONOMIC IMPACTS OF THE KANSAS AGRICULTURAL EXPERIMENT STATION
WHEAT BREEDING PROGRAM, 1977-2005 ________________________________________________________________________
Lawton Lanier Nalley Research Assistant
Department of Agricultural Economics Kansas State University
Andrew Barkley
Department of Agricultural Economics Kansas State University
Manhattan, Kansas 66506-4011 Phone: 785-532-4426
Forrest G. Chumley
Associate Director of the Kansas Agricultural Experiment Station Kansas State University
Acknowledgement: Allan Fritz provided useful comments and suggestions to this report. This is Contribution no. 06-333-S from the Kansas Agricultural Experiment Station, Manhattan.
This publication from the Kansas State University Agricultural Experiment Station and Cooperative Extension Service has been archived. Current information is available from http://www.ksre.ksu.edu.
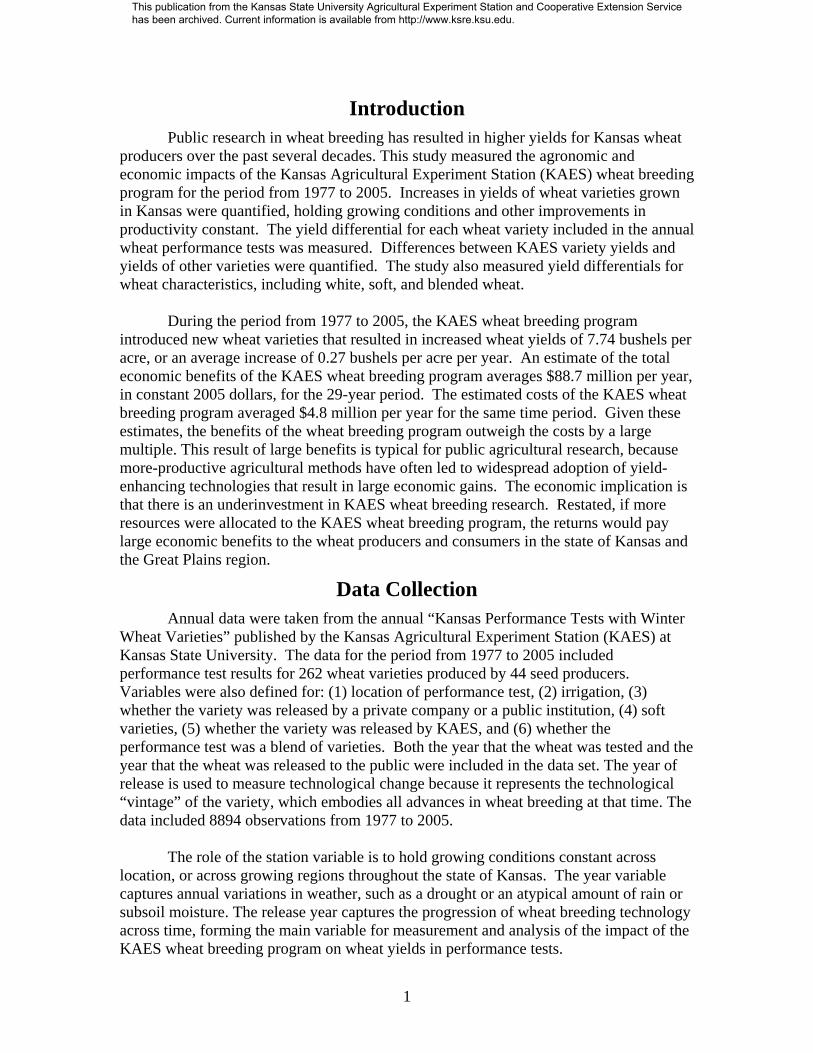
IntroductionPublic research in wheat breeding has resulted in higher yields for Kansas wheat
producers over the past several decades. This study measured the agronomic and economic impacts of the Kansas Agricultural Experiment Station (KAES) wheat breeding program for the period from 1977 to 2005. Increases in yields of wheat varieties grown in Kansas were quantified, holding growing conditions and other improvements in productivity constant. The yield differential for each wheat variety included in the annual wheat performance tests was measured. Differences between KAES variety yields and yields of other varieties were quantified. The study also measured yield differentials for wheat characteristics, including white, soft, and blended wheat.
During the period from 1977 to 2005, the KAES wheat breeding program
introduced new wheat varieties that resulted in increased wheat yields of 7.74 bushels per acre, or an average increase of 0.27 bushels per acre per year. An estimate of the total economic benefits of the KAES wheat breeding program averages $88.7 million per year, in constant 2005 dollars, for the 29-year period. The estimated costs of the KAES wheat breeding program averaged $4.8 million per year for the same time period. Given these estimates, the benefits of the wheat breeding program outweigh the costs by a large multiple. This result of large benefits is typical for public agricultural research, because more-productive agricultural methods have often led to widespread adoption of yield-enhancing technologies that result in large economic gains. The economic implication is that there is an underinvestment in KAES wheat breeding research. Restated, if more resources were allocated to the KAES wheat breeding program, the returns would pay large economic benefits to the wheat producers and consumers in the state of Kansas and the Great Plains region.
Data Collection Annual data were taken from the annual “Kansas Performance Tests with Winter
Wheat Varieties” published by the Kansas Agricultural Experiment Station (KAES) at Kansas State University. The data for the period from 1977 to 2005 included performance test results for 262 wheat varieties produced by 44 seed producers. Variables were also defined for: (1) location of performance test, (2) irrigation, (3) whether the variety was released by a private company or a public institution, (4) soft varieties, (5) whether the variety was released by KAES, and (6) whether the performance test was a blend of varieties. Both the year that the wheat was tested and the year that the wheat was released to the public were included in the data set. The year of release is used to measure technological change because it represents the technological “vintage” of the variety, which embodies all advances in wheat breeding at that time. The data included 8894 observations from 1977 to 2005.
The role of the station variable is to hold growing conditions constant across
location, or across growing regions throughout the state of Kansas. The year variable captures annual variations in weather, such as a drought or an atypical amount of rain or subsoil moisture. The release year captures the progression of wheat breeding technology across time, forming the main variable for measurement and analysis of the impact of the KAES wheat breeding program on wheat yields in performance tests.
1
This publication from the Kansas State University Agricultural Experiment Station and Cooperative Extension Service has been archived. Current information is available from http://www.ksre.ksu.edu.
Varieties and Public/Private Producers This study included 262 varieties of wheat, beginning with the variety ‘Newton’
in 1977, and continuing through the most-recently released 2005 varieties. A variable was assigned to each variety if it was released by a public research university (Kansas State University, Texas A&M, University of Nebraska, etc.,) or a private research company. This allows for any differences between the yields of privately developed wheat breeds and publicly released varieties to be measured. A separate variable was added to analyze those varieties released by Kansas State University (KAES), and to track their performance in comparison with the other varieties.
White, Soft, and Blended Wheat White wheat was distinguished with a separate variable because of its rise in
popularity among breeders and millers, together with the interest from international buyers. The possible advantages of white wheat over red wheat are associated with end-use, rather than agronomic performance. Hard white (HW) wheat is the newest class of wheat to be grown in the United States. It is used for noodles, yeast breads, and flat breads, and is grown in California, Idaho, Kansas, and Montana. One advantage of HW wheat commonly cited is the potential for an increase in the flour extraction rate. Another potential advantage of HW wheat is that it may increase the demand for U.S. wheat, because some importing countries prefer HW wheat to hard red wheat (Boland and Dhuyvetter, 2002). Hard white wheat currently is used primarily in domestic markets with limited quantities being exported. Soft white (SW) wheat is a preferred class of wheat for flat breads, cakes, pastries, crackers, and noodles, and is grown primarily in the Pacific Northwest. Soft white wheat is characterized by low protein content relative to hard wheat, usually about 10 percent. Soft white wheat represents just more than 20 percent of total U.S. exports, primarily to Asia and the Middle East (Kansas Wheat Commission). The data include variables for white, blend, and soft attributes, to distinguish between possible differences between these wheat variety types.
Measurements of the Benefits of Wheat Breeding Programs The methodology used to calculate the economic benefits of the Kansas wheat
breeding program followed an extensive literature on the economic impacts of agricultural research, as summarized by Huffman and Evenson (1993) and Alston et al. (1995). Previous evaluations of wheat breeding programs were conducted by Blakeslee and Sargent (1982); Zentner and Peterson (1984); Brennan (1984, 1989a, and 1989b); Byerlee and Traxler (1995); and Barkley (1997).
The first step in evaluating the economic impact of the Kansas wheat breeding
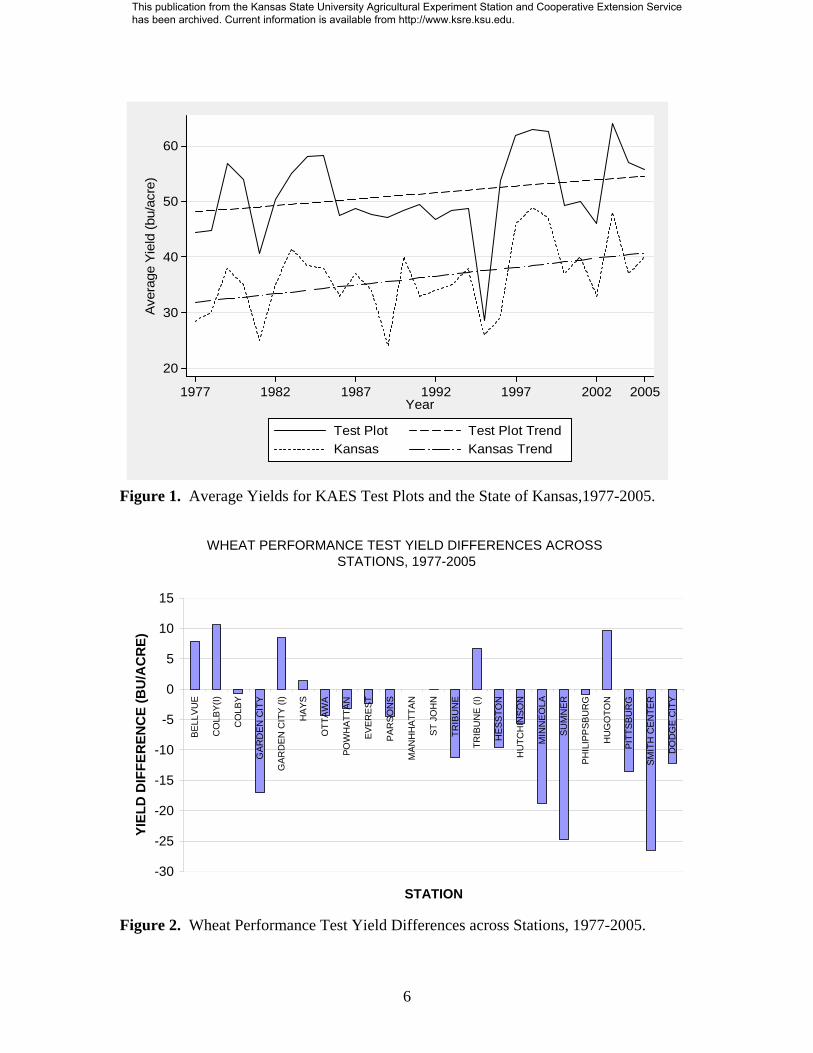
program was to measure the increase in yields from the genetic improvement of wheat, holding all other production parameters constant. This was accomplished by applying the methodology of Feyerherm et al. (1984) to calculate the relative yields for each variety with data from KAES performance tests with wheat varieties (KAES). Use of relative yield performance data from nurseries implicitly assumes that actual producer yields are equivalent to test-plot yields in KAES experiments. Although a gap between experimental and actual yields exists (Figure 1), Brennan (1984) wrote, “The only reliable sources of relative yields are variety trials” (p. 182). Therefore, annual changes in
2
This publication from the Kansas State University Agricultural Experiment Station and Cooperative Extension Service has been archived. Current information is available from http://www.ksre.ksu.edu.
relative yields are measured with performance test data, which represent ideal management and agronomic conditions, instead of actual wheat yield performance.
The agronomic contribution of the Kansas wheat-breeding research program was
measured by quantifying the increase in yields attributable to genetic enhancements in wheat for the period from 1977 to 2005. Yield gains were measured from all varieties released by KAES, beginning with Newton in 1977. A regression model was used to measure the impact of productivity gains from research, and the effects of the included attributes of wheat.1 Salmon (1951) reported that tests over many location-years are necessary to detect differences in cultivar yields. Yield data were aggregated over all locations and years to develop a yield ratio for each variety. Following Feyerherm et al. (1984), relative yield ratios were derived by calculating the mean yield ratio over all location-years where each wheat variety was grown together with the control variety (‘Scout66’). For ease in interpretation, yield differences were also calculated by subtracting the mean yield of each variety from the mean yield of the control variety. The yield ratio and yield differential provide comparisons of variety performance (Table 1). Performance measures were also calculated for all 23 experiment stations that KAES operated during the period from 1977 to 2005. Yield differences were calculated by subtracting the mean yield at each station from the mean yield of the control station (Manhattan), as shown in Figure 2.
Model Results More than 51 percent of the variation in wheat yields was explained by the
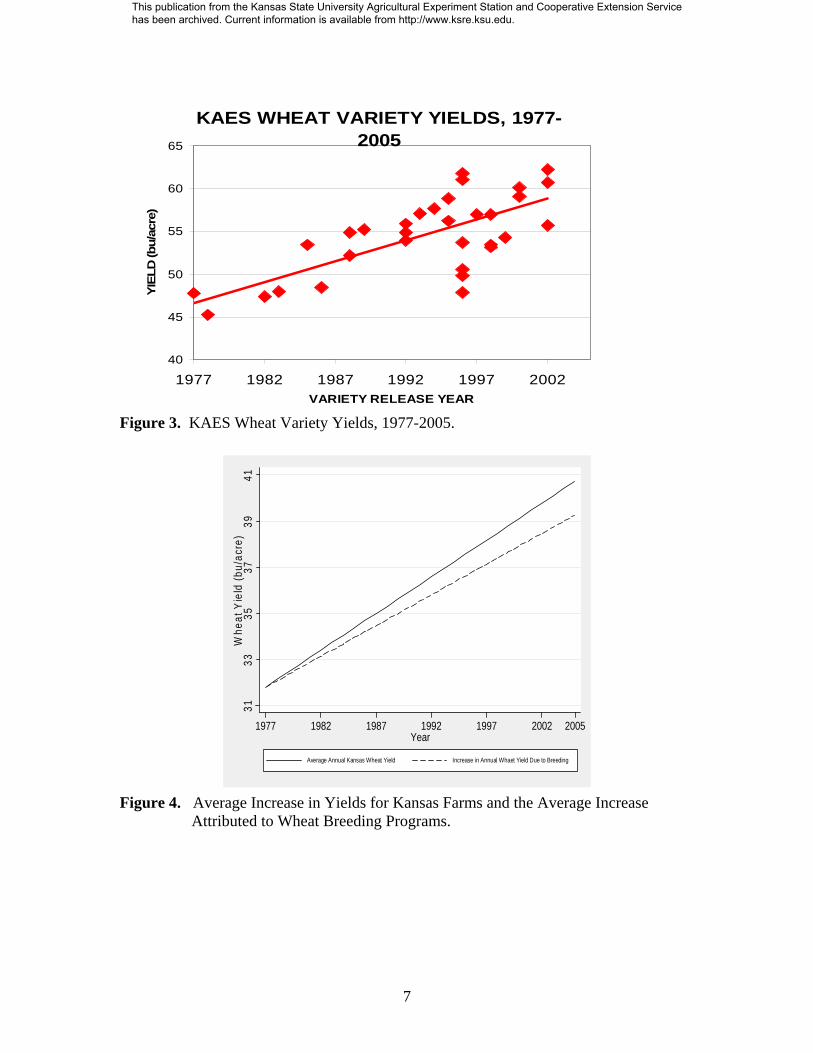
regression model for the period from 1977 to 2005. White wheat yielded 1.68 bushels per acre less than hard red wheat, holding all else constant. This was expected, because white wheat was in the developmental stage during this time period. Present and future white wheat yields are likely to reduce or eliminate this yield gap between red and white wheat varieties. Soft wheat was not statistically different in yield than hard red wheat. Average yields for blended and nonblended varieties did not differ from each other. In the regression, “release year,” or the year in which the wheat variety was released to the public, was positively associated with yield, equal to 0.27 bushels per acre. This result demonstrates an increase of 0.27 bushels per acre per year attributed to wheat breeding programs alone, equaling to 0.51 percent yield increase per year (0.27/52.45, where 52.45 is the average yield for all varieties over the time period under investigation). During the 1977 to 2005 period, wheat breeding programs contributed 7.83 bushels per acre to wheat yields. Estimates of cumulative economic benefits, assuming a perfectly elastic demand for wheat,2 are $88.7 million per year, in constant 2005 dollars, over the 29-year period.
There were no statistical differences between the yields of private and public
wheat varieties. This is an interesting and relevant result, given the recent release and adoption of a large number of private varieties. During the 1977 to 2005 period, varieties released by KAES yielded an average of 0.75 bushels less per acre than non-KAES 1 A fixed-effects OLS regression was used, including fixed effects for year and location (Greene, 1993). 2 This assumes that the increased Kansas wheat production due to genetic improvement does not influence the price of wheat. This is a realistic assumption, because Kansas produces approximately two percent of world wheat, and the yield increase is a relatively small shift in the total world supply of wheat.
3
This publication from the Kansas State University Agricultural Experiment Station and Cooperative Extension Service has been archived. Current information is available from http://www.ksre.ksu.edu.
varieties. But there have been significant increases in the average yields in the varieties released by KAES (Figure 2). The yield ratios and yield differences for the 39 wheat varieties released by KAES since 1977 are shown in Table 1. Table 2 and Figure 2 compare average yields for each station to that of the Manhattan Experiment Station (the base station). There were higher yields per acre in 5 of the 6 irrigated stations, relative to the dryland station located in Manhattan.3 Table 2 illustrates the fluctuation in average yield across time, compared with the average yield of the base year (2005).
Taking the average yield of all varieties in all of the KAES test plots, and
obtaining the average yield for all varieties of wheat actually planted by farmers in the state of Kansas from 1977 to 2005, the effect on yield exclusively from KAES wheat breeding (both public and private) could be calculated. Actual wheat yields in Kansas increased 8.932 bushels per acre during the time period. Of this increase, 7.74 bushels per acre, or 86.66 percent, were attributable to the KAES wheat breeding program alone. The remaining 13 percent of wheat yield increase can be attributed to other improvements in technology, management, and production practices. The wheat breeding program has significantly increased yields, resulting in large economic benefits to the citizens of Kansas.
Implications and Conclusions White wheat varieties recently have been developed in Kansas, with the first
public version of a HW wheat variety in 1992 (‘Arlin’). Varietal yields will typically be lower during the development phase of a new wheat class, as reflected in the results of this study. From 1977 to 2005, white wheat had lower average yields than red wheat, equal to 1.68 bushels per acre. This study analyzed only the yield of white wheat, and not milling attributes, demand, or quality. The results for white wheat, which millers point out have higher average flour extraction rates, may require more in-depth research to see if its lower yield could be economically mitigated by its milling attributes. As expected, white wheat variety yields increased over time, and yields of future releases could be similar to those of hard red wheat varieties. Yields of soft wheat and blended wheat were not different from those of hard red winter wheat.
No difference was found when comparing yields of private with public wheat
varieties. This result may possibly be the result of the high degree of information and germplasm sharing that occurs between all wheat breeding programs: the agronomists are typically familiar with each other, and the work of all of the programs. The KAES varieties yielded 0.72 bushels per acre less than the average of all varieties, but the rate of increase was identical across all varieties. This result may reflect higher quality attributes in KAES varieties, relative to other wheat varieties.
The most interesting and important result is the effect of wheat breeding programs
on increases in yield per acre over time. For Kansas farms during the period from 1977 to 2005, 86.66 percent (7.74/ 8.932) of the increase in yields can be attributed to wheat breeding programs alone (Figure 4). Other increases may be attributed to more efficient
3The station Leoti was operational for only one year (1960), had only 10 observations, and was not statistically different from Manhattan.
4
This publication from the Kansas State University Agricultural Experiment Station and Cooperative Extension Service has been archived. Current information is available from http://www.ksre.ksu.edu.
harvesting techniques, higher quality inputs, and improvements in management and technology. When analyzing the “new age” of wheat breeding (1977-2005), wheat breeding is responsible for an increase of 7.74 bushels per acre, or an average increase of 0.27 bushels per year.
An estimate of the total economic benefits of the KAES wheat breeding program
is $88.7 million per year, in constant 2005 dollars, for the 29-year period. The estimated costs of the program were $4.8 million per year. Given these estimates, the benefits of the wheat breeding program outweigh the costs by a large multiple, demonstrating that larger investments in the KAES wheat breeding program would provide large and sustained economic benefits to Kansas wheat producers and consumers in the future.
5
This publication from the Kansas State University Agricultural Experiment Station and Cooperative Extension Service has been archived. Current information is available from http://www.ksre.ksu.edu.
20
30
40
50
60A
vera
ge Y
ield
(bu/
acre
)
1977 1982 1987 1992 1997 2002 2005Year
Test Plot Test Plot TrendKansas Kansas Trend
Figure 1. Average Yields for KAES Test Plots and the State of Kansas,1977-2005.
WHEAT PERFORMANCE TEST YIELD DIFFERENCES ACROSS STATIONS, 1977-2005
-30
-25
-20
-15
-10
-5
0
5
10
15
BELL
VUE
CO
LBY(
I)
CO
LBY
GAR
DEN
CIT
Y
GAR
DEN
CIT
Y (I)
HAY
S
OTT
AW
A
POW
HAT
TAN
EVER
EST
PAR
SON
S
MAN
HH
ATTA
N
ST J
OH
N
TRIB
UN
E
TRIB
UN
E (I
)
HES
STO
N
HU
TCH
INS
ON
MIN
NEO
LA
SUM
NER
PHIL
IPP
SBU
RG
HU
GO
TON
PITT
SBU
RG
SMIT
H C
ENTE
R
DO
DG
E C
ITY
STATION
YIEL
D D
IFFE
REN
CE
(BU
/AC
RE)
Figure 2. Wheat Performance Test Yield Differences across Stations, 1977-2005.
6
This publication from the Kansas State University Agricultural Experiment Station and Cooperative Extension Service has been archived. Current information is available from http://www.ksre.ksu.edu.
KAES WHEAT VARIETY YIELDS, 1977-2005
40
45
50
55
60
65
1977 1982 1987 1992 1997 2002VARIETY RELEASE YEAR
YIEL
D (b
u/ac
re)
Figure 3. KAES Wheat Variety Yields, 1977-2005.
3133
3537
3941
Whe
at Y
ield
(bu/
acre
)
1977 1982 1987 1992 1997 2002 2005Year
Average Annual Kansas Wheat Yield Increase in Annual Whaet Yield Due to Breeding
Figure 4. Average Increase in Yields for Kansas Farms and the Average Increase
Attributed to Wheat Breeding Programs.
7
This publication from the Kansas State University Agricultural Experiment Station and Cooperative Extension Service has been archived. Current information is available from http://www.ksre.ksu.edu.
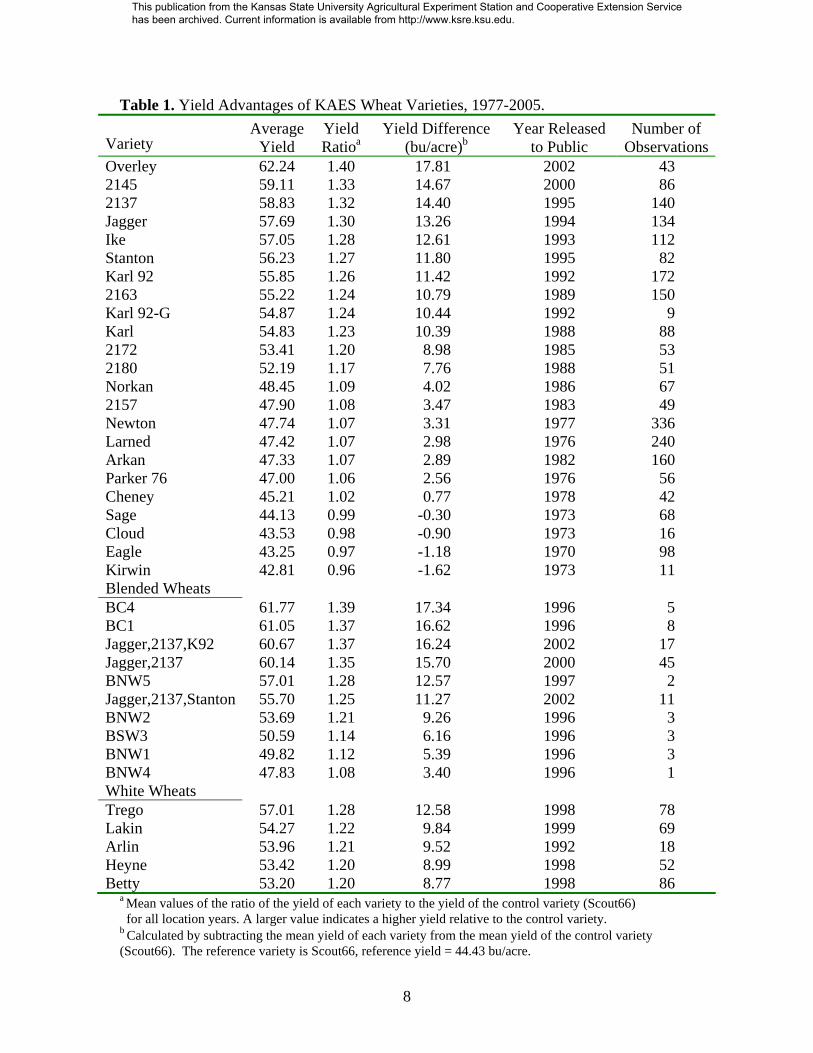
Table 1. Yield Advantages of KAES Wheat Varieties, 1977-2005. Variety
Average Yield
Yield Ratioa
Yield Difference (bu/acre)b
Year Released to Public
Number of Observations
Overley 62.24 1.40 17.81 2002 43 2145 59.11 1.33 14.67 2000 86 2137 58.83 1.32 14.40 1995 140 Jagger 57.69 1.30 13.26 1994 134 Ike 57.05 1.28 12.61 1993 112 Stanton 56.23 1.27 11.80 1995 82 Karl 92 55.85 1.26 11.42 1992 172 2163 55.22 1.24 10.79 1989 150 Karl 92-G 54.87 1.24 10.44 1992 9 Karl 54.83 1.23 10.39 1988 88 2172 53.41 1.20 8.98 1985 53 2180 52.19 1.17 7.76 1988 51 Norkan 48.45 1.09 4.02 1986 67 2157 47.90 1.08 3.47 1983 49 Newton 47.74 1.07 3.31 1977 336 Larned 47.42 1.07 2.98 1976 240 Arkan 47.33 1.07 2.89 1982 160 Parker 76 47.00 1.06 2.56 1976 56 Cheney 45.21 1.02 0.77 1978 42 Sage 44.13 0.99 -0.30 1973 68 Cloud 43.53 0.98 -0.90 1973 16 Eagle 43.25 0.97 -1.18 1970 98 Kirwin 42.81 0.96 -1.62 1973 11 Blended Wheats BC4 61.77 1.39 17.34 1996 5 BC1 61.05 1.37 16.62 1996 8 Jagger,2137,K92 60.67 1.37 16.24 2002 17 Jagger,2137 60.14 1.35 15.70 2000 45 BNW5 57.01 1.28 12.57 1997 2 Jagger,2137,Stanton 55.70 1.25 11.27 2002 11 BNW2 53.69 1.21 9.26 1996 3 BSW3 50.59 1.14 6.16 1996 3 BNW1 49.82 1.12 5.39 1996 3 BNW4 47.83 1.08 3.40 1996 1 White Wheats Trego 57.01 1.28 12.58 1998 78 Lakin 54.27 1.22 9.84 1999 69 Arlin 53.96 1.21 9.52 1992 18 Heyne 53.42 1.20 8.99 1998 52 Betty 53.20 1.20 8.77 1998 86
a Mean values of the ratio of the yield of each variety to the yield of the control variety (Scout66) for all location years. A larger value indicates a higher yield relative to the control variety. b Calculated by subtracting the mean yield of each variety from the mean yield of the control variety (Scout66). The reference variety is Scout66, reference yield = 44.43 bu/acre.
8
This publication from the Kansas State University Agricultural Experiment Station and Cooperative Extension Service has been archived. Current information is available from http://www.ksre.ksu.edu.
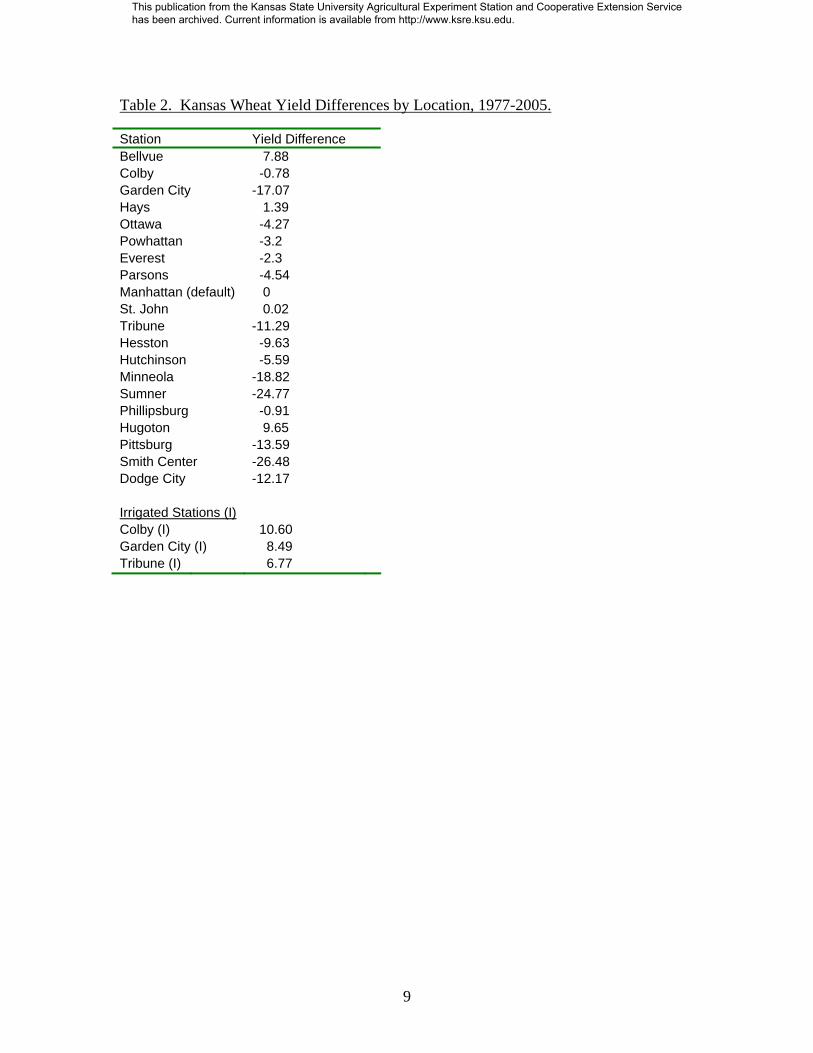
Table 2. Kansas Wheat Yield Differences by Location, 1977-2005. Station Yield Difference Bellvue 7.88 Colby -0.78 Garden City -17.07 Hays 1.39 Ottawa -4.27 Powhattan -3.2 Everest -2.3 Parsons -4.54 Manhattan (default) 0 St. John 0.02 Tribune -11.29 Hesston -9.63 Hutchinson -5.59 Minneola -18.82 Sumner -24.77 Phillipsburg -0.91 Hugoton 9.65 Pittsburg -13.59 Smith Center -26.48 Dodge City -12.17 Irrigated Stations (I) Colby (I) 10.60 Garden City (I) 8.49 Tribune (I) 6.77
9
This publication from the Kansas State University Agricultural Experiment Station and Cooperative Extension Service has been archived. Current information is available from http://www.ksre.ksu.edu.
References Alston, J.M., G.W. Norton, and P.G. Pardey. 1995. Science under Scarcity: Principles
and Practice for Agricultural Research and Evaluation and Priority Setting. Ithaca, NewYork: Cornell University Press.
Barkley, Andrew. 1997. Kansas Wheat Breeding: An Economic Analysis. SRP 793, Kansas State University Agricultural Experiment Station and Cooperative Extension Service, Manhattan, Kansas.
Blakeslee, L., and R. Sargent. 1982. Economic Impacts of Public Research and Extension Related to Wheat Production in Washington. Research Bulletin XB 0929. Agricultural Research Center, Washington State University, Pullman, Washington.
Boland M., and K. Dhuyvetter. “Economic Issues with Milling Hard White Wheat.” Manhattan, Kansas: Kansas State University, May 2002.
Brennan, J.P. 1984. Measuring the contribution of new varieties to increasing wheat yields. Review of Marketing and Agricultural Economics 52:175-195.
Brennan, J.P. 1989a. An analysis of the economic potential of some innovations in a wheat breeding programme. Australian Journal of Agricultural Economics 33:48-55.
Brennan, J.P. 1989b. An analytical model of a wheat breeding program. Agricultural Systems 31:349-366.
Byerlee, D., and G. Traxler. 1995. National and international wheat improvement research in the post-green revolution period: evolution and impacts. American Journal of Agricultural Economics 77:268-278.
Feyerherm, A.M., G.M. Paulsen, and J.L. Sebaugh. 1984. Contribution of genetic improvement to recent wheat yield increases in the U.S.A. Agronomy Journal 76:985-990.
Greene, W.H. 1993. Econometric Analysis, 2nd Edition, New York: Macmillan. Huffman, W.E., and R.E. Evenson. 1993. Science for Agriculture: A Long-Term
Perspective. Ames, Iowa: Iowa State University Press. Kansas Agricultural Experiment Station (KAES) and Cooperative Extension Service
(CES). Kansas Performance Tests with Winter Wheat Varieties. Various years, 1977-2005, Manhattan, Kansas: Kansas State University Printing Plant.
Kansas Wheat Commission. Wheat Facts: Classes. http://www.kswheat.com/general. Salmon, S.C., 1951. Analysis of variance of longtime variety tests of wheat.” Agronomy
Journal 43:562-570. Zentner, R.P., and W.L. Peterson. 1984. An economic evaluation of public wheat
research and extension expenditures in Canada. Canadian Journal of Agricultural Economics 32:327-353.
10
This publication from the Kansas State University Agricultural Experiment Station and Cooperative Extension Service has been archived. Current information is available from http://www.ksre.ksu.edu.

Kansas State University Agricultural Experiment Station and Cooperative Extension Service, Manhattan 66506
SRP 948 June 2006
Kansas State University Agricultural Experiment Station and Cooperative Extension Service is an equal opportunity provider and employer. These materials may be available in alternative formats. 210
This Report of Progress was edited, designed, and printed by the Department of Communications at Kansas State University
This publication from the Kansas State University Agricultural Experiment Station and Cooperative Extension Service has been archived. Current information is available from http://www.ksre.ksu.edu.