Sri Lanka Science, Technology & Innovation · FOREWORD Sri Lanka Science, Technology & Innovation...
97
Transcript of Sri Lanka Science, Technology & Innovation · FOREWORD Sri Lanka Science, Technology & Innovation...

Sri Lanka Science, Technology & InnovationStatistical Handbook
2015
National Science Foundation47/5, Maitland Place
Colombo 07Sri Lanka
www.nsf.gov.lk
HeadScience and Technology Policy Research DivisionNational Science Foundation47/5, Maitland PlaceColombo 07Sri Lanka
Tel/Fax: 011 2675841E-mail: [email protected]: www.mis.nsf.gov.lk
© National Science Foundation, Sri Lanka. ISBN 978-955-590-130-7
For a copy of the publication or suggestions for improvements, please write to:

FOREWORD
Sri Lanka Science, Technology & Innovation Statistical Handbook 2015, is a compilation of key findings of the National Research & Development (R&D) Survey carried out by the NSF during 2016-2017 to provide the nationally and internationally comparable statistical indicators on Science, Technology and Innovation. The definitions and classifications used in the National R&D Survey 2015 are based on the International Standardization of Statistics on Science and Technology (UNESCO, 2010) and the Frascati Manual (OECD, 2002).
The indicators presented in the first three chapters cover the input measures such as expenditure on research and development, available human resources and the output measures such as patents, publications etc. The fourth chapter presents the basic innovation indicators that were developed using the data collected through the National R&D Survey 2015, and hence, the readers will have an idea on how Sri Lanka performed in the year 2015 in the area of innovation. The last chapter presents some useful indicators relevant to broader areas such as economic and development activities in the country along with the indicators relevant to education, health and natural resources in Sri Lanka.
For easy reference of the users, Sri Lanka Science, Technology & Innovation Statistical Handbook 2015 also includes the highlights of the Survey and the general definitions used for the purpose.
Prof. Sirimali FernandoChairpersonNational Science FoundationColombo, Sri Lanka
January 2018
i

PREFACE
Sri Lanka Research and Development Survey 2015 was designed to measure the status of research and development in the country pertaining to the surveyed year 2015. The indicators presented in the handbook are aimed at policy planners, policy authorities, researchers and academics who require evidence based information to overview the national S&T status and benchmark Sri Lanka with the other countries globally. The definitions and classifications used in the survey appear at the end of the book.
Sri Lanka Science, Technology & Innovation Statistical Handbook 2015 was produced by the research team of the Science and Technology Policy Research Division of the NSF.
The valuable comments and editorial changes made by the external reviewer Prof. M.J.S. Wijeratne and Director General of the NSF, Prof. Ananda Jayawardane were greatly helpful in finalizing the document.
The Management Information System (MIS) Unit of the University Grants Commission (UGC) assisted the data collection of Higher Education Sector Institutions coming under the purview of the UGC. All the institutions under the scope of the survey that provided information for the success of this survey are gratefully acknowledged. The support and guidance received from the Chairperson, Director General and Board of Management of the NSF are immensely appreciated.
Dr P.R.M.P. Dilrukshi Ranathunge Head Science and Technology Policy Research Division (STPRD) National Science Foundation Sri Lanka
January 2018
iiii

TECHNICAL NOTES
The Research, Development and Innovation (RDI) consist of people, institutions, processes, infrastructure, linkages and collaborations that involved in the generation, diffusion and absorption of scientific and technological knowledge. The capability and performance of Sri Lanka’s Science, Technology and Innovation (STI) system is crucial to advance the future economic prosperity, social development and quality of life of people.
This survey covered four major S&T sectors in the country such as:a. Higher Education sector (State and Private)-full coverage. b. State S&T sector that included Research Institutions, S&T service providing Institutions–full coverage. c. Business Enterprises–250 institutions were selected for the survey considering the size of the establishment, degree of
their R&D activity and proportion of their contribution to national economy. All the major industries that conduct a substantial amount of R&D were included in the sample as per the guidance of the Department of Census and Statistics.
d. Private Non Profit Institutions (PNP)–all institutions that were involved in the activities related to S&T were covered in the survey.
The data, presented in this book are in line with the standards and methodologies laid down by the UNESCO and OECD. International standard classifications relevant to Science, Technology and Innovation were followed in questionnaire development, indicators development and presentation.
iii

iv
HIGHLIGHTS-2015
• Total investment forR&D fromGrossDomesticProduct (GDP) is 0.11% in2015 and it remainsconstant 0.1-0.11 during 2013-2015.
• When considered theR&D expenditure the highest investmentwas done byGovernment Sector(59.6%)followedbyBusinessEnterpriseSector(34.4%),PrivateNonProfitSector(2.3%)andForeignSector(1.5%).
• The highest propotion of funds for R&D was devoted for applied research (55.9%) followed byexperimentaldevelopmentresearch(30.1%)andbasicresearch(14.0%).
• Most of the research conducted in year 2015 came under the discipline of Agriculture (31.5%),followedbyNaturalSciences(26.6%),Engineering&Technology(25.1%),MedicalSciences(8.6%)andSocialSciences&Humanities(5.4%).
• SriLankarecorded292Researchers(Headcount)permillionpopulationand106FullTimeEquavalant(FTE) Researchers per million population in 2015.
iv

v
Abbreviations
FTE Full Time Equivalent GDP Gross Domestic Product GERD Gross Expenditure on R&D IPR Intellectual Property Rights IT Information Technology MIS Management Information System na not available NA Not Applicable NARESA Natural Resources, Energy & Science Authority nes not elsewhere specified
nm not mentionedNSF National Science Foundation o/w of which OECD Organization for Economic Co-operation and Development PCT Patent Cooperation Treaty PNP Private Non Profit PPP Purchasing Power Parity R&D Research and Development S&T Science and Technology SCI Science Citation Index STI Science, Technology and Innovation STP Science and Technology Personnel STPRD Science & Technology Policy Research Division UGC University Grants Commission UIS UNESCO Institute of Statistics

CONTENTS Foreword i
Preface iiTechnical Notes iiiHighlights iv
Abbreviations v
1. Financial Resources for Research and Development (2-18)
1.1: Gross Expenditure on R&D (GERD) in Sri Lanka 1966-20151.2: Gross Expenditure on R&D (GERD) in Selected Countries 1.3: National Gross Investment on R&D by Source of Funding 20151.4: National Gross Investment on R&D for Different Sectors by Source of Funding in 20151.5: Trends in Gross Expenditure on R&D (GERD) by Source of Funding as a Percentage of GDP 2008-20151.6: Trends in National Investment on R&D by Source of Funding 2008-20151.7: National Gross Expenditure on R&D (GERD) by Sector of Performance 2015 1.8: Trends in National Expenditure by Sectors of Performance 2010-20151.9: Percentage Gross Expenditure on R&D (GERD) by Source of Funding in Selected Countries 1.10: National R&D Expenditure by Nature of Research Activity 20151.11: National R&D Expenditure by Nature of Research Activity 2013-20151.12: Percentage of GERD by the Type of R&D Activity in Selected Countries 1.13: National R&D Expenditure of Different Sectors by Discipline 20151.14: National R&D Expenditure by Discipline 2008-2015
vivi
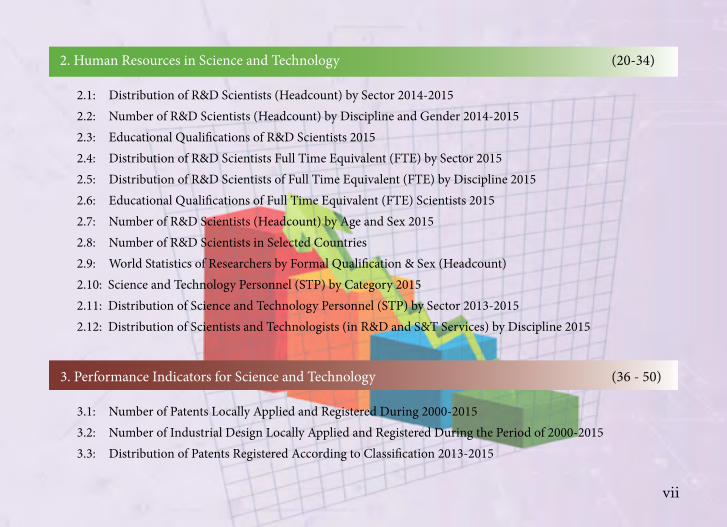
2. Human Resources in Science and Technology (20-34)
2.1: Distribution of R&D Scientists (Headcount) by Sector 2014-20152.2: Number of R&D Scientists (Headcount) by Discipline and Gender 2014-20152.3: Educational Qualifications of R&D Scientists 2015 2.4: Distribution of R&D Scientists Full Time Equivalent (FTE) by Sector 20152.5: Distribution of R&D Scientists of Full Time Equivalent (FTE) by Discipline 2015 2.6: Educational Qualifications of Full Time Equivalent (FTE) Scientists 20152.7: Number of R&D Scientists (Headcount) by Age and Sex 20152.8: Number of R&D Scientists in Selected Countries 2.9: World Statistics of Researchers by Formal Qualification & Sex (Headcount) 2.10: Science and Technology Personnel (STP) by Category 20152.11: Distribution of Science and Technology Personnel (STP) by Sector 2013-20152.12: Distribution of Scientists and Technologists (in R&D and S&T Services) by Discipline 2015
3. Performance Indicators for Science and Technology (36 - 50)
3.1: Number of Patents Locally Applied and Registered During 2000-2015 3.2: Number of Industrial Design Locally Applied and Registered During the Period of 2000-2015 3.3: Distribution of Patents Registered According to Classification 2013-2015
vii

3.4: Patent Applications in Selected Countries 2013-2015 3 5: Main Fields of Publications in the SCI Journals 2013-20153.6: Knowledge Disseminations During 20153.7: Science & Technology Postgraduate Output 2013-2015
4. Innovation Indicators (52 - 62)
4.1: R&D Expenditure by Different Industrial Categories 20154.2: Percentage of Total Revenue that came from the Sale of Products & Services by
Industries Involved in R&D in 2006-20154.3: Number of Innovations Developed by the Business Enterprises in 2015
4.4: Number of Innovations Developed by the Government Sector (R&D) Institutions in 2015
4.5: Number of Innovations Developed by the Higher Education Sector in 2015 4.6: High-Technology Exports (Current US$) in Selected Countries 2013-20154.7: Involvement of Industrial Sector with Other Institutions in Conducting R&D and Innovation Activities
2006-20154.8: Countries where Sri Lankan Business Enterprices Aquired their Technologies during 2008-20154.9: MethodologiesUsedbyIndustries(%)toProtecttheirIntellectualPropertyRights(IPR)
during 2006-2015
viiiviii

5. Key Socio-Economic Indicators - General (64 - 76)
5.1: Demographic Indicators of Sri Lanka 2014-20155.2: Demographic Indicators of SAARC Countries5.3: Social Indicators of SAARC Countries5.4: Economic Indicators on National Output and Expenditure 5.5: Composition of Exports 2014-20155.6: Composition of Imports by Major Categories 2014-20155.7: Realised Investments in the Board of Investment (BOI) Enterprises 2014-2015 5.8: Education Indicators in General Education5.9: Number of Government Schools 20155.10: Number of Students Studying Science in G.C.E. Advance Level in Government Schools 20155.11: Health Service Indicators of Public Sector 2012-20155.12: Key Indicators in Infrastructure Development in Public Communication Sector 2013-20155.13: Performance of Power and Energy Sector 2014-2015
Definitions 77-80Survey Team 81
ix


FINANCIAL RESOURCES FOR
RESEARCH AND DEVELOPMENT

2Financial Resources for Research & Development
Year GDP current prices
Rs. million
GERD Rs. million
(US$ million)
GERD as percentage
of GDP
Total population
million
GERD per million
population Rs. million
1966 7,529 19.8 (4.1) 0.30 11.5 1.7
1975 11,100 45.1 (6.4) 0.40 13.5 3.3
1984 142,700 257.0 (9.7) 0.18 15.6 16.5
1996 769,900 1,410.0 (23) 0.18 18.3 77.0
2004 1,800,750 3,807.5 (40.9) 0.21 19.4 196.2
2006 2,939,000 5,119.2 (47.9) 0.17 19.8 258.52008 4,410,682 5,047.7 (46.1) 0.11 20.2 249.92010 5,605,104 8,778.2 (69.4) 0.16 20.7 424.12013 8,674,230 9,670.0 (73.3) 0.11 20.5 471.7
2014 10,448,479 10,350.1 (79.0) 0.10 20.7 500.0
2015 11,183,220 11,904.1 (83.8) 0.11 20.9 569.6
1.1: Gross Expenditure on R&D (GERD) in Sri Lanka 1966-2015
Source: National R&D Surveys Sri Lanka, 1996 (NARESA), 2000, 2004, 2006, 2008, 2013, 2014 & 2015 (NSF)*Estimates

3Financial Resources for Research & Development
Figure 1: Trends in Gross Expenditure on R&D (GERD) in Sri Lanka
2,000
1966 1975 1984 1996 2004 2006 2008 2010 2013 2014 2015 0 0
0.05
0.1
0.15
0.2
0.25
0.3
0.35
0.4
0.45
0.3
0.4
4,000
6,000
8,000
10,000
12,000
14,000Ex
pend
iture
(Rs.
mill
ion)
GER
D a
s Per
cent
age
of G
DP
Expenditure (Rs. million)
GERD as Percentage of GDP
0.18 0.180.21 0.17
0.11
0.16 0.11
0.10
0.11
Year

Country Year (Data available)
GERD (in Constant PPP$)
GERD (as a % of GDP)
GERD per Capita (in PPP$)
Australia 2013 18,241,431 2.20 994.12Brazil 2014 32,498,467 1.17 186.57China 2015 342,513,404 2.07 297.65France 2015 46,972,923 2.23 945.22Germany 2015 87,179,229 2.88 1,398.08India 2015 42,038,378 0.63 38.34Indonesia 2013 1,832,856 0.08 8.48Iraq 2015 174,475 0.04 5.73Japan 2015 140,316,886 3.28 1,343.74Malaysia 2015 8,895,835 1.30 344.33New Zealand 2013 1,391,195 1.15 415.94Pakistan 2015 1,944,365 0.25 12.31Philippines 2013 762,767 0.14 9.09Republic of Korea 2015 69,848,079 4.23 1,475.69Saudi Arabia 2013 10,766,303 0.82 414.33Singapore 2014 8,510,212 2.20 1,828.39South Africa 2013 4,264,722 0.72 92.79Sri Lanka 2015 11,725 0.11 5.70Thailand 2015 5,809,929 0.63 102.23United Kingdom 2015 37,327,531 1.70 715.39United States of America 2015 420,550,104 2.79 1,562.88
1.2: Gross Expenditure on R&D (GERD) in Selected Countries
Source: Adopted from UNESCO Statistics 2015*National R&D Survey Sri Lanka, 2015
4Financial Resources for Research & Development
*

5Financial Resources for Research & Development
1.3: National Gross Investment on R&D by Source of Funding 2015
Source of Funding
Recurrent Capital Total GERD (as a % of GDP)
Government6,181.5 918.0 7,099.5 0.063
(51.9%) (7.7%) (59.6%)
Business Enterprise
3,737.6 362.3 4,099.9 0.037
(31.4%) (3.0%) (34.4%)
Foreign 133.7 42.7 176.4 0.002
(1.1%) (0.4%) (1.5%)
Other400.8 127.5 528.3 0.004
(3.4%) (1.1%) (4.4%)
Total10,453.6 1,450.5 11,904.1 0.106
(87.8%) (12.2%) (100.0%)
Rs. million
Figure 2: National investment on R&D by
different sectors
Source: National R&D Survey Sri Lanka, 2015 (NSF)NOTE: Percentage indicated in the table counted taking individual count as percentage of the overall total (Rs. million 11,904.1)
Foreign2%
Other4%
Government60%
Business Enterprises34%
6Financial Resources for Research & Development
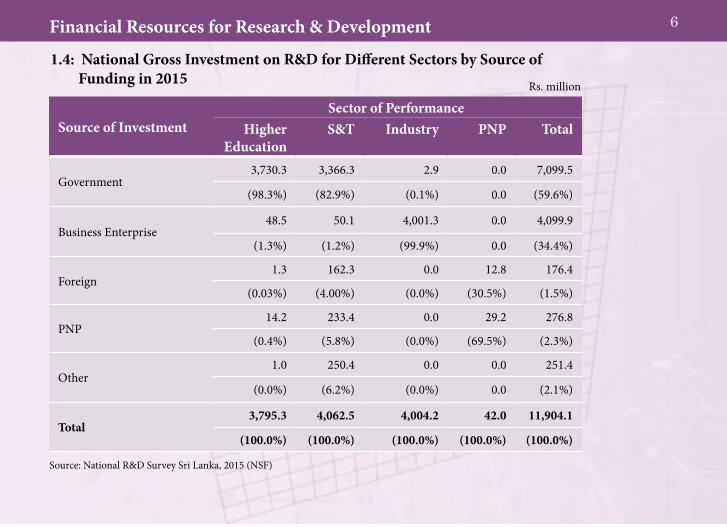
1.4: National Gross Investment on R&D for Different Sectors by Source of Funding in 2015
Source: National R&D Survey Sri Lanka, 2015 (NSF)
Source of Investment Sector of Performance
Higher Education
S&T Industry PNP Total
Government3,730.3 3,366.3 2.9 0.0 7,099.5
(98.3%) (82.9%) (0.1%) 0.0 (59.6%)
Business Enterprise 48.5 50.1 4,001.3 0.0 4,099.9
(1.3%) (1.2%) (99.9%) 0.0 (34.4%)
Foreign 1.3 162.3 0.0 12.8 176.4
(0.03%) (4.00%) (0.0%) (30.5%) (1.5%)
PNP14.2 233.4 0.0 29.2 276.8
(0.4%) (5.8%) (0.0%) (69.5%) (2.3%)
Other1.0 250.4 0.0 0.0 251.4
(0.0%) (6.2%) (0.0%) 0.0 (2.1%)
Total3,795.3 4,062.5 4,004.2 42.0 11,904.1
(100.0%) (100.0%) (100.0%) (100.0%) (100.0%)
Rs. million
7Financial Resources for Research & Development
0% 20% 40% 60% 80% 100%
2015
2014
2013
2010
2008
Expenditure (%)
Year
Government
Business Enterprise
Foreign
Other
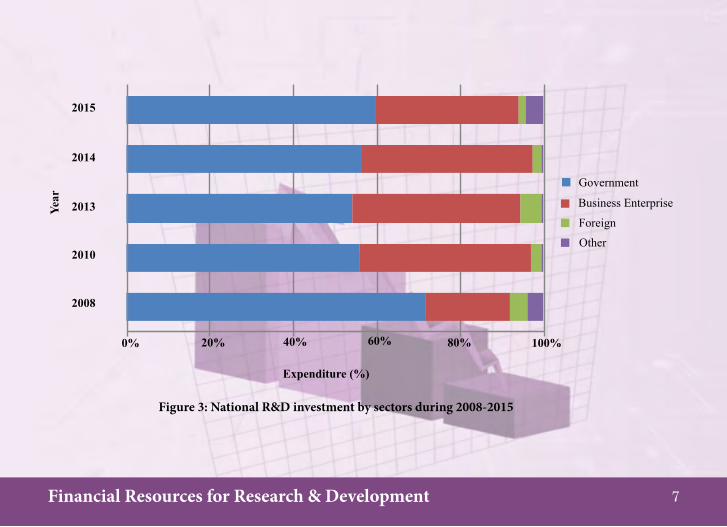
Figure 3: National R&D investment by sectors during 2008-2015
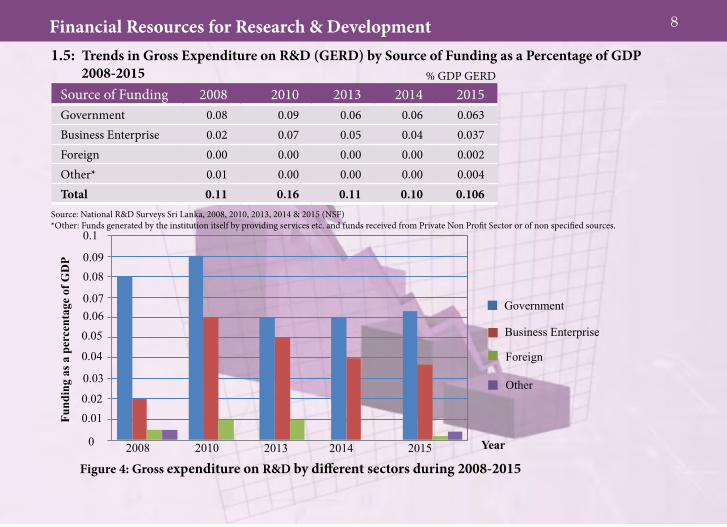
1.5: Trends in Gross Expenditure on R&D (GERD) by Source of Funding as a Percentage of GDP 2008-2015
Source of Funding 2008 2010 2013 2014 2015Government 0.08 0.09 0.06 0.06 0.063Business Enterprise 0.02 0.07 0.05 0.04 0.037Foreign 0.00 0.00 0.00 0.00 0.002Other* 0.01 0.00 0.00 0.00 0.004Total 0.11 0.16 0.11 0.10 0.106
Source: National R&D Surveys Sri Lanka, 2008, 2010, 2013, 2014 & 2015 (NSF)*Other: Funds generated by the institution itself by providing services etc. and funds received from Private Non Profit Sector or of non specified sources.
%GDPGERD
8Financial Resources for Research & Development
Business Enterprise
Government
Foreign
Other
0.07
0.080.09
0.1
0.06
0.04
0.05
0.03
0.020.01
0 20102008 2013 2014 2015 Year
Fund
ing
as a
per
cent
age
of G
DP
Figure 4: Gross expenditure on R&D by different sectors during 2008-2015

9Financial Resources for Research & Development
1.6: Trends in National Investment on R&D by Source of Funding 2008-2015
Source: National R&D Surveys Sri Lanka, 2008, 2010, 2013, 2014 & 2015 (NSF)*Other: Funds generated by the institution itself by providing services etc. and funds received from Private Non Profit Sector or of non specified sources
Source of Funding 2008 2010 2013 2014 2015
Government 3,624.41 4,907.16 5,209.97 5,813.22 7,099.60
(71.8%) (55.9%) (53.9%) (56.2%) (59.6%)
Business Enterprise1,004.01 3,592.58 3,934.04 4,268.41 4,099.90
(19.9%) (40.9%) (40.7%) (41.2%) (34.4%)
Foreign215.59 239.13 486.17 220.82 176.40
(4.3%) (2.7%) (5.0%) (2.1%) (1.5%)
Other*203.74 39.29 39.83 47.63 528.20
(4.0%) (0.5%) (0.4%) (0.5%) (4.4%)
Total 5,047.75 8,778.16 9,670.01 10,350.08 11,904.10
(100.0%) (100.0%) (100.0%) (100.0%) (100.0%)
Rs. million
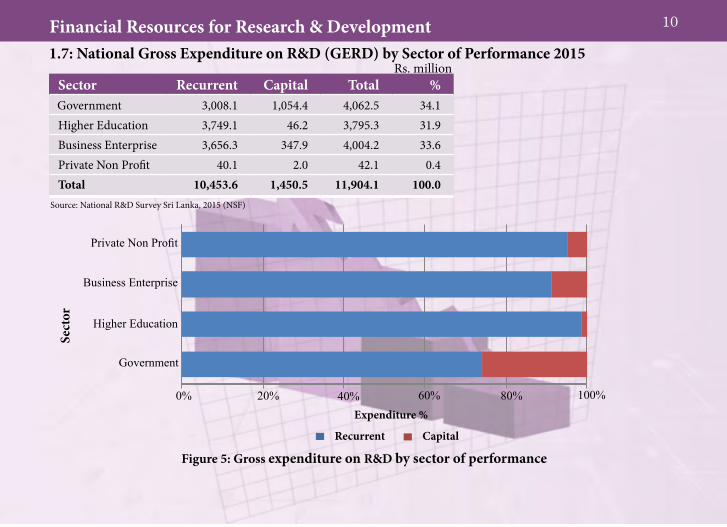
1.7: National Gross Expenditure on R&D (GERD) by Sector of Performance 2015
Source: National R&D Survey Sri Lanka, 2015 (NSF)
Sector Recurrent Capital Total % Government 3,008.1 1,054.4 4,062.5 34.1Higher Education 3,749.1 46.2 3,795.3 31.9Business Enterprise 3,656.3 347.9 4,004.2 33.6Private Non Profit 40.1 2.0 42.1 0.4Total 10,453.6 1,450.5 11,904.1 100.0
Expenditure %
Sect
or
Private Non Profit
Business Enterprise
Higher Education
Government
Recurrent Capital
Rs. million
0% 20% 40% 60% 80% 100%
Figure 5: Gross expenditure on R&D by sector of performance
10Financial Resources for Research & Development

1.8: Trends in National Expenditure by Sectors of Performance 2010-2015
SectorYear
2010 2013 2014 2015
Government3,927.90 3,365.95 4,018.09 4,062.50(44.8%) (34.8%) (38.8%) (34.1%)
Higher Education1,008.34 1,931.12 2,072.60 3,795.30(11.5%) (20.0%) (20.0%) (31.9%)
Business Enterprise3,840.36 4,339.60 4,230.87 4,004.20(43.7%) (44.9%) (40.9%) (33.6%)
Private Non Profit1.56 33.33 28.51 42.10
(0.0%) (0.3%) (0.3%) (0.4%)
Total8,778.16 9,670.00 10,350.07 11,904.10(100.0%) (100.0%) (100.0%) (100.0%)
Source: National R&D Surveys Sri Lanka, 2010, 2013, 2014 & 2015 (NSF)
Rs. million
11Financial Resources for Research & Development

1.9: Percentage Gross Expenditure on R&D (GERD) by Source of Funding in Selected Countries Country Percentage Contribution to GERD by Different Sector
Year* Business Enterprise
Government Higher Education
Private Non Profit
Australia 2013 56.31 11.21 29.63 2.84
Canada 2014 49.89 9.20 40.41 0.50China 2015 76.79 16.16 7.05 na
France 2015 65.10 13.07 20.28 1.55
Germany 2015 67.74 14.91 17.35 naIndia 2015 43.58 52.47 3.94 NilIndonesia 2013 25.68 39.39 34.93 naIraq 2015 1.64 39.27 59.09 NilJapan 2015 78.49 7.90 12.28 1.33Malaysia 2015 51.95 19.56 28.48 NilRepublic of Korea 2015 77.53 11.74 9.09 1.64Singapore 2014 61.17 11.40 27.43 naSri Lanka 2015 33.60 34.10 31.90 0.40United Kingdom 2015 65.73 6.80 25.62 1.86United States of America 2015 71.52 11.18 13.23 4.08
Source: Adopted from: http://www.uis.unesco.org/ScienceTechnology/Pages/default.aspxna: not available; Nil: No adequate data*Data is available for this year only
12Financial Resources for Research & Development

Nature of research Govern-ment
Higher Education
Business Enterprise
PNP Total %
Basic 593.0 211.8 850.9 13.0 1,668.7 14.0Applied 2,609.4 2,811.4 1,198.5 29.0 6,648.3 55.9Experimental Development 860.1 772.1 1,954.9 0.0 3,587.1 30.1Total 4,062.5 3,795.3 4,004.3 42.0 11,904.1 100.0
1.10: National R&D Expenditure by Nature of Research Activity 2015Rs. million
Higher Education
Government
Business Enterprise
PNP
Sect
or
Basic
Applied
Experimental Development
Expenditure (%)
Source: National R&D Survey Sri Lanka, 2015 (NSF)
0% 20% 40% 60% 80% 100%
Figure 6: National R&D expenditure by nature of research activity 2015
13Financial Resources for Research & Development

14Financial Resources for Research & Development
Nature of Research2013 2014 2015
Amount % Amount % Amount %Basic Research 959.29 10.0 1,578.47 15.2 1,668.80 14.0Applied Research 5,518.65 57.0 5,938.05 57.4 6,648.20 55.9Experimental Development 3,192.06 33.0 2,833.56 27.4 3,587.10 30.1Total 9,670.00 100.0 10,350.08 100.0 11,904.10 100.0
1.11: National R&D Expenditure by Nature of Research Activity 2013-2015
Source: National R&D Surveys Sri Lanka, 2013, 2014 & 2015 (NSF)
Rs. million
Experimental Development
Expenditure (%)
Year
Applied Research
Basic Research
0% 20% 40% 60% 80% 100%
2010
2013
2014
2015
Figure 7: National R&D expenditure by nature of research activity 2010-2015

15Financial Resources for Research & Development
Country % of GERD
Year Basic Research
Applied Research
Experimental Development
Not Specified
China 2015 5.05 10.79 84.16 0.00France 2014 24.39 37.59 34.75 0.00Japan 2015 11.91 19.86 63.69 4.55Malaysia 2015 20.93 70.48 8.58 0.00New Zealand 2013 25.18 39.11 35.75 0.00
Republic of Korea 2015 17.23 20.84 61.94 0.00Singapore 2014 19.67 32.07 48.25 0.00South Africa 2013 23.78 47.28 28.94 0.00Sri Lanka 2015 14.02 55.85 30.13 0.00Thailand 2015 14.70 35.67 42.68 6.95United Kingdom 2014 16.91 43.33 39.76 0.00
1.12: Percentage of GERD by the Type of R&D Activity in Selected Countries
Source: Adopted from: http://www.uis.unesco.org/ScienceTechnology/Pages/default.aspx

16Financial Resources for Research & Development1.13: National R&D Expenditure of Different Sectors by Discipline 2015
Source: National R&D Survey Sri Lanka, 2015 (NSF)
Discipline Higher Education
State Sector
Business Enterprise
PNP Total %
Natural Sciences 1,182.8 888.1 1,060.8 38.6 3,170.3 26.6Engineering & Technology 679.5 683.1 1,629.0 0.2 2,991.8 25.1Medical Sciences 974.5 42.8 1.8 0.0 1,019.1 8.6Agricultural Sciences 419.3 2,035.1 1,291.7 0.0 3,746.1 31.5Social Sciences & Humanities 253.9 390.6 0.0 3.3 647.8 5.4
Other 285.3 22.8 20.9 0.0 329.0 2.8Total 3,795.3 4,062.5 4,004.2 42.1 11,904.1 100.0
Medical Sciences
Other
Engineering & Technology
Social Sciences & Humanities
Natural Sciences
Agricultural Sciences
0% 20% 40% 60% 80% 100%Expenditure (%)
Sect
or
State Sector
Higher Education
Business Enterprise
PNP
Rs. million
Figure 8: National R&D expenditure by different sectors 2015

17Financial Resources for Research & Development
1.14: National R&D Expenditure by Discipline 2008-2015
Source: National R&D Surveys Sri Lanka, 2008, 2010, 2013, 2014 & 2015 (NSF)
DisciplineYear
2008 2010 2013 2014 2015
Natural Sciences645.00 1,064.11 2,376.86 2,666.19 3,170.30(12.8%) (12.1%) (24.6%) (25.8%) (26.6%)
Engineering & Technology 1,490.20 1,771.38 3,195.52 2,447.55 2,991.80(29.5%) (20.2%) (33.1%) (23.5%) (25.1%)
Medical Sciences 875.10 498.62 904.49 371.84 1,019.10(17.3%) (5.7%) (9.4%) (3.7%) (8.6%)
Agricultural Sciences1,669.60 2,925.99 2,693.25 4,077.77 3,746.10(33.1%) (33.3%) (27.8%) (39.4%) (31.5%)
Social Sciences & Humanities367.80 577.81 475.77 603.85 647.80(7.3%) (6.6%) (4.9%) (5.8%) (5.4%)
Other0.00 1,940.25 24.11 182.87 329.00
(0.0%) (22.1%) (0.2%) (1.8%) (2.8%)
Total5,047.70 8,778.16 9,670.00 10,350.07 11,904.10(100.0%) (100.0%) (100.0%) (100.0%) (100.0%)
Rs. million

18Financial Resources for Research & Development
2013
2010
2008
2014
2015
0% 20% 40% 60% 80% 100%
Medical Sciences
Other
Engineering & Technology
Social Sciences and Humanities
Natural Sciences
Agricultural Sciences
Expenditure (%)
Year
Figure 9: National expenditure on R&D by discipline from 2008-2015

HUMAN RESOURCES IN
SCIENCE AND TECHNOLOGY
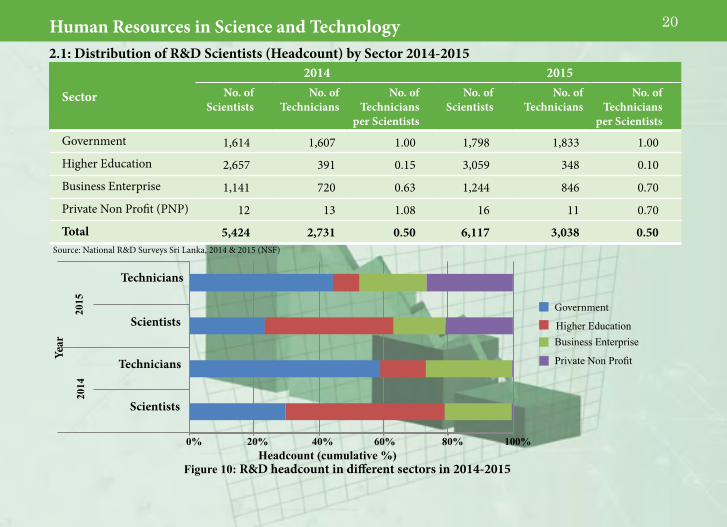
2.1: Distribution of R&D Scientists (Headcount) by Sector 2014-2015
Sector
2014 2015No. of
ScientistsNo. of
TechniciansNo. of
Technicians per Scientists
No. of Scientists
No. of Technicians
No. of Technicians
per Scientists
Government 1,614 1,607 1.00 1,798 1,833 1.00
Higher Education 2,657 391 0.15 3,059 348 0.10
Business Enterprise 1,141 720 0.63 1,244 846 0.70
Private Non Profit (PNP) 12 13 1.08 16 11 0.70
Total 5,424 2,731 0.50 6,117 3,038 0.50Source: National R&D Surveys Sri Lanka, 2014 & 2015 (NSF)
Headcount (cumulative %)
Business Enterprise
Private Non Profit
Higher Education
Government
20Human Resources in Science and Technology
0% 20% 40% 60% 80% 100%
Technicians
Scientists
Scientists
Technicians
2014
2015
Figure 10: R&D headcount in different sectors in 2014-2015
Year

2.2: Number of R&D Scientists (Headcount) by Discipline and Gender 2014-2015
Discipline
Headcount of R&D Scientists (2014)
Headcount of R&D Scientists(2015)
Male Female Total Male Female TotalNo % No % No % No % No % No %
Natural Sciences 891 30 738 30 1,629 30 993 30 904 32 1,897 31
Agricultural Sciences
651 22 638 26 1,289 23 737 23 686 24 1,423 23
Engineering & Technology
713 24 334 13 1,047 19 780 24 506 18 1,286 21
Medical Sciences 360 12 434 18 794 15 441 14 335 12 776 13
Social Sciences & Humanities
233 8 175 7 408 8 239 7 232 8 471 8
Other 97 4 160 6 257 5 76 2 188 6 264 4
Total 2,945 100 2,479 100 5,424 100 3,266 100 2,851 100 6,117 100Source: National R&D Surveys Sri Lanka, 2014 & 2015 (NSF)
21Human Resources in Science and Technology
22Human Resources in Science and Technology
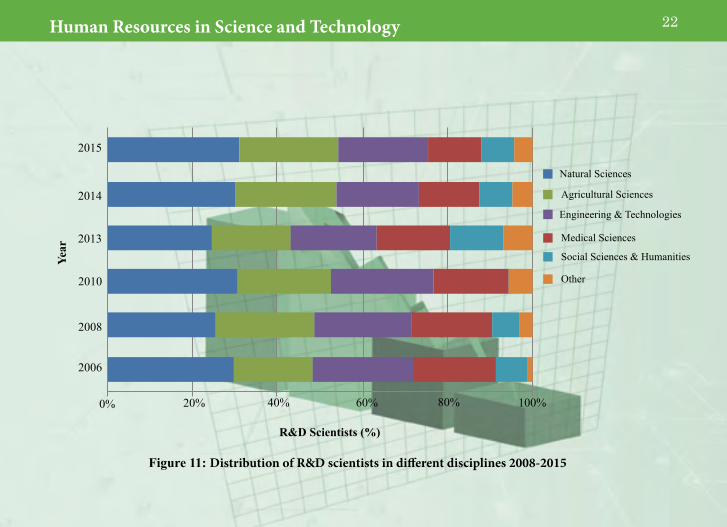
Figure 11: Distribution of R&D scientists in different disciplines 2008-2015
Natural Sciences
Medical Sciences
Agricultural Sciences
Social Sciences & Humanities
Other
Engineering & Technologies
R&D Scientists (%)
Year
2008
2006
2010
2013
2014
2015
0% 20% 40% 60% 80% 100%
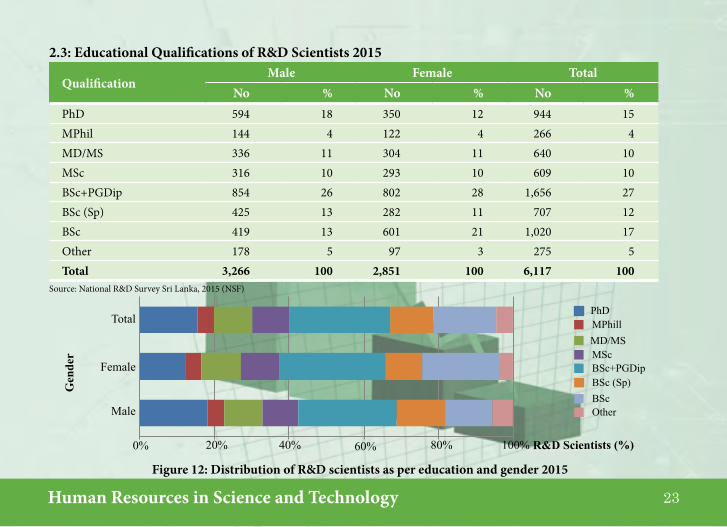
2.3: Educational Qualifications of R&D Scientists 2015
QualificationMale Female Total
No % No % No %PhD 594 18 350 12 944 15MPhil 144 4 122 4 266 4MD/MS 336 11 304 11 640 10MSc 316 10 293 10 609 10BSc+PGDip 854 26 802 28 1,656 27BSc (Sp) 425 13 282 11 707 12BSc 419 13 601 21 1,020 17Other 178 5 97 3 275 5Total 3,266 100 2,851 100 6,117 100
23Human Resources in Science and Technology
Source: National R&D Survey Sri Lanka, 2015 (NSF)
Figure 12: Distribution of R&D scientists as per education and gender 2015
Gen
der
20% 40% 60% 80% 100% R&D Scientists (%)0%
PhD
MSc
BSc
MPhill
BSc+PGDip
Other
BSc (Sp)
MD/MS
Total
Female
Male

2.4: Distribution of R&D Scientists Full Time Equivalent (FTE) by Sector 2015
Sector Full Time Equivalent of R&D Scientists
Male Female Total % of Female
Government 608 490 1,098 24Higher Education 334 278 612 13Business Enterprise 253 245 498 12PNP 3 5 8 0Total 1,198 1,018 2,216 49
24Human Resources in Science and Technology
Source: National R&D Survey Sri Lanka, 2015 (NSF)
R&D Scientists (FTE %)
Figure 13: Trends in R&D scientists (FTE) distribution by sector 2008-2015
Year
2008
2010
2013
2014
2015
0% 20% 40% 60% 80% 100%
Business Enterprise
Private Non Profit
Higher Education
Government

2.5: Distribution of R&D Scientists of Full Time Equivalent (FTE) by discipline 2015
Discipline 2015
Male Female Total
Natural Sciences 320 291 611Agricultural Sciences 352 309 661Engineering & Technology 295 161 456Medical Sciences 112 93 205Social Sciences and Humanities 87 86 173Other 32 78 110Total 1,198 1,018 2,216
25Human Resources in Science and Technology
Source: National R&D Survey Sri Lanka, 2015 (NSF)
Dis
cipl
ine
0% 20% 40% 60% 80% 100%
Figure 14: Trends in distribution of R&D scientists (FTE) in different disciplines 2015
Natural Sciences
Engineering & Technologies
Medical Sciences
Agricultural Sciences
Social Sciences and Humanities
Other
R&D Scientists (FTE %)
Male
Female
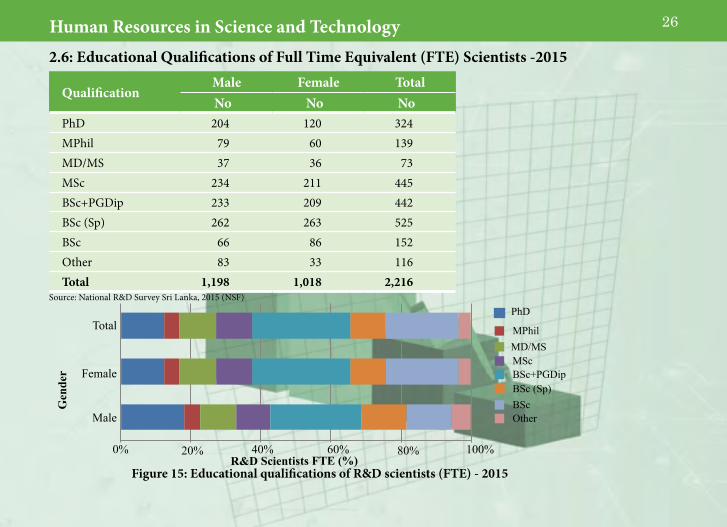
2.6: Educational Qualifications of Full Time Equivalent (FTE) Scientists -2015
QualificationMale Female TotalNo No No
PhD 204 120 324MPhil 79 60 139MD/MS 37 36 73MSc 234 211 445BSc+PGDip 233 209 442BSc (Sp) 262 263 525BSc 66 86 152Other 83 33 116Total 1,198 1,018 2,216
26Human Resources in Science and Technology
Source: National R&D Survey Sri Lanka, 2015 (NSF)
Gen
der
R&D Scientists FTE (%)0% 20% 40% 60% 80% 100%
Figure 15: Educational qualifications of R&D scientists (FTE) - 2015
PhD
MSc
BSc
MPhil
BSc+PGDip
Other
BSc (Sp)
MD/MS
Total
Female
Male

27Human Resources in Science and Technology
2.7: Number of R&D Scientists (Headcount) by Age and Sex 2015
Age groupHeadcount of R&D Scientists Headcount of Full Time
Equivalent (FTE) Scientists Male Female Total Male Female Total
21-30 554 349 903 238 168 40631-40 508 635 1,143 254 277 53141-50 869 817 1,686 335 297 63251-60 750 573 1,323 270 177 447Above 60 446 309 755 100 75 175Not mentioned 139 168 307 1 24 25Total 3,266 2,851 6,117 1,198 1,018 2,216
above 6051-6041-50 31-4021-30
Male
R&
D S
cien
tists
(F
TE
)
Female
Male
Female
R&
D S
cien
tists
(T
otal
)
Source: National R&D Survey Sri Lanka, 2015 (NSF)
0% 20% 40% 60% 80% 100%Figure 16: Age distribution of R&D scientists engaged in research in 2015
Headcount (%)

28Human Resources in Science and Technology2.8: Number of R&D Scientists in Selected Countries
Country Year (Data available)
Researchers (HC) per million population
Researchers (FTE) per million population
Austria 2013 8,419 4,763Belgium 2013 5,982 4,156China 2012 1,527 1,036France 2014 5,770 4,169Germany 2013 6,818 4,400Iraq 2015 169 64Ireland 2013 5,436 3,606Italy 2014 2,811 1,977Japan 2015 7,169 5,231Malaysia 2015 2,909 2,261New Zealand 2013 6,562 4,009Pakistan 2015 430 294Republic of Korea 2015 9,012 7,087South Africa 2013 860 437Sri Lanka 2015 292 106United Kingdom 2014 7,604 4,299
Source: Adopted from UNESCO Statistics; National R&D Survey Sri Lanka, 2015 (NSF) HC: Headcount
*
*

29Human Resources in Science and Technology
2.9: World Statistics of Researchers by Formal Qualification & Sex (Headcount)
Source: Adopted from UIS statistics(n) Magnitude nil or negligible
Country
Year Researchers (Total)
Researchers (with PhD or similar Level %)
Researchers (Bachelor or Master Level
%)
Researchers (short
occupancy programmes
%)
Researchers (All other
qualifications %)
Researchers (Female %)
Austria 2013 71,448 27.87 52.57 2.53 17.02 29.60
Bulgaria 2014 17,795 53.07 43.97 1.73 1.24 49.50
Chile 2015 13,015 45.14 32.21 17.33 5.32 33.00
Iraq 2015 6,158 47.56 52.40 0.03 (n) 39.90
Malaysia 2015 89,861 25.31 67.42 1.55 1.80 49.60
Pakistan 2015 81,306 12.30 87.70 (n) 33.90
Russian Federation 2015 37,9411 29.40 70.60 40.30
Singapore 2014 4,0730 23.70 71.16 5.14 30.10
South Africa 2013 45,935 59.46 32.59 7.94 44.00
Sri Lanka 2015 6,117 19.00 76.00 5.00 46.62
Turkey 2014 181,544 41.24 56.51 1.29 0.95 36.90

30Human Resources in Science and Technology 2.10: Science and Technology Personnel (STP) by Category 2015
Category Male Female Total Per million population
S&T Scientists 7,211 5,134 12,345 591
Technicians 17,173 5,884 13,057 1,103
Other Supporting Staff 44,045 24,212 68,257 3,266
STP 68,429 35,230 93,659 4,960Source: National R&D Survey Sri Lanka, 2015 (NSF)
S&T ScientistsTechniciansSupporting Staff
S&T Personnel (%)
2014
2013
2015
Year
Figure 17: Trends in science and technology personnel (STP) distribution 2013-2015
0% 20% 40% 60% 80% 100%

31Human Resources in Science and Technology
2.11: Distribution of Science and Technology Personnel (STP) by Sector 2013-2015
Sector2013 2014 2015
STP Percent STP Percent STP PercentGovernment 18,992 16.74 21,986 25.07 11,965 13Higher Education 3,873 3.42 6,140 7.00 6,656 07Business Enterprise 90,546 79.81 59,509 67.86 74,985 80PNP 36 0.03 57 0.07 53 0Total 113,447 100.00 87,692 100.00 93,659 100
Source: National R&D Surveys Sri Lanka, 2013, 2014 & 2015 (NSF) NOTE: Total STP includes all Researchers, other Scientists Technicians and Supporting Staff
201520142013
Figure 18: Trends in Science and Technology Personnel (STP) across different sectors, 2013-2015
Business Enterprise
Government
Year
S&T
Pers
onne
l
Higher Education
Private Non Profit
010,00020,00030,00040,00050,00060,00070,00080,00090,000
100,000

32Human Resources in Science and Technology2.12: Distribution of Scientists and Technologists (in R&D and S&T Services) by
Discipline 2015
STP Male Female Total % Female
of TotalNatural Sciences 2,242 1,837 4,079 15Agricultural Sciences 1,120 863 1,983 7Engineering & Technologies 2,122 966 3,088 8Medical Sciences 742 532 1,274 4Social Sciences & Humanities 734 667 1,401 5Other/Not specified 251 269 520 2Total 7,211 5,134 12,345 42
Figure 19: Distribution of Scientists and Technologists in different disciplines 2015
Source: National R&D Survey Sri Lanka, 2015 (NSF)
Natural Sciences
Engineering & Technologies
Medical Sciences
Social Sciences and Humanities
OtherAgricultural Sciences
0
500
1000
1500
200025003000
350040004500
Male
Female
Total
Discipline
Num
ber o
f Sc
ient
ists
and
Tec
hnol
ogis
ts

33Human Resources in Science and Technology
Natural Sciences
Medical SciencesAgricultural Sciences
Social Sciences & Humanities
Other
Engineering & Technologies
Figure 20: Distribution of scientists by discipline 2010-2015
2010 2013 2014 2015
10
0
20
30
40
50
60
Year
Num
ber o
f Sci
entis
ts a
nd T
echn
olog
ists
34Human Resources in Science and Technology
2004 2006 2008 2010 2013 2014 20150
2000
4000
6000
8000
10000
12000
14000
Year
Num
ber
of S
cien
tists
STP Scientists
R&D Scientists
R&D Scientists (FTE)
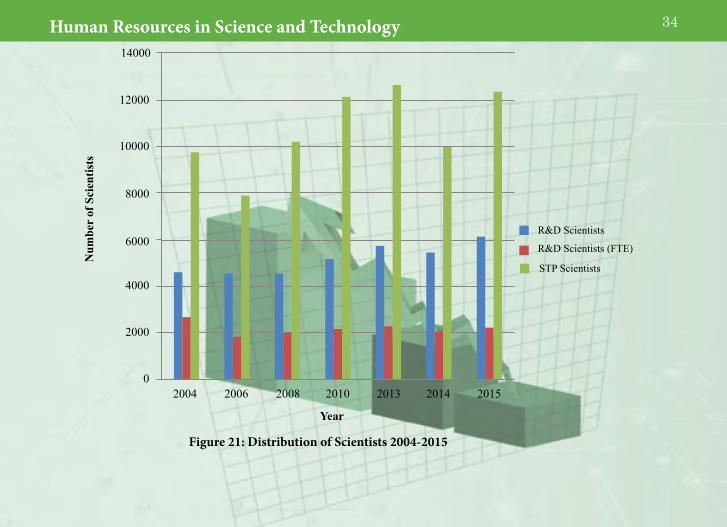
Figure 21: Distribution of Scientists 2004-2015

PERFORMANCE INDICATORS FOR
SCIENCE AND TECHNOLOGY
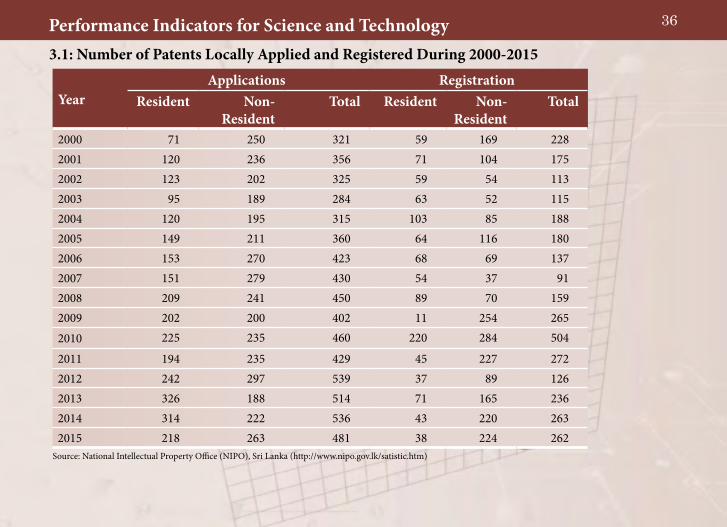
3.1: Number of Patents Locally Applied and Registered During 2000-2015
Source: National Intellectual Property Office (NIPO), Sri Lanka (http://www.nipo.gov.lk/satistic.htm)
36Performance Indicators for Science and Technology
YearApplications Registration
Resident Non- Resident
Total Resident Non-Resident
Total
2000 71 250 321 59 169 2282001 120 236 356 71 104 1752002 123 202 325 59 54 1132003 95 189 284 63 52 1152004 120 195 315 103 85 1882005 149 211 360 64 116 1802006 153 270 423 68 69 1372007 151 279 430 54 37 912008 209 241 450 89 70 1592009 202 200 402 11 254 2652010 225 235 460 220 284 504
2011 194 235 429 45 227 2722012 242 297 539 37 89 1262013 326 188 514 71 165 2362014 314 222 536 43 220 2632015 218 263 481 38 224 262

37Performance Indicators for Science and Technology
3.2: Number of Industrial Design Locally Applied and Registered During the Period of 2000-2015
Source: National Intellectual Property Office (NIPO), Sri Lanka (http://www.nipo.gov.lk/satistic.htm)
YearApplications Registration
Resident Non- Resident
Total Resident Non-Resident
Total
2000 187 10 197 179 6 1852001 520 26 546 482 11 4932002 345 40 385 253 13 2662003 385 42 427 365 23 3882004 254 50 304 224 40 2642005 257 47 304 269 88 3572006 477 39 516 422 45 4672007 328 24 352 8 6 142008 333 56 389 85 4 892009 273 40 313 238 36 2742010 233 51 284 228 37 265
2011 387 56 443 88 21 1092012 365 29 394 60 28 882013 260 99 359 100 30 1302014 245 47 292 471 58 5292015 392 68 460 179 67 246
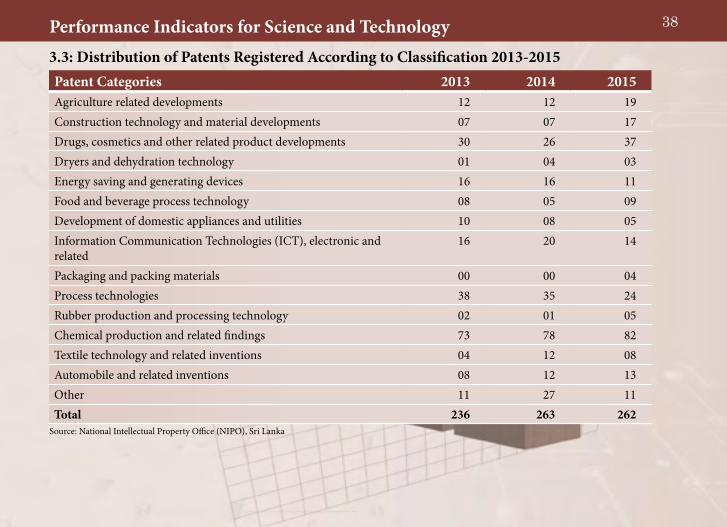
38Performance Indicators for Science and Technology3.3: Distribution of Patents Registered According to Classification 2013-2015
Source: National Intellectual Property Office (NIPO), Sri Lanka
Patent Categories 2013 2014 2015Agriculture related developments 12 12 19Construction technology and material developments 07 07 17Drugs, cosmetics and other related product developments 30 26 37Dryers and dehydration technology 01 04 03Energy saving and generating devices 16 16 11Food and beverage process technology 08 05 09Development of domestic appliances and utilities 10 08 05Information Communication Technologies (ICT), electronic and related
16 20 14
Packaging and packing materials 00 00 04Process technologies 38 35 24Rubber production and processing technology 02 01 05Chemical production and related findings 73 78 82Textile technology and related inventions 04 12 08Automobile and related inventions 08 12 13Other 11 27 11Total 236 263 262
39Performance Indicators for Science and Technology
0% 20% 40% 60% 80% 100%
2015
2014
2013
Year
Number of Patents (%)
Chemical production and related findings
Drugs, cosmetics and other related product developments
Agriculture related developments
Construction technology and material developments
Information Communication Technologies (ICT), electronic and related
Automobile and related inventions
Process technologies
Energy saving and generating devices
Rubber production and processing technology
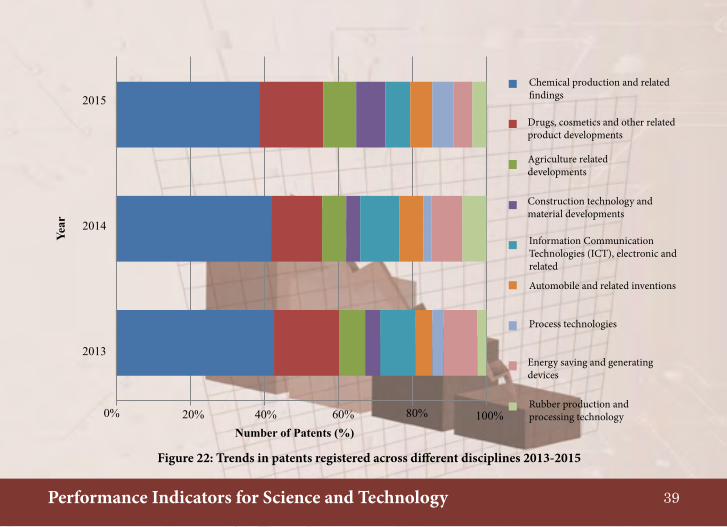
Figure 22: Trends in patents registered across different disciplines 2013-2015

40Performance Indicators for Science and Technology3.4: Patent Applications in Selected Countries 2013-2015
Source: World Bank Data (http://data.worldbank.org/indicator/)na: not available
CountryResident Non-Resident
2013 2014 2015 2013 2014 2015Australia 3,061 1,988 2,291 26,656 23,968 26,314Bangladesh 60 44 41 243 249 299Switzerland 1,525 1,480 1,477 631 568 446China 704,936 801,135 968,252 120,200 127,042 133,612United Kingdom 14,972 15,196 14,867 7,966 7,844 7,934Ireland 333 263 250 57 58 190Italy 8,307 8,601 na 905 781 naJapan 271,731 265,959 258,839 56,705 60,030 59,882Malaysia 1,199 1,353 1,272 6,006 6,267 6,455New Zealand 1,614 1,636 1,184 5,167 6,092 5,317Philippines 220 334 375 3,065 3,255 3,359
Thailand 1,572 1,006 na 5,832 6,924 naSri Lanka 328 314 218 188 222 263United States of America 287,831 285,096 288,335 283,781 293,706 301,075

41Performance Indicators for Science and Technology
3.5: Main Fields of Publications in the SCI Journals 2013-2015
Source : World Bank Data, http://data.worldbank.org/indicator/
Field2013 2014 2015
Total number
With foreign Co-authorship (%)
Total number
With foreign Co-authorship(%)
Total number
With foreign Co-authorship(%)
Agriculture 37 73.0 36 83.3 41 87.8Biological Science 20 85.0 19 84.2 23 91.3Molecular Biology & Biotechnology
39 79.5 28 85.7 22 81.8
Chemical Science 22 81.8 24 75.0 26 80.8Earth Sciences 18 72.2 17 82.3 14 85.7Engineering & Technologies 13 69.2 11 72.7 15 60.0Environmental Science 36 88.9 29 89.6 33 87.9Fisheries, Aquaculture 6 100.0 9 100.0 7 100.0Food Science 17 88.2 23 95.6 29 86.2Forestry 12 100.0 15 100.0 16 100.0
Health Science 122 72.1 118 70.3 126 84.1
Mathematics 5 80.0 4 100.0 5 100.0Nanotechnology 14 92.9 12 91.7 6 83.3Physics 17 47.1 16 50.0 18 61.1Veterinary 2 100.0 3 100.0 3 100.0
Social Sciences 11 54.5 9 55.5 12 58.3
Total 391 77.0 373 79.3 396 83.6Source: Adopted from the Science Citation Index (SCI)

42Performance Indicators for Science and Technology
Num
ber
of P
ublic
atio
ns in
the
SCI J
ourn
als
Total
With foreign Co-authors
02005 2006 2007 2008 2009 2010 2012 2013 2014 20152011
50
100
150
200
250
300
350
Year
400
450
Figure 23: Publication trends in the SCI journals by Sri Lankan scientists 2005-2015

43Performance Indicators for Science and Technology
AgricultureHealth Sciences
Social Sciences
Veterinary
Physics
Nanotechnology
Mathematics
ForestryFood Science
Fisheries, Aquaculture
Environmental Science
Engineering & Technologies
Earth Science
Chemical Science
Molecular Biology & Biotechnology
Biological Sciences
2014
2015
2013
Figure 24: Publication trends in different subject areas 2013-2015 with the publications in the area of health sciences
0
20
40
60
80
100
120
140
Num
ber
of A
rtic
les

44Performance Indicators for Science and TechnologyAgriculture
Veterinary
Social Sciences
Physics Chemical Science
Molecular Biology & Biotechnology
Biological Science
Nanotechnology
Mathematics
Forestry
Fisheries, AquacultureFood Science
Engineering & Technologies
Earth Sciences
Environmental Science
Figure 25: Publication trends in different subject areas 2013-2015 (without Health Sciences)
Note: The publications done in health sector were not included to give clear distribution trends in the other disciplines.
2014
2015
2013
Num
ber
of A
rtic
les 0
10
20
30
40
50
45Performance Indicators for Science and Technology
0
50
100
150
200
250
300
350
400
450
20062004 2008 2010 2013 2014 20150
2000
4000
6000
8000
10000
12000
14000N
o. o
f Pub
licat
ions
in S
CI J
ourn
als
Year
Num
ber o
f Sci
entis
ts a
nd E
xpen
ditu
re o
n R
&D
(R
s. m
illio
n)
Number of R&D Scientists Expenditure on R&DPublications in SCI Journals
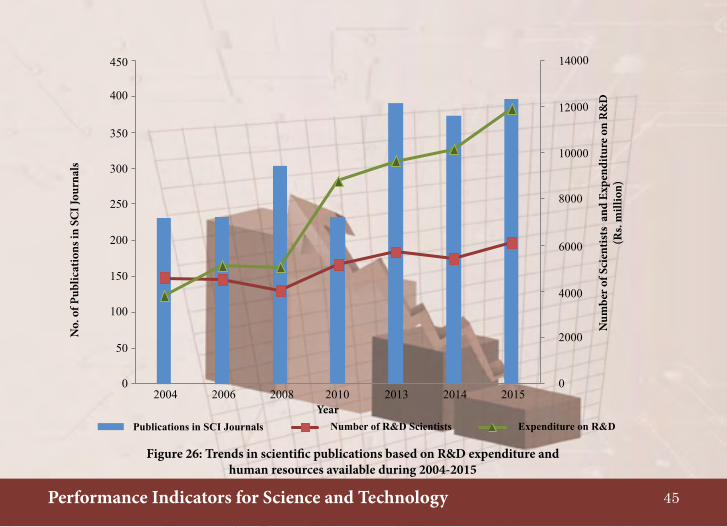
Figure 26: Trends in scientific publications based on R&D expenditure and human resources available during 2004-2015

46Performance Indicators for Science and Technology
Natural Sciences
Medical Sciences
Engineering & Technology
Agricultural Sciences
Social Sciences and Humanities
Others
Publications in SCI Journals (%)
Expenditure on R&D(%)
Human Resources (%)
Figure 27: Trends in scientific publications based on R&D expenditure and human resources (by percentage) 2015
0
10
20
30
40
50
Num
ber
of A
rtic
les

47Performance Indicators for Science and Technology
3.6: Knowledge Disseminations During 2015
Publication/ActivityState Sector Higher
Education Total Higher
Education (%)Local Int Local Int Local Int Local Int
Books and Book Chapters 31 68 272 65 303 133 90 49Journal articles (peer reviewed) 49 177 57 817 106 994 54 82Journal articles (other) 91 20 481 310 572 330 84 94Newspaper articles 152 103 185 27 337 130 55 21Abstracts 227 57 833 465 1,060 522 79 89Newsletters, handbooks, manuals etc. that aim general public 105 3 2,223 584 2,328 587 95 99
Presentations/Resource Persons seminars/conference that aim general public
1,128 325 836 30 1,964 355 43 8
Source: National R&D Survey Sri Lanka, 2015 (NSF) Int: International

48Performance Indicators for Science and Technology
Degree Year Medical Agriculture Science/IT Engineering Total
PGDip
2013 310 11 156 02 4792014 230 18 229 06 4832015 341 04 352 146 843
MSc/MEng 2013 47 170 591 210 1,0182014 93 241 470 205 1,0092015 56 195 397 171 819
MPhil2013 04 23 43 12 822014 05 18 34 09 662015 09 16 46 08 79
MS/MD2013 251 00 00 00 2512014 265 00 00 00 2652015 268 00 00 00 268
PhD2013 02 07 16 02 272014 08 05 18 02 332015 04 10 19 07 40
Total
2013 614 211 806 226 1,8572014 601 282 751 222 1,856
2015 678 225 814 332 2,049
3.7: Science & Technology Postgraduate Output 2013-2015
Source: UGC Statistics 2014 & 2015

49Performance Indicators for Science and Technology
PhD
MS/MD
MPhil
MSc/MEng
PG Dip
0% 20% 40% 60% 80% 100%
FemaleMale
Figure 28: Distribution of postgraduate output by gender 2015
Qualification
Science & Technology Postgraduates (%)

50Performance Indicators for Science and Technology
Engineering
Science/IT
Agriculture
Medical
0% 20% 40% 60% 80% 100%
FemaleMale
Figure 29: Distribution of postgraduates output by different discipline 2015
Science & Technology Postgraduates (%)
Dis
cipl
ine

INNOVATION INDICATORS

52Innovation Indicators4.1: R&D Expenditure by Different Industrial Categories 2015
Category 2015
Recurrent Capital Total %Agriculture, Fisheries and Forestry 245.42 23.35 268.77 7.00Mining and Quarrying 33.70 3.21 36.91 1.00Manufacturing 3,221.12 306.50 3,527.62 88.00Electricity 116.76 11.11 127.87 3.00Construction 0.45 0.04 0.49 0.00Trade and Services 0.18 0.02 0.20 0.00R&D 19.38 1.84 21.22 0.50Other 19.20 1.83 21.03 0.50Total 3,656.21 347.90 4,004.11 100.00
Rs. million
Source: National R&D Survey Sri Lanka, 2015 (NSF)
0% 10% 20% 30% 40% 50% 60% 70% 80% 90% 100%
2014
2015
2010
2008
Expenditure %
Year
Manufacturing Trade and ServicesConstructionElectricity R&D OtherMining and Quarrying
Agriculture, Fisheries and Forestry
Figure 30: Trends in R&D expenditure of different R&D categories 2008-2015

4.2: Percentage of Total Revenue that came from the Sale of Products and Services by Industries Involved in R&D in 2006-2015
Category 2006 2008 2010 2013 2014 2015Local Market 58.84 62.07 66.12 66.12 68.81 68.62Asia Pacific Countries 7.64 6.27 8.77 8.77 6.57 7.56European Countries 18.65 15.99 14.76 14.76 10.8 9.98United States 10.57 10.98 7.93 7.93 5.84 2.98Middle East Countries - - 0.71 0.71 3.20 2.98Africans Countries - - 0.69 0.69 3.77 7.19Rest of the World 4.30 4.69 1.02 1.02 1.01 0.69Total 100% 100% 100% 100% 100% 100%
2010 2013 2014 2015
53Innovation Indicators
Figure 31: Trends in revenue generated by industries within the period 2006-2015Year
Source: National R&D Surveys Sri Lanka, 2006, 2008, 2010, 2013, 2014 & 2015 (NSF)
Tota
l Rev
enue
(%)
0
5
2006 2008
10
15
20Asia Pacific Countries
European Countries United States
Middle East Countries
Africans Countries
Rest of the World
Rs. million

54Innovation Indicators
Designs/Prototypes developed
Import substitutes developed
New plant varieties/hybrids developed
Existing products/services/procesess significantly improved
New products/services/processes developed
4.3: Number of Innovations Developed by the Business Enterprises in 2015
Innovation TypeNumber
Developed Transferred CommercializedNew products/services/processes developed 152 16 66Existing products/services/processes significantly improved
84 7 43
New plant varieties/hybrids developed 7 1 6Import substitutes developed 9 5 0Designs/Prototypes developed 261 1 122
Source: National R&D Surveys Sri Lanka, 2015
Figure 32: Different innovation types developed by business enterprise sector during 2015
Developed
Transferred
Commercialized
0 50 100Number %
Inno
vatio
n Ty
pe

55Innovation Indicators
4.4: Number of Innovations Developed by the Government Sector (R&D) Institutions in 2015
Innovation TypeNumber
Developed Transferred CommercializedNew products/services/processes developed 59 96 96Existing products/services/processes significantly improved
38 12 11
New plant varieties/hybrids developed 22 17 18Import substitutes developed 1 6 0Designs/Prototypes developed 4 1 1
Source: National R&D Surveys Sri Lanka, 2015
Figure 33: Different innovation types developed by government sector institutions in 2015
Developed
Transferred
Commercialized
Designs/ Prototypes developed
Import substitutes developed
New plant varieties/hybrids developed
Existing products/services/processes significantly improved
New products/services/processes developed
0 50 100Number %
Inno
vatio
n Ty
pe

56Innovation Indicators4.5: Number of Innovations Developed by the Higher Education Sector in 2015
Innovation TypeNumber
Developed Transferred CommercializedNew products/services/processes developed 67 26 naExisting products/services/processes significantly improved
34 8 na
New plant varieties/hybrids developed 47 7 naImport substitutes developed 5 3 naDesigns/Prototypes developed 0 0 na
Source: National R&D Surveys Sri Lanka, 2015
Figure 34: Different innovation types developed by higher education sector in 2015
Import substitutes developed
New plant varieties/hybrids developed
Existing products/services/processes significantly improved
New products/services/processes developed
0 50 100
Developed
Transferred
Commercialized
Number %
Inno
vatio
n Ty
pe
57Innovation Indicators
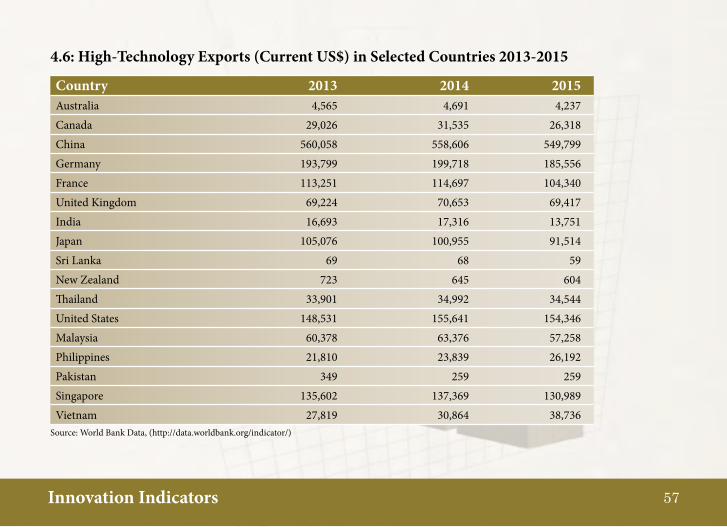
4.6: High-Technology Exports (Current US$) in Selected Countries 2013-2015
Country 2013 2014 2015Australia 4,565 4,691 4,237Canada 29,026 31,535 26,318China 560,058 558,606 549,799Germany 193,799 199,718 185,556France 113,251 114,697 104,340United Kingdom 69,224 70,653 69,417India 16,693 17,316 13,751Japan 105,076 100,955 91,514Sri Lanka 69 68 59New Zealand 723 645 604Thailand 33,901 34,992 34,544United States 148,531 155,641 154,346Malaysia 60,378 63,376 57,258Philippines 21,810 23,839 26,192Pakistan 349 259 259Singapore 135,602 137,369 130,989Vietnam 27,819 30,864 38,736
Source: World Bank Data, (http://data.worldbank.org/indicator/)

58Innovation Indicators
Developing niche or specialized markets
Seeking new markets
Comply with environment standards and regulations
Promotion export markets
Implimenting new information and communication technologies
Active involvement in developing new industry-wide standards
Research & Development
Satisfying existing clients
Promotion domestic markets
High Moderate Minor Not applicable
Figure 35: Importance given by the enterprises for their activities during 2015
Importance given %
Act
ivity
0% 40%20% 60% 100%80%

59Innovation Indicators
4.7: Involvement of Industrial Sector with Other Institutions in Conducting R&D and Innovation Activities 2006-2015
Institution % Institutional Involvement in R&D
2006 2008 2010 2014 2015
Own company alone 48.6 52.7 52.2 60.0 53.4With parent company 25.8 20.7 18.1 13.8 17.8Collaboration with other institution 16.4 19.0 21.3 18.5 20.5Outsourcing 9.2 7.6 8.5 7.7 8.3
Total 100.0 100.0 100.0 100.0 100.0
Own company alone
Collaboration with other institutions
With parent company
Outsourcing
Figure 36: The degree of engagement with other institutions for R&D by industries during 2006-2015
Source: National R&D Surveys Sri Lanka, 2006, 2008, 2010, 2014 & 2015 (NSF)
6050403020100
708090
Met
hods
Em
ploy
ed f
or IP
R
Prot
ectio
n (%
)
2008 2010 2014 2015Year

60Innovation Indicators4.8: Countries where Sri Lankan Business Enterprises Aquired their Technologies during
2008-2015Locality Country 2008 2010 2014 2015Local Government 13 12 12 5
Private 02 16 19 2Foreign Individual 01 - - -
Australia - 01 01 01Belgian 03 06 01 -China 01 01 04 -Denmark - 01 - -Dubai - - 01 01France 01 01 - -Germany 03 11 05 01India 07 15 12 03Italy 02 - - 01Hong Kong - - 02 01Japan 01 03 02 -South Korea - 01 1 -Switzerland - - 01 -
Spain - - 01 -
Pakistan - 02 01 -Taiwan - 01 01 -Thailand 01 - - -UK 01 03 01 -USA 04 05 01 01
Source: National R&D Surveys Sri Lanka, 2008, 2010, 2014 & 2015
61Innovation Indicators
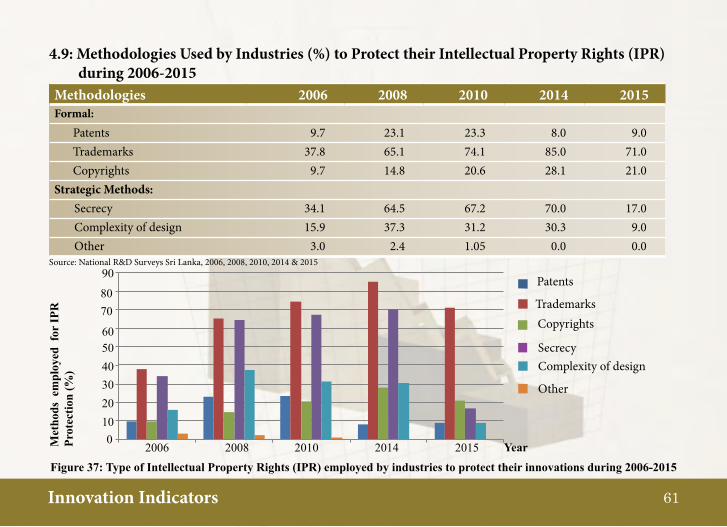
4.9: Methodologies Used by Industries (%) to Protect their Intellectual Property Rights (IPR) during 2006-2015
Methodologies 2006 2008 2010 2014 2015Formal:
Patents 9.7 23.1 23.3 8.0 9.0Trademarks 37.8 65.1 74.1 85.0 71.0Copyrights 9.7 14.8 20.6 28.1 21.0
Strategic Methods: Secrecy 34.1 64.5 67.2 70.0 17.0Complexity of design 15.9 37.3 31.2 30.3 9.0Other 3.0 2.4 1.05 0.0 0.0
6050403020100
7080
90
Met
hods
em
ploy
ed f
or IP
R
Prot
ectio
n (%
)
2006 2008 2010 2014 2015
Patents
CopyrightsTrademarks
SecrecyComplexity of design
Other
Figure 37: Type of Intellectual Property Rights (IPR) employed by industries to protect their innovations during 2006-2015 Year
Source: National R&D Surveys Sri Lanka, 2006, 2008, 2010, 2014 & 2015

62Innovation Indicators
Rate %
Fact
ors
Other
Risk related to feasibility of the final outcomes
Inadequate funding for research
Inadequate funds in the establishment
Shortage of staff for RDI activities
Inadequate knoweldge to conduct R&D activities
High Medium Low Not relevant
Figure 38: Factors that affected to abandon the R&D work initiated by industries before their successful completion in 2015
0% 40%20% 60% 100%80%

KEY SOCIO-ECONOMIC INDICATORS

64Key Socio-Economic Indicators-General
Item 2014(a) 2015(a)Mid-Year population, ‘000 (b) 20,771 20,9660-14 Years, ‘000 5,235 5,288
15-54 Years, ‘000 11,879 11,989
55 Years and over, ‘000 3,657 3,689
Growthofpopulation,% 0.9 0.9
Crude birth rate, per 1,000 population 16.9 16.0Crude death rate, per 1,000 population 6.2 6.3
Rate of natural increase, per 1,000 population 10.7 9.7Net migration rate, per 1,000 population -2.2 0.7Infant mortality rate, per 1,000 live births na naDensity of population, persons per Sq.Km. 331 334
5.1: Demographic Indicators of Sri Lanka 2014-2015
Sources: Central Bank of Sri Lanka 2014 & 2015(a) Provisional; (b) Until 2011, mid-year population estimates were prepared based on the Census of Population and Housing-2001Mid-Year population estimates 2012 onwards were prepared based on the final report of the Census of Population and Housing-2012na: not available

65Key Socio-Economic Indicators-General
Indicator Year
Sri Lanka
Afghan-istan
Bangla-desh
Bhu-tan
India Mal-dives
Nepal Pak-istan
Mid-Year population, Mn. 2013 20.6 27.5 154.7 0.7 1,228.8 0.4 27.3 181.7
2014 20.8 28.1 155.8 0.7 1,267.0 0.4 27.8 188.0
Populationgrowth,% 2013 0.9 1.9 1.4 1.7 1.3 3.5 1.4 0.6
2014 0.9 2.2 1.4 1.7 1.2 3.6 1.4 2.0
Land area, '000 Sq.km. 2014 65.6 652.8 147.5 38.3 3,287.2 0.3 147.2 796.1
Density of population [Persons per Sq. km.]
2014 334.0(a) 43.0 1,060.0 19.0 363.0 2,739.0 187.0 236.0
PopulationbyAgeGroups,%
0-14 Years 2014 25.2(a) 44.9 30.0 27.4 29.2 27.6 33.5 35.2
15-64 Years 2014 66.9(a) 52.7 65.1 67.6 65.3 67.7 61.1 60.3
65 Years & above 2014 7.9(a) 2.4 5.0 5.0 5.5 4.7 5.4 4.5
Urbanpopulation,% 2014 18.2(b) 24.4 32 38.1 30.8 40.5 (c ) 17.0 (d) 38.6
Crude birth rate, Per 1,000 2013 16.0 (a) 34.1 20 19.6 20.4 22 21 25.2
Crude death rate, Per 1,000 2013 6.3(a) 7.8 5.7 6.5 7.9 3.4 6.7 6.9
Total fertility rate [Births per Women] 2010 2.3 6.3 2.2 2.4 2.6 1.8 2.7 3.4
Infant mortality rate [per 1,000 live births] 2013 2.3 4.9 2.2 2.2 2.5 2.3 2.3 3.2
Maternal mortality rate [per 100,000 live births]
2013 29.0 400.0 170.0 120.0 190.0 31.0 190.0 170.0
Expectation of life at birth, Years 2014 74.9 60.4 71.6 69.5 68 76.8 69.6 66.2
5.2: Demographic Indicators of SAARC Countries
Sources: Key Indicators for Asia and the Pacific 2015, ADBHuman Development Report 2015, UNDP World Development Indicators 2015, Central Bank of Sri Lanka(a) 2015; (b) 2012; (c) 2010; (d) 2011

66Key Socio-Economic Indicators-General
Indicator Year Sri Lanka
Afghan-istan
Bangla-desh
Bhu-tan
India Mal-dives
Ne-pal
Paki-stan
Human Development Index (a)(Max.:1,000; Min.: 0.000) 2014 0.757 0.465 0.570 0.605 0.609 0.706 0.548 0.538
LiteracyRate,%(15Yearsandover)
2013 94.1(b) 45.4(c) 62.5(d) na 75.2(3) 98.4(e) 71.1(c) 67.0(c)Male
Female 2013 92.4(b) 17.6(c) 55.1(d) na 50.8(e) 98.4(e) 46.7(c) 42.0(c)
LabourForceParticipationRate,%2013 74.7(f) 79.5 84.1 77.2 79.9 77.5 87.1 82.9
Male
Female 2013 35.9(f) 15.8 57.4 66.7 27 56.2 79.9 24.6
UnemploymentRate,% 2014 4.7(f) na 4.3(g) 2.9(g) 2.8(c) na na 6.0
Employment(%oftotalemployment)
2013 28.7(f) na 77.6 56.3 47.2 na na 43.7Agriculture
Industry 2013 25.8(f) na na 11.0 24.7 na na 14.1
Services 2013 45.6(f) na na 32.7 28.1 na na 42.2Population below the income of Poverty Line,%(h)
2004-2014 na 35.8 31.5 12.0 21.9 na 25.2 22.3
Physicians per 10,000 people 2013 9.3(f) 2.7 3.6(c) 2.6(d) 7.0(d) 14.2(i) na 8.3(i)Hospital Beds per 10,000 people 2013 37(f) 5(d) 6(c) 18(d) 7(c) 43(j) 5(e) 6(d)Internet Subscriptions, per 1,000 Persons 2014 20(f) 0 12 33 12 56 8 11
Telephones per 1,000 Persons (Main Lines) 2014 124(f) 3 7 31 21 61 30 26Telephones per 1,000 Persons (Mobile Phones) 2014 124(f) 3 7 31 21 61 30 26
5.3: Social Indicators of SAARC Countries
Sources: Key Indicators for Asia and the Pacific 2015, ADB, Human Development Report 2015, UNDP, Department of Census and Statistics, Central Bank of Sri Lanka(a) A composite index of life expectancy, education and income.; (b) 2015 provisional data.; (c) 2011; (d) 2012; (e) 2006; (f) 2015; (g) 2013;(h) National Poverty Line (Data refer to the most recent year available during the period specified); (i) 2010; (j) 2009, na: not available

67Key Socio-Economic Indicators-General
Economic ActivityValue (Rs. million) As a Share of GDP (%) Rate of Change (%)
2014 (a) 2015 2014 (a) 2015 2014 (a) 2015
AGRICULTURE, FORESTRY & FISHERIES 641,493 676,899 7.8 7.9 4.9 5.5Agriculture and Forestry 520,835 559,445 6.3 6.5 5.1 7.4Fisheries 120,658 117,453 1.5 1.4 3.7 -2.7
INDUSTRY 2,194,167 2,259,223 26.7 26.2 3.5 3.0Mining and Quarrying 202,905 201,036 2.5 2.3 2.2 -0.9Manufacturing 1,292,994 1,354,083 15.7 15.7 2.3 4.7Electricity, Gas, Water and Waste Treatment
108,157 119,105 1.3 1.4 4.7 10.1
Construction 590,111 584,999 7.2 6.8 6.6 -0.9SERVICES 4,634,805 4,881,273 56.3 56.6 5.2 5.3
Wholesale and Retail Trade, Transportation, Storage, Accommodation and Food Service Activities
1,914,236 2,002,655 23.3 23.2 4.0 4.6
Information & Communication 44,102 49,613 0.5 0.6 11.6 12.5Financial, Insurance and Real Estate Activities including Ownership of Dwellings
945,090 1,061,757 11.5 12.3 8.1 12.3
Professional Services and Other Personal Service Activities
1,007,434 1,020,397 12.2 11.8 4.3 1.3
Public Administration, Defence, Education, Human Health and Social Work Activities
723,943 746,852 8.8 8.7 5.5 3.2
5.4: Economic Indicators on National Output and Expenditure
Sources: Annual Report 2014 & 2015, Central Bank of Sri Lanka (a) Provisional

2
68Key Socio-Economic Indicators-General
Category 2014 2015 (a) Change in value
Y-O-Y (b)Change %
Contribution to Change % Value Share % Value Share %
Agricultural Exports 2,793.9 25.2 2,481.5 23.6 -312.4 -11.2 50.0 Tea 1,628.3 14.6 1,340.5 12.8 -287.8 -17.7 46.0 Rubber 45.3 0.4 26.1 0.2 -19.2 -42.3 3.1 Coconut 356.4 3.2 351.7 3.3 -4.6 -1.3 0.7 Other Agricultural Products 763.9 7.0 763.2 7.3 -0.8 42.7 0.0Industrial Exports 8,262.0 74.2 7,975.6 75.9 -286.5 -3.5 45.8
Textiles and Garments 4,929.9 44.3 4,820.2 45.9 -109.8 -2.2 17.6Rubber Products 889.8 8.0 761.2 7.2 -128.6 -14.5 20.6Petroleum Products 338.0 3.0 373.9 3.6 35.9 10.6 -5.8Gem & Diamond and Jewellery 393.6 3.5 331.7 3.2 -61.9 -15.7 9.9Food, Beverages and Tobacco 289.3 2.6 265.2 2.5 -24.0 -8.3 3.8Machinery and Mechanical Appliances
342.9 3.1 293.8 2.8 -49.1 -14.3 7.9
Printing Industry Products 52.4 0.5 45.7 0.4 -6.7 -12.8 1.1Transport Equipment 151.8 1.4 243.7 2.3 91.9 60.5 -14.7Leather, Travel Goods and Footwear
138.9 1.2 135.7 1.3 -3.2 -2.3 0.5
Ceramic Products 41.3 0.4 35.2 0.3 -6.2 -14.9 1.0Other Industrial Exports 694.1 6.2 669.4 6.4 -24.7 -3.6 4.0
Mineral Exports 59.5 0.5 28.4 0.3 -31.1 -52.3 5.0Unclassified Exports 14.7 0.1 19.5 0.2 4.8 32.4 -0.8Total Exports (b)(c) 11,130.1 100.0 10,504.9 100.0 -625.1 -5.6 100.0
5.5: Composition of Exports 2014-2015
Sources: Annual Report 2015, Central Bank of Sri Lanka.(a) Provisional; (b) Adjusted; (c) Excludes re-exports, Y-O-Y: Year to Year Change
US Dollars million

69Key Socio-Economic Indicators-General
5.6: Composition of Imports by Major Categories 2014-2015
Sources: Annual Report 2014 & 2015, Central Bank of Sri Lanka.(a) Provisional; (b) Adjusted; (c) Excludes re-imports, Y-O-Y: Year to Year Change
Category 2014 2015 (a) Change in Value
Y-O-Y Change %
Contribution to Change %Value Share % Value Share %
Consumer Goods 3,852.5 19.8 4,713.5 24.9 861.0 22.3 -178.6
Food and Beverages 1,633.7 8.4 1,627.8 8.6 -5.9 -0.4 1.2
Non-Food Consumer goods 2,218.8 11.4 3,085.7 16.3 866.9 39.1 -179.8Intermediate Goods 11,397.7 58.7 9,638.2 50.9 -1,759.5 -15.4 364.9
Fuel 4,597.3 23.7 2,699.6 14.3 -1,897.7 -41.3 393.6
Textiles and Textile Articles 2,327.6 12 2,296.2 12.1 -32.3 -1.3 6.5Diamond, Precious stones and Metals 175.4 0.9 161.5 0.9 -13.9 -7.9 2.9
Chemical Products 808.2 4.2 870.3 4.6 62.1 7.7 -12.9Wheat and Maize 404.7 2.1 357.2 1.9 -47.5 -11.7 9.9Fertilizer 272.4 1.4 289.6 1.5 17.2 6.3 -3.6
Other Intermediate Goods 2,812.0 14.5 2,963.7 15.7 151.7 5.4 -31.5
Investment Goods 4,152.2 21.4 4,567.0 24.1 414.8 10.0 -86.0
Machinery and Equipment 2,131.0 11.0 2,278.1 12.0 147.1 6.9 -30.5
Transport Equipment 707.3 3.6 930.9 4.9 223.7 31.6 -46.4
Building Materials 1,308.9 6.7 1,352.0 7.1 43.1 3.3 -8.9
Other Investment Goods 4.9 - 5.9 - 1.0 20.6 -0.2
Unclassified Imports 14.4 0.1 15.9 0.1 1.5 10.3 -0.3
Total Imports (b) (c ) 19,416.8 100.0 18,934.6 100.0 -482.2 -2.5 100.0
US Dollars million
70Key Socio-Economic Indicators-General
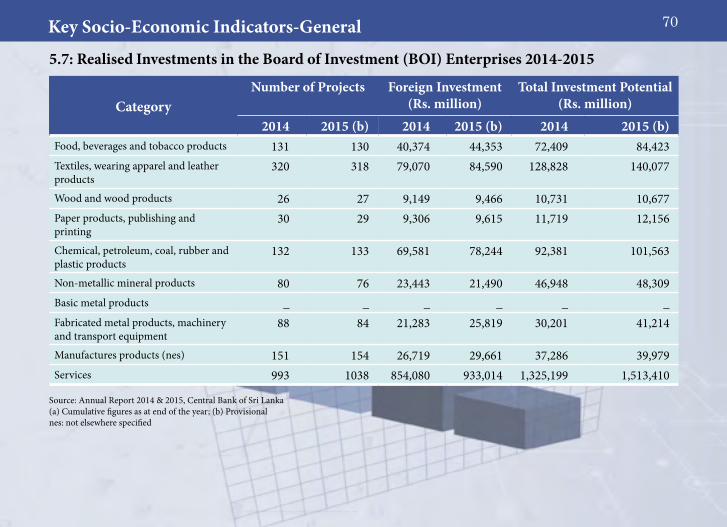
CategoryNumber of Projects Foreign Investment
(Rs. million)Total Investment Potential
(Rs. million)2014 2015 (b) 2014 2015 (b) 2014 2015 (b)
Food, beverages and tobacco products 131 130 40,374 44,353 72,409 84,423Textiles, wearing apparel and leather products
320 318 79,070 84,590 128,828 140,077
Wood and wood products 26 27 9,149 9,466 10,731 10,677Paper products, publishing and printing
30 29 9,306 9,615 11,719 12,156
Chemical, petroleum, coal, rubber and plastic products
132 133 69,581 78,244 92,381 101,563
Non-metallic mineral products 80 76 23,443 21,490 46,948 48,309Basic metal products _ _ _ _ _ _Fabricated metal products, machinery and transport equipment
88 84 21,283 25,819 30,201 41,214
Manufactures products (nes) 151 154 26,719 29,661 37,286 39,979Services 993 1038 854,080 933,014 1,325,199 1,513,410
5.7: Realised Investments in the Board of Investment (BOI) Enterprises 2014-2015
Source: Annual Report 2014 & 2015, Central Bank of Sri Lanka (a) Cumulative figures as at end of the year; (b) Provisional nes: not elsewhere specified

71Key Socio-Economic Indicators-General
Item 2013 2014 2015 (a)Total Schools (No.) 10,849 10,971 10,997
Government Schools 10,012 10,121 10,144Private (b) 103 103 104Pirivenas 734 747 749
Total Students (No.) 4,307,625 4,354,011 4,418,173Government Schools 4,037,095 4,078,798 4,129,534Private (b) 130,344 131,397 136,228Pirivenas 66,116 62,897 64,806
New Admissions (No.) (c) 342,451 348,288 323,337Total Teachers (No.) 243,332 253,649 259,697
Government Teachers 223,752 232,990 236,999Other (Private Schools and Pirivenas) 12,379 12,932 13,851
Student/Teacher Ratio (Government Schools) 18 18 17Expenditure on Education (Rs. million) (d) 151,801 190,150 225,047Expenditure as a % of GDP (e) 1.58 1.82 2.01
5.8: Education Indicators in General Education
Sources: Annual Report 2013, 2014 & 2015, Central Bank of Sri Lanka(a) Provisional(b) Private Schools approved by the government and schools for children with special needs (This figure excludes international schools which are registered under the
Companies Act); (c) Government Schools only; (d) Government expenditure on General and Higher Education;(e) Data based on GDP estimates compiled by the Department of Census and Statistics

72Key Socio-Economic Indicators-General5.9: Number of Government Schools 2015
Source: Sri Lanka Education Information 2015, Ministry of Education1AB: Schools having Advanced Level Science stream classes1C: Schools having Advanced Level Arts and/or Commerce streams but no Science streamType 2: Schools having classes only up to grade 11Type 3: Schools having classes only up to grade 8
Province 1AB 1C Type 2 Type 3 Total
Western 193 252 497 417 1,359
Central 115 317 467 620 1,519
Southern 150 206 378 379 1,113
Northern 98 109 302 471 980
Eastern 94 176 356 477 1,103
North Western 108 256 476 409 1,249
North Central 61 129 235 379 804
Uva 78 182 315 317 892
Sabaragamuwa 108 174 436 407 1,125
Total 1,005 1,801 3,462 3,876 10,144

73Key Socio-Economic Indicators-General
Province Sinhala Medium
English Medium (Students with Primary Education in Sinhala)
Tamil Medium
English Medium (Students with Primary Education in Tamil)
Total
Western 29,156 2,215 956 95 32,422
Central 10,992 575 1,880 315 13,762
Southern 20,372 81 73 0 20,526
Northern 41 0 6,524 201 6,766
Eastern 1,386 0 7,054 36 8,476
North Western 11,317 681 1,277 10 13,285
North Central 5,294 53 307 0 5,654
Uva 7,063 156 150 0 7,369
Sabaragamuwa 9,963 216 363 99 10,641
Total 95,584 3,977 18,584 756 118,901
5.10: Number of Students Studying Science in G.C.E. Advance Level in Government Schools 2015
Source: Sri Lanka Education Information 2015, Ministry of Education

74Key Socio-Economic Indicators-General
Item 2012 2013 2014 2015(a)
Hospitals (Practicing Western Medicine) (No.) 593 603 601 610Beds (No.) 73,437 74,636 76,918 76,781Primary Health Care Units 480 481 484 475Doctors (No.) 17,129 17,553 17,903 19,429Asst. Medical Practitioners (No.) 1,061 1,057 1,055 1,017Nurses (No.) 30,136 30,928 31,964 32,272Attendants (No.) 8,403 8,091 8,215 8,689In-Patients (No.’000) 5,840 5,926 na naOut-Patients (No.’000) 50,631 53,861 54,970 naAyurvedic Physicians (No.) (b) 20,712 21,060 22,422 22,672Total Health Expenditure (Rs. million) 99,101 119,530 138,403 177,789Current Expenditure 81,946 99,609 116,151 140,560Capital Expenditure 17,155 19,920 22,252 37,230TotalHealthExpenditureasa%ofGDP(c) 1.13 1.25 1.32 1.59
5.11: Health Service Indicators of Public Sector 2012-2015
Sources: Ministry of Healthcare and NutritionDepartment of AyurvedaMinistry of Finance and PlanningCentral Bank of Sri Lanka(a) Provisional;(b) Registered with the Department of Ayurvedic Commissioner;(c) Based on GDP estimates compiled by the Department of Census and Statisticsna: not availabie
75Key Socio-Economic Indicators-General
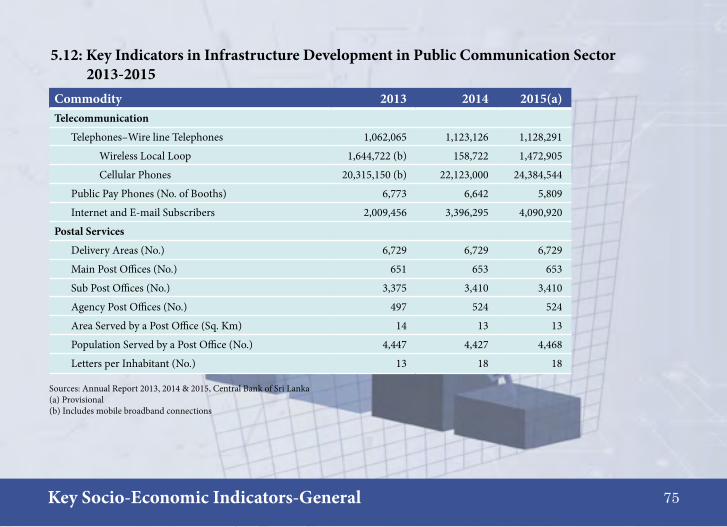
Commodity 2013 2014 2015(a)Telecommunication
Telephones–Wire line Telephones 1,062,065 1,123,126 1,128,291
Wireless Local Loop 1,644,722 (b) 158,722 1,472,905
Cellular Phones 20,315,150 (b) 22,123,000 24,384,544
Public Pay Phones (No. of Booths) 6,773 6,642 5,809
Internet and E-mail Subscribers 2,009,456 3,396,295 4,090,920
Postal Services
Delivery Areas (No.) 6,729 6,729 6,729
Main Post Offices (No.) 651 653 653
Sub Post Offices (No.) 3,375 3,410 3,410
Agency Post Offices (No.) 497 524 524
Area Served by a Post Office (Sq. Km) 14 13 13
Population Served by a Post Office (No.) 4,447 4,427 4,468
Letters per Inhabitant (No.) 13 18 18
5.12: Key Indicators in Infrastructure Development in Public Communication Sector 2013-2015
Sources: Annual Report 2013, 2014 & 2015, Central Bank of Sri Lanka(a) Provisional(b) Includes mobile broadband connections

76Key Socio-Economic Indicators-General
Item 2014 2015(a)Growth Rate (%)2014 2015(a)
Installed Capacity (MW) 3,932 3,850 17.0 -2.1Hydro (b) 1,377 1,377 1.2 0.0Fuel Oil (c) 1,215 1,115 -9.0 -8.2Coal 900 900 200.0 0.0NCRE (d) 440 458 20.4 4.1
Units Generated (GWh) 12,357 13,090 3.9 5.9Hydro (b) 3,632 4,904 -39.4 35.0Fuel Oil (c) 4,305 2,276 32.1 -47.1Coal 3,202 4,443 118 38.8NCRE (d) 1,217 1,466 3.3 20.4
Total Sales by CEB (GWh) 11,063 11,786 4.2 6.5Total Sales LECO (GWh) 1,271 1,352 -0.9 6.4OverallSystemLossofCEB(%) 10.5 10 -2.4 -4.5Number of Consumers (‘000) (f) 5,929 6,171 3.7 4.1o/w Domestic and Religious 5,235 5,444 3.7 4.0
Industrial 58 60 2.5 3.4 General Purpose and Hotel (e) 633 665 4.2 5.1
5.13: Performance of Power and Energy Sector 2014-2015
Sources: Annual Report 2014 & 2015, Central Bank of Sri Lanka(a) Provisional; (b) Excluding mini hydro power plants; (c) Inclusive of Independent Power Producers (IPPs); (d) Refers to Non-Conventional Renewable Energy including mini hydro; (e) Inclusive of sales to government category; (f) Inclusive of LECO consumers

DEFINITIONS
The definitions and classifications used in the National R&D Survey 2015 and in this Handbook are based on the International Standardization of Statistics on Science and Technology (UNESCO, 2010) and the Frascati Manual (OECD, 2002).
1. Research and Experimental Development (R&D)
Comprises creative work undertaken on a systematic basis in order to increase the stock of knowledge including the knowledge of humanity, culture and society, and the use of this stock of knowledge to device new applications.
The term R&D covers three activities:
a. Basic research: The experimental or theoretical work undertaken primarily to acquire new knowledge of the underlying foundations phenomena and observed facts, without any particular application or use in view.
b. Applied research: The original investigations undertaken in order to acquire new knowledge. However, it is directed primarily towards a specific practical aim or objective.
c. Experimental development: The systematic work, drawing on existing knowledge gained from research and practical experience that is directed to produce new materials, products and devices; to install new processes, systems and services; or to improve substantially those already produced or installed.
2. Sectors
Government sector: Includes all Departments, Institutions and other Corporate or Statutory bodies, which furnishes different types of services but normally they do not sell them to the community.
Higher Education sector: Includes all Universities, Colleges of Technology and other Institutions that provide Tertiary Education, whatever their sources of funds or legal status.
77

Private sector: Includes all firms, organizations and institutions whose primary activity is the market production of the goods or services (other than higher education) for sale to the general public at an economically significant price and to the Private Non Profit (PNP) institutions mainly serving them. 3. R&D Expenditures
All expenditures for R&D performed within a sector of the economy, including both: a. Current cost (labour cost, non capital purchases of materials, supplies of R&D equipment, water, fuel, gas, electricity, library
materials etc.).b. Capital expenditure (reported in full for the period when they took place and should not register as element of depreciation).
4. Source of R&D expenditure (Investment)
The sectors/institutions who invest (devote money) for R&D work
5. Sources of funds
Business Enterprise Sector:• All firms organizations and institutions whose primary activity is the market production of goods or services (other than
the higher education sector) for sale to the general public at an economically significant price.• The Private Non Profit (PNP) institutions mainly serving them.
Private Non Profit (PNP) Sector:• Non-market, Private Non Profit institutions serving the households• Private individuals or households
Funds from Foreign Sources:• All institutions and individuals located outside the country• All international organizations (except business enterprises), including facilities and operations with frontiers of a country.
78
Own funds:• Funds generated by the institutions of it’s own activities.
Funds from Other Sri Lankan Sources: • All organizations, institutions, bodies, that are not mentioned in one of the above sectors e.g. NSF, NRC, CARP etc.
6. Human Resources in Research and Development
Science and Technology Personnel (STP): It is defined according to the Canberra Manual (OECD) as persons fulfilling one of the following conditions:• Successfully completed education at the tertiary level in a S&T field of study (seven broad S&T fields of study are Natural
Sciences, Engineering and Technology, Medical Sciences, Agriculture Sciences, Social Sciences, Humanities and other fields).
• Not formally qualified as above but employed in an occupation where the above qualifications are normally required. • Working in the above fields providing technical services or supporting services.
R&D Personnel: All persons employed directly on R&D, as well as those providing direct services such as R&D Managers, Administrators, and Clerical Staff excluding persons providing an indirect services such as canteen and security.
Scientists: Experts who posses qualification on level of degree or above in the area of Science and Technology and presently engage in work related to science and technology including social sciences. The work can be R&D or services in the area of S&T. This exclude medical physicians, teachers etc.
Researchers: Professionals engaged in the conception or creation of new knowledge, products, processes, methods, systems and also in the management of the projects concerned. Postgraduate students at the PhD level and MPhil engaged in R&D are also considered as researchers.
Technicians and equivalent staff: Persons whose main tasks require technical knowledge and experience in one or more fields of engineering, physical and life sciences (technicians) or social sciences and humanities (equivalent staff). They participate
79

in R&D by performing scientific and technical tasks involving the application of concepts and operational methods normally under the supervision of researchers.
Other supporting staff: Includes skilled and unskilled craftsmen, secretarial and clerical staff participating in R&D projects or directly associated with (or providing services to researchers involved in) such projects.
Headcount: Reflects the total number of persons employed in R&D, independently from their dedication. These data allow links to be made with other data series, such as education and employment data or the results of population censuses. They are also used for calculating indicators, analyzing the characteristics of the R&D workforce, with respect to age, gender or national origin.
Full Time Equivalent (FTE):Onepersonperyear.(e.g.ifapersonnormallyspends30%ofhis/hertimeonR&Dandtherestonother activities such as teaching, administration and counseling, the FTE is then counted as 0.3. Similarly, if a full time R&D worker is employed at an R&D unit for only a six month period, the FTE is calculated as 0.5).
7. Innovation
The use of new or significantly improved production process, distribution method, or support activity for goods or services.
80

Survey Team of Science & Technology Policy Research Division (STPRD)
• Dr P.R.M.P Dilrukshi (Head) Overall coordination of the survey including questionnaire preparation, data analysis, indicator development and preparation of the handbook
• Mrs Upuli Rathnayake, Mrs Chamika Dharmasena, Mrs Dilushi Munasinghe (Scientific Officers) Coordination of data collection
• Mrs N.B.W.I. Udeshika, Mrs Y.S.L Kumaranayake, Ms B.G.A.R.L. Batheegama, Ms M.K.U.L. Mirihana and Mrs Prasadini Dissanayaka (Research Assistants) Assisted data collection, data analysis, data compilation and preparation of the handbook
• Ms Ayomi Palihawadana, Confidential Secretary and Mrs Ajantha Kanthi (Management Assistant) Maintained correspondence with institutions and data entry
• Mr H.D. Lakshitha (Technical Assistant) Gave Technical Assistant to conduct the survey
• Mrs Chandima Samarasinghe (Management Assistant) Overall typesetting and Designed of the handbook including designing of the coverpage
81
Science and Technology Policy Research Division of the National Science Foundation
“Science Indicators for Policy Development”
The NSF also functions as a research arm in the area of S&T Policy by providing evidence based policy recommendations for the policy formulation and addressing the gaps in the existing policies, aiming towards rapid socio-economic development in the country through Science Technology and Innovation. The main focuses made on these directions are:
1. Undertaking science, technology and innovation (STI) policy research in the areas of importance to make recommendations towards policy formulation.
2. Developing various databases relevant to all sectors of STI that will be useful for decision making.
3. Undertaking public awareness programmes and public discourses on nationally important issues related to the areas of STI.
4. Investigating, collecting, researching and securing Indigenous Knowledge (IK) that exists and being practiced in Sri Lanka.
5. Undertaking capacity building of human resources especially in the areas of Social Sciences and Indigenous Knowledge.
Few activities of the Division:1. National Research and Development (R&D) Survey
2. Science and Technology Management Information System (STMIS)
3. Study on Social Science Research in Sri Lanka
4. Study on employability of Science and Technology Graduate and Postgraduate passed out from local universities
5. Research and relevant activities under the areas of STI Policy and Social Sciences
6. Data collection, documentation, investigation and research in the areas of Indigenous Knowledge