AmiBroker 4.90 new features overview by Tomasz Janeczko, Amibroker.com.

1
Equities Sector Update
Sri Lanka : Healthcare Sector
A J
KSB
Res
earc
h P
ubli
cati
on
John Keells Stock Brokers (Pvt)Ltd.130, Glennie Street,Colombo 2,Sri Lanka.
Company No. PV 89
Tel: 9411 2421 101-9 (Gen.),9411 2326 003,9411 2439 047/8
Fax: 9411 2326 863,9411 2342 068
October 2007
Healthcare services are dominated by the State given the long standingpolicy of providing free services. We estimate that the government sectorhandles 80% of inpatient volumes. The State treated 4.3m inpatients in2005 which are the last available figures from the Department of HealthServices.
The government spent 2% of GDP on health in 2006 which is marginallyhigher than regional norms. However State spending has beenpredominantly recurrent leading to stagnation in capacity.
Resultant overcrowding has led to increased demand for private sectorhealthcare services. Rising income levels and higher insurance penetrationprovides further upside to existing demand.
Sri Lanka’s proportion of over 60 year olds will increase over the nextfew decades since overall population growth has stabilized and deathrates have decreased. This generation will require more frequent andmore intensive healthcare and will be a source of increasing demand.
Private sector bed supply has increased at a CAGR of 14% over the lastten years. However most of the established 100+ bed private hospitalsare Colombo based. Some private operators have now started to extendtheir brand and establish facilities elsewhere.
Significant capacity expansions are currently underway both by existingplayers as well as new entrants including the Ceylinco and the HemasGroup. However underlying demand will lead to healthy long termprospects and we feel that the sector offers significant potential in themedium to long term despite high relative short term valuations.
Navin [email protected]
Indexed ASPI / Healthcare
-
500.0
1,000.0
1,500.0
2,000.0
2,500.0
3,000.0
3,500.0
4,000.0
29-Jun-0402-Aug-
01-Oct-04
01-Dec-
01-Feb-01-Apr-0501-Jun-05
01-Sep-
02-Nov-
02-Jan-0601-M
ar-02-M
ay-
03-Jul-06
01-Sep-01-N
ov-
02-Jan-0701-M
ar-03-M
ay-01-Jun-07
All Share Price Index HCARE
2
Market overview
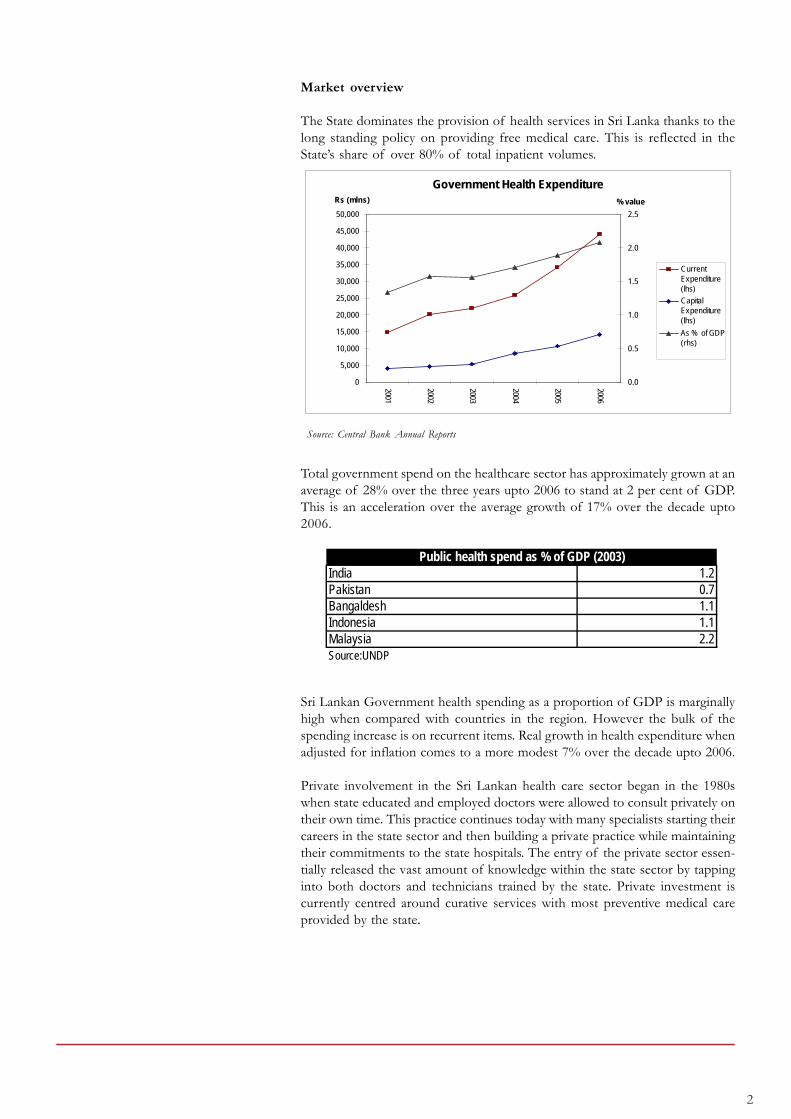
The State dominates the provision of health services in Sri Lanka thanks to thelong standing policy on providing free medical care. This is reflected in theState’s share of over 80% of total inpatient volumes.
Source: Central Bank Annual Reports
Total government spend on the healthcare sector has approximately grown at anaverage of 28% over the three years upto 2006 to stand at 2 per cent of GDP.This is an acceleration over the average growth of 17% over the decade upto2006.
Sri Lankan Government health spending as a proportion of GDP is marginallyhigh when compared with countries in the region. However the bulk of thespending increase is on recurrent items. Real growth in health expenditure whenadjusted for inflation comes to a more modest 7% over the decade upto 2006.
Private involvement in the Sri Lankan health care sector began in the 1980swhen state educated and employed doctors were allowed to consult privately ontheir own time. This practice continues today with many specialists starting theircareers in the state sector and then building a private practice while maintainingtheir commitments to the state hospitals. The entry of the private sector essen-tially released the vast amount of knowledge within the state sector by tappinginto both doctors and technicians trained by the state. Private investment iscurrently centred around curative services with most preventive medical careprovided by the state.
India 1.2Pakistan 0.7Bangaldesh 1.1Indonesia 1.1Malaysia 2.2Source:UNDP
Public health spend as % of GDP (2003)
Government Health Expenditure
0
5,000
10,000
15,000
20,000
25,000
30,000
35,000
40,000
45,000
50,000
2001
2002
2003
2004
2005
2006Rs (mlns)
0.0
0.5
1.0
1.5
2.0
2.5
% value
CurrentExpenditure(lhs)
CapitalExpenditure(lhs)
As % of GDP(rhs)

3
Despite the government sector having an 80% share we estimate the privatehospital sector is now a Rs.20 billion industry.
Demographics will increase long term demand
Fertility decline has been the main contributory factor in the reduction ofthe population growth rate along with the decades long decline in the CrudeDeath Rate.
Source: Department of Health Services and Department of Statistics
The Sri Lankan population is projected to increase from the current 19.9million to 21 million by the year 2020 and should stabilize at this level by themiddle of the next century. According to these projections, by 2020 SriLanka will have the fastest growing aging population in South Asia.
The 60 years and older proportion of the population is expected to increaseat a faster pace than the broader population growth rates. This increase willbe faster among women since they tend to live longer, and there should bean increasing demand for healthcare services targeted towards the elderly inthe coming decades. People over 65 are estimated to use twice as muchhealth resources as the generation before them. Diseases like cancer, cardio-vascular ailments, neurological and rheumatic diseases will require greaterspending on healthcare as well as a qualitative change in approach.
Population Projection4.1
3.4
2.42
21.421.7
19.3
13.515.6
17.2
0.00
0.50
1.00
1.50
2.00
2.50
3.00
3.50
4.00
4.50
1976 1985 1995 2003 2025 2050
0
5
10
15
20
25
Total FertilityRate
Population

4
Lifestyle diseases
Lifestyle diseases like cardiovascular diseases, cancer, type 2 diabetes andnephritis have all increasingly become commonplace in the upper classesof middle-income countries like Sri Lanka.
Source: Medical Statistics Division
Source: Medical Statistics Division
The above charts give the leading causes for hospitalization and for hospitaldeaths in the State sector. Although traumatic injuries were the primary causefor hospitalization it should be noted that many private hospitals do not dealwith these cases due to statutory and liability issues.
Leading Causes of Hospital Deaths, 2004
41.1%
11.6%9.5%
9.4%
8.9%
8.4%
6.8%4.3%
Other
Ischaemic heart disease
Neoplasms (tumours)
Diseases of the gastrointestinal tract
Cerebrovascular disease
Pulmonary heart disease
Diseases of the respiratory system
Pneumonia
Leading Causes of Hospitalization, 2004
16.50%
10.0%
8.0%7.50%
6.0%
4.90%
4.10%
4.0%
3.60%3.50%
Traumatic injuries
Respiratory diseases
Symptoms, signs and abnormal clinical &laboratories findings
Viral diseases
Gastrointestinal tract diseases
Direct/Indirect obstetric causes
Urinary diseases
Intestinal infectious diseases
Skin and subcutaneous tissue
Musculoskeletal diseases

5
Statistically South Asians have shown higher risk of coronary heart diseasecompared with people from other regions. Tobacco consumption, high bloodpressure and high cholesterol intake are all cardiac risk factors increasinglyprevalent in the higher income segment of a country like Sri Lanka.
Oncology treatment facilities have always required heavy investment relativeto other fields. Cancer surgery requires specialized operating rooms. Complexchemotherapy can only be administered in the inpatient oncology units byspecifically trained oncology nurses. Outpatient treatment is also specializedwith radiation and chemotherapy provided either in hospital-based outpatientfacilities or in associated physician- operated facilities. Private hospitals haveyet to make serious investments in this area but demand will continue togrow. Cancer now occurs at younger ages and many cancers are curable andothers manageable as chronic illnesses over long time frames
Only eight to ten per cent of diabetics need hospitalization, thus inviting littleattention from investors in establishing diabetes hospitals. The rest can betreated on an OPD basis.
Provincial health patterns
A disease profile of the provinces (as shown in the appendix according tostate medical data) adds further detail to health demand trends.
The largest specialties required are those for obstetrics and gynecology, respi-ratory ailments, circulatory ailments and infectious diseases. Hospital mortal-ity rates indicate that circulatory and respiratory ailments are the most criti-cal.
The Central Bank statistics for illness by province it indicate that the Western,North Western and Uva Provinces have the greatest demand. Comparingthis with income and healthcare expenditure, currently the largest healthcaremarkets are the Western and North Western Provinces. Much of the de-mand in the Western province could be due to the rest of the country receiv-ing care from what still appears to be a centralized state healthcare system.
Looking at the aging demographic on a provincial level the largest proportionof over 55 year olds are in the Northern and the Western Provinces, withboth their shares of 17.2% over the national average of 15.3%. Approxi-mately 40% of this older population are in ill health.

6
Health Spending Patterns
The largest source of healthcare payment are households who pay out-of-pocket. Increasing GDP trends as well as the increasing amount of inwardremittances mean that a growing share of the population will be able toafford private healthcare.
Work-place health insurance is the largest source of third party payments forhospitals. Many employers have opted to bear the medical expenses of theiremployees either through insurance policies or through internally contributedfunds. The ETF also provides funds to its members for medical care.
Source: Central Bank Annual Reports
Source: Sri Lanka National Health Accounts 2001-2002
GDP & Inward Remittances (per capita)
0
200
400
600
800
1000
1200
1400
1600
2002 2003 2004 2005 2006
US($)
-
20.0
40.0
60.0
80.0
100.0
120.0
140.0US($)
Per capita GDP(lhs)
Per capitaremittances (rhs)
Breakdown of Private Health Expenditure
87.9%
1.9%
7.0%
3.2%
Households
Employees
Insurance
Non profit

7
Source: Insurance Board of Sri Lanka
The rising proportion of the population taking on life insurance (which isclosely tied with health insurance) indicates that the share of payments toprivate healthcare made by insurance will increase over time.
State and Private Infrastructure
As at 2006, according to the Central Bank there were 61,835 beds in the statemedical sector while there were over 9,000 provided by the private sector.Private sector bed capacity has grown at 14% over the last decade from theestimated 2,500 beds in 1996. Current demand for private sector beds hasbeen estimated by the Ministry of Health at well over 15,000. WHO recom-mends 5 beds for every 1,000 persons and Sri Lanka falls short of thatstandard with a required capacity of 100,000 beds.
There were 9,648 qualified doctors in the state health sector, which averagesout to one doctor for every 2,061 people. WHO standards recommend onedoctor for every 600 persons, to ensure adequate provision of healthcare.Based on these standards Sri Lanka requires at least 33,000 doctors.
SL has only 4.85 doctors for every 10,000 people as compared to the 20-30doctors per 10,000 people in the developed countries.
India 6.0Pakistan 7.4Bangaldesh 2.6Indonesia 1.3Malaysia 7.0Source:UNDP
Doctors per 10,000 people (2004)
Life Insurance Penetration
0
200
400
600
800
1000
1200
1400
1600
1800
2000
2002
2003
2004
2005
2006
In thousands
5.0
5.5
6.0
6.5
7.0
7.5
8.0
8.5
9.0As %
New policiesissued (lhs)
Policies in force(lhs)
Penetration as %of Population (rhs)

8
While the proportion of medical officers has grown consistently over the lastdecade, it appears clear that at these rates Sri Lanka is at least two decadesaway from matching the doctor/population rates of the developed countries.
An estimated 4 million in-patients are treated in public and private sectorhealth care facilities in the country annually. With its policy of free healthservices and extensive geographical spread of hospital facilities, the publicsector accounts for approximately 80% of the total in-patient market.
Out-patient participation by the private sector would follow a similar distribu-tion, mainly due to the presence of a state sponsored network of generalpractitioners across the country. The channeling services offered by privatehealthcare establishments in Colombo, can currently accommodate around5,000 patients each day.
The above figures from past Central Bank Annual Reports (private hospitalsurveys have since been discontinued) indicate the relative size of the pri-vate and public sectors. While we assume that the private sector share of theinpatient and outpatient markets have grown data on the private sector isnot given by the Ministry of Health.
Source: Medical Statistics Division
Source: Central Bank Annual Reports
Private hospitals 2001 2002Hospital beds 961 974 No of patients
Inpatients 46,897 51,418 Outpatients 349,436 388,069
Doctors 711 749 Permanent 107 86 Visiting 511 583 Part time 93 80
Govt hospitals 2001 2002Hospital beds 58,833 59,781 No of patients
Inpatients 4,092,000 4,032,000 Outpatients 43,350,000 45,681,000
No of doctors 7,235 7,459
No of Medical Officers (per 10,000)
0.000.501.001.502.002.503.003.504.004.505.005.506.00
1995
1996
1997
1998
1999
2000
2001
2002
2003
2004
2005

9
Healthcare business model
Health revenue is stable and non-cyclical - irrespective of the state of theeconomy. The demand for healthcare is and will continue to be constant andgrowing.
The quoted hospital companies are all tertiary care general hospitals and areconcentrated in Colombo, while serving the catchment areas of the Gampahaand Kalutara Districts. Typical occupancies are well over 90 per cent withexisting capacities fully utilized.
The current business model for a typical private hospital is heavily depen-dant on the consultants who possess tremendous bargaining power. Patientvolumes are driven by consultant availability at a hospital and they are gen-erally given the freedom to choose multiple hospitals to work at as well as toset their fee structure. The influence of consultants can even extend tocapex decisions made by the hospital on medical equipment and facilities. Incontrast Apollo introduced a resident specialist doctor format which reliedheavily on expatriate specialists hired on contract basis, but because Sri Lankanpatients are drawn by the reputation of the doctor rather than the institutionthis model has had mixed success.
The bulk of a Sri Lankan private hospital’s revenue is composed of roomcharges, pharmacy sales and diagnostics which comprises of lab servicesand radiology/imaging.
Room rates (Rs.) Ward Normal A/C LuxuryNawaloka 1,600 2,900 3,700 8,200 Asiri Surgical 2,200 3,500 4,250 7,000 Durdans 3,000 4,750 4,950 Apollo 1,500-2,000 3,200-12,500
Most of the private hospitals offer different grades of private rooms keep-ing their mix of lower tier ward beds to a minimum in order to maximizerevenue. The different grades offer a variety of modern amenities. Whilepublicly disclosed room charges can vary from a per night minimum ofRs.2,000 to Rs.12,500 for the luxury segment these bed fees are augmentedby additional charges which vary according to the intensity of the procedureand duration of stay. While current bed capacity is limited private hospitalshave maximized resources through a sustained reduction in average lengthof stay and improving throughput procedures.
Hospitals have historically made large margins on pharmaceutical sales thanksto their advantages of buying in bulk and being able and sell on large mark-ups to what is effectively a captive market. This was because purchasingadvantages used to be amplified by the close relationships hospitals havewith suppliers and the bulk purchase of generics. However the profitabilityof this business may have been eroded by bad inventory management prac-tices where hospitals tend to initially overpurchase drugs that are subse-quently not recommended by phycisians. Typically drugs can account foralmost half of all health care bills.

10
The clinical test segment for revenue has been a major growth area for theprivate medical sector. While the hospital itself can drive a lot of volumethrough their lab services most have also established islandwide collectionpoints in order to provide these services to smaller medical centres andclinics. Much of this revenue comes from basic blood and urinary testingdone at healthy margins, with Nawaloka and Asiri providing more sophisti-cated testing as well.
Although a leading contributor to revenue, the radiology and imaging unitsrequire the heaviest capital investment. A top of the range CT scanner cancost upwards of $1m. Investment here implicitly boosts overall revenuethanks to synergies since superior facilities would lead to surgeons referringmore patients to the hospital. This is particularly significant in the treatmentof high margin specialties like cardiology and neurology.
Hospitals exploit economies of scale and scope by combining a specific setof assets, such as pharmacies and imaging departments, clinical laborato-ries, and emergency rooms. In varying degrees, profit margins will improveas hospitals grow in size and we expect the current phase of consolidationand capacity expansion to increase the dominance of the larger players inthe sector.
A recent trend in hospital investment has seen initiatives to start up special-ized facilities to treat specific diseases. Ceylinco and Ninewells are the cur-rent examples with facilities for diabetes, cancer and ob/gyn. The largecapital investment required set up even a specialized healthcare facility leadsus to conclude that this strategy is best suited for a group which already hasinterests in the sector. The emergence of hospital conglomerates in the cur-rent run of consolidation makes this a possibility in the future. Networks ofstand-alone ambulatory service centres, diagnostic-imaging centres, endos-copy suites, and specialty hospitals could become features of expansion forthe current set of private health care operators.
Prospects
The private sector should continue to expand with the underlying demandset to outstrip supply for the foreseeable future. Existing incumbents arebest placed to benefit from these trends with the sector retaining its growthpotential for many years to come.
(i) Capacity expansion
While the current round of capacity expansion will boost earnings in themedium term it will be insufficient to handle rising demand. We expect tosee further investment from new entrants and possible consolidation activ-ity among the current operators. Constrained capacity will however continueto be a feature of this industry.
(ii) Regional demand
Most Sri Lankans still travel to Colombo to obtain tertiary healthcare ser-vices. Provincial statistics on bed capacities, morbidity and spending indicatethat the North Western, Southern and Central Provinces provide the bestopportunities for private hospital expansion. Of the current operators onlyAsiri and Nawaloka have made a serious effort to establish a presence out-side the capital.

11
(iii) IT efficiencies
Investment in IT could help achieve numerous efficiencies especially inareas like patient record databases and inventory management systems. Pointof sale payment systems and inventory management could help rationalizethe sale of pharmaceuticals and boost margins.
Valuations
We estimate that the quoted sector will grow revenues at an average of 26%over the next three years, while correspondingly EBIT will grow at an aver-age of 38%, with the new investment improving EBIT margins.
Trading at 40x FY08 earnings the sector is at a premium to market mul-tiples. However this is because FY08 earnings are suppressed due to the costof ongoing investment projects.
Given strong underlying demand the sector presents attractive prospectsfor earnings growth when factoring in current expansion and consolidationefforts. Our sector picks are the Asiri Group (ASIR & AMSL) and Durdans(CHL).
A comparison between Sri Lankan hospital stocks and regional/US hospitalstocks is given below.
Rs mlnsNet earnings
(FY07) PER (ttm)P/BV
(FY07)Bumrungrad (Thailand) 4,834 27 10 Bangkok Dusit (Thailand) 4,838 36 5 Parkway Holdings (Singapore) 4,264 42 8 Raffles Medical (Singapore) 1,218 24 7 Apollo (India) 2,757 26 3 Community Health Systems (US) 19,511 18 2 Universal Health Services (US) 29,666 12 2
Rs mlnsNet earnings
(FY07) PER (FY07)PER
(FY08E)P/BV
(FY07)Apollo (155) n/a 40.3 3.3 Durdans 170 7.8 13.9 0.9 Nawaloka (113) n/a n/a 1.3 Asiri Surgical 221 22.3 30.3 4.2 Asiri Hospital 184 31.5 45.7 4.8

12
HEALTHCARE STATISTICS BY PROVINCE
Monthly Per Capita Expenditure by Province Western Central Southern Northern Eastern North Western North Central Uva Sabaragamuwa All Provinces
Health 241 86 119 81 96 126 76 68 77 135Health % 4.1% 2.8% 3.7% 2.5% 3.1% 3.1% 2.4% 2.7% 2.8% 3.4%
Total 5922 3089 3222 3255 3136 4012 3159 2564 2793 3936
Population distributionBy gender %Male 46.7% 48.5% 47.2% 45.9% 46.4% 48.2% 48.8% 48.3% 48.6% 47.6%Female 53.3% 51.5% 52.8% 54.3% 53.6% 51.8% 51.2% 51.7% 51.4% 52.4%
By age groups %0-4 Years 7.8% 8.1% 6.8% 7.2% 10.3% 8.0% 8.6% 7.9% 7.4% 7.9%5-9 Years 7.6% 7.6% 9.0% 10.4% 11.2% 7.6% 7.1% 9.0% 7.7% 8.2%10-14 Years 8.2% 10.0% 11.3% 10.8% 12.3% 9.4% 10.9% 12.3% 9.9% 10.0%15-18 Years 6.7% 8.1% 8.8% 8.0% 9.0% 7.8% 8.2% 10.2% 8.1% 8.0%19-24 Years 10.2% 10.8% 9.9% 12.2% 10.4% 10.6% 11.0% 9.6% 10.8% 10.5%25-34 Years 15.4% 13.5% 12.4% 12.3% 13.3% 14.2% 15.0% 11.6% 13.7% 13.9%35-44 Years 14.4% 13.3% 13.0% 10.2% 13.3% 13.9% 14.2% 15.1% 13.5% 13.7%45-54 Years 12.5% 13.7% 12.1% 11.8% 9.9% 13.6% 12.7% 11.8% 13.4% 12.6%55-64 Years 9.0% 7.9% 7.7% 8.9% 5.8% 8.0% 6.8% 7.3% 8.1% 8.0%Over 64 Years 8.1% 7.0% 9.1% 8.3% 4.5% 7.0% 5.6% 5.3% 7.4% 7.3%All 17.1% 14.9% 16.8% 17.2% 10.3% 15.0% 12.4% 12.6% 15.5% 15.3%
Persons in ill health by age group, % of population0-14 Years 17.7% 10.8% 17.1% 6.6% 9.1% 14.5% 13.6% 15.1% 13.7% 14.2%15-34 Years 9.7% 6.4% 9.7% 6.5% 9.2% 9.6% 9.1% 8.7% 6.5% 8.7%35-54 Years 15.0% 10.7% 13.3% 16.3% 17.6% 16.5% 11.5% 15.2% 12.2% 14.1%55-64 Years 22.1% 11.3% 15.3% 24.5% 20.7% 19.3% 18.4% 19.6% 15.0% 18.4%Over 64 Years 23.2% 13.5% 21.2% 31.2% 22.3% 26.6% 20.1% 30.2% 19.1% 22.1%All 15.2% 9.6% 14.1% 12.3% 12.4% 14.7% 12.2% 14.2% 11.5% 13.3%
Source: Central Bank - Consumer Finances and Socioeconomic Survey
Source: Ministry of Health- Medical Statistics Division
Source: Ministry of Health- Medical Statistics Division
State sector bed capacity (2005)
Mixed M
edical &
Surgical
Medical
Surgical
Pediatrics / C
hildren
Obstetric /
Gynaecology
Com
municable diseases
Tuberculosis
Cancer
Leprosy
Psychiatry
Neurology /
Neuro Surgery
Genito U
rinary
Cardiology
ENT
Eye
Skin
Orthopaedic
Thoracic Surgery
Plastic Surgery / B
urns
Rheum
atology / R
ehabilitation
Dental
Others
Total
Western 1,150 6,079 3,422 1,212 1,392 14 - 504 - 1,748 123 136 154 404 192 58 689 164 91 74 48 1,595 19,249 Central 979 2,280 1,014 886 618 - 40 - - 78 53 - - 78 101 - 167 - 19 63 - 1,182 7,558 Southern 554 2,316 1,020 652 461 - 48 78 - 81 36 18 35 98 110 89 60 - - - 23 1,090 6,769 Northern 337 1,102 398 97 5 - 57 63 - 74 - - - - 63 20 16 - - - 2 781 3,015 Eastern 549 1,729 579 597 359 - 66 14 60 56 - - - 22 114 - 29 - - - - 793 4,967 North Western 723 2,149 760 491 353 9 19 13 - 41 49 36 - 51 119 - 58 43 - 34 - 1,114 6,062 North Central 635 1,521 419 459 347 3 - 58 - 86 47 - 32 29 79 18 - - - - 29 510 4,272 Uva 512 1,263 315 330 152 - - - - 26 7 - 8 41 14 - - - - - - 609 3,277 Sabaragamuwa 494 1,591 779 591 674 - 34 - - 29 - - - 56 78 21 - - - 21 71 629 5,068
People per bed in the state sector (2005)
Mixed M
edical &
Surgical
Medical
Surgical
Pediatrics / C
hildren
Obstetric /
Gynaecology
Com
municabl
e diseases
Tuberculosis
Cancer
Leprosy
Psychiatry
Neurology /
Neuro Surgery
Genito U
rinary
Cardiology
ENT
Eye
Skin
Orthopaedic
Thoracic Surgery
Plastic Surgery /
Burns
Rheum
atology / R
ehabilitation
Dental
Others
Total
Western 4,679 885 1,573 4,440 3,866 384,371 - 10,677 - 3,078 43,750 39,568 34,943 13,320 28,027 92,779 7,810 32,812 59,134 72,719 112,108 3,374 280 Central 2,476 1,063 2,390 2,736 3,922 - 60,599 - - 31,076 45,735 - - 31,076 24,000 - 14,515 - 127,577 38,476 - 2,051 321 Southern 4,112 984 2,234 3,494 4,942 - 47,464 29,209 - 28,127 63,285 126,571 65,093 23,248 20,712 25,599 37,971 - - - 99,055 2,090 337 Northern 2,283 698 1,933 7,933 153,892 - 13,499 12,214 - 10,398 - - - - 12,214 38,473 48,091 - - - 384,731 985 255 Eastern 3,080 978 2,921 2,833 4,711 - 25,623 120,793 28,185 30,198 - - - 76,868 14,834 - 58,314 - - - - 2,133 340 North Western 3,001 1,010 2,855 4,419 6,147 241,099 114,205 166,915 - 52,924 44,284 60,275 - 42,547 18,234 - 37,412 50,463 - 63,820 - 1,948 358 North Central 1,740 726 2,636 2,407 3,184 368,226 - 19,046 - 12,845 23,504 - 34,521 38,092 13,983 61,371 - - - - 38,092 2,166 259 Uva 2,300 932 3,738 3,568 7,746 - - - - 45,283 168,194 - 147,170 28,716 84,097 - - - - - - 1,933 359 Sabaragamuwa 3,646 1,132 2,312 3,048 2,673 - 52,980 - - 62,115 - - - 32,167 23,094 85,778 - - - 85,778 25,371 2,864 355

13
Cases per 100,000 people (2005) 2000 2001 2002 2003Certain infectious and parasitic diseases 2,432 2,149 2,195 1,856 Neoplasms 260 287 302 276 Diseases of the blood and blood-forming organs & certain disorders involving the immune system 111 105 87 79 Endocrine, nutritional and metabolic diseases 278 328 305 312 Mental and behavioural disorders 247 257 222 211 Diseases of the nervous system 243 262 265 258 Diseases of the eye and adnexa 300 348 349 366 Diseases of the ear and mastoid processs 87 88 89 84 Diseases of the circulatory system 1,153 1,270 1,224 1,207 Diseases of the respiratory system 2,313 2,302 2,441 2,353 Diseases of the digestive system 1,057 1,147 1,128 1,096 Diseases of the skin and subcutaneous system 567 595 594 567 Diseases of the musculoskeletal system and connective tissue 612 621 620 587 Diseases of the genitourinary system 1,125 1,216 1,206 1,125 Pregnancy, childbirth the puerperium 3,123 3,383 3,525 3,560 Certain condition originating in the perinatal period 9,109 9,505 9,284 9,643 Congential malformations, deformations and chromosomal abnormalities 55 62 63 58 Symptoms, signs and abnormal clinical and laboratory findings not elsewhere classified 1,061 1,193 1,198 1,242 Injury, poisoning and certain other consequences of external causes 3,346 3,619 3,413 3,372
Source: Ministry of Health- Medical Statistics Division

14
Rs. 23.00 HOLD
Sri Lanka Equities Corporate Update
Lanka Hospitals Corporation PLC (Apollo)
A J
KSB
Res
earc
h P
ubli
cati
on
John Keells Stock Brokers (Pvt) Ltd.130, Glennie Street,Colombo 2,Sri Lanka.
Tel: 9411 2421 101-9 (Gen.),9411 2326 003,9411 2439 047/8
Fax: 9411 2326 863,9411 2342 068
October 2007
Built by the Indian based Apollo Group and commissioned in 2002, Apollounderwent a change of ownership in late 2006, with the Distilleries group,through SLIC buying over 80% of the quoted entity for a considerationof Rs.28.00 per share. The new management has negotiated with the ApolloGroup to retain the Apollo brand while exercising operational control.
Apollo was initially designed for 300 beds and is expandable to 500 beds.The Hospital currently has 250 beds equipped and operational and is oneof the few Colombo hospitals to have under-utilized capacity, currentlyoperating at marginally over 55% of installed bed strength. Apollo’s splitbetween wards and single beds skews significantly higher to wards ascompared to the norm for premium Colombo based private hospitals.The large majority of Apollo revenue can be classified as inpatient, withthe key revenue drivers being Cardiology and Pediatric Cardiology.
Apollo is the only private hospital which offered a predominantly residentteam of medical specialists, made up of mainly expat Indian specialists oncontract with Apollo, India. However, since the change in ownership, asignificant number of expat doctors have returned to India once thecontracts run out. Currently about 200 of Apollo’s nurses are Indiancomprising the majority with the rest filled out by Sri Lankans. Lack ofsupport staff is a significant factor in Apollo being unable to make optimumuse of their capacity. The management’s long term aim is to make themajority of the nurses Sri Lankan since one of the problems faced byApollo is that the Indian nurses are unable to communicate with localpatients.
Despite breaking even in FY06 after commencing operations in 2002,Apollo has subsequently posted negative net earnings in FY07. Whilstrevenue increased at CAGR of 6.8% from FY04 to FY07, revenue growthhas regressed in FY07 where the company top-line decrease was 1.1%.
A rights issue of 3 for 7 shares at Rs.15 was announced on the 16th ofOctober. The issue will raise Rs.1bn which will be used to retire debt. Thiswill lead to a new level of profitability for Apollo.
LHCLReuters Code LHCL.CMBloomberg Code LHCL.SLShare Price LKR 23.00Issued Share Capital (Shares) 156,612,518 12 mth High/Low (Rs.) 31.75 / 19.50Average Daily Volume (Shares) 12,075 Market Capitalization Rs.mn 3,602 Price Performance (%) 1 mth 3 mth 12 mthASPI 1.02 1.93 4.78LHCL 0 9.52 -30.43
Navin [email protected]
Apollo
0
5
10
15
20
25
30
35
40
Oct
-04
Jan-
05A
pr-0
5Ju
l-05
Oct
-05
Jan-
06A
pr-0
6Ju
l-06
Oct
-06
Jan-
07A
pr-0
7Ju
l-07
Oct
-07
Price
0
5,000,000
10,000,000
15,000,000
20,000,000
25,000,000
30,000,000Price
Volume
Fiscal year Net profit (Rs m)
EPS (Rs) Growth (%) PER (X) P/BV (x) ROE (%)
2006 3.9 0.02 106.8 924.80 3.45 0.372007 (154.8) (0.99) -4074.3 n/a 2.78 n/a
2008E 89.4 0.57 157.8 40.29 1.51 3.742009E 99.5 0.64 11.3 36.20 1.45 3.992010E 105.6 0.67 6.1 34.11 1.39 4.07

15
With uncertainty over long term availability of medical specialists andsupport staff hindering occupancy, revenue growth will likely lag behindindustry levels, whilst rising costs should see a further erosion in earningsprospects, till such time the company undergoes an operational restructure.In addition, with the hospital entering into its seventh year of operations,equipment replacement may be required

16
This document is published by John Keells Stockbrokers (Pvt.) Limited for the exclusive use of their clients. All information has been compiled from availabledocumentation and JKSB’s own research material. Whilst all reasonable care has been taken to ensure the accuracy of the contents of this issue, neither JKSB norits employees can accept responsibility for any decisions made by investors based on information contained herein.
Income Statement 2005 2006 2007 2008E 2009E 2010EYear ending 31st March Rs. mn Rs. mn Rs. mn Rs. mn Rs. mn Rs. mnRevenue 1,657 1,832 1,811 1,902 1,997 2,097 Cost of Services (528) (571) (581) (616) (647) (679) Gross profit 1,129 1,261 1,231 1,286 1,350 1,418 Expenses (1,014) (1,076) (1,204) (1,160) (1,218) (1,279) Operating profit 115 184 30 126 132 138 Net finance cost (170) (180) (187) (35) (31) (32) Tax (1) (0) 2 (1) (1) (1) Net earnings (56) 4 (155) 89 99 106
Balance Sheet 2005 2006 2007 2008E 2009E 2010EAs at 31st March Rs. mn Rs. mn Rs. mn Rs. mn Rs. mn Rs. mnFixed AssetsPP&E 2,418 2,299 2,728 2,642 2,548 2,650 Other 37 51 65 63 69 69
2,455 2,349 2,792 2,705 2,617 2,719 Current AssetsInventories 58 62 61 64 76 80 Receivables 49 68 78 81 85 89 Cash 20 21 19 245 443 455
126 152 157 390 604 624
Current LiabilitiesShort-term loans & OD 471 615 829 183 168 171 Trade payables 138 124 165 237 264 277 Other 30 1 0 18 23 23
639 739 993 438 455 471
Long-term LiabilitiesTerm Debt 795 603 406 12 16 16 Other 17 116 255 253 259 259
813 719 661 265 275 275
Net Assets 1,130 1,043 1,295 2,392 2,491 2,597
Stated Capital 1,665 1,665 1,665 2,672 2,672 2,672 Reserves (535) (621) (370) (280) (181) (75) Shareholder's Funds 1,130 1,043 1,295 2,391 2,491 2,596
Cash flow statement 2005 2006 2007E 2008E 2009E 2010EYear ending 31st March Rs. mn Rs. mn Rs. mn Rs. mn Rs. mn Rs. mnPBT (55) 4 (157) 90 100 107
Depreciation / Amortization 130 133 139 146 153 161 Finance costs 170 180 187 35 31 32 Other 14 8 Change in working capital (31) (94) 33 66 11 5
Cash from Operations 228 231 202 338 296 305
Finance costs paid (170) (163) (187) (35) (31) (32) Income tax paid - (4) (5) (1) (1) (1) OtherNet Cash from Operations 57 64 11 301 264 272
Net PPE (48) (14) (569) (60) (60) (263) Net Investments 0 0 OtherNet Cash from Investing (48) (14) (569) (60) (60) (263)
Proceeds from Shares 1,007 Borrowings (20) (101) 16 (1,022) (6) 3 Dividends paidOtherNet Cash from Financing (20) (101) 16 (15) (6) 3
Net increase in Cash (11) (51) (541) 226 198 12

17
Rs. 2.50 HOLD
Sri Lanka Equities Corporate Update
Nawaloka Hospitals PLC (NHL)
A J
KSB
Res
earc
h P
ubli
cati
on
John Keells Stock Brokers (Pvt) Ltd.130, Glennie Street,Colombo 2,Sri Lanka.
Tel: 9411 2421 101-9 (Gen.),9411 2326 003,9411 2439 047/8
Fax: 9411 2326 863,9411 2342 068
October 2007
Having started with 100 beds 21 years ago, the hospital currently has a bedcapacity of 325 along with 70 consultation chambers. NHL is currentlymidway through another expansion phase, which will take them to 410beds and 10 OTs from its current complement of 6, by FY08 . Thecapacity expansion can be broken down into a construction cost of Rs.400-450m and an equipment cost of approximately Rs.300-350m.
Nawaloka is considered to have the second largest share of the diagnosticlaboratory market behind market leader Asiri. The lab facility is a tie-upwith Metropolis Health Services of India with a 50/50 profit sharingventure. The agreement was signed in 2005 for a period of 5 years.Nawaloka Metropolis has focused on positioning itself as the high-endreferral laboratory in Sri Lanka with a tertiary central laboratory at theHospital’s Colombo centre
Nawaloka’s investment of Rs.120m in cardiac catheterization lab facilitieswhich facilitates angioplasty and stenting procedures has boosted heartprocedure volumes with Cardiac Procedures increasing 16% compared toFY06. A 64 slice CT scanner for cardiac evaluation is planned for oncethe current capacity expansion project is complete
Nawaloka invested Rs. 833 million on a 24 percent stake in the 446 roomGaladari Hotel in August 2005, when the GoSL divested same. Theinvestment to-date has proved a white elephant, with Nawaloka’s Rs.156mshare of the associate’s loss in FY07 being the primary factor in thecompany making net losses for the year.
Like its peers, Asiri and Asha, Nawaloka is currently operating at full strength.Whilst revenue has increased by a CAGR of 16.2% from FY03 to FY07,margins have exhibited a declining trend with operating profit margindeclining from 15.4% in FY03 to 11.3% in FY07, with staff costs increasingby an average of 21.6% from FY03 to FY07.
NHLReuters Code NHL.CMBloomberg Code NHL.SLShare Price LKR 2.50Issued Share Capital (Shares) 704,752,798 12 mth High/Low (Rs.) 3.80 / 2.10Average Daily Volume (Shares) 622,937 Market Capitalization Rs.mn 1,762 Price Performance (%) 1 mth 3 mth 12 mthASPI 1.02 1.93 4.78NHL 4.00 8.70 -44.00
Navin [email protected]
Nawaloka
0
1
2
3
4
5
6
7
8
Oct
-04
Jan-
05
Mar
-05
Jun-
05
Sep
-05
Dec
-05
Mar
-06
Jun-
06
Sep
-06
Dec
-06
Mar
-07
Jul-0
7
Oct
-07
Price
0
10,000,000
20,000,000
30,000,000
40,000,000
50,000,000
60,000,000Vol
Price
Volume
Fiscal year Net profit (Rs m)
EPS (Rs) Growth (%) PER (X) P/BV (x) ROE (%)
2006 53.2 0.08 -54.4 33.14 1.16 3.502007 (113.4) (0.16) -313.4 n/a 1.25 n/a
2008E (262.7) (0.37) -131.6 n/a 1.54 n/a2009E 115.3 0.16 143.9 15.28 1.40 9.162010E 294.8 0.42 155.7 5.98 1.13 18.98

18
Revenues will be boosted with the much needed room supply coming onstream in FY09, whilst margins can receive a boost with the increased OTcapacity. Operating Profit should grow at a three year CAGR of 37%.Group net earnings continue to be affected by their holding of Galadari.However the proposed conversion of Galadari’s government debt to equityshould bring Nawaloka’s holding below 20% which would then necessitatethe stake to be treated as an investment.
We estimate that this will impact earnings positively in FY09 with growthof 155% subsequently expected in FY10. Nawaloka currently trades at15.3x our FY09 estimate.

19
This document is published by John Keells Stockbrokers (Pvt.) Limited for the exclusive use of their clients. All information has been compiled from availabledocumentation and JKSB’s own research material. Whilst all reasonable care has been taken to ensure the accuracy of the contents of this issue, neither JKSB norits employees can accept responsibility for any decisions made by investors based on information contained herein.
Income Statement 2006 2007 2008E 2009E 2010EYear ending 31st March Rs. mn Rs. mn Rs. mn Rs. mn Rs. mnRevenue 1,673 1,987 2,385 2,933 3,373 Cost of Services (921) (1,088) (1,300) (1,599) (1,838) Gross profit 751 898 1,085 1,335 1,535 Expenses (532) (675) (754) (851) (960) Operating profit 219 224 331 483 575 Net finance cost (77) (142) (379) (314) (224) Associate (26) (156) 2 2 2 Writedown in investment value (170) PBT 116 (75) (223) 169 351 Tax (63) (38) (40) (54) (56) Profit attributable 53 (113) (263) 115 295
Balance Sheet 2006 2007 2008E 2009E 2010EAs at 31st March Rs. mn Rs. mn Rs. mn Rs. mn Rs. mnFixed AssetsPP&E 1,338 1,454 2,254 2,314 2,389 Associate / Investments 818 661 663 665 667
2,156 2,115 2,917 2,979 3,056 Current AssetsInventories 70 77 81 128 154 Trade and OtherReceivables 143 184 178 187 121 Receivables from Related Companies 64 149 118 165 142 Deposits and Advances 144 136 98 126 133 Cash 9 9 4 1 2
431 554 479 607 552
Current LiabilitiesShort-term loans & OD 657 271 480 474 440 Trade payables 143 204 180 234 214 Other 55 30 44 65 81
856 504 704 773 735
Long-term LiabilitiesTerm Debt 117 644 1,441 1,429 1,166 Other 95 116 108 126 154
212 760 1,549 1,555 1,320
Net Assets 1,519 1,406 1,143 1,258 1,553
Stated Capital 1,207 1,207 1,207 1,207 1,207 Reserves 312 198 (64) 51 346 Shareholder's Funds 1,519 1,406 1,143 1,258 1,553
Cash flow statement 2006 2007 2008E 2009E 2010EYear ending 31st March Rs. mn Rs. mn Rs. mn Rs. mn Rs. mnPBT 116 (75) (223) 169 351
Depreciation / Amortization 113 127 172 188 204 Finance costs 77 142 379 314 224 Associate 26 156 (2) (2) (2) Other 10 26 Change in working capital (35) (67) 47 (77) 36
Cash from Operations 307 309 373 592 813
Finance costs paid (77) (142) (379) (314) (224) Income tax paid (25) (62) (40) (54) (56) Other (4) (4) Net Cash from Operations 201 101 (46) 224 533
Net PPE (222) (242) (972) (248) (279) Net Investments (843) OtherNet Cash from Investing (1,065) (242) (972) (248) (279)
Proceeds from Shares 419 Borrowings 490 62 1,013 21 (253) Dividends paid (35) OtherNet Cash from Financing 873 62 1,013 21 (253)
Net increase in Cash 9 (79) (5) (3) 1

20
ASIR- Rs. 81.50AMSL- Rs.10.50 BUY
Sri Lanka Equities Corporate Update
Asiri Group (ASIR / AMSL / ASHA)
A J
KSB
Res
earc
h P
ubli
cati
on
John Keells Stock Brokers (Pvt) Ltd.130, Glennie Street,Colombo 2,Sri Lanka.
Tel: 9411 2421 101-9 (Gen.),9411 2326 003,9411 2439 047/8
Fax: 9411 2326 863,9411 2342 068
Navin [email protected]
October 2007
Comprising three quoted entities Asiri Hospitals Limited ASIR (the parentcompany), Asiri Medical Services Limited (AMSL) and Asha CentralHospitals Limted (ASHA), the Asiri group have established the strongestfranchise in private health care and is one of the few hospitals attemptingto extend this brand to the rest of the country.
The original Asiri Hospitals, which is the parent company, has a completerange of medical services with 110 beds and 3 operating theatres alongwith CT Scan diagnostic facilities.
AMSL, which is a specialized surgical hospital has 110 beds and is currentlygoing through a capacity expansion which will add another 40 beds by theend of 2008. The expansion will also see AMSL’s operating theatre countgo upto 7.
AMSL has established a core competency in neurology, but is currentlynot as established in cardiac procedures when compared to peers likeDurdens and Apollo. AMSL’s focus on surgery affords it higher marginsthan its peer group. This facility was also the first in Sri Lanka to have a 64slice CT scanner in its complement of imaging services. Asiri Surgicalcommenced operations in 2003 but reached full operations in FY05. Thisbusiness unit enjoys a tax holiday that will end in 2014.
The group’s diagnostics laboratory is a major contributor to earnings withAsiri acknowledged as the market leader by peers carrying out approximately70% of the diagnostic laboratory tests in Sri Lanka. The laboratory servicehas units in Kandy, Kalubowila, Matara, Negombo and Ragama with abranch in Kurunegala to be established. About 7,000-8,000 tests are doneon a daily basis at the Colombo unit while Kandy carries out another 1,000and Kalubowila carries out about 350. Asiri pioneered genetic testing in SriLanka which identifies chromosomal abnormalities which can cause disease.
Asiri Hospitals (ASIR)
0
10
20
30
40
50
60
70
80
90
Oct
-04
Jan-
05M
ar-
Jun-
05
Sep
-
Jan-
06
Apr
-06
Jul-0
6N
ov-0
6Ja
n-07
Apr
-07
Jul-0
7
Oct
-07
Price
0
1,000,000
2,000,000
3,000,000
4,000,000
5,000,000
6,000,000
Vol
Price
Volume
Asiri Surgical (AMSL)
0
2
4
6
8
10
12
14
Nov
-04
Jan-
05M
ar-
May
-Ju
l-05
Sep
-N
ov-0
5Ja
n-06
Mar
-M
ay-
Jul-0
6S
ep-
Nov
-06
Jan-
07M
ar-
May
-Ju
l-07
Sep
-
Pri
ce
0
10,000,000
20,000,000
30,000,000
40,000,000
50,000,000
60,000,000
70,000,000
80,000,000
Vo
l
Price
Volume
ASIRFiscal year Net profit
(Rs m)EPS (Rs) Growth (%) PER (X) P/BV (x) ROE (%)
2006 125.0 1.8 -51.5 46.40 5.16 11.132007 184.2 2.6 47.4 31.49 4.83 15.34
2008E 127.0 1.8 -31.0 45.65 4.37 9.582009E (68.0) (1.0) -153.5 n/a 4.60 n/a2010E 932.0 13.1 1470.6 6.22 2.64 42.45
AMSLFiscal year Net profit
(Rs m)EPS (Rs) Growth (%) PER (X) P/BV (x) ROE (%)
2006 138.8 0.3 100.3 35.53 4.49 12.632007 220.7 0.5 59.0 22.35 4.18 18.72
2008E 162.7 0.3 -26.3 30.32 3.83 3.322009E 226.8 0.5 39.4 21.75 3.37 16.932010E 848.0 1.8 273.9 5.82 2.18 27.28

21
Asiri Hospitals entered into an agreement with a Matara based companynamed Central Dispensary & Nursing Home to lease a 50 bed hospital atthe end of 2006. The hospital will have two operating theatres, maternityand ICU facilities in addition to diagnostics including a CT scanner.
Asiri acquired the 114 bed Asha Central for a consideration of Rs.1.85b inend August 2007. Asha which is situated on a 291 perch freehold propertyin high end residential area of Horton Place, is in the process of constructinga new 250 bed facility at Norris Canal Road, in close proximity to theColombo General Hospital. The acquisition was funded mainly throughdebt. Asiri is expected to keep the Horton Place facility running while thenew project is being completed, and dispose of the prime property, currentlyvalued at over Rs.1500m, once the new hospital is complete.
The Norris Canal road project is estimated to cost approximately Rs.2.5bnover the next 24 months. The hospital, according to pre-acquisitionmanagement plans, was designed to have 250 beds with 75 channelconsultation chambers along with 2 cardiac operating theatre suites and 6general operating theatres. Services will be provided in the core disciplinesof cardiac care, obstetrics, gynaecology and paediatrics. The newmanagement is expected to make minor modifications to the overall planin order to maximize on operational synergies.
43% 28% 29%
ASIR
AMSL
ASHA
AMSL is accounted as a subsidiary of ASIR , whilst the ASHA acquisitionwas made by both quoted entities.
Once the AMSL expansion and the new Asha Central Hospital iscommissioned, the Asiri group will have the largest presence in high endColombo private sector hospital beds with a compliment of over 550, aswell as having over 18 OT’s. In addition, the new Asha Central Hospitalis ideally located in close proximity to the main National Hospital inColombo, giving it a significant advantage in attracting visiting consultantmedical specialists.
The refurbishment at ASIR upgraded both inpatient and outpatientfacilities and also expanded their laboratory operations. Post refurbishment,we expect operational earnings to grow by an average 42% over the next3 years.
AMSLReuters Code AMSL.CMBloomberg Code AMSL.SLShare Price LKR 10.50Issued Share Capital (Shares) 469,739,990 12 mth High/Low (Rs.) 14.25 / 6.50Average Daily Volume (Shares) 463,297 Market Capitalization Rs.mn 4,932 Price Performance (%) 1 mth 3 mth 12 mthASPI 1.02 1.93 4.78AMSL -2.33 27.27 50.00
ASIRReuters Code ASIR.CMBloomberg Code ASIR.SLShare Price LKR 81.50Issued Share Capital (Shares) 71,141,043 12 mth High/Low (Rs.) 98.75 / 49.75Average Daily Volume (Shares) 29,455 Market Capitalization Rs.mn 5,798 Price Performance (%) 1 mth 3 mth 12 mthASPI 1.02 1.93 4.78ASIR 18.12 45.54 65.21

22
AMSL currently enjoys premium margins on account of its focus onhigh end surgical procedures. The addition of the 40 beds will furtherboost margins. We expect AMSL EBIT to increase by 54% in FY09.
Post takeover, ASHA is expected to increase EBIT by approximately30% in FY09, with synergies flowing through leveraging on groupinfrastructure. The significant jump in earnings is expected to come throughin FY10 with the commissioning of the new hospital, which is expectedto register Rs.410m in net earnings in its first year of operations.
Both ASIR and AMSL earnings however, will be suppressed in the shortterm by borrowing costs of both the acquisition and the construction ofthe new Hospital, amounting to approximately Rs.4.3b spread throughFY08-FY09. However, borrowings can be significantly reduced once thetransition is complete and the prime Horton place real estate is divested.
Currently both ASIR and AMSL are valued higher than sector and marketmultiples. However, given the significant medium term earnings upsidethat exists once the new hospital is commissioned, we see value in bothAMSL and ASIR as long term investments.

23
ASIRIIncome Statement 2006 2007 2008E 2009E 2010EYear ending 31st March Rs. mn Rs. mn Rs. mn Rs. mn Rs. mnRevenue 1,292 1,707 2,607 3,197 4,388 Cost of Services (717) (899) (1,450) (1,758) (2,420) Gross profit 575 808 1,157 1,440 1,969 Expenses (291) (360) (511) (563) (713) Operating profit 287 465 646 877 1,256 Gain from disposal of property 1,040 Net finance cost (44) (78) (356) (820) (421) PBT 243 387 290 57 1,875 Tax (33) (75) (86) (7) (23) Minority interest (85) (128) (77) (117) (920) Profit attributable 125 184 127 (68) 932
Balance Sheet 2006 2007 2008E 2009E 2010EAs at 31st March Rs. mn Rs. mn Rs. mn Rs. mn Rs. mn
Fixed Assets 2,078 2,218 5,284 6,604 6,344
Current AssetsInventories 101 120 166 200 180 Receivables 50 97 200 175 160 Cash 7 20 64 127 195 Other 61 62 62 70 74
219 299 492 572 609
Current LiabilitiesShort-term loans & OD 437 414 725 857 819 Trade payables 65 92 130 156 123 Other 26 38 38 38 38
527 545 893 1,051 980
Long-term LiabilitiesTerm Debt 98 144 2,838 4,000 1,988 Non interest bearing debt 75 70 66 59 53 Other 139 162 178 208 218
312 375 3,082 4,267 2,259
Net Assets 1,459 1,597 1,801 1,858 3,714
Stated Capital 474 711 711 711 711 Reserves 649 489 616 549 1,481 Shareholder's Funds 1,123 1,200 1,328 1,260 2,195 Minority Interest 336 397 473 599 1,519
Cash flow statement 2006 2007 2008E 2009E 2010EYear ending 31st March Rs. mn Rs. mn Rs. mn Rs. mn Rs. mnPBT 243 387 290 57 1,875
Depreciation / Amortization 110 154 193 214 235 Finance costs 44 78 356 820 421 Other 6 17 (1,040) Change in working capital (5) (39) (112) 17 2
Cash from Operations 398 597 727 1,108 1,493
Finance costs paid (44) (78) (356) (820) (421) Income tax paid (23) (48) (86) (7) (23) Other (2) (2) Net Cash from Operations 329 470 285 281 1,049
Net PPE (395) (298) (3,259) (1,534) 1,065 Net Investments 0 0 OtherNet Cash from Investing (395) (298) (3,259) (1,534) 1,065
Proceeds from SharesBorrowings (113) 68 3,018 1,317 (2,046) Dividends paid (129) (174) - OtherNet Cash from Financing (243) (107) 3,018 1,317 (2,046)
Net increase in Cash (308) 65 43 64 68

24
This document is published by John Keells Stockbrokers (Pvt.) Limited for the exclusive use of their clients. All information has been compiled from availabledocumentation and JKSB’s own research material. Whilst all reasonable care has been taken to ensure the accuracy of the contents of this issue, neither JKSB norits employees can accept responsibility for any decisions made by investors based on information contained herein.
AMSLIncome Statement 2006 2007 2008E 2009E 2010EYear ending 31st March Rs. mn Rs. mn Rs. mn Rs. mn Rs. mnRevenue 531 719 848 1,188 1,485 Cost of Services (262) (335) (395) (553) (692) Gross profit 269 384 453 634 793 Expenses (129) (162) (186) (221) (268) Operating profit 139 226 271 418 529 Associate - - 19 47 427 Net finance cost (0) (4) (125) (236) (106) Tax (0) (1) (2) (2) (2) Net Profit 139 221 163 227 848
Balance Sheet 2006 2007 2008E 2009E 2010EAs at 31st March Rs. mn Rs. mn Rs. mn Rs. mn Rs. mnFixed AssetsPP&E / Leasehold 1,236 1,226 1,476 1,432 1,389 Investment 947 1,229 1,371
1,236 1,226 2,423 2,661 2,760 Current AssetsInventories 53 55 75 106 123 Receivables 16 42 60 91 104 Cash 5 7 26 15 107 Other 1 2 2 2 2
75 106 163 214 336
Current LiabilitiesShort-term loans & OD 18 41 199 198 208 Trade payables 28 35 45 54 61 Other 89 5 12 10 10
135 81 256 262 279
Long-term LiabilitiesTerm Debt - - 975 1,088 505 Non interest bearing debt 75 70 64 59 49 Other 1 2 2 3 4
76 72 1,041 1,150 558
Net Assets 1,099 1,179 1,289 1,463 2,259
Stated Capital 982 982 982 982 982 Reserves 117 197 307 481 1,277 Shareholder's Funds 1,099 1,179 1,289 1,464 2,259
Cash flow statement 2006 2007 2008E 2009E 2010EYear ending 31st March Rs. mn Rs. mn Rs. mn Rs. mn Rs. mnPBT 139 221 165 229 850
Depreciation / Amortization 50 73 87.14 101 110Finance costs 1 5 125 236 106 Other 0 1 Change in working capital 27 (104) (28) (53) (23) Associate (19) (47) (427)
Cash from Operations 218 196 331 466 616
Finance costs paid (0) (4) (125) (236) (106) Income tax paid (1) (2) (2) (2) (2) OtherNet Cash from Operations 217 190 204 228 508
Net PPE (148) (64) (338) (57) (67) Net Investments (947) (283) (141) OtherNet Cash from Investing (148) (64) (1,284) (339) (208)
Proceeds from SharesBorrowings (8) 5 1,134 106 (582) Dividends paid (62) (141) (53) (53) (53) Dividend received 19 47 427 OtherNet Cash from Financing (70) (136) 1,100 101 (208)
Net increase in Cash (1) (9) 19 (11) 92

25
Sri Lanka Equities Corporate Update
Ceylon Hospitals PLC (CHL)
A J
KSB
Res
earc
h P
ubli
cati
on
John Keells Stock Brokers (Pvt) Ltd.130, Glennie Street,Colombo 2,Sri Lanka.
Tel: 9411 2421 101-9 (Gen.),9411 2326 003,9411 2439 047/8
Fax: 9411 2326 863,9411 2342 068
October 2007
Although Durdans was established over 60 years ago the hospitaltransformed itself over the 1990s with new initiatives to specialize in cardiacprocedures as well as the introduction of professional management andmodern IT practices that will help realize efficiencies ahead of its peergroup.
Durdans is currently undergoing a capacity expansion that will take themfrom 150 beds to 325 beds. Other facilities being built include new channelingconsultation chambers adding to the current 28 rooms, approximately 9,000sq ft for radiology, 5 new operating theatres adding to the current 3 and abulking up of the Pediatrics and Ob/Gyn divisions. This phase costingalmost Rs.2 bn is due to be complete by the end of 2009 with constructiontaking place without hampering current operations.
Durdans’ key specialization is in cardiac procedures, which is the largestcontributor to revenue with a share of about 25%. The Company firstsetup its Cardiac centre in collaboration with Escorts Heart Institute in1997, which was he pioneering non-invasive cardiac centre in Sri Lanka.Diagnostic laboratory services are the second largest contributor to revenuewith an over 20% share, but outreach is limited compared to rivals likeAsiri and Nawaloka.
Thanks to their expansion initiatives, Durdans has shown higher than averagerevenue growth of 33% over the last three years from FY04 to FY07when compared to their peers. Correspondingly operating profit alsoincreased by an average of 40% over the same period while operatingmargins also increased from 13.5% in FY04 to 15.8% in FY07.
We estimate that Durdans’ expansion will help net earnings grow at a CAGRof 45% over the next three years with the benefits of the capacity expansionto be felt in FY10. The Durdans voting share is currently trading at a PERof 8x FY07 earnings while the non-voting share trades at 6x. Werecommend BUY.
CHLReuters Code CHL.CMBloomberg Code CHL.SLShare Price LKR
Voting 55.00Nonvoting 39.50
Issued Share Capital Voting 19,500,000
Nonvoting 6,375,000 12 mth High/Low (Rs.)
Voting 68.00 / 45.00Nonvoting 44.75 / 27.00
Average Daily Volume (Shares)Voting 7,606
Nonvoting 10,499 Market Capitalization Rs.mn (Voting) 1,073 Price Performance (%) 1 mth 3 mth 12 mthASPI 1.02 1.93 4.78CHL.N 3.77 7.32 17.02CHL.X 1.28 3.95 41.07
Navin [email protected]
CHL.N- Rs. 55.00CHL.X-Rs. 39.50 BUY
Durdans (voting)
0
10
20
30
40
50
60
70
80
Oct
-04
Dec
-
Feb
-
Apr
-05
Jun-
05
Aug
-
Oct
-05
Dec
-F
eb-
Apr
-06
Jun-
06
Aug
-O
ct-0
6
Dec
-
Feb
-
Apr
-07
Jun-
07A
ug-
Oct
-07
Price
0
100,000
200,000
300,000
400,000
500,000
600,000
700,000
800,000Vol
Price
Volume
CHL (voting)Fiscal year Net profit
(Rs m)EPS (Rs) Growth (%) PER (X) P/BV (x) ROE (%)
2006 145.0 5.6 63.9 9.81 1.60 16.312007 169.9 6.6 17.1 8.38 0.93 11.13
2008E 95.5 3.7 -43.8 14.90 0.91 6.112009E 25.2 1.0 -73.6 56.53 0.93 1.652010E 402.0 15.5 1497.0 3.54 0.76 21.50

26
This document is published by John Keells Stockbrokers (Pvt.) Limited for the exclusive use of their clients. All information has been compiled from availabledocumentation and JKSB’s own research material. Whilst all reasonable care has been taken to ensure the accuracy of the contents of this issue, neither JKSB norits employees can accept responsibility for any decisions made by investors based on information contained herein.
Income Statement 2006 2007 2008E 2009E 2010EYear ending 31st March Rs. mn Rs. mn Rs. mn Rs. mn Rs. mnRevenue 1,401 1,639 1,884 2,129 4,409 Cost of Services (669) (764) (886) (1,011) (2,072) Gross profit 732 875 999 1,118 2,337 Expenses (512) (632) (728) (816) (1,598) Operating profit 221 242 271 302 738 Net finance cost (23) (28) (139) (247) (262) PBT 212 230 149 73 494 Tax (42) (35) (22) (11) (49) Minority interest (25) (25) (31) (37) (43) Profit attributable 145 170 96 25 402
Balance Sheet 2006 2007 2008E 2009E 2010EAs at 31st March Rs. mn Rs. mn Rs. mn Rs. mn Rs. mnFixed AssetsPP&E 1,067 1,779 2,479 3,170 3,603 Others 11 7 10 18 19
1,079 1,786 2,489 3,188 3,622 Current AssetsInventories 83 89 94 106 220 Receivables 91 97 113 128 265 Cash 23 63 18 28 24 Other 132 111 90 60 23
328 358 316 322 532
Current LiabilitiesShort-term loans & OD 132 177 145 205 198 Trade payables 124 221 264 251 273 Other 47 24 33 29 36
302 422 442 485 507
Long-term LiabilitiesTerm Debt 148 115 565 1,247 1,520 Other 30 38 182 185 185
179 153 747 1,432 1,705
Net Assets 926 1,569 1,615 1,593 1,942
Stated Capital 259 259 259 259 259 Reserves 631 1,268 1,304 1,269 1,611 Shareholder's Funds 889 1,527 1,562 1,527 1,869 Minority interest 37 43 53 65 72
Cash flow statement 2006 2007 2008E 2009E 2010EYear ending 31st March Rs. mn Rs. mn Rs. mn Rs. mn Rs. mnPBT 212 230 149 73 494
Depreciation / Amortization 44 56 68 82 98 Finance costs 23 28 139 247 262 Other (47) (3) Change in working capital (20) 72 21 (40) (229)
Cash from Operations 213 383 377 362 626
Finance costs paid (23) (28) (139) (247) (262) Income tax paid (42) (52) (22) (11) (49) Other (2) (3) Net Cash from Operations 145 300 215 104 314
Net PPE (207) (261) (771) (773) (531) Net Investments 35 46 OtherNet Cash from Investing (173) (215) (771) (773) (531)
Proceeds from SharesBorrowings 55 1 571 738 273 Dividends paid (48) (58) (60) (60) (60) OtherNet Cash from Financing 6 (56) 511 678 213
Net increase in Cash (21) 29 (44) 9 (4)