sRG HOUSING FINANCE LIMITED Corporate...Bijainagar Chittorgarh Dungarpur Fatehnagar 17 Jaipur...
35
SRG HOUSING FiMNCE LTD l^'ri'r r"i r,! TM NO:2339164 sRG HOUSING FINANCE LIMITED REGD. oFFICE: 321, S-M, LoDHA COMPLEX, SHASTnI ClRCtE, UDAIPUR 313001 (BTJASTHAN) PHoNE: 0294-2561882, 2412609, FAX| 0294-5104446, E.MAIL: [email protected] CIN NO, i 165922RJj999P1C015440 WEBSITE: wwwsrghousing.com Dare:31.01.2018 To, Department of Corporate Services BSE Limited Mumbai- 400 001 Respected Sir/Ma'am, SUBIECT: Corporate Presentation - December, 2Ol7 With reference to above, we hereby provide the Corporate Presentation ofthe Company for the period ended December,2017. Please take the same on record and acknowledge the receipt. Thanking You, With Regards, For SRG Housing Fill 'Qffiir""tor1 DIN:00248843 C0RP0RATE oFFlCEr 1046, 1olH rL00R, HUBT0WN S0LARIS, N. S. PHA0KE MABG, VIJAY tlAGAfi, AiIDHERI (E), MUMBAI- 400 069 (MAHABASHTRA)
Transcript of sRG HOUSING FINANCE LIMITED Corporate...Bijainagar Chittorgarh Dungarpur Fatehnagar 17 Jaipur...
SRG HOUSING FiMNCE LTDl^'ri'r r"i r,!
TM NO:2339164
sRG HOUSING FINANCE LIMITEDREGD. oFFICE: 321, S-M, LoDHA COMPLEX, SHASTnI ClRCtE, UDAIPUR 313001 (BTJASTHAN)
PHoNE: 0294-2561882, 2412609, FAX| 0294-5104446, E.MAIL: [email protected] NO, i 165922RJj999P1C015440 WEBSITE: wwwsrghousing.com
Dare:31.01.2018
To,Department of Corporate ServicesBSE LimitedMumbai- 400 001
Respected Sir/Ma'am,
SUBIECT: Corporate Presentation - December, 2Ol7
With reference to above, we hereby provide the Corporate Presentation ofthe Company forthe period ended December,2017.
Please take the same on record and acknowledge the receipt.
Thanking You,
With Regards,
For SRG Housing Fill
'Qffiir""tor1
DIN:00248843
C0RP0RATE oFFlCEr 1046, 1olH rL00R, HUBT0WN S0LARIS, N. S. PHA0KE MABG, VIJAY tlAGAfi, AiIDHERI (E), MUMBAI- 400 069 (MAHABASHTRA)
CorporatePresentation December, 2017www.srghousing.com

P A G E 01
Company Profile
Ÿ SRG HFL’s business model is the brainchild Ÿ Bombay Stock Exchange Listed and
of Mr. Vinod K. Jain, the company’s National Housing Bank registered Housing
Managing Director. His vision is to provide Finance Company.
housing finance to people in rural area which is Ÿ Recognized by National Housing Bank for
generally underrated and left ignored by other refinance facility.
financial institutions.
Individual
Home Loans
Loan Against
PropertyProject
Loan
WE SERVICE FOR

02
2002 :
2004 :
Got license from NHB being the 1st Company in Rajasthan to get NHB License.
Converted into Public Company.
1999 :
2000 :
Incorporated as Vitalise Finlease Private Limited.
Changed the name of the company to SRG Housing Finance Private Limited.
1 2012 : Listed on BSE SME Platform being the 1st Company in Rajasthan to be listed on SME Platform.
2 3 2015 :
2015 :
Migrated to BSE Main Board being India’s 1st Company to get migrated.
Notified by Ministry of Finance to be treated as “Financial Institution” under SARFAESI Act 2002.
4
2016: Got Sanctioned its First Ever Refinance From National Housing Bank, twice i.e. in the month of April, 2016 and also in the month of January, 2017.
2017:
2017:
Brickwork has assigned Ratings of BWR BBB-(BWR Triple B Minus).
Credit Rating upgraded by CARE Ratings to CARE BBB- Stable (Triple B Minus Outlook: Stable)
2017 : Awarded with Order of Merit by Skoch Group in 47th Skoch Summit for qualifying among Top 100 SMEs in India.
2017: Appointed Deloitte Haskins & Sells LLP, Chartered Accountants, for the Management Audit (Specific Account Balance Testing) for SRG Housing Finance Limited for the financial year 2017-18.
2017 : Company has secured refinance from multiple sources.
2017 : During the year 2016-17, Company successfully raised funds worth Rs. 15.19 Cr by way of Private Placement of equity shares from various leading investors of the country. This issue is the 1st Private Placement made by the Company post its IPO.
2017 : First ever Debenture Issue of the Company worth Rs. 25 Cr.
5678
9 10 11
P A G E
03
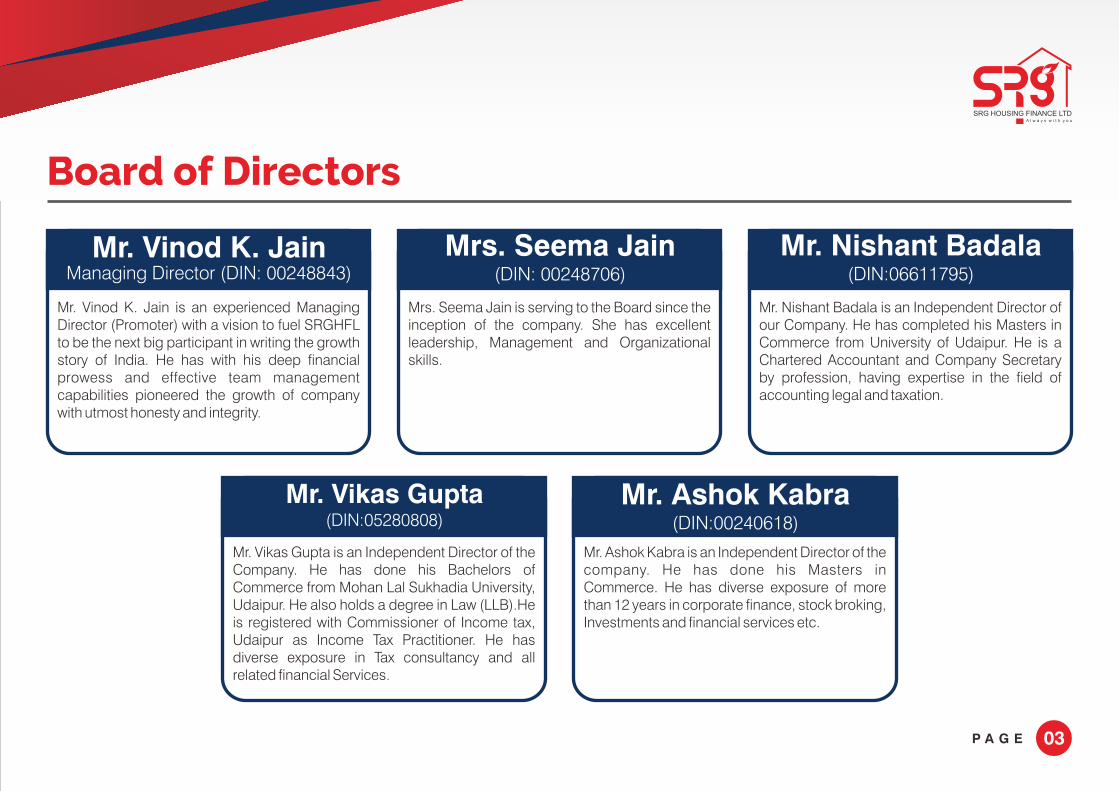
Board of Directors
Mrs. Seema Jain(DIN: 00248706)
Mr. Nishant Badala (DIN:06611795)
Mr. Ashok Kabra(DIN:00240618)
Mr. Vikas Gupta (DIN:05280808)
Mr. Vinod K. Jain Managing Director (DIN: 00248843)
P A G E
Mr. Ashok Kabra is an Independent Director of the company. He has done his Masters in Commerce. He has diverse exposure of more than 12 years in corporate finance, stock broking, Investments and financial services etc.
Mr. Vikas Gupta is an Independent Director of the Company. He has done his Bachelors of Commerce from Mohan Lal Sukhadia University, Udaipur. He also holds a degree in Law (LLB).He is registered with Commissioner of Income tax, Udaipur as Income Tax Practitioner. He has diverse exposure in Tax consultancy and all related financial Services.
Mrs. Seema Jain is serving to the Board since the inception of the company. She has excellent leadership, Management and Organizational skills.
Mr. Vinod K. Jain is an experienced Managing Director (Promoter) with a vision to fuel SRGHFL to be the next big participant in writing the growth story of India. He has with his deep financial prowess and effective team management capabilities pioneered the growth of company with utmost honesty and integrity.
Mr. Nishant Badala is an Independent Director of our Company. He has completed his Masters in Commerce from University of Udaipur. He is a Chartered Accountant and Company Secretary by profession, having expertise in the field of accounting legal and taxation.

04
Mr. Vinod K. Jain | Managing Director
He is an experienced Managing Director (Promoter) with strong controlling, direction & effective team building
capability. In the year 1999 he floated his own Company “SRG Housing Finance Limited” with a broad and clear
vision in the field of finance. He pioneered Housing Finance in year 2002 in Rajasthan.
He has proved his capability in strategic management and is a successful performer in pursuit of profitable growth.
His relentless ambition established the brand SRG and fueled the company to the new heights of success. He has
always proven SRG Housing Finance Ltd. as the best Company with respect to customer satisfaction and highly
motivated employees.
Mr. Vinod Jain is a firm
believer of achieving
excellence through a
positive and proactive
approach. He follows
a dictum –
Success is simple.Do what's right,the right way,at the right time.
P A G E

05
Management Team
Ms. Jain has over 5 years of experience in Finance. She is Ph.D. in finance and is an associate member of ICSI along with MBA
(PGDBA) from Symbiosis. She is a post graduate from Mohan Lal Sukhadia University, Rajasthan. She is having hand of
experience in management and finance. She is effectively handling administration and management of the company. She works
closely on strategic planning, decision making and new policy formulation which aids in development and achievement of goals.
She has joined the company in 2017.
Ms. Krati Jain | Vice President
Mr. Modi has more than 25 years of experience in ensuring financial strengthening to the individuals and organizations via audit
and strategic planning. His in-depth knowledge about the financial system and various derivatives is unparalleled. He is with the
company since 2012.
Mr. Ashok Modi | CFO
Mr. Murdia has 15 years of experience into Sales and Marketing and has build robust business models in sectors like finance,
insurance, telecom etc. He has an expertise in channel management where he researches into identifying cum building new
market opportunities. He has been working with the company since 2010.
Mr. Lavang Murdia | CMO
P A G E

06
Management Team
Ms. Nagar is an associate member of Institute of Company Secretaries of India and also possesses LLB degree. She is handling
Compliance, Equity & Debt Financing matters. Her deep insights and research mindset has helped company to find newer
innovative ways to expand and flourish. She joined the company in the year 2015.
Ms. Sunaina Nagar | CS & GM- Finance
Ms. Bakshi is an Associate Member of Bar Council of India. She is an MBA HR from IMT Ghaziabad. She is also persuing Masters in
Law. She is handling Strategic Planning, Human Resource matters. Her intelligence, hard work and dedication to work has helped
company grow in an organised manner.
Ms. Manjot Kaur Bakshi | CHRO
Mr. Singhvi is retired as a Senior Manager-Bank of Baroda after serving for 36 years and also has been Incharge-cum- faculty in
RTC(Regional Training Centre), Jaipur for 5 years. His qualifications includes B.SC, M.COM, MBA, CAIIB among others and he has
also qualified various courses on Mutual Funds organised by NISM. He is equipped with various procedures and policies which
makes financial transaction less cumbersome and meaningful. His tracking mechanism and rigorous follow up strategies has
helped building up of customer network. Mr. Singhvi is working with company since 2015
Mr. Dilip Kumar Singhvi | GM- Operations
P A G E
07
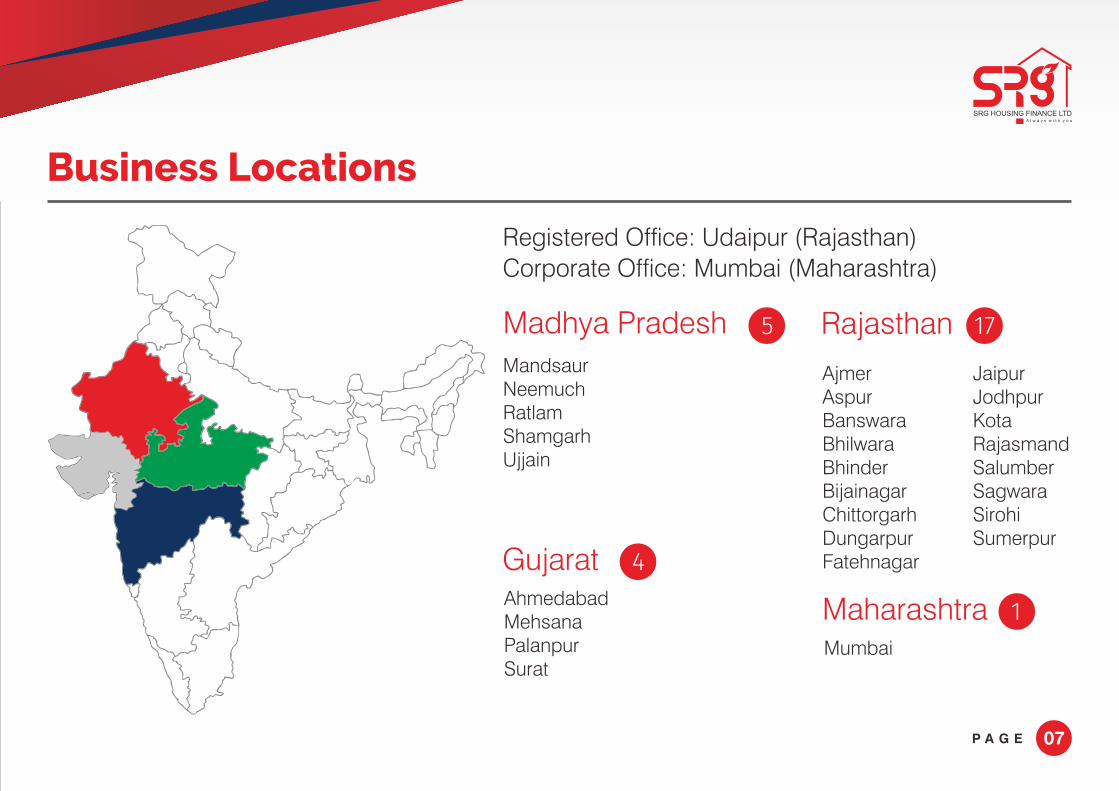
Business Locations
MehsanaPalanpurSurat
Ahmedabad
Gujarat 4
Registered Office: Udaipur (Rajasthan)Corporate Office: Mumbai (Maharashtra)
Madhya Pradesh
MandsaurNeemuchRatlamShamgarhUjjain
5 Rajasthan
AjmerAspurBanswaraBhilwaraBhinderBijainagarChittorgarhDungarpurFatehnagar
17
JaipurJodhpurKotaRajasmandSalumberSagwaraSirohiSumerpur
Mumbai
Maharashtra 1
P A G E
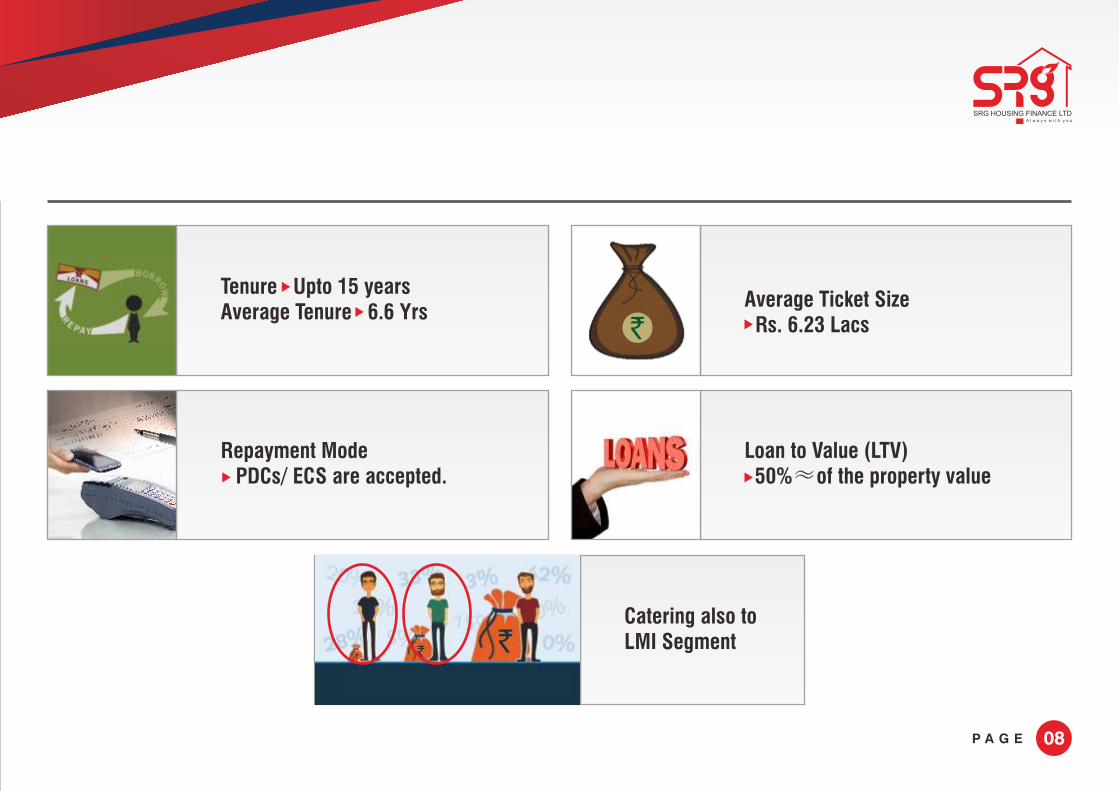
08
Average Ticket Size
Loan to Value (LTV)Repayment Mode PDCs/ ECS are accepted.
Catering also toLMI Segment
Tenure Upto 15 yearsAverage Tenure 6.6 Yrs
Rs. 6.23 Lacs
50%≈of the property value
P A G E
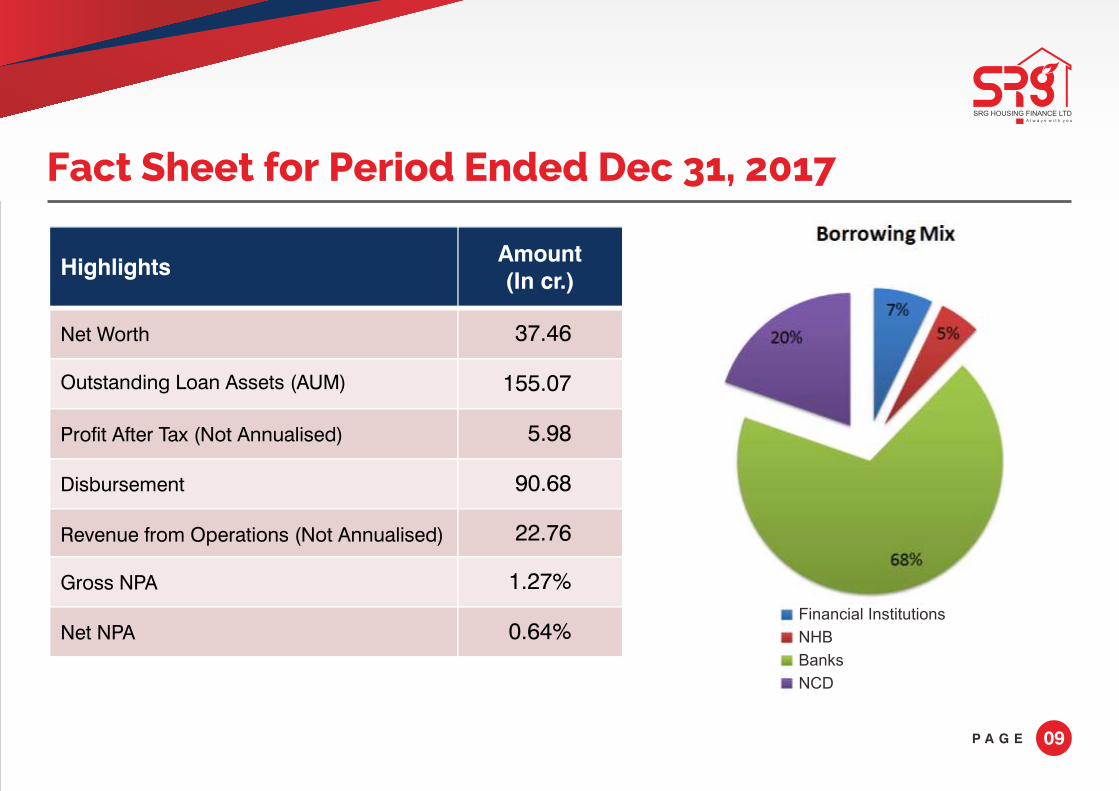
09
Fact Sheet for Period Ended Dec 31, 2017
Amount(In cr.)
Net Worth 37.46
Outstanding Loan Assets (AUM) 155.07
Profit After Tax (Not Annualised) 5.98
Disbursement 90.68
Revenue from Operations (Not Annualised) 22.76
Gross NPA 1.27%
Net NPA 0.64%
Highlights
P A G E
Financial Institutions
NHB
Banks
NCD
10
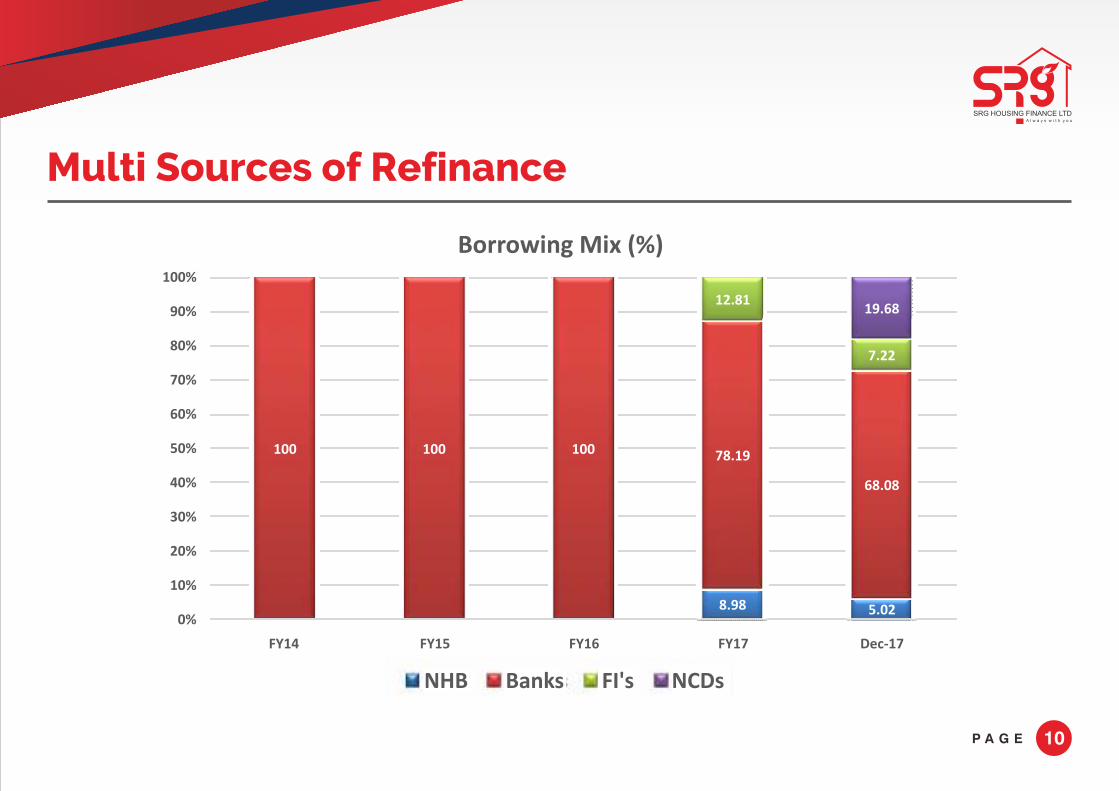
Multi Sources of Refinance
8.98 5.02
100 100 100 78.19
68.08
12.81
7.22
19.68
0%
10%
20%
30%
40%
50%
60%
70%
80%
90%
100%
FY14 FY15 FY16 FY17 Dec-17
Borrowing Mix (%)
Banks FI'sNHB NCDs
P A G E
11
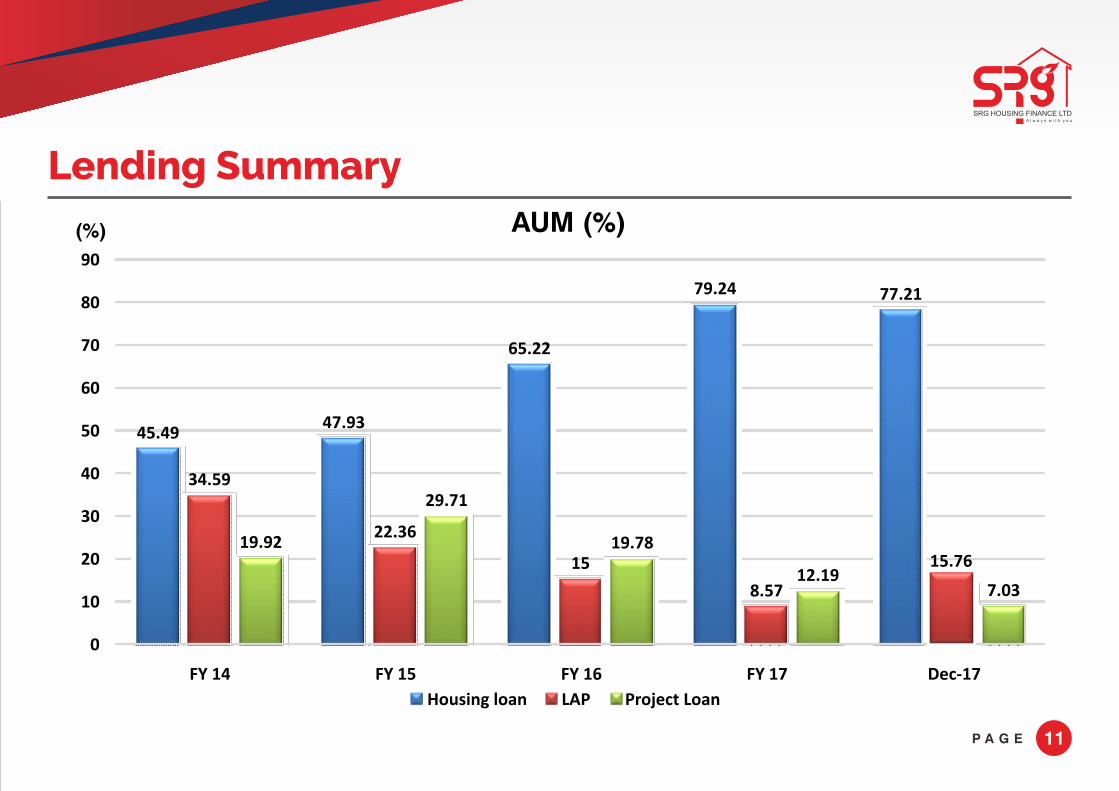
Lending Summary
45.4947.93
65.22
79.24 77.21
34.59
22.36
15
8.57
15.7619.92
29.71
19.78
12.197.03
0
10
20
30
40
50
60
70
80
90
FY 14 FY 15 FY 16 FY 17 Dec-17
AUM (%)
Housing loan LAP Project Loan
(%)
P A G E

12
Loan Portfolio Analysis
Dec, 2017 2017 2016
Amount % Amount % Amount %
Housing Loan 11972.99 77.22 6483.95 79.24 3474.71 65.21
LAP 2443.48 15.75 701.66 8.57 798.85 14.99
Project Loan 1090.28 7.03 997.27 12.19 1054.89 19.80
Total 15506.75 100.00 8182.87 100.00 5328.45 100.00
Dec, 2017 2017 2016
Avg. Loan size
Housing Loan 4.48 4.66 4.17
LAP 9.01 15.95 21.02
Project Loan 121.11 124.66 131.86
Amount in Lacs
Amount in Lacs
P A G E

13
7.57
18.83
155.07
0
20
40
60
80
100
120
140
FY 12 FY 13 FY 14
` In Cr.
AUM Growth160
180
26.4
38.68
53.28
81.83
FY 15 FY 16 FY 17 Dec-17
CAGR OF 60.97 %
AUM (In cr)
P A G E

14
Increasing Geographical Presence
As on Dec 16
AUM (%)
RajasthanMaharashtra
96.86
3.14AUM ( %)
As on Dec 17
21.09
76.28
0.34
2.29 Rajasthan
Maharashtra
Madhya Pradesh
Gujarat
P A G E
15
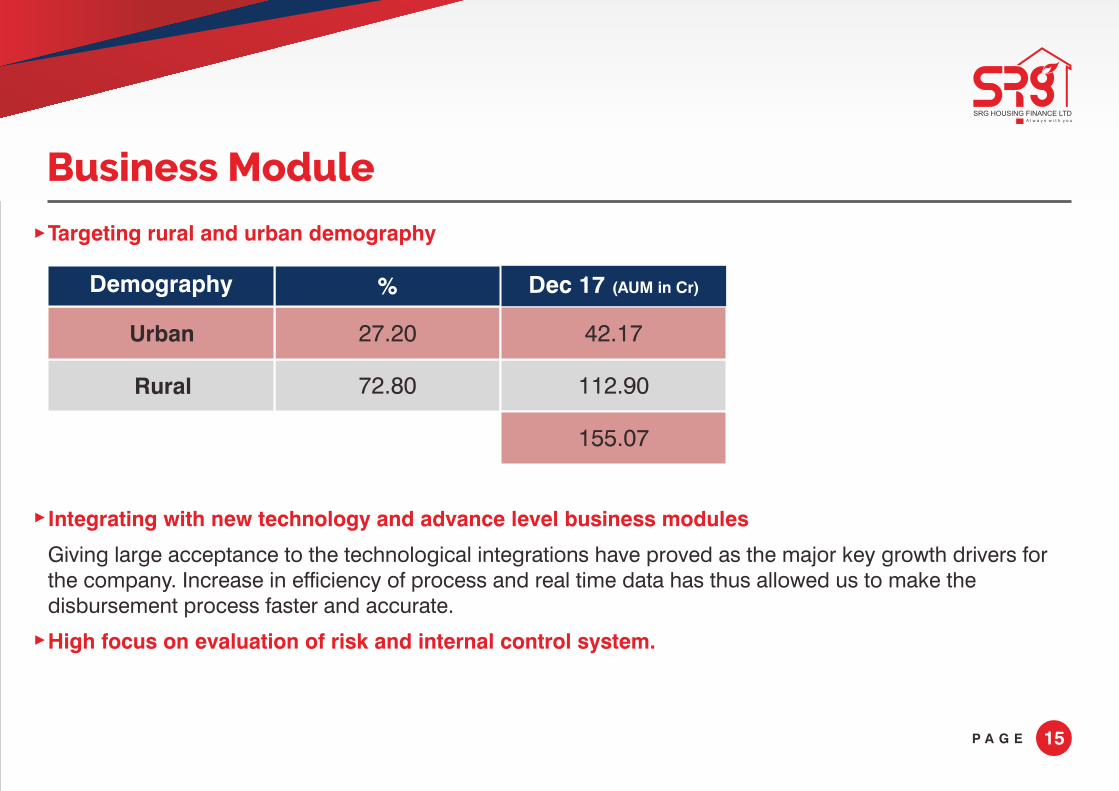
Business Module
Targeting rural and urban demography
Integrating with new technology and advance level business modules
High focus on evaluation of risk and internal control system.
Giving large acceptance to the technological integrations have proved as the major key growth drivers for the company. Increase in efficiency of process and real time data has thus allowed us to make the disbursement process faster and accurate.
P A G E
27.20
72.80
Urban
Rural 112.90
Demography Dec 17 (AUM in Cr)%
42.17
155.07

16
49.78 51.16
55.7753.44
46.92
42.42
0
10
20
30
40
50
60
FY14 FY15 FY16 FY17 Dec-16 Dec-17
Cost to Income Ratio
Cost to Income Ratio (%)
%
P A G E
17
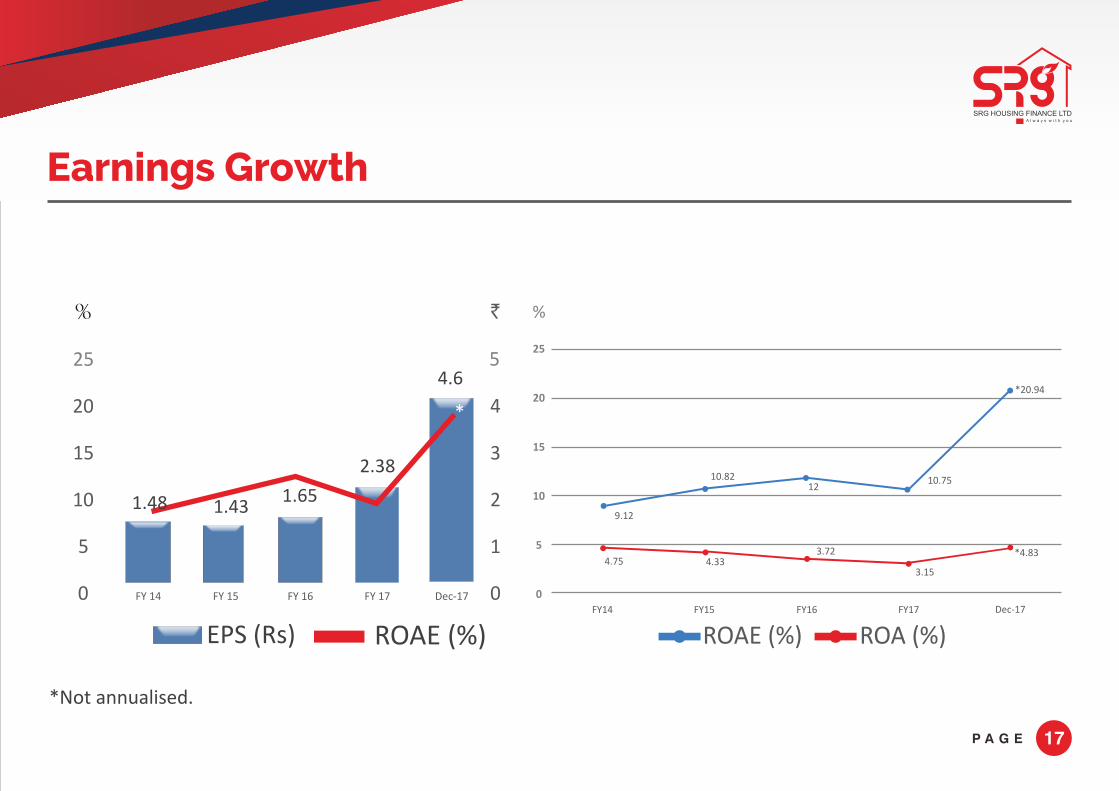
Earnings Growth
*Not annualised.
0
5
10
15
%
20
25
0
1
2
3
`
4
5
1.431.65
2.38
4.6
EPS (Rs) ROAE (%)
1.48
FY 15FY 14 FY 17FY 16 Dec-17
P A G E
25
20
15
10
5
0FY14 FY15 FY16 FY17 Dec-17
4.75
9.12
10.82
4.333.72
1210.75
3.15
*4.83
ROAE (%) ROA (%)
%
*20.94

18
` in Cr.Operating Profit Net Interest Margin (%)%
9
8
7
6
5
4
3
2
1
0
1.692.27
FY 14 FY 15 FY 16 FY 17 Dec-17
2.77
4.03
8.25
Operating Profit (In cr)
16
14
12
10
8
6
4
2
0FY 14 FY 15 FY 16 FY 17 Dec-17
NIM (%)
1.69
14.24
13.02 12.35
9.67
12.69
Earnings Growth
P A G E

19
*Not annualised.
P A G E
14.55
13.0212.35
9.67
12.69
1.19
1.54 1.872.7
*5.984.754.33
3.723.15
*4.83
2013-14 2014-15 2015-16 2016-17 Dec-17
NIM(%) PAT(In Cr) ROA(%)
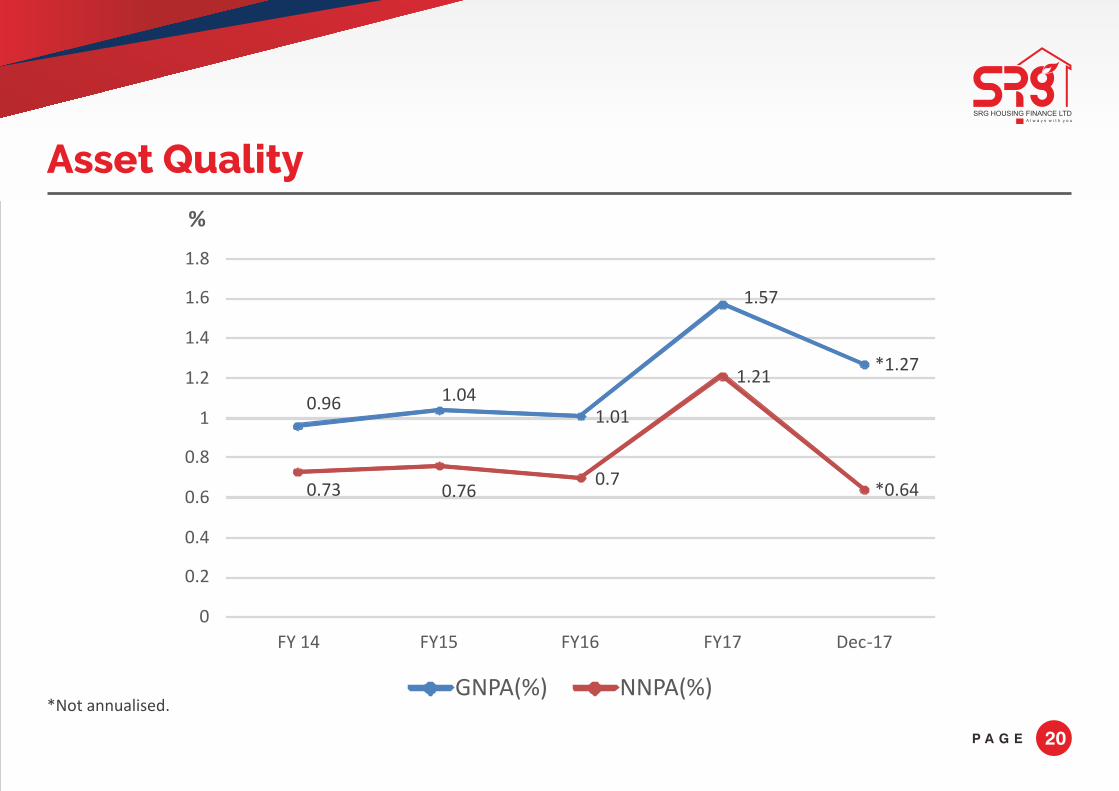
Asset Quality
20
%
P A G E
*Not annualised.
0.96 1.041.01
1.57
*1.27
0.73 0.760.7
1.21
*0.64
0
0.2
0.4
0.6
0.8
1
1.2
1.4
1.6
1.8
FY 14 FY15 FY16 FY17 Dec-17
GNPA(%) NNPA(%)

21
Fresh Approvals Vs. Fresh Disbursement
100
90
80
70
60
50
40
30
20
10
0
93.07 90.68
22.37 21.65
9m Dec 179m Dec 16
New Approvals (In cr) Disbursements (In cr)
` in Cr.
P A G E
22
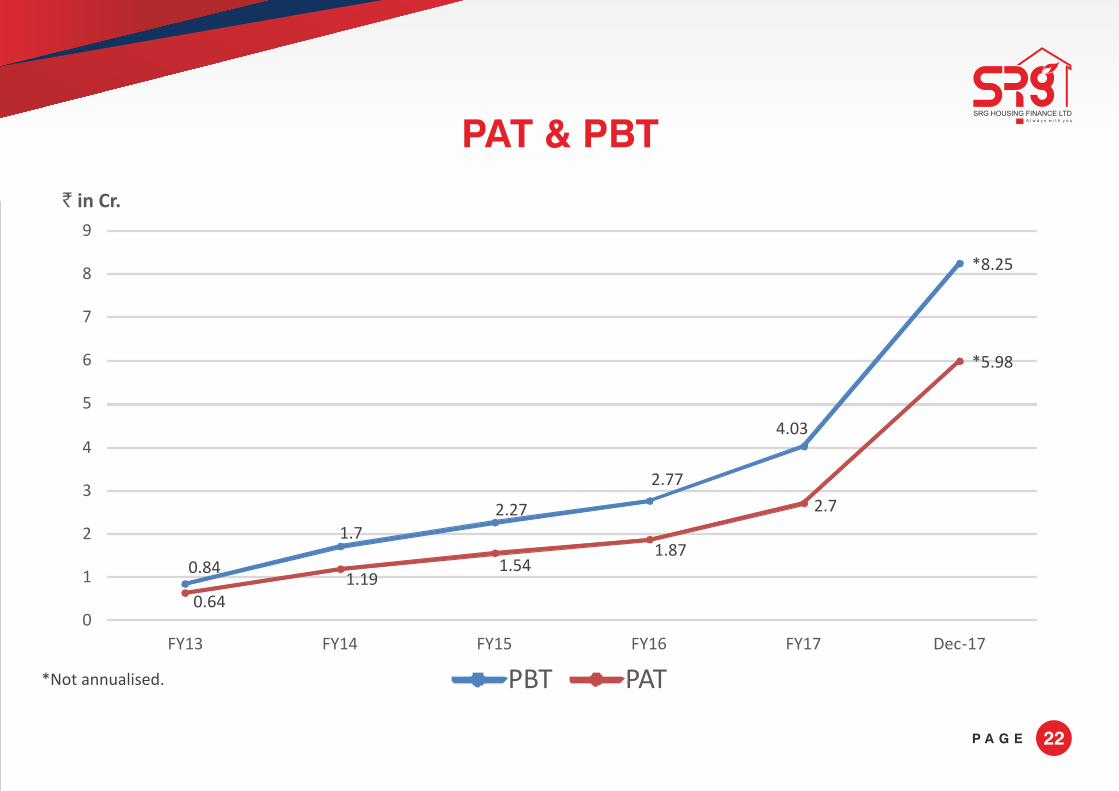
` in Cr.
PAT & PBT
P A G E
0.84
1.7
2.27
2.77
4.03
*8.25
0.641.19
1.541.87
2.7
*5.98
0
1
2
3
4
5
6
7
8
9
FY13 FY14 FY15 FY16 FY17 Dec-17
PBT PAT*Not annualised.
23
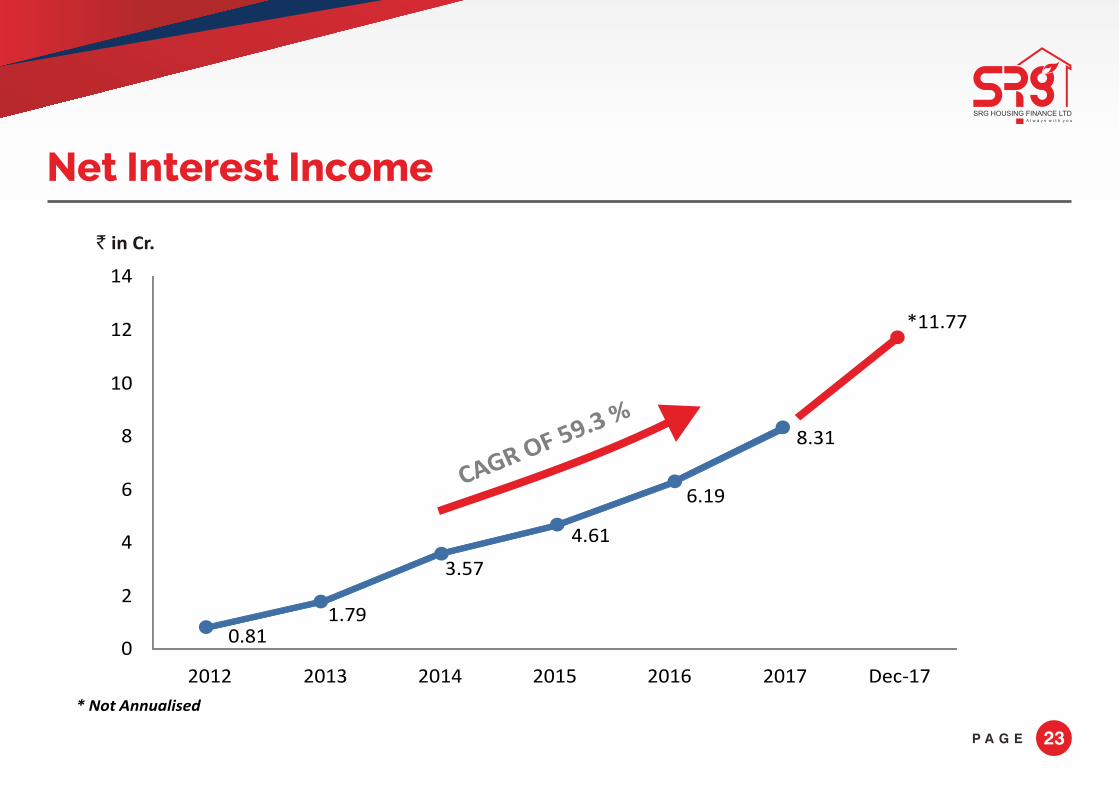
Net Interest Income
` in Cr.
CAGR OF 59.3 %
P A G E
4.61
6.19
8.31
*11.77
0.811.79
3.57
0
2
4
6
8
10
12
14
2012 2013 2014 2015 2016 2017 Dec-17
* Not Annualised

24
Performance Highlights
(In Cr.)
Particulars Dec’17 (3m) Sep’17 (3m) Dec’16 (3m) Dec’17 (9m) Dec’16 (9m) Mar’17 (12m)
New Approvals 38.34 30.88 9.97 93.07 22.37 51.53
Disbursements 36.16 29.79 10.17 90.68 21.65 47.37
Outstanding Loan Book 155.07 125.04 66.13 155.07 66.13 81.83
Interest Income 7.76 6.24 3.49 19.05 9.77 13.86
Fees & Other Income 1.66 1.17 0.07 3.71 0.15 0.70
Total Income 9.42 7.41 3.56 22.76 9.92 14.56
Interest Expenditure 2.84 2.32 1.47 7.28 4.01 5.55
Other Expenditure 3.45 2.27 1.37 7.23 3.16 4.98
Total Expenditure 6.29 4.59 2.84 14.51 7.17 10.53
Profit Before Tax & Provisions 3.13 2.82 0.72 8.25 2.75 4.03
Net Interest Income 4.92 3.92 2.02 11.77 5.76 8.31
Cost to Income Ratio (%) 52.50 44.65 47.13 42.42 46.92 53.44
P A G E

25
Performance Highlights
Profit Before Tax (PBT) (` In cr.) 3.13 2.82 0.72 8.25 2.75 4.03
Provision for Taxation & DTL (` In cr.) 0.60 0.93 0.23 2.27 0.90 1.32
Profit After Tax (PAT) (` In cr.) 2.53 1.89 0.49 5.98 1.85 2.71
Earnings per share (EPS) 1.95 1.46 0.43 4.60 1.64 2.38
Gross NPA (` In cr.) 1.96 1.58 0.73 1.96 0.73 1.28
Gross NPA Ratio (%) 1.27 1.27 1.10 1.27 1.01 1.57
Net NPA (` In cr.) 0.98 0.85 0.37 0.98 0.37 0.98
Net NPA Ratio (%) 0.64 0.69 0.57 0.64 0.57 1.21
ParticularsDec’17 (3m)
Sep’17(3m)
Dec’16(3m)
Dec’17(9m)
Dec’16(9m)
Mar’17(12m)
Profit Before Tax & Provisions (` In cr.) 3.13 2.82 0.72 8.25 2.75 4.03
P A G E

Key Quarterly Data
26
(In )cr
P A G E
4.92
1.66
3.45
0.60
2.53
39.15
122.66
155.07
1.27
0.64
Dec-17
3.92
1.17
2.27
0.93
1.89
36.94
97.28
125.04
Sep-17
Income Statement Jun-16 Mar-17 Jun-17
NII 1.83 1.90 2.02 2.54 2.92Other Income 0.04 0.05 0.06 0.54 0.94Total Opex 0.87 0.92 1.37 1.81 1.55
Tax/ DTL 0.33 0.34 0.23 0.42 0.76Net Profit 0.67 0.69 0.48 0.85 1.55
Balance Sheet
Shareholders Funds 16.83 17.5 17.92 33.97 35.04Borrowings 42.28 48.85 59.39 75.04 69.28Loan book 51.97 58.13 66.13 81.83 100.04Total assets 61.39 68.19 79.45 112.45
NIM (%) 13.67 12.99 11.98 9.67CRAR/CAR (%) 49.10 49.30 44.20 72.70 65.60Gross NPA (%) 1.24 1.01 1.10 1.57 1.32Net NPA (%) 0.59 0.44 0.57 1.21 0.62
Sep-16 Dec-16
Jun-16 Mar-17 Jun-17Sep-16 Dec-16
Dec-17Sep-17
48.90
1.27
0.69
109.10
13.72
167.80
12.69
Dec-17
139.97
13.05
Sep-17Jun-17Mar-17Dec-16Key Ratios (Annualized) Jun-16 Sep-16
27
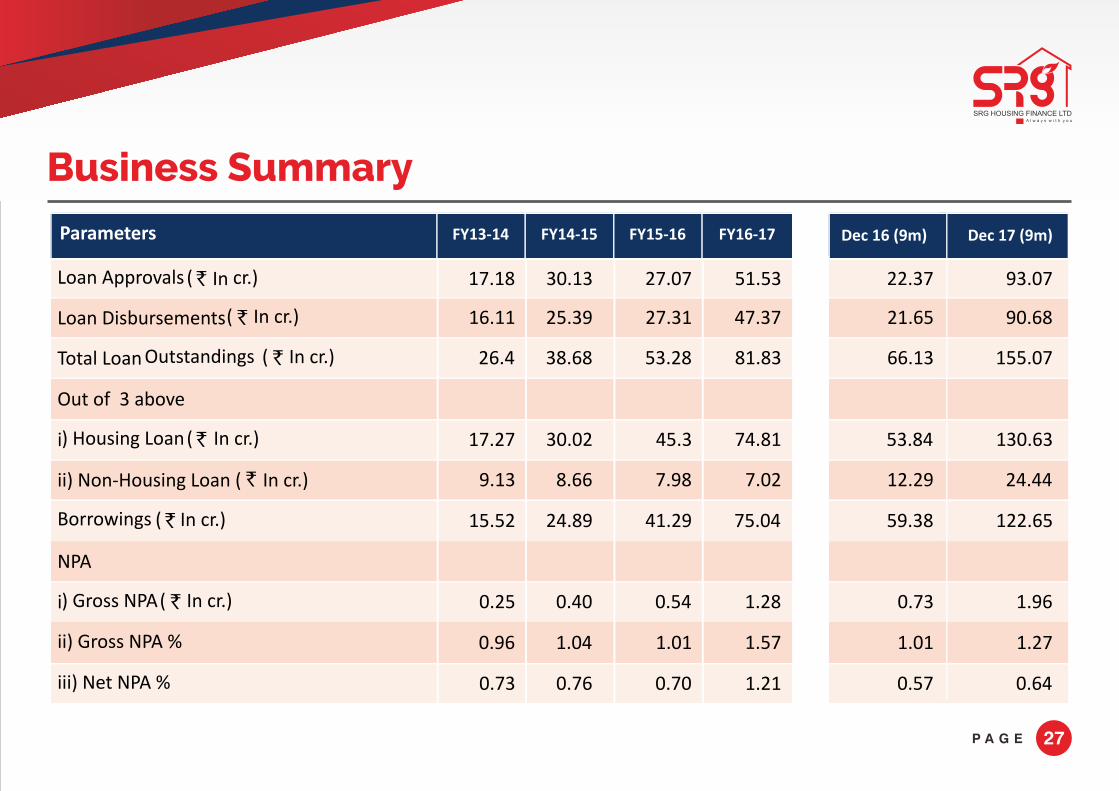
Business Summary
Parameters FY13-14 Dec 16 (9m) Dec 17 (9m)
Loan Approvals ( ̀ In cr.) 17.18 30.13 27.07 51.53 22.37 93.07
Loan Disbursements ( ` In cr.) 16.11 25.39 27.31 47.37 21.65 90.68
Total Loan Outstandings ( ` In cr.) 26.4 38.68 53.28 81.83 66.13 155.07
Out of 3 above
i) Housing Loan ( ̀ In cr.) 17.27 30.02 45.3 74.81 53.84 130.63
9.13 8.66 7.98 7.02 12.29 24.44
Borrowings ( ̀ In cr.) 15.52 24.89 41.29 75.04 59.38 122.65
NPA
i) Gross NPA ( ` In cr.) 0.25 0.40 0.54 1.28 0.73 1.96
ii) Gross NPA % 0.96 1.04 1.01 1.57 1.01 1.27
iii) Net NPA % 0.73 0.76 0.70 1.21 0.57 0.64
P A G E
FY14-15 FY15-16 FY16-17
ii) Non-Housing Loan ( ` In cr.)

28
Business Summary
Parameters FY 13-14 FY 14-15 FY 15-16 FY 16-17 Dec 16 (9m) Dec 17 (9m)
No. of Branches / Offices
i) Branches 9 9 19 271915
No. of Employees (Incl. Junior Officers on Contract, Excl. Sub Staff) 17 16 43 123
Total Employees 19 18 47 131
Sub staff 2 2 4 8
Interest Collected (` In Cr)
i) Housing Loan 5.05 8.60 17.18
ii) Non-Housing Loan 1.34 1.79 1.17 1.87
iii) Investments 0.00 0.00 0.11 0.45
Processing Charges ( ̀ In cr) 0.00 0.03 0.01 1.84
Other Income ( ` In cr) 0.00 0.00 0.03 1.42Total Income ( ` In cr)
51
55
4
11.97
1.89
0.17
0.49
0.03
32
35
3
8.38
1.80
0.03
0.00
0.04
9.92 22.76
P A G E
4.74 6.87
29
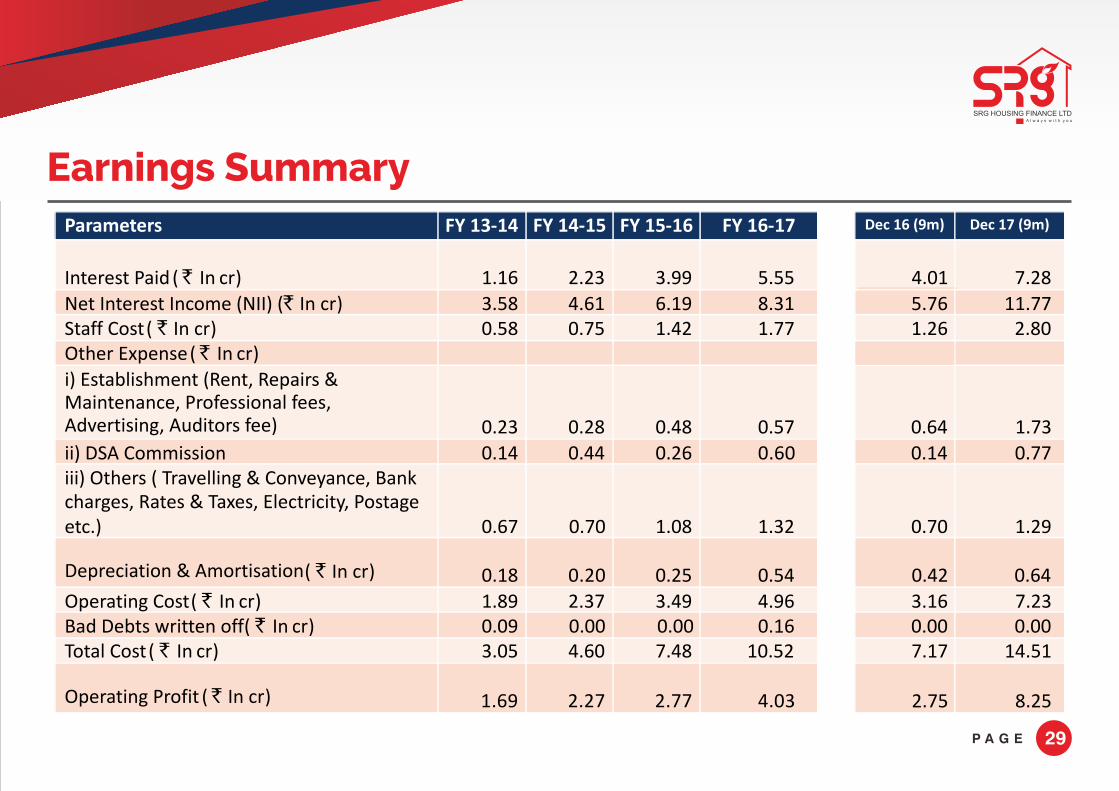
Earnings Summary
Parameters FY 13-14 FY 14-15 FY 15-16 FY 16-17 Dec 16 (9m) Dec 17 (9m)
Interest Paid ( ̀ In cr)
Net Interest Income (NII) ( ̀ In cr)Staff Cost ( ` In cr)Other Expense ( ̀ In cr)
iMaintenance, Professional fees, Advertising, Auditors fee)
) Establishment (Rent, Repairs &
ii) DSA Commissioniii) Others ( Travelling & Conveyance, Bank charges, Rates & Taxes, Electricity, Postage etc.)
( ` In cr)
Operating Cost ( ` In cr)Bad Debts written off ( ` In cr)Total Cost ( ` In cr)
Operating Profit ( ̀ In cr)
1.16
3.580.58
0.23
0.14
0.67
0.18
1.890.093.05
2.23
4.610.75
0.28
0.44
0.70
2.370.004.60
3.99
6.191.42
0.48
0.26
1.08
0.25
3.490.007.48
5.55
8.311.77
0.57
1.32
0.54
4.960.16
10.52
4.01 7.28
5.761.26
0.64
0.14
0.70
0.42
3.160.007.17
2.75
11.772.80
1.73
0.77
1.29
0.64
7.230.00
14.51
8.25
P A G E
Depreciation & Amortisation

30
Earnings Summary
Parameters FY 13-14 FY 14-15 FY 15-16 FY 16-17 Dec 16 (9m) Dec 17 (9m)
Provision & Taxes ( ` In cr)
Net Profit ( ` In cr)
Share Capital ( ` In cr)
Reserves ( ` In cr)
Shareholders Fund- Tier I ( ` In cr)
Earnings Per Share ( ` In cr)
0.5
1.19
8.08
5.60
13.68
0.81
1.48
Number of shares (In cr)
EBITDA
0.73
1.54
11.31
3.40
14.71
1.13
1.43
0.90
1.87
11.31
5.09
16.4
1.13
1.65
1.32
2.71
13.00
20.97
33.97
1.30
2.38
0.90
1.85
11.31
6.61
17.92
1.13
1.64
2.27
5.98
13.00
26.15
39.15
1.30
4.60
3.03 4.70 7.02 10.12 16.187.18
P A G E

31
Financial Ratios
Parameters FY 13-14 FY 14-15 FY 15-16 FY 16-17 Dec 16 (9m) Dec 17 (9m)
Return on Equity (ROE %) 9.12 10.82 12 10.75 *10.96 *20.94
Return on Average Assets (ROA %) 4.75 4.33 3.72 3.15 *2.74 *4.83
Net Interest Margin (NIM%) (Annualized) 14.24 13.02 12.35 9.67 11.98 12.69
Cost to Income Ratio (%) 49.78 51.16 55.77 53.44 53.54 46.69
Avg. Business Per Branch ( ` In cr) 2.93 4.30 3.55 4.31 3.48 5.74
Avg. Business Per Employee ( ` In cr) 1.55 2.42 1.67 1.60 1.53 1.26Average cost of Borrowings (% p.a) 12.9 13.15 13.15 11.61 12.63 10.57
Interest Spread (% p.a) 10.77 10.00 10.08 10.97 9.01 9.23
Capital Gearing Ratio (Shareholders fund/Debt) 0.88 0.59 0.40 0.45 0.30 0.31
Debt Equity Ratio 1.13 1.69 2.52 2.21 3.31 3.13
P A G E
*Not annualised.
32
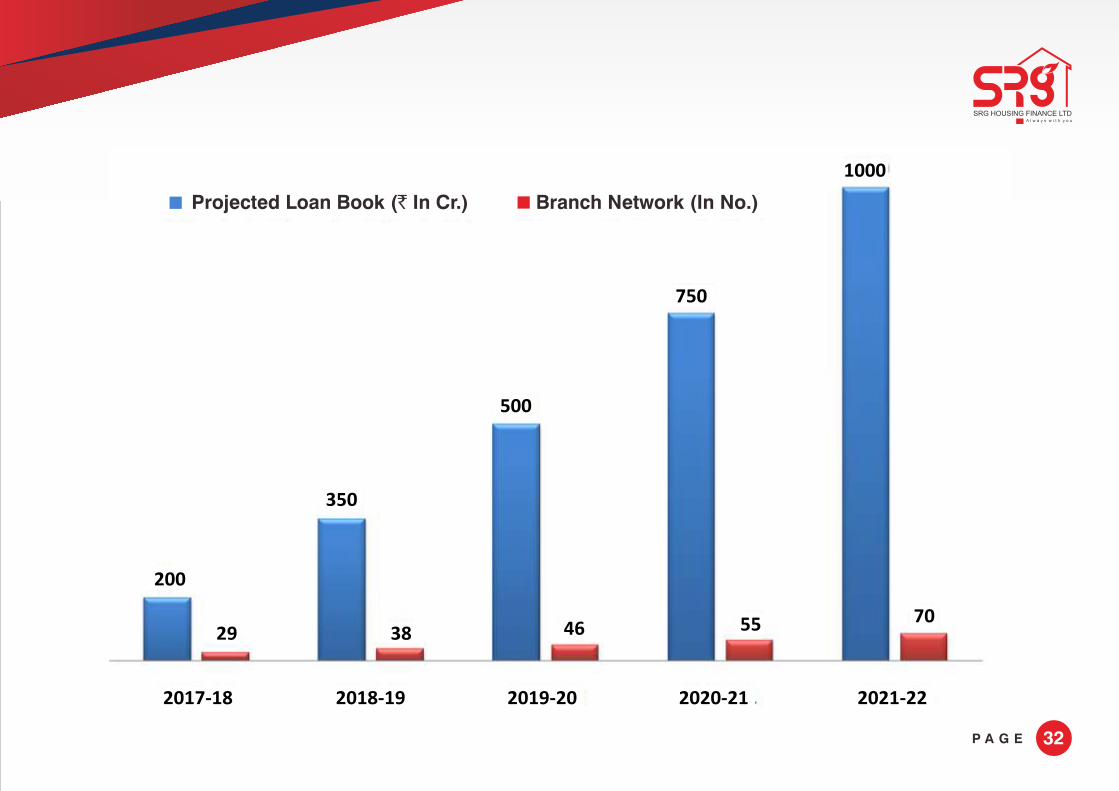
Projected Loan Book (` In Cr.) Branch Network (In No.)
29
P A G E
200
2017-18 2018-19
38
350
500
46 55
750
1000
70
2019-20 2020-21 2021-22

Thank You!