Analytics updates viewability, verification, visual analytics
sRADAR: A Complex Event Processing and Visual AnalyticsSystem for Maritime Intelligence
Naveen Nandan Baljeet Malhotra∗ Daniel Dahlmeier
SAP Research and Innovation, CREATE #14University Town, 1 Create Way, Singapore 138602
[email protected] [email protected] [email protected]
Abstract
Maritime Intelligence is about empowering users ina port ecosystem with data and visual analytics toincrease the efficiency and effectiveness of maritimeoperations. In this context, discovery and visualiza-tion of ship domain violations based on the analy-sis of trajectories generated by ships could serve im-portant navigational and business purposes. Findingpatterns of domain violations in a large trajectorydatabase, however, is a non-trivial task, primarily dueto the combinatorial nature of the problem. In thispaper, we present a system, sRADAR, which mod-els such trajectories, applies complex event process-ing on the data streams to identify such domain viola-tions, performs analytics to derive useful insights intothe recorded data, and helps visualizing the result ofsuch geo-spatial analytics. To evaluate our proposal,we setup an Automatic Identification System for col-lecting real trajectories of ships arriving at the portof Singapore. We discuss some preliminary resultson domain violations and the efficiency of our systemusing the real-time data collected by our system.
Keywords: Anomaly detection, Complex event pro-cessing, Maritime Intelligence, Visual analytics.
1 Introduction
Interactions between ships are an important area ofresearch in marine navigation science and traffic en-gineering. According to the International MaritimeOrganization, 90% of the global trade is transportedby sea, and as the global trade is increasing, ship colli-sion avoidance will become more important than everbefore. In this context, ship safety domain is a keyconcept that essentially prescribes an area around aship that must not be intruded by any other ships forsafe navigation. Ship safety domain is very critical,not only to enhance the navigation safety, but alsoto protect the lives of crew members and the serenityof marine environment. When a ship enters into thesafety domain of another ship, it is generally calledship brushing or domain violation. Apart from jeopar-dizing human and financial losses, ship brushing mayhave serious implications on international relations.
∗Corresponding Author.
Copyright c©2013, Australian Computer Society, Inc. This pa-per appeared at the Eleventh Australasian Data Mining Con-ference (AusDM 2013), Canberra, 13-15 November 2013. Con-ferences in Research and Practice in Information Technology(CRPIT), Vol. 146, Peter Christen, Paul Kennedy, Lin Liu,Kok-Leong Ong, Andrew Stranieri and Yanchang Zhao, Ed.Reproduction for academic, not-for-profit purposes permittedprovided this text is included.
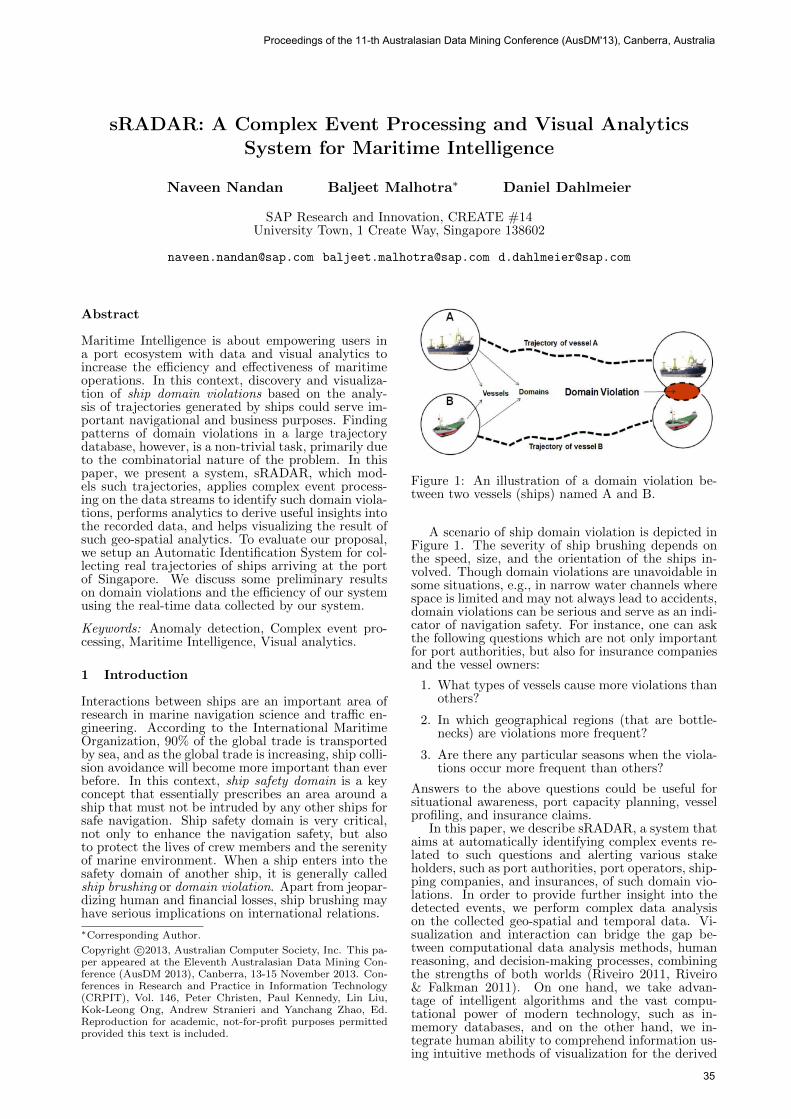
Figure 1: An illustration of a domain violation be-tween two vessels (ships) named A and B.
A scenario of ship domain violation is depicted inFigure 1. The severity of ship brushing depends onthe speed, size, and the orientation of the ships in-volved. Though domain violations are unavoidable insome situations, e.g., in narrow water channels wherespace is limited and may not always lead to accidents,domain violations can be serious and serve as an indi-cator of navigation safety. For instance, one can askthe following questions which are not only importantfor port authorities, but also for insurance companiesand the vessel owners:
1. What types of vessels cause more violations thanothers?
2. In which geographical regions (that are bottle-necks) are violations more frequent?
3. Are there any particular seasons when the viola-tions occur more frequent than others?
Answers to the above questions could be useful forsituational awareness, port capacity planning, vesselprofiling, and insurance claims.
In this paper, we describe sRADAR, a system thataims at automatically identifying complex events re-lated to such questions and alerting various stakeholders, such as port authorities, port operators, ship-ping companies, and insurances, of such domain vio-lations. In order to provide further insight into thedetected events, we perform complex data analysison the collected geo-spatial and temporal data. Vi-sualization and interaction can bridge the gap be-tween computational data analysis methods, humanreasoning, and decision-making processes, combiningthe strengths of both worlds (Riveiro 2011, Riveiro& Falkman 2011). On one hand, we take advan-tage of intelligent algorithms and the vast compu-tational power of modern technology, such as in-memory databases, and on the other hand, we in-tegrate human ability to comprehend information us-ing intuitive methods of visualization for the derived
Proceedings of the 11-th Australasian Data Mining Conference (AusDM'13), Canberra, Australia
35

knowledge. To track the position of ships, we rely onthe Automatic Identification System (IMO 2001) orAIS for short, which provides a rich source of dataon ships’ identification, trajectories, navigation sta-tus and others. The AIS technology is explained inmore detail in Section 3.
The rest of the paper is organized as follows. Sec-tion 2 presents a discussion on the related work in thecontext of trajectory data mining and analytics. Insection 3, we present an overview of the system andthe details of our experimental setup. In the follow-ing section 4, we discuss the architecture and othertechnical details of the sRADAR system. Section 5presents the details of the analytics visualization andreporting component of the system. The paper is con-cluded in section 6.
This paper discusses the preliminary approachtaken towards building a solution for the maritimescenario. In building this prototype, we use and ex-ploit some of the capabilities of in-memory databasetechnology and front-end technology, HANA c© andUI5 c© respectively, offered by SAP.
2 Related Work
Many researchers have extensively used maritimedata specifically generated by the AIS for trajectorydata mining (Li et al. 2010). The AIS data has alsobeen used to study a spectrum of multidisciplinaryproblems such as maritime emission control (Perezet al. 2009), anomaly detection and risk assessments(Ristic et al. 2008, Laxhammar et al. 2009, Jakobet al. 2010), complex network analysis (Kaluza & et.al. 2010), and others (Malhotra et al. 2011).
Trajectory data mining is an emerging and rapidlydeveloping topic in the area of data mining that aimsat discovering patterns of trajectories based on theirproximity in either a spatial or a spatio-temporalsense. As ships keep moving and continuously gen-erate trajectory data, mining their trajectories playsan important role in maritime data management (Al-vares et al. 2007, Andrienko et al. 2007, de Vries et al.2010, Giannotti et al. 2007, Lee et al. 2008, Li et al.2010). For instance, at a commercial port wherehundreds of vessels may enter or leave the port orwait to do so, collision avoidance is of utmost impor-tance (Statheros et al. 2008).
Trajectory data mining methods can also be em-ployed to discover mobility, traffic and congestion pat-terns which can then be used for situational aware-ness (Alvares et al. 2007). Based on the movementpatterns, trajectories (and the vessels spanning them)can be clustered into groups to access the interactionsbetween them and their collision risks (Li et al. 2010,de Vries & van Someren 2008). Furthermore, modelscan be built based on the discovered patterns to engi-neer monitoring systems such as the one proposed in(Piciarelli & Foresti 2006), which can then be used todetect anomalies (e.g., the trajectory of a particularship that is not adhering to the guidelines) in real timeto warn the authorities immediately. In (Perez et al.2009), the authors discussed the challenges of datamanagement, analysis, and the problems of missingdata in the AIS datasets while proposing potentialmethods for addressing the limitations. Yet anotherstudy (Malhotra et al. 2011), discusses the manage-ment of the AIS data streams from the perspective ofprivacy and access control.
The purpose of this paper is not to conduct an in-depth survey of works that deal with the above datamining techniques or to focus on trajectory analy-sis based on the AIS data. Rather we pay attention
Field Description
MMSI Mobile Marine Service Identifier.9 digit identifier for a vessel’s AIS.
Navigation For example, under way usingStatus engine, at anchor, engaged in fishing.
Rate of Turn Turning rate in degrees per minute.
Speed Speed of vessel in knots.
Longitude Longitude position of vessel.
Latitude Latitude position of vessel.
Table 1: Data fields in AIS message types 1 to 3.
to the particular problem of domain violations thatcould serve various purposes. We also focus on visual-ization and reporting mechanisms that are importantfor analyzing the brushing incidents (in particular inport waters) for various stake holders of a port ecosys-tem as mentioned previously.
3 AIS Overview
The Automatic Identification System (AIS) (IMO2001)) is an automatic identification and tracking sys-tem for maritime vessels. The primary purpose ofAIS is to improve navigation safety and avoid colli-sions between vessels. It allows ships and stations tobroadcast messages that contain information about aship’s navigational status, position course and speed,among many others. The primary purpose for AISis navigation safety and traffic control. The Interna-tional Maritime Organization (IMO) requires all in-ternational voyaging ships with a gross tonnage of300 or more tons and passenger ships to have an Au-tomatic Identification System (AIS) installed.
AIS messages are broadcasted through VHS ra-dio equipment. AIS messages can be received byother ships and by vessel traffic services stations inthe vicinity (typically within 40 nautical miles). Asa matter of fact, AIS messages can be received byanyone in range using an appropriate receiver anddecoding hardware and software. The AIS protocolspecifies 27 different message types which carry dif-ferent information, for example ship navigation infor-mation, base station reports, information about shipsize and dimensions, and search-and-rescue aircraftreports. In practice, we observe that AIS messagetypes 1 to 3, which are position reports for navigationpurposes, are used more frequently than the othermessage types. Table 1 shows some of the importantfields contained in AIS message types 1 to 3. It isworth noting that AIS does not infer the position ornavigational status of the ship automatically. AIS ismerely a radio technology for broadcasting a ship’sinformation, which has to be provided by other sen-sors on-board that ship, for example its GPS device.
3.1 Experimental Setup
The AIS data can be collected from an AIS communi-cation network while using a multi-layer system typ-ically consisting of a Complex Event (Stream) Pro-cessing Engine (CEP) (Arasu et al. 2003, Abadi et al.2003) and a database system for processing, storing
CRPIT Volume 146 - Data Mining and Analytics 2013
36

Figure 2: Experimental setup for data collection.
and analysis of the AIS data. At SAP Research, wehave setup an AIS station to collect data from theships arriving at the port of Singapore. The overallinfrastructure of the setup is shown in Figure 2.
The captured AIS data is being processed and an-alyzed using a specialized complex processing engine(CEP). CEPs usually do not store data permanently,however, they allow access to traditional databasessuch as Oracle c© and SQL Server c© for data stor-age and processing purposes. We interfaced our CEPwith HANA c©, which is SAP’s in-memory databaseappliance. Next, we describe the overall system archi-tecture of the sRADAR system that we built for com-plex event processing based on AIS data and visualanalytics for the purpose of maritime intelligence.
4 sRADAR Architecture
The proposed system consists of the following fourmain components:
1. AIS decoder,
2. rule engine,
3. real-time database,
4. visualization and reports.
Figure 3 shows the overall architecture of the system.We describe each component in turn.
4.1 AIS Decoder
The AIS messages are encoded in a binary format andhence, need to be decoded for further processing toidentify information about the ships and their loca-tion. For this, we stream the AIS messages to an AISdecoder on the application server via UDP. The AISdecoder acts as a listener and as each message arrives,applies a decoding algorithm and stores the informa-tion to the database for future analysis. The decoderalso forwards the ship information to the rule enginein order to perform on-the-fly computations, such asevent detection.
Figure 3: Overall architecture of the system.
4.2 Rule Engine
The rule engine has predefined rules, such as vesselbrushing detection, vessel zone entering, vessel zoneleaving, etc. As the decoded AIS messages arrive atthe rule engine, each of the rules is applied to everymessage and if it matches the defined constraint, anevent is fired that contains the relevant informationabout the detected event, for example the location,the identifier of the ships involved, and the time. Thedetected events are stored in the database which isused for further analytics as well as reporting andvisualization.
4.3 Real-Time Database
The database layer for the system is implemented inSAP HANA c© which is highly effective for temporalanalysis of geo-spatial data. The database acts asboth data store for the event detection phase and asthe analytical engine for complex queries which aredescribed in the following section. The initial systemprototype makes use of JDBC calls to interact withthe database, but going forward we are investigatingon exploiting the geo-spatial capabilities of HANA c©.
4.4 Visualization and Reports
The visualization layers for the prototype are builtusing a mix of SAP UI5 c© for the real-time shipmovements, event reports and drawing zones for geo-fencing, CVOM c©, bundled within UI5 c©, for analyt-ical charts and Leaflet c© for the event heatmap andderived event trajectory visualization. We consideredvisualization to be one of the most important compo-nents of the sRADAR system as visual analytics arenot only important for reporting incidents, but alsofor situational awareness. To that end, we discuss theVisual Analytics in detail in the following section.
5 Visual Analytics
The system allows users to visualize data in differentmodes.
1. Real-time Ship Movement
2. Event Reports
3. Analytical Charts
4. Event Heatmap
Proceedings of the 11-th Australasian Data Mining Conference (AusDM'13), Canberra, Australia
37

Figure 4: Real-time visualization of ships and inter-face to perform various actions such as drawing ofzones.
Figure 5: User interface for the selection of detectedevents based on various criteria such as ship/zonetypes, timeline, country of origin and so on.
5. Event Spatial Clustering
6. Brushing Event Trajectory
5.1 Real-time Ship Movement
The decoded AIS messages contain information aboutthe position of ships. As a new AIS message arrives,the system identifies the source and checks if that spe-cific ship has been identified before. If the ship hasnot been detected before, we store the information inthe database along with its latest position. In casethe ship already exists in the database, a compari-son is made with its previous reported position andif this has changed, the latest position is updated. Inboth cases, the updated position is returned to thefrontend which in turn plots the ship on a map. Themapping API used for this real-time plot is providedby ESRI c©. Apart from plotting objects on the map,the front-end can also be used to draw and definezones for geo-fencing. This is illustrated in Figure 4.
5.2 Event Reports
The events triggered are stored in the database withinformation on time of occurrence, event type, posi-tion of the ship, details of other ships involved in theevent, zone information, if any, and so on. These arepresented to the user in the form of tabulated reports.This service is available on demand i.e., the query istriggered when user requests through the UI and pop-ulated in tabular format accordingly. An example ofthe event report UI is shown in Figure 5.
Figure 6: Analytical charts that present ship eventsby zone and event types.
5.3 Analytical Charts
As the decoded AIS data grows in volume, the amountof events detected also increase proportionally. Thismakes it difficult to query for all the events and rep-resent them in a report format. For this reason, wemake use of the interactive charting library CVOM c©to present such information in a more intuitive fash-ion. The queries that populate the charts aggregateevents by ship type, event type, etc. and help theusers to get a broader insight into the recorded data.This would in turn help the user to identify out-liers and move into investigating further based on theknowledge gained.
The frontend makes use of REST calls to the back-end that fire the query every few seconds, thereby,ensuring real-time updates. The data is populatedon the charts only if there is a change in state of theresult, making the process of calculation and retrievalquite efficient. Figure 6 shows examples of analyticalcharts from our system.
5.4 Event Heatmap
When a large number of data points are involvedthat are geo-spatially distributed, plotting each ofthem was found to be inefficient. After investigat-ing further, using heatmaps was found to be a com-mon method of presenting the density of an aggre-gate of spatially distributed points. We make useof the heatmap.js javascript library which is used as
CRPIT Volume 146 - Data Mining and Analytics 2013
38

Figure 7: Visualization of a heatmap based on de-tected events.
Figure 8: Visualization of spatially clustered eventsbased on various zoom levels.
a layer atop leaflet.js, a mapping solution that inte-grates with OpenStreet c© maps.
The user is allowed to select a specific event type,on which a REST call is made to query the databaseand retrieve a distribution of all points in space ofthat specific event. The returned points are plottedas a heatmap with the color intensity depicting thedensity of points returned. An example heatmap isshown in Figure 7.
5.5 Event Spatial Clustering
Another method to visualize a large number of spa-tially distributed points was to make use of themarker clustering API of Leaflet. By using this, weare able to cluster the number of events and displaythem as a collective point with an aggregated count,which in turn is controlled by the zoom level of themap. When the user zooms in, the clusters break-down and render into individual points or smallerclusters as shown in Figure 8.
5.6 Brushing Event Trajectory
Brushing between ships was identified to be one of themajor concerns at busy ports such as Singapore. Wedefine a prior rule to detect brushing events betweenships which is triggered when two ships violate thespace constraint. The constraint is usually defined asthe minimum distance that is to be maintained be-tween any two ships. This minimum distance variesfrom ship to ship and takes into account the typeand dimensions of the ship. An event is triggeredand stored in the database for violation of such con-straints with information on the ships involved, thetime when the event occurs, the information on thezone in which the event occurred, if any, and the posi-tion of the ship. For every brushing event, two recordsare generated, one for each ship. Also, based on theduration of brushing there could be multiple recordsof the same event that is being recorded with differenttimestamp and position logs. Initially we present tothe user a report of all such logs in tabular format,which was useful when the number of brushing eventsdetected were quite low. But as more and more ofsuch events were detected, the number of such recordsin the database grew large and representing them intabular format was not always useful. For instance,
Figure 9: A scenario depicting multiple brushingevents and a method to aggregate them based on timewindows.
if our system detects brushing events between ship Aand ship B for a period of 1 hour, based on the fre-quency of AIS messages received from these ships, wewould have multiple entries of the same event with avariation in timestamp and position of the ships. Al-though this was accurate and represented the actualsituation, from the user’s perspective, it would notbe useful to know that this event occurred multipletimes.
To tackle this problem, and present the informa-tion to the user in a more intuitive form, we developedan algorithm to aggregate such events based on a timeinterval. A query is generated to aggregate all eventsof this type for each ship based on a time window.The definition of the interval for the time window isset based on studying the frequency of such events.Figure 9 represents the definition of the threshold be-tween consecutive events. Here, e1, e2, e3, e4, e5are the event records as detected by the rule engineand stored in the database. The algorithm aggregatesthese events as a single brushing incident E1 or as twodifferent brushing incidents E1 and E2 based on thevariation of the threshold ε0. In this way, multiple en-tries of the same brushing event that are recorded canbe reported to the user as an aggregated event. Oneof the methods to present this information to the useris as before, using tabulated reports with the follow-ing attributes: Ship1, Ship2, Start Time, End Time,Brush Duration, Start Position, End Position. An-other method is to directly visualize the trajectory ofthe incident on a map. This is done by returning theresult in GeoJSON standard format to the frontendLeaflet layer.
6 Conclusion
The system developed serves as a research prototypefor maritime intelligence using AIS broadcast mes-sages recorded from the ships around the port of Sin-gapore, one of the busiest ports in the world. The ca-pabilities of technologies such as in-memory databasescan be further exploited for analytics on such largedata volumes to detect anomalies in maritime traf-fic. In the future, the system will run analytics onmultiple other data sources that provide accurate po-sition information such as radar, surveillance cam-eras, etc. As the system for collecting and analyz-ing AIS messages is in place, further research focus
Proceedings of the 11-th Australasian Data Mining Conference (AusDM'13), Canberra, Australia
39

would be in the direction of applying and develop-ing learning algorithms to detect domain violationsautomatically, rather than handcrafting them. Also,the developed prototype is currently being evaluatedby various stakeholders and further changes would bemade based on the feedback.
7 Acknowledgment
We would like to thank the Economic DevelopmentBoard of Singapore and National Research Founda-tion of Singapore for partially supporting this re-search. Our thanks are also due to SAP COIL andSAP HANA Solutions teams in Singapore for provid-ing infrastructure support.
References
Abadi, D. J., Carney, D., Cetintemel, U., Cherniack,M., Convey, C., Lee, S., Stonebraker, M., Tatbul,N. & Zdonik, S. B. (2003), ‘Aurora: a new modeland architecture for data stream management’, TheVLDB Journal 12(2), 120–139.
Alvares, L. O., Bogorny, V., de Macedo, J. A. F.,Moelans, B. & Spaccapietra, S. (2007), Dynamicmodeling of trajectory patterns using data miningand reverse engineering, in ‘Proc. of the Int. Conf.on Conceptual Modeling (ER2007)’, pp. 149–154.
Andrienko, G., Andrienko, N. & Wrobel, S. (2007),‘Visual analytics tools for analysis of movementdata’, ACM SIGKDD Explorations 9(2), 38–46.
Arasu, A., Babcock, B., Babu, S., Datar, M., Ito, K.,Nishizawa, I., Rosenstein, J. & Widom, J. (2003),Stream: The stanford stream data manager, in‘Proc. of SIGMOD’.
de Vries, G. K. D., van Hage, W. R. & van Someren,M. (2010), Comparing vessel trajectories using ge-ographical domain knowledge and alignments, in‘Proc. of the ICDM Int. Workshop on Spatial andSpatiotemporal Data Mining (SSTDM)’, pp. 209–216.
de Vries, G. & van Someren, M. (2008), Unsupervisedship trajectory modeling and prediction using com-pression and clustering, in ‘Proc. of the Belgian-Netherlands Conf. on Artificial Intelligence’, pp. 7–12.
Giannotti, F., Nanni, M., Pinelli, F. & Pedreschi, D.(2007), Trajectory pattern mining, in ‘Proc. of theACM Int. Conf. on Knowledge Discovery and DataMining (KDD)’, pp. 330–339.
IMO (2001), Guidelines for the onboard operationaluse of shipborne automatic identification systems(ais), as amended by itu-1371. resolution a.917(22),Technical report, International Maritime Organiza-tion.
Jakob, M., Vanek, O., Urban, S., Benda, P. & Pe-choucek, M. (2010), Employing agents to improvethe security of international maritime transport, in‘Proc. of the Int. Conf. on Autonomous Agents andMultiagent Systems’, pp. 29–38.
Kaluza, P. & et. al. (2010), ‘The complex network ofglobal cargo ship movements’, The Journal of theRoyal Society Interface 7, 1093–1103.
Laxhammar, R., Falkman, G. & Sviestins, E. (2009),Anomaly detection in sea traffic - a comparison ofthe gaussian mixture model and the kernel densityestimator, in ‘Proc. of the 12th Int. Conf. on Infor-mation Fusion’, pp. 756–763.
Lee, J., Han, J. & Li, X. (2008), Trajectory out-lier detection: A partition-and-detect framework,in ‘Proc. of the Int. Conf. on Data Engineering(ICDE)’, pp. 140–149.
Li, Z., Lee, J.-G., Li, X. & Han, J. (2010), Incrementalclustering for trajectories, in ‘Proc. of Int. Conf.on Database Systems for Advanced Applications’,pp. 32–46.
Malhotra, B., Tan, W.-J., Cao, J., Kister, T., Bres-san, S. & Tan, K.-L. (2011), Assist: Access con-trolled ship identification streams, in ‘Proc. of the19th ACM SIGSPATIAL Int. Symposium on Ad-vances in Geographic Information Systems (GIS)’,pp. 485–488.
Perez, H., Chang, R. & Billings, R. (2009), Automaticidentification systems (AIS) data use in marine ves-sel emission estimation, in ‘Proc. of the 18th An-nual Int. Emission Inventory Conference’.
Piciarelli, C. & Foresti, G. L. (2006), ‘On-line tra-jectory clustering for anomalous events detection’,Pattern Recognition Letters pp. 1835–1842.
Ristic, B., Scala, B. L., Morelande, M. & Gordon, N.(2008), Statistical analysis of motion patterns inAIS data : Anomaly detection and motion predic-tion, in ‘Proc. of the 11th Int. Conf. on InformationFusion’, pp. 40–46.
Riveiro, M. & Falkman, G. (2011), The role of vi-sualization and interaction in maritime anomalydetection, in ‘IS&T/SPIE Electronic Imaging’,International Society for Optics and Photonics,pp. 78680M–78680M.
Riveiro, M. J. (2011), Visual analytics for maritime
anomaly detection, PhD thesis, Orebro University.
Statheros, T., Howells, G. & McDonald-Maier, K.(2008), ‘Autonomous ship collision avoidance navi-gation concepts, technologies and techniques’, TheJournal of Navigation 61, 129–142.
CRPIT Volume 146 - Data Mining and Analytics 2013
40