Sr.-ECTRICAL PEAKING AND: HOURLY lIUOWATT CONSUMPTION … · tive watt reoorder, a standard...
43
THE EFFECTOr FEEDBACK ON RESIDENTIAL Sr.-ECTRICAL PEAKING AND: HOURLY lIUOWATT CONSUMPTION An abstraot. of a Thesis by Elbert 8la.kely Februli,ry 1978 Drake University Advisor: Kenneth E. Lloyd The eroblem.. Elect.rioit.y consum.ption researoh has primarilY'Tnvestlgated prooedures desig:ned to deorease overall kilowat.t hour (KWH) oonsumption. Only one st.udy has reported. the effeots of a procedure on the pattern of eleotricit.y consumption" 'fbe present study assessed the effects of feedback on ItWB consumption and the consumption pattern. Procedure. The present study oompared the effects of a £eedEack 11ght and buzzer, which signalled high con- sumption in any 15 min period of the day, with an initial and final baseline period where no feedback was given. Three volunteer families served as subjects. Five measures of overall consumption were used. Findinis. Each consumption measure decreased during Feedback-lor all families. When feedback was withdrawn in the final Baseline period for two families, all measures from one family and one measure from the other family re- turned to the initial Baseline levels. The oonsumption pattern during Feedback remained unchanged.in one family and ohanged in another family when compared to Baseline. Conclusions. Feedback aan decrease overall 1(W consumptIon and change the consumption pattern. Reoomm.endations. Further research could assess the effectS 01 ot.her procedures on eleattiaity consumption and ident.ify other kinds of changes in the consumption pattern.
Transcript of Sr.-ECTRICAL PEAKING AND: HOURLY lIUOWATT CONSUMPTION … · tive watt reoorder, a standard...
THE EFFECTOr FEEDBACK ON RESIDENTIAL Sr.-ECTRICALPEAKING AND: HOURLY lIUOWATT CONSUMPTION
An abstraot. of a Thesis byElbert 8la.kely
Februli,ry 1978Drake University
Advisor: Kenneth E. Lloyd
The eroblem.. Elect.rioit.y consum.ption researoh hasprimarilY'Tnvestlgated prooedures desig:ned to deoreaseoverall kilowat.t hour (KWH) oonsumption. Only one st.udy hasreported. the effeots of a procedure on the pattern ofeleotricit.y consumption" 'fbe present study assessed theeffects of feedback on ItWB consumption and the consumptionpattern.
Procedure. The present study oompared the effectsof a £eedEack 11ght and buzzer, which signalled high consumption in any 15 min period of the day, with an initialand final baseline period where no feedback was given.Three volunteer families served as subjects. Fivemeasures of overall consumption were used.
Findinis. Each consumption measure decreased duringFeedback-lor all families. When feedback was withdrawn inthe final Baseline period for two families, all measuresfrom one family and one measure from the other family returned to the initial Baseline levels. The oonsumptionpattern during Feedback remained unchanged.in one familyand ohanged in another family when compared to Baseline.
Conclusions. Feedback aan decrease overall 1(W
consumptIon and change the consumption pattern.
Reoomm.endations. Further research could assess theeffectS 01 ot.her procedures on eleattiaity consumption andident.ify other kinds of changes in the consumption pattern.

THE EFFECT OF FEEDBACK ON USIDENTnL ELECTRICAL
PEAKING AND HOURLY KILOWA'!"I' CONSUMPTION
A Theais
Presented to
The School of Graduate Studies
Drake University
In Partial Fulfillment
of the Requirements for the Degree
Master of Arts
by
Elbert Blakely
February 1978

THE EFFECT OF FEEDBACK ON RESIDENTIAL ELECTRICAL
PEAKING AND HOURLY KILOWATT CONSUMPTION
by
Blberot Blakely
Approved by Commit:tee:
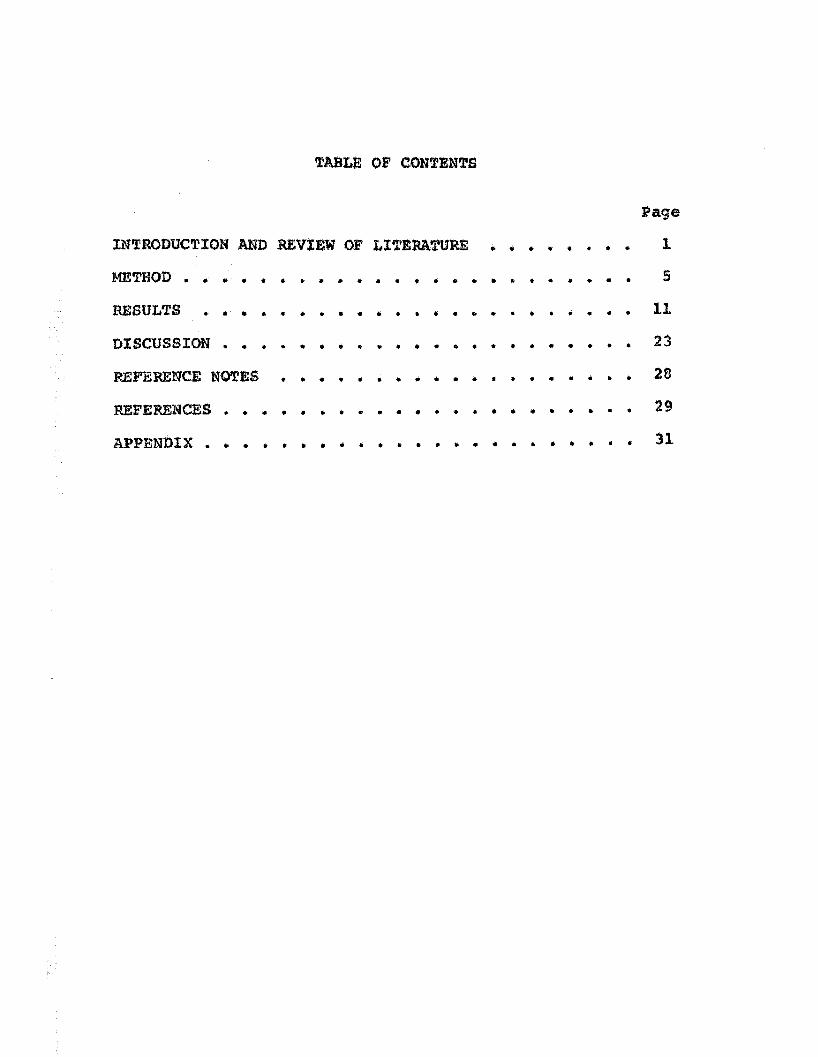
TABLE OF' CON!:D'1'S
Page
INTRODUCTION .AND REVIEW OJ' LI'1'EBAI'J.'t.1'RE .. .. .. .- .. " " .. 1
METHOD " .. .. .. .. " .. .. " .. .. .. ., .. .. ., .. .. .. .. .. .. .. 5
RESULTS .. .- .. .. .. .. .. .. .. .. .. .. ., .. ., ., .. .. .. ., .. .. .. 11
DISCUSSION .. .. ., ., .. .. ., ., ., .. .. .. ., • ., • ., ., .. .. .. 23
REFERENCE NOTES .. .. .. .. .. .. .. .. .. .. .. .. .. .. .. .. • .. .. 28
REFERENCES .. ., ., .. .. .. .. ., .. .. .. .. .. .. .. .. .. .. .. .. .. .. 29
APPENDIX . ., .. .. • .. .. .. • .. .. .. .. .. .. .. .. .. .. .. .. .. .. 31
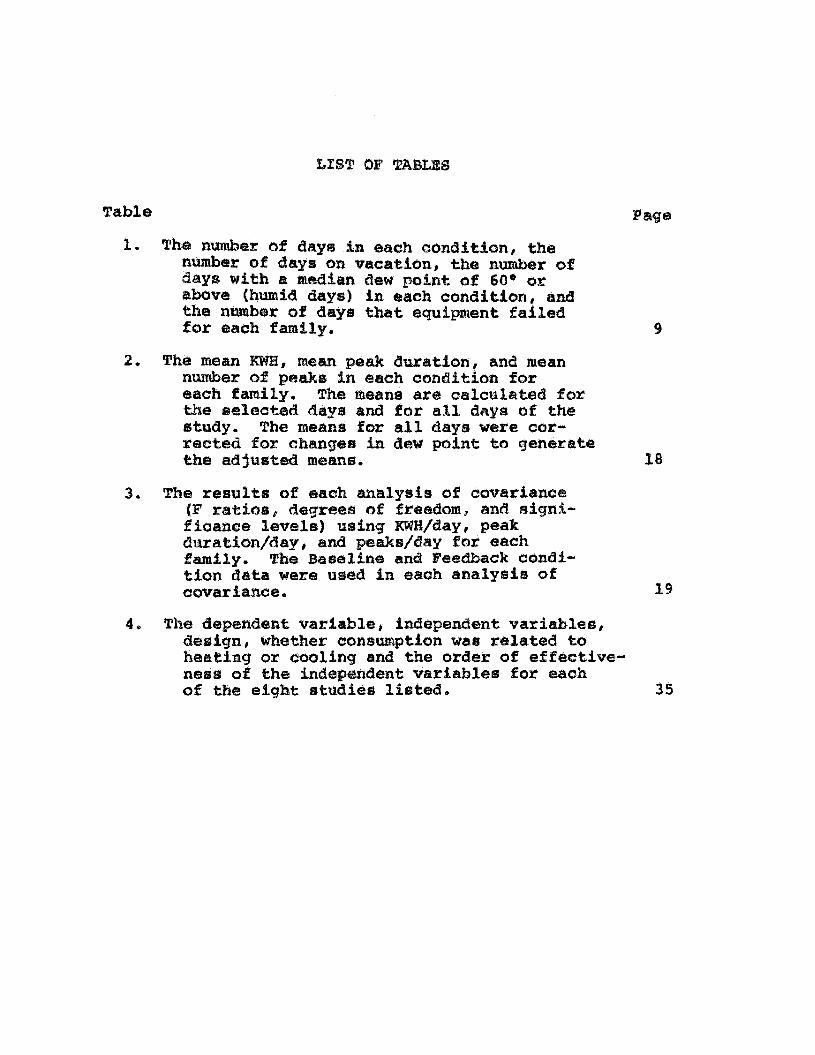
Table Page
1.. Th.enumber of days in each 00nd11:10n, thenumber of days on "aoation, 'the number ofdays with. a ~edian dew point of 60· orabove (humid days) in each oondition, andthe number of days that equipment failedfor each family. 9
2. The mean KWH, mean peak duration I and meannumber of peaks in each oondition foreaoh family. Th.e means are aaloulated forthe selected days and for all days of thestudy. The means for all clays were correct.ed for chang-es in dew point to g-enerate1:he adjusted means. 18
3. The result.s of each analysis of covarianoe(F ratios, degrees of freedom, and sig'nifioance levels) using KWH/day, peakduration/day I and peaks/d.ay for eachfamily. The Saseline and Feedbaok condition data were used in each analysis ofcovarianoe. 19
4. The dependent variable, independent variables,design, whether oonsum.ption was related toheating or cooling and the order of effectiveness of the independent variables for eaohof the eiqht studies listed. 35

LIST OF FIGURES
Figure
1.. The number of peaks and the median dew pointfor all days of the study for all families ..The arro1llS indioate the days that t.hejudges selected as being equal 1IIith respectto dew point.
2.. Mean equated KWH oonsumed, dew point, peakduration, KWH above peak oriterion andnumber of peaks for all oonditions in eaohfamily for dew point equated days ..
3.. Median KWH oonsumption per hour ot the dayfor all humid days for t.he three experimental conditions in each family ..
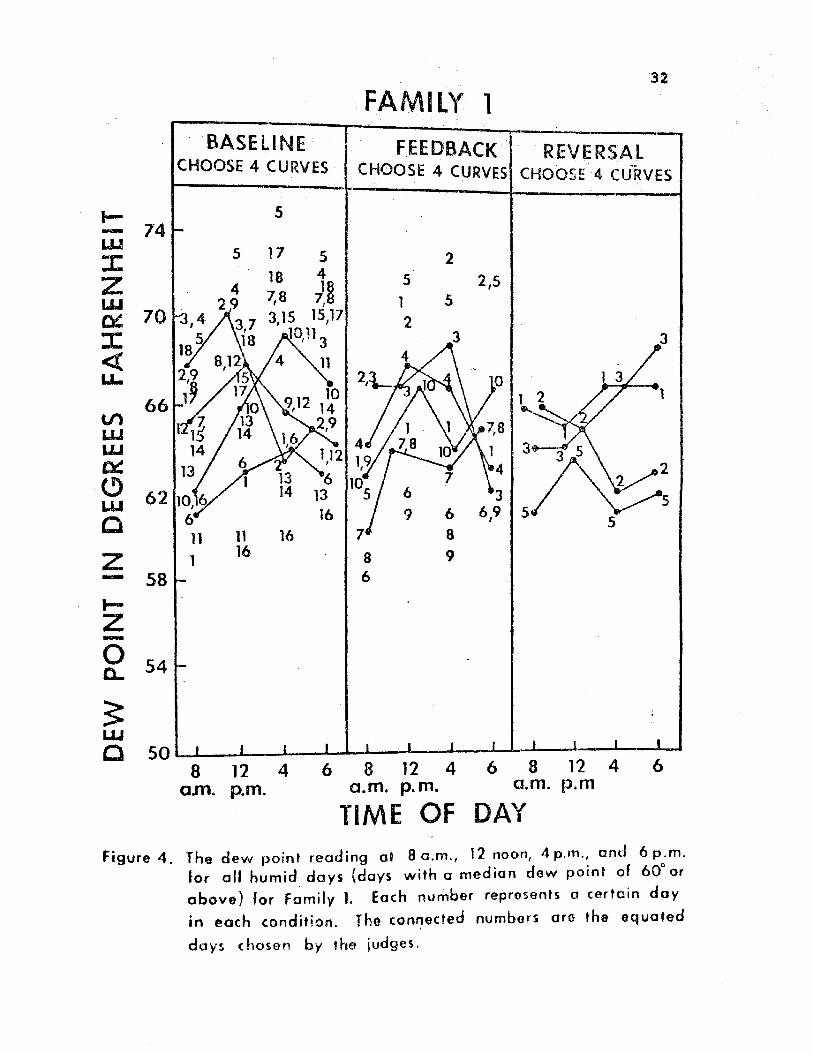
4. The dew poi.nt reading at 8 a.m., 12 noon,4 p .. m., and (5 p.m. for all humid days(days with a median dew poi.nt of 60· or above)for Family 1. Eaah number represents a cer....1:a1.n day in eaoh oontiition. The oonneotednwntJers are the equat.ed days choaen by thejudges ..
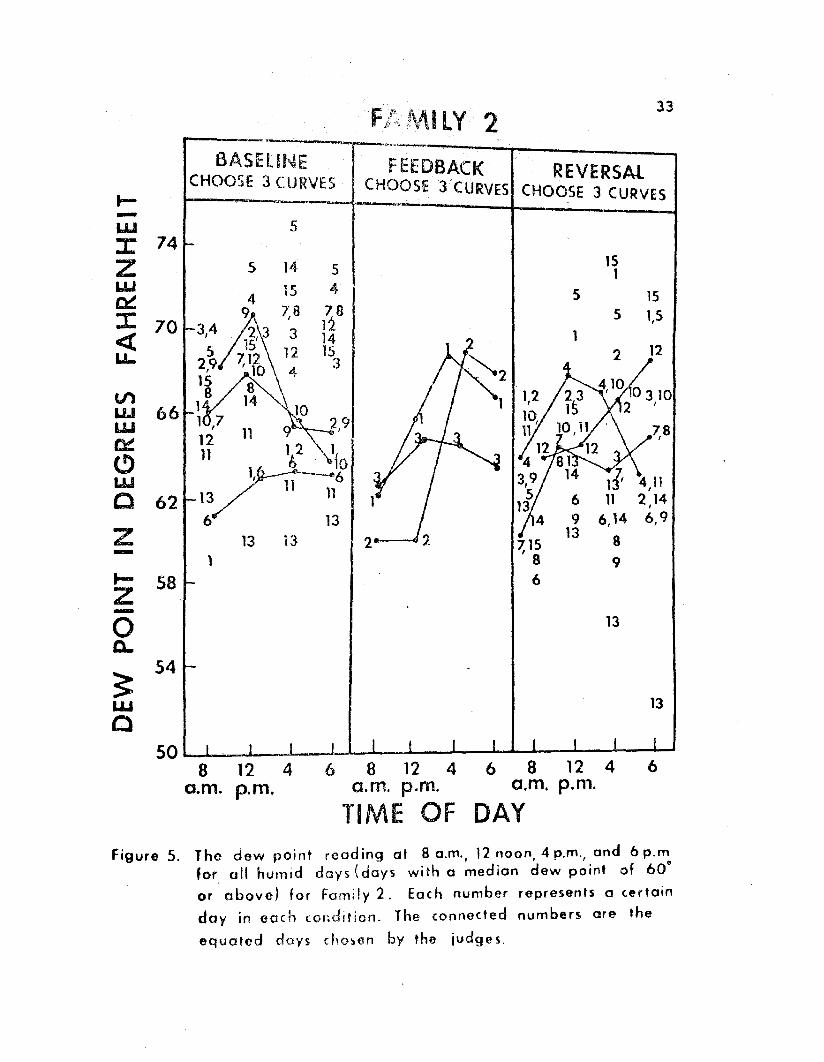
5.. The dew point. reading at 8 a .. m.. , 12 noon,4 p.m., and 6 p.m. for all humid days (dayswith a media.n dew point of 60· or above)for Family 2. Eaoh number represents aoertain day in eaah aondition.. The oonneot.ednumbers are the equated days ohosen by thejudges ..
6 .. The dew point. reading' at 8 a .. m.. , 12 noon,4 p .. m., and 6 p.m. for all humid days (dayswith a median dew point of 60· or above)for Family 3.. Each number represents aoertain day in each oondition.. The oonneotednumbers are equated days chosen by thejud<1Gs.
Page
12
16
21
32
33
34

Chapuer 1
INTRODUCTIO~l
The cost of electricit.y generation has increased due,
in part, to recent increases in the price of crude oil.. New
methods of produoing electricity, that. do not rely 01'1 crude
oil, must be developed and implemented.. In the meantime,
electricity conservation is important to keep the production
cost low and to provide time to develop the new production
methods. Prooedures need to be deslqned that will enoourage
consumer electrioity conSlJervatiol1.'"
An operant teohnology has bra8n increasingly applied
in analyzing environmentally relat:.ed behavior. Dehavior
related to littering (Burgess, Clark, , Hendee, 1971,
Chapman 61 JU.sely, 1974: Clark, BurqesuJ, lie Hendee, 1972;
Hayes, Johnson, &: Cone, 1975; Kohlenberg &: Phillips, 1973,
Powers, Osborne, (. Anderson, 1973), paper disposal (Geller,
wimer, &: Orebaugh, 1976), purchasing returnable bottles
(Geller, Farris, & Post, 1973), and noise reduction (Meyers,
Artz, " Craighead, in press) have been modified. Savings in
residential fuel 011 (Seaver & Patterson, 1976), natural
"'This research was supported in part with funds froma Drake University researchqrant to the author and in partwith funds generously supplied by the Iowa Power and LightCompany. The author is grateful for the considerableassistance he reoeived from William Fletcher of the IowaPower and Light Company.

2
gas (Winett Ii Nietzel, 1975), residential electricity
(Hayes & Cona, in preSS1 Kohlenberg, Phillips, & Proctor,
197Eh Palmer,. Lloyd, & Lloyd, in press) and gasoline con'"
sumption (Foxx & Hake,. 1977) have been demonstrated using'
operant technique.s.
Behavioral researoh on elecrtricity oonservation in
private homes has investigated two problem areas: methods
of decreasing overall electricity consumption and methods
of reducing peak demand", Peak demand usually refers to
the high electricity use during' certain times of the day.
Prompts in the form of slogans and Ieotters (Palmer
et al., in pres.s) and daily feedback on KWH coru:1umption or
oost information to individual consumers (Hayes &I Cone, in
pressy Palmer at al., in press) have deoreased overall
daily KWH consumption. Monetary rebates, contingent. on
decreased consumption,. have also been effective (Hayes (;I
Cone, in press: Winett., Kagel, Battalio, &I ,finkler, in
press: Winett, Kaiser, " Habarkorn, 1976). Simply giving
information to the consumer on how to save electricity or
listing the wattage of various applianoes (Hayes & cone, in
press; Winett at al .. , in press) and weekly consumption feed
back (Winatt at Cll., in press) have not been effective in
decreasing overall consumption.
The second problem area in electricity research and
production, reducing peak demand, is important since supple
mentary generators using expensive oil or nuclear power must

3
be operated durin.Cj peak demand periods.. During non....peak
periods, the supplementarygenerat.ors are idle. It would
be more cost efficient, froret the electricity producers'
point of view, if some of uhe peak demand could be eluninated
and/or switched to non-peak periods of the day. Initial
research in t.his area demonstrated that. feedback qiven every
15 min and feedback plus monetary rebat.es were effeetive in
reducing peaking with residential cons~~ers (Xohlenberq at
al., 1976) .. Specifically, t.his research showed that cumula
tive KWH above a criterion could be reduced in private homes.
It did not reveal Whether there was an overall tu>1B reduotion,
whether consumption was switched to non-peak periods of the
day or how Much, if any, of the decrease occurred during
the peak demand hours of t.he day. The present. researdh ob
tained data on these possible out.comes.
Moet studies of overall and peak consumption have
involved electricity corusumlng behavior not related to air
conditioner or furnace operation.. In the only study con
ducted durlng humid summer days using families with air
condit.ioners (Winett at al .. , in press), monet.ary rebat.es
were effecti.ve and ,,,eokly feedback was ineffective in
reducing consumption. A poi.nt syst.em with backup rein
forcers was effective in reducing the durat.ion of small
appliance use in an individual home (Woodarski, Note 2),
but did not reduoe furnace use. It was noted that weather
variations confounded the furnace use data. Some procedure
4
that will decrease overall consumption and/or reduoe peak
inq with heatinq and coolinq devices must be developed and
evaluated.
The present study was conducted during' the surmuer
months with families who had air conditioners. 'the effects
of 15 min feedback on overall consumption and on peaJd.ng
durinq a season when air conditioners were in use were
studied.

Permission was obe"itlea from the owner and the
manager of an apartment complex in Des Moines, Iowa, to
contact. residents in the complex by telephone. Eleven
families were cont.aoted. Two families volunteered to par
tioipate. A third family in a private home also agreed to
participate. The criteria for seleot.ion of the families
were that the residenoe was equipped with air conditioning,
that one parent functioned as a houseperson (she/he was not
employed elsewhere), that at least one child lived in the
family, and that the family would not leave for an extended
vacation during the stUdy. Each family had an electric
stove, electric refrigerator, television, radio, dishwasher,
and a central air conditioning unit. The apartment
families did not have individual water heaters, washers, or
dryers. The private hom.e contained a water heater, washer,
and d.ryer ..
APParatus
Eaoh familY dwellim.J was equipped with a feedback
device and a recording device. The feedback device con
sisted of a chassis box, a 7W light bulb, and a 6 volt
buzzer. The 7U bulb was mounted in a hole drilled in the
,~ T.h·.;:a 6" "'·ol··t··· b·uzzer ",ras II:l0unt.ed inside t11e box. The.uox.. "" ...

6
feedback device was mounted on ill wall between the livinfj6
room and kitchen of each dwelling:.
The recording device, mounted at Cbedwel11ng-s
electric uletar, included an Est.erline-Angus IS min cumula
tive watt reoorder, a standard electric clock, and a cou.nter"
The cumulative watt recQrder reoorded the KWH consumed
during: every 15 min period of the day. This reoorder con
sisted of an upward moving pen that reset to zero every 15
min. 'I'lle resulting: raw data were strip charts containing 96
u.pward sloping lines for eaoh day. The height of each line
represented the KWH consumed in a 15 min period. Recorders
were equipped with electrical contacts t.hat. could be ad
just.ed t.o close when the pen excursion reached a predeter
mined position; i.e .. , a pret.1.ete:nnined 15 min consumpt.ion
level. The contacts re-opened when the pen reset. t.o zero at
the end. of the 15 min interval ..
The counter and clock: were wired throuqh t.he con
tacts t.o a 110 volt power source. When the contaots closed,
the oounter pulsed and the clock operated continuously
until t.he pen reset. to zero. The recorder also activated
the feedback device inside the dwelling. The oontact.s
pulsed the buzzer and operated the 7T1l light bulb continu
ously until the pen reset. to zero. When the family con
sumed the predetermined amount of eleotric!ty in a 15 min
period, the bu~zer pu18ed and the 1T1l liqht bulb was operated
until the 15 min interval ended.. When the buzzer and light.

7
bulb were operat.ed, the £...i11'. elect.ricit.y consuming
act.ivit.y had no effect on the feeaback: device wit.hin 1:11:&t
particular 15 min intenal. The wat.t recorder. operated at.
all times during the study. The dependellt variables ob
tained throuqhout the st.udy were the lDm consumpt.ion per 15
m.in period and per 24 hours, the number of peaks (t.he
number of times that 15 min consumption reached cri.t.erion) ,
and the durat.ion of peaks per 24 hours (cumulati:ve mitlutes
in each 15 min period that. the pen was above the criterion).
KWH above criterion data Were ca1cu1at.ed after the stUdy
ended.
Procedure
This study was scheduled to begin in mid-April and
end in August. Due to equipment shortaqes, the stud.y did
not begin until July. Observations were conducted. for 65
days.
Instruotions to subjects. Prior to the beqillninq
of the study, eaob family was told that their electricity
oonsumption would be oontinuously measured by recordinq
equipment, that at 8 p.m. each day, an experimenter would
colleot data from t.he recordlng device and that the feed
back device would operate at various times during the study.
Thus, a recording day was from 8 p.m. on a particular day
to a p .. m.. on the following day. The relation between the
feedback devioe and KWH oonsumption wae also explained.

8
Experimental concU.tions.. Families were alternated
from Baseline to Feedback and back to Baseline conditions ..
The privat.e home family, Family 3, did not. receive the
final Baseline condit.ion. The unforeseen delays in be
ginning thest.Ud.y resulted in an overlap with Family 3' s
va.cation.. During :Baseline, subjects were informed in
writing that thefeedbaok device was disconneoted. S1:rip
charts were removed from 1I:he recorders ·after nine d.ays of
Baseline. A criterion of peaking was chosen for eaoh family
such that 10% of the strip chart lines for all nine days
were above the peak level. 'rhese criterion peak levels were
not changed for the reainder of the study ..
During the Feedbaok condition, families were in
formed in writing that the feedbaok devioe in their dwelling
would be opera:ting whenever their aonsumpt.ion during a 15
min interval reaahed a peak level. The contacts of the
watt recorders were set to olose at eaah family'S designated
oriterion peak leV'e1.. If a peak oocmrred during any 15 min
interval, the feedback light would remain on until the end
of that interval regardless of any changes in eleotrioity
usaqe by a family member. The study was terminated when the
days began to cool in early autumn.. The number of days in
each oondition and the number of days on vacation for eaoh
family are in Table 1 (columns 2,3,4, and 5).
~eliabilit.I." A second observer independently col
lected data on six occasions during the study. Reliability

Table 1
The number of days in each condition, the number of days on vacation,the number of d.ays with a median dew point of 60· or above (humid
days) in each condition, and t.be number of days thatequipment failed for each family
Nt1.1Dber of da]"s
Family
In each condition
Feed-Baseline back Reversal
On With median dew point of Equipmentvacation 60· or above (humid days) failed
Feed-Baseline back Reversal
1 34 19 12 2 18 12 4 0
2 27 9 29 0 16 3 15 3
3 32 33 0 5 18 16 0 0
~

10
for each dependent measure was calculated bydi,,1ding t:he
smaller frequency by the larger frequenoy and lttul-tiplyinq
by 100. Agreement was always 100%.
Cha.pt.er 3
Eleotrioity demand during the swmner in Des MOines
oan be largely at.t.ribut.ed t.o air oonditioner 0PEtrat.lon
(Fletoher, Note 1). Des Moines summers are warm and
especially humid. The temperature anti the amount of
moisture in the air were important in analyzing the data.
The amount. of moisture in the air is indicated by dew point..
Dew point is the t.emperature at whioh it parcel of air must
be oooled to form water. '1'he hither the dew point, the more
water in the air. Dew point. in Des Moines' summers gener
ally varies from 40· on drt days to 70· on extremely humid
days. As the present. study pr09'ressed, it beoame evident.
that extreme fluctuat.ions in temperature and partiCUlarly
dew point generat.ed corresponding fluctuations in the
eleotricit.y oonsumpt.ion data. Peaks per day varied from
zero on cool, dry days t.o 20-30 on warm, humid days. Days
with zero' or few peaks which were oorrelated with low t.emp
erat.ure and dew point readings oould not. cont.ribute mean
ingful data t.o the study. consumption would probably have
been low on such days regardless of the experimental oondi
tion in effeot. The median daily dew point and the number
of peaks for all days in all conditions for all families
are shown in Figure 1. Visual comparison of the inoreases
and decreases of both dew point and peaks indioates a positive

12
6ASEUNE FEEDBACK REVERSAL
6fJ
5040
30 t:wJ:Zw
"""J:«LL
tZ-oc,
3:30 w
C
60
50
40
60
50
40Vl
30 ww~
owcz
DEw POINT
40
30
20
10
o
FAMilY I
Vl~
«WSOQ.
40u,
030
~20~~ 10
~ 0:::JZ
5 10 15 20 25 30 35 40 45 50 55 60 65DAYS
Figure L The number of peaks and the median dewpoint for. all days of the study for all families.The arrows indicate the days thaI the judgesselected as baing equal with respect to dewpoint.

13
correlat.ion bet.ween the two events. Pearson product moment.
oorrelations bet.weandaily dew point and number of peaks
during Baseline were 0.52, 0.45, and O.OSfor Families 1,
2, and :3 respectively. Dew point. was olearly prediot.ive of
eleotricity consumpt.ion on a particular day.
For the purpose of the present IlJtudy, dat.a from
warm, humid days were more important. than data from cool,
dry days. In order to eliminate t.he data from cool, dry
days, a orit.erion for humid days was seleet.ed. Preese-Not.is
Associat.es, Inc., a privat.e weatber foreoast.ing company in
Des Moines, has advocat.ed a orit.erion for humid days as a
day with a dew point. of 60° Fahrenheit (16 0 Centigrade) or
above.. Iowa Power and Light Company has acoept.ed this ori
terion. It. was used in the present study. Only days that:
had a median dew point of 60· or above were considered.
The number of humid days remaininq In each oondition for
each family after the cool, dry day. were eliminat.ed from
oonsiderat.ion are shown in oolumns 6, 7, and 8 of Table 1.
When electricity conSUmption for only humid days was
plotted, there was still considerable varia.bility in the
day to day oonsumption. An additional seleotion proeedure
was employed in a further effort to decrease variability in
the data. In the additional seleotion procedure, the dew
point at. 8:00 a.m., 12:00 noon, 4tOO p .. m., and 6tOO p.m. of
each humid day were plotted. (See Figures 4, 5, and 6 in the
Appendix). These times were recommended by Iowa Power and
14
Light Company as the time. when ptIOple often choose to 'turn
on their air conditioners" Jud.qes (P.yc:holoqy faculty and
graduate student.) selected four dew point curves in each
egperimental condi1d.on which they judged mo.t similar to
each other (onl.y three humid day. were availab1e durinq
Feedback for Family 210 the judge8 chose three curves in
each condition). At. least 80% of the judges chose a
particular set of curves for ramilies land 2. Eighty per
cent of the jUdqes did not atiree on any of the curves for
Family 3 so the four curves that the raters chose most often
were used. The same procedure was repeated using tempera
ture data.
Because of the low aqre$1l'lent among jUdges for Family
3, another procedure for seleoting comparable humid days was
examined. The median temperature and median dew point for
each day were summed. Five days were chosen in eaeh oondi
tion that were most comparable with respeot to the oombined
temperature and dew point. This prooedure was then used to
select four days per condition for Family 1 and three days
per condition for Family 2.
In summary, a fixed number of da.ys were chosen from
each experimentaloondition to form three sets of data that
were comparable with respect to dew point, temperature, and
a COmbination of bOth. The selected days for eaoh family
were not always the same a8 the seleoted days for the other
families. The electricity oonsumption data for the tnrfllle

15
weatber cr:U:eria 'Were nex:t plotted for the seleoted day.s ..
All three weat.her criteria qenerat.ed similar sets of con
sumption data" Since the dew point readings were pa.rt.iou....
larly useful in prediotin.9 electricity consumption through
out tbe stud.y, the dew point criterion was a.dopt.ed for the
analysis of the results of the present. st.udy.. The arrows in
Figure 1 indicate those cia.ys selected by the jUdqes to be
equal with respect to dew point. (e.g., days 14, lS, 24, and
28 during Baseline tor Family 1).
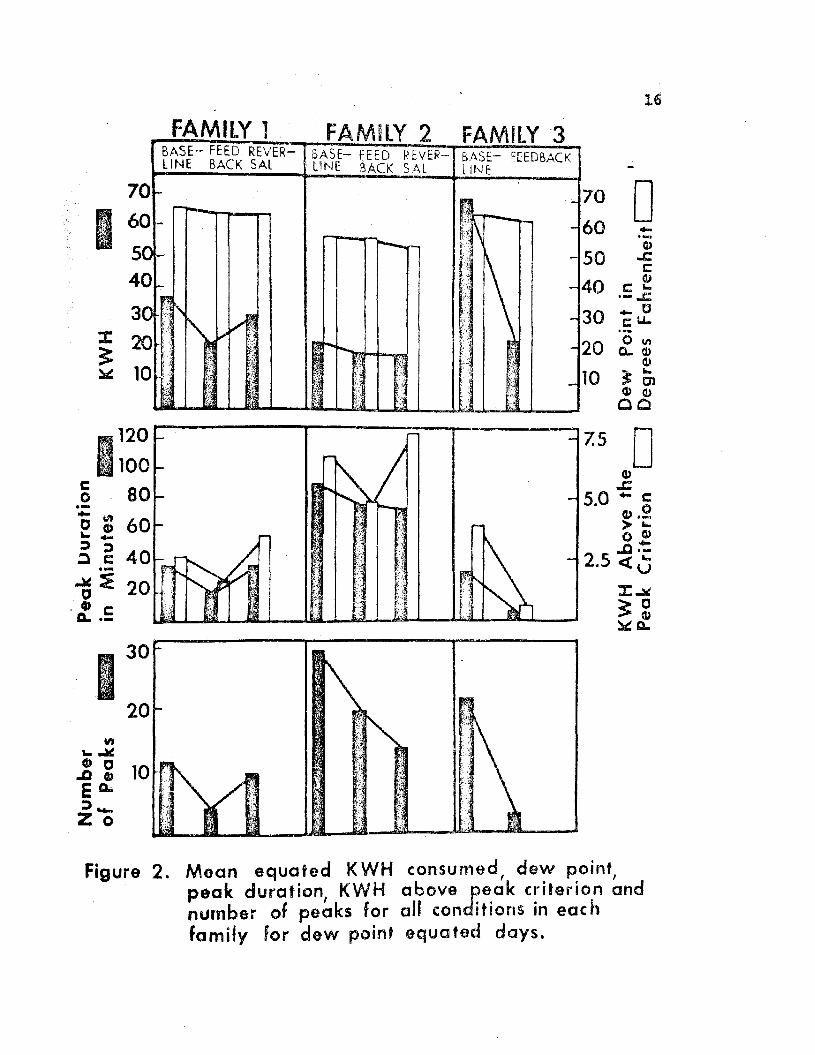
The consumption data equated for dew poi.nt are shown
in Figure 2. There are five sets of histograms in thrae rows
for each family. The top row of histograms contains the
mean dew point reoording (open histograms and right hand
ordi.nate) for the four (t.hree for Farally 2) seleobed humid
days for each of the families during eaoh experimental oondi
tion. The top row of histograms also shows the mean da.ily
KWH (shaded hi.stograms and left hand ordinate) oonsumed by
eaoh family during the different experimental oonditions.
The second row of histograms shOWS the mean peak duration
(shaded histograms and left hand ordinate) and the mean KWH
eonsumption over the peak ori.terion (open histograms and
right har!d ordinate) by the families during each experimental
condition. KWB consumed above the peak criterion was
calculated after the IItudy ended for only the select.ed humid
days. The tbi.rd row of hist.oqrams shows the mean number of
peaks for each family during the experimental oonditions.
16
o70
60
50
40
30
20
10
FAMilY 2 FAMILY 3FAMILY 1BASE FEED REVER BASE- FEED ReVER- BASE- FEEDBACKLINE BACK SAL LINE BACK SAL LINE
Of-.... l!'! " ..
0-\;~ ....~
'\r- -
10 -_r-:-
\-(.):
0 I- -0 ~r\ -v'- l.-"V r--.
~ -0
..~
I_UL.~-
7
I 654
3J: 20~~ 1
I..~·...·..··..·.·..·.····...··'··>
T~
;',,'
I·'·····
. ~
Figure 2. Moan equated KWH consumed, dew point,peak duration, KWH above peak criterion andnumber of peaks for aU conditions in eachfamily for dew point equated days.

17
The data from Family 1 in Figure ,2 olearly demon-
strates the effectiveness of the f,eedback procedure in re
ducing oonsumption as compared to Baseline and Reversal in
terms of all four depel'Uient measures. The data from l?'amily
,2 show a decrease in consumption during Feed.l.Jaok for all
dependent m.easures.. On.1.y RWBabove the peaking- criterion
increased during Reversal for this family. The data from
Family 3 show a decrease in consumption during Feedback for
all four dependent measures ..
Figure ,2 includes only data from the selected days ..
The mean KWII consumed, the mean peak duration, and mean
ntmlber of peaks were also calculated for all days (boeh
humid and cool days) of eaoh condition for each family.
These means were then adjusted for dew point variability
using analysis of covariance. Table,2 contains the means
for selected days, for all days, and the adjusted means ..
The adjusted means (and the means for all days) change in
the same direction acrOss the experimental conditions as
the means for selected days with the exception of the mean
peak duration for Family 1. The seleated days data in
Figure ,2 representea, on the \'1hole, the data from all days,
even when the total days data were adjusted for changes in
the de\4 point. Table 3 shows the a.nalysis of covariance
results using the lGfH per day, peak duration per day, and
the number of peaks per day data for the Baseline and Feed'"
back condition for eaoh family. The Baseline and Feedback

Table 2
The mean I(WH, mean peak duration, and mean number of peaks in each conditionfor each family. The means are calculated for the selected days and for
all days of the study. The means for all days were corrected forchanges in dew point to generate the adjllsted means
Mean KWH Mean Peak Duration Mean Number of Peaks
Base- Peed- Base- Feed- Base- Peed-line back Reversal line back Reversal line back Reversal
Family 1;.
selected daysall daysadjusted
Famil;;[ 2selected days
all daysadjusted
Pamily.3
select.ed daysall daysadjust.ed
36 2~ 30 35 19 34 12 4 10
30 23 23 19 18 22 8 5 629 23 26 17 20 24 7 5 8
22 IS 17 90 76 74 31 20 14
21 16 13 161 77 40 29 18 10
20 15 12 147 84 45 28 17 9
69 22 - 33 6 - 22 3
51 27 - 23 6 - 13 4
48 31 19 10 11 6 t""'- - - •
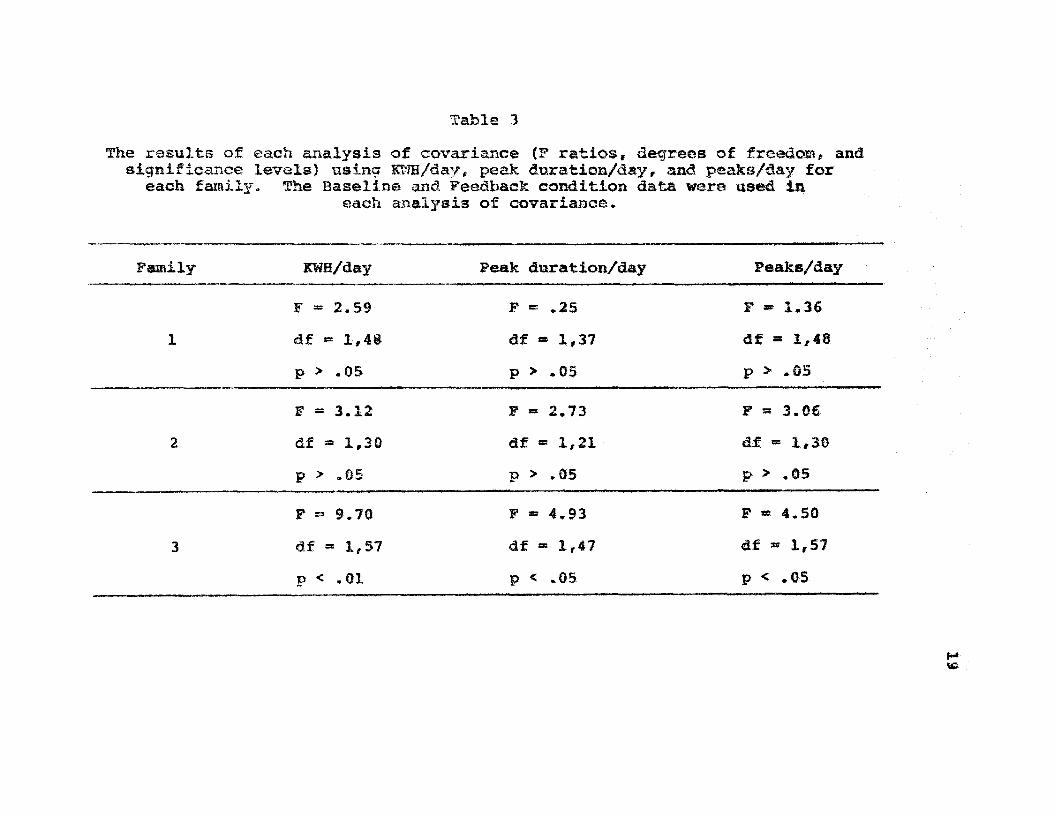
Table 3
The results of each analysis of covariance (F ratios, degrees of freedom, andsignificance levels) using ~m/dayf peak duration/day, and peaks/day for
each family. The Baseline and Feedback condition data were used ineach analysis of covariance.
---------------_.Family
1
2
3
KWH/day
F == 2.59
Cif == 1,48
p )0 .05
F = 3.12
df == 1,30
p )0 .05
F C! 9.70
df == 1,57
p < .01
Peak duration/day
F ., .25
df == 1,37
p > .OS
P == 2.73
elf == 1,21
p )0 .05
F == 4.93
elf == 1,47
p < .05
Peaks/day
F .. 1 .. 36
df =- 1#48
p > .05
P • 3.06
tif • 1,30
p > .05
F - 4.50
elf • 1,57
p < .OS
....\CD
20
means are not. siqn.ifi.oantly tUfferent.for Family land
Family 2 (p > .05). The means for Family 3 are significant.
ly different. (p 0( .05 for peak duration/day and peaks/day,
p < .01 for KWH/day).
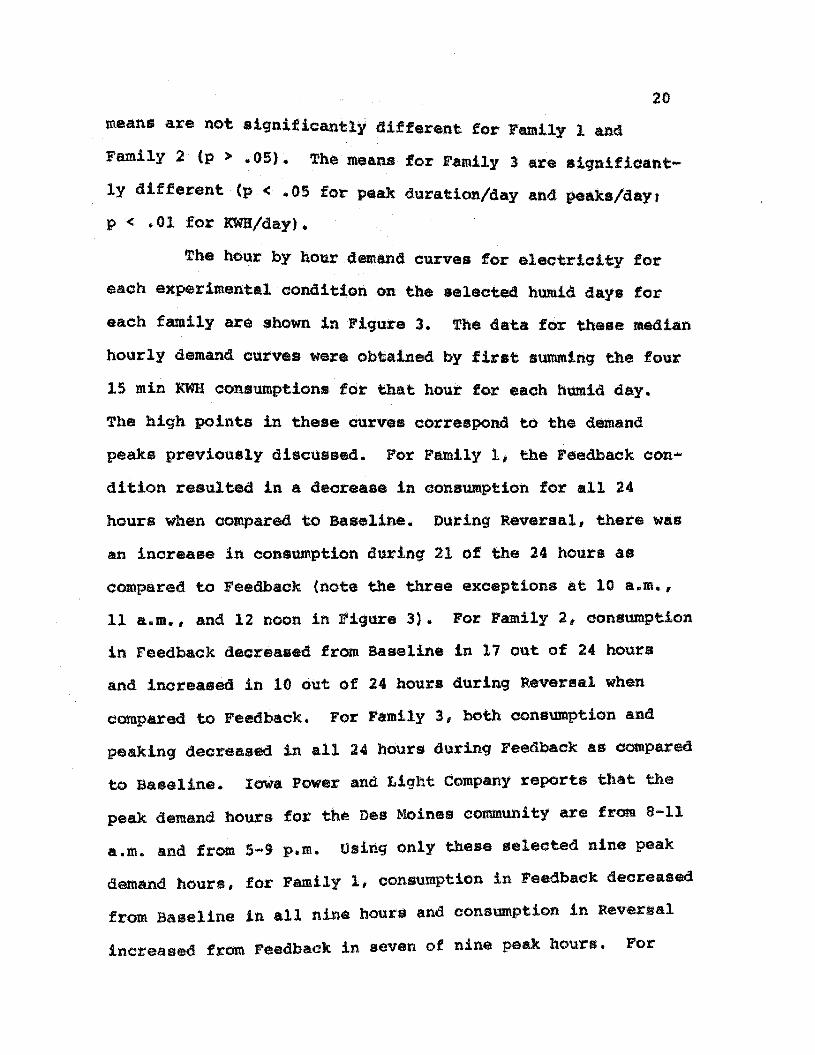
The hour by hour a_and ourves for electri.ait.y for
eaah experiment.al condit.lononthe selected humid days for
eaoh family are shown inri9ure 3.. The 4at./I for these median
hourly demand ourves were obtained by first summing t.he fow::
15 min KWH oonsumpt.ions for that. hour for each humid day.
The high point.8 in these ourves correspond t.o the demand
peaks previously discussed. Por Family 1, the Feedback con"
dit.ion resulted in a decrease in oonsumption for all 24
hours when aompared to Baseline.. During Reversal, there was
an inorealle in consumption dur!.nq 21 of the 24 hours as
compared to Feedback (note the three exceptions at 10 a.m .. ,
11 a"m., and 12 noon in l'iqU%"e 3).. For Family 2, oorulJumpt.ion
in Feedbaok decreued from Baseline in 17 out of 24 hours
and increased in 10 out of 24 bours durin9 Reversal when
compared to Feedback", For Family :3, both consumption and
peakln9 decreasea in all 24 hours during Feedback as compared
to Baseline", Iowa Power and Light. Company reports that: the
peak demand hours for the Des Moines community are from. 8-11
a.m. and from 5-9 p.m. Using only these selected nine peak
demand hours, for Family 1, consumptio,n in Feedback decreased
from Baseline in all nine hours and consumption in Reversal
increased from Feedback in seven of nine peak hours. For

r---------,,,"',," 21
FAMILY 13.0
2.52.0
1.5
1.0
0.5
2.52.0
1.5
J: 1.0:>;> 0.5~
FAMilY 2
FAMilY 3
8 p.m. 12p.m. 4 a.m. 8 a.m. 12p.rn, 4 p.m,
4.5
4.0
3.53.0
2.52.0
1.5
1.0
0.5
HOURS OF THE DAYfigure 3. Median KWH consumption per hour of the day
for all humid daY5 for the three E!'Kperimental
conditions in each 'amily.

22
Family 2, oon8umption in r••dbaok deorealed from Baseline
in eight of nine peak hou.rs.. Consumpt.ion in Reversal
inoreased fromre.dbaok in t.hree of nine hours. For Family
3, oonsumption in Feedback a.eoreased from Baseline in all
nine peak demand hours.
At the end of the study, eaoh tam.!ly verbally
responded to a questionnaire. All families reported that
they had. no objeotion to the feedback devioe being: in their
homes and. that the feedbaok deviee helped them conserve
eleotric!t.y • Familiee land 2 said tbat they did nothing
in partioular to conserve eleotrloity.. Family:3 reported
turning on ithe fan to circulate the air instead of turning'
on the air conditioner.

DISCUSSION
The data in Figure 2, Table 2, and Figure 3 indi....
oate that. feedbaok oan be effeotive in reducing eleo~ioity
consumption on humid days in individual homes. Consumption
deoreased. from Baseline to Feedbaok in all dependent measures
in all families. All the Reversal data from Family 1 and
the KWH above peak criterion reversal for Family 2 support
the interpretation that thea Feedback oond.ition was respons
ible for the deorease in oonsumption. The houseperson (the
husband) in Family 2 moved out of the apartment during the
study. An important eleotricity oonsumer Was not at home
during the day for the last. part of t.he stUdy. This oould
explain the continued. oonsumption decrease in three dependent
measures durinq the Reversal oondition. A seoond possibil
it.y oould be that a smaller electricity bill as a result of
reduced oonsumption during Feedback maintained the low con
sumption. Although it was not possible to obtain RevEll:'sal
data from Family 3, the large magnitude of the decrease in
consumption !from :aaselina to Feedback in all four dependent.
measures (Figure 2) and the olear change in the Slope of
the hourly demand ourve (Figure J) strongly suggest the
effectiveness of the Feedback condition.
The present data replicated the effects of feedback
on KWH oonsumption abOve a peak criterion (the only de
pendent variable reported by Kohlenberg et al., 1976). Both
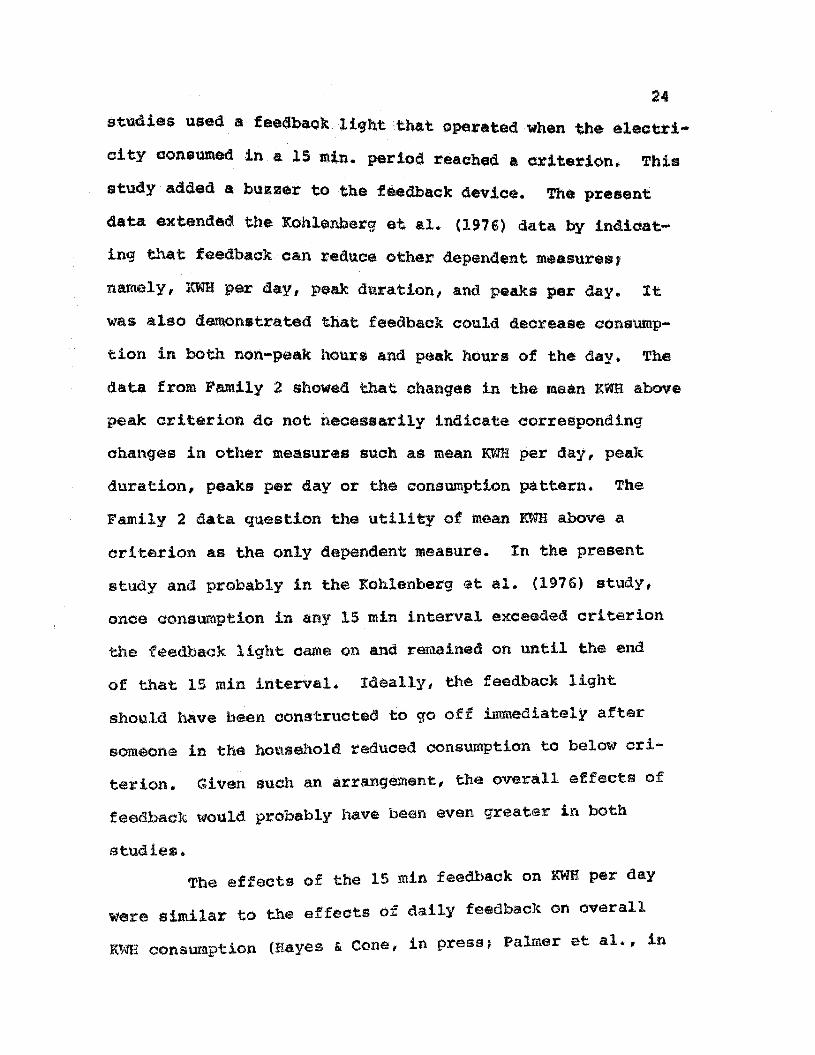
24
studies used a feedbaoklig-bttbat Qperated wheS1 the eleotri-
oity oonsumed in a 15 -in. per.lod reached a. criterion.. This
st.udy added a. buzzer to t.he feedbaok device. The present.
data extendec:l the :Kohl.enberg et al. (1976) data by indioat....
ing that feedbaok oan reduce other dependent measures,
namely, KWH per day, peak duration, and peaks per day. It:.
was also demonstrated that feedbaok could deorease oon.sump
tion in both non-peak hours and peak hours of the day.. The
da.ta from Family 2 showed that changes in the mean l(WR above
peak criterion do not neoessarily indioate corresponding
oha,11ges in o'ther measures suoh as mean KWH per day, peak
duration, peaks per day or the consumption pattern. The
Family 2 data question the utility of mean KWH above a
criterion as the only dependen.t measure. In the present
study and probably in the :Kohlenberg at al. (1976) study,
once consumption in any 15 min interval exeeeded criterion
the feedback light came on and. remained on until the end
of that 15 min interval. Ideally, the feedback light
should have been oonstruoted to go off immediately aft·er
somecme in the household reduced oonsumption to below cri
terion. Given suoh an arrangement, the overall effects of
feedback would probably have been even great.er in both
stUdies.
The effects of the 15 min feedback on KWH per day
were similar to the effects of daily feedback on overall
KWH oonsumption (Hayes .. Cone, in press; Palmer at al., in

25
press). Neither of these st.udies had been oond:uct.ed during
the swnmer,so t.he effeets of daily feedbackort elect.rioit.y
consumption dueta air con4itiC)ner opetat1on could not. be
assessed. Weekly feedbaok(Winett et al., in press) was
found to have no substantial effect on eleotrioity consump
tion whl.l!rethe major part of the consumption oonsisted of
air conditioner operation. 'rhe present researoh is the first
report of the effectiveness of feedbaok in reducing eleotri....
oit.y oonsumpt.ion related t.o air oondit.ioner operation.
Perhaps more immediate feedback, Le.. , 15 min i.ntervals
rather than weekly intervals, is neoessary to effeot enanqes
in air conditioner use on humid days.. Researoh is needed to
oompare the relative effect.s of weekly, daily, and 15 min
feedback procedures.
The higb variabilit.y in peaks per day in Figure 1
also occurred in other dependent measures.. Variabilit.y of
this nature is t.ypical of man.y e1ect.rioity consumption
studies.. Some of the variability may be a function of
corresponding' changes in the dew point.. In the present
study, days that were similar wit.h respect. to dew point ~1ere
select.ed in each oondition; t.hus, ohanges in the data could
not. be a result of changes in t.he dew point. The fact t.hat
d~~ point appears, in part, to determine air oondit.ioner
use on humid days 8119gest.s that a dehumidifier miqht be used
in homes instead of an air conditioner. Dehumidifiers re
move moisture from the air and use 50-60% less electricity

26
than air condit.ioners.
The hourly d._and ourve. in 'igu.re 3 show Baseline
peakinq periods arol1n(i4aOO p.m. and non-pea.kin9 periods
around 4s00a.m.. The pattern of these cu.rve.could have
ohanqed in at: lea8t three ways when the families were
shifted from Ball.line to Feedback. Only two such chanqes
occurred in the present: st.udy. During Feedback, the over
all shape of the demand ourve could remain similar to Base
line wit.h the ent:ire curve beinq lower on the ordinate (s.ae
Family I in Piqure 3).. During Feedback, the demand ourve
could have become flatt.er and at a lower level on the
ordinat.e (see Family 3 in figure 3) or at the same general
level such that. tot.al KWH per day remained t.he same as in
Baseline. This third possibility did not OdOur in any of
the families. Purt.her research is needed to identify tn.
kinds of ohanqes in demand curves, like t.hose in Piqure 3,
most. likely to occur with ohanqes in eXp$riment.al oondit.ions.
The term peakinq is used different.ly in dlfferene
contexts t.o describe periods of hi<}h electricity consump
tion. In the present. study, peald.nq meant. that. consumption
in a 15 min period exceeded a pre-determined orit.erion ..
Peaking could also be defined in terms of 'the high points
in the hourly consumpt.ion ourves of Fiqure 3.. A third
peakinq ie the hiqh community demand from all the families
in an area suoh as that reported by Iowa Power and Light
Company between 8:00 and 11:00 a .. m. and between 5:00 and

27
9: 00 p.m. A final definition of peaking: 18 8e.80IU&\1. Iowa
Power and Light Company is a summer tilne peaking company..
Thus, aoross the entireyeu,eleotrioity a_and is hiqhest
in the summer months. Power companies supplying electricit.y
t.o homes heated by electrical beating devices would be
examples of winter peaking compan.ies ..
Time of day meterin9 is based on the hourly dmnand
curves of an entire community. Power companies in :Florida
(e.g., "Peak Load Experiment," 1971) are noW' assessing- the
effects of differenti·al rat.e structures based on time of
day use. Peak hour consumption C08tS more than non-peak
hour consumption.. This type of research indicates a shift
by t.he power oompanies from e4~oat.iona1 or informational
approaohes t.o a manipulation of the consequences of
electrioity consumption.. This is III welcome change since
providinq information about electrioity oonsumption, Which
typioally involves 9iv1n9 watt ratings of various appli
anoes or giving tips on how to save electricity, has been
shown to be ineffective in raduc.ing consumpti.on (Hayes Ii
Cone, in press; tlt.inett, at a1., in press). Peak pricing
is more similar to the behavioral techniques that. have been
shown t.o be effeotive.

28
1. Fletoher, W. Peraonal00:mnlWli.C$tion. Iowa Power andL.1g:ht Company,. De. Moines t Iowa, 1977"
2.. Woodarski, J" S.. The reduction ofeleotrieal ener9Yconsumption: The appl.:Loationof beha.vioral ana.lysis.Ninth. Annual Meeting' ,.AIUJooiation for the Advancementof Behavior Therapy, San Fran.oisoo, Deoember, 1915.

29
References
T. R. Anti-litter prooe4ure$ inuarea •.. Journal of Al?21ied Behavior377...383.
Bur9:::ta~·.a:;iy;i:r~f:~t::ii:t::n::~~e~~r;;Applied B.e~av~or Analxsis, 1971, 4, 11-75:
~ -Chapman, C., & Risley,
urban bigh-densityAnallsi,s, 1974, 1,
An exper1Journal of-
Phillips, T., & Proctor, W. A behavioralpeaking in residential electrical energy,:,out:na1 o~ApgliedBehavior Analysis, 1976,
Clark, R.N., Burgess,a. L.,& Hendee, J .. C. The d.evelopment of antd.-litter behavior in a forest campground.~our,nal ·0£ Applied Behavior Analysls, 1.912, !, 1...5.
Fox-x, R. M., , Iiake, D. F. Gasoline oonservation: Aprocedure for. measuring at'ld reducing 1:he.driving ofcolle9'8.students. ",curoal of Applied Behavior Analysis,1977, 10, 61-74.
Geller, E. S., Farris, J. C., s Post, D. S.. Prompting aconswner :behavior for pollution control. JournalofApplied Behav1pr Analxa!.!., 1973, !, 367-376.
Geller, E. s., Witmer, J. F .. I s Orebaug-h, A. L. Instructionsas a det.erminant of pa.per*"disposal behaviors. Environment and Behavior, 1976, !, 411-439.
Ha.yes, S. C., &. Cone, J. B. Reduoing residential electricalenergy uscu Payments, informat.ion, and feedbaok. J()urnaloJ: A12121ied Behavior .Analysis, in press.
Hayes, s , C., Johns·on, V. S .. , , cone, J. 1). The marked i tamtechnique: A praotical procedure for litter oontrol.Journal of Applied ,Behavior: Analysis, 1975, !, 381-386.
Kohlenberg, R., & Phillips, Too Reinforcement. and rate oflitt8r depositi.ng. JotlJ:l1al of A12l?:lled Behavior Ana~si.,1973, 6, 391-396.
Kohlenber9, R.,analysis ofCOnStmlEU:S.~_, IJ-Us.
Meyers, A.. VA., Arts, L. M.,& Craig-head, ti. B. The effectsof instruct.ions, incentive, and feedback on a communityproblem: Dormitory noise. ~9\1rnal of Applied BehaviorAnalysis, in press.

30
Palmer, M. a., Lloyd, M. a., I: tloyd, I. E. An ElKP$t'imental analysis of electricity cOlleervation procedures.Jo~rnalof Ap;eliedBehavlorAnal:)[sis, in press.
Peak load experiment proved no easy taek. Orlando Sentinelsi;a:" f48,y 15, 1971, Sec. 13, p .. 3.
powers, R. a., Osborne, J. G., & Anderson, E. G.. posit.ivereinforcement of litter removal lnthe natural environment.. Journalo,£ Applied B~bavi.or Analysis, 19"/3, !,579-586.
Seaver, W. B.,& Patterson,A. H. Decreasing fuel oil consumption through feedback and social commendation.Journal of AEPli;,ed ltehav!;or Arua.lys!!, 1975, !, 147-152.
tJinett, R. A., Kagel, J. B., 'Bat.talio, R. c., I: t~inkler,
R. c.. The effects of monet.ary rebates, feedbaok, andinfonnationon residential electricity conservation.Journal of Applied Behavior. Analysis, in preas...
~Unet.t, R. A., Kaiser, S .. , " Haberkorn, G.. The effe~ts ofmonetary rebates and daily feedback on electricity.Jour na 1.J?.fEnvironmentC1l Systems, 1976, 6, 321-339.
\1in9tt, R. A., &. Ni.etzel, M.. T. Behavioral ecology:Contingency man.agemen't of oonsumer ene·rgy use. ~...me:r1oanJournal of Community Psychology, 1915, ], 123-13~ ..

APPENDIX
FAMILY 1BASEl.INE
CHOOSE 4 CURVESFEEDBACK REVERSAL
CHOOSE 4 CURVES CHOOSE. 4 CU'RVES
- 745
w:r:zw~ 70:c«u.
VlWw0::C>wC
Z- 58
5 17 518 4
7,8 7~a3,15 15)7
10,1134 11
11 1616
25 2,5
1 52
69 6
89
5
......Z-oc.. 54
66 8 12 4 6 a 12 4n.m, p. m. a.m. p.m
TIME OF DAY
8 12 4am. p.m.
~wC 50 ..........._-..I-_..a.-....-L-..I--'--~~ .........._.Ji--I,---'-_..&_--"-......L-...j
Figure 4. The dew point reading at 8 c.m., 12 noon, 4 p.m., and 6 p.rn.for all humid. days (days with a media,n dew point of 60° orabove) for Family 1. Each number represents a certain day
in each condition. The connected numbers are the equated
days chosen by the judges.
tMllY 233
-w:c 74
Zw~
:t: 70<t .LL.
V')w 66w~
C>wC 62
Z
151
5 155 1,5
FEEDBACK REVERSAlCHOOSEJ CURVES CHOOSE J CURVES
13
1
5
5 14 5
15 4
7,8 1~83,4 2,3 3 14
155 712 12 15
11 1 2 1,b . 10
13~66 13
13 13 2---
--------....--.,-------r-------BASEUNE
CHOOSE 3 CURVES
58IZ-oe,
-
~WC
54
13
8 12 4o.m. p.m.
6 8 12 4 6 8 12 4o.m, p.m. o.m, p.m.
TIME OF DAY
6
Figure 5. The dew point reading at 8 a.m., 12 noon, 4 p.m., and 6 p.mfor all humid days (days with a median dew point of 60°
or above) for Family 2. Each number represents a certain
day in each condition. The connected numbers are the
equated days chosen by the judges.

FAMilY 334
8
16
5
11 1616
BASELINE FEEDBACKCHOOSE 4 CURVES CHOOSE 4 CURVES
17 218 2
70 3,4 25 3 11
J--w:I: 74Zw~
:I:«u,
V)Ww0::C>wC 62
Z-Z 58-oQ.
~ 54
wQ
8 12 4 6 B 12 4 6a.m. p. m. a.m. p. rn.
TIME OF DAYFigure 6. The dew point reading at 8 o.m., 12 noon, 4p.m.,
and 6 p.rn. for ail humid days (days with a mediandew point of 600 or above) for Family 3. Each
number represents a certoin day in each condition_
The connected numbers are equated days ChOUIO
by the judges.

Table 4
'!he dependent variable, independent variables, design, whetheJ:' coll$tlmption was related toheatinq orcoo1iDq and the order of effectiveness of the independent variables for each of ue eiqht
studies listed
StudyDependentvariable Independent. variables Des.lq:n
Was consumptionrelat.ed to heat Order of effectivenessor eooliDq of ind.ependent. variables
KWH/hour
Bayes &COne, 1npress
I:.Oblenberq,Pb111ips,Proctor,1916
Rebates--weekly for 1. Rebat:e8-aebat.es+less rom Qse Sinqle Feedhiu:keRehat.es+
Feedback--d.aily subject & no Informationmonetary multiple 2. Feedbek
Inf01:'1Il.ation--wat.t baseline 3.. InfO%lDatioD (tetllPGrarUyrat!nq ,. conservation elf..>
. t.1ps
C\1lI.\ulative Rebates...-bi...weeJdy for 1. _bate8+Fe~ckener9Y less :KWBun1ts over Feedl>aek--every 15 min Sinq1.e No 2. FeeQbaClka peak Xllfo:rmation--pea.k.1ng' subject.criterion explained & watt 3. Info1:mA1:!on (not effec-
. ratiD$ls _. .. t!ve)
Palmer,Lloyd, &
Lloyd, inpress
DH/day
~ek--a.ailyDBMoaeu:!XFeedbaC!k-Dm Sinqle No 1. No· Cl1ffenmces fo1R'14.:~ projeeUons subject between any i.t:lde~t
'P!!!9t:--4aily or lett.er variable.from q~.~r~t;__~f~lce
&IU'I

Table" (cont.1nued)
StudyDepena.entvariable Independent vaxiables De:s.ign
Was consumptionrelated to heat Order of eff_uvea•••or coolin9 of indepeadent varlules
s.~ GPat.terson,1916
I gallonsof fuel.oil perdegreeday
i'eed.baek--recent use Between 1 .. i'eedback+cO~at.1oa~red to previ011s q::'oups- Yeswinter's use 2 oil (hea.tinq) 2.. i'.~ (not. effective~at1on--less deliveries wbeR q~e4 to controlrecent un given "'We ued group)
.uesavi§ oi1'l decal . _
Wine.tt.Ka<jel,Battal.io,,. Winkler,in press
Winett,biser, &
Haberkorn,1976
"reduction. inpc:rwer use(:readweekly)
DB/dayc.hartedas '&.
CMIl9ed
:Rebates--Hlgh , low(weekly)Peed.back-weeklymeter readingInfoxmat.ion--conserVation t.1p.s
Rebates-Hig'h ,. low forreduced use--qivenweeklyFeedback--da11y fllcha.nqe in KWH use
BetweenG withiDgroups
Between ,.withingroup(withingroup was.ABCD)
Yes(CQQllng)
Yes--on~ days
(cooli:t\9)
1. Righ.rebate+feedhack.+infOJ::'J:Ut.1oD
2. LowreJl.ta;te+fe~inf'o..J. Peedbaok (not. effective'4. Information (not. effec
tive)
1. High rebabes+feed:1:>ack.
2. Low reba.t.es+feeQhaok aseffeeUve as feedback
w~

Table 4 (continued)
Studyoependentvariable Independent variables Design
Was eonS\DlPt.ionrelat.ed to beat Order of effectivenessor eoolinq of independent variables
Wlnet.t. &N'ietze1,1975
Woodarski,1975
" energyreduct.ioo(DB scubic feetof gas)
Durat.ionof appU.anae use
Rebat.es--weekly for ..energy reductionInformation--elect.ricity and g. reducingt.ips
Point syst.em--dailypoints qiven for lessappliance use & forspecific behaviors-points excbangedweekly
Between& witbinqroup(withingroup wasABA)
Sinqlesubject-I familyused
yes-for partof t.l\e s.tudy(beatiDq)
Yes(heatinq)
1. Rehate+information2. Infomation3. No control groups &
weather variation oonfoUJ3li results
1. point system reduced TV,stereo, oven use
2. Point. system did not-reduce furnaee--wat:herconfou~
W'I