Squat Biomechanical Modeling Results from Exercising on ... · Squat Biomechanical Modeling Results...
16
Squat Biomechanical Modeling Results from Exercising on the Hybrid Ultimate Lifting Kit 1 American Society for Gravitational and Space Research - Annual Meeting October 29, 2016 Christopher A. Gallo William K. Thompson Beth E. Lewandowski NASA Glenn Research Center Kathleen M. Jagodnik Baylor College of Medicine https://ntrs.nasa.gov/search.jsp?R=20170004124 2018-11-05T21:12:55+00:00Z
Transcript of Squat Biomechanical Modeling Results from Exercising on ... · Squat Biomechanical Modeling Results...

Squat Biomechanical Modeling Results from Exercising on the Hybrid Ultimate Lifting Kit
1
American Society for Gravitational and Space Research - Annual Meeting
October 29, 2016
Christopher A. GalloWilliam K. ThompsonBeth E. Lewandowski
NASA Glenn Research Center
Kathleen M. Jagodnik
Baylor College of Medicine
https://ntrs.nasa.gov/search.jsp?R=20170004124 2018-11-05T21:12:55+00:00Z

Digital Astronaut Project Overview
2
• The Digital Astronaut Project (DAP) develops computational models of exercising using advanced devices to predict and assess spaceflight health and performance risks and enhance countermeasure development under the Human Research Program (HRP).
• The Advanced Resistive Exercise Device (ARED) on the Space Station is the functional performance benchmark.
• The Multi Purpose Crew Vehicle (MPCV) and Mars Transfer Vehicle will have limited area available for exercise devices.

• Digital Astronaut personnel tested the Hybrid Ultimate Lifting Kit (HULK) prototype in the GRC Exercise Countermeasures Lab (ECL).
• Motion capture and force data:– Motion capture: BTS Smart-DX®, 12 camera system,
100 Hz sampling
– Ground Reaction Forces (GRF): Kistler® Model 9261 force plates, 100 Hz sampling
– Device loads: HULK internal load cells at 200 Hz
• BTS FreeEMG 16 wireless sensor system:– Electromyography (EMG) at 1000 Hz sampling
– Band pass filtered 20-450 Hz
– Full wave rectified, RMS envelope
– Maximum Voluntary Contraction (MVC) normalized
• BTS Smart Tracker & Smart Analyzer software.3
Data Collection and Analysis

Biomechanical Models in OpenSim
4
• OpenSim (Stanford University) is a freely available biomechanical simulation software allowing users to:
Develop models of musculoskeletal structures
Create dynamic simulations of movement and kinematics
Calculate estimates for muscle and joint kinetics
*Rajagopal, A., Dembia, C.L., DeMers, M.S., Delp, D.D., Hicks, J.L., and Delp, S.L., "Full body musculoskeletal model for muscle-driven simulation of human gait," (in press, submitted to IEEE Transactions on Biomedical Engineering, 10.1109/TBME.2016.2586891) (2016) OpenSim Model Motion Capture
• The OpenSim Rajagopal* (2016) lower body model scaled to the test subject is used for analyses.
• The marker coordinates and ground reaction forces (green arrows) are the inputs to OpenSim

OpenSim Work Flow
(iteration among steps is assumed)
Model Scaling
Match the model to the
subject’s anthropometric measurements
Inverse
Kinematics (IK)
Compute the joint angles that best
replicate the marker position history
Inverse
Dynamics (ID)
Determine the net joint forces and
joint torques based on kinematics
Static
Optimization (SO)
Extend ID to resolve the net muscle group
forces at each instant in time
EMGValidation
For detailed explanation of the workflow steps, refer to the OpenSim User’s Guide:
http://simtk-confluence.stanford.edu:8080/display/OpenSim/User%27s+Guide
5

• Determine rep start and stop times from a marker trajectory• Resample outcomes onto a normalized time vector from 0.0 to 1.0• Compute ensemble average• Perform statistical analysis at each increment (μ and σ)
Statistical Analysis
6
μ + σ
μμ - σ
Knee angle vs. time for five cycles Normalized average of five cycles

Exercises Performed on the HULK
7
Free Weight 1 Long Bar Free Weight 2 T-Bar
• The HULK device load is applied through a cable.
• The load configuration is either free weights (two trials), dual cable long bar, or single cable T-bar interfacing with the HULK.

Testing Analysis Results
8
• The results presented will compare two different interface methods with the HULK to a corresponding free weight trial.
• The data for the long bar and free weight 1 comparison were taken during two different test sessions in April and July 2015 with Subject 1 at a 185 lb. load.
• The data for the T-bar and free weight 2 comparison were taken during the same test session in July 2016 with Subject 2 at a 155 lb. load.
• Subject 1 is a 250 lb., 73 inch tall 95th percentile male.
• Subject 2 is a 185 lb., 70 inch tall 50th percentile male.
• The results presented from the OpenSim analysis of the trials are the normalized and averaged joint angles, joint moments and muscle forces.

Inverse Kinematics Results
9
• Hip and knee angles are similar for the different exercises.
• The motion is the same on the right and left sides.
• The joint angles for free weight 2 and T-bar show a greater difference than free weight 1 and long bar.
Free Weight 1 vs. Long Bar Free Weight 2 vs. T-Bar
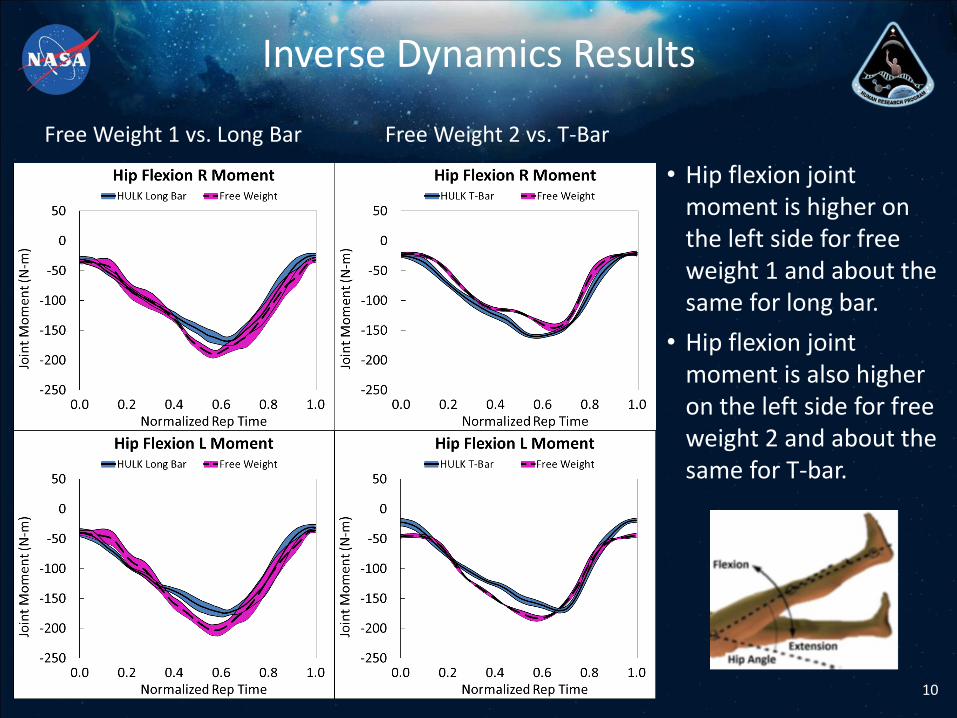
Inverse Dynamics Results
10
• Hip flexion joint moment is higher on the left side for free weight 1 and about the same for long bar.
• Hip flexion joint moment is also higher on the left side for free weight 2 and about the same for T-bar.
Free Weight 1 vs. Long Bar Free Weight 2 vs. T-Bar

Inverse Dynamics Results
11
• Hip adduction moment is higher on the right side for free weight 1 and higher on the left side for long bar.
• Small difference in hip adduction moment for free weight 2 and T-bar.
Free Weight 1 vs. Long Bar Free Weight 2 vs. T-Bar

Inverse Dynamics Results
12
• Knee joint moment is higher on the right side for long bar and about the same for free weight 1.
• Knee joint moment is higher on the right side for T-bar and about the same for free weight 2.
Free Weight 1 vs. Long Bar Free Weight 2 vs. T-Bar

Muscle Force Results
13
• Hip extensor force is higher on the left side of the body for free weight 1 and long bar.
• Hip extensor force is higher on the left side for free weight 2 and the same for T-bar.
Free Weight 1 vs. Long Bar Free Weight 2 vs. T-Bar

Muscle Force Results
14
• Knee extensor force is higher on the left side for free weight 1 and higher on the right side for long bar.
• Knee extensor force is higher on the left side for free weight 2 and the same for T-bar.
Free Weight 1 vs. Long Bar Free Weight 2 vs. T-Bar

Foot Center of Pressure Location
15
The colored shapes represent the center of pressure location of the ground reaction force vector on the bottom of the foot for each time step. On the left two plots, the feet are flat on the ground while pressure is applied near the front of the foot on the right two plots. The lines are connecting the foot marker locations shown as dots.
Right Left Right Left
Heel
Toe
Heel
Toe
Free Weight 2Free Weight 1
HULK Long Bar HULK T-Bar

Conclusions
16
• Both free weight trials show a dominance towards the left side possibly resulting from balancing the free weight bar.
• Both HULK long bar and T-bar show no side preference .
• There is a greater difference in joint angle, joint moment and muscle force between free weight 2 and HULK T-bar than between free weight 1 and HULK long bar.
• The test subjects each had a different exercise technique and foot pressure location and one is not necessarily better than the other.
• The muscle forces and joint moments from the exercises analyzed are consistent with the results from previous trials.