SQL Server™ 2005: Report Builder -...
16
SQL Server™ 2005: Report Builder
Transcript of SQL Server™ 2005: Report Builder -...
SQL Server™ 2005: Report Builder
Table of Contents
SQL Server™ 2005: Report Builder .............................................................................................................................3 Lab Setup.......................................................................................................................................................................4 Exercise 1 Report Model Projects .................................................................................................................................5 Exercise 2 Create a Report using Report Builder ..........................................................................................................9
SQL Server™ 2005: Report Builder
Page 3 of 16
SQL Server™ 2005: Report BuilderObjectives
In this lab, you will familiarize yourself with the new ad-hoc report tool, Report Builder. After completing this lab you will be able to: Create a report model Create a report data source Create an ad-hoc report
Scenario A typical problem with ad-hoc reporting scenarios is the user is forced to understand the underlying schema of the data store not from a business perspective, but rather from the perspective of any application developer. With Report Models, a developer can define the entities, fields, and roles available for ad-hoc reporting. This allows end-users to think in terms of business relationships when building reports with Report Builder. Report Models are support against SQL Server and Analysis Server databases. A single data store is supported per model. However, each model project can contain one or more data models mapped on to the data source’s schema. Report Model projects are created using Business Intelligence Development Studio. Once a Report Model has been created, it is built and deployed to a Report Services Server. From there any user with appropriate permissions can navigate to the server using Internet Explorer and launch the Report Builder ad-hoc reporting tool. Using Report Builder, reports are created using drag & drop. The available entities and fields are exposed via the previously built Report Model. Saved reports are stored on the Reporting Services Server and can be edited using Report Builder or for more advanced scenarios, in the Reporting Services Report Designer.
Prerequisites None
Estimated Time to Complete This Lab
30 Minutes
SQL Server™ 2005: Report Builder
Page 4 of 16
Lab Setup
Tasks Detailed Steps
1. Log in. 1. Log in using the Administrator user account. The password is Pass@word1.
SQL Server™ 2005: Report Builder
Page 5 of 16
Exercise 1 Report Model Projects ScenarioIn this exercise, you will use B
Tasks Detailed Steps
1. Create a Report Model Project NOTE: [Notes if applicable.]
1. Click Start | All Programs | Microsoft SQL Server 2005 CTP | Business Intelligence Development Studio.
2. Click File | New | Project. 3. In the New Project dialog box, in the Project Types pane, click the Business
Intelligence Projects folder. 4. In the Templates pane, click the Report Model Project icon. 5. In the Name text box, type “Sales Report Model”. 6. In the Location text box, enter C:\SQL Labs\User Projects 7. Uncheck the Create directory for Solution checkbox and click OK. The project is created in a new solution; the solution is the largest unit of management in the Business Intelligence Development Studio environment. Each solution contains one or more projects. You can view the solution and its projects in the Solution Explorer pane on the right-hand side in the Business Intelligence Development Studio. If the Solution Explorer is not visible, you can view it by selecting the View | Solution Explorer menu item (or the keyboard shortcut Ctrl + Alt + L).
2. Create a Data Source 1. In the Solution Explorer pane, under the Sales Report Model project, right-click the Data Sources folder, and then select Add Data Source from the context menu.
2. In the Data Source Wizard dialog box, on the Welcome to the Data Source Wizard page, click Next.
3. On the Select how to define the connection page, make sure the Create a data source based on an existing or new connection radio button is chosen. Click New ….
4. In the Connection Manager dialog box, notice how the the SqlClient Data Provider is selected and not changeable.
5. In the Server name drop-down list type localhost. 6. Under Log on to the server, click Use Windows Authentication. 7. In the Select or enter a database name drop-down list, click
AdventureWorks. 8. Click Test Connection. Click OK to dismiss the message box 9. In the Connection Manager dialog box, click OK. 10. In the Data Source Wizard dialog box, on the Select how to define the
connection page, verify that localhost.AdventureWorks is selected, and click Next.
11. On the Completing the Data Source Wizard page, leave the default Data source name Adventure Works unchanged, and then click Finish.
You have now set up the information how to connect to the database you are working
SQL Server™ 2005: Report Builder
Page 6 of 16
Tasks Detailed Steps with. It is now time to define the schema information you want to use in the solution. You do this through the Data Source View.
3. Create a Data Source View
1. In the Solution Explorer pane, under the Sales Report Model project, right-click the Data Source Views folder, and then select Add New Data Source View from the context menu.
2. In the Data Source View Wizard dialog box, on the Welcome to the Data Source View Wizard page, click Next.
3. On the Select Data Source page, in the Relational data sources pane, verify that Adventure Works is selected, and then click Next. The wizard will connect to the data source selected and expose a list of available objects.
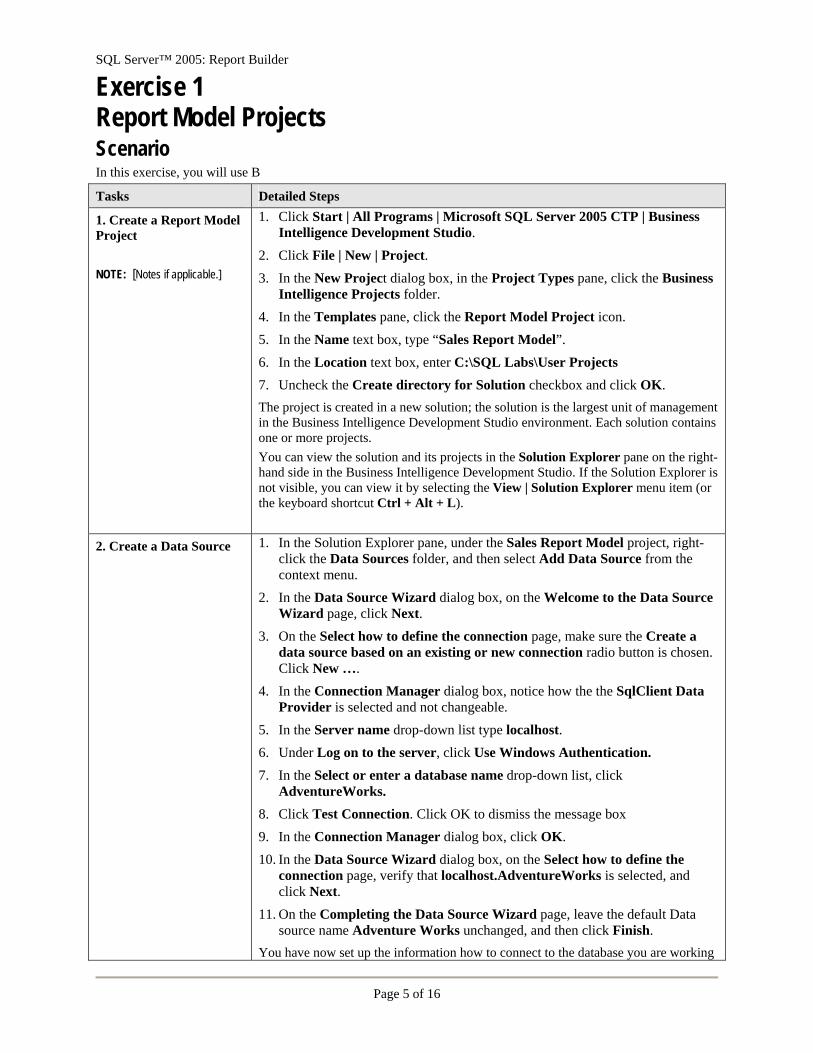
4. On the Select Tables and Views page, add the Person.Contact table by clicking on the table name in the Available objects list, and then clicking the add button (represented by the ‘>’ symbol in the middle of the wizard page). Once the table has been added to the Included objects list, click the Add Releated Tables button at the bottom of the list.
5. Repeat the process by adding the Sales.Customer table and perform the add related tables operation again. Once the related tables have been added, click on the Sales.SalesTerritory table at the bottom of the Included objects list and click the Add Releated Tables button.
6. Finally, add the Sales.SalesOrderDetail table from the Available objects list but do not add related tables. Your list of tables should match those as shown in Figure 1.
Figure 1: Select Tables and Views 7. Click Next. 8. On the Completing the Wizard page, in the Name text box, type Sales and
then click Finish. If you’d like, you can double click on the Sales.dsv item in the Solution Explorer to examine the schema you have defined.
SQL Server™ 2005: Report Builder
Page 7 of 16
Tasks Detailed Steps
4. Create a Report Model NOTE: At Step 6, the Report Model Wizard will take a few moments to read the database schema and generate the model.
1. In the Solution Explorer pane, under the Sales Report Model project, right-click the Report Models folder, and then select Add New Report Model from the context menu.
2. In the Report Model Wizard dialog box, on the Welcome to the Report Model Wizard page, click Next.
3. On the Select Data Source View page, in the Available data source views list, make sure Sales is selected and click Next.
The select report model generation rules allows you to choose the rules which determine how the metadata is generated from the data source. 4. On the Select report model generation rules, accept the defaults and click
Next. 5. On the Update Statistics page, make sure Update statistics before
generating is selected and click Next. 6. On the Completing the Wizard page, click the Run button to generate the
model. When the wizard finishes, click Finish.
5. Deploy the Report Model Project NOTE: At Step 4, it might take a moment for IIS and Reporting Services to initialize.
1. In the Solution Explorer pane, right-click the Sales Report Model project item, and then select Deploy from the context menu.
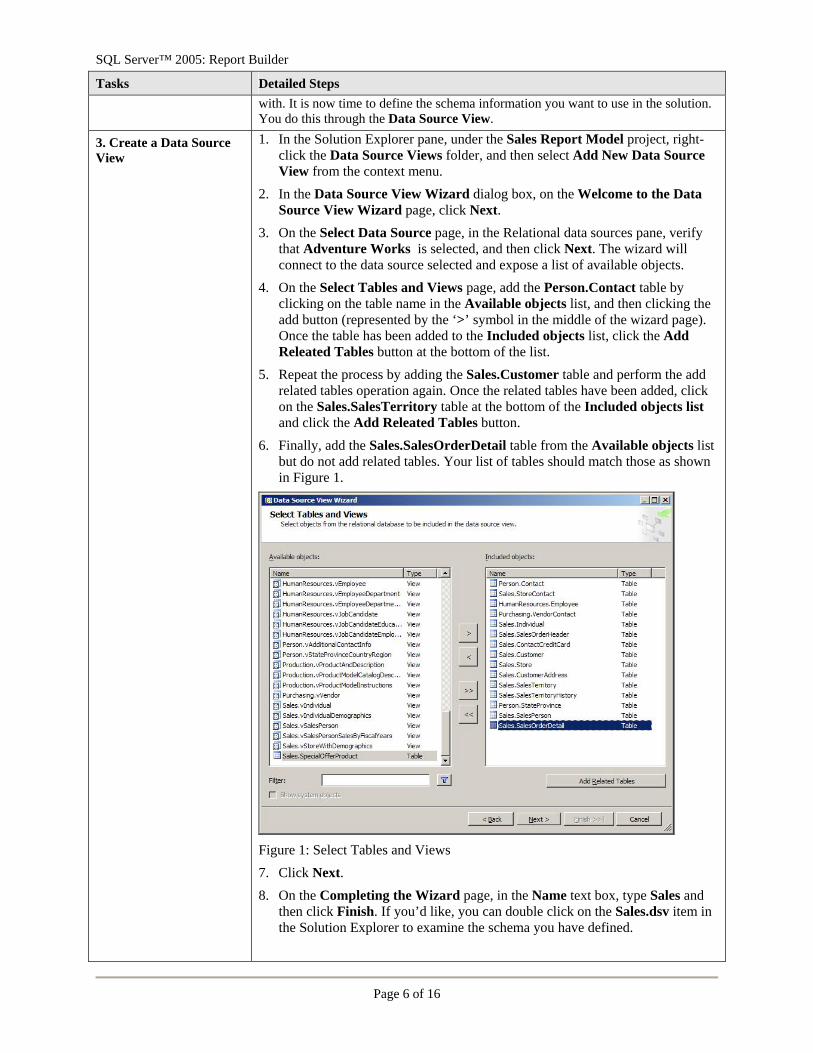
The Output window will open and display the build and deployment process (see Figure 2 for an example of a successful deployment.
Figure 2: Output window after successful Report Model deployment 2. Close Business Intelligence Development Studio by selecting File | Exit.
You should not be prompted to save anything. As part of deployment, Business Intelligence Development Studio saves your work.
3. Click Start | All Programs | Internet Explorer. 4. In the Address bar, enter http://localhost/reports/ and press Enter. Once
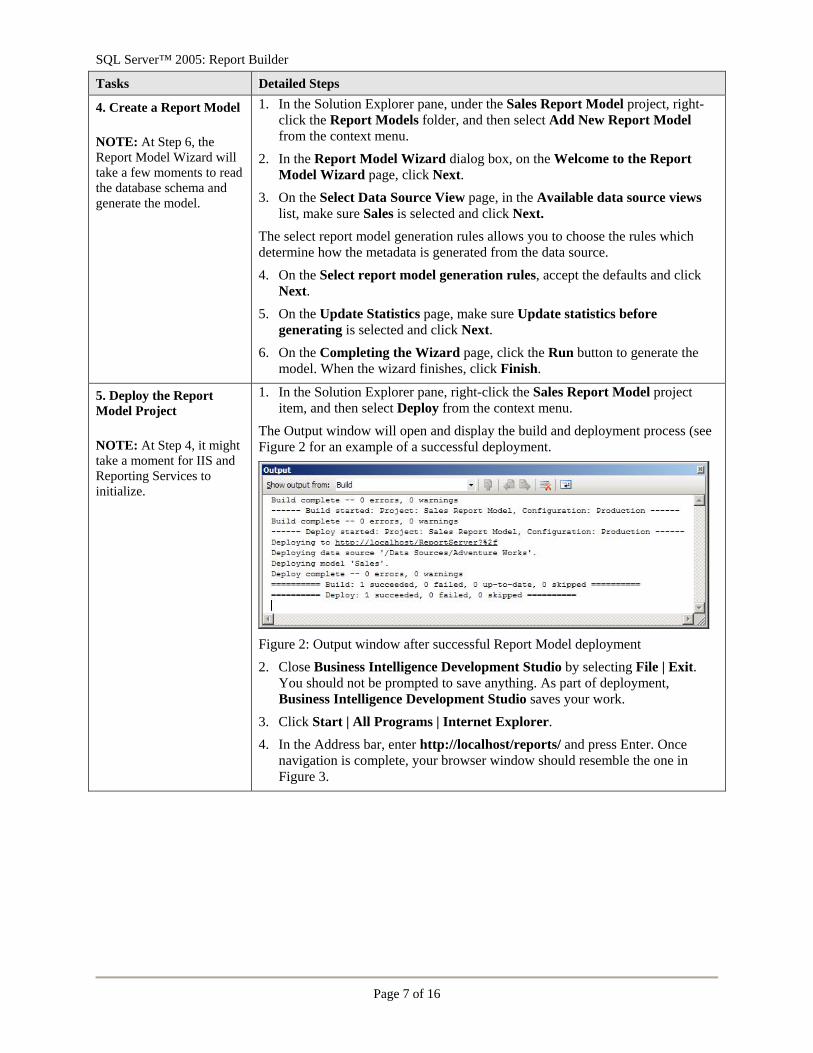
navigation is complete, your browser window should resemble the one in Figure 3.
SQL Server™ 2005: Report Builder
Page 8 of 16
Tasks Detailed Steps
Figure 3: Reporting Services home page 5. Click the Data Sources link. You will see the Adventure Works data source.
Click the Back button of your browser. 6. Click the Models link. You see the Sales report model. 7. Click the Sales link. In the Description field, type Adventure Works Sales
Report Model and click the Apply button. 8. In the upper-left corner, click the Home link.
Now that a Report Model is created, you will create ad-hoc reports using Report Builder.
SQL Server™ 2005: Report Builder
Page 9 of 16
Exercise 2 Create a Report using Report Builder ScenarioReport Builder is installed on the server as part of Reporting Services installation. End-users get the tool installed on their machine via a menu item on the Reporting Services home page. Report Builder is a ClickOnce application.
Tasks Detailed Steps
1. Install Report Builder NOTE: If during step 5 you get a failure dialog, shutdown Internet Explorer and start this exercise over.
1. If it is not already running, click Start | All Programs | Internet Explorer. 2. In the Address bar, enter http://localhost/reports/ and press Enter (if the page
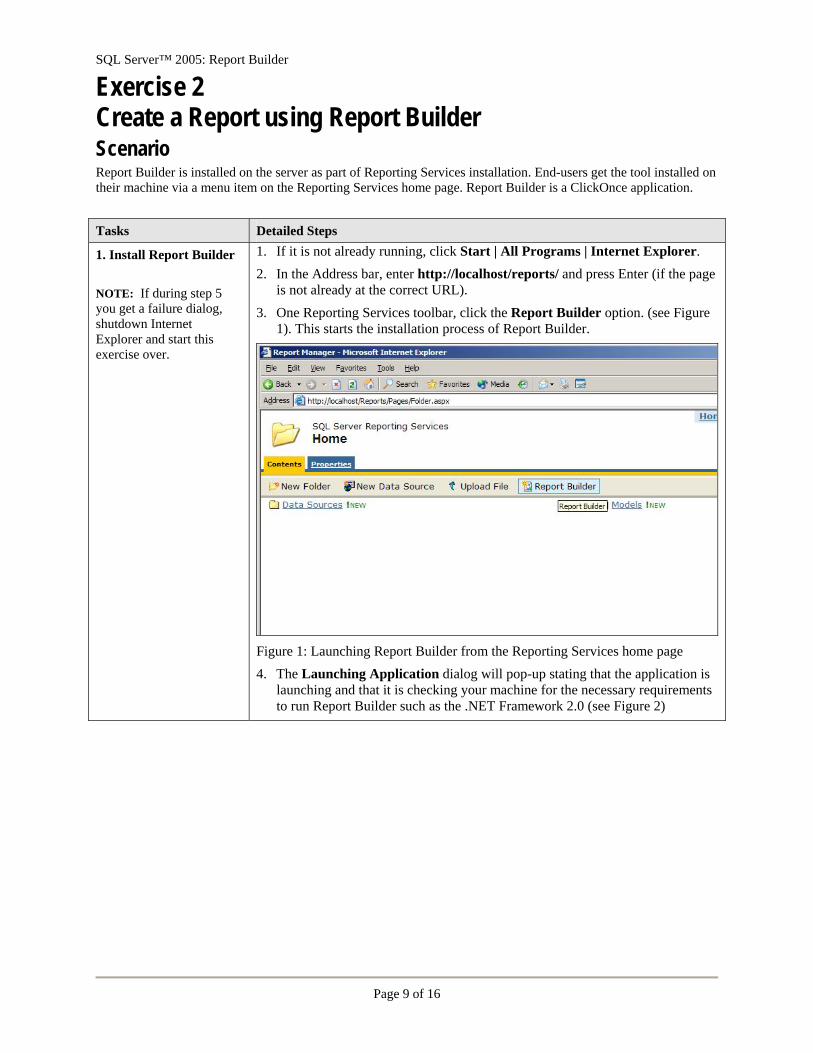
is not already at the correct URL). 3. One Reporting Services toolbar, click the Report Builder option. (see Figure
1). This starts the installation process of Report Builder.
Figure 1: Launching Report Builder from the Reporting Services home page 4. The Launching Application dialog will pop-up stating that the application is
launching and that it is checking your machine for the necessary requirements to run Report Builder such as the .NET Framework 2.0 (see Figure 2)
SQL Server™ 2005: Report Builder
Page 10 of 16
Tasks Detailed Steps
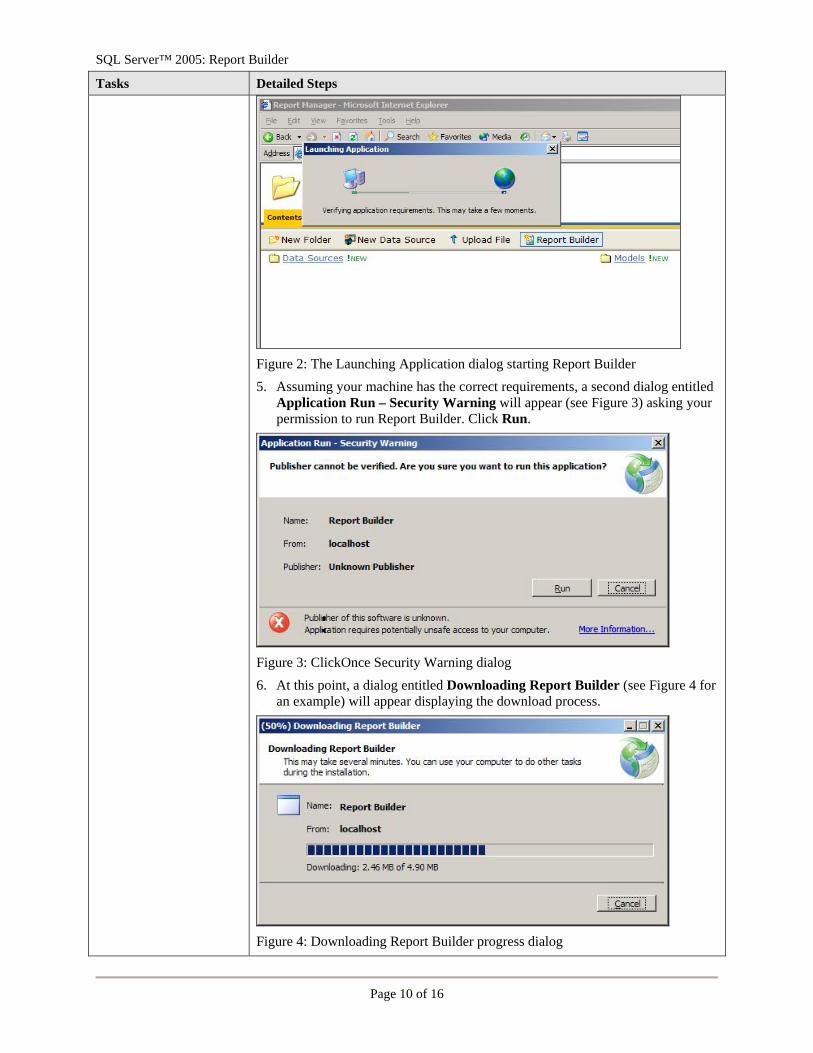
Figure 2: The Launching Application dialog starting Report Builder 5. Assuming your machine has the correct requirements, a second dialog entitled
Application Run – Security Warning will appear (see Figure 3) asking your permission to run Report Builder. Click Run.
Figure 3: ClickOnce Security Warning dialog 6. At this point, a dialog entitled Downloading Report Builder (see Figure 4 for
an example) will appear displaying the download process.
Figure 4: Downloading Report Builder progress dialog
SQL Server™ 2005: Report Builder
Page 11 of 16
Tasks Detailed Steps 7. Once the download and installation is complete, the Report Builder splash
screen should flash briefly and Report Builder should be started with the New Report dialog open.
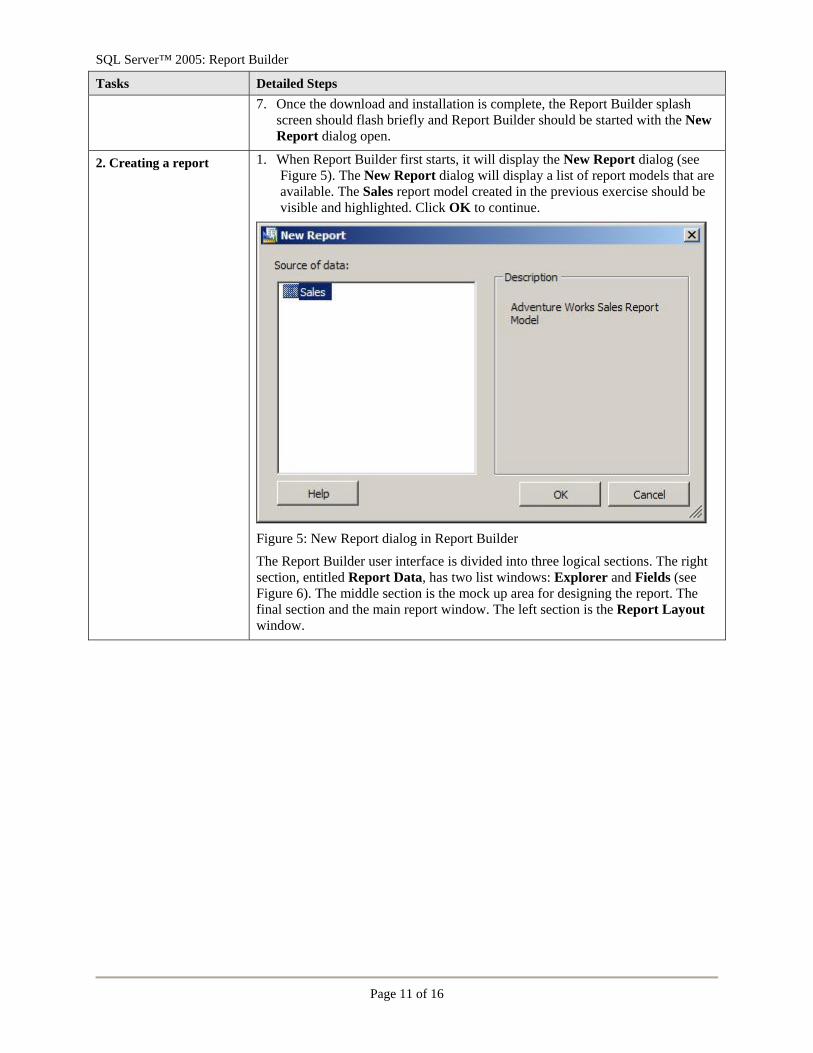
2. Creating a report 1. When Report Builder first starts, it will display the New Report dialog (see Figure 5). The New Report dialog will display a list of report models that are available. The Sales report model created in the previous exercise should be visible and highlighted. Click OK to continue.
Figure 5: New Report dialog in Report Builder The Report Builder user interface is divided into three logical sections. The right section, entitled Report Data, has two list windows: Explorer and Fields (see Figure 6). The middle section is the mock up area for designing the report. The final section and the main report window. The left section is the Report Layout window.
SQL Server™ 2005: Report Builder
Page 12 of 16
Tasks Detailed Steps
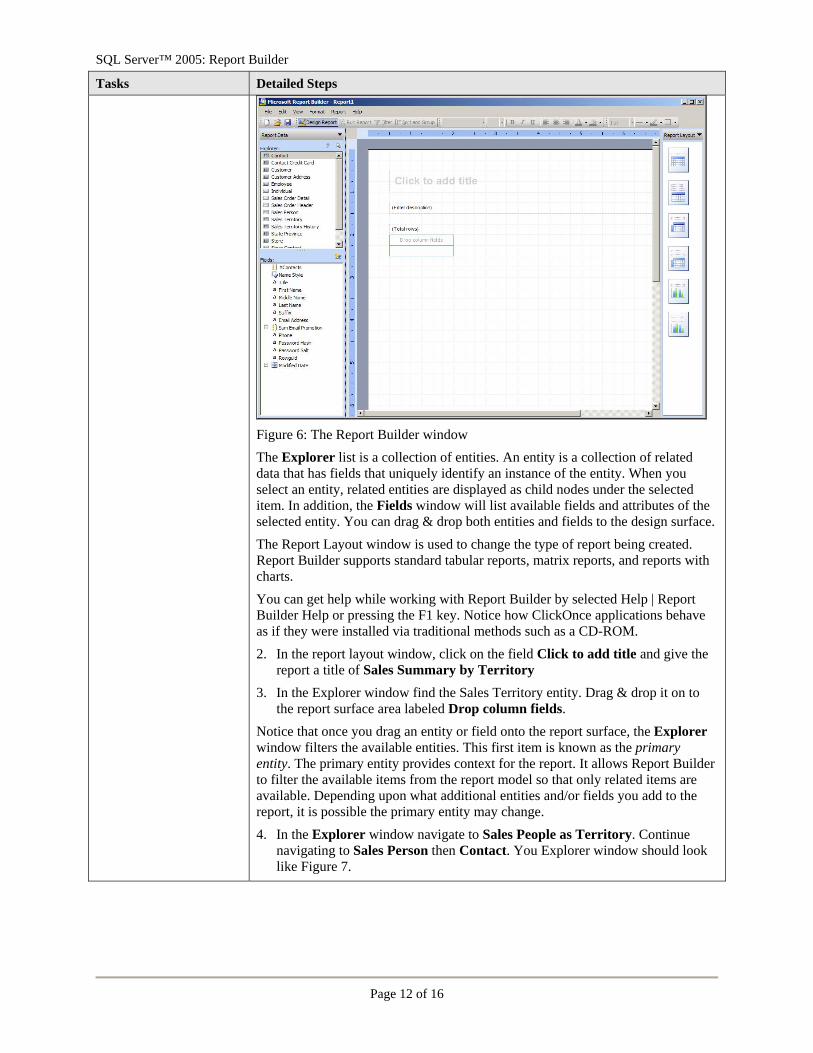
Figure 6: The Report Builder window The Explorer list is a collection of entities. An entity is a collection of related data that has fields that uniquely identify an instance of the entity. When you select an entity, related entities are displayed as child nodes under the selected item. In addition, the Fields window will list available fields and attributes of the selected entity. You can drag & drop both entities and fields to the design surface. The Report Layout window is used to change the type of report being created. Report Builder supports standard tabular reports, matrix reports, and reports with charts. You can get help while working with Report Builder by selected Help | Report Builder Help or pressing the F1 key. Notice how ClickOnce applications behave as if they were installed via traditional methods such as a CD-ROM. 2. In the report layout window, click on the field Click to add title and give the
report a title of Sales Summary by Territory 3. In the Explorer window find the Sales Territory entity. Drag & drop it on to
the report surface area labeled Drop column fields. Notice that once you drag an entity or field onto the report surface, the Explorer window filters the available entities. This first item is known as the primary entity. The primary entity provides context for the report. It allows Report Builder to filter the available items from the report model so that only related items are available. Depending upon what additional entities and/or fields you add to the report, it is possible the primary entity may change. 4. In the Explorer window navigate to Sales People as Territory. Continue
navigating to Sales Person then Contact. You Explorer window should look like Figure 7.
SQL Server™ 2005: Report Builder
Page 13 of 16
Tasks Detailed Steps
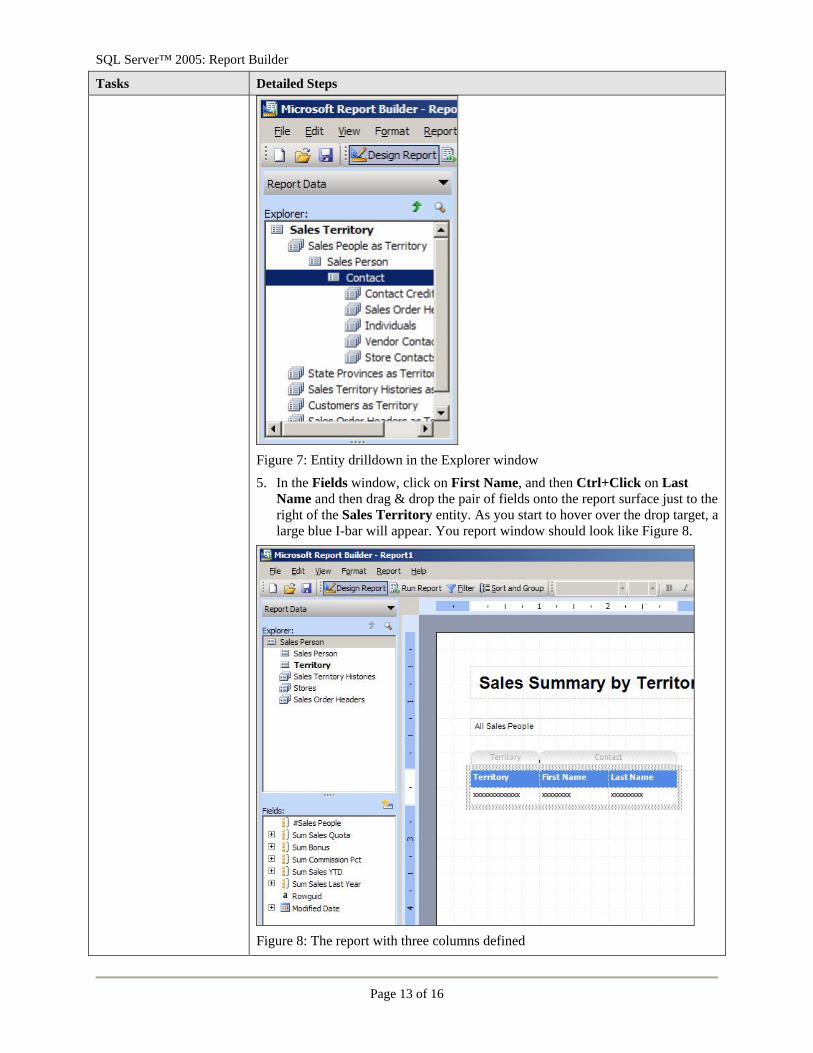
Figure 7: Entity drilldown in the Explorer window 5. In the Fields window, click on First Name, and then Ctrl+Click on Last
Name and then drag & drop the pair of fields onto the report surface just to the right of the Sales Territory entity. As you start to hover over the drop target, a large blue I-bar will appear. You report window should look like Figure 8.
Figure 8: The report with three columns defined
SQL Server™ 2005: Report Builder
Page 14 of 16
Tasks Detailed Steps Notice that the primary entity has changed to Sales Person in the Explorer window. 6. In the Explorer window, navigate to the Sales Order Headers entity. From
the Fields window, drag & drop #Sales Order Headers to the right of the Contact fields.
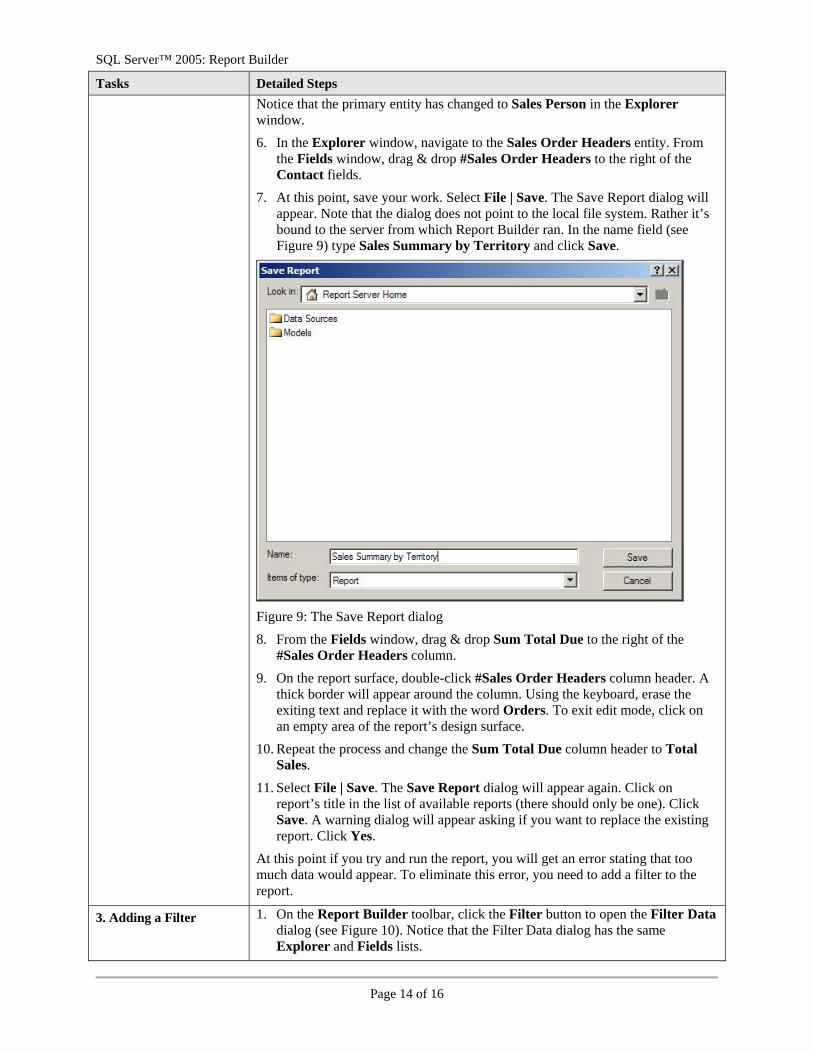
7. At this point, save your work. Select File | Save. The Save Report dialog will appear. Note that the dialog does not point to the local file system. Rather it’s bound to the server from which Report Builder ran. In the name field (see Figure 9) type Sales Summary by Territory and click Save.
Figure 9: The Save Report dialog 8. From the Fields window, drag & drop Sum Total Due to the right of the
#Sales Order Headers column. 9. On the report surface, double-click #Sales Order Headers column header. A
thick border will appear around the column. Using the keyboard, erase the exiting text and replace it with the word Orders. To exit edit mode, click on an empty area of the report’s design surface.
10. Repeat the process and change the Sum Total Due column header to Total Sales.
11. Select File | Save. The Save Report dialog will appear again. Click on report’s title in the list of available reports (there should only be one). Click Save. A warning dialog will appear asking if you want to replace the existing report. Click Yes.
At this point if you try and run the report, you will get an error stating that too much data would appear. To eliminate this error, you need to add a filter to the report.
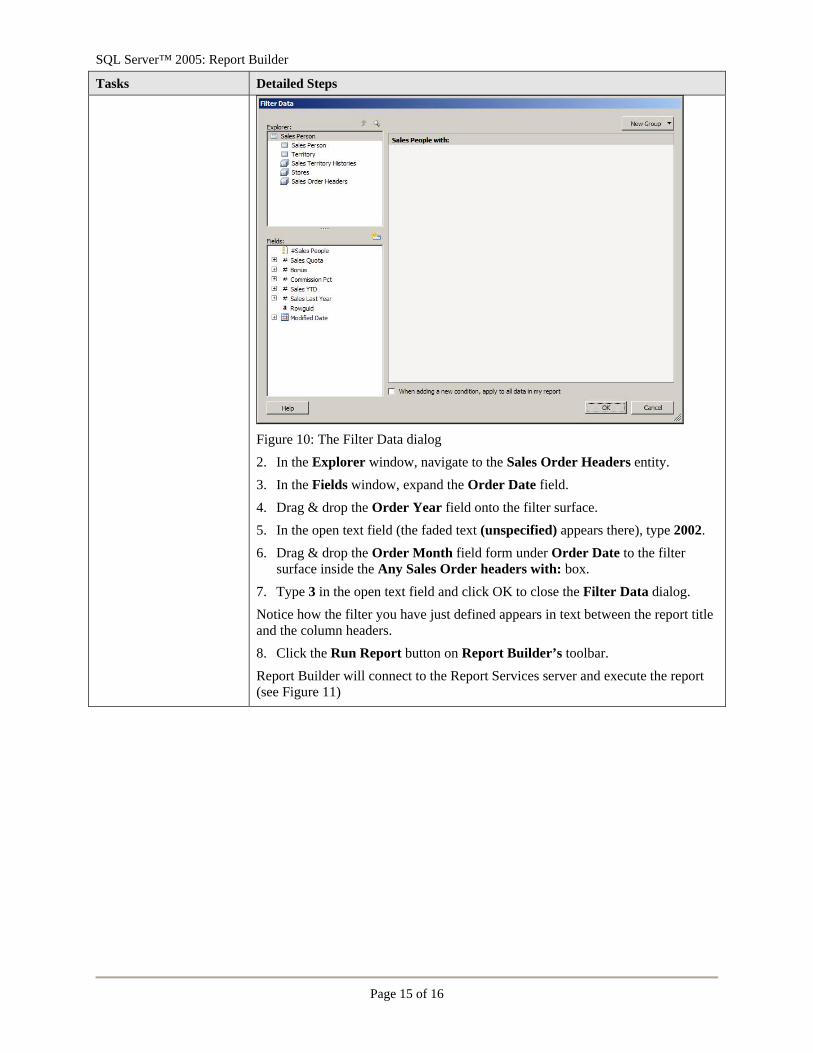
3. Adding a Filter 1. On the Report Builder toolbar, click the Filter button to open the Filter Data dialog (see Figure 10). Notice that the Filter Data dialog has the same Explorer and Fields lists.
SQL Server™ 2005: Report Builder
Page 15 of 16
Tasks Detailed Steps
Figure 10: The Filter Data dialog 2. In the Explorer window, navigate to the Sales Order Headers entity. 3. In the Fields window, expand the Order Date field. 4. Drag & drop the Order Year field onto the filter surface. 5. In the open text field (the faded text (unspecified) appears there), type 2002. 6. Drag & drop the Order Month field form under Order Date to the filter
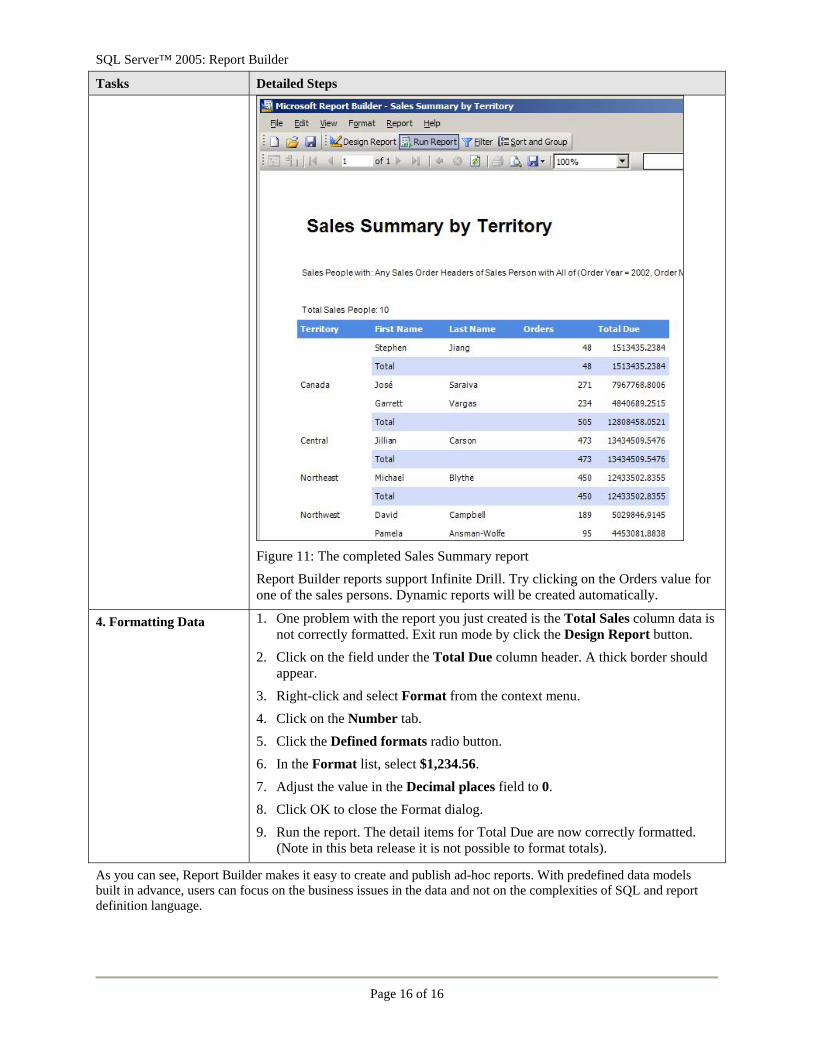
surface inside the Any Sales Order headers with: box. 7. Type 3 in the open text field and click OK to close the Filter Data dialog. Notice how the filter you have just defined appears in text between the report title and the column headers. 8. Click the Run Report button on Report Builder’s toolbar. Report Builder will connect to the Report Services server and execute the report (see Figure 11)
SQL Server™ 2005: Report Builder
Page 16 of 16
Tasks Detailed Steps
Figure 11: The completed Sales Summary report Report Builder reports support Infinite Drill. Try clicking on the Orders value for one of the sales persons. Dynamic reports will be created automatically.
4. Formatting Data
1. One problem with the report you just created is the Total Sales column data is not correctly formatted. Exit run mode by click the Design Report button.
2. Click on the field under the Total Due column header. A thick border should appear.
3. Right-click and select Format from the context menu. 4. Click on the Number tab. 5. Click the Defined formats radio button. 6. In the Format list, select $1,234.56. 7. Adjust the value in the Decimal places field to 0. 8. Click OK to close the Format dialog. 9. Run the report. The detail items for Total Due are now correctly formatted.
(Note in this beta release it is not possible to format totals).
As you can see, Report Builder makes it easy to create and publish ad-hoc reports. With predefined data models built in advance, users can focus on the business issues in the data and not on the complexities of SQL and report definition language.