SPSS 14.0 for Windows What’s New in SPSS 14.0 for Windows 14 Vorabinfos.pdf · What’s New in...
8
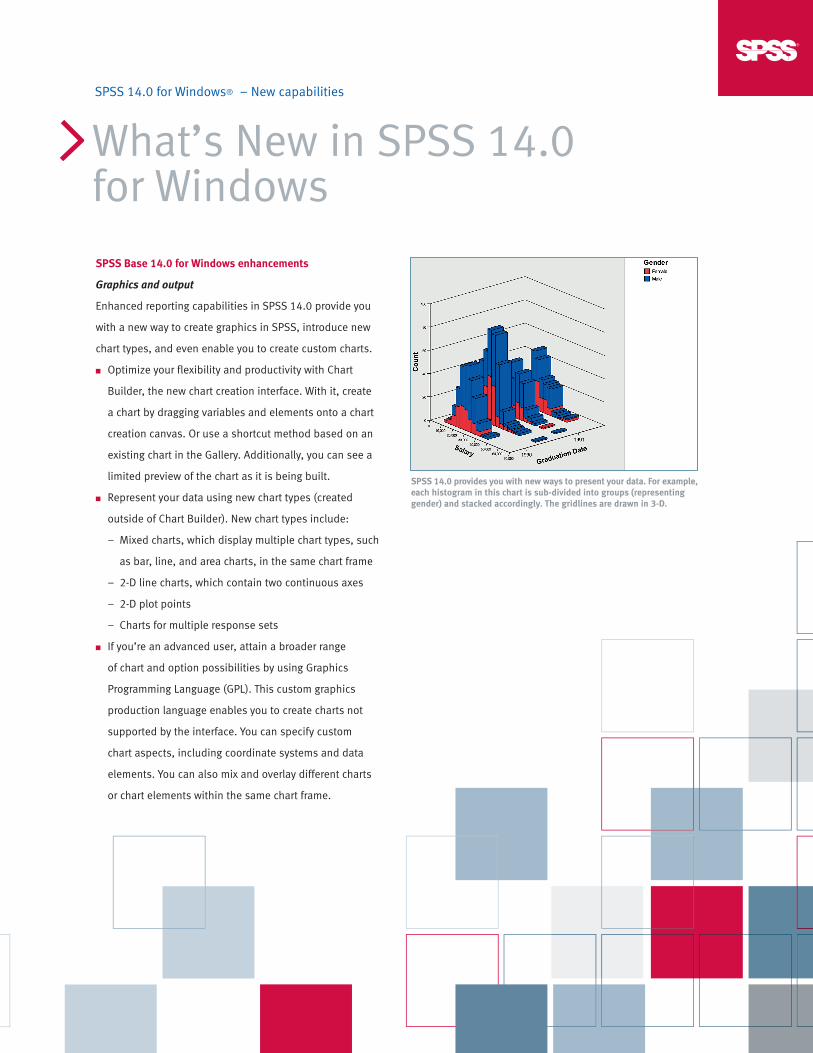
What’s New in SPSS 14.0 for Windows SPSS 14.0 for Windows ® – New capabilities SPSS Base 14.0 for Windows enhancements Graphics and output Enhanced reporting capabilities in SPSS 14.0 provide you with a new way to create graphics in SPSS, introduce new chart types, and even enable you to create custom charts. ■ Optimize your flexibility and productivity with Chart Builder, the new chart creation interface. With it, create a chart by dragging variables and elements onto a chart creation canvas. Or use a shortcut method based on an existing chart in the Gallery. Additionally, you can see a limited preview of the chart as it is being built. ■ Represent your data using new chart types (created outside of Chart Builder). New chart types include: – Mixed charts, which display multiple chart types, such as bar, line, and area charts, in the same chart frame – 2-D line charts, which contain two continuous axes – 2-D plot points – Charts for multiple response sets ■ If you’re an advanced user, attain a broader range of chart and option possibilities by using Graphics Programming Language (GPL). This custom graphics production language enables you to create charts not supported by the interface. You can specify custom chart aspects, including coordinate systems and data elements. You can also mix and overlay different charts or chart elements within the same chart frame. SPSS 14.0 provides you with new ways to present your data. For example, each histogram in this chart is sub-divided into groups (representing gender) and stacked accordingly. The gridlines are drawn in 3-D.
Transcript of SPSS 14.0 for Windows What’s New in SPSS 14.0 for Windows 14 Vorabinfos.pdf · What’s New in...
What’s New in SPSS 14.0 for Windows
SPSS 14.0 for Windows® – New capabilities
SPSS Base 14.0 for Windows enhancements
Graphics and output
Enhanced reporting capabilities in SPSS 14.0 provide you
with a new way to create graphics in SPSS, introduce new
chart types, and even enable you to create custom charts.
■ Optimize your flexibility and productivity with Chart
Builder, the new chart creation interface. With it, create
a chart by dragging variables and elements onto a chart
creation canvas. Or use a shortcut method based on an
existing chart in the Gallery. Additionally, you can see a
limited preview of the chart as it is being built.
■ Represent your data using new chart types (created
outside of Chart Builder). New chart types include:
– Mixed charts, which display multiple chart types, such
as bar, line, and area charts, in the same chart frame
– 2-D line charts, which contain two continuous axes
– 2-D plot points
– Charts for multiple response sets
■ If you’re an advanced user, attain a broader range
of chart and option possibilities by using Graphics
Programming Language (GPL). This custom graphics
production language enables you to create charts not
supported by the interface. You can specify custom
chart aspects, including coordinate systems and data
elements. You can also mix and overlay different charts
or chart elements within the same chart frame.
SPSS 14.0 provides you with new ways to present your data. For example, each histogram in this chart is sub-divided into groups (representing gender) and stacked accordingly. The gridlines are drawn in 3-D.

Data and access management
More powerful data management in SPSS Base 14.0
provides you with a number of new features to save time,
work with new file types, increase accuracy and
reliability—and better manage your data. You can now:
■ Open multiple datasets within a single SPSS session.
This enables you to save time and condense steps
when merging data files. This also helps you maintain
consistency when copying data dictionary information
between multiple files.
■ Directly import data from Dimensions™ products,
including mrInterview™. This enables you to bypass
your system administrator and save time by importing
data from Dimensions yourself.
■ Import from and export to OLE DB data sources
without having to go through ODBC. This helps improve
performance, especially when your data are large.
■ Read/write Stata® files
■ Read SAS® compressed files
■ Easily find and replace text strings in your data using
the new find/replace function for transformations
■ Better describe categorical data because value label
length has increased to 120 bytes, which is double
the previous limit
■ Clone or duplicate datasets. This enables you to protect
the original dataset while performing transformations
or doing analyses on a duplicate dataset.
■ Access data in SPSS using the latest versions of popular
operating systems and databases. SPSS 14.0 updates
the Data Access Pack to Connect ODBC 5.1.
Programmability
You can now control the flow of your syntax jobs using
Python, an open-source programming language that is
embedded in SPSS. Programs written in Python can be
used to control, or make decisions about, which syntax
is executed based on:
■ Variable attributes
■ Procedure output
■ Error codes
Licensing
Several updates to the licensing features in SPSS Base
14.0 give your organization more flexibility and reliability:
■ Ensure primary or high-priority users always have access
to the SPSS software they need using network license
reservations and priority settings
■ Provide “on-the-road access” to SPSS software. A
network commuter license enables users to work
unconnected to your network.
■ Protect against downtime when a License Manager
fails. Your network administrators can now set up
multiple License Managers for redundancy so that
applications are uninterrupted in the case of a failure.
When a License Manager fails, a license from another
License Manager automatically takes over.
This dual Y chart displays multiple coordinate systems—plotting both acceleration and power against vehicle weight. A Loess smoother is used on each of them.
2

New SPSS add-on module: SPSS Data Validation™
This new add-on module enables you to streamline the
data validation process, eliminate labor-intensive manual
checks—and reach more accurate results. With it, you can:
■ Easily identify suspicious and invalid cases, variables,
and data values; view patterns of missing data; and
summarize variable distributions. With this knowledge,
you can determine data validity and remove or correct
suspicious cases at your discretion prior to analysis.
The Validate Data procedure performs automatic data
checks based on each variable’s measure level (whether
categorical or continuous). For example, the procedure
runs a frequency for categorical-level data and displays
all cases showing a “4” on a three-point scale. You can
specify validation rules for individual variables (such as
range checks) and cross-variable checks (for example,
“pregnant males”).
■ Easily detect multivariate outliers so that you can further
examine them and determine if they should be included
in your analyses. The anomaly detection procedure
searches for unusual cases based upon deviations from
similar cases and gives reasons for such deviations. It
enables you to flag outliers by creating a new variable.
SPSS Trends™ 14.0 enhancements
Obtain easier and more powerful forecasting with
improvements to SPSS Trends. You can now:
■ Produce accurate time-series models even if you have
little or no experience with time-series data. The new
Expert Modeler feature in the SPSS Trends add-on
module automatically determines which ARIMA
(autoregressive integrated moving average process)
or exponential smoothing model best fits your time-
series and independent variables, eliminating selection
through trial and error. You do not have to know how
to choose proper ARIMA orders or achieve stationarity
(in which a variable has a constant mean, variance,
and autocorrelation over time) in order to create time-
series models.
— If you’re an experienced time-series modeler, you
can use the Expert Modeler to bypass many manual
or tedious tests and steps. Or, if you prefer, provide
the Expert Modeler with a partial or exact set of
parameters to use as it searches for a model.
■ Save hours or even days of work because you can model
hundreds of time-series variables at once, rather than
one series at a time. Because the module presents
results in an organized fashion, you can concentrate
on the models that need closer examination.
■ Reforecast and re-estimate time-series models when
new data is available. If your models are not fitting as
well as they originally did, you can quickly re-estimate
your models using new data.
3

SPSS Tables™ 14.0 enhancements
Gain two more ways to display results in SPSS Tables:
■ Run significance tests on multiple response variables
■ Exclude categories used in subtotal calculations
from significance tests on the fly, even when they
are displayed (not hidden) in the base table
SPSS Categories™ 14.0 enhancements
The new preference scaling (PREFSCAL) procedure in
SPSS Categories enables you to:
■ Visually examine the relationship between objects. Set
up this procedure in syntax to perform multidimensional
unfolding on two sets of objects in order to find a common
quantitative scale. Developed by the Data Theory Group
at Leiden University, this is the only known algorithm
that can perform non-metric analyses for ordinal data
without giving degenerate solutions (as, for example,
ALSCAL does).
Amos™ 6.0 enhancements
Amos provides you with powerful and easy-to-use structural
equation modeling (SEM) software. It enables you to create
more realistic models than if you used standard multivariate
statistics or multiple regression models alone. You can now
easily incorporate Amos into your SPSS workflow. Amos
itself has several enhancements that enable you to:
■ Obtain Bayesian estimates of model parameters and
other quantities with Markov chain Monte Carlo (MCMC)
estimation. Bayesian analysis enables you to apply your
subject-area expertise or business insight to improve
estimates by specifying an informative prior distribution.
You can:
— Reliably fit structural equation and related models
to smaller samples
— Estimate any function of model parameters. For
example, compute the difference between direct
and indirect effects. Observed data can be complete
or incomplete.
— Investigate the assumptions of maximum likelihood
estimation by plotting the marginal likelihood of
any parameter
— Avoid inadmissible model parameter estimates, such
as negative variance estimates, through the choice of
prior distribution or a global option
— Prevent unstable solutions of systems of linear
equations in non-recursive models (for example,
models with bi-directional causality) through a
global setting
— Perform tests of custom hypotheses that are not
easily obtained using maximum likelihood or other
estimation methods
— Compute optimal asymmetric confidence intervals
for indirect effects
■ Create datasets with missing values or latent variables
filled in. Choose from three data imputation methods:
regression, stochastic regression, or Bayesian. Use
regression imputation to create a single completed
dataset. Use stochastic regression imputation or
Bayesian imputation to create multiple imputed
datasets. You can impute missing values or factor scores.
4

SPSS Server™ 14.0 enhancements
SPSS Server continues to help your organization increase
its productivity by giving you the ability to:
■ Create models more quickly and accurately using the
feature selection and naïve Bayes algorithms
— The feature selection algorithm enables you to
reduce the set of variables (or predictors) available
to include only those that are most relevant for
modeling. This algorithm supports categorical and
continuous independent and dependent variables,
and accepts very large sets of predictors (up to 100,000).
— The naïve Bayes algorithm also enables you to select
predictors to reduce the set of variables (or predictors)
available to include only those that are most relevant
for modeling. Unlike the feature selection algorithm,
however, the naïve Bayes algorithm uses a multivariate
model to select predictors. Also, this algorithm is
available for categorical-dependent variables only.
Predictors can be continuous or categorical, and the
algorithm is best used when you have fewer than
200 predictors.
■ Use the interface or syntax to score new data in the
scoring engine, which assigns predicted values and
probabilities to new data using previously created
models
■ Reduce network traffic and improve performance with
the data-free client feature. You can prepare and analyze
data using the full gamut of SPSS functionality without
the additional overheads involved when data is delivered
to the client. Your network administrator controls this
event and can enable or disable delivery of the SPSS
client on a per user, per group, or universal basis.
System requirements
SPSS Base 14.0 for Windows
■ Operating system: Windows XP, 2000, and Me are the
preferred platforms. Windows 98 is also supported.
■ Hardware: Intel® Pentium-compatible processor
■ Memory: 300MB RAM minimum
■ Minimum free drive space: 220MB
■ SVGA monitor
SPSS 14.0 add-on modules
■ All SPSS 14.0 add-on modules require SPSS Base 14.0
for Windows
■ Memory: See individual specification sheets or
www.spss.com for information on minimum
required RAM
Amos 6.0
■ Operating system: Windows XP, 2000, or Me
■ Memory: 256MB RAM minimum
■ Minimum free drive space: 125MB
■ Web browser: Internet Explorer 6
SPSS Server 14.0
■ System requirements vary according to platform.
Contact your SPSS account representative for
requirements on your platform.
5
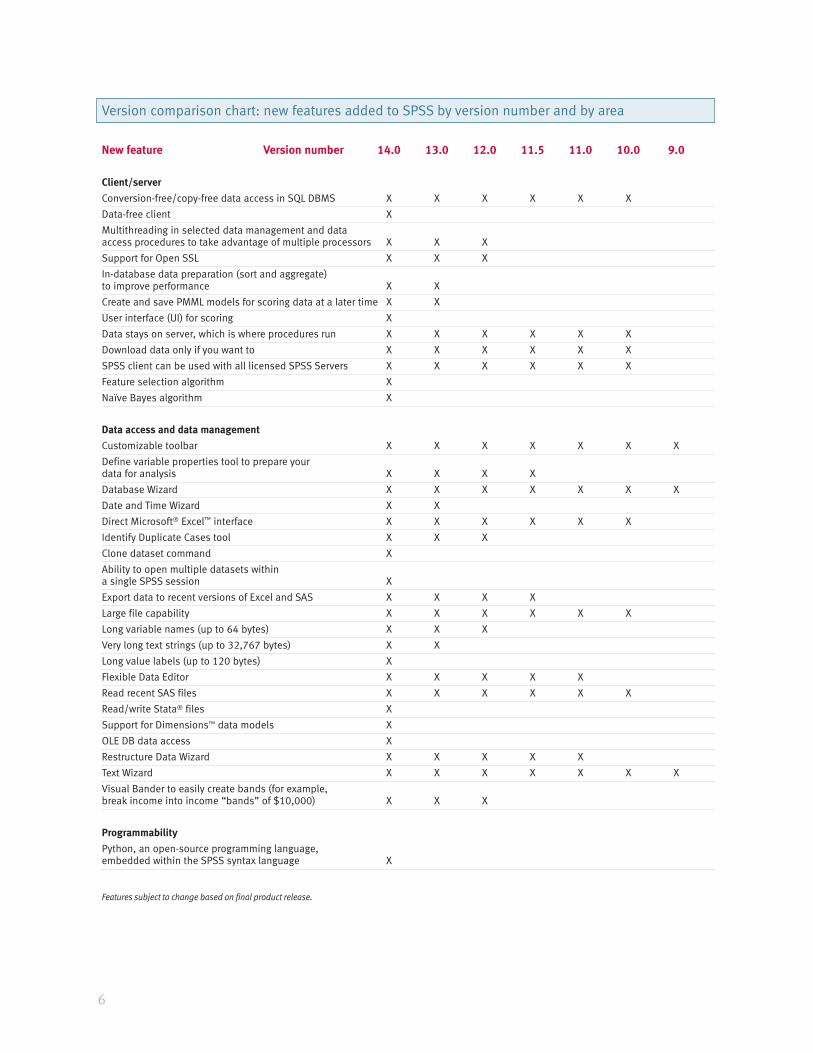
Version comparison chart: new features added to SPSS by version number and by area
New feature Version number 14.0 13.0 12.0 11.5 11.0 10.0 9.0
Client/server
Conversion-free/copy-free data access in SQL DBMS X X X X X X
Data-free client X
Multithreading in selected data management and data access procedures to take advantage of multiple processors X X X
Support for Open SSL X X X
In-database data preparation (sort and aggregate) to improve performance X X
Create and save PMML models for scoring data at a later time X X
User interface (UI) for scoring X
Data stays on server, which is where procedures run X X X X X X
Download data only if you want to X X X X X X
SPSS client can be used with all licensed SPSS Servers X X X X X X
Feature selection algorithm X
Naïve Bayes algorithm X
Data access and data management
Customizable toolbar X X X X X X X
Define variable properties tool to prepare your data for analysis X X X X
Database Wizard X X X X X X X
Date and Time Wizard X X
Direct Microsoft® Excel™ interface X X X X X X
Identify Duplicate Cases tool X X X
Clone dataset command X
Ability to open multiple datasets within a single SPSS session X
Export data to recent versions of Excel and SAS X X X X
Large file capability X X X X X X
Long variable names (up to 64 bytes) X X X
Very long text strings (up to 32,767 bytes) X X
Long value labels (up to 120 bytes) X
Flexible Data Editor X X X X X
Read recent SAS files X X X X X X
Read/write Stata® files X
Support for Dimensions™ data models X
OLE DB data access X
Restructure Data Wizard X X X X X
Text Wizard X X X X X X X
Visual Bander to easily create bands (for example, break income into income “bands” of $10,000) X X X
Programmability
Python, an open-source programming language, embedded within the SPSS syntax language X
Features subject to change based on final product release.
6

Version comparison chart: new features added to SPSS by version number and by area
New feature Version number 14.0 13.0 12.0 11.5 11.0 10.0 9.0
Analysis
Ability to run multiple SPSS sessions simultaneously and switch sessions X X X X X X
CATPCA and PROXSCAL (in SPSS Categories add-on module) X X X X X X
Multiple correspondence analysis (in SPSS Categories add-on module) X X
Preference scaling (in SPSS Categories add-on module) X
Cluster analysis (in SPSS Base) X X X X X X X
TwoStep cluster analysis (in SPSS Base) X X X X
Descriptive ratio statistics X X X X X
Discriminant analysis (in SPSS Base) X X X X X X X
Factor analysis (in SPSS Base) X X X X X X X
General linear models (GLM) (in SPSS Advanced Models™ add-on module) X X X X X X X
Linear mixed models (also known as hierarchical linear models) (in SPSS Advanced Models add-on module) X X X X X
Multinomial logistic regression (in SPSS Regression Models™ add-on module) X X X X X X X
Stepwise multinomial logistic regression (in SPSS Regression Models add-on module) X X X
PoLytomous universal models (PLUM) to model ordinal outcomes (in SPSS Advanced Models add-on module) X X X X X X
Reliability and ALSCAL multidimensional scaling and matrix operations (in SPSS Base) X X X X X X X
Receiver-operating characteristic (ROC) analysis (in SPSS Base) X X X X X X X
SPSS Complex Samples™ add-on module X X X
Complex samples general linear model (in SPSS Complex Samples add-on module) X X
Complex samples logistic regression (in SPSS Complex Samples add-on module) X X
Varcomp (in SPSS Advanced Models add-on module) X X X X X X X
SPSS Classification Trees™ add-on module X X
Validate data procedure in (in SPSS Data Validation add-on module) X
Anomaly detection for multivariate outliers (in SPSS Data Validation add-on module) X
Enhanced SPSS Trends add-on module X
Bayesian analysis (in Amos 6.0 structural equation modeling software) X
Regression imputation, stochastic regression imputation, and multiple Bayesian imputation (in Amos 6.0 structural equation modeling software) X
Graphs
IGRAPH (interactive graphs) X X X X X X X
SPSS Maps™ add-on module for creating high-quality maps and performing demographic analysis X X X X X X
Presentation graphics system X X X
Chart Builder user interface for SPSS graphics X
Support for SPSS Inc.’s Graphics Programming Language (GPL) X
Features subject to change based on final product release.
7

To learn more, please visit www.spss.com. For SPSS office locations and telephone numbers, go to www.spss.com/worldwide.
SPSS is a registered trademark and the other SPSS products named are trademarks of SPSS Inc. All other names are trademarks of their respective owners. © 2005 SPSS Inc. All rights reserved. S14CMP-0705
Version comparison chart: new features added to SPSS by version number and by area
New feature Version number 14.0 13.0 12.0 11.5 11.0 10.0 9.0
Graphs (continued)
Population pyramids (also called mirror charts or dual charts), 3-D bar charts, and dot charts (also called dot density charts) X X
Mixed charts, 2-D line charts, 2-D plot points, and charts for multiple response sets X
Additional chart display features/options, including paneled charts and error bars on categorical charts X X
Output
XML model export for model deployment with SmartScore® X X X X X X
Enhanced SPSS Tables™ module with table preview builder and inferential statistics X X X X
Draft Viewer/text output and control X X X X X X X
Export output to Microsoft Excel X X X X
Export output to Microsoft Word X X X X
Export output to Microsoft PowerPoint® X X
HTML output X X X X X X X
Layered reports/OLAP cubes X X X X X X X
Output Navigator/Viewer X X X X X X X
Output scripting/programming in Basic X X X X X X X
Pivot tables/report cubes X X X X X X X
Output management system (turn pivot table output, such as SPSS data files, XML, and HTML, into data/input) X X X
Interactive interface for the output management system X X
Switch output language X X X X
TableLooks™ X X X X X X X
Table to graph X X X X X X
Licensing improvements
Network license reservations and priority settings X
Network commuter license X
License manager redundancy X
Help
Interactive case studies X X X X X
“SPSS Manuals on CD,” featuring manuals in PDF format for SPSS Base and all add-on modules X X X
Results Coach™ X X X X X X X
Statistical Coach™ X X X X X X X
Tutorial X X X X X X X
Chart tutorial X X
“What's This?” (context-sensitive help) X X X X X X X
Features subject to change based on final product release.