Sprott conference 2016 corporate presentation
42
VALUE THROUGH GOLD SPROTT NATURAL RESOURCE SYMPOSIUM July 26, 2016
-
Upload
pretiumr -
Category
Investor Relations
-
view
2.301 -
download
1
Transcript of Sprott conference 2016 corporate presentation

1
VA LU E T H R O U G H G O L D
SPROTT NATURAL RESOURCE SYMPOSIUMJuly 26, 2016

2
CAUTIONARY STATEMENT
Forward Looking InformationThis Presentation contains “forward-looking information” and “forward looking statements” within the meaning of applicable Canadian and United States securities legislation. Forward-looking information may include, but is not limited to, the anticipated production and developments in our operations in future periods, information with respect to our planned exploration and development activities, the adequacy of our financial resources, the estimation of mineral reserves and resources including the 2016 Valley of the Kings Mineral Resource estimate, realization of mineral reserve and resource estimates and timing of development of our Brucejack Project, costs and timing of future exploration, results of future exploration and drilling, production and processing estimates, capital and operating cost estimates, timelines and similar statements relating to the economic viability of the Brucejack Project, timing and receipt of approvals, consents and permits under applicable legislation, our executive compensation approach and practice, the composition of our board of directors and committees and adequacy of financial resources. Wherever possible, words such as “plans”, “expects”, “projects”, “assumes”, “budget”, “strategy”, “scheduled”, “estimates”, “forecasts”, “anticipates”, “believes”, “intends”, “targets” and similar expressions or statements that certain actions, events or results “may”, “could”, “would”, “might” or “will” be taken, occur or be achieved, or the negative forms of any of these terms and similar expressions, have been used to identify forward-looking statements and information. Statements concerning mineral reserve and resource estimates may also be deemed to constitute forward-looking information to the extent that they involve estimates of the mineralization that will be encountered if the property is developed. Any statements that express or involve discussions with respect to predictions, expectations, beliefs, plans, projections, objectives, assumptions or future events or performance are not statements of historical fact and may be forward-looking information. Forward-looking information is subject to a variety of known and unknown risks, uncertainties and other factors that could cause actual events or results to differ from those expressed or implied by the forward-looking information, including, without limitation, those risks identified in our Annual Information Form dated March 28, 2016 filed on SEDAR at www.sedar.com and in the United States on Form 40-F through EDGAR at the SEC’s website at www.sec.gov. Forward-looking information is based on the expectations and opinions of our management on the date the statements are made. The assumptions used in the preparation of such statements, although considered reasonable at the time of preparation, may prove to be imprecise. We do not assume any obligation to update forward-looking information, whether as a result of new information, future events or otherwise, other than as required by applicable law. For the reasons set forth above, prospective investors should not place undue reliance on forward-looking information. National Instrument 43-101Technical and scientific information contained herein relating to the Projects is derived from National Instrument 43-101 (“NI 43-101”) compliant technical reports (“Reports”) “Mineral Resources Update Technical Report” dated December 19, 2013 and “Feasibility Study and Technical Report on the BrucejackProject, Stewart, BC” dated June 19, 2014. We have filed the Reports and Update under our profile at www.sedar.com. Technical and scientific information not contained within the Reports for the Projects have been prepared under the supervision of Mr. Kenneth C. McNaughton, P.Eng. and Ian Chang, P.Eng., each of whom is an independent “qualified person” under NI 43-101.This presentation uses the terms “measured resources”, “indicated resources” (together “M&I”) and “inferred resources”. Although these terms are recognized and required by Canadian regulations (under NI 43-101), the United States Securities and Exchange Commission does not recognize them. Mineral resources which are not mineral reserves do not have demonstrated economic viability. The estimate of mineral resources may be materially affected by environmental, permitting, legal, title, taxation, socio-political, marketing, or other relevant issues. There is no guarantee that all or any part of the mineral resource will be converted into mineral reserves.In addition, “inferred resources” have a great amount of uncertainty as to their existence, and economic and legal feasibility. It cannot be assumed that all or any part of an inferred mineral resource will ever be upgraded to a higher category. Under Canadian rules, estimates of inferred mineral resources may not form the basis of feasibility or pre feasibility studies, or economic studies, except for a Preliminary Assessment as defined under NI 43-101. Investors are cautioned not to assume that part or all of an inferred resource exists, or is economically or legally mineable. CurrencyUnless otherwise indicated, all dollar values herein are in Canadian $.

3
Brucejack high-grade gold project
Fully funded & permitted -construction underway
Commercial production target 2017
V A L U E T H R O U G H G O L D

4
BRUCEJACK PROJECT LOCATION

5
Mine Underground $101.4M
Mine Site $165.3M
Offsite Infrastructure
$81.0M
Owners Costs $160.3M
Indirect Costs $97.5M
Contingency $35.3M
Working Capital $56.0M
UPDATED CONSTRUCTION COSTS
(1) Based on capital cost update (see News Release dated February 17, 2016) and operating cost assumptions from the Feasibility Study and Technical Report Update on the Brucejack Project, dated June 19, 2014.
(2) Mine Site Capital Costs Include; mine site, mine site process, mine site utilities, mine site facilities, tailings facilities, mine site temporary facilities and surface mobile equipment.
Total Direct Costs $347.7MTotal Indirect
Costs $293.1M
Capital Cost Summary US$696.8 million
60% engineering milestone reached December 2015
US$640.8M total project capital cost
US$56.0M working capital for first 3 months
Gold revenue from first 3 months has not been included
(2)

6
FULLY FUNDED
(1) Based on Brucejack capital cost update (see News Release dated February 17, 2016) and operating cost assumptions from the Feasibility Study and Technical Report Update on the Brucejack Project, dated June 19, 2014.
(2) See News Release dated Feb 23, 2016
US$540M Financing Package Announced Sept 2015 US$350 - 7.5% fixed loan US$150 stream 8% of production US$40 equity financing
US$146.2M Equity Financing(2)
Announced Feb 2016
Robust cash flow at $1100/oz gold Re-financing optionality
Loan Facility US$350M
Callable Stream
US$150M
Equity US$40M
Equity US$100M
Incurred Costs
Financing Structure(1)
US$696.8M
To Sept 30, 2015
US$66M
(2)

7
BRUCEJACK - ROBUST ECONOMICS
(1) Based on Brucejack capital cost update (see News Release dated February 17, 2016) and operating cost assumptions from the Feasibility Study and Technical Report Update on the Brucejack Project, dated June 19, 2014
(2) NPV is discounted to Dec 31, 2015.
Economic Results by Metal Price (1)
Low Case Base Case High Case
Gold Price (US$/oz) $800 $1,100 $1,400Silver Price (US$/oz) $10 $14 $18NPV(2) (5% US$M) Pre-Tax $1,097 $2,360 $3,630
After Tax $723 $1,550 $2,280Internal Rate of Return Pre-Tax 20.2% 33.0% 43.8%
After-Tax 16.8% 27.4% 36.3%Net Cash Flow (US$M) Pre-Tax $2,210 $4,310 $6,420
After-Tax $1,530 $2,880 $4,230Payback Pre-Tax 4.9 3.4 2.7
After-Tax 5.0 3.5 2.8
Capex (US$M) $696.8 $696.8 $696.8
Exchange Rate (US$:C$) 0.75 0.75 0.75

8
BRUCEJACK PROJECT PRODUCTION
Source: Feasibility Study and Technical Report Update on the Brucejack Project, dated June 19, 2014
Mine Life 18 years
Total Gold Production 7.27 million oz
Average Annual Gold Production
504,000 oz (years 1-8)
404,000 oz (life of mine)
Gold and Silver Recoveries 96.7% and 90.0%
Processing Rate 2,700 tonnes per day
9
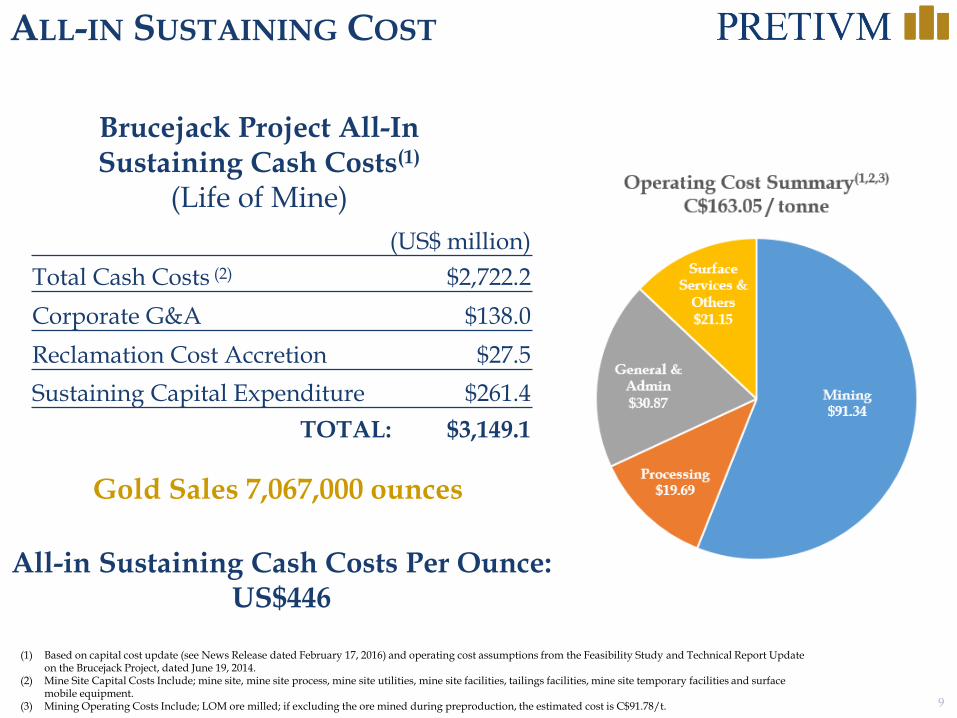
ALL-IN SUSTAINING COST
(1) Based on capital cost update (see News Release dated February 17, 2016) and operating cost assumptions from the Feasibility Study and Technical Report Update on the Brucejack Project, dated June 19, 2014.
(2) Mine Site Capital Costs Include; mine site, mine site process, mine site utilities, mine site facilities, tailings facilities, mine site temporary facilities and surface mobile equipment.
(3) Mining Operating Costs Include; LOM ore milled; if excluding the ore mined during preproduction, the estimated cost is C$91.78/t.
Mining $91.34
Processing$19.69
General & Admin$30.87
Surface Services &
Others$21.15
Operating Cost Summary(1,2,3)
C$163.05 / tonne
All-in Sustaining Cash Costs Per Ounce: US$446
(US$ million)Total Cash Costs (2) $2,722.2Corporate G&A $138.0Reclamation Cost Accretion $27.5Sustaining Capital Expenditure $261.4
TOTAL: $3,149.1
Brucejack Project All-In Sustaining Cash Costs(1)
(Life of Mine)
Gold Sales 7,067,000 ounces

10
HIGH-GRADE GOLD RESERVES(1,2)
Valley of the Kings
West Zone
Category Tonnes(mil)
Gold(g/t)
Silver(g/t)
Contained
Gold(mil oz)
Silver(mil oz)
Proven 1.4 7.2 383 0.3 17.4
Probable 1.5 6.5 181 0.3 8.6
Total P&P 2.9 6.9 279 0.6 26.0
Valley of the Kings West Zone
(1) Source: Feasibility Study and Technical Report Update on the Brucejack Project, dated June 19, 2014
Category Tonnes(mil)
Gold(g/t)
Silver(g/t)
Contained
Gold(mil oz)
Silver(mil oz)
Proven 2.1 15.6 12 1.1 0.8
Probable 11.5 15.7 10 5.8 3.9
Total P&P 13.6 15.7 11 6.9 4.6
Mineral Reserve Estimate – June 2014
11
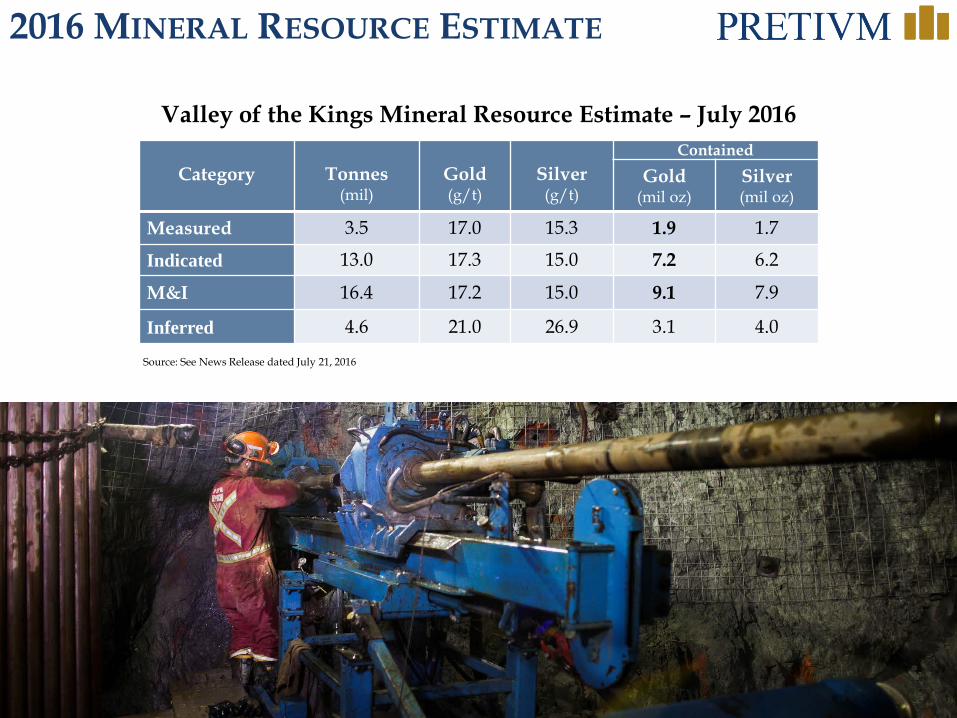
2016 MINERAL RESOURCE ESTIMATE
Source: See News Release dated July 21, 2016
Category Tonnes(mil)
Gold(g/t)
Silver(g/t)
ContainedGold
(mil oz)Silver(mil oz)
Measured 3.5 17.0 15.3 1.9 1.7
Indicated 13.0 17.3 15.0 7.2 6.2
M&I 16.4 17.2 15.0 9.1 7.9
Inferred 4.6 21.0 26.9 3.1 4.0
Valley of the Kings Mineral Resource Estimate – July 2016

12
VALLEY OF THE KINGS: STOCKWORK
S N
Cleo West Drift 615L West Raise
Domain 20
~0.5 m

13
LONGHOLE STOPING
30 m level spacing
Maximum of 45 m stope lengths
15 m widths
Dilution Factors– Primary Stopes: 7%– Secondary Stopes: 15%
Mining Recovery Factors– Primary Stopes: 97.5%– Secondary Stopes: 92.5%
Average 12 stopes in the mining and backfill cycle at any time
30 M SPACING

14
BRUCEJACK MINE:LIFE OF MINE (18 YEAR)
Conveyor Portal
West Zone Portal
Shops
Valley of the Kings1350m level
Valley of the Kings1230m level
Ventilation RaiseVR1
Ventilation RaiseVR3
Ventilation RaiseVR4
Valley of the Kings1500m level
Valley of the Kings990m level
Ventilation RaiseVR5
West Zone990m levelOpen
Open

15
MINE SURFACE FACILITIES
VOK Portal
Mill
Camp
Waste RockDisposal
Contact WaterPond
West ZonePortal

16
PROJECT FLOW SHEET
55% FROM CONCENTRATE
45% FROM GRAVITY
(1) Source: Feasibility Study and Technical Report Update on the Brucejack Project, dated June 19, 2014.
96.7% GOLD RECOVERY (LOM)

17
COMMUNITY ENGAGEMENT
Commercial contracting and employment of First Nations has been ongoing since project discovery
Longtime commercial relationship with Ski Km lax Ha; Cooperation and Benefits Agreement signed with Nisga’a Nation
We extend both commercial contract and employment opportunities to locals whenever possible

18
2015 2016 2017
KEY MILESTONES TO PRODUCTION
2014

19
EARTH WORKS- OCTOBER 2015

20
CONSTRUCTION ADVANCING– JANUARY 2016

21
FIRST CONCRETE POUR– JANUARY 19, 2016

22
CONSTRUCTION ADVANCING– FEBRUARY 2016

23
CONSTRUCTION ADVANCING– MARCH 2016

24
CONSTRUCTION ADVANCING– APRIL 2016

25
FIRST CAMP MODULE PLACED– APRIL 21, 2016

26
CONSTRUCTION ADVANCES– MAY 2016

27
CONSTRUCTION ADVANCES- MAY 2016

28
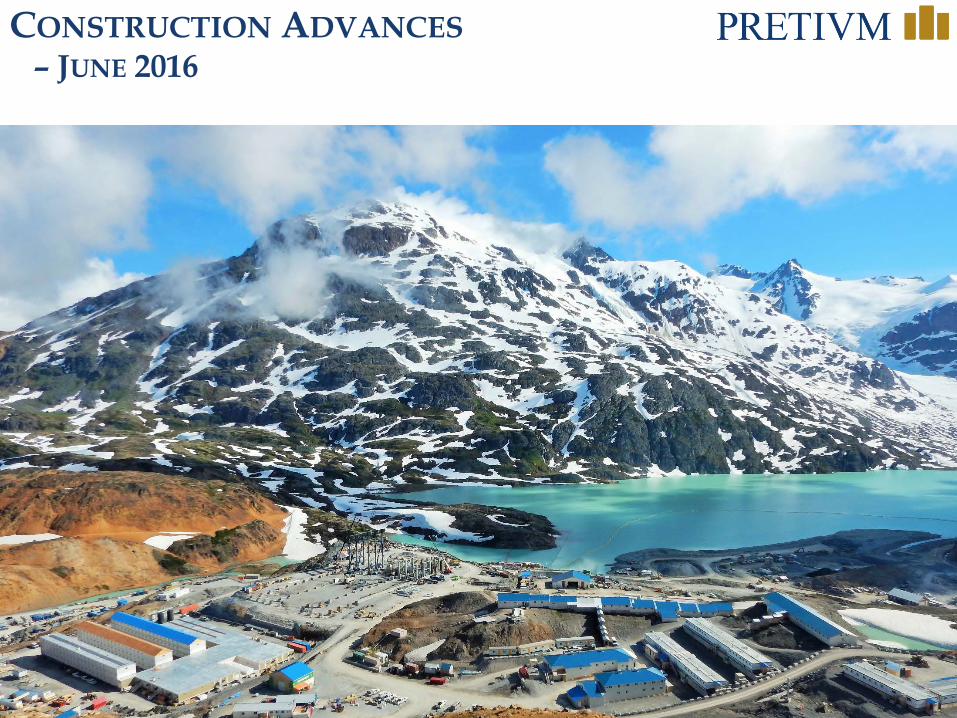
CONSTRUCTION ADVANCES– JUNE 2016

29
CONSTRUCTION ADVANCES– JUNE 2016

30
Mill Facility
330-PersonCamp
RockDisposal
Contact WaterPond
AERIAL VIEW– JUNE 2016
31
CONSTRUCTION ADVANCES– JUNE 2016

32
CONSTRUCTION ADVANCES– JULY 2016

33
CAMP OCCUPANCY– FIRST DORM OPERATIONAL - JULY 2016

34
CONSTRUCTION ADVANCES– JULY 2016
35
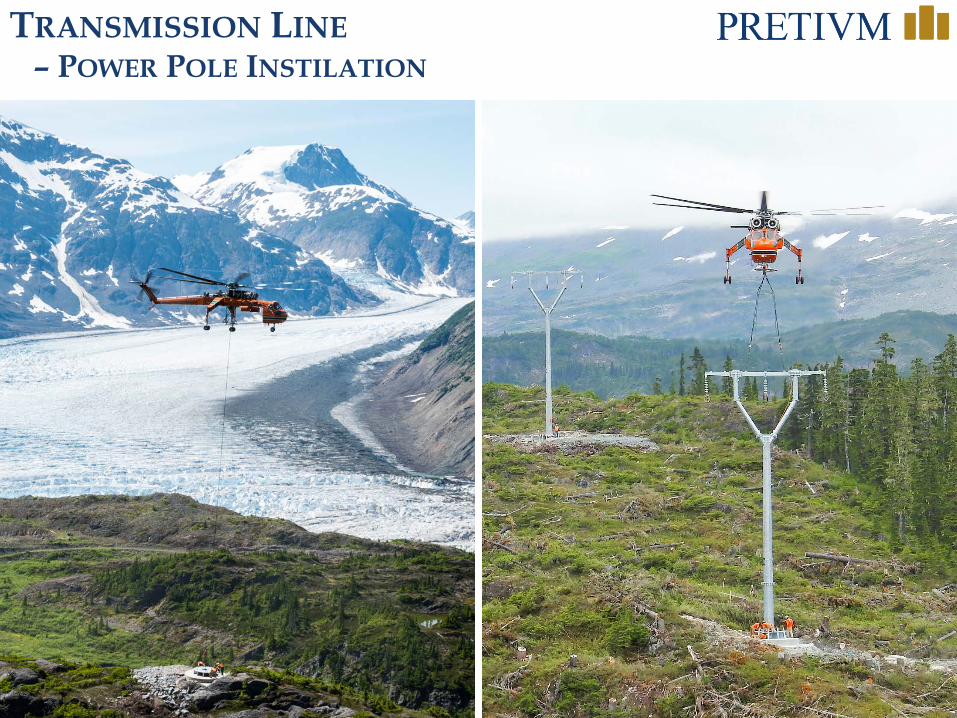
TRANSMISSION LINE– POWER POLE INSTILATION

36500m
N
SU-657
SU-654
SU-658
1.5m @ 16.9 g/t Au
9.0m @ 21.87 g/t Au(Includes 0.5m @ 203 g/t Au)
1.18m @ 10.75 g/t Au
SU-661
SU-668SU-666
2.05m @ 2,100 g/t Au(Includes 0.5m @ 8,600 g/t Au)
0.5m @ 137 g/t Au
Valley of the Kings Resource
> 20.0
Assay intervals
5.0 - 20.0
1.0 – 5.0
0.5 – 1.0
0.25 – 0.5
Key (g/t Au)
Previously Reported Drilling
2015 GRASS-ROOTS EXPLORATION –FLOW DOME ZONE

37
N
SU-673
Valley of the Kings
Resource
561.5m @ 0.53 g/t Au(includes 3m @ 6.34 g/t Au
SU-671277m @ 0.88 g/t Au, 15.64 g/t Ag(includes 8.68m @ 9.94 g/t Au, 90.3 g/t Ag
SU-6822.28m @ 56.32 g/t Ag(includes 0.7m @ 86.4 g/t Ag
Bowser Area
Kirkham Zone
Brucejack Lake
Flow Dome Zone
SU-674SU-675
SU-678
SU-681SU-685
SU-676
SU-677
2015/2016 GRASS-ROOTS EXPLORATION

38
EXPLORATION POTENTIAL EAST - WEST
200 m
N Valley of the Kings Access Ramp
Bulk Sample Development
Approximate surface projection of December
2013 Measured & Indicated resources
SU-4980.5m @ 3,874 g/t Au
SU-5261.16m @ 4,195 g/t Au
VU-1360.5m @ 1,100 g/t Au
Brucejack Fault

39
2016 MILESTONES
Capex funded In-fill underground drill
program Complete engineering and
procurement Complete 330-person camp Mill building construction Complete transmission line Underground development Grass-roots exploration
drilling

40pretivm.com
QUESTIONS
Booth #40 TSX/NYSE : PVG

41
Silver Standard,
9.6%
Institutions, 50.6%Van Eck,
6.0%
Management, 2.0%
Retail, 31.8%
SHAREHOLDING & ANALYST COVERAGE
(1) As of July 22, 2016; ownership calculated on an undiluted basis.(2) An additional US$200 million is available from the US$540 million construction financing closed Sept 21, 2015. See News Release dated Sept 15, 2015 & Sept 21, 2015(3) As of July 22, 2016. Source: IPREO & SEDI
Capital Structure(1)
Public Float 161.4Silver Standard Shares 17.0Total Issued & Outstanding Shares 178.4 Incentive Options 8.4Total Fully Diluted Shares 186.8
Market Cap (July 22, 2016) C$2.56 billionWorking Capital (at March 31, 2015)(2) C$455.8 million
(shares in millions) Analyst CoverageCanaccord Genuity Eric ZaunscherbCIBC Jeff KilleenCormark Securities Richard GrayH.C. Wainwright Heiko F. IhleNumis Jonathan GuyPareto Securities Rhys BradleyRBC Dan RollinsRoth Capital Partners Joseph ReagorScotiabank Ovais Habib
Top Shareholders(3) (% S/O)
Silver Standard Resources 9.55Van Eck Associates 6.00Zijin Mining 5.06Black Rock Asset Management 5.00Orion & Blackstone 4.74Liberty Metals & Mining 4.67Sun Valley Gold, LLC 2.45M&G Management 2.22Pretivm Management 2.01Connor, Clark & Lunn 1.97Sprott Asset Management 1.83

4242
CONTACT:Phone: 604-558-1784Fax: 604-558-4784Toll-free: 1-877-558-1784
HEAD OFFICE:Pretium Resources Inc.Suite 2300 – 1055 Dunsmuir St.Four Bentall CentrePO Box 49334Vancouver, BCCanada V7X 1L4
Advancing a major high-grade gold project in Canada
COMMON SHARES:TSX/NYSE: PVGIssued: 178.4 MFully diluted: 186.8 M52-week hi/low: C$15.30/$5.57Market cap: C$2.56 B
(at July 22, 2016)